Article

Guided Classification System for Conceptual Overlapping Classes in OpenStreetMap

1
Bremen Spatial Cognition Center (BSCC), University of Bremen, Bremen 28334, Germany
2
Information System Department, Faculty of Computers and Information, Assuit University, Assuit 71515, Egypt
3
Faculty of Information and Communication Technology, Mahidol University, Bangkok 73170, Thailand
4
GIScience research group, Institute of Geography, Heidelberg University, Heidelberg 69120, Germany
*
Author to whom correspondence should be addressed.
ISPRS Int. J. Geo-Inf. 2016, 5(6), 87; https://doi.org/10.3390/ijgi5060087
Submission received: 8 April 2016 / Revised: 11 May 2016 / Accepted: 23 May 2016 / Published: 7 June 2016
(This article belongs to the Special Issue Volunteered Geographic Information)

Abstract

:
The increased development of Volunteered Geographic Information (VGI) and its potential role in GIScience studies raises questions about the resulting data quality. Several studies address VGI quality from various perspectives like completeness, positional accuracy, consistency, etc. They mostly have consensus on the heterogeneity of data quality. The problem may be due to the lack of standard procedures for data collection and absence of quality control feedback for voluntary participants. In our research, we are concerned with data quality from the classification perspective. Particularly in VGI-mapping projects, the limited expertise of participants and the non-strict definition of geographic features lead to conceptual overlapping classes, where an entity could plausibly belong to multiple classes, e.g., lake or pond, park or garden, marsh or swamp, etc. Usually, quantitative and/or qualitative characteristics exist that distinguish between classes. Nevertheless, these characteristics might not be recognizable for non-expert participants. In previous work, we developed the rule-guided classification approach that guides participants to the most appropriate classes. As exemplification, we tackle the conceptual overlapping of some grass-related classes. For a given data set, our approach presents the most highly recommended classes for each entity. In this paper, we present the validation of our approach. We implement a web-based application called Grass&Green that presents recommendations for crowdsourcing validation. The findings show the applicability of the proposed approach. In four months, the application attracted 212 participants from more than 35 countries who checked 2,865 entities. The results indicate that 89% of the contributions fully/partially agree with our recommendations. We then carried out a detailed analysis that demonstrates the potential of this enhanced data classification. This research encourages the development of customized applications that target a particular geographic feature.

1. Introduction

Web and information revolutions, the increased availability of location sensing devices, and the advanced communication technologies facilitate the evolution of free geographic content, which is known as Volunteered Geographic Information (VGI) [1]. In particular, we are concerned with the VGI format, in which the public participates in mapping processes regardless of their prior geographic experience. In the past, these processes were performed exclusively by cartographers at mapping agencies and in specialized organizations. Among others, OpenStreetMap (OSM) (http://openstreetmap.org/), Wikimapia (http://www.wikimapia.org/), and Google Map Maker (https://www.google.com/mapmaker) are examples of VGI-based mapping projects. With the expansion of crowdsourcing, participants have developed a tremendous amount of free geographic data that have been utilized in various applications. For example, VGI acts as a potential data source for applications of environmental mapping [2,3], crisis management [4,5], urban planning [6,7], map provision [8], and location-based services (LBS) [7,9]. However, in each application, the data quality is an issue of high concern. Several studies have concluded that the quality of VGI is heterogeneous [10]. This finding impacts the utility of VGI as a complementary source or as an alternative to authoritative data sources [11,12,13,14].
In general, VGI—as spatial data—has multiple measures of data quality such as: completeness, lineage, logical consistency, positional accuracy, and semantic (attribute) accuracy [15]. In our research, we are concerned with the attribute accuracy. In particular, we investigate data quality from the viewpoint of classification, i.e., whether a piece of land covered by grass is being classified as park, garden, or forest, if an areal water body belongs to the lake, pond or reservoir class, etc. In VGI projects, data classification is mainly based on participants’ cognition. On one hand, the appropriate classification depends on quantitative (e.g., size, area) and/or qualitative (e.g., context) characteristics. However, these characteristics, which distinguish between classes, might not be observed by participants. In addition, the non-standard data collection procedures and the limited expertise of participants may result in heterogeneous data classification. On the other hand, the non-strict definition of geographic features leads—in some cases—to conceptual overlapping classes. Thus, a given entity may be classified as lake or pond, park or garden, marsh or swamp and it could plausibly belong to multiple classes, but only small details might distinguish between the most appropriate class [16,17].
To tackle the aforementioned problems, we propose the rule-guided classification approach in our previous work [16,17]. The approach learns the distinct qualitative characteristics of specific classes and encodes them into predictive rules. Afterwards, the extracted rules are organized into a classifier that acts to guide the participants towards the most appropriate classes. In this paper, we propose crowdsourcing validation as one of many possible implementation scenarios of our approach. In this scenario, we present a set of entities associated with our recommended classes to the crowd for the purpose of validation.
In this paper, we present the Grass&Green application (http://www.opensciencemap.org/quality): a web-app that addresses the conceptual overlapping challenge of some grass-related classes. We utilized the data from the OSM project, particularly the data set of Germany. However, the results were presented to the entire OSM mappers as well as public participants. We selected the classes of garden, grass, forest, park, and meadow as an exemplification of the conceptual overlapping problem. The choice is based on the following reasons: (i) in the utilized data set, they are the most common grass-related classes within city boundaries (our geographic scope of research); and (ii) for non-experts, conceptual overlapping between these classes exists, since they are related to the global concept of grass but with finer differences. We launched the application to validate our previous work in [16,17]. The participants were allowed to express their agreement/disagreement with the recommended classes. In addition, the participants were encouraged to send us feedback and comments. We announced the application on OSM diaries [18] and other social media blogs. In four months, the application attracted 212 participants from more than 35 countries. During this period, the participants checked 2865 entities. The findings indicate the applicability of the proposed approach. Around 89% of the contributions are fully/partially in agreement with our recommended classes. Moreover, the detailed investigation of the results demonstrates the enhanced classification of the target entities. We received positive feedback from participants, which encourages the expansion of the application of the proposed approach to different locations. Moreover, the findings of this work motivate the development of more customized applications that handle a particular geographic feature in order to enhance the data quality of voluntary geographic data sets.
This paper is organized as follows. Section 2 provides an overview about related works. The reasons for problematic data classification in VGI projects, including subjective classification, participant heterogeneity, and conceptual overlapping classes are discussed in Section 3. A summary of our proposed approach is provided in Section 4. The Grass&Green application is presented in Section 5 including: the description, the conceptual architecture, and the announcement methodologies. Section 6 illustrates the results from various perspectives. A vision of the proposed approach with respect to enhancing data quality is provided in Section 7. Section 8 concludes the paper and highlights some future research directions.

2. Related Work

With the increased availability of VGI sources, the resulting data quality has been raised as an issue of high concern in GIScience [10,12,14]. Most research has targeted the OSM project as the most prominent VGI mapping project. The project aims to develop a free world digital map editable and obtainable by everyone [8]. Currently, OSM data covers most of the world and the project has more than 2,500,000 registered users on 10 April 2016 according to OSMstats website [19]. Several research studies have addressed the quality from various perspectives like the assessment of the resulting data (Section 2.1) and the development of approaches and methodologies to enhance the data quality (Section 2.2). Other research has focused on data classification in user-generated geographic contents (Section 2.3).

2.1. VGI Quality Assessment

Generally, geo-spatial data are assessed either by comparison with an authoritative data source or by analyzing the intrinsic properties of the data. The assessment is carried out based on the standard spatial data quality measures developed in ISO/TC 211 [20,21]. The OSM data are compared with the authoritative data in the UK, Germany, Canada and France [22,23,24,25,26,27]. With the evolution of VGI, authors in [13] argue that there are three dimensions in assessing VGI data: crowdsourcing, social, and geographic dimensions. Hence, the intrinsic properties of data like contributors’ reputation, editing history, and data evolution have been analyzed to assess data quality [28,29,30,31,32,33,34,35]. Researchers have investigated different quality measures like positional accuracy, completeness, and thematic accuracy with respect to various geographic features like road networks, buildings, and land use features. Another perspective of quality assessment has been presented in [36], where the data quality is associated with the purpose of use. In [37], the authors presented a framework to assess the data quality conceptually.
Most of the research concludes that VGI is a potentially valuable data source, particularly in urban places [38]. Nevertheless, they mostly agree on the heterogeneous quality of the data with respect to various quality measures [12,13].

2.2. VGI Quality Enhancement: Approaches and Methods

Several economic and cultural factors influence data quality in VGI-mapping projects [35,39]. To our knowledge, there are only a limited number of research studies concerned with enhancing the data quality in VGI-based mapping projects.
In [40,41], the authors argue that intuitive human interfaces can play a role in producing data of high quality. The work in [42] encourages conflating OSM and authoritative data to develop an integrated open data source while [43] present a semantic solution that aids the contributors during the editing process toward enhanced data quality, in order to overcome cross-cultural and multi-language problems. Moreover, [11,44] discussed the utilization of learning to enhance the data classification of VGI projects. In [16,17], we presented the rule-guided classification approach, which acted to generate recommended classes to improve the classification quality. As an alternative, “Gamification” has been presented as another method for enhancing VGI quality [45].
For the OSM project in particular, OSMRec is a recommendation tool presented in [46]; it is an editor plugin tool for automatic annotation of spatial entities in the OSM project [47]. In addition, OSM Inspector [48], KeepRight [49], MapRoulette [50], and MapDust [51] are examples, among others, of web-applications that have been developed to enhance the data quality of the project. These applications have been either customized for a particular feature in a particular location like NOVAM [52], which manages bus stop features in the UK, or they have been developed generally for multiple features in various locations. These applications encourage the role of participants to enhance data quality through crowdsourcing revision.

2.3. Human-Centered Data Classification

Other research has focused particularly on the data classification in user generated geo-spatial content. In VGI, the data classification is human-centered; the data are classified based on individual perceptions rather than on a pre-defined model as is the case in professional data classification. The authors in [53] presented different forms of spatial data uncertainty, which influence the classification precision and granularity. In [44], the authors analyzed the plausible and ambiguous classification in VGI. Nevertheless, the research in [54] concludes the ability of the public to precisely classify land cover features when they are provided with aerial and ground photos. The work of [55] studied cultural, linguistics, and regional influences on the data classification while the authors of [56] investigate the classification quality of land use and land cover features in VGI with respect to the contributors and the provided data.
The authors of [57] have developed Geo-Wiki (http://www.geo-wiki.org/) (a crowdsourcing web-application) to validate and enhance the classification of global land cover data. Geo-Wiki also aims to develop a hybrid global land cover map from different data sources, where the authoritative data sources are enhanced with open sources and the power of crowdsourcing is used for validation.
In [58], the authors studied the annotation process in the OSM project. They identified the problem of using OSM data taxonomy and its impacts on data classification. From a particular point of view, the cross-cultural nature of the OSM project results in heterogenous data classification of identical geographic features, and hence, limited use of the data. However, semantic solutions have been used to overcome this problem [59,60].
Nevertheless, the research in [24,26] has assessed the classification accuracy of land use and land cover features in the OSM project. They highlighted the remarkable data quality and the potential utilization of VGI as a complementary data source of these features.

3. Beyond Data Classification in VGI Projects: The Case of OpenStreetMap

Several research studies have emphasized the significance of VGI sources. However, they also highlight their problematic data classification: in most applications, imprecise data classification results in either incorrect or incomplete results. How are the data classified? Do the data follow a strict classification model? How could we verify the data classification? At which granularity level is the data classification complete? All of these are critical issues that will impact the effective utilization of VGI sources. Thus, this section gives an insight into the classification challenges in VGI projects. In this paper, we analyzed the OSM data. The impacts of the contribution mechanism and the utilized data models on data quality are presented in Section 3.1. In any VGI projects, participants play a major role in the data collection process. Thus, the OSM communities and their influence on data classification are addressed in Section 3.2, whereas Section 3.3 discusses general difficulties of geographic data classification.

3.1. Classification by Tags (key = value)

In OSM, the contributions are performed by participants as follows: the participants delineate geographic features from provided satellite images (e.g., Bing aerial images), by using one of the OSM editors (e.g., iD editor). The features are represented as entities using the appropriate data models: point (0-D features), way (linear features), and relation (complex features). Afterwards, the participants are free to describe and classify the contributed entity by means of tags; when a tag has the format of key = value, the key describes the classification perspective and the value is the class label. For example, the tag of natural = water describes the natural coverage of an entity as a water body, while an additional tag, e.g., water = lake, is required to express the precise classification.
The OSM project presents the recommended tags and appropriate ways of mapping various geographic features on its Wiki pages (http://wiki.openstreetmap.org/wiki/Map_Features). However, the lack of integrity checking mechanisms and the complete free contribution mechanisms result in problematic classification. For example, an entity could be assigned no tags or infinite tags and even the repetition of tags is possible, e.g., natural = water and natural_1 = sand. Although these flexible mechanisms allow participants to initiate new classes, they generate various challenges during data processing and cleaning. Figure 1 illustrates a problematic classification example of when the indicated entity is assigned to conflicting classes.

3.2. Subjective Classification

VGI mapping projects are run by the power of crowds. The contributions come from the local knowledge of participants. They are free to translate their observation into an annotated geographic feature with description/categorization/classification. As humans interpret the observations differently, they may perceive the geographic features differently; a given entity might be classified as a restaurant by a participant, but it may be categorized by others as a cafe; whether a water body is large enough to be classified as a lake or small enough to be appropriately classified as a pond; these classifications depend on rational and individual aspects. This fact leads to subjective classification.
In the OSM project, participants have unequal mapping and cartographic experience; they come from different cultures; and they have various educational backgrounds and interests. Thus, the heterogeneous participants boost the problematic classification. Incomplete and inconsistent classification are examples of the problems related to subjective classification.
  • Incomplete classification: the limited local knowledge of a participant or the unclear perceived observation from the provided satellite images impacts the classification granularity. In a pilot study on the OSM data set of Germany (May 2015), we found 225,933 entities related to water body classes. Only 20% of these entities have finer classes like lake, waste water, etc. We detected about 10,520,418 unclassified building entities, which have a coarser classification as building while other entities of building are classified into finer classes like residential, industrial, etc.
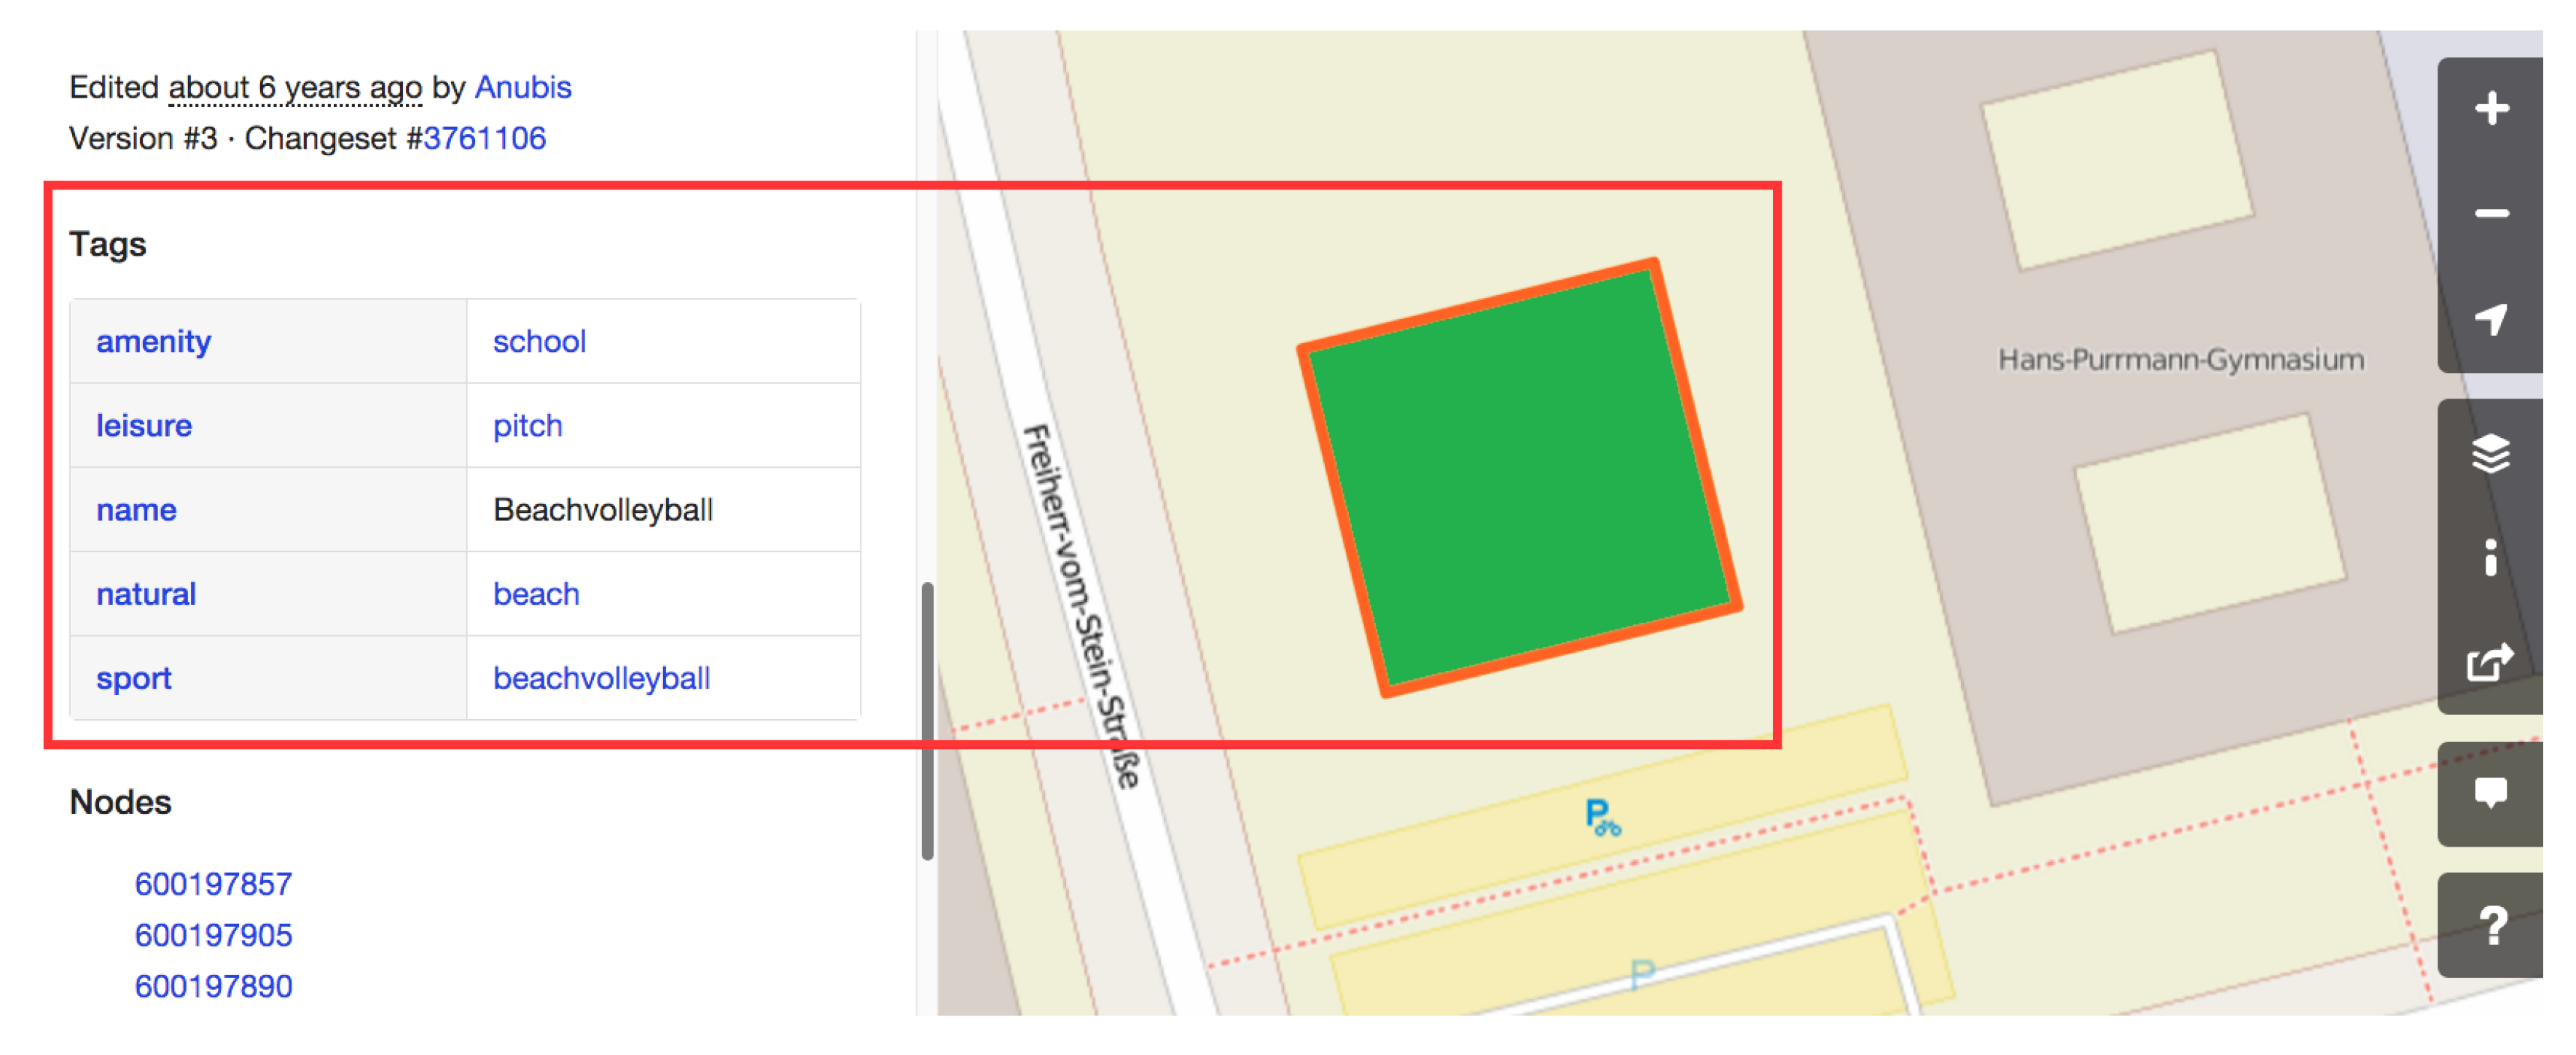
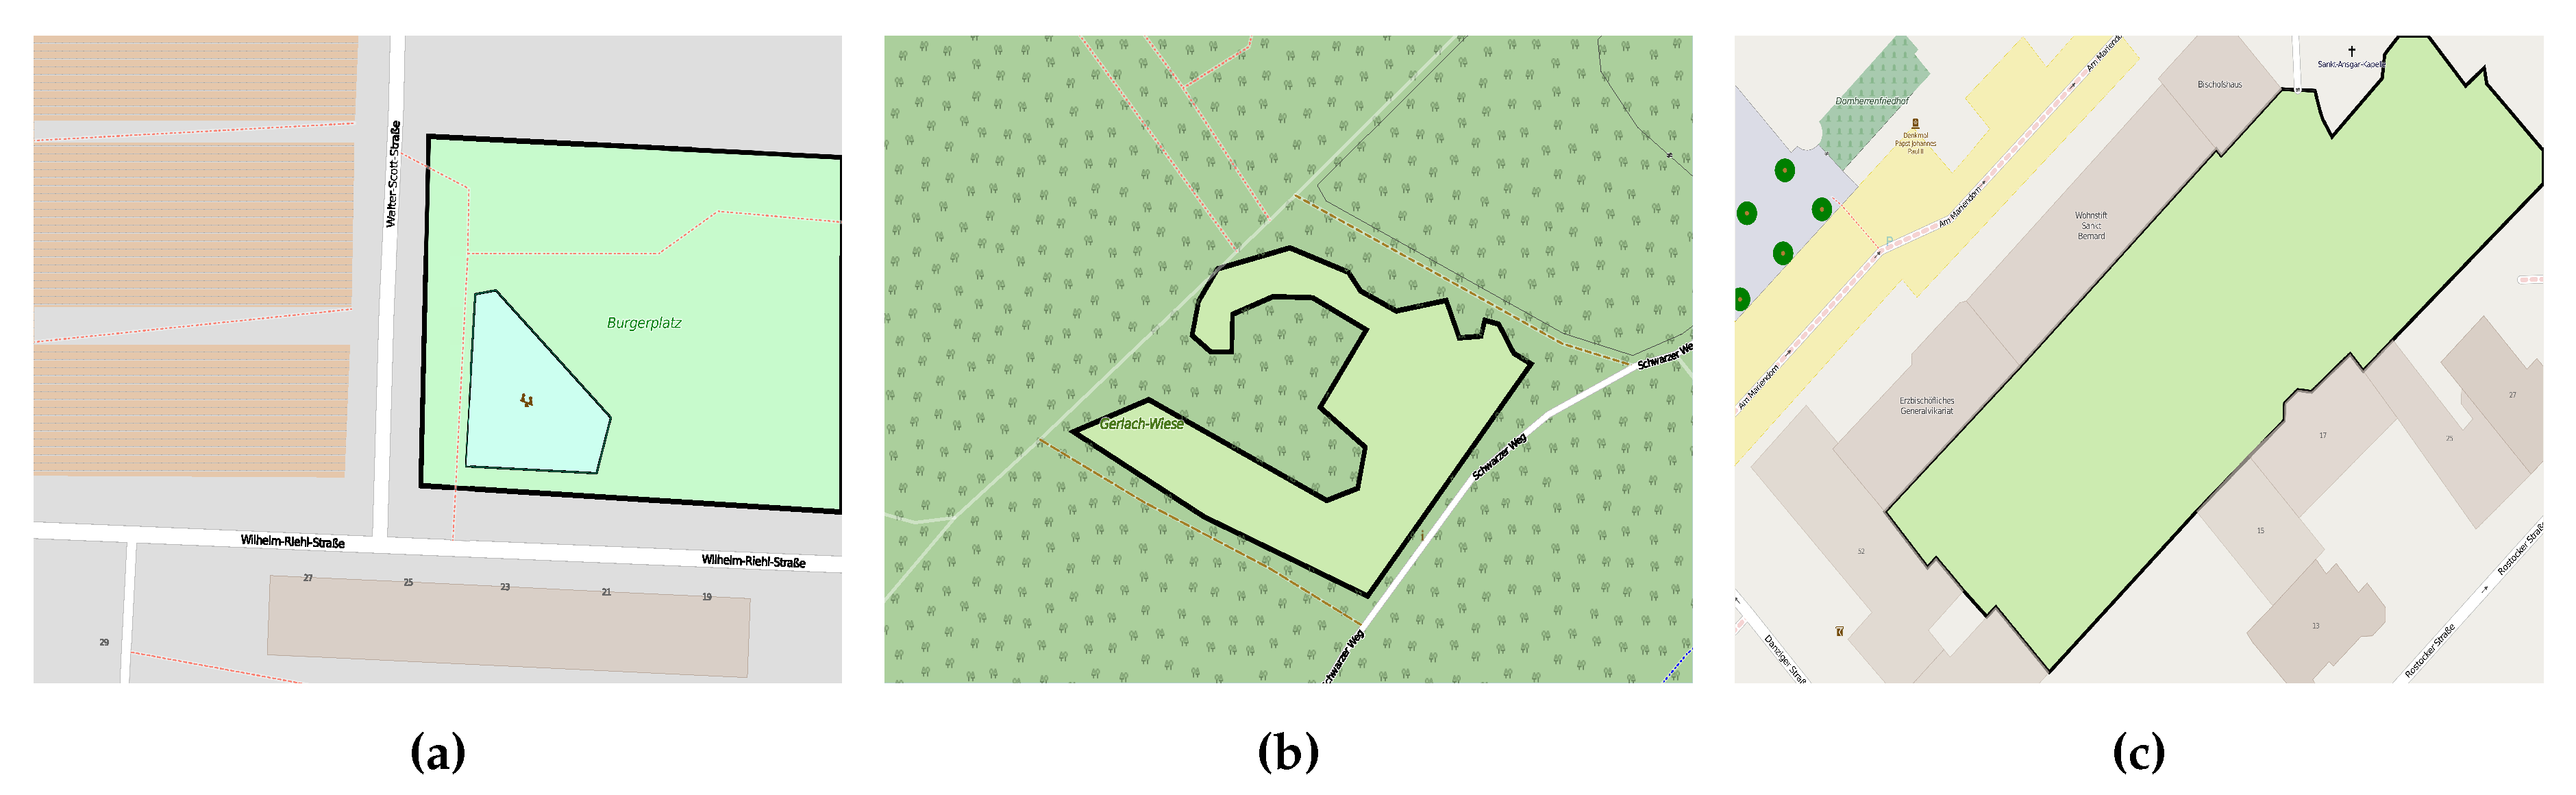
  • Inconsistent classification: when participants interpret a given feature differently, they assign it to conflicting classes or an ambiguous class. During our investigations, we found out that some entities are assigned to conflicting classes; some entities are classified as meadow (i.e., grass land) and wetland (i.e., water body). Figure 1 illustrates a clear example of the classification inconsistency, when the given entity is classified by the pitch, school, and beach classes.

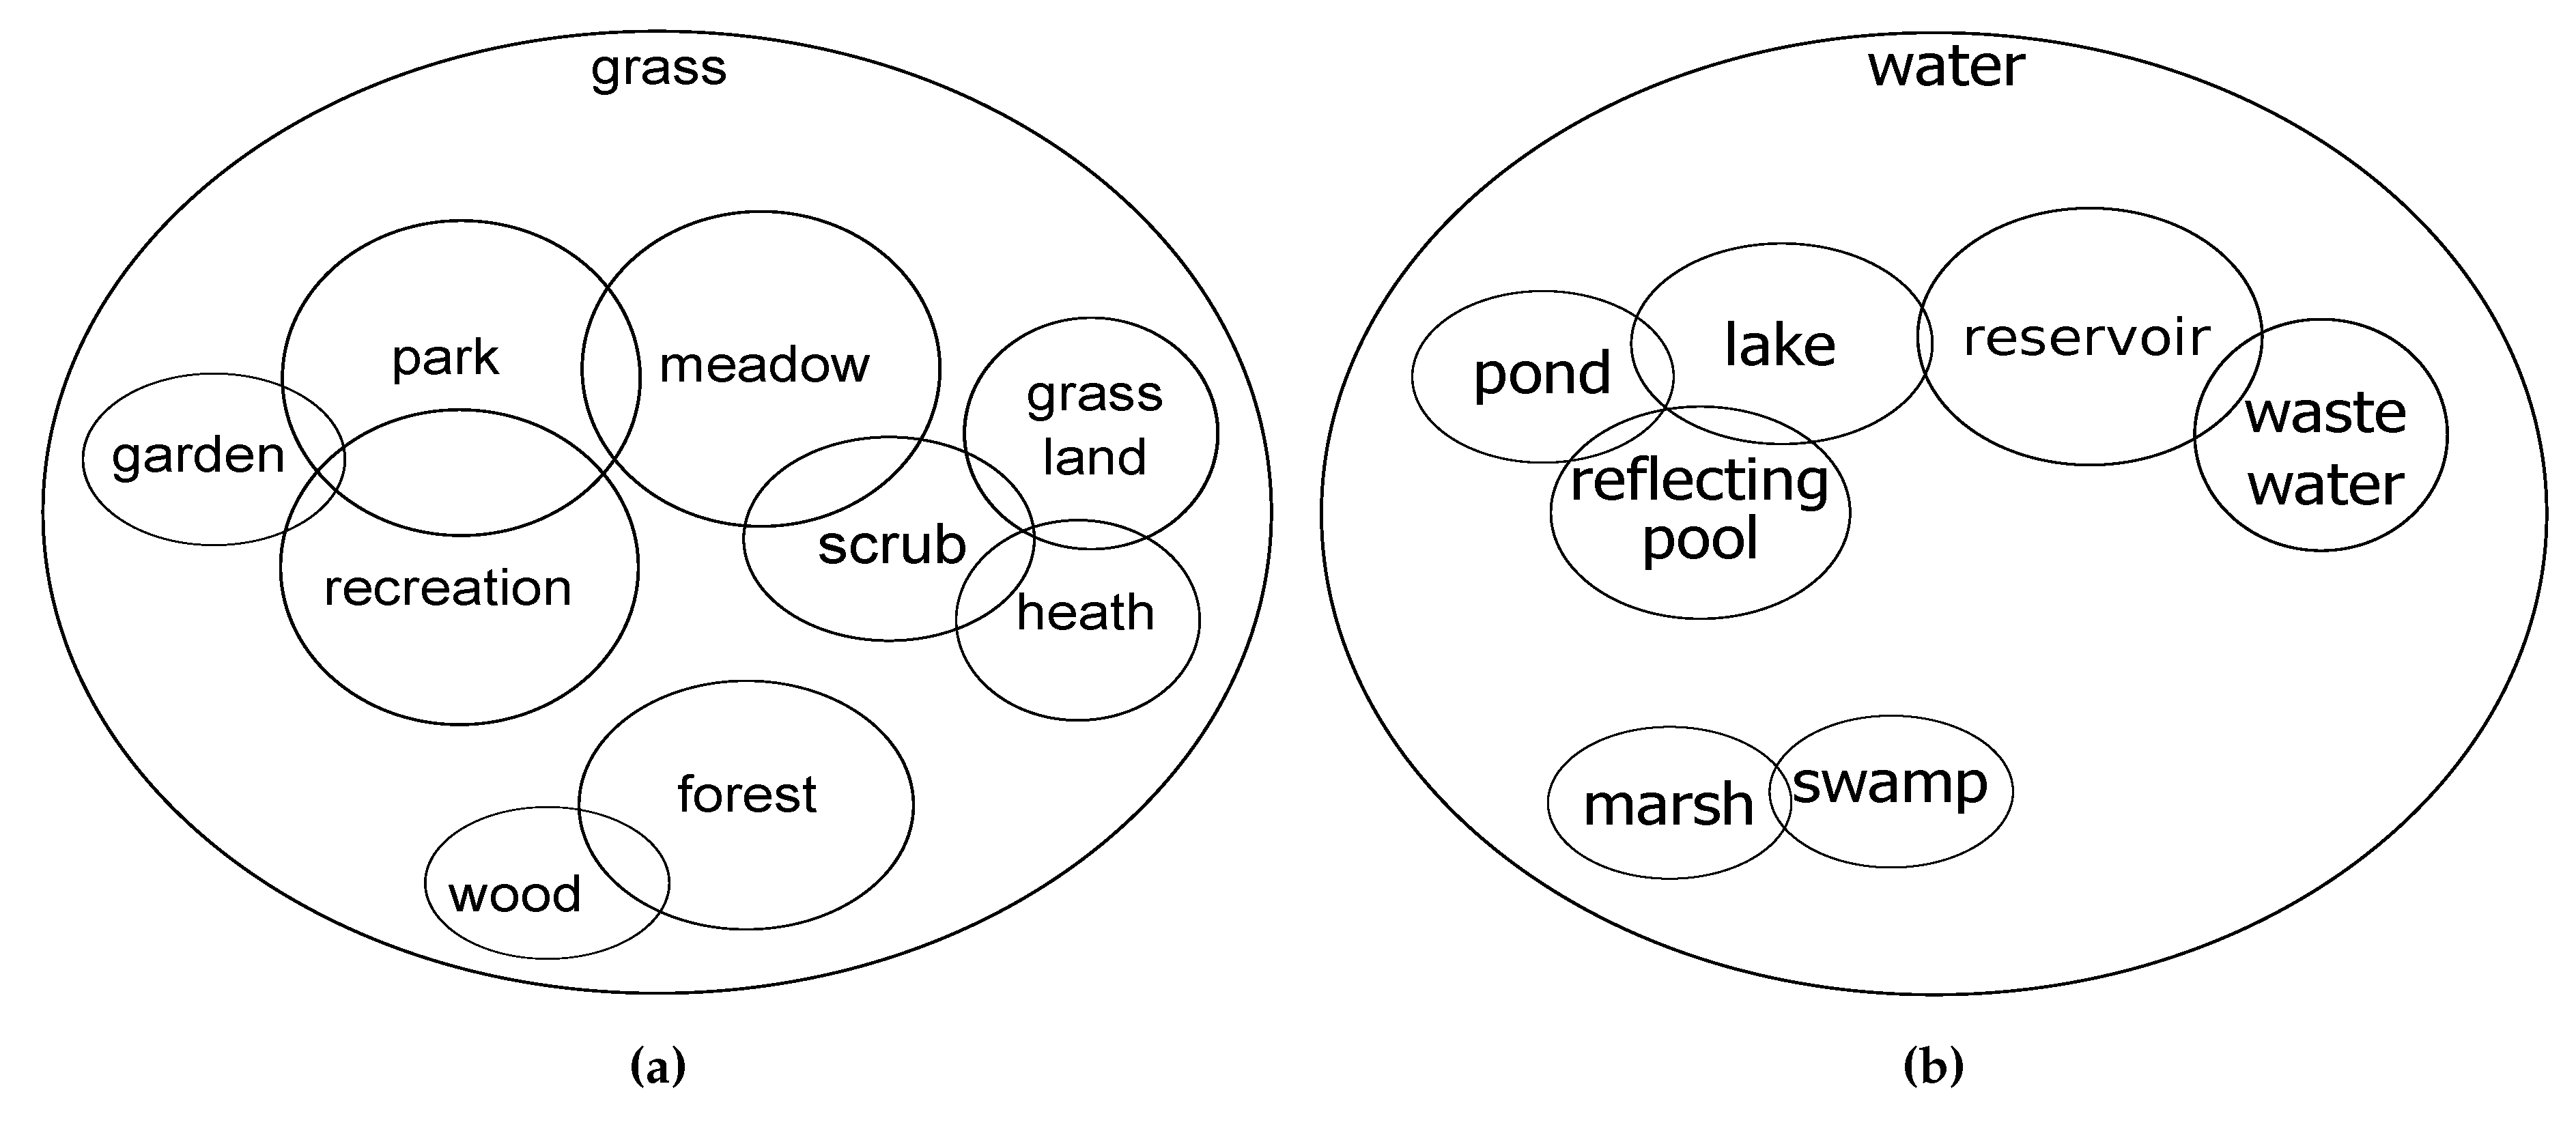
3.3. Conceptual Overlapping Classes

In general, spatial data are prone to various forms of uncertainty: probability, vagueness, and ambiguity. The problem might be related to whether a geographic feature is well or poorly defined [53]. In [61,62], the authors link the uncertainty of the spatial data with the VGI quality. In particular, poor definitions lead to crisp boundaries between similar classes. Thus, a particular entity could plausibly belong to multiple overlapping classes with various degrees of accuracy. Nevertheless, there are usually qualitative and/or quantitative characteristics that could distinguish between these classes.
Among others, the features of water bodies, grass-related, and wetland are examples of features with non-strict definitions, and hence, they include overlapping classes. Figure 2 illustrates the conceptual overlapping classes within grass-related and water body features, with respect to the recommendations given in the OSM Wiki. Table 1 describes the mapping between the OSM tags and their corresponding classes. In the OSM project, a single class could be described by various tags; however, we investigate the most common tagging. The overlapping between classes in the figure is based on sharing a particular concept or common characteristics. Moreover, the size of overlapping indicates the degree of conceptual similarity.
For example, the park, recreation, and garden are overlapping classes in Figure 2a: they share the characteristics of being used for entertainment and amusement. The classes of park, garden are classified by the leisure key, while the recreation class is described by the landuse key. However, the recreation entities are most likely related to certain activities (e.g., sport, or social activities), the garden entities are more cultivated with flowers and plants than others, and the park entities are in general larger than garden and recreation and might include both of them as well. Figure 2b shows another example of overlapping classes related to water body features. When a water body is stagnant and natural, it could be classified as lake (if it is large) or as pond (if it is small), but when it is man-made it would be more appropriately classified as reservoir. Other classes such as marsh and swamp are both describing the land area that is saturated with water, either permanently or seasonally. In the OSM data, they are both described by the wetland key. Only the type of vegetation distinguishes between the classes: swamp when woody vegetation and marsh when non-woody vegetation and open habitats.
The previous discussions summarize the reasons behind the problematic classification in VGI projects; Section 3.1 and Section 3.2 argue the problem from the nature of VGI projects, while Section 3.3 discusses the problem from the perspective of spatial data uncertainty. These classification problems impact not only on the data quality, but they also limit the development of general applications, e.g., global rendering and visualizing applications. Moreover, the problematic data quality will determine the utility of VGI sources for particular types of application.

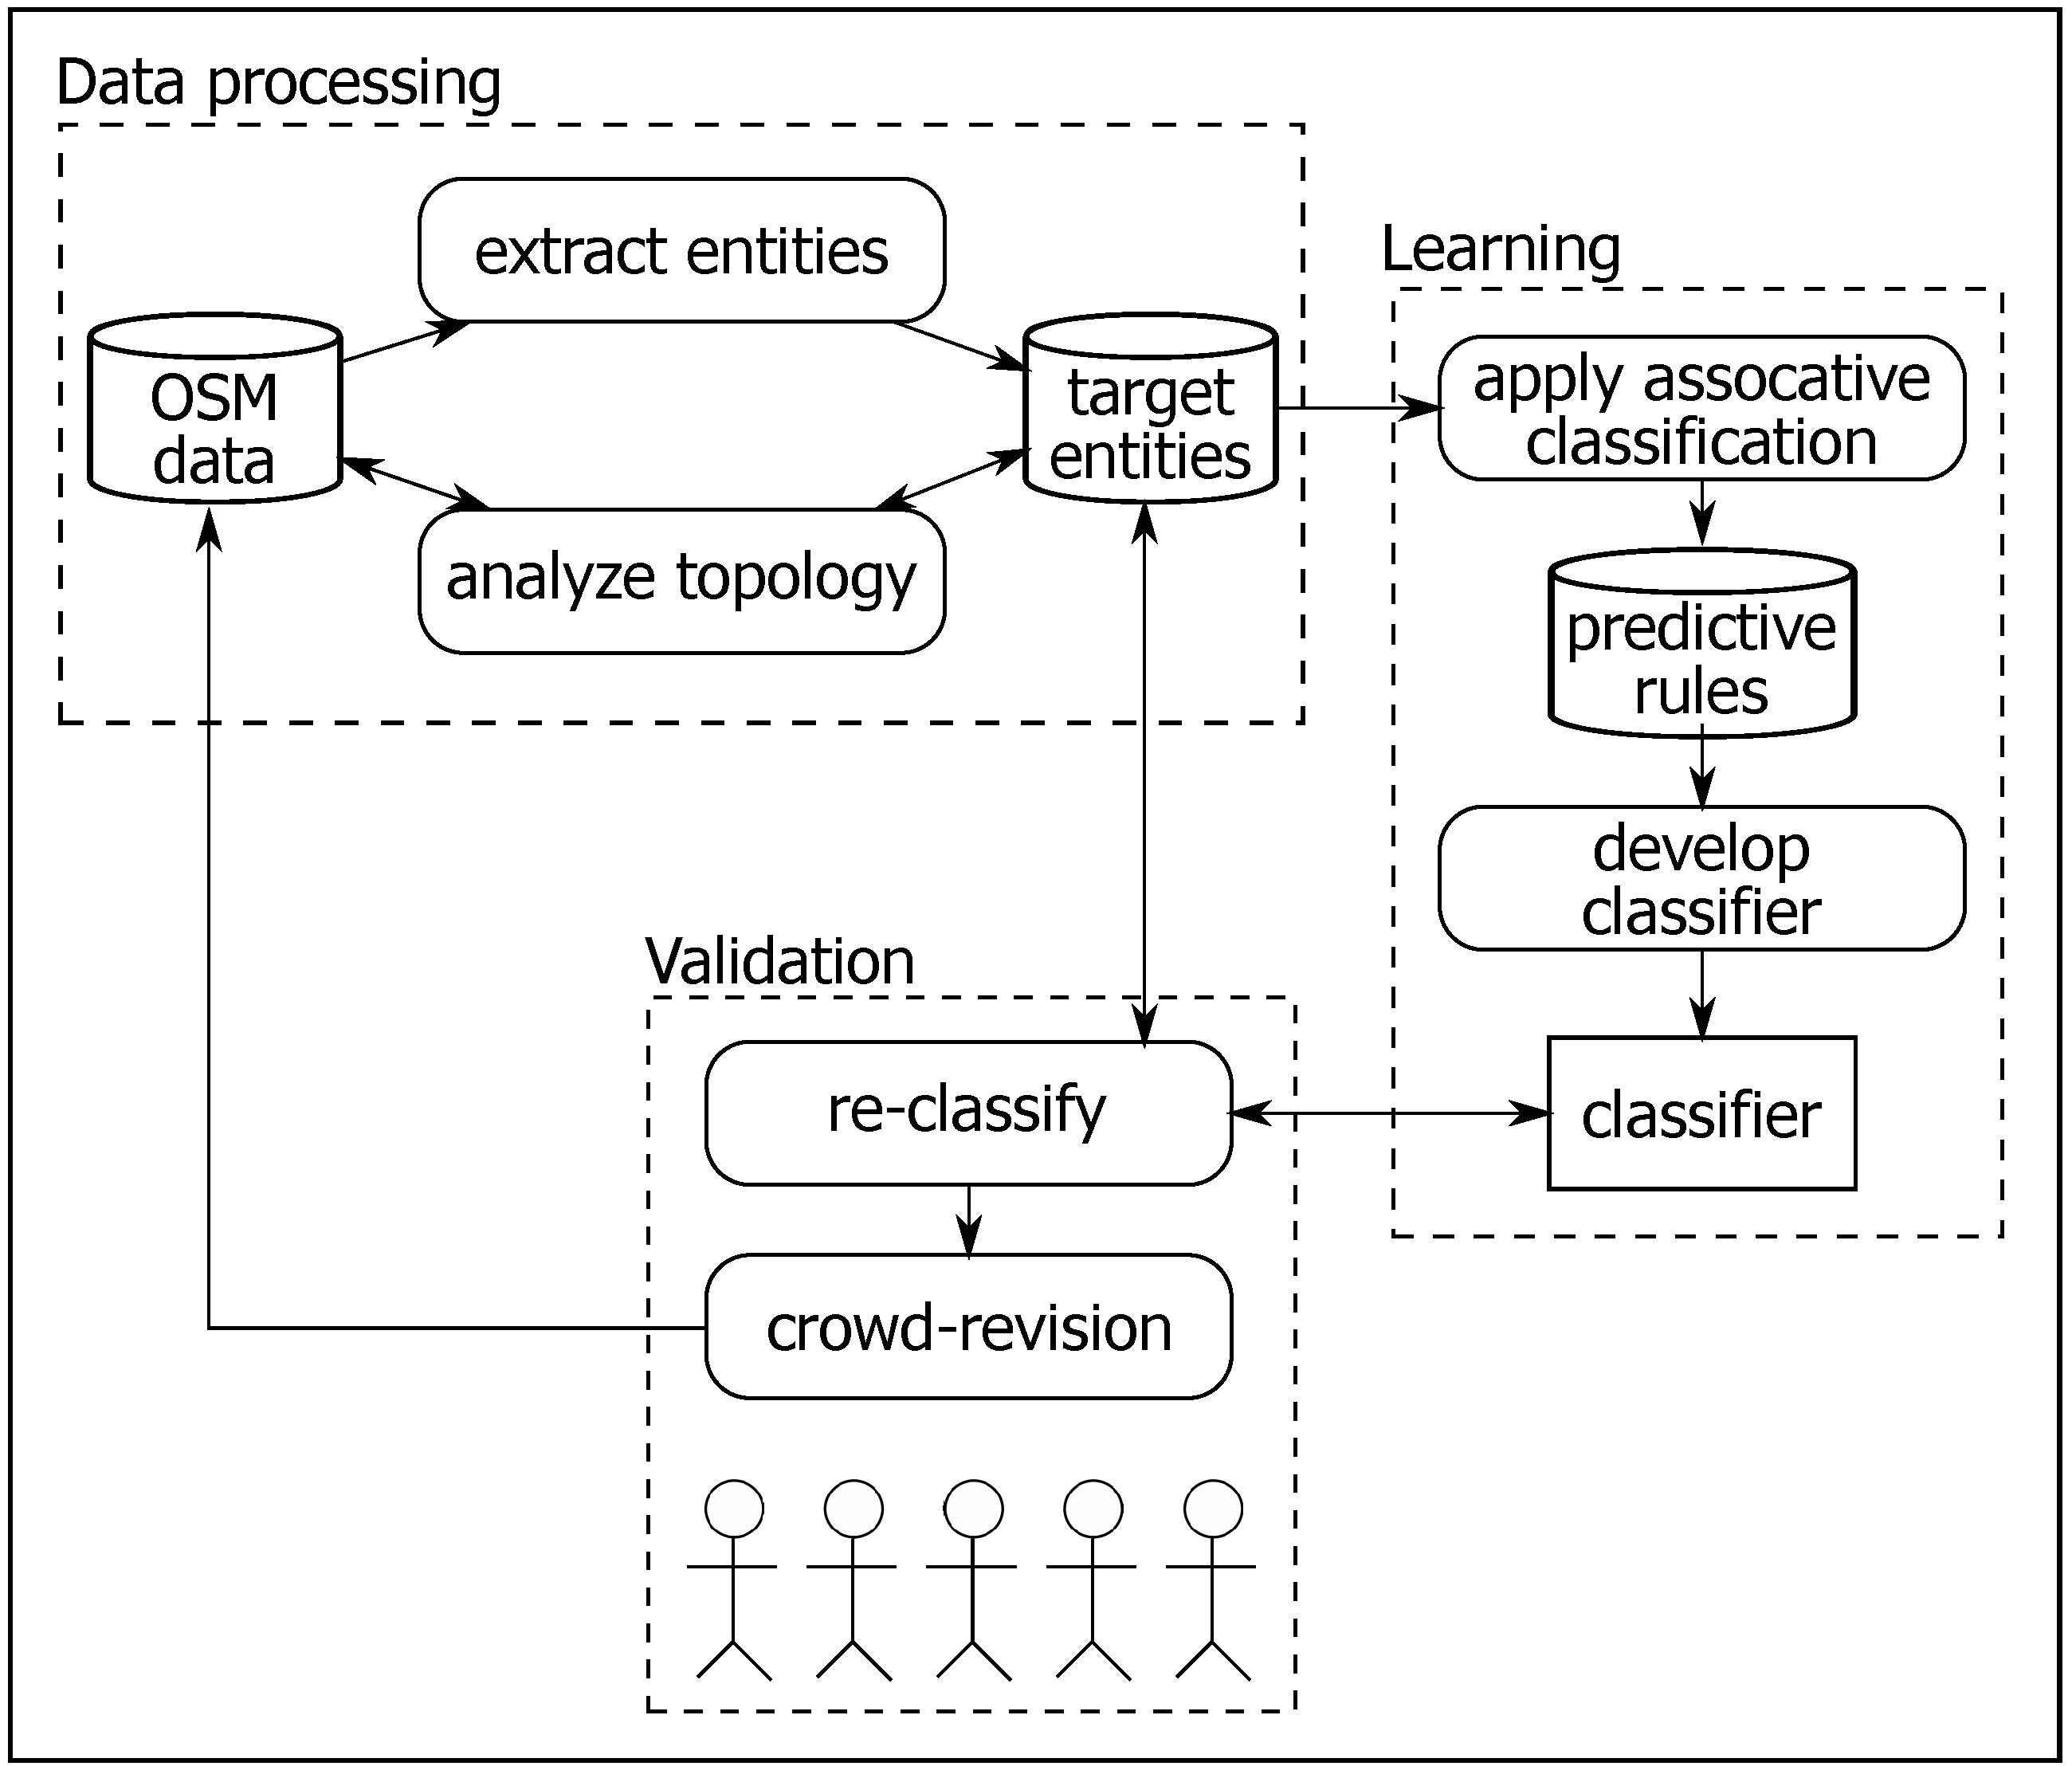
4. Rule-Guided Classification Approach

In [16,17], we tackled the classification by developing the rule-guided classification approach. In VGI projects, participant conceptualization of geographic features impacts on the data classification. From a human cognitive perspective, people are likely to investigate the qualitative characteristics of a given feature in order to classify it appropriately. Moreover, humans implicitly contrast between similar classes to infer a certain class instead of others. For example, we contrast between park and forest classes by looking into the coverage of trees, the availability of amusement and entertainment facilities, and the accessibility for pedestrians. Hence, our approach exploits the qualitative characteristics and comparison to distinguish between similar classes. For particular entities of overlapping classes, we apply a machine learning mechanism to extract the distinct qualitative topological characteristics that identify each class. These characteristics are formulated and organized to develop a classifier. Then, the approach employs the developed classifier to re-classify the entities and presents them again for crowdsourcing validation. In this approach, we assume that identical entities should be classified similarly within the same country (i.e., localized classification). Thus, learning from data from India and applying the extracted knowledge on data from Germany might lead to another problematic classification, due to different cultures and concepts. For further details, see [17].
Figure 3 illustrates the conceptual structure of the rule-guided classification approach. For exemplification, we demonstrate the approach on a case study. We utilize the OSM data set of Germany and target the classification of some grass-related classes: grass, garden, forest, park, and meadow. The choice of the Germany data set is due to the following reasons: (a) in Germany, there exists an active mappers community on the OSM project; (b) several studies confirmed the high quality of data, particularly in the urban areas; and (c) there is no large bulk import of data. Figure 3 divides the approach into three phases: data processing, learning, and validation phases.
(1) 
Data processing:
From the OSM data set of Germany, we extracted the entities of target classes. The entities are extracted from the most densely populated cities to ensure data of high quality. We are concerned with the areal entities. Thus, to understand the qualitative characteristics of the classes, we topologically checked each individual entity. We developed an automatic algorithm using the 9-Intersection Model (9IM) to perform the investigation [63]. This investigation aims to find out the common topological relations between pairs of entities; these relations are potentially useful to distinguish between similar classes. For example, find the relation between pairs of entity ( E 1 , E 2 ), when E 1 represents the target feature (e.g., park entity) and E 2 is another kind of nearby feature to E 1 (e.g., playground, water bodies, etc.).
(2) 
Learning:
The target of the learning phase is developing a classifier able to potentially distinguish between similar classes. We apply an associative classification [64] data mining mechanism to perform the learning task. This mining approach utilizes the association rule to construct the classification system [64]. First, we extract a set of predictive rules that describe each class, and then these rules were ranked and organized into the classifier. During the classification process, a given entity is matched against the entire extracted set of rules. The matched rules are ranked in descending order based on their confidence measures. Due to the overlapping problem (see Section 3), the developed classifier is configured to give the two most appropriate classes instead of picking out a single class.
(3) 
Validation:
Due to the nature of VGI, the proposed approach exploits crowdsourcing to validate the classification. The entities are re-classified using the developed classifier. Afterwards, they are presented to the public again for the purpose of revising the recommended classes. The validation phase has multiple functionalities: (a) enhance/ensure the target entities’ classification by crowdsourcing revision; (b) understand the public conception of target classes; and (c) find out the response of participants to the provided recommendations.
The first and second phases are presented with more details in a previous work [16,17], while this paper focuses on the third phase, where the implementation of the validation phase is presented in the next section.

5. Grass&Green: Customized Quality Assurance Application

As a validation of the rule-guided classification approach, we developed a web application called Grass&Green. We adopted a web-based architecture to reach a broad number of participants. The application launched in August 2015 and targeted at public participants and OSM mappers as well. The application is hosted on an Ubuntu [65] server as a sub-branch of the OpenScienceMap (OScieM) project [66].
The application description is presented in Section 5.1. Section 5.2 demonstrates the application architecture and its components, while the utilized channels to attract participants are discussed in Section 5.3.

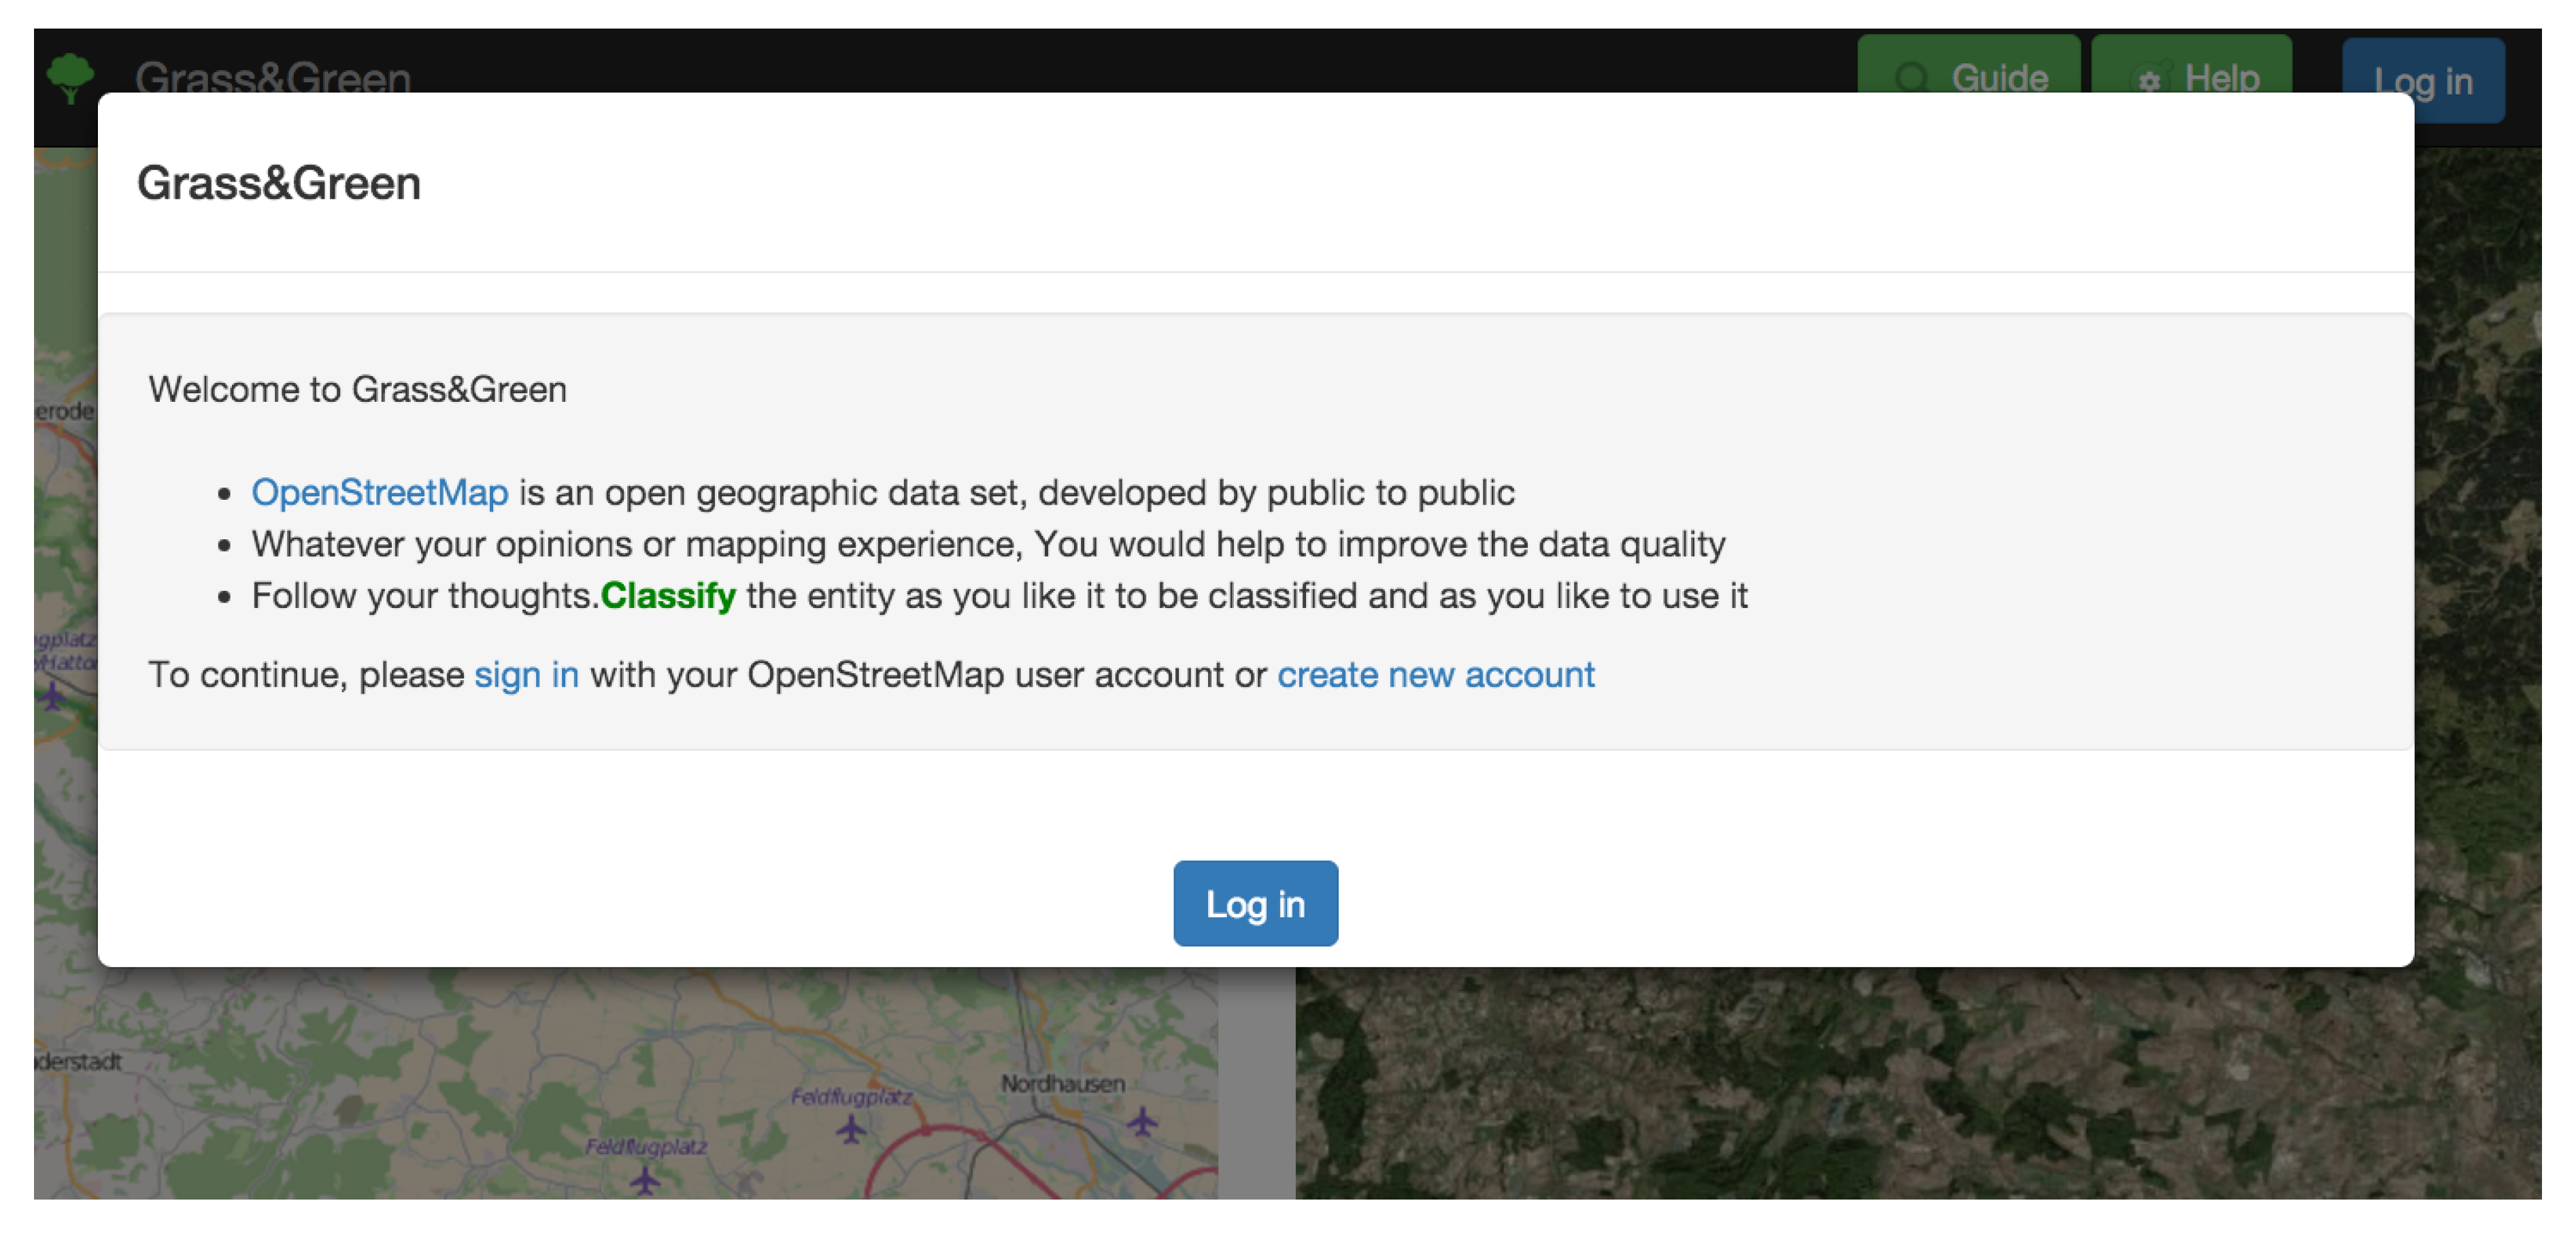
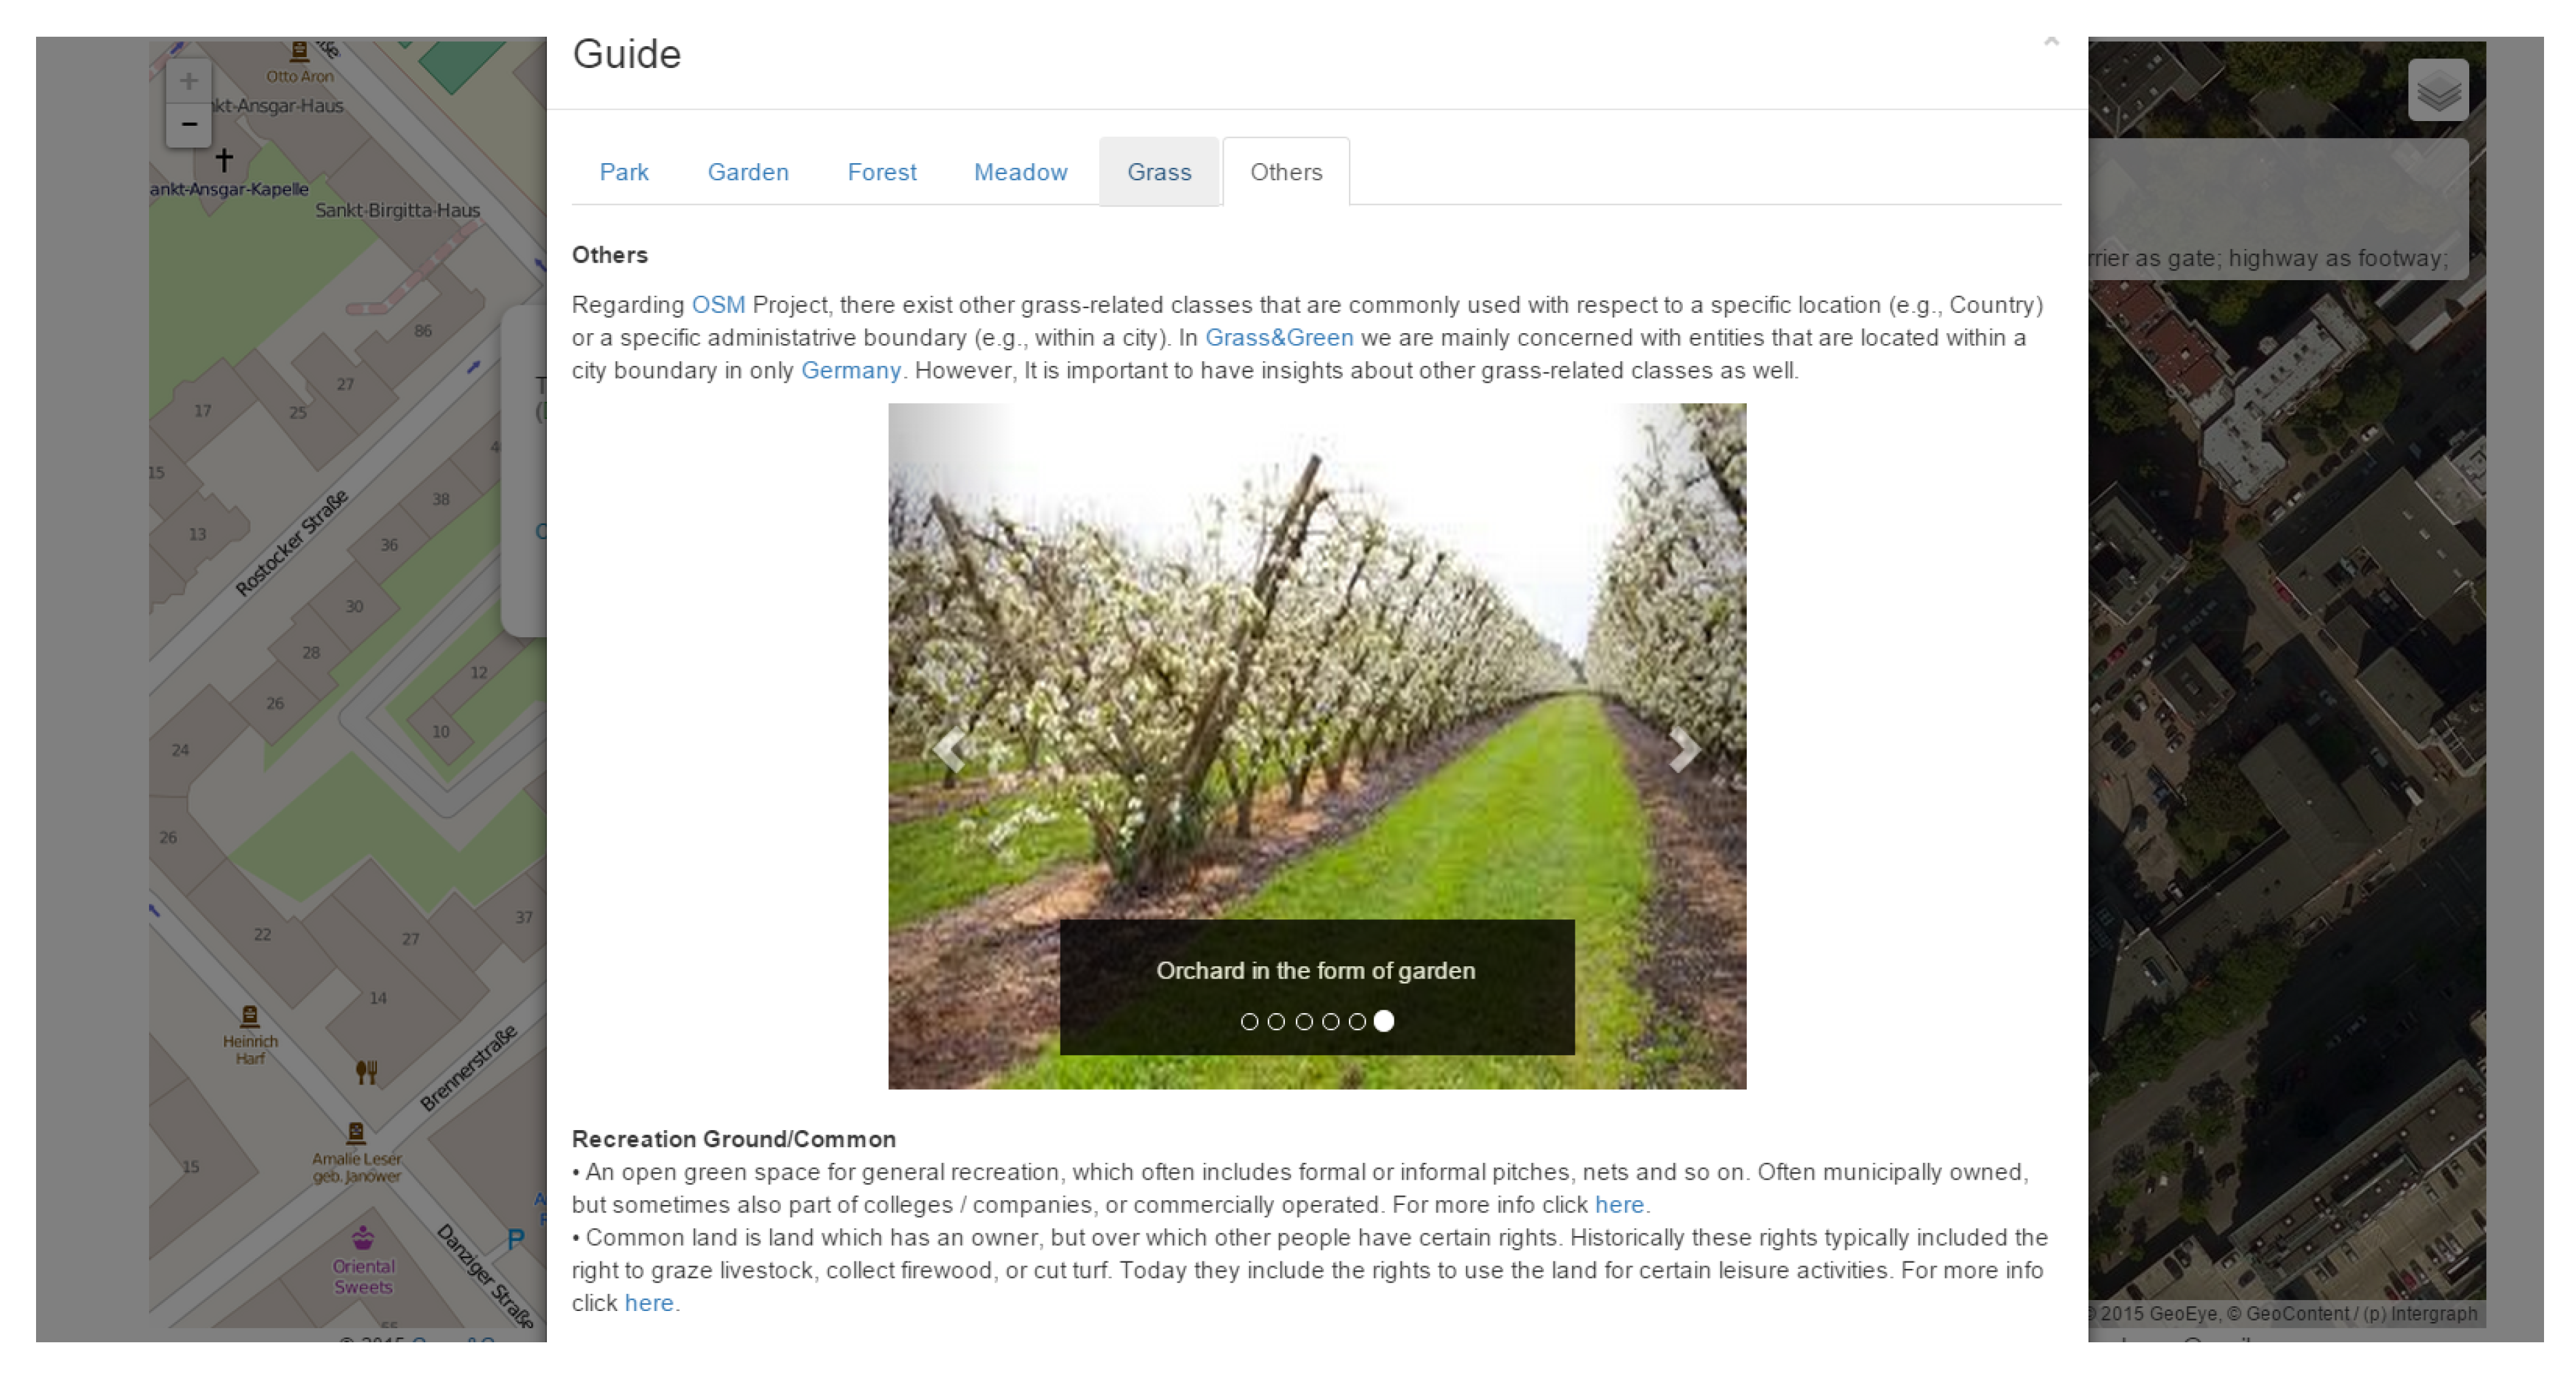
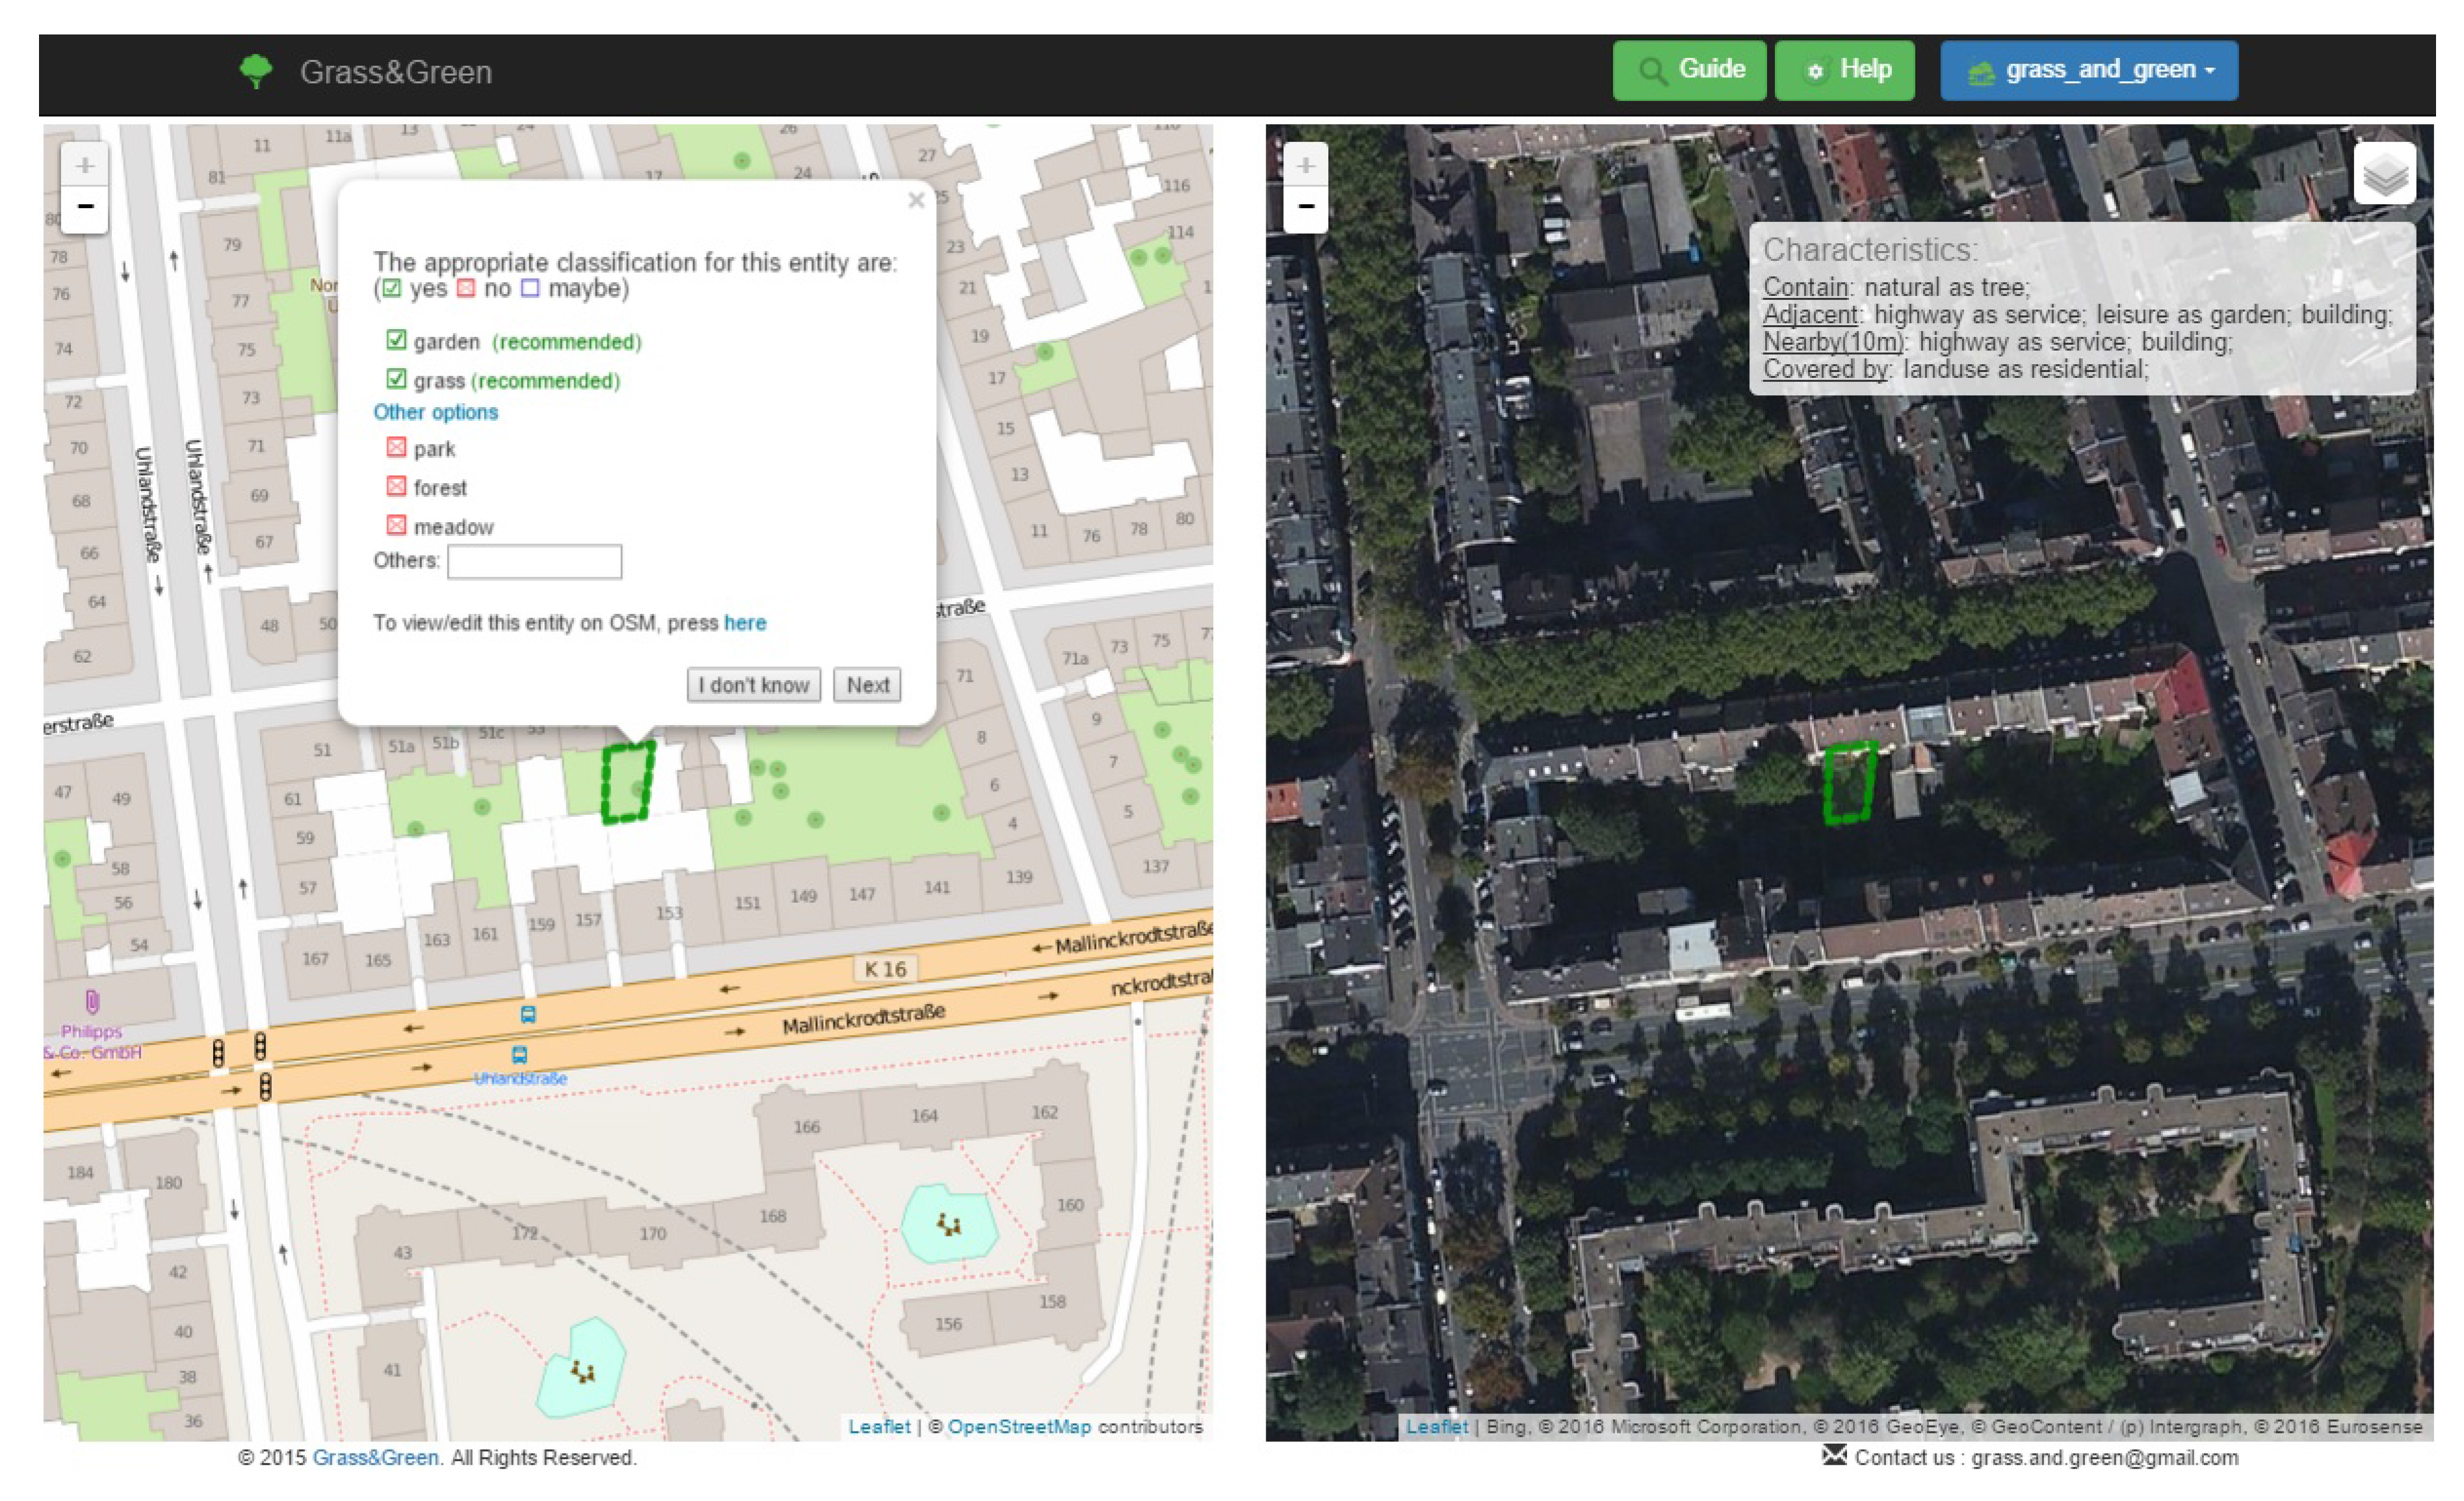
5.1. Application Description

Figure 4, Figure 5 and Figure 6 illustrate the user interface (UI) of the application. The interface usability and ease of use are of concern in order for us to achieve the application objectives and to simulate the nature of VGI projects as well. Before logging in, Grass&Green presents the instructions for use to the participant. As we contribute directly to the OSM project, participants must have an OSM user account. The application allows non-OSM users to register for an account (see Figure 4).
For non-expert participants, the application has a menu called “Guide” that introduces the class descriptions. The descriptions are provided visually and as text from multiple sources: Wikipedia, OSM Wiki, and WordNet [67] (see Figure 5).
After login, the application shows the entities to the participant randomly. Figure 6 shows the simple interface of the revision process. On the right-hand side, the given entity is outlined and overlapped with Bing satellite images, which is an aerial image provider. In addition, the topological qualitative descriptions of the entity are provided as text. For example, the given entity in Figure 6 contains trees, adjacent to a building, a garden, and a service way, and covered by a residential area. On the left-hand side, the entity is outlined and overlapped with the OSM base map. Over the entity, a pop-up message shows the recommended classes (marked as recommended) and the other classes as well. The validation is flexible, similar to the contribution mechanism of the OSM project; the participant could select between “yes”, “no”, and “maybe” options from the provided classes. The participant could deselect our recommendations and select other classes or add a new class (if required). More options are provided for the participant like view and editing the entity directly through the OSM project interfaces. In both maps, a zoom in/out option is provided to enable the participants to explore the geographical context.
Furthermore, the “Help” menu provides participants with the instructions at anytime if required. At the bottom, a contact e-mail address is given for further feedback and comments from interested participants. At any point, participants are allowed to logout or simply close the application to exit the validation process.

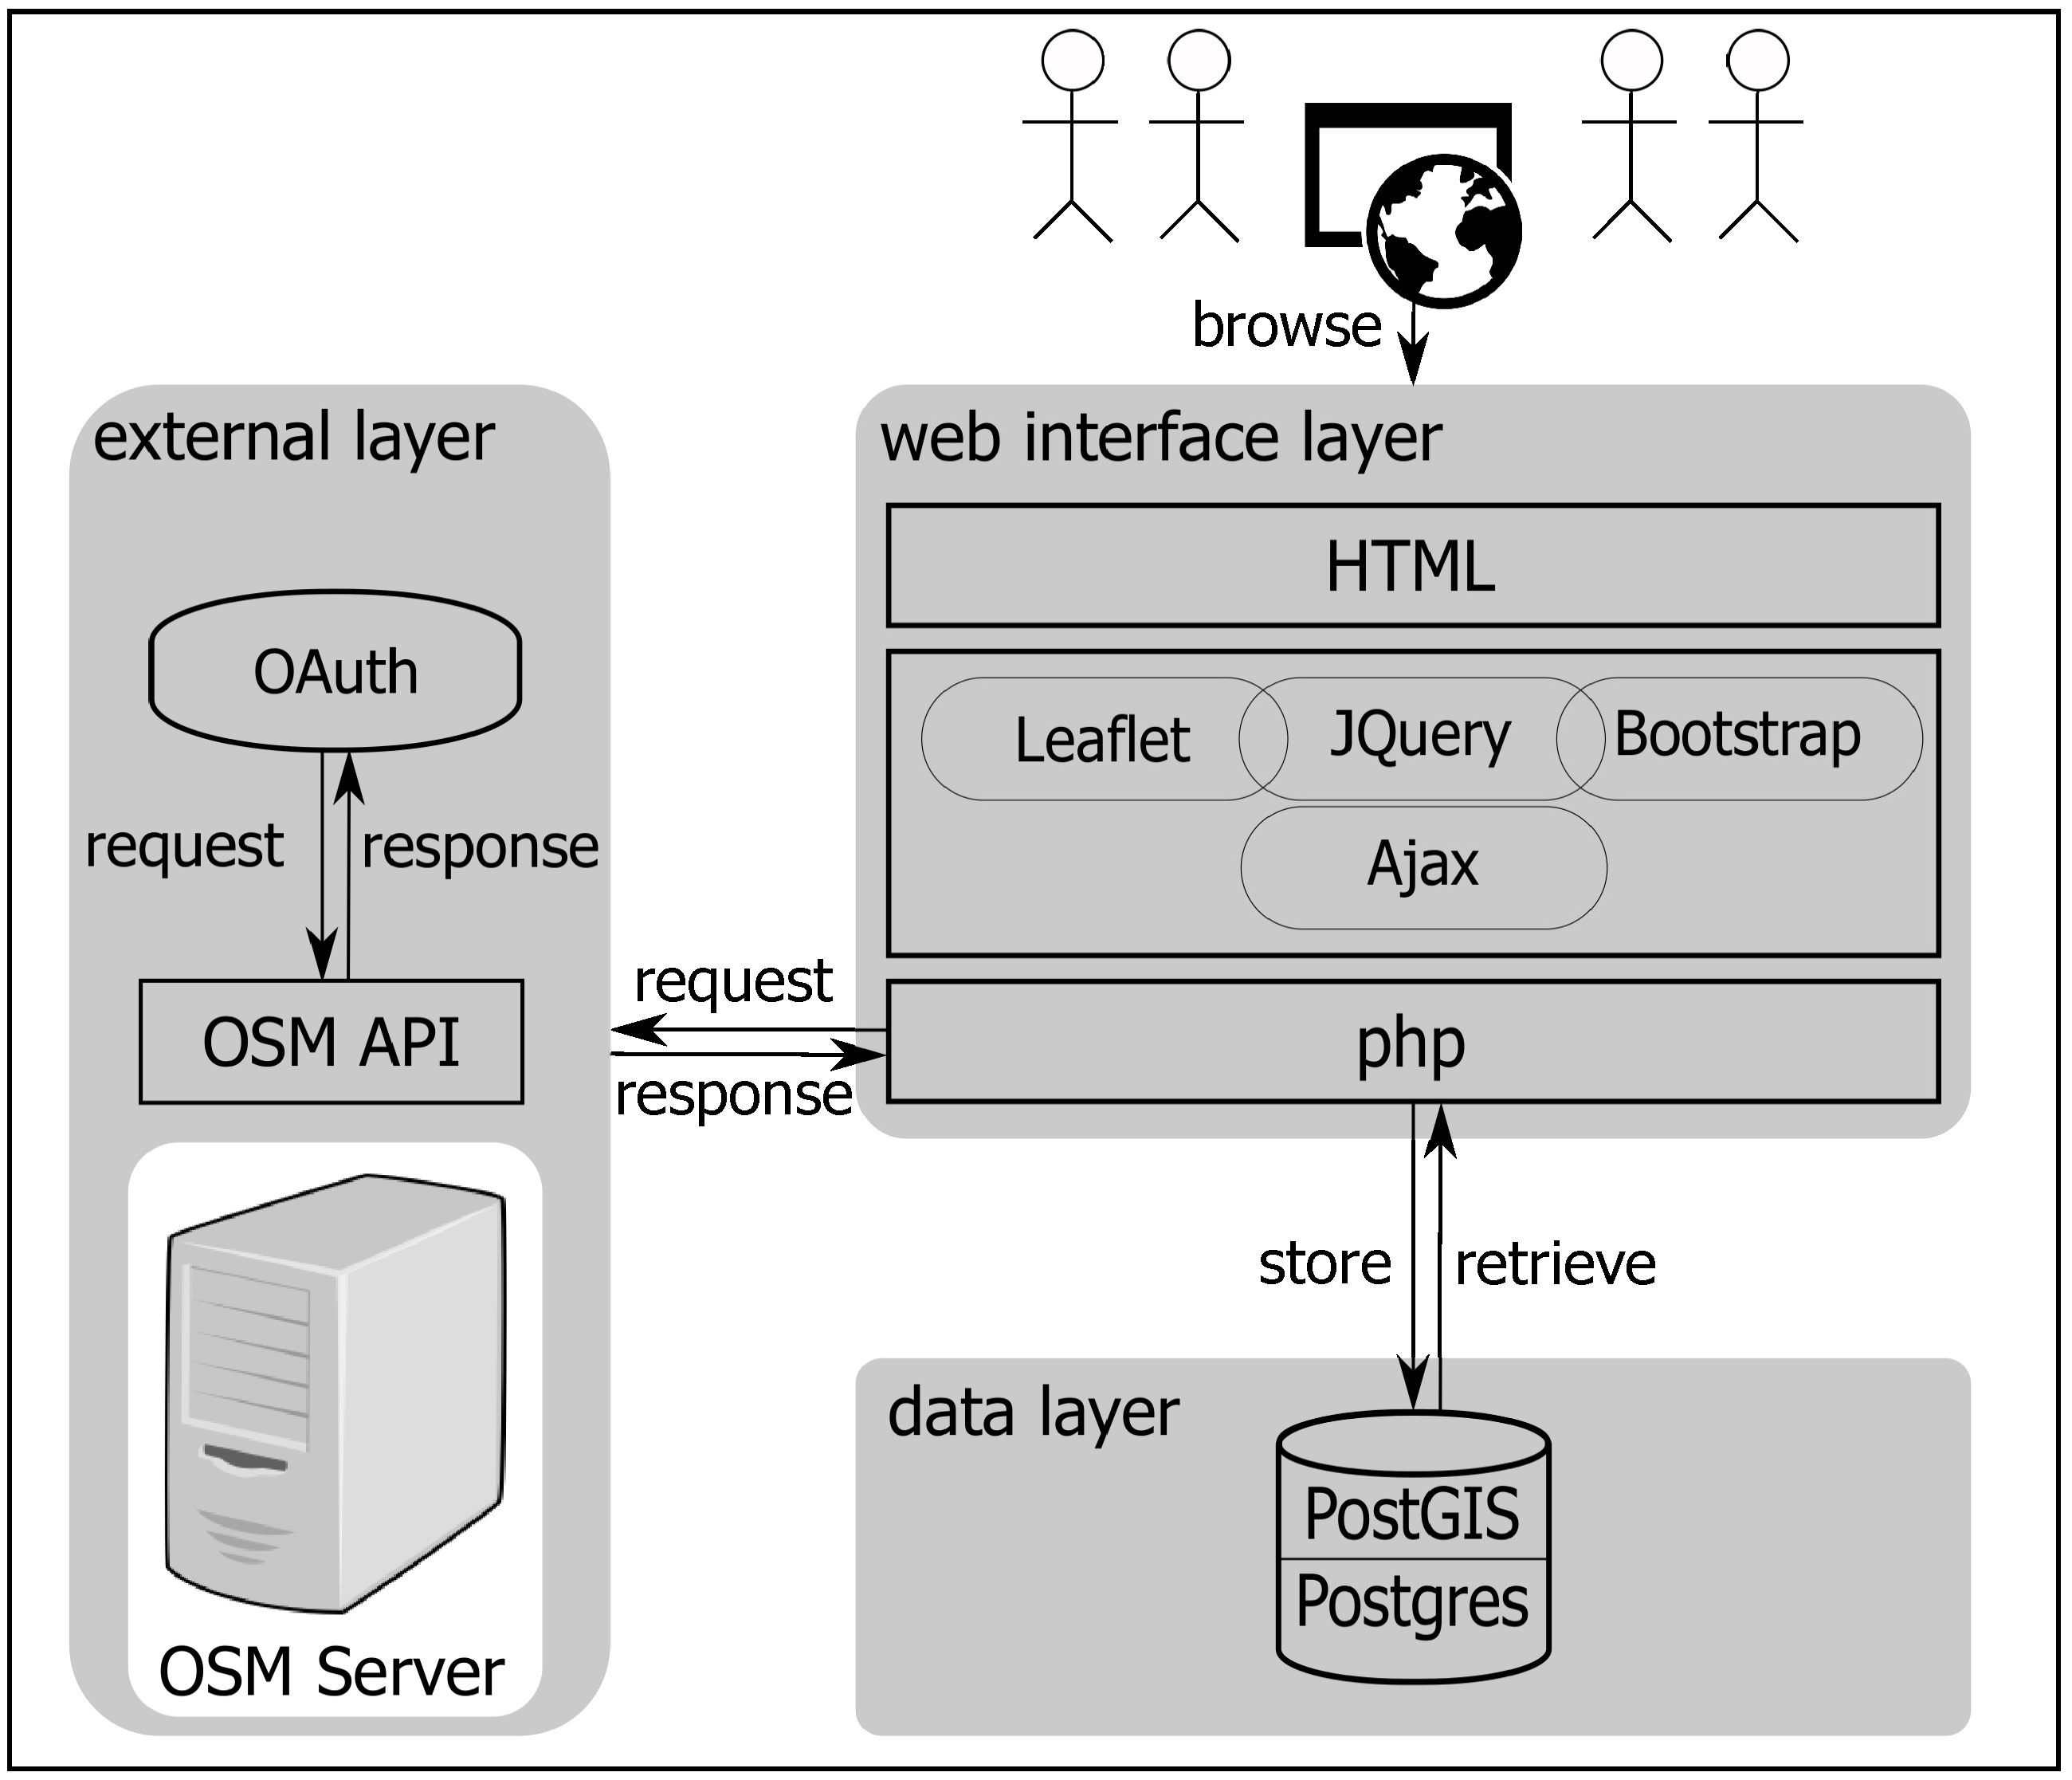
5.2. Application Architecture

As a web-based application, Grass&Green consists of front-end and back-end components; the front-end components control the usability and the visualization in the UI like the leaflet component [68], the Bootstrap framework [69], and the JQuery library [70] while the back-end components are responsible for performing efficient and reliable communications among application layers. Figure 7 shows how the application is composed of three layers: interface layer, data layer, and external layer.
Using any internet browser, the participants can access the interface layer. First, the participants login to the application using the authorization open standard of OAuth [71], which allows them to connect to a third party website—in this case, the OSM project—in a secure way without exposing their password. After successful login, the interface layer, by means of AJAX and PHP, starts to call the data from the data layer for the validation process. By means of php functions, the application controls the validation results and participant contributions. The data layer contains the data set developed by the proposed approach in [17]. In the data set, each entity is associated with its topological qualitative characteristics, its geometry, and two recommended classes. The data set is stored in a Postgres data base with postGIS extension to handle the geometry of entities. As an external layer, the OSM server is accessed through the OSM Application Program Interface (API). We used the OSM user account as a reference to participant experience and their geographic origin. During the validation, participants have options to edit/view the presented entities by OSM editors/viewers. In addition, the interface layer calls the OSM API to update the entities after the validation process.

5.3. Announcement Methods and Target Participants

Participants are the power of any VGI project. Thus, attracting and encouraging participants to contribute is one of the deployment challenges. The aim is to attract a large number of participants: OSM mappers and public participants as well. We have exploited the power of the crowd to attract participants using the following channels:
  • OSM diaries:
    We announced the launch and the objectives of the application locally to the OSM mappers through the project diaries (https://www.openstreetmap.org/user/grass_and_green/diary). The OSM diaries are public to every one.
  • Social Media:
    We developed two pages for the project: one on Twitter (https://twitter.com/grass_and_green) and the other on Facebook (https://www.facebook.com/grassANDgreen/) to use the power of social media to attract public participants. We infrequently sent news of the application and thanked the participants on the project pages.
  • Others:
    Mailing lists and paper-based flyers are also utilized to target other researchers and students as well.

6. Results

In this section, we discuss the results that have been obtained by the application from various perspectives: participant and contribution patterns (Section 6.1), the participant responses to recommendations (Section 6.2), and the potential enhanced data classification (Section 6.3). In addition, we analyzed the participant feedback as well (Section 6.4). The presented results represent the contributions over a four-month period from 28 August to 28 December 2015.

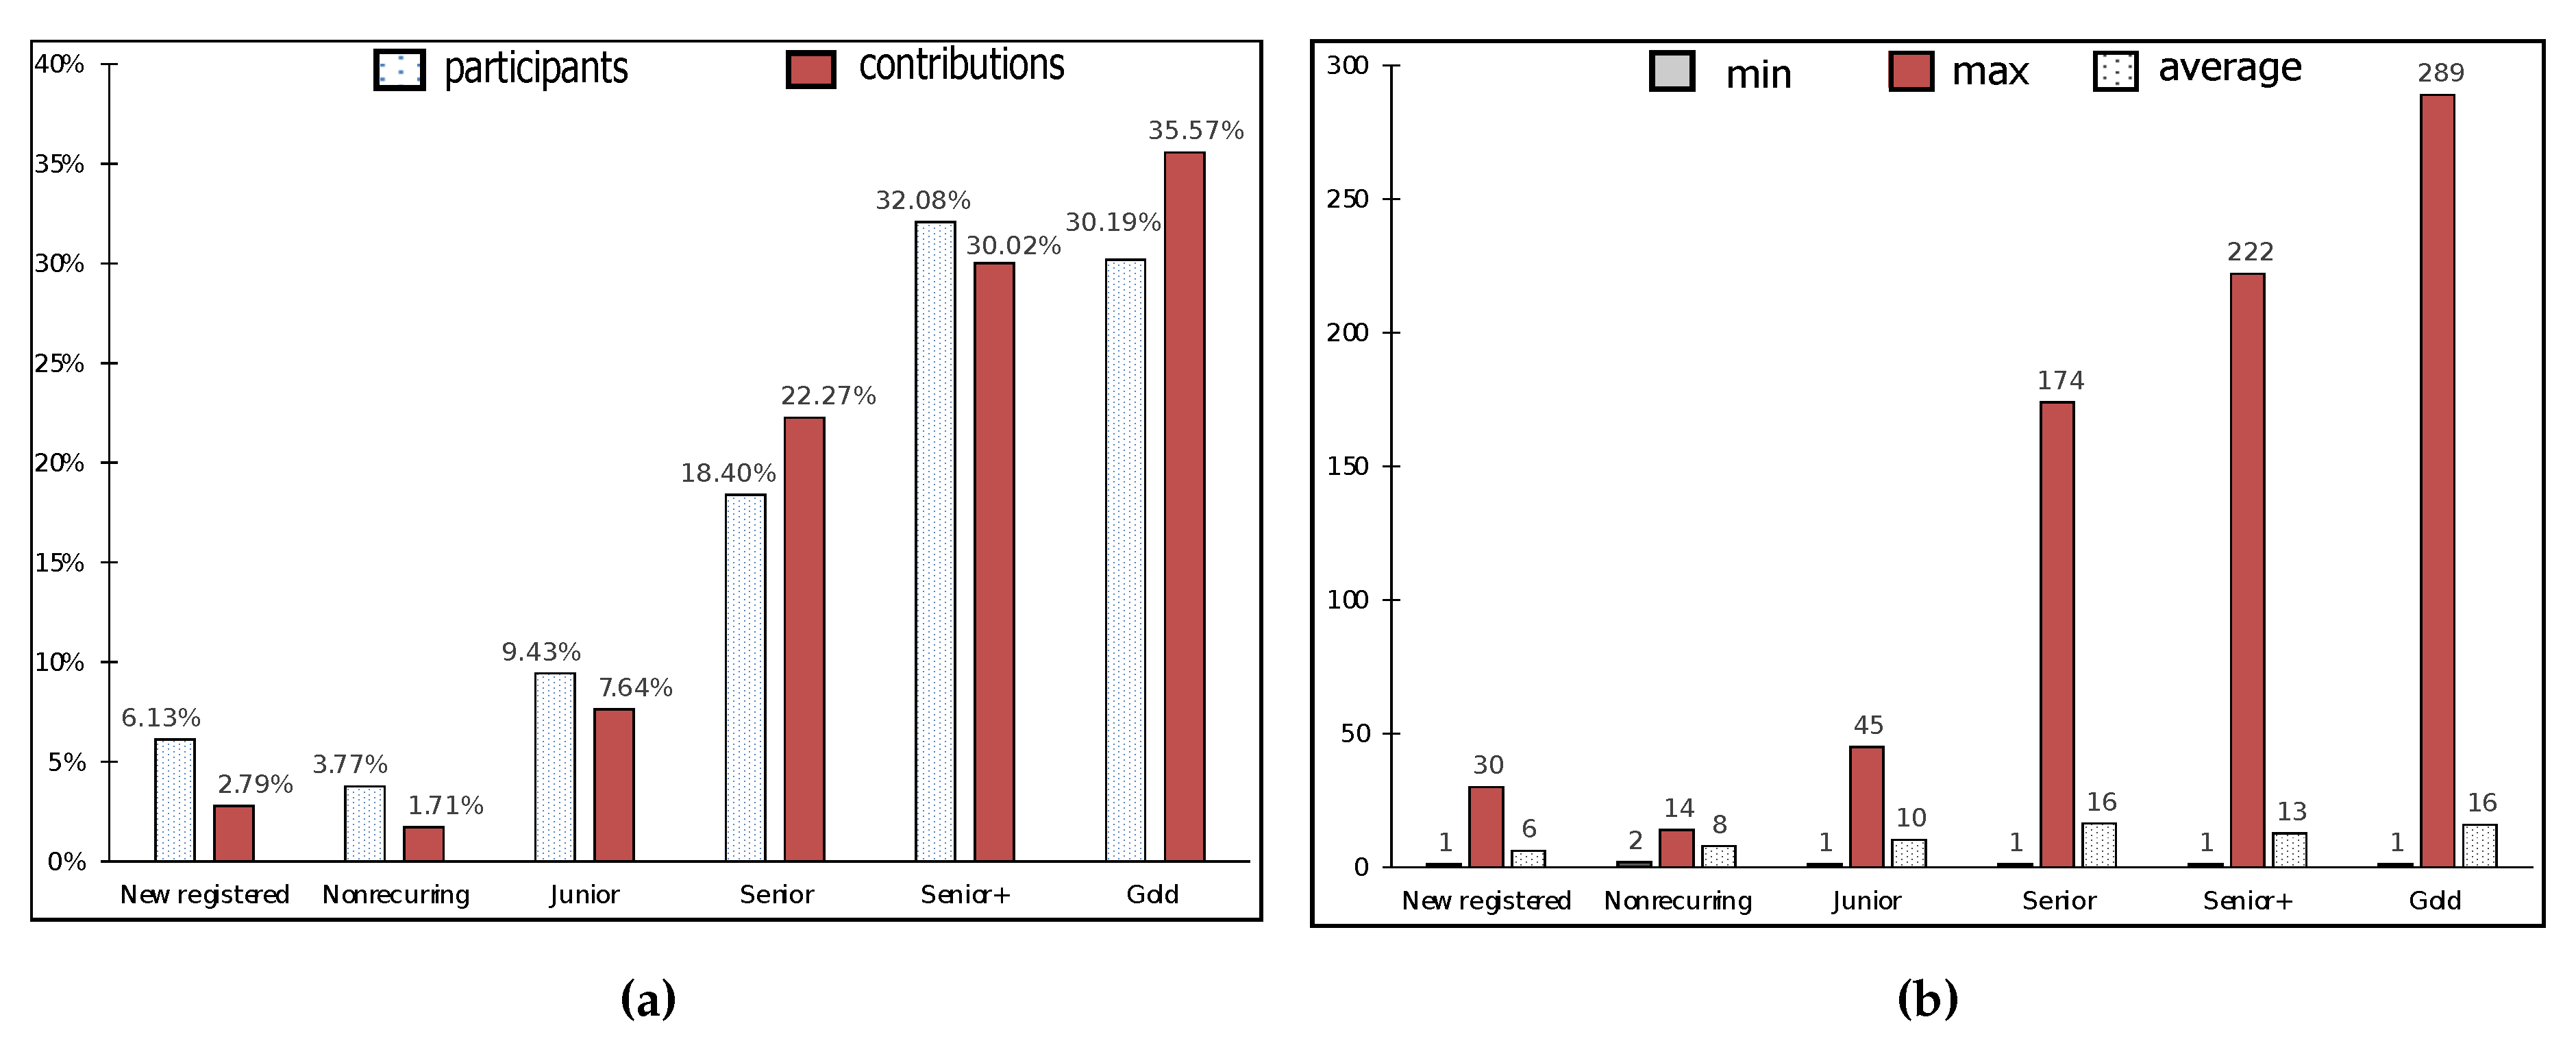
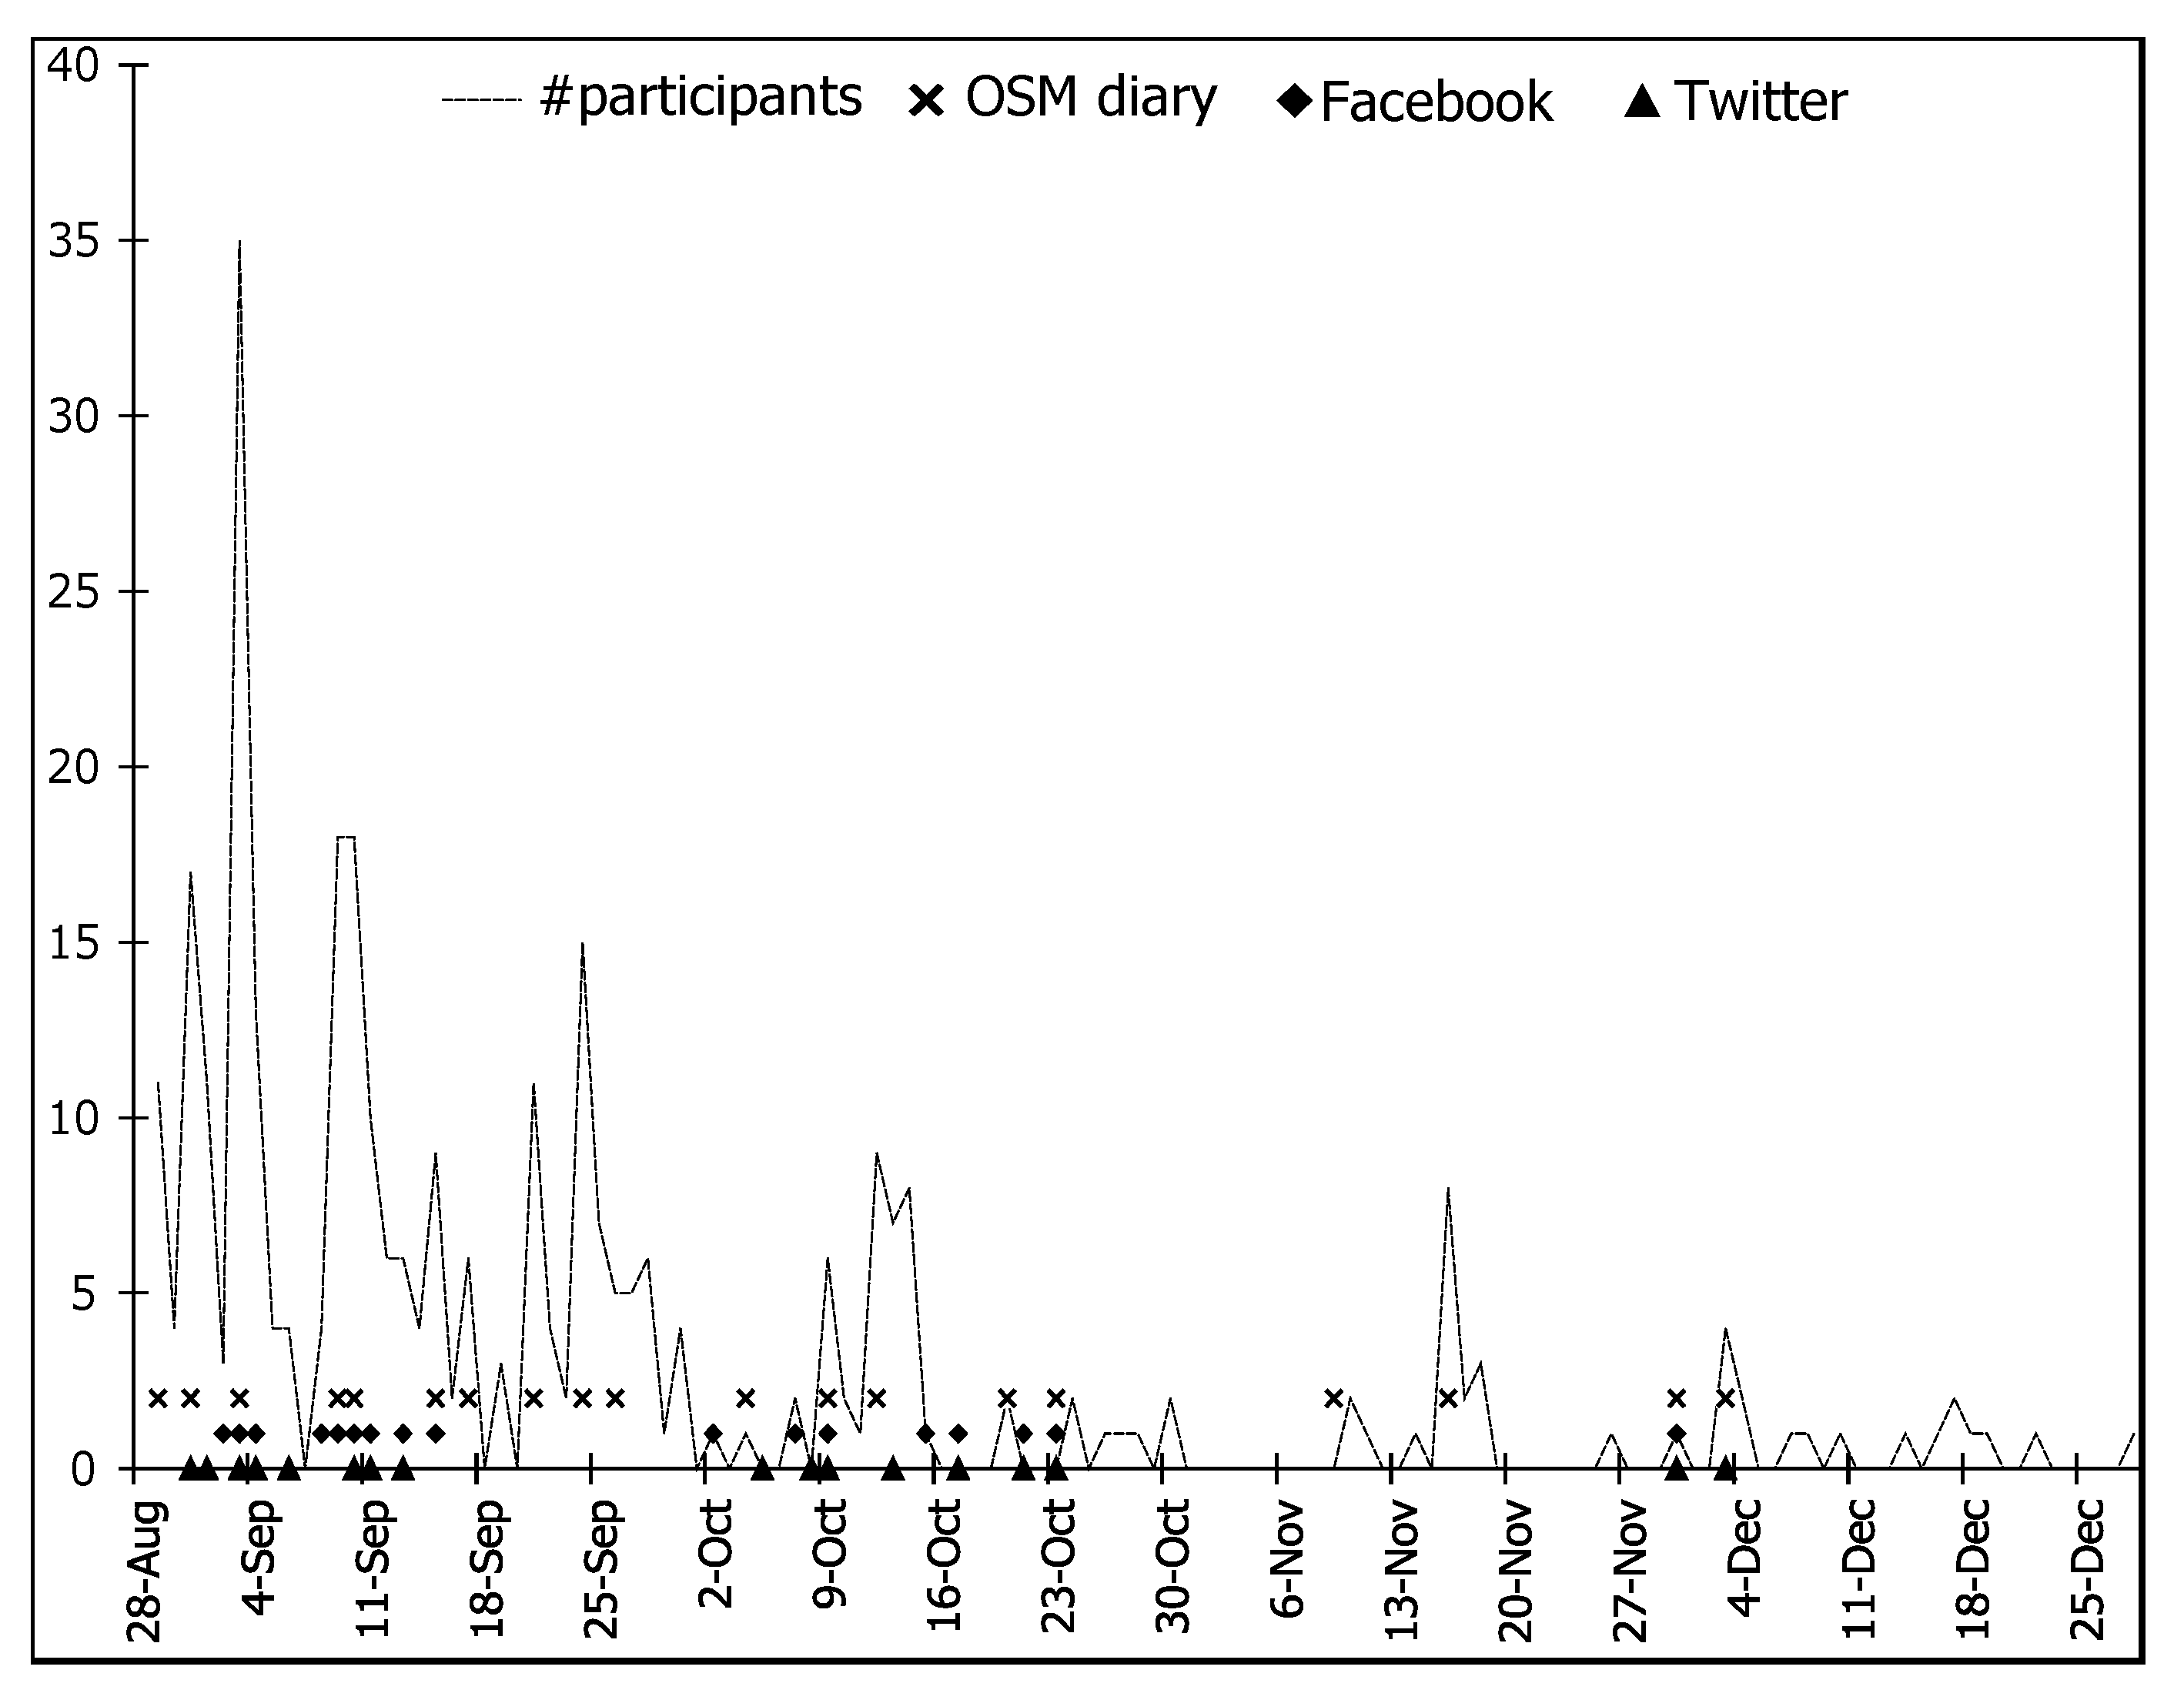
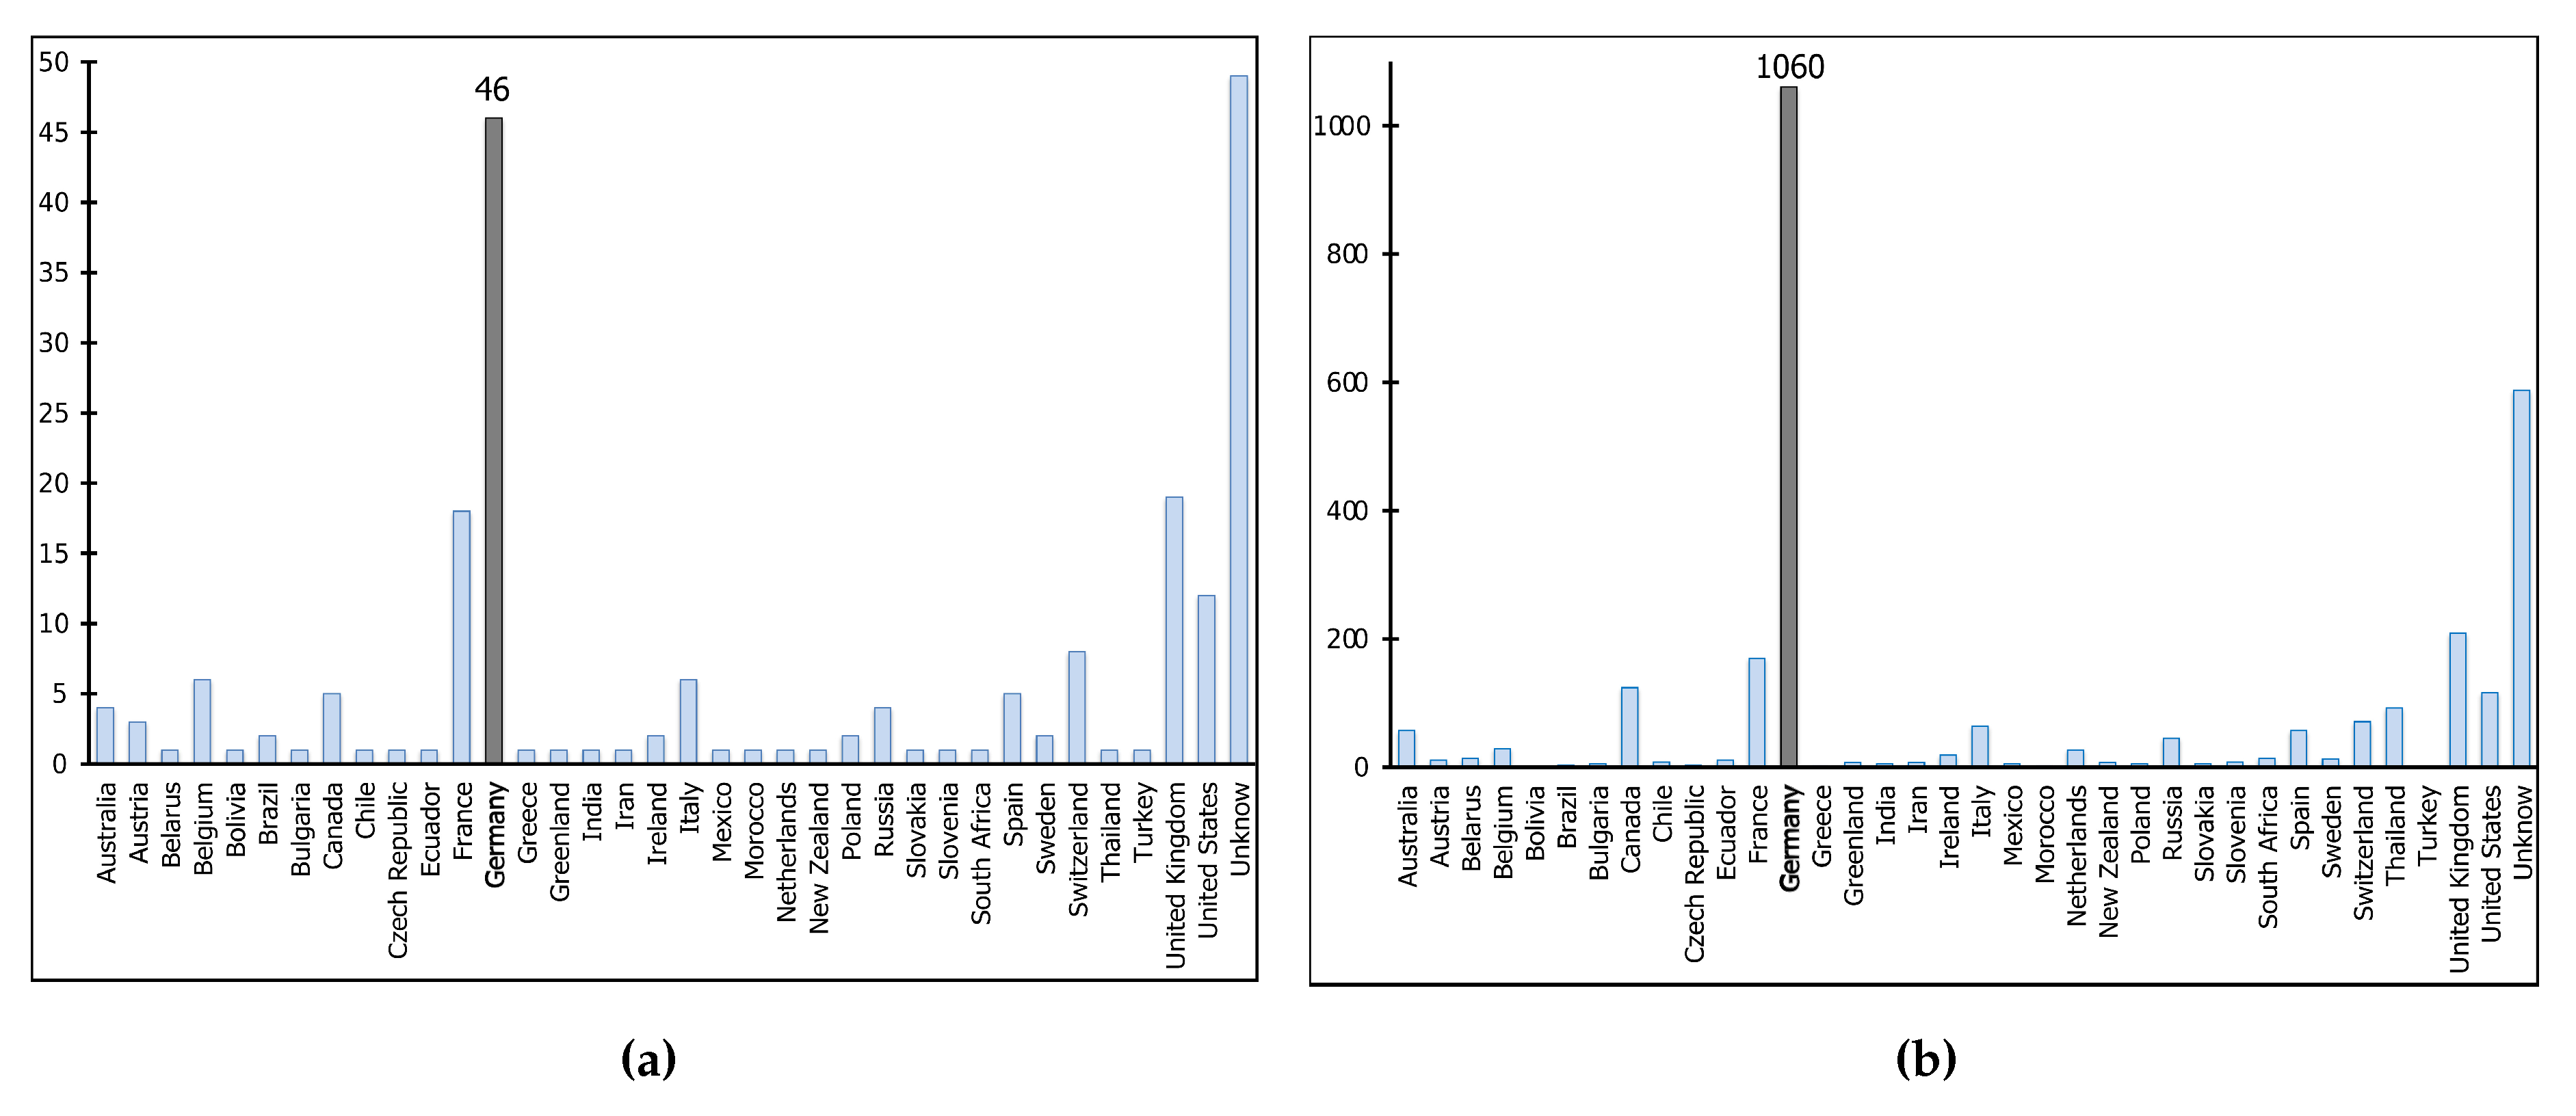
6.1. Participant and Contribution Patterns

Taking into account that we used simple declaration approaches, Figure 8, Figure 9 and Figure 10 give insight into the patterns of participants and contributions. The application attracted 212 participants: 163 participants have a known origin of location from 35 different countries while the others are from unknown locations. Figure 8a shows that 46 (about 28%) out of 163 participants are from Germany. In addition, the participants examined the classification of 2,865 entities; 1,060 out of these entities have been checked by participants related to Germany, as shown in Figure 8b, which is relevant to the data set used here. The rest of the entities have been checked by participants from different locations.
On the other hand, the participants have various levels of familiarity with the OSM project, and, consequently, distinct levels of contributions, as shown in Figure 9. We group the participants, according to the proposed categorization schema in [30], based on the Changsets; when the Changesets denote the number of changes the mapper done including add, delete, and update operations.
Figure 9a shows the distribution of participants and contributions per group as follows: 30.19% Gold > = 2000), 32.08% Senior + (500 < = changesets < 2,000), 18.4% Senior (100 < = changesets < 500), 9.43% Junior (10 < = changesets < 100), 3.77% Nonrecurring (1 < changesets < 10), and 6.13% New registered (changesets < = 1). In Grass&Green, about 65% of contributions are from Senior + and Gold mappers, which adds reliability to the obtained results. Figure 9b shows the minimum and maximum contributions of participants per group, in addition to the average contributions per participant. This figure indicates that the more experience and familiarity of a participant with the OSM project, the more they are concerned and contribute. Figure 9b shows that the participants from Gold, Senior + , Senior, and Junior groups examined on average between 11–16 entities/participant, while participants from Nonrecurring and New registered groups checked on average between 6–8 entities/participant. The finding shows some extreme concerns of individual contributions of 289, 222, and 174 entities from participants belonging to Gold, Senior, and Senior + groups, respectively.
Figure 10 shows the contribution patterns relative to the utilized announcement methods. After two weeks, the number of participants are mostly less than ten per day. The figure shows that the number of participants decreases with time and increases with using an attraction method, particularly the OSM diaries.

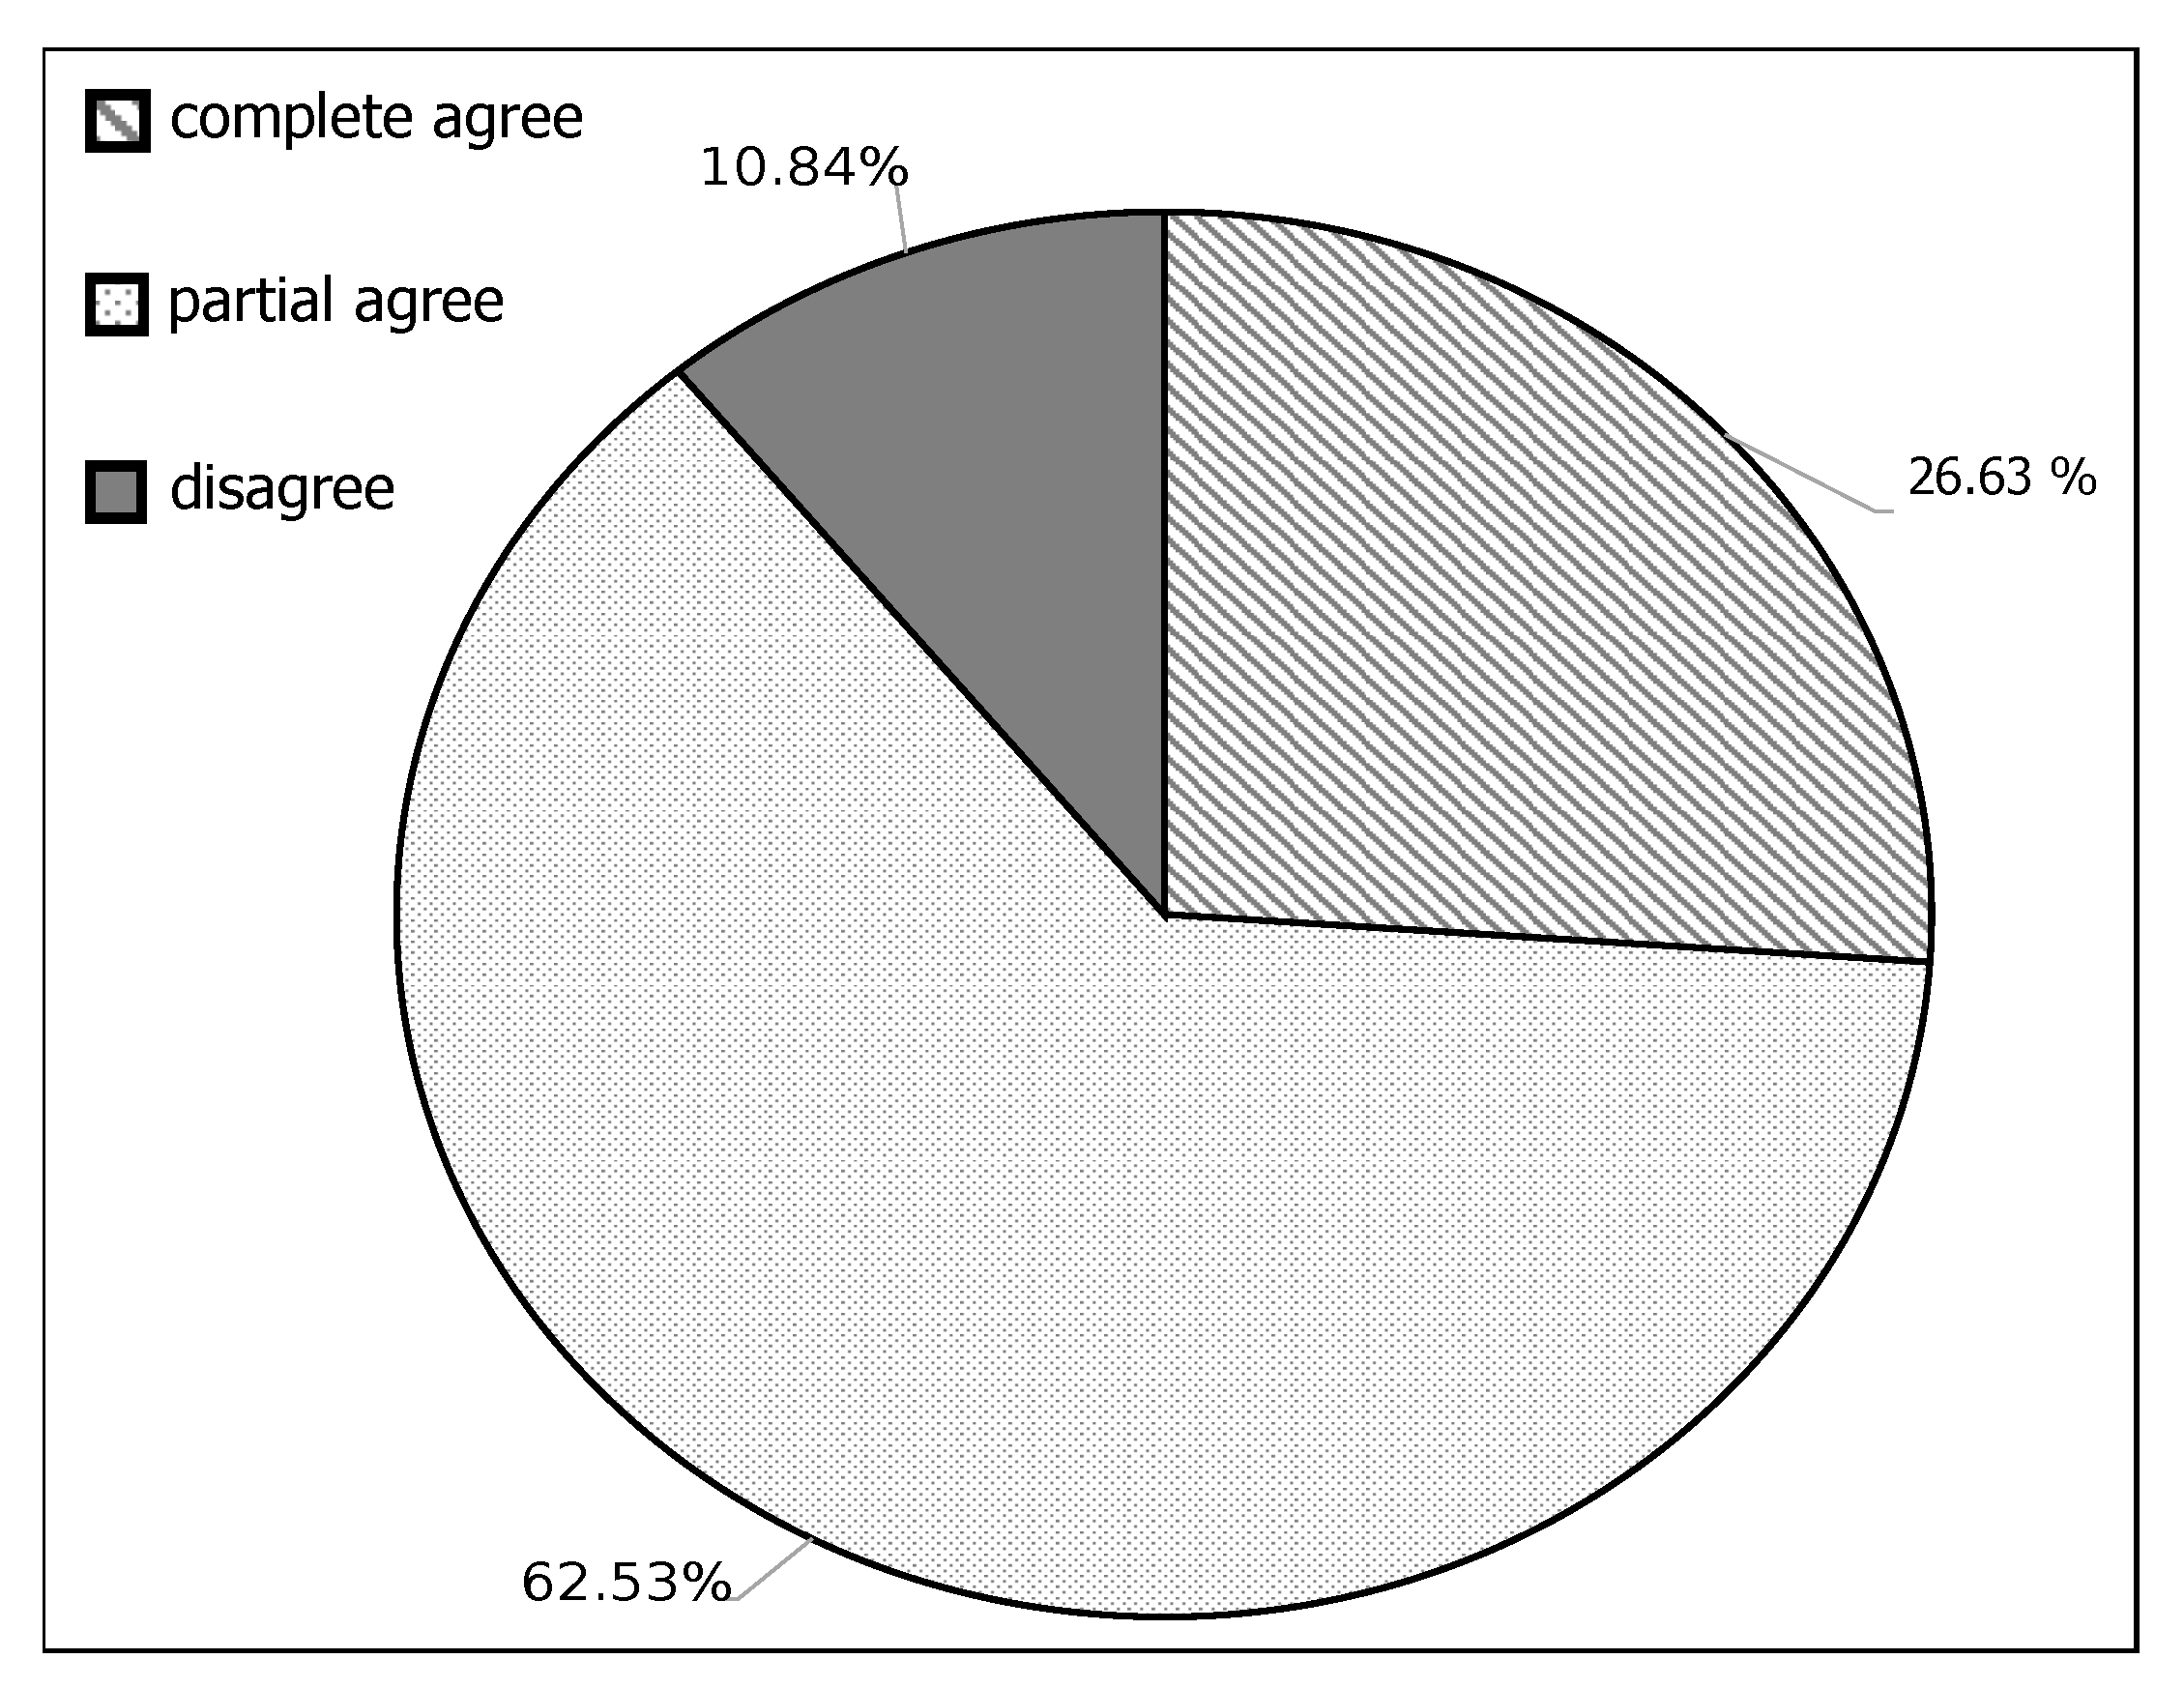
6.2. Participant Responses

The participants checked 2,865 entities. During the validation, the participant may select the “I do not know” option, when they are not confident about a certain classification. For 586 entities, we received the “I do not know” option, when the variances between classes were not recognized by the participants. In these cases, the entities have not been updated on the OSM project and have been excluded from our analysis as well. For the rest of the 2,279 entities, we received a participant’s opinion. As explained before (see Section 5.1), the participant has complete flexibility to adapt our recommended classes resulting in three levels of participant agreement:
  • Complete agreement: when a participant agrees with both of the recommended classes and marks them with the “yes” option.
  • Partial agreement: when a participant agrees with only one of the recommended classes and marks the other with a “no” or “maybe” option.
  • Disagreement: when a participant does not agree with any of the recommended classes and marks them both with a “no” or “maybe” option.
Figure 11 shows the agreement of the participants with the recommended classes as follows: 10.84% disagree, 26.89% completely agree, and 62.53% partially agree. We can conclude that about 89% of the participants have complete/partial agreement with the recommended classes. The findings indicate the success of the developed classifier to distinguish between the target classes. Furthermore, the responses and the participation implies the feasibility of the proposed approach as well.

6.3. Enhanced Data Classification Quality

To understand the influence of our approach on data classification quality, we analyzed the contributions in more detail. We examined the classification of entities before and after the validation with respect to the recommended classes. Table 2 and Table 3 give two different views of the results.
Table 2 compares the classification of entities before and after the validation with respect to the recommended classes and participant opinions. During the indicated period, participants validated 2,279 entities; these entities were classified previously as follows: 412 garden, 1,136 grass, and 731 park. In the analysis, we investigate whether the previous classification is recommended or not by our approach. From a cognitive view, in this analysis, we consider a “maybe” answer to be closer to “yes” than to “no”. The findings indicate that the participants accepted 75.9%, 89.2%, and 85.2% of the recommendations of the garden, grass, and park entities, respectively. The participants confirmed the classification of a large portion of the presented entities, as well as correcting other potential misclassified entities (bold numbers in 3rd and 4th columns of Table 2). In general, they accepted about 85.5% of the provided recommendations.
In another analysis, Table 3 gives insight into the classes with respect to the recommendations and participant opinions after the validation process. During the validation process, the forest class was recommended for 748 entities either as first or second recommendations. For 184 out of the 748 entities, participants agreed on the potential recommended classes when the forest class was not previously assigned to any of the presented entities; the same occurred with the meadow class (bold numbers in Table 3). Furthermore, entities that have potentially accepted classes of garden, grass, and park are more than the presented entities per each class as shown in comparison with Table 2. On one hand, the finding may indicate the potential correction of misclassified entities. On the other hand, the overall results in Table 3 proved the conceptual overlapping classification and demonstrate the plausibility of multiple classes as indicated in Figure 12.
Through manual investigation, we detected cases when entities can strongly belong to various classes. According to participant validations, we found numerous entities with two valid classes; among others, 37 entities as park/forest, 24 entities as park/garden, and two as park/meadow. Figure 12 illustrates some of these examples when the given entity in Figure 12a is located within a forest area and adjacent to a farmyard. However, the entity contains a playground (i.e., entertainment facility) and is paved by footways (dashed red lines). Thus, it is recommended and validated to be classified as park/meadow while the presented entities in Figure 12b,c are recommended and validated as park/forest; they are partially covered by heavy trees and woody plants (dark green areas). In addition, they contain water bodies (outlined by a blue line), and cycle ways (dashed blue lines).
Figure 13 illustrates visually the potential of the enhanced data classification. The figure shows three scenarios of contributions: confirmation, correction, and ignorance. Figure 13a presents the confirmation scenario when the indicated entity is classified as park. The approach suggests park and grass as recommended classes. During the validation, a participant selected only the park class. Figure 13b shows the correction scenario when the given entity is classified as park and the approach recommends meadow and grass classes. During the validation, a participant classified it as a meadow. Figure 13c illustrates the ignorance scenario when the indicated entity is classified as grass. The approach recommends garden and grass classes. However, a participant decided to classify it as meadow, which was an inappropriate choice.
In the first scenario, the given entity has leisure characteristics and the participant followed our recommendations and confirmed its classification as park. The entity in the second scenario contains no other features, is located within a forest area, and has a name “Gerlach-Wiese”, where wiese (German) = meadow (English); it was classified as park, but a participant followed our recommendations and updated it to meadow. In the third scenario, the entity is surrounded by buildings and has a higher probability of being a garden, according to our recommendations. However, the participant classified it as meadow, which was an inappropriate class. The last scenario does not enhance the data classification, but it reflects individual perceptions. This scenario could also happen when our recommendations are wrong or do not reflect reality. In such cases, multiple validations could be the proper solution.

6.4. Participant Feedback

Participants were allowed to contact us giving their comments and feedback either by e-mail or by commenting on our posts. We received both positive and negative feedback as well. Regarding the positive feedback, participants showed respect and encouraged us by different statements like: “Great service, plans to expand?”, “If you plan to include Belgium, you’ll see very strange stuff”, “Just perfect. thank you”, “It’s a good subject indeed!”, etc. On the contrary some people sent us negative or improvement feedback like: “Your questions will produce a very strong response bias”, “referring to Wikipedia and definitions from the dictionaries is completely wrong since OSM does not use natural language to describe objects”, “To be able to use this tool correctly, there should be clear consensus on exact meaning”, etc. We thank all the participants for their contributions and feedback. The entire feedback will be considered to extend the application.

7. Discussion

In the past, mapping was an exclusive task of cartographers and well-trained individuals. Nevertheless, the errors and the accuracy of maps was an issue of concern even in professional production. In reality, there is no accurate map due to geographic data ambiguity and temporal developments of data [72,73,74]. With the availability of new technologies, VGI has become a potential source of geographic data. In particular, VGI facilitates the mapping process when the public takes part in the process of data collection. However, in VGI, other factors influence the resulting data accuracy such as: the heterogeneous characteristics of the participants, the lack of expertise, and the flexible contribution mechanisms. In particular, most VGI sources have inherent issues such as problematic data classification that is either inconsistent or incomplete.To provide reliable services requires data of guaranteed quality. The concept of Volunteered Geographic Services (VGS) has been introduced in [75]. However, there still exists a need for reliable data sources [76].
VGI is based on the power of crowdsourcing. From our perspective, in order to exploit the crowd to provide valuable information, participants should be guided and/or well educated regarding the required data quality. Thus, we proposed the rule-guided classification approach in [16,17]. The approach aims to fill the gap between the need for flexible contribution mechanisms, the uncertainty of spatial data, and the various participant perceptions. With the increase in the evolution of VGI sources, machine learning, particularly data mining, can play a vital role in ensuring data quality. In our approach, we applied data mining mechanisms to develop a classifier that can distinguish between similar classes. Afterwards, the developed classifier is utilized to guide the participants towards more accurate classification.
To enhance the data quality, the use of crowdsourcing is one possibility that has been previously encouraged as one dimension to ensure data quality [13]. In this paper, we encourage exploiting the crowds but in a guided manner. In crowdsourcing, participants are willing to contribute. However, they generally do not care about the target goal. For example, we tracked the participant interactions during their contribution in Grass&Green to find out whether they carefully investigated the provided descriptions or not. We found out that only 80 out of the 212 participants checked the given descriptions in the "Guide" menu. The same situation occurs in the OSM project where most of the participants contribute without spending enough time to read the provided suggestions and recommendations on the OSM Wiki pages.
The application presented in this paper shows the feasibility of the proposed approach. In addition, it encourages the development of customized applications for a particular geographic feature. For example, regarding the OSM project, several applications and services have been developed to check and enhance road networks in various locations. Consequently, OSM provides more reliable and precise information about roads than authoritative data sources in some locations. In Grass&Green, we developed a simple application to verify our approach. The few perceived drawbacks could be tackled by intelligent modules. Developing intuitive and interactive interfaces for VGI-based mapping projects would be one possibility to overcome the classification challenges. For example, by negotiation or by exemplification, an intelligent interface might be able to drive the participants towards more precise and finer classification.
From a cognitive perspective, understanding human perception of geographic features is required, because they are the engine of VGI mapping projects. The diversity of participants’ cultures and interests have dual functionality: enriching the data source and ensuring the data quality. In Grass&Green, we coped with participants’ diversities by focusing on the concepts and investigating the qualitative representation of the classes. Thus, we utilized classes, definitions, and descriptions from Wikipedia and dictionaries. Cognitive acquisition techniques and adequate data representation are also required to encourage participants to produce more accurate data. Moreover, the classification problems could be tackled by employing geo-spatial ontology. The need for geo-spatial ontology has been previously discussed for better understanding of space and building more efficient GIS applications [77].
The developed approach is grounded in strong foundations, and thus it can be configured to other geographic features and other locations as well. First, the approach is based on the topological investigation of target features with respect to their context. Therefore, it can be applied to any other areal geographic features (e.g., water body features). Second, the approach is built upon the assumption of localized classification. Thus, within a particular country the approach may be used to enrich the data classification in non-urban areas, after learning from the data of urban areas, if the latter are available. In contrast, the approach has some limitations as well. Firstly, the classifier is dependent on the availability of large amounts of data in order to extract reliable knowledge. Secondly, learning from data with problematic quality may trigger uncertainty in the developed classifier, and hence, a careful investigation of the utilized training data quality is needed.

8. Conclusions

VGI can act as a complementary data source for authoritative data and a significant element in a geo-spatial data infrastructure. Nevertheless, heterogeneous data quality limits the utility of this promising resource. In particular, this research tackles the problematic classification of VGI, where the data classification depends on individual preferences and perceptions. In a previous work, we developed the rule-guided classification approach that exploits machine learning mechanisms to handle the classification challenges in VGI projects. The approach utilizes the data availability to learn the distinct characteristics that can help to distinguish between similar classes. The learned characteristics were used afterwards to develop a classifier, which was able to distinguish between similar classes. The classifier is developed to guide the participants towards the most appropriate classification.
As a validation of the approach, we developed a web-based application called Grass&Green. The application addresses the overlapping classes of some grass-related entities. For a given data set, the application applied the rule-guided classification and presented the recommended classes for public validations. The findings indicate the feasibility of the proposed approach and the success of the application as well. Using simple announcement methods, we attracted the attention of 212 participants from more than 35 different cultural backgrounds. About 89% of the contributions agree with our recommendations. Analyzing the contributions shows a potential enhancement of data classification. Participant feedback has encouraged the application of our approach to other data sets. The results stimulate the development of more customized applications to ensure the classification quality of a particular feature. In future works, we intend to design cognitive and interactive data acquisition mechanisms. In addition, we would like to exploit the nature of VGI and the participants in order to develop more intuitive data interpretation.

Acknowledgments

This article is based upon work from COST Action IC1203 ENERGIC (www.vgibox.eu), supported by COST (European Cooperation in Science and Technology). We gratefully acknowledge the German Academic Exchange Service (DAAD) and the host research group at the Bremen Spatial Cognition Center (BSCC). Moreover, we would like to thank the CapacityLab at the University of Bremen for facilitating a student internship for the second author. Thanks to all the participants for their contributions and feedback to the developed application.

Author Contributions

Ahmed Loai Ali developed the approach and the concept of guided classification, wrote the manuscript, and provided the support material and technical instructions for Nuttha Sirilertworakul. Nuttha Sirilertworakul was mainly responsible for implementing the application and revising the manuscript. Alexander Zipf and Amin Mobasheri contributed to discussing the results and providing a proof-reading that substantially improved the manuscript.

Conflicts of Interest

The authors declare no conflict of interest.

References

  1. Goodchild, M.F. Citizens as sensors: The world of volunteered geography. GeoJournal 2007, 69, 211–221. [Google Scholar] [CrossRef]
  2. Gouveia, C.; Fonseca, A. New approaches to environmental monitoring: The use of ICT to explore volunteered geographic information. GeoJournal 2008, 72, 185–197. [Google Scholar] [CrossRef]
  3. Mooney, P.; Corcoran, P. Can Volunteered Geographic Information be a participant in eEnvironment and SDI? In Environmental Software Systems. Frameworks of eEnvironment; Springer: Berlin, Germany, 2011; pp. 115–122. [Google Scholar]
  4. Roche, S.; Propeck-Zimmermann, E.; Mericskay, B. GeoWeb and crisis management: Issues and perspectives of volunteered geographic information. GeoJournal 2013, 78, 21–40. [Google Scholar] [CrossRef]
  5. Zook, M.; Graham, M.; Shelton, T.; Gorman, S. Volunteered Geographic Information and crowdsourcing disaster relief: A case study of the Haitian earthquake. World Med. Health Policy 2010, 2, 7–33. [Google Scholar] [CrossRef]
  6. Foth, M.; Bajracharya, B.; Brown, R.; Hearn, G. The second life of urban planning? Using NeoGeography tools for community engagement. J. Locat. Based Serv. 2009, 3, 97–117. [Google Scholar] [CrossRef] [Green Version]
  7. Mooney, P.; Sun, H.; Yan, L. VGI as a dynamically updated data source in location-based services in urban environments. In Proceedings of the 2nd International Workshop in Ubiquitous Crowdsourcing: UbiCrowd’11, Beijing, China, 17–21 September 2011.
  8. Haklay, M.; Weber, P. OpenStreetMap: User-generated street maps. IEEE Pervasive Computing 2008, 7, 12–18. [Google Scholar] [CrossRef]
  9. Savelyev, A.; Xu, S.; Janowicz, K.; Mülligann, C.; Thatcher, J.; Luo, W. Volunteered geographic services: Developing a linked data driven location-based service. In Proceedings of the 1st ACM SIGSPATIAL International Workshop on Spatial Semantics and Ontologies, Chicago, IL, USA, 1 November 2011; pp. 25–31.
  10. Elwood, S.; Goodchild, M.F.; Sui, D.Z. Researching Volunteered Geographic Information: Spatial data, geographic research, and new social practice. Ann. Assoc. Am. Geogr. 2012, 102, 571–590. [Google Scholar] [CrossRef]
  11. Ali, A.L.; Schmid, F. Data quality assurance for Volunteered Geographic Information. In Geographic Information Science; Springer: Vienna, Austria, 2014; pp. 126–141. [Google Scholar]
  12. Devillers, R.; Stein, A.; Bédard, Y.; Chrisman, N.; Fisher, P.; Shi, W. Thirty years of research on spatial data quality: achievements, failures, and opportunities. Trans. GIS 2010, 14, 387–400. [Google Scholar] [CrossRef]
  13. Goodchild, M.F.; Li, L. Assuring the quality of Volunteered Geographic Information. Spat. Stat. 2012, 1, 110–120. [Google Scholar] [CrossRef]
  14. Goodchild, M.F. Assertion and authority: The science of user-generated geographic content. In Proceedings of the Colloquium for Andrew U. Frank’s 60th Birthday, Vienna, Italy, 30 June–1 July 2008.
  15. Guptill, S.C.; Morrison, J.L. Elements of Spatial Data Quality; Elsevier: Amsterdam, The Netherlands, 2013. [Google Scholar]
  16. Ali, A.L.; Schmid, F.; Falomir, Z.; Freksa, C. Towards rule-guided classification for Volunteered Geographic Information. ISPRS Ann. Photogramm. Remote Sens. Spat. Inf. Sci. 2015, II-3/W5, 211–217. [Google Scholar] [CrossRef]
  17. Ali, A.L.; Falomir, Z.; Schmid, F.; Freksa, C. Rule-guided human classification of Volunteered Geographic Information. ISPRS J. Photogramm and Remote Sens. 2016, in press. [Google Scholar]
  18. OSM Users’ diaries. Available online: https://www.openstreetmap.org/diary (accessed on 24 May 2016).
  19. OSMstats. Available online: http://osmstats.neis-one.org/ (accessed on 24 May 2016).
  20. stensen, O.M.; Smits, P.C. ISO/TC211: Standardisation of geographic information and geo-informatics. In Proceedings of the 2002 IEEE International Geoscience and Remote Sensing Symposium, IGARSS’02, Toronto, ON, Canada, 24–28 June 2002; Volume 1, pp. 261–263.
  21. ISO/TC211. Available online: http://www.isotc211.org/ (accessed on 24 May 2016).
  22. Haklay, M. How good is Volunteered Geographic Information? A comparative study of OpenStreetMap and Ordnance Survey datasets. Environ. Plan. B Plan. Des. 2010, 37, 682–703. [Google Scholar] [CrossRef]
  23. Ludwig, I.; Voss, A.; Krause-Traudes, M. A comparison of the street networks of Navteq and OSM in Germany. In Advancing Geoinformation Science for a Changing World; Springer: Berlin, Gernany, 2011; pp. 65–84. [Google Scholar]
  24. Arsanjani, J.J.; Mooney, P.; Zipf, A.; Schauss, A. Quality assessment of the contributed land use information from OpenStreetMap versus authoritative datasets. In OpenStreetMap in GIScience; Springer: Berlin, Germany, 2015; pp. 37–58. [Google Scholar]
  25. Dorn, H.; Törnros, T.; Zipf, A. Quality evaluation of VGI using authoritative data—A comparison with land use data in southern Germany. ISPRS Int. J. Geo-Inf. 2015, 4, 1657–1671. [Google Scholar] [CrossRef]
  26. Vaz, E.; Jokar Arsanjani, J. Crowdsourced mapping of land use in urban dense environments: An assessment of Toronto. Can. Geogr. 2015. [Google Scholar] [CrossRef]
  27. Girres, J.F.; Touya, G. Quality assessment of the French OpenStreetMap dataset. Trans. GIS 2010, 14, 435–459. [Google Scholar] [CrossRef]
  28. Flanagin, A.J.; Metzger, M.J. The credibility of Volunteered Geographic Information. GeoJournal 2008, 72, 137–148. [Google Scholar] [CrossRef]
  29. Bishr, M.; Kuhn, W. Geospatial information bottom-up: A matter of trust and semantics. In The European Information Society; Springer: Berlin, Germany, 2007; pp. 365–387. [Google Scholar]
  30. Neis, P.; Zipf, A. Analyzing the contributor activity of a Volunteered Geographic Information project: The case of OpenStreetMap. ISPRS Int. J. Geo-Inf. 2012, 1, 146–165. [Google Scholar] [CrossRef]
  31. Neis, P.; Zielstra, D.; Zipf, A. The street network evolution of crowdsourced maps: OpenStreetMap in Germany 2007–2011. Future Internet 2011, 4, 1–21. [Google Scholar] [CrossRef]
  32. Keßler, C.; de Groot, R.T.A. Trust as a proxy measure for the quality of Volunteered Geographic Information in the case of OpenStreetMap. In Geographic Information Science at the Heart of Europe; Springer: Berlin, Germany, 2013; pp. 21–37. [Google Scholar]
  33. Keßler, C.; Trame, J.; Kauppinen, T. Tracking editing processes in Volunteered Geographic Information: The case of OpenStreetMap. In Proceedings of Workshop on Identifying Objects, Processes and Events in Spatio-Temporally Distributed Data (IOPE 2011), Belfast, ME, USA, 12–16 September 2016.
  34. D’Antonio, F.; Fogliaroni, P.; Kauppinen, T. VGI edit history reveals data trustworthiness and user reputation. In Proceedings of the 17th AGILE Conference on Geographic Information Science, Connecting a Digital Europe through Location and Place, Castellon, Spain, 3–6 June 2014.
  35. Neis, P.; Zielstra, D.; Zipf, A. Comparison of Volunteered Geographic Information data contributions and community development for selected world regions. Future Internet 2013, 5, 282–300. [Google Scholar] [CrossRef]
  36. Ballatore, A.; Zipf, A. A conceptual quality framework for Volunteered Geographic Information. In Proceedings of the 12th International Conference on Spatial Information Theory COSIT 2015, Santa Fe, NM, USA, 12–16 October 2015; pp. 89–107.
  37. Barron, C.; Neis, P.; Zipf, A. A comprehensive framework for intrinsic OpenStreetMap quality analysis. Trans. GIS 2014, 18, 877–895. [Google Scholar] [CrossRef]
  38. Hecht, B.; Stephens, M. A tale of cities: Urban biases in Volunteered Geographic Information. In Proceeding of the 8th International Conference on Weblogs and Social Media (ICWSM), Oxford, UK, 27–29 May 2014.
  39. Quattrone, G.; Mashhadi, A.; Capra, L. Mind the map: the impact of culture and economic affluence on crowd-mapping behaviours. In Proceedings of the 17th ACM Conference on Computer Supported Cooperative Work & Social Computing, Baltimore, MD, USA, 15–19 February 2014; pp. 934–944.
  40. Schmid, F.; Kutz, O.; Frommberger, L.; Kauppinen, T.; Cai, C. Intuitive and natural interfaces for geospatial data classification. In Proceedings of Workshop on Place-Related Knowledge Acquisition Research (P-KAR), Kloster Seeon, Germany, 31 August 2012.
  41. Schmid, F.; Frommberger, L.; Cai, C.; Dylla, F. Lowering the barrier: How the What-You-See-Is-What-You-Map paradigm enables people to contribute volunteered geographic information. In Proceedings of the 4th Annual Symposium on Computing for Development, Cape Town, South Africa, 6–7 December 2013; pp. 8–18.
  42. Pourabdollah, A.; Morley, J.; Feldman, S.; Jackson, M. Towards an authoritative OpenStreetMap: Conflating OSM and OS OpenData national maps’ road network. ISPRS Int. J. Geo-Inf. 2013, 2, 704–728. [Google Scholar] [CrossRef]
  43. Vandecasteele, A.; Devillers, R. Improving Volunteered Geographic Data quality using semantic similarity measurements. ISPRS-Int. Arch. Photogramm. Remote Sens. Spat. Inf. Sci. 2013, 1, 143–148. [Google Scholar] [CrossRef]
  44. Ali, A.L.; Schmid, F.; Al-Salman, R.; Kauppinen, T. Ambiguity and plausibility: Managing classification quality in Volunteered Geographic Information. In Proceedings of the 22nd ACM SIGSPATIAL International Conference on Advances in Geographic Information Systems, Dallas, TX, USA, 4–7 November 2014; pp. 143–152.
  45. Yanenko, O.; Schlieder, C. Game principles for enhancing the quality of user-generated data collections. In Proceedings of the AGILE, Workshop Geogames Geoplay, Castellon, Spain, 3–6 June 2014; pp. 1–5.
  46. Karagiannakis, N.; Giannopoulos, G.; Skoutas, D.; Athanasiou, S. OSMRec tool for automatic recommendation of categories on spatial entities in OpenStreetMap. In Proceedings of the 9th ACM Conference on Recommender Systems, Vienna, Austria, 16–20 September 2015; pp. 337–338.
  47. OSMRecPlugin. Available online: https://github.com/GeoKnow/OSMRec (accessed on 24 May 2016).
  48. OSM Inspector. Available online: http://tools.geofabrik.de/osmi/ (accessed on 24 May 2016).
  49. Keep Right. Available online: http://keepright.ipax.at/ (accessed on 24 May 2016).
  50. Map Roulette. Available online: http://maproulette.org/ (accessed on 24 May 2016).
  51. Map Dust. Available online: http://www.mapdust.com/ (accessed on 24 May 2016).
  52. NOVAM. Available online: http://b3e.net/novam/ (accessed on 24 May 2016).
  53. Fisher, P.F. Models of uncertainty in spatial data. Geograph. Inf. Syst. 1999, 1, 191–205. [Google Scholar]
  54. Sparks, K.; Klippel, A.; Wallgrün, J.O.; Mark, D. Citizen science land cover classification based on ground and aerial imagery. In Spatial Information Theory; Springer: Berlin, Germany, 2015; pp. 289–305. [Google Scholar]
  55. Klippel, A.; Sparks, K.; Wallgrün, J.O. Pitfalls and potentials of crowd science: A meta-analysis of contextual influences. ISPRS Ann. Photogramm. Remote Sens. Spat. Inf. Sci. 2015, II-3/W5, 325–331. [Google Scholar] [CrossRef]
  56. Foody, G.; See, L.; Fritz, S.; Van der Velde, M.; Perger, C.; Schill, C.; Boyd, D.; Comber, A. Accurate attribute mapping from volunteered geographic information: issues of volunteer quantity and quality. Cartogr. J. 2014, 52, 1–9. [Google Scholar] [CrossRef]
  57. Fritz, S.; McCallum, I.; Schill, C.; Perger, C.; See, L.; Schepaschenko, D.; Van der Velde, M.; Kraxner, F.; Obersteiner, M. Geo-Wiki: An online platform for improving global land cover. Environ. Model. Softw. 2012, 31, 110–123. [Google Scholar] [CrossRef]
  58. Mooney, P.; Corcoran, P. The annotation process in OpenStreetMap. Trans. GIS 2012, 16, 561–579. [Google Scholar] [CrossRef]
  59. Ballatore, A.; Bertolotto, M.; Wilson, D.C. Geographic knowledge extraction and semantic similarity in OpenStreetMap. Knowl. Inf. Syst. 2013, 37, 61–81. [Google Scholar] [CrossRef]
  60. Baglatzi, A.; Kokla, M.; Kavouras, M. Semantifying OpenStreetMap. In Proceedings of the 5th International Terra Cognita Workshop, Boston, MA, USA, 12 November 2012; pp. 39–50.
  61. Comber, A.J.; Fisher, P.; Harvey, F.; Gahegan, M.; Wadsworth, R. Using metadata to link uncertainty and data quality assessments. In Proceedings of the 12th International Symposium on Spatial Data Handling, Vienna, Austria, 12–14 July 2006; pp. 279–292.
  62. Grira, J.; Bédard, Y.; Roche, S. Spatial data uncertainty in the VGI world: Going from consumer to producer. Geomatica 2010, 64, 61–72. [Google Scholar]
  63. Egenhofer, M.J.; Al-Taha, K.K. Reasoning about Gradual Changes of Topological Relationships. In Proceedings of International Conference GIS—From Space to Territory: Theories and Methods of Spatio-Temporal Reasoning, Pisa, Italy, 21–23 September 1992; pp. 196–219.
  64. Thabtah, F. A review of associative classification mining. Knowl. Eng. Rev. 2007, 22, 37–65. [Google Scholar] [CrossRef]
  65. Ubuntu Server. Available online: http://www.ubuntu.com/server (accessed on 24 May 2016).
  66. OpenScienceMap. Available online: http://www.opensciencemap.org/ (accessed on 24 May 2016).
  67. Wordnet. Available online: https://wordnet.princeton.edu/ (accessed on 24 May 2016).
  68. Leaflet. Available online: http://leafletjs.com/ (accessed on 1 June 2016).
  69. Bootstrap. Available online: http://getbootstrap.com/ (accessed on 1 June 2016).
  70. JQuery. Available online: https://jquery.com/ (accessed on 1 June 2016).
  71. OAuth. Available online: http://oauth.net/ (accessed on 1 June 2016).
  72. Crone, G.R. Maps and Their Makers: An Introduction to the History of Cartography; Hutchinson’s University Library: London, UK, 1966. [Google Scholar]
  73. Goodchild, M.F.; Gopal, S. The Accuracy of Spatial Databases; CRC Press: Boca Raton, FL, USA, 1989. [Google Scholar]
  74. Goodchild, M.F. Data Models and Data Quality: Problems and Prospects. Available online: http://www.geog.ucsb.edu/ good/papers/192.pdf (accessed on 1 June 2016).
  75. Thatcher, J. From Volunteered Geographic Information to Volunteered Geographic Services. In Crowdsourcing Geographic Knowledge; Springer: Berlin, Germany, 2013; pp. 161–173. [Google Scholar]
  76. Parker, C.J.; May, A.; Mitchell, V.; Burrows, A. Capturing volunteered information for inclusive service design: potential benefits and challenges. Des. J. 2013, 16, 197–218. [Google Scholar] [CrossRef] [Green Version]
  77. Frank, A.U. Spatial ontology: A geographical information point of view. In Spatial and Temporal Reasoning; Springer: Berlin, Germany, 1997; pp. 135–153. [Google Scholar]
Figure 1. An example of problematic classification in the OSM project: the highlighted entity is classified as pitch, school, and beach, while it is actually a beach volleyball playground in a school.
Ijgi 05 00087 g001
Figure 2. Conceptual overlapping classes due to the given descriptions in the OSM Wiki. Examples of (a) overlapping grass-related classes, (b) overlapping water-related classes.
Ijgi 05 00087 g002
Figure 3. Conceptual structure of the rule-guided classification approach.
Ijgi 05 00087 g003
Figure 4. Application instructions and the OSM user login options.
Ijgi 05 00087 g004
Figure 5. Textual and visual descriptions of target classes.
Ijgi 05 00087 g005
Figure 6. Validation interface for the presented entities.
Ijgi 05 00087 g006
Figure 7. The Grass&Green application structure.
Ijgi 05 00087 g007
Figure 8. Participant and contribution patterns with respect to the participant geographic origins. (a) The distribution of participant geo-origins, (b) Contributions relative to participant geo-origins.
Ijgi 05 00087 g008
Figure 9. Participants and contributions relative to participant experience. (a) Distribution of participants and contributions per group, (b) Participant concerns per group.
Ijgi 05 00087 g009
Figure 10. Numbers of participants per day relative to the announcement methods.
Ijgi 05 00087 g010
Figure 11. Participant agreement with the recommended classes.
Ijgi 05 00087 g011
Figure 12. Visual illustrations of entities that plausibly belong to conceptual overlapping classes. The given entities (outlined by black lines) are validated by the participants. (a) An entity is validated to be classified as park/meadow, (b) An entity is validated to be classified as park/forest, (c) An entity is validated to be classified as park/forest.
Ijgi 05 00087 g012
Figure 13. Visual investigation of participant contributions compared to the provided recommendations by our approach and the resulting enhanced data classification. (a) A participant followed our recommendation and confirmed the entity classification as park, (b) A participant followed our recommendation and corrected the entity classification from park to meadow, (c) A participant ignored our recommended garden class, and misclassified the entity as meadow.
Ijgi 05 00087 g013
Table 1. Mapping between OSM tags and some of grass-related and water-related overlapping classes.
OSM TagClassOSM TagClass
landuse = grass
or landcover = grass
grassnatural = wood
or wood = yes
wood
leisure = parkparknatural = waterwater
leisure = gardengardennatural = water
water = lake
lake
landuse = recreation groundrecreationnatural = water
water = pond
pond
landuse = meadowmeadownatural = water
water = reflecting_pool
reflecting pool
natural = scrubscrubnatural = water
water = reservoir
reservoir
natural = grasslandgrasslandnatural = water
water = wastewater
waste water
natural = heathheathnatural = wetland
wetland = swamp
swamp
landuse = forestforestnatural = wetland
wetland = marsh
marsh
Table 2. Entities classified before and after the validation with respect to the recommended classes and participant opinions.
Entities/Class Before ValidationParticipants’ ResponsePrevious Class in RecommendationPrevious Class Not in RecommendationAcceptance Percentage
412 entities
(garden)
yes/maybe2611175.9%
no8852
1,136 entities
(grass)
yes/maybe9422489.2%
no9872
731 entities
(park)
yes/maybe4264185.2%
no67197
Total
2279 entities
85.5%
Table 3. Classes with respect to recommendations and participant responses after the validation.
ClassesIn Recommended ClassesParticipants Response
yes/maybeno
forest748184564
garden753443310
grass1,9701,605365
park747542205
meadow340106234

