Abstract
City/regional authorities are responsible for designing and structuring the urban morphology based on the desired land use activities. One of the key concerns regarding urban planning is to establish certain development goals, such as the real gross domestic product (GDP). In Canada, the gross national income (GNI) mainly relies on the mining and manufacturing industries. In order to estimate the impact of city development, this study aims to utilize remote sensing and Geographic Information System (GIS) techniques to assess the relationship between the built-up area and the reported real GDP of seven major cities in Canada. The objectives of the study are: (1) to investigate the use of regression analysis between the built-up area derived from Landsat images and the industrial area extracted from Geographic Information System (GIS) data; and (2) to study the relationship between the built-up area and the socio-economic data (i.e., real GDP, total population and total employment). The experimental data include 42 multi-temporal Landsat TM images and 42 land use GIS vector datasets obtained from year 2005 to 2010 during the summer season (June, July and August) for seven major cities in Canada. The socio-economic data, including the real GDP, the total population and the total employment, are obtained from the Metropolitan Housing Outlook during the same period. Both the Normalized Difference Built-up Index (NDBI) and Normalized Difference Vegetation Index (NDVI) were used to determine the built-up areas. Those high built-up values within the industrial areas were acquired for further analysis. Finally, regression analysis was conducted between the real GDP, the total population, and the total employment with respect to the built-up area. Preliminary findings showed a strong linear relationship (R2= 0.82) between the percentage of built-up area and industrial area within the corresponding city. In addition, a strong linear relationship (R2= 0.8) was found between the built-up area and socio-economic data. Therefore, the study justifies the use of remote sensing and GIS data to model the socio-economic data (i.e., real GDP, total population and total employment). The research findings can contribute to the federal/municipal authorities and act as a generic indicator for targeting a specific real GDP with respect to industrial areas.
Keywords:
remote sensing; multi-temporal images; Landsat images; built-up area; NDBI; NDVI; land use; GIS; industrial area; real GDP 1. Introduction
Satellite remote sensors acquire images of the Earth’s surface by recording the reflected energy from objects on the ground. Thus, remote sensing data can be used to retrieve semantic information of the Earth surface instead of geometric measurements only. Remote sensing image classification techniques have been used to aid in identifying the land use/land cover areas [1,2]. Land use/land cover features include, without limitation: residential, commercial and industrial, water, vegetation cover and wetland [3]. Applications of remote sensing, particularly in socio-economic studies, aim to map the spatial extent [4], urban populations [5], intra-urban population density [6,7] and economic activities [8]. These data can provide valuable information for the municipal authorities and researchers to aid in urban planning and city management. Real GDP usually serves as an index of the annual production on a country/city’s final goods and service. In Canada, the gross national income (GNI) mainly depends on the mining and manufacturing industries and services [9]. Canada is one of the top mining countries, as well as one of the largest producers of minerals and metals. The mining industry contributed 21% of the total value of Canadian goods’ exports in 2010, where 28.6% of the industrial sector contributes to the total real GDP in Canada [10]. With respect to the mature development of remote sensing techniques, there emerge several studies using remote sensing data to model the real GDP at a national scale.
Sutton et al. [11] demonstrated a case study to determine the relationships between observed changes in night-time satellite images derived from the Defense Meteorological Satellite Program’s Operational Linescan System (DMSP-OLS) and the changes in total population and real GDP in four nations (India, China, Turkey and the United States). Two approaches were used in their research work to model that relationship. First, the 1992 to 1993 and 2000 DMSP OLS night-time images were used to measure the economic activity within each nation based on the extended light areas. Second, the extended light areas were used to study the relationship with the total population to compute the real GDP, where the state level lights were used to model the relationship with the state level real GDP values based on a linear regression model. However, Sutton et al. [11] illustrated that the proposed method is not preferable to measure the real GDP for the developed countries. That is mainly because the night-time image somehow depicts the population density, where the developed countries’ GDP may not have a very strong linear relationship with the population density. The results found a strong to moderate positive linear relationship (regression) in this case study (R2= 0.96 for China, 0.84 for India, 0.95 for Turkey and 0.72 for the United States) and demonstrated a good opportunity to use the remote sensing technique as a tool to map economic activity at national and sub-national levels.
Ma and Xu (2010) conducted a research study in the City of Guangzhou, China [12]. The main goal of the case study was: (1) to detect the urban expansion of the built-up area of the City of Guangzhou in a period of 23 years lasting from 1979 to 2002; (2) to model its urban expansion; (3) to correlate the built-up area of the City of Guangzhou with the real GDP, total population, urban resident income and urban traffic of the city. The supervised image classification technique (maximum likelihood algorithm) was used to classify the image data and extract the built-up areas. Urban expansion was evaluated by analysing the dynamic change of land use. The results showed that the City of Guangzhou extended about 4.5-times from year 1979 to 2002. That gives an indication that the City of Guangzhou expands about 14.2 km2 on average every year. An optimized trinomial equation was applied to determine the correlation between the built-up areas and socio-economic parameters. The correlation coefficient between the built-up urban area and the total population was found to be about 0.97 within the city. A value of the correlation coefficient of 0.98 was determined between the per capita GDP and the per capita residence area for urban residents in the city [12].
Ghosh et al. [13] developed a new tool named the Information and Communication Technology Development Index (IDI) to assess the GDP per capita of different countries of the World. The main goal of the study is to use IDI to measure the development of countries as information societies. The IDI was created by using 11 indicators from information and communication technology (ICT) use, access and skills. The ICT index included three usage indicators (Internet users, fixed broadband and mobile broadband). There are five access indicators, which include in the access index (fixed telephony, mobile telephony, international internet bandwidth, households with computers and households with Internet). The skills index is a very important input for the IDI, because it represents the education within the country. Three indicators (adult literacy, gross secondary and tertiary enrollment) were proposed to represent the skills index in the ICT. Night-time imagery of 2006 was combined with a LandScan population grid of 2006 to measure the human activity within different countries. The LandScan population grid is a method that can be used to determine the total population and the percentage of the total economic activity of the countries. The 2008 World Development Indicators Report provided the per capita GDP record for different countries of the World, where the International Telecommunication Union (ITU) calculated the IDI for the 159 countries. First, the human activity map, which was derived from DMSP-OLS night-time imagery and LandScan, was used to assess the per capita GDP. Second, the per capita GDP map, which was derived from DMSP-OLS night-time imagery and LandScan, were correlated with per capita GDP records obtained from the 2008 World Development Indicators report. The results showed that the relationship reached up to 0.9 R2 in terms of the regression coefficient. Finally, a second order polynomial regression was used to assess the relationship between the estimated per capita GDP and IDI values, and the results showed about a 0.89 coefficient of regression. The authors demonstrated that remote sensing light images collected at night-time and the LandScan population grid can be used to represent IDI maps and per capita GPD values at finer resolutions [13].
Yue et al. [14] proposed another approach in Zhejiang Province located in the southeast China for real GDP estimation. The main objectives of the study is: (1) to propose a low-cost and accurate approach for real GDP estimation by using a diversity source of remote sensing data; and (2) to provide an important database for the government for future developmental strategies. The real GDP was estimated by combining the Defense Meteorological Satellite Program Operational Linescan System (DMSP/OLS) night-time imagery, Global MODIS vegetation indices (MODIS EVI), at a resolution of 250 m, and land cover data for 2009. An accurate Human Settlement Index (HSI) was derived by integrating night-time imagery (DMSP/OLS) with the MODIS EVI data in order to estimate the real GDP of secondary and tertiary industries. The land cover data were used to provide the agricultural productivity, such as farming, forestry, stockbreeding and fishery. The land cover data were then used to estimate the real GDP of the primary industries using a threshold mechanism. The brightness values of the night-time imagery (DMSP/OLS) were correlated with the real GDP of secondary and tertiary industries in Zhejiang Province, and the results yielded a correlation coefficient of 0.97. It was found that primary industries, which mainly consist of farming, forestry, stockbreeding and fishery, are hard to detect using DMSP/OLS night-time imagery. That is mainly due to the primary industries only representing 5% of the total real GDP and the coarse resolution of the image.
Despite the above successful attempts, the majority of the studies utilized satellite images collected at night-time that are not always available, since the night-time images are only accessible for National Geophysical Data Centre (NGDC) of National Oceanic and Atmospheric Administration (NOAA) members. The night-time images have low spatial resolution (1 km2) with respect to the Landsat images, and the night-time imagery (DMSP/OLS) may not be the best option for the estimation of total population and urban areas [15]. In addition, the above-mentioned studies either focused on the national scale or a specific city. In this research work, the authors aim to utilize remote sensing and GIS techniques to assess the relationship between the built-up area and the reported real GDP in seven major cities in Canada. Instead of using the night-time light images, we employed the multi-temporal Landsat TM satellite images, which are free to the public and have a short revisit time [16]. As the real GDP of Canada is mainly made up of mining and manufacturing services, thus we place an emphasis on the built-up land with industrial use and compare the remote sensing-derived built-up index with respect to the corresponding real GDP of these seven major cities from 2005 to 2010.
2. Datasets and Methods
2.1. Datasets
Seven major cities in Canada, i.e., Toronto, Ottawa, Montreal, Québec City, Edmonton, Calgary and Vancouver, were selected in this study due to the data availability and their real GDP differences. The datasets used in this study included three categories of data: (1) Landsat TM satellite images; (2) land use GIS data; and (3) socio-economic data, including real GDP, total population and total employment. Since the land-use GIS data are not available after year 2010, therefore, all of the data were collected from the year 2005 to 2010.
A total of 42 Landsat TM Images were downloaded from the USGS Earth Explorer [17]. The spatial resolution of the Landsat images is 30 m for the multi-spectral bands and 60 m for the thermal band. All of these images were imported into PCI Geomatics V10.1, an image processing software, clipped and then projected into the UTM coordinate system. Atmospheric correction was conducted with the consideration of the sensor parameters data (sensor type, acquisition date, Sun elevation, Sun zenith and pixel size) and weather conditions (air temperature and visibility). These corrected images were subsequently used to compute the Normalized Difference Vegetation Index (NDVI) and Normalized Difference Building Index (NDBI), as described in Section 2.2. We intentionally ignored those data acquired from November to March due to the appearance of clouds and snow cover, which could affect the experimental results.
A total of 42 land use GIS layer data was acquired from the Scholars GeoPortal [18] from 2005 to 2010. These land use layers were imported into the ArcGIS environment for further analysis. Similar to the remote sensing data, all of the data were projected to the corresponding UTM coordinate system. Socio-economic data are provided by the Metropolitan Housing Outlook [9] for more than 25 years. The Metropolitan Housing Outlook measures and records the socio-economic parameters, such as the real GDP, total employment and total population, for the major cities in Canada. Table 1 summarizes the data sources used in this study.

Table 1.
The data sources used in this study.
2.2. Methodology
Figure 1 shows the overall workflow for this research work, which can be summarized in the following steps. All images were clipped to the study area in each city to speed up the data processing. All image subsets were projected into the UTM coordinate system. Then, atmospheric corrections were carried out on all of the multi-temporal Landsat images.
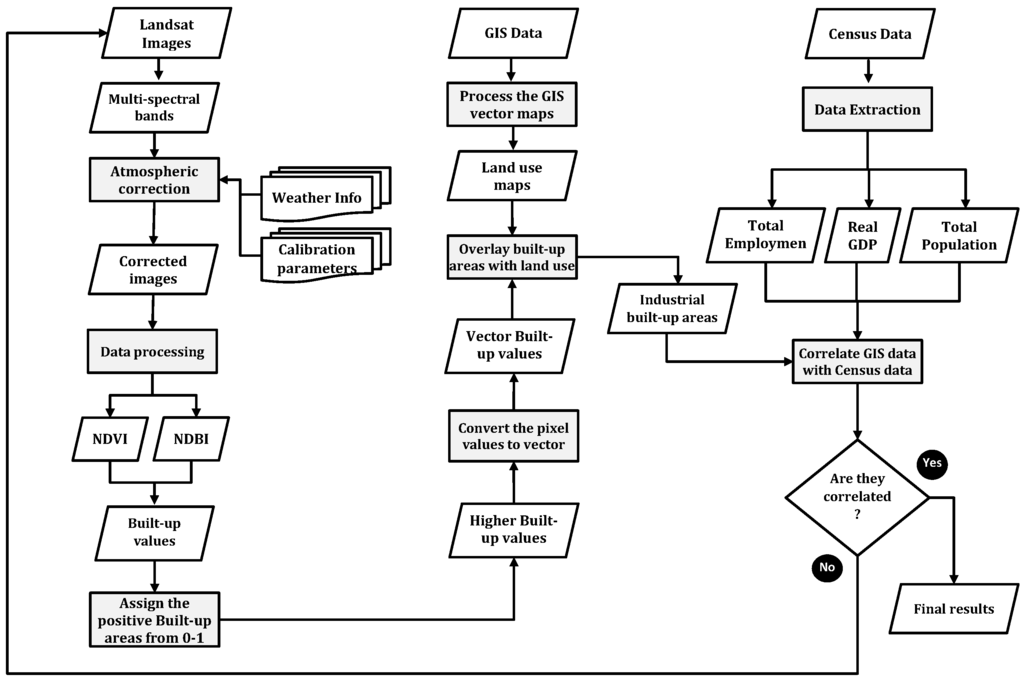
Figure 1.
The overall workflow.
The atmospheric correction model (ATCOR2) developed by Richter [19] was utilized to remove the effects that change the spectral characteristics of the land features [20]. To implement the ATCOR2 model, weather information (e.g., air temperature, visibility) were obtained from the Canadian national climate and weather data archive. The calibration parameters for Landsat TM sensor (biases and gains) were also used for atmospheric correction. These calibration parameters are very crucial in the process of atmospheric correction because they provide the bias and gain values in order to convert the image’s digital number to radiance and subsequently convert the radiance to top of atmosphere reflectance [21]. After conducting the atmospheric correction, the bio-physical parameters were derived from the Landsat images. Bands 3, 4 and 5 of the Landsat multi-spectral image were used to determine the bio-physical parameters, NDVI and NDBI, of the study area in order to extract the built-up areas on the images.
Regarding how the built-up area being derived, Zha et al. [22] proposed a method to map the urban land (or impervious surface) in the City of Nanjing, China, by using the Landsat TM image due to its high temporal and spectral resolution with respect to other sensors. The cloud-free Landsat TM images were used to derive the NDBI, which represents the built-up regions in the study area. Since some of the vegetation areas were found to be assigned into the built-up category due to the surrounding environments of the vegetation, for that reason, NDVI was calculated to illustrate the vegetation cover in the City of Nanjing. Subsequently, the adjusted built-up areas were derived using arithmetic manipulation between NDBI and NDVI, and only those positive values were classified as built-up areas. Finally, a median filter with a kernel size of 5 pixels by 5 pixels was used to enhance the appearance of the final built-up image. The filtered built-up image was converted to vector data to validate the results using the original colour composite image. It was found that the proposed method yielded an accuracy of 92.6%, which could lead to it being able to be used to map urban areas better than using only NDBI [22,23,24]. Therefore, in this study, we followed the proposed method by Zha et al. [22] to derive the built-up area. First, the NDBI values (ranging from −1 to 1) are calculated using Equation (1):
where is the mid-infrared Band 5 of the Landsat TM image and is the near infrared Band 4 of Landsat TM image. The NDVI values (ranging from −1 to 1) refer to an index that is able to monitor the vegetation activity and its annual changes, which can be are calculated using the following equation [22]:
where is the near infrared Band 4 in Landsat image and is the red Band 3 in the Landsat image. Finally, the built-up areas are defined by subtracting the NDBI layer from the NDVI layer using the following equation of Zha et al. [22]:
The same concept as in Zha et al. [22] is considered, where the positive values obtained from Equation (3) represent built-up areas, or otherwise, they refer to non-built-up areas. After that, only those built-up pixels with high positive values were used. Higher positive built-up pixel values were identified based on the histogram of the built-up image. The mean of the histogram of the built-up image was used as a threshold to identify those high values [25]. These selected positive built-up pixel values were then converted into polygon shapefile layers for further analysis in ArcGIS. The following Figure 2 shows a pictogram to demonstrate how the built-up area is derived.
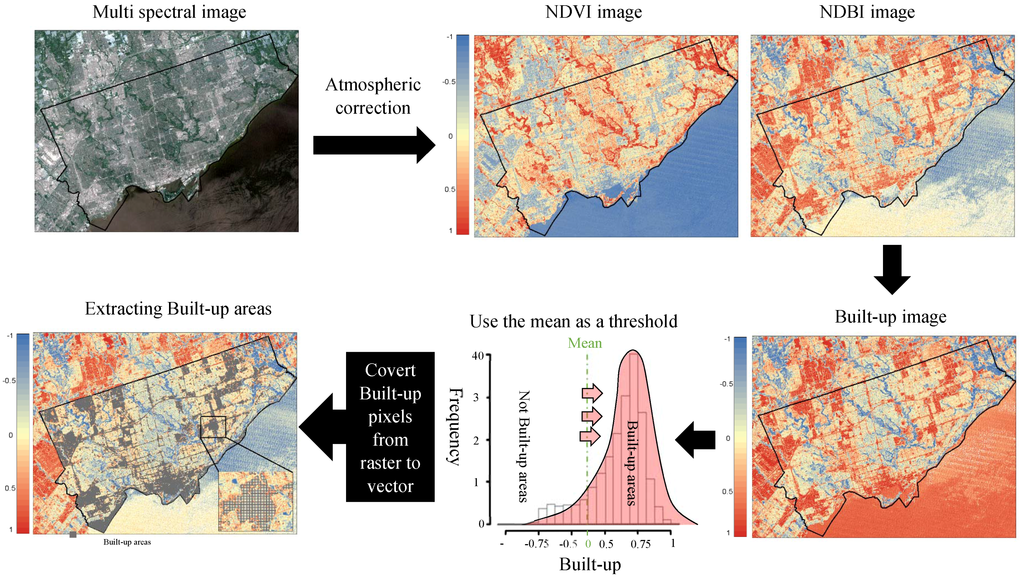
Figure 2.
A pictogram to demonstrate how the built-up area is derived.
The land use GIS data were used to extract the industrial, commercial and residential areas, and they are used to correlate the Landsat-derived built-up area. All of the GIS data were clipped to the study area in each city to improve the performance of data processing. The built-up pixels were overlapped with the land use maps to calculate the percentage of built-up pixels overlaid on each of the land use areas (industrial, commercial and residential). Figure 3 shows an example of the City of Montreal for the built-up image extracted from the Landsat image on the left side of the figure and the land use map extracted from the GIS data on the right side of the figure. The red colour in the built-up image represents the higher built-up values, which reflect buildings or impervious surfaces in the City. The blue colour represents a low built-up value, which also covers some of the vegetation or any green area within the image. Figure 4 shows the built-up pixels that were extracted and overlapped with the land use map for the City of Montreal.
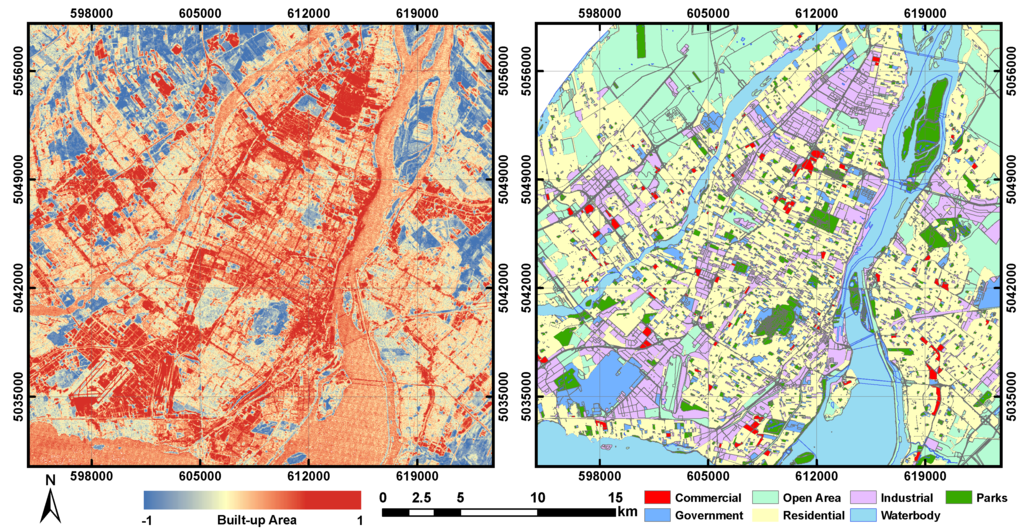
Figure 3.
Landsat derived built-up image (left) and land use map (right) for the City of Montreal.
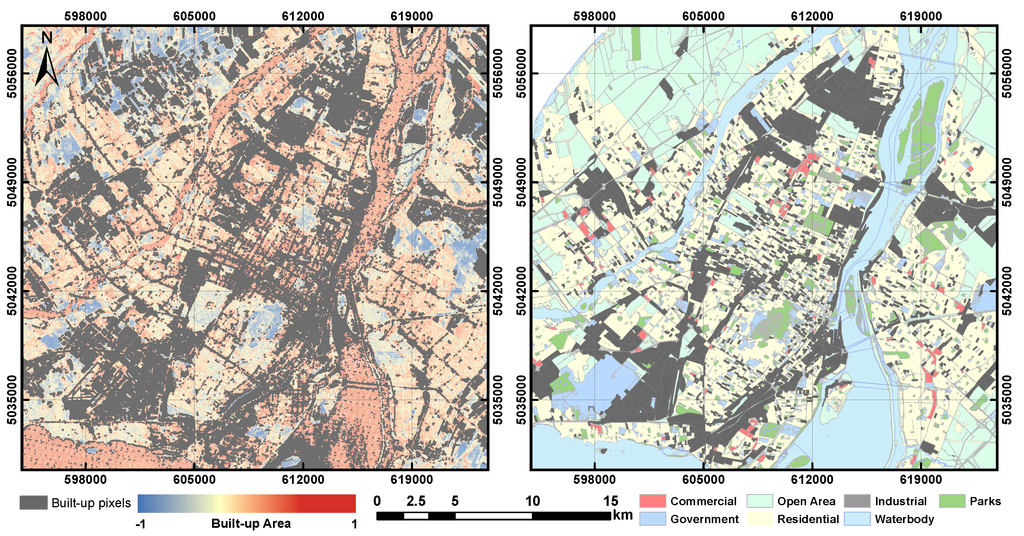
Figure 4.
An illustration of the built-up pixels overlaid on the land use map.
Finally, the social-economic data obtained from the Metropolitan Housing Outlook [9], including the real GDP, the total employment and the total population for the seven cities, were plotted and analysed in the GIS platform. Finally, the built-up areas extracted from the Landsat images were correlated with the three socio-economic parameters in order to reveal their relationships. The linear regression analysis was used to depict the relationship between any two parameters, and in this study, we used the R2, i.e., the coefficient of determination, as an indicator to reveal the relationship between any of these two parameters. A confidence interval of 95% was used throughout the linear regression analysis.
3. Results and Discussion
3.1. Built-Up Areas
In this section, an analysis was first conducted to reveal the relationship between the Landsat-derived built-up areas and the underneath land cover zones. Figure 5 shows the percentage of the built-up areas derived from the Landsat images correlated with the land use maps from the GIS data. The total number of pixels in the built-up area was calculated from each land use (industrial, residential and commercial), where the percentage of the built-up areas was computed for each land use in the map. Most of the built-up areas derived from the Landsat images are located in the industrial and residential zones. However, the built-up areas are mainly occupied in the industrial zones by 51%–70% in 2005, 52%–70% in 2006, 50%–67% in 2007, 45%–73% in 2008, 51%–75% in 2009 and 51%–80% in 2010. That is mainly because of the higher reflectance of the industrial areas that are usually paved with homogeneous concrete and asphalt structures compared to the residential and commercial areas. The industrial areas are mainly covered by a large extent of concrete structure without any distinguished vegetation on site, where the residential areas contain residential buildings and houses. Many of these residential buildings and houses have vegetation surrounding them, which may influence their corresponding spectral reflectance values found within the Landsat images.
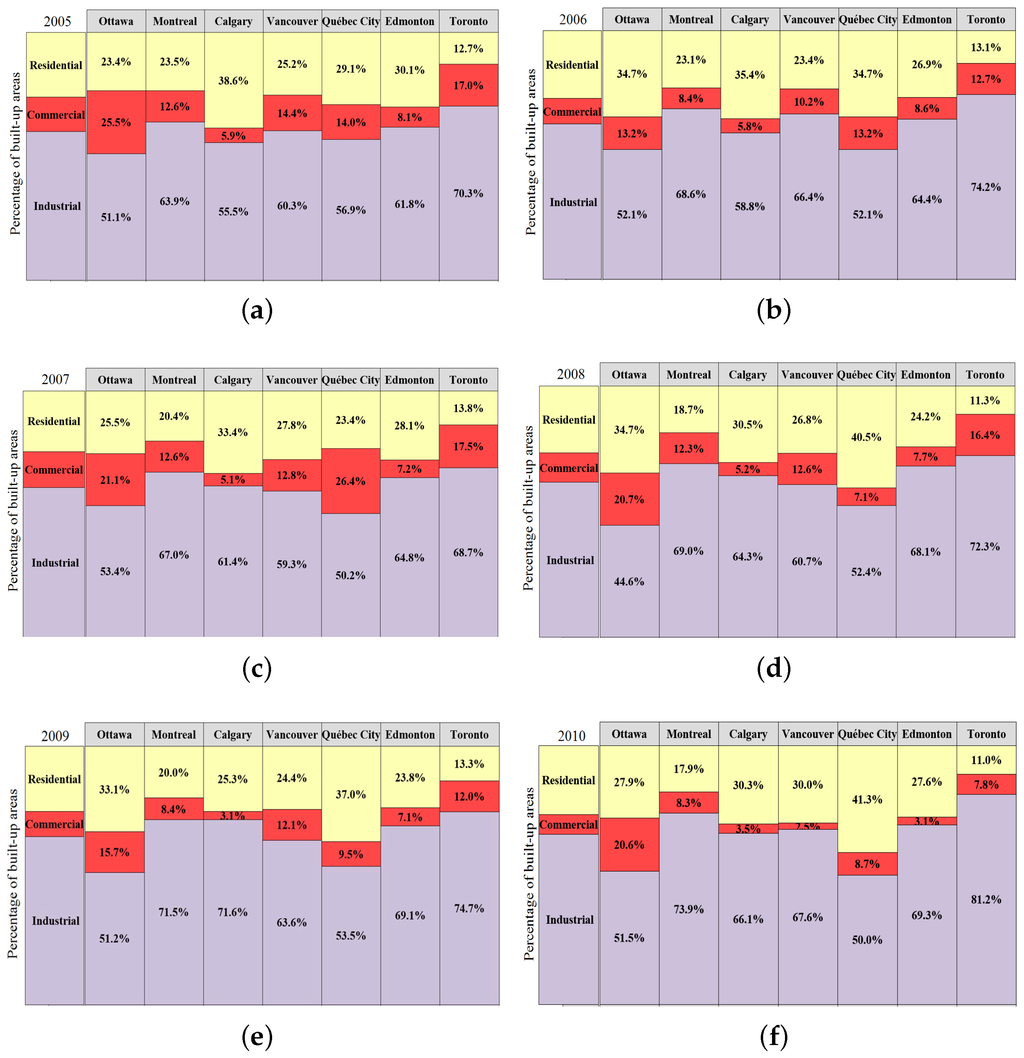
Figure 5.
Percentage of built-up areas within the land use. (a) 2005; (b) 2006; (c) 2007; (d) 2008; (e) 2009; (f) 2010.
In 2005, the built-up areas obtained from the Landsat images are consistently located within the industrial zones in the seven cities. The percentage of the built-up areas found within big cities, such as the City of Toronto, Montreal and Vancouver, has a higher percentage of the built-up areas compared to small cities, such as Québec City, by 10% to 20%. However, the percentage of the built-up areas within big cities, such as Toronto, Montreal and Vancouver, is significantly higher than the percentage of the built-up areas in small cities, such as Québec City, by 30% to 36% for the year 2010. Such findings can be explained due to the fact that the industrial areas in those big cities occupy more land than those industrial areas in the small cities by 70 to 100 km2. The highest percentage of the built-up areas within the industrial zones in 2010 is found in the City of Toronto (81%). The lowest percentage of the built-up areas within the industrial zones is located in Québec City (50%). This could be due to the variation of the manufacturing and services industries in Toronto, which are found to be more significant than that in Québec City.
Figure 5 shows dramatic changes in the percentage of the built-up areas that are located within the residential and commercial areas in the cities. The percentage of the built-up areas that are located within the residential and commercial areas in Québec City and Ottawa changed from 4.5% to 12% throughout 2005 to 2010, which could be explained as due to the urban sprawl in those two cities. However, the industrial areas in the other cities, such as Toronto, Montreal, Vancouver and the City of Calgary, expanded by 7% to 10% from the year 2005 to 2010. This can be explained by the urban expansion in the industrial sector that is more than the residential and commercial sector in these four cities.
The highest percentage of the built-up areas within the industrial zones in 2005 is located in the City of Toronto (70%). The lowest percentage of the built-up areas within the industrial zones is located in the City of Ottawa (51%). That is mainly because of the urban sprawl, where the total population in the City of Toronto is about five million people. However, the combined total population of Québec City and the City of Ottawa is about two million people in 2005 [9]. From the year 2005 to 2010, it was observed that the built-up areas, which are located within the industrial zones, are significantly higher than the built-up areas, which are located within the residential and commercial areas zones. For that reason, further analysis was conducted to determine the linear regression between the percentage of the built-up areas and the industrial areas from year the 2005 to 2010. A strong positive linear relationship was observed for all of the built-up areas and industrial areas, where R2= 0.82 is detected for the percentage of the built-up areas found within the industrial zones from 2005 to 2010, as shown in Figure 6. With these findings, one can conclude that the Landsat-derived built-up areas mainly represent the industrial zones regardless of the cities being analysed. This thus paves the way for the subsequent analysis, in the following Section 3.2, which aims to model the relationship between the Landsat-derived built-up areas with respect to the real GDP, the total population and the total employment.
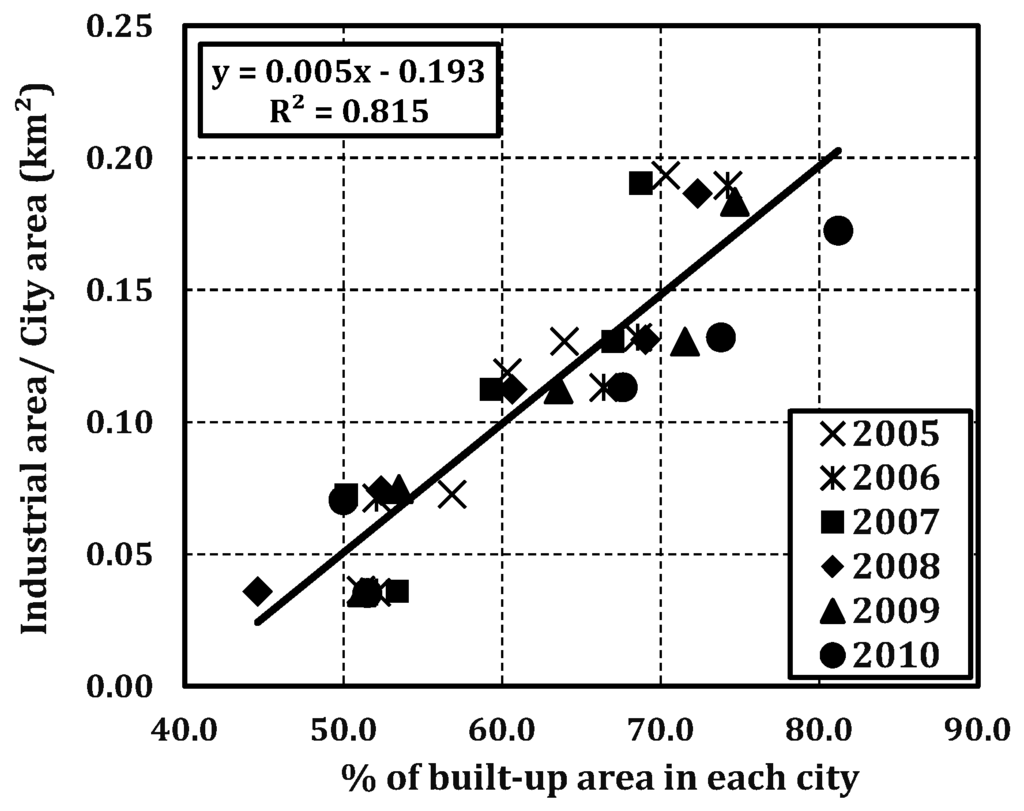
Figure 6.
Relationship between the percentage of built-up areas and the industrial areas from 2005 to 2010.
3.2. Regression Analysis between the Socio-Economic Parameters and Built-Up Areas
A preliminary analysis was conducted to determine the linear regression between the real GDP, total employment and total population from socio-economic parameters with respect to the percentage of the built-up areas derived from the remote sensing images within the industrial zones from the year 2005 to 2010. Such analyses are found missing in the existing literature, which adopted Landsat images for industrial land use and socio-economic parameters.
Figure 7 shows the relationship between the percentage of the built-up areas within the industrial zones and the real GDP, total employment and total population from 2005 to 2010, respectively. Preliminary analysis revealed that a moderate positive linear relationship exists for both of the socio-economic parameters and the percentage of the built-up areas within the industrial zones from 2005 to 2010. An R2 of 0.6 was detected for the percentage of the built-up areas within the industrial zones and real GDP. On the other hand, an R2 of 0.5 was observed for the percentage of the built-up areas within the industrial zones and total population. Furthermore, the linear regression between the percentage of the built-up areas found within the industrial zones and R2 of total employment was 0.5.
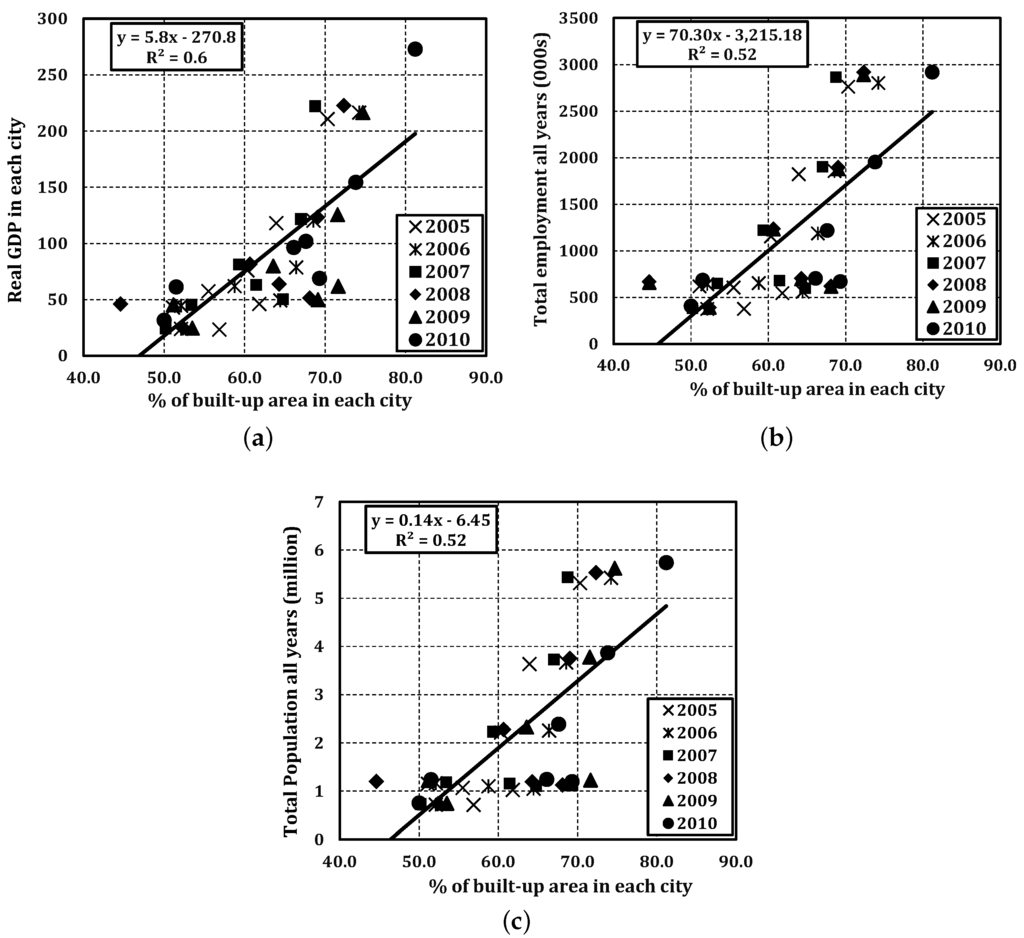
Figure 7.
Relationship between % of built-up areas and the socio-economic parameters from 2005 to 2010. (a) % of built-up areas vs. GDP; (b) % of built-up areas vs. total employment; (c) % of built-up areas vs. population.
Since a few outliers were observed in Figure 7, which are mainly contributed by the City of Calgary and Edmonton, if the data of these two cities were eliminated from the analysis, the linear regression between the socio-economic parameters and the percentage of the built-up areas within each city were significantly improved. The R2 between the percentage of the built-up areas within the industrial zones and the real GDP jumped from 0.6 to 0.8. The linear regression between the percentage of the built-up areas within the industrial zones and total population increased from 0.5 to 0.83. The regression between the percentage of the built-up areas within the industrial zones and total employment improved from 0.5 to 0.82, as shown Figure 8. The reason for deducting these two cities for analysis is mainly because the City of Edmonton and the City of Calgary are located in the province of Alberta, which is mainly dependent on the oil and gas industries (Canadian Centre for Energy Information, 2012), where most of the oil and gas manufacturers are located outside the cities. For that reason, the industrial areas within the cities may not accurately represent the real GDP of the cities. As a result, the cities of Calgary and Edmonton were eliminated from the data due to the low regression between industrial areas and socio-economic parameters.
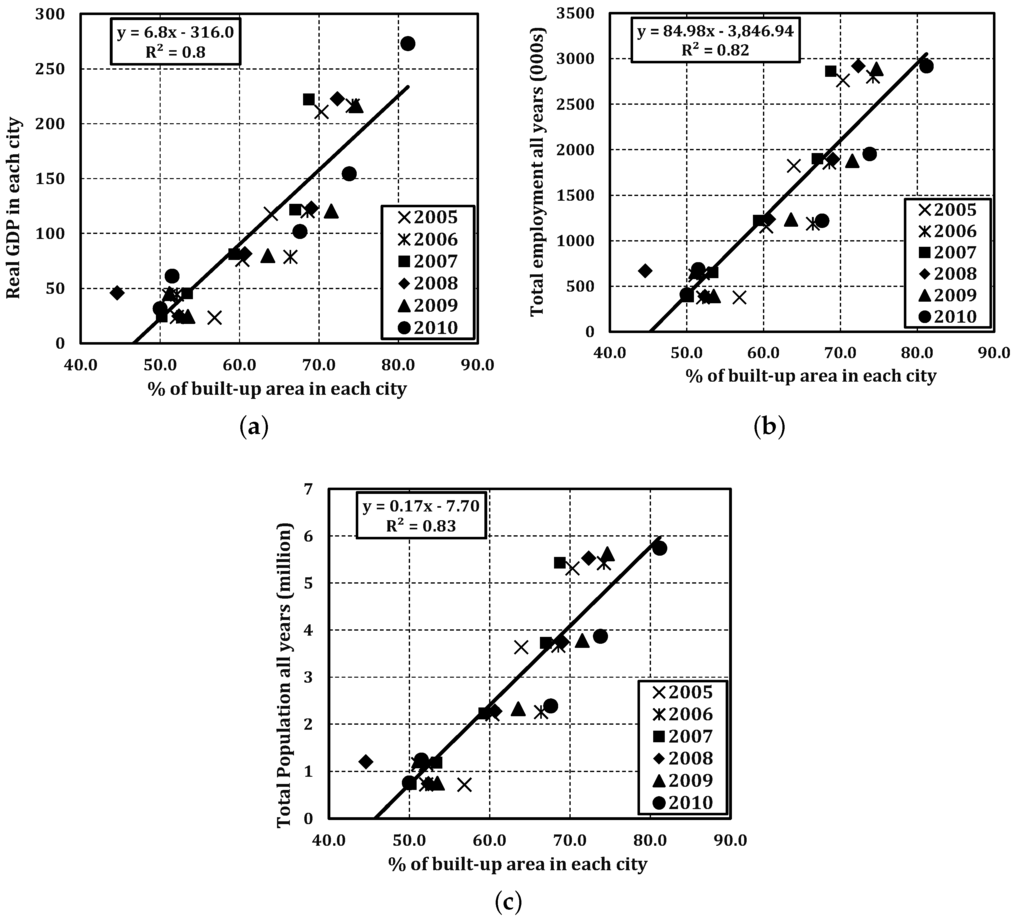
Figure 8.
Relationship between % of built-up areas and the socio-economic parameters without Edmonton and Calgary from 2005 to 2010. (a) % of built-up areas vs. GDP; (b) % of built-up areas vs. total employment; (c) % of built-up areas vs. population.
In spite of these results, all of the fitted regression lines show that the percentage of the built-up areas within the industrial zones has a direct proportional relationship to all of the socio-economic parameters that were used in this study. Further analysis was conducted to determine the linear regression between the industrial area from GIS data and the real GDP from 2005 to 2010. That is mainly to investigate which city inflates the overall regression. As noted in the below Figure 9, the results vary in each of the cities. A strong positive linear relationship was observed for both of the industrial areas and real GDP in the City of Ottawa and the City of Vancouver, resulting in a R2 of 0.9 and 0.8 from 2005 to 2010, as shown in Figure 9a,b. A moderate positive linear relationship (R2= 0.7 and 0.6) was found for the cities of Toronto, Montreal, Edmonton and Québec City, as shown in Figure 9c to f. The City of Calgary has a weak linear relationship (R2 = 0.4) between the industrial areas within the cities and the corresponding GDP from 2005 to 2010, as shown in Figure 9g. Based on the previous observation, the City of Edmonton and Calgary have negative impact on the overall regression, because these two cities are mainly dependent on the oil and gas industries (Canadian Centre for Energy Information, 2012), where most of the oil and gas manufacturers are located outside the cities, as mentioned previously. Therefore, a moderate positive linear relationship (R2= 0.66) was determined, when Edmonton and Calgary were involved in the dataset, as shown in Figure 9h. However, a strong positive linear relationship was observed for both of the industrial areas and real GDP if the aforementioned two cities were eliminated, resulting in a R2 of 0.81 for the real GDP from 2005 to 2010, as shown in Figure 10.
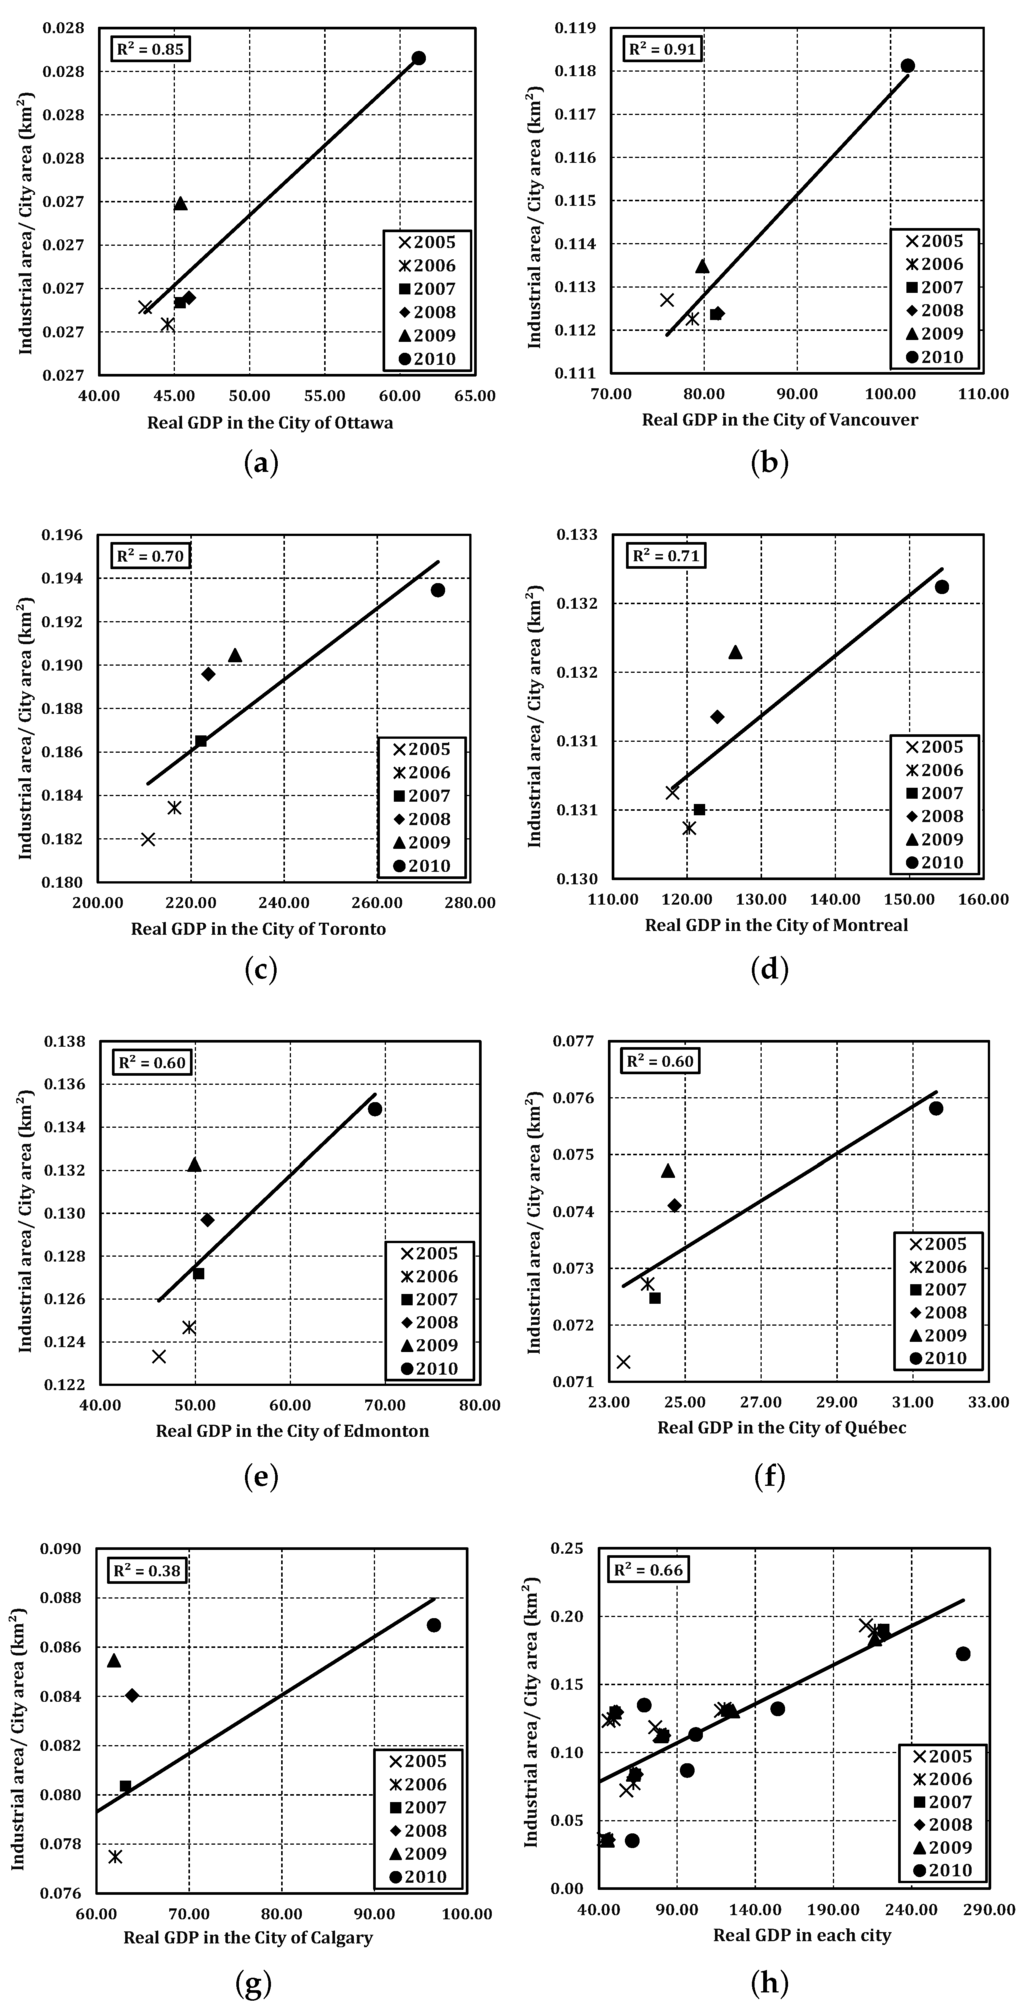
Figure 9.
Relationship between the real GDP and industrial areas from 2005 to 2010. (a) City of Ottawa; (b) City of Vancouver; (c) City of Toronto; (d) City of Montreal; (e) City of Edmonton; (f) Québec City; (g) City of Calgary; (h) all cities.
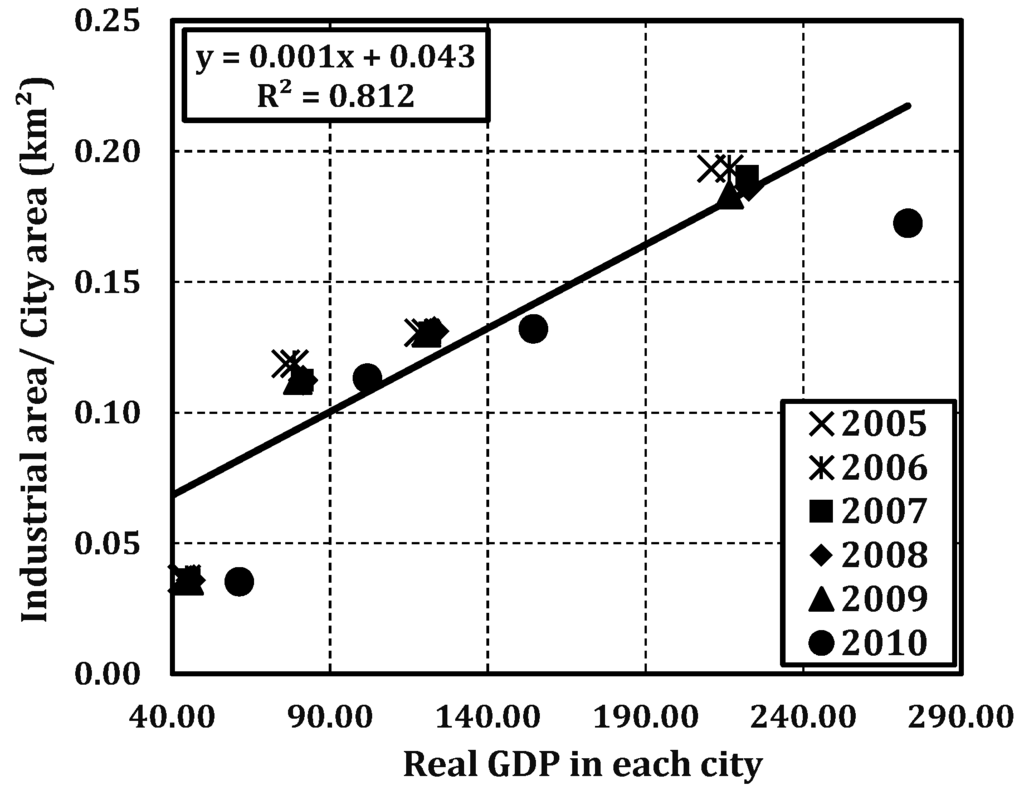
Figure 10.
Real GDP vs. industrial areas without Edmonton and Calgary.
Despite these moderate/strong regressions being revealed, such a method may not be replicated at the individual city level, because remote sensing-derived parameters are unable to explain the large amounts of variance in GDP. Current economic development studies have already pointed out certain factors influencing the GDP, including energy consumption, foreign direct investment and CO2 emissions [26]. In addition, some parameters that contribute to the GDP, such as retail sales, service sector and manufacturers’ shipments, are hard to measure [27]. Therefore, the use of the remote sensing technique to model the GDP only contributes to a certain degree (in a particular spatial dimension), while other socio-economic and environmental factors should be considered in order to derive a more universal indicator to predict the economic development at the country-wide level. Therefore, all of these hidden factors may affect the regression coefficient (R2) in each city.
3.3. Discussion
In summary, this study aims to investigate the ability of using remote sensing technique to model and predict the real GDP for those cities that are mainly dependent on industrial and manufacturing incomes. To achieve this, we have to first prove there exists a relationship between the remote sensing-derived indices (i.e., the built-up areas) with respect to the industrial zones, which has been reported in Section 3.1. With such a high linear regression (R2 = 0.82) between the remote sensing-derived built-up areas, as well as the industrial areas, one can assume that the built-up areas have a high component of industrial and manufacturing activities. Therefore, in Section 3.2., we investigate the relationship between the Landsat-derived built-up areas with respect to the real GDP, the total population and the total employment. A high linear regression was observed (R2 = 0.8) for the three socio-economic parameters. Thus, the presented approach can be replicated by any federal authorities in developed countries, where their major incomes are dependent on the industrial and manufacturing activities. However, there are a few varieties of limitations in regards to the research study. (1) More up-to-date GIS data are required to consolidate the findings for different cities and countries. (2) Water bodies and bare soil all have high built-up index values that may cause confusion with the impervious surfaces. If this method were being applied elsewhere and no GIS data exists, it would likely cause problems, as water bodies or bare soil could be classified as built-up areas, and the relationship with GDP would be affected. (3) Other regression analyses (such as nonlinear regression) can be explored depending on the nature of study area and the socio-economic parameters being studied. The authors have investigated the use of nonlinear regression to run the relationship between the GIS and remote sensing data, with respect to the socio-economic data, including real GDP, total population and total employment. However, there is no consistent trend being found in all of these cities regardless of the improvement on R2 that thus reveals the inappropriate use of a non-linear model in this specific case study. Such an argument is somehow supported in the existing literature from [11] to [14], where all of these studies examined the use of the linear regression approach to analyse the data, which either focused on the national scale or on a specific city, and the majority of the results represent moderate to strong linear regression between the remote sensing-derived information with respect to the socio-economic data. Although the parameters being analysed may not be identical, the use of linear regression somehow has its grounds in accordance with these existing literatures. In short, the remote sensing technique can provide fruitful information to model some of the socio-economic parameters. However, other socio-economic parameters and empirical models should be considered in order to develop a more universal indicator to predict the GDP. As a result, further research should be carried out to reveal the relationship with respect to other parameters, such as energy consumption, foreign direct investment and CO2 emissions [26], as well as developing a new technique to retrieve the built-up area for those regions located in an arid environment and cold region or specifically designed city, like a green city.
4. Conclusions
This study aims to investigate the relationship between the built-up area, as well as three socio-economic parameters (the real GDP, total population and total employment) in order to facilitate any new city development and regional planning, with a case study of seven major cities in Canada. Since not all of the cities have a comprehensive GIS land use dataset to find out the built-up areas, thus we proposed to utilize remote sensing data to estimate the built-up areas to achieve such a goal. In this study, we analysed 42 Landsat images and 42 land use maps in order to study the regression between the percentage of built-up areas extracted from the satellite image and the reported real GDP in seven major cities in Canada. The Landsat TM images were first atmospherically corrected, and the built-up values were computed using the NDBI and NDVI. Those high built-up values within the industrial areas were derived from the Landsat images for subsequent analysis. Built-up values within the industrial areas were correlated with industrial zones within the seven cities with a strong positive linear relationship (R2 = 0.82) found from the year 2005 to 2010. A further analysis was conducted to investigate the regression between the real GDP, population and total employment with respect to the built-up areas. It was found that the percentage of built-up areas, which are located in the industrial zones, has a moderate positive linear relationship (R2 = 0.6, and 0.5) with the socio-economic parameters if all cites were considered in the datasets. However, an improvement of the coefficient regression (R2 = 0.8, 0.82 and 0.83) was observed when the City of Edmonton and Calgary were eliminated from the analysis, since these cities have a relative high gross income from the oil mining industry that does not require a large piece of land for manufacturing. With the regression found, the results can be used as a generic indication for the federal/municipal authorities, which are aiming at or targeting a specific real GDP with respect to the planned industrial areas for city management. Future work can be focused on developing a new method to accurately extract the built-up area for arid or cold region environment/country, since the NDBI-NDVI approach may not be applicable in those area to extract the built-up zone. In addition, the relationship between the real GDP, as well as other remote sensing-derived indices (such as area of desert or soil) should be investigated for those regions.
Acknowledgments
The research was supported by the Natural Sciences and Engineering Research Council of Canada (NSERC) Discovery Grant. We acknowledge the United States Geological Survey (USGS) for the data and information that they provided through the EarthExplorer platform. Special thanks also are extended to Dan Jakubek from the library of Ryerson University, who provided all of the GIS data for this research work.
Author Contributions
The research was conducted by the main author, Kamil Faisal, under the supervision of the co-author Ahmed Shaker, who designed the experiment and provided technical support and guidance and directly contributed to the results of this article. Suhaib Habbani assisted in part of the experimental work under the guidance of Kamil Faisal and Ahmed Shaker.
Conflicts of Interest
The authors declare no conflict of interest.
References
- Cihlar, J. Land cover mapping of large areas from satellites: Status and research priorities. Int. J. Remote Sens. 2000, 21, 1093–1114. [Google Scholar] [CrossRef]
- Yan, W.Y.; Shaker, A.; El-Ashmawy, N. Urban land cover classification using airborne LiDAR data: A review. Remote Sens. Environ. 2015, 158, 295–310. [Google Scholar] [CrossRef]
- Selçuk, R.; Nişnci, R.; Bayram, U.; Yalçin, A. Monitoring land-use changes by GIS and remote sensing techniques: Case study of Trabzon. In Proceedings of 2nd FIG Regional Conference, Marrakech, Morocco, 2–5 December 2003; pp. 1–11.
- Huang, W.; Zeng, Y.; Li, S. An analysis of urban expansion and its associated thermal characteristics using Landsat imagery. Geocarto Int. 2015, 30, 93–103. [Google Scholar] [CrossRef]
- Sutton, P.; Roberts, D.; Elvidge, C.; Baugh, K. Census from heaven: an estimate of the global human population using night-time satellite imagery. Int. J. Remote Sens. 2001, 22, 3061–3076. [Google Scholar] [CrossRef]
- Sutton, P.; Roberts, D.; Elvidge, C.; Meij, H. A comparison of night-time satellite imagery and population density for the continental United States. Photogramm. Eng. Remote Sens. 1997, 63, 1303–1313. [Google Scholar]
- Sutton, P.C.; Elvidge, C.; Obremski, T. Building and evaluating models to estimate ambient population density. Photogram. Eng. Remote Sens. 2003, 69, 545–553. [Google Scholar] [CrossRef]
- Sutton, P.C.; Costanza, R. Global estimates of market and non-market values derived from night-time satellite imagery, land cover, and ecosystem service valuation. Ecol. Econ. 2002, 41, 509–527. [Google Scholar] [CrossRef]
- Metropolitan Housing Outlook. In-Depth Housing Analysis for Canada, the Provinces, and Nine Metropolitan Areas. Available online: http://www.genworth.ca/en/pdfs/Metropolitan_Housing_Outlook_Autumn13_EN.pdf (accessed on 19 June 2014).
- The Mining Association of Canada. Facts and Figures 2011. Available online: http://www.miningnorth.com/wp-content/uploads/2012/04/MAC-FactsFigures-2011-English-small.pdf (accessed on 28 June 2014).
- Sutton, P.C.; Elvidge, C.D.; Ghosh, T. Estimation of gross domestic product at sub-national scales using night-time satellite imagery. Int. J. Ecol. Econ. Stat. 2007, 8, 5–21. [Google Scholar]
- Ma, Y.; Xu, R. Remote sensing monitoring and driving force analysis of urban expansion in Guangzhou City, China. Habitat Int. 2010, 34, 228–235. [Google Scholar] [CrossRef]
- Ghosh, T.; Elvidge, C.D. Estimating the information and technology development index (IDI) using night-time satellite imagery. Proc. Asia-Pac. Adv. Netw. 2010, 30, 143–171. [Google Scholar] [CrossRef]
- Yue, W.; Gao, J.; Yang, X. Estimation of gross domestic product using multi-sensor remote sensing data: A case study in Zhejiang province, East China. Remote Sens. 2014, 6, 7260–7275. [Google Scholar] [CrossRef]
- Liu, Q.; Sutton, P.C.; Elvidge, C.D. Relationships between night-time imagery and population density for Hong Kong. Proc. Asia-Pac. Adv. Netw. 2011, 31, 79–90. [Google Scholar] [CrossRef]
- Yan, W.Y.; Mahendrarajah, P.; Shaker, A.; Faisal, K.; Luong, R.; Al-Ahmad, M. Analysis of multi-temporal Landsat satellite images for monitoring land surface temperature of municipal solid waste disposal sites. Environ. Monit. Assess. 2014, 186, 8161–8173. [Google Scholar] [CrossRef] [PubMed]
- United States Geological Survey. Available online: http://earthexplorer.usgs.gov/ (accessed on 25 April 2014).
- Scholars GeoPortal. Available online: http://geo2.scholarsportal.info (accessed on 19 April 2014).
- Richter, R. Correction of satellite imagery over mountainous terrain. Appl. Opt. 1998, 37, 4004–4015. [Google Scholar] [CrossRef] [PubMed]
- Paolini, L.; Grings, F.; Sobrino, J.A.; Jiménez Muñoz, J.C.; Karszenbaum, H. Radiometric correction effects in Landsat multi-date/multi-sensor change detection studies. Int. J. Remote Sens. 2006, 27, 685–704. [Google Scholar] [CrossRef]
- Chander, G.; Markham, B.L.; Helder, D.L. Summary of current radiometric calibration coefficients for Landsat MSS, TM, ETM+, and EO-1 ALI sensors. Remote Sens. Environ. 2009, 113, 893–903. [Google Scholar] [CrossRef]
- Zha, Y.; Gao, J.; Ni, S. Use of normalized difference built-up index in automatically mapping urban areas from TM imagery. Int. J. Remote Sens. 2003, 24, 583–594. [Google Scholar] [CrossRef]
- Bhatti, S.S.; Tripathi, N.K. Built-up area extraction using Landsat 8 OLI imagery. GISci. Remote Sens. 2014, 51, 445–467. [Google Scholar] [CrossRef]
- He, C.; Shi, P.; Xie, D.; Zhao, Y. Improving the normalized difference built-up index to map urban built-up areas using a semiautomatic segmentation approach. Remote Sens. Lett. 2010, 1, 213–221. [Google Scholar] [CrossRef]
- Fasial, K.; Shaker, A. The use of remote sensing technique to predict Gross Domestic Product (GDP): An analysis of built-up index and GDP in nine major cities in Canada. Int. Arch. Photogram. Remote Sens. Spat. Inf. Sci. 2014, XL-7, 85–92. [Google Scholar] [CrossRef]
- Pao, H.T.; Tsai, C.M. Multivariate granger causality between CO2 emissions, energy consumption, FDI (foreign direct investment) and GDP (gross domestic product): Evidence from a panel of BRIC (Brazil, Russian Federation, India, and China) countries. Energy 2011, 36, 685–693. [Google Scholar] [CrossRef]
- Landefeld, S.J.; Seskin, E.P.; Fraumeni, B.M. Taking the pulse of the economy: Measuring GDP. J. Econ. Perspect. 2008, 22, 193–193. [Google Scholar] [CrossRef]
© 2016 by the authors; licensee MDPI, Basel, Switzerland. This article is an open access article distributed under the terms and conditions of the Creative Commons by Attribution (CC-BY) license (http://creativecommons.org/licenses/by/4.0/).