
Spatio-Temporal Patterns of Urban-Rural Development and Transformation in East of the “Hu Huanyong Line”, China


Abstract
:1. Introduction
2. Methodology
2.1. AHP Method and Index System Building
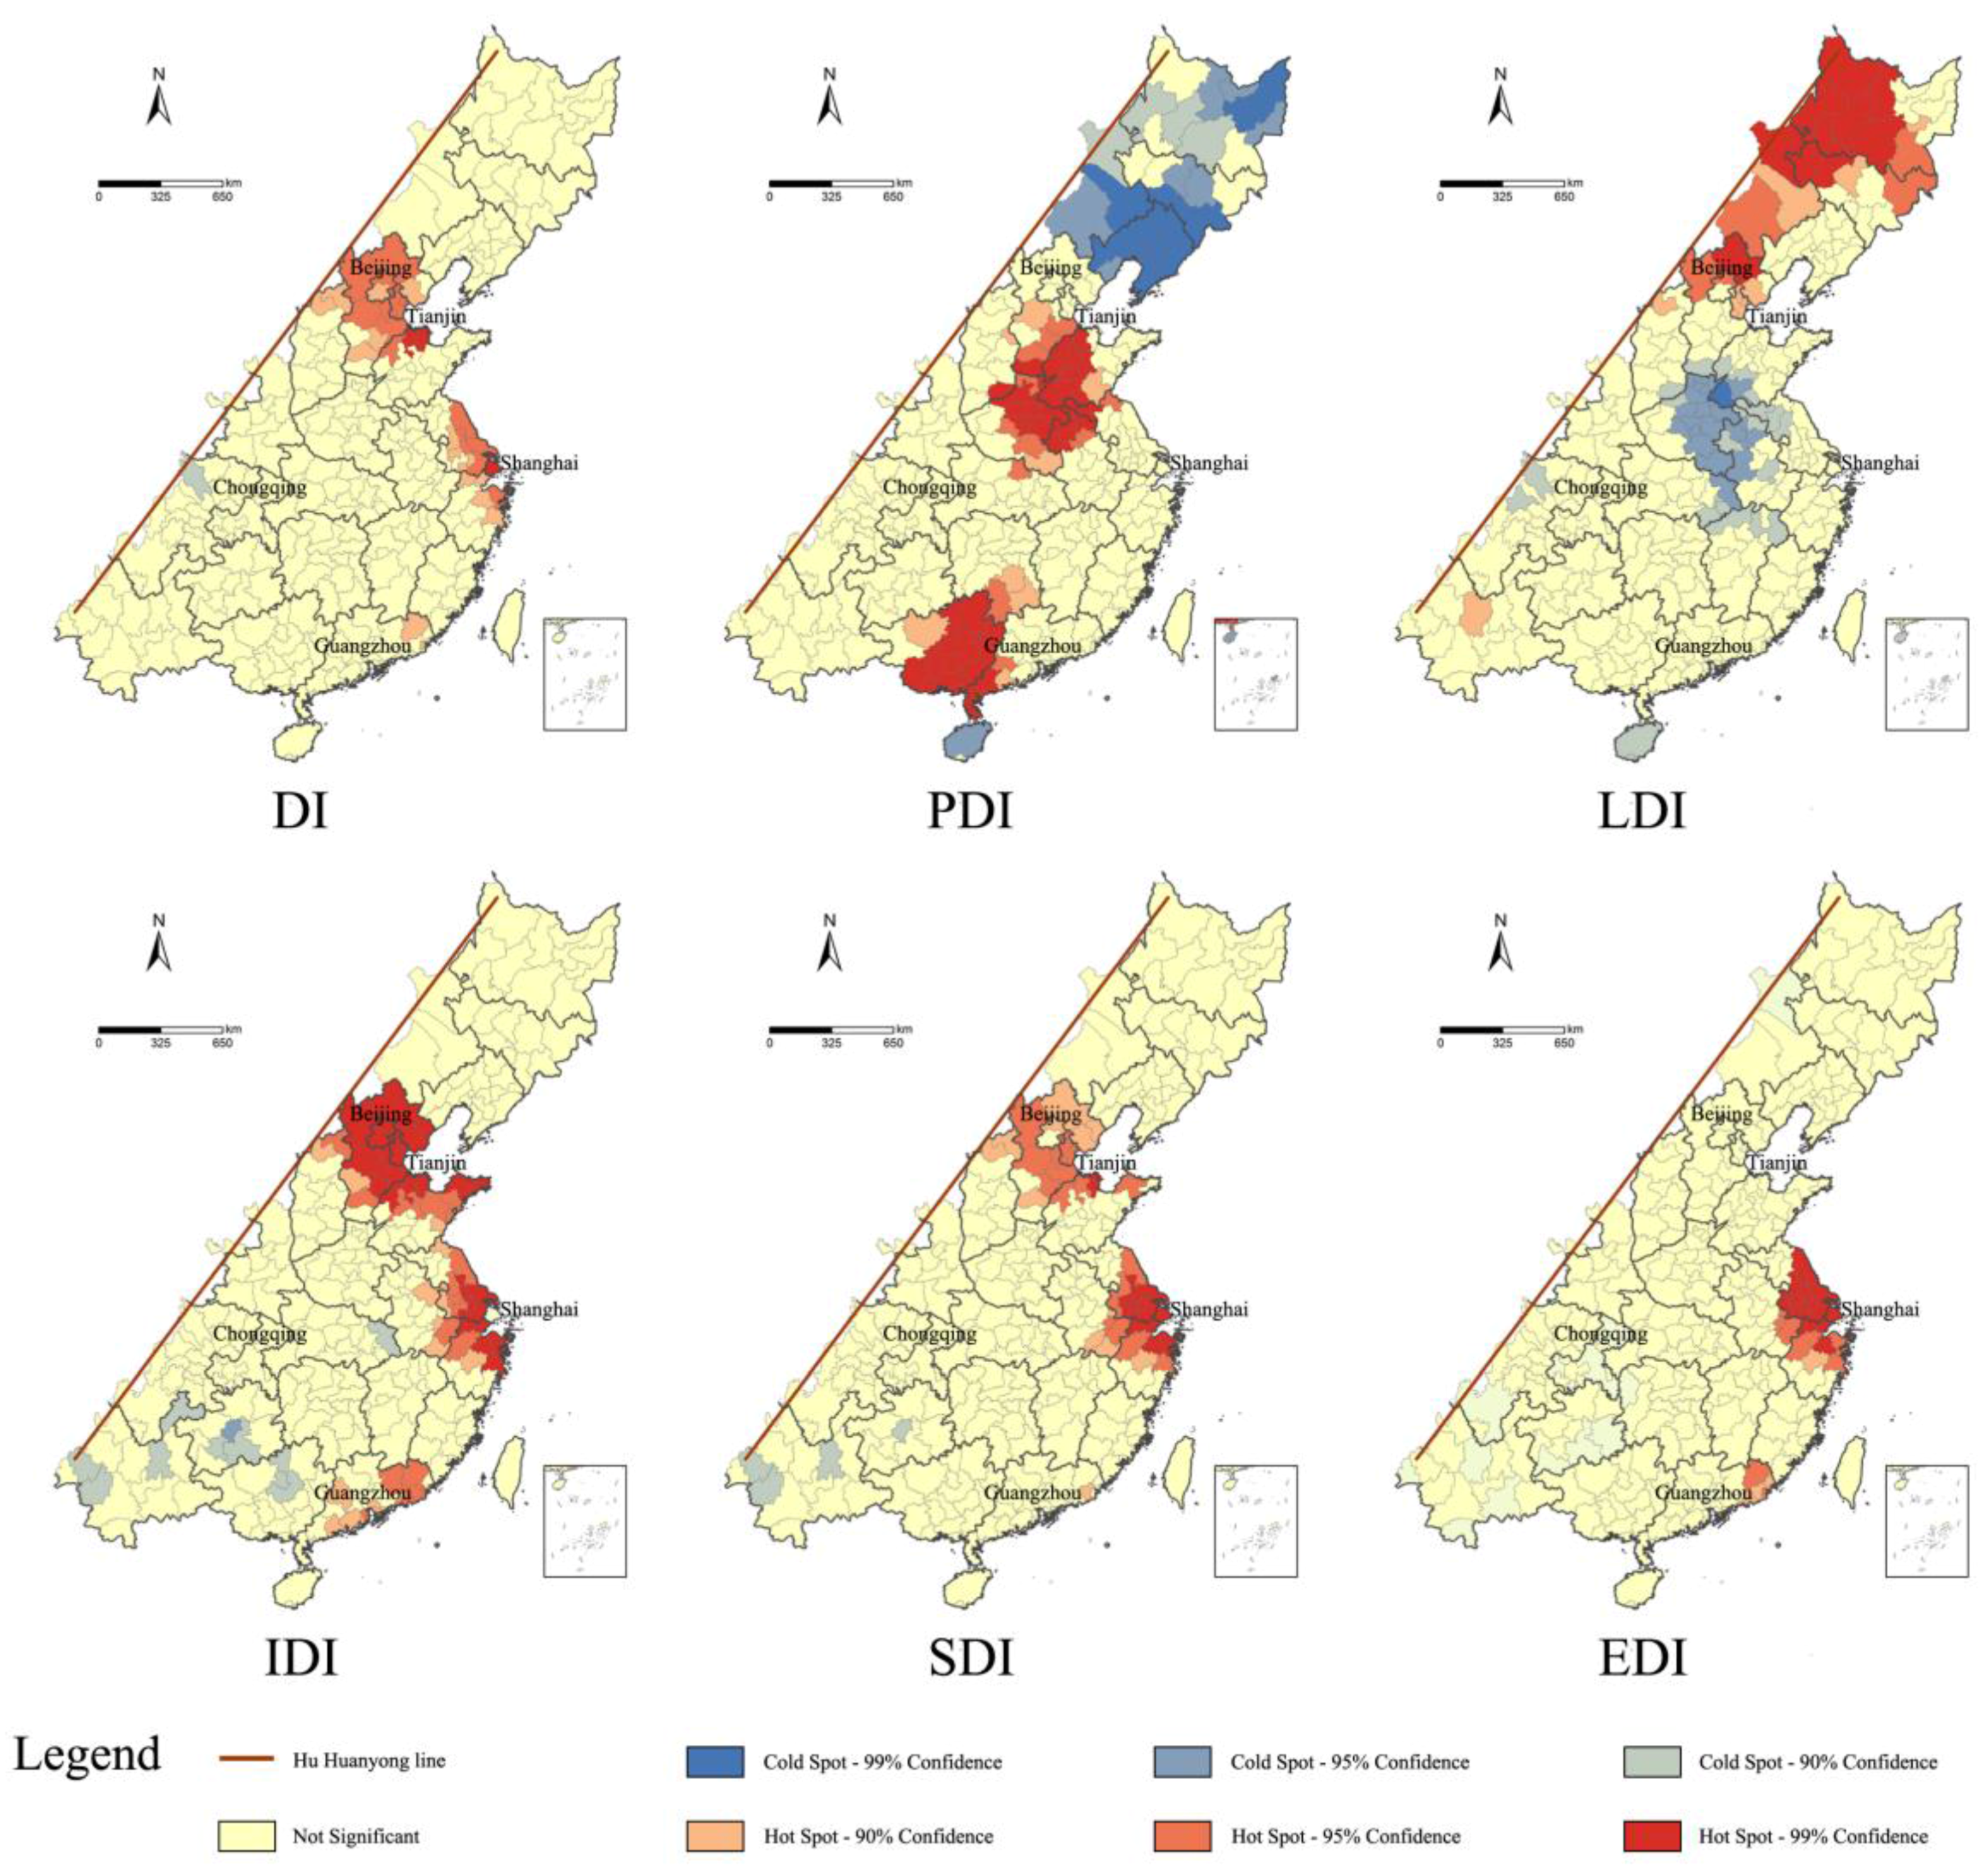
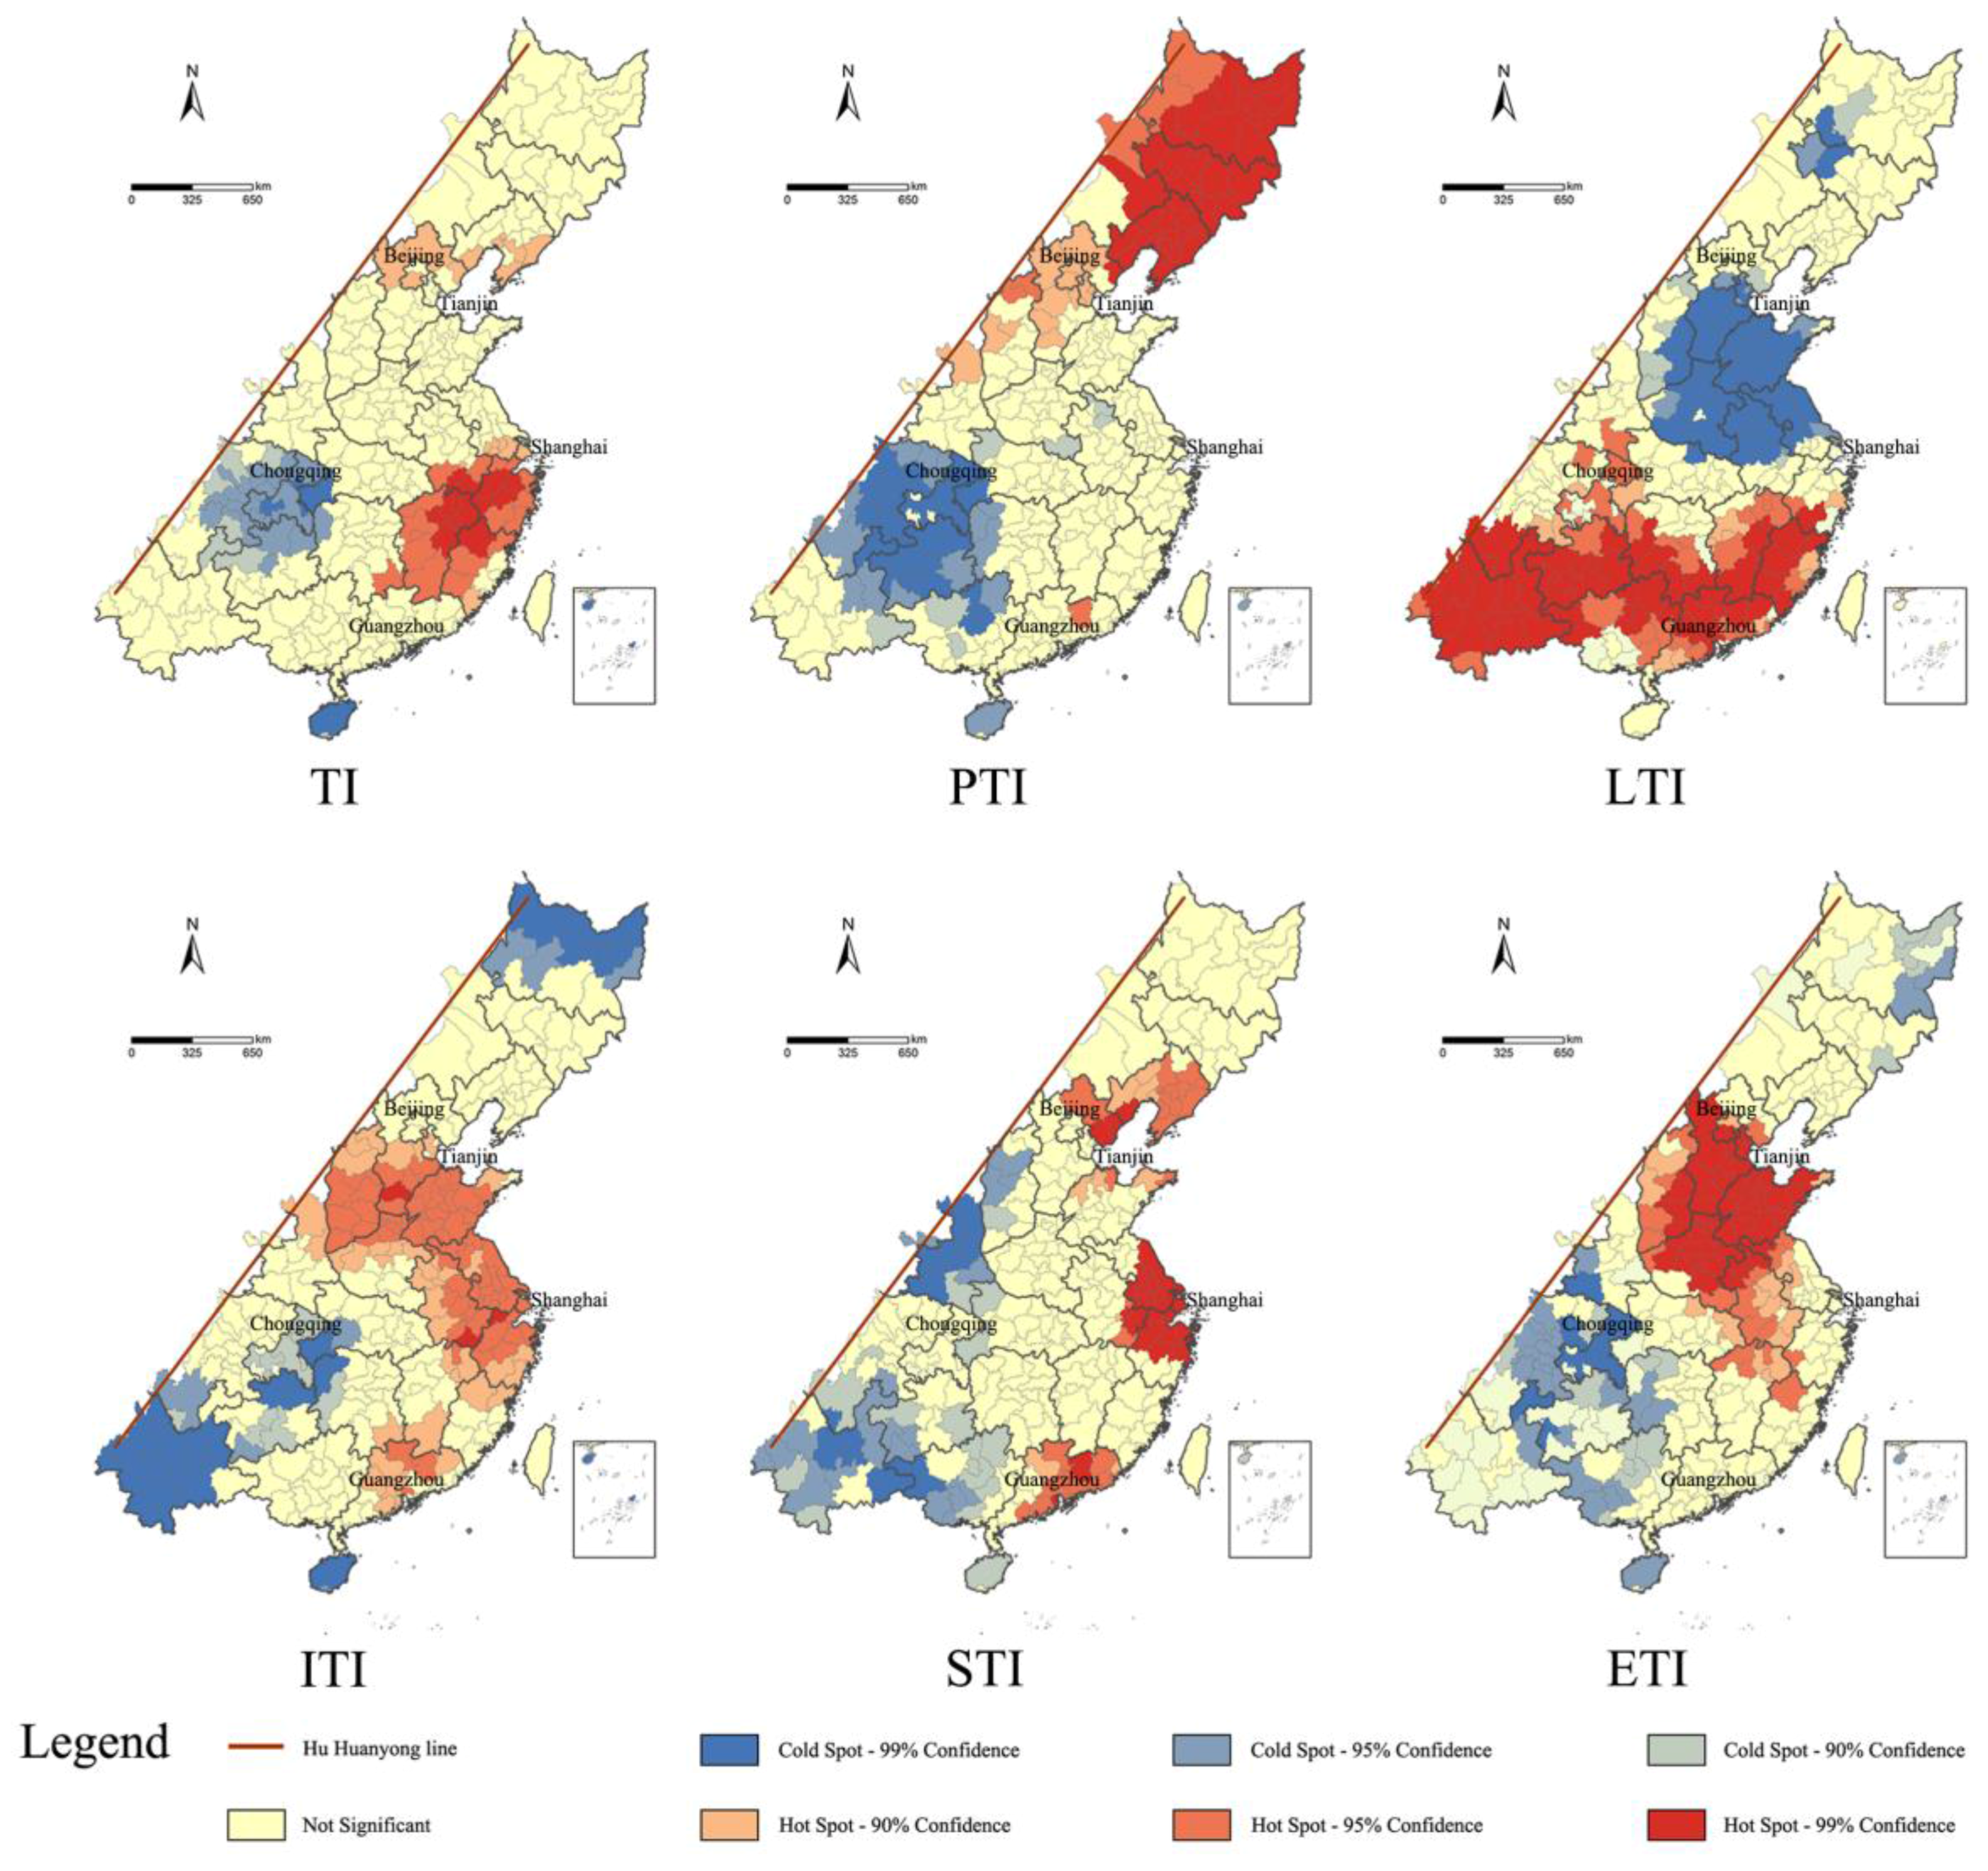
2.2. Hotspot Analysis Method
2.3. Pearson Correlation Coefficient and Local Moran’s I Methods
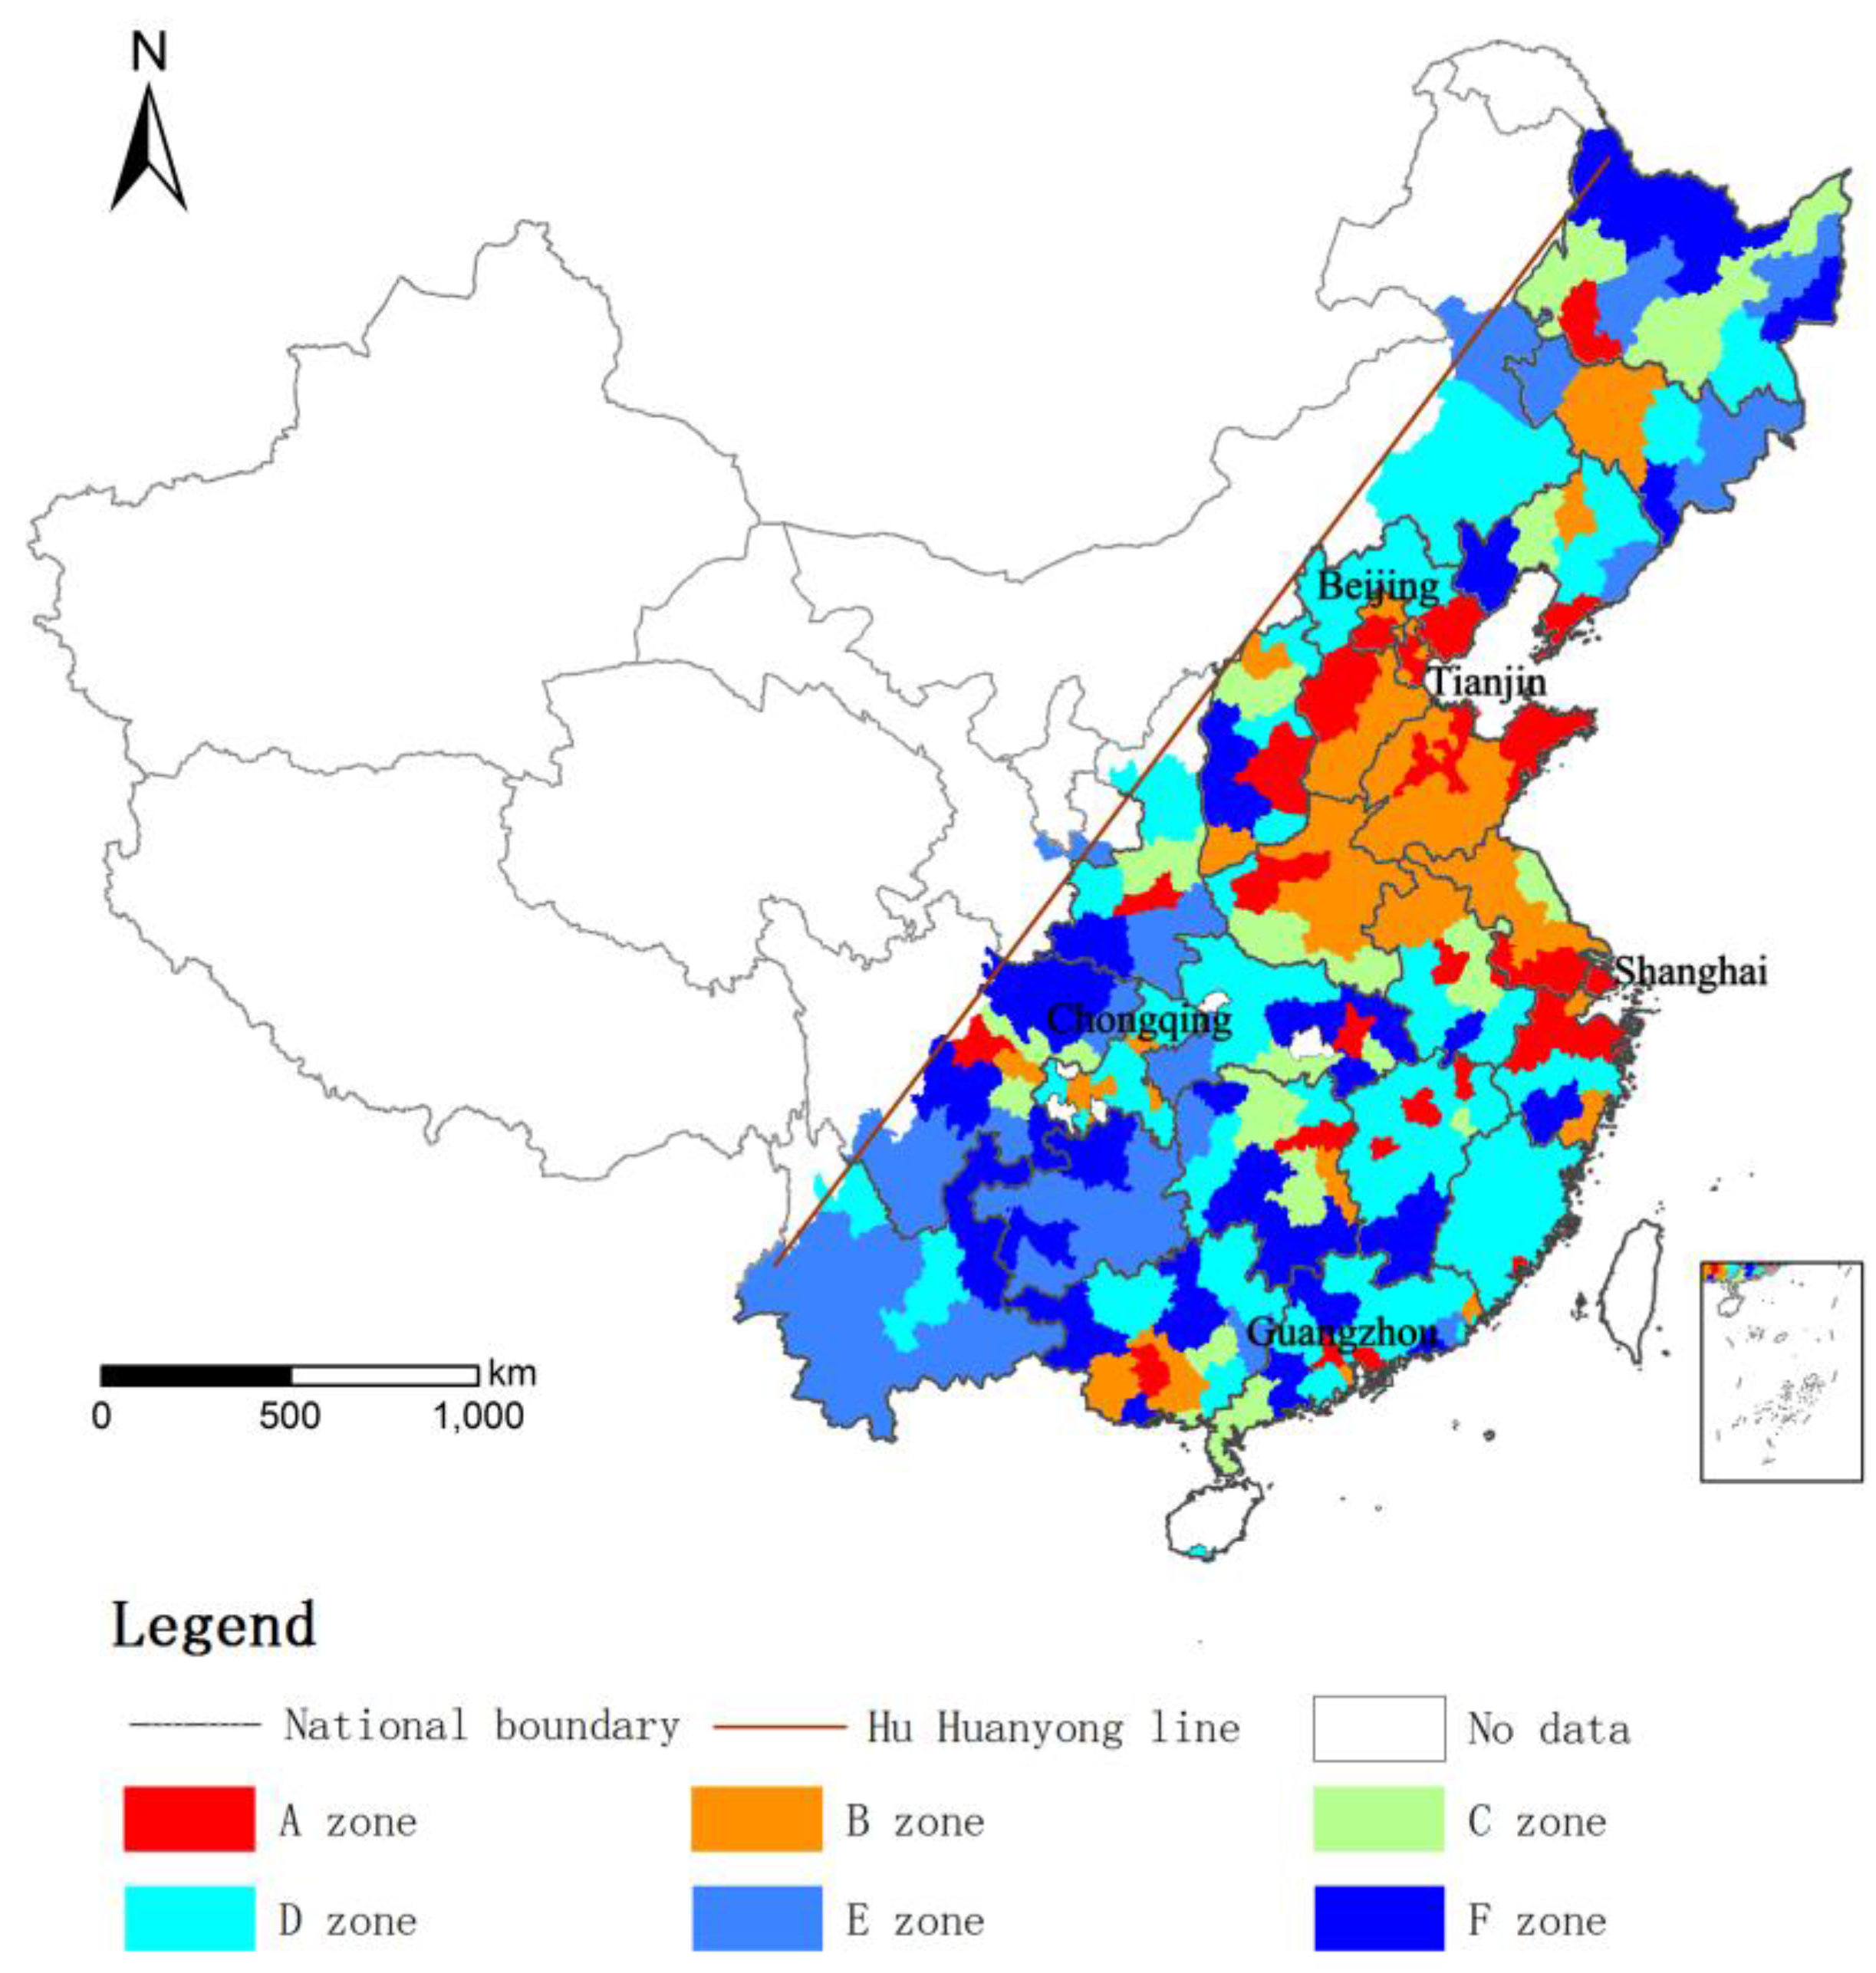
2.4. Self-Organization Feature Map Neural Network Method
3. Data Source and Study Area
3.1. Data Source
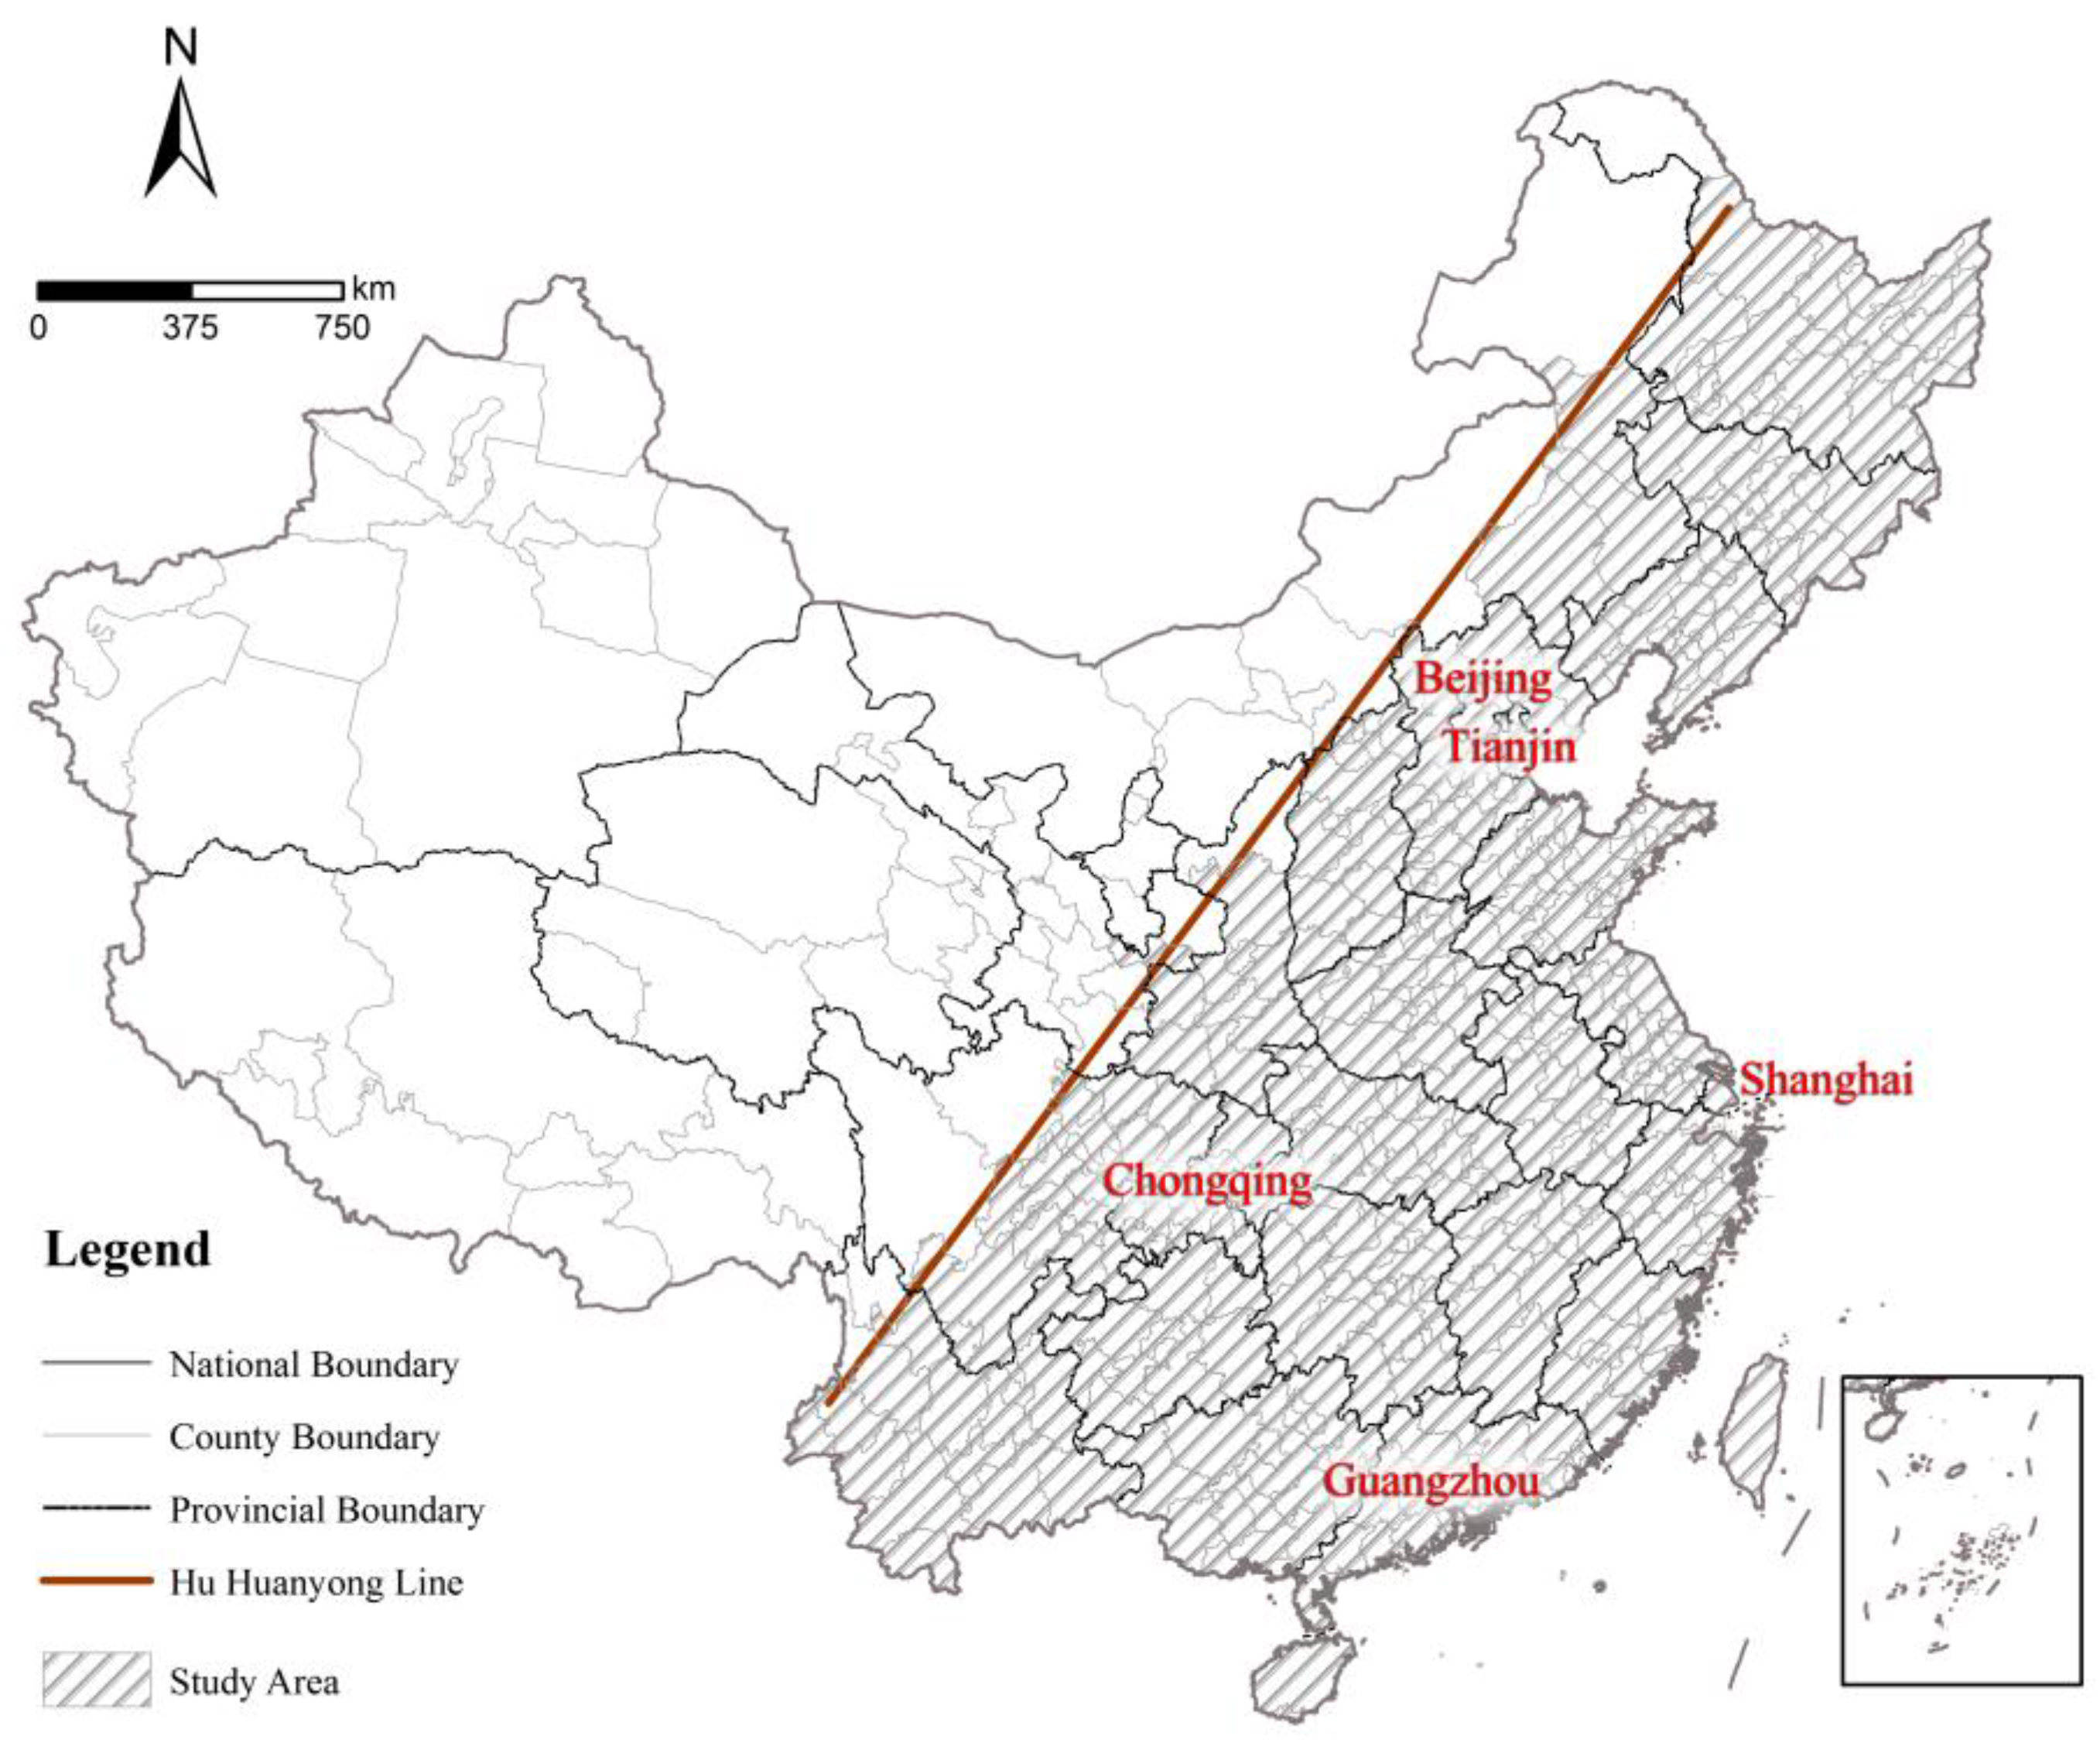
3.2. Study Area
4. Results and Discussions
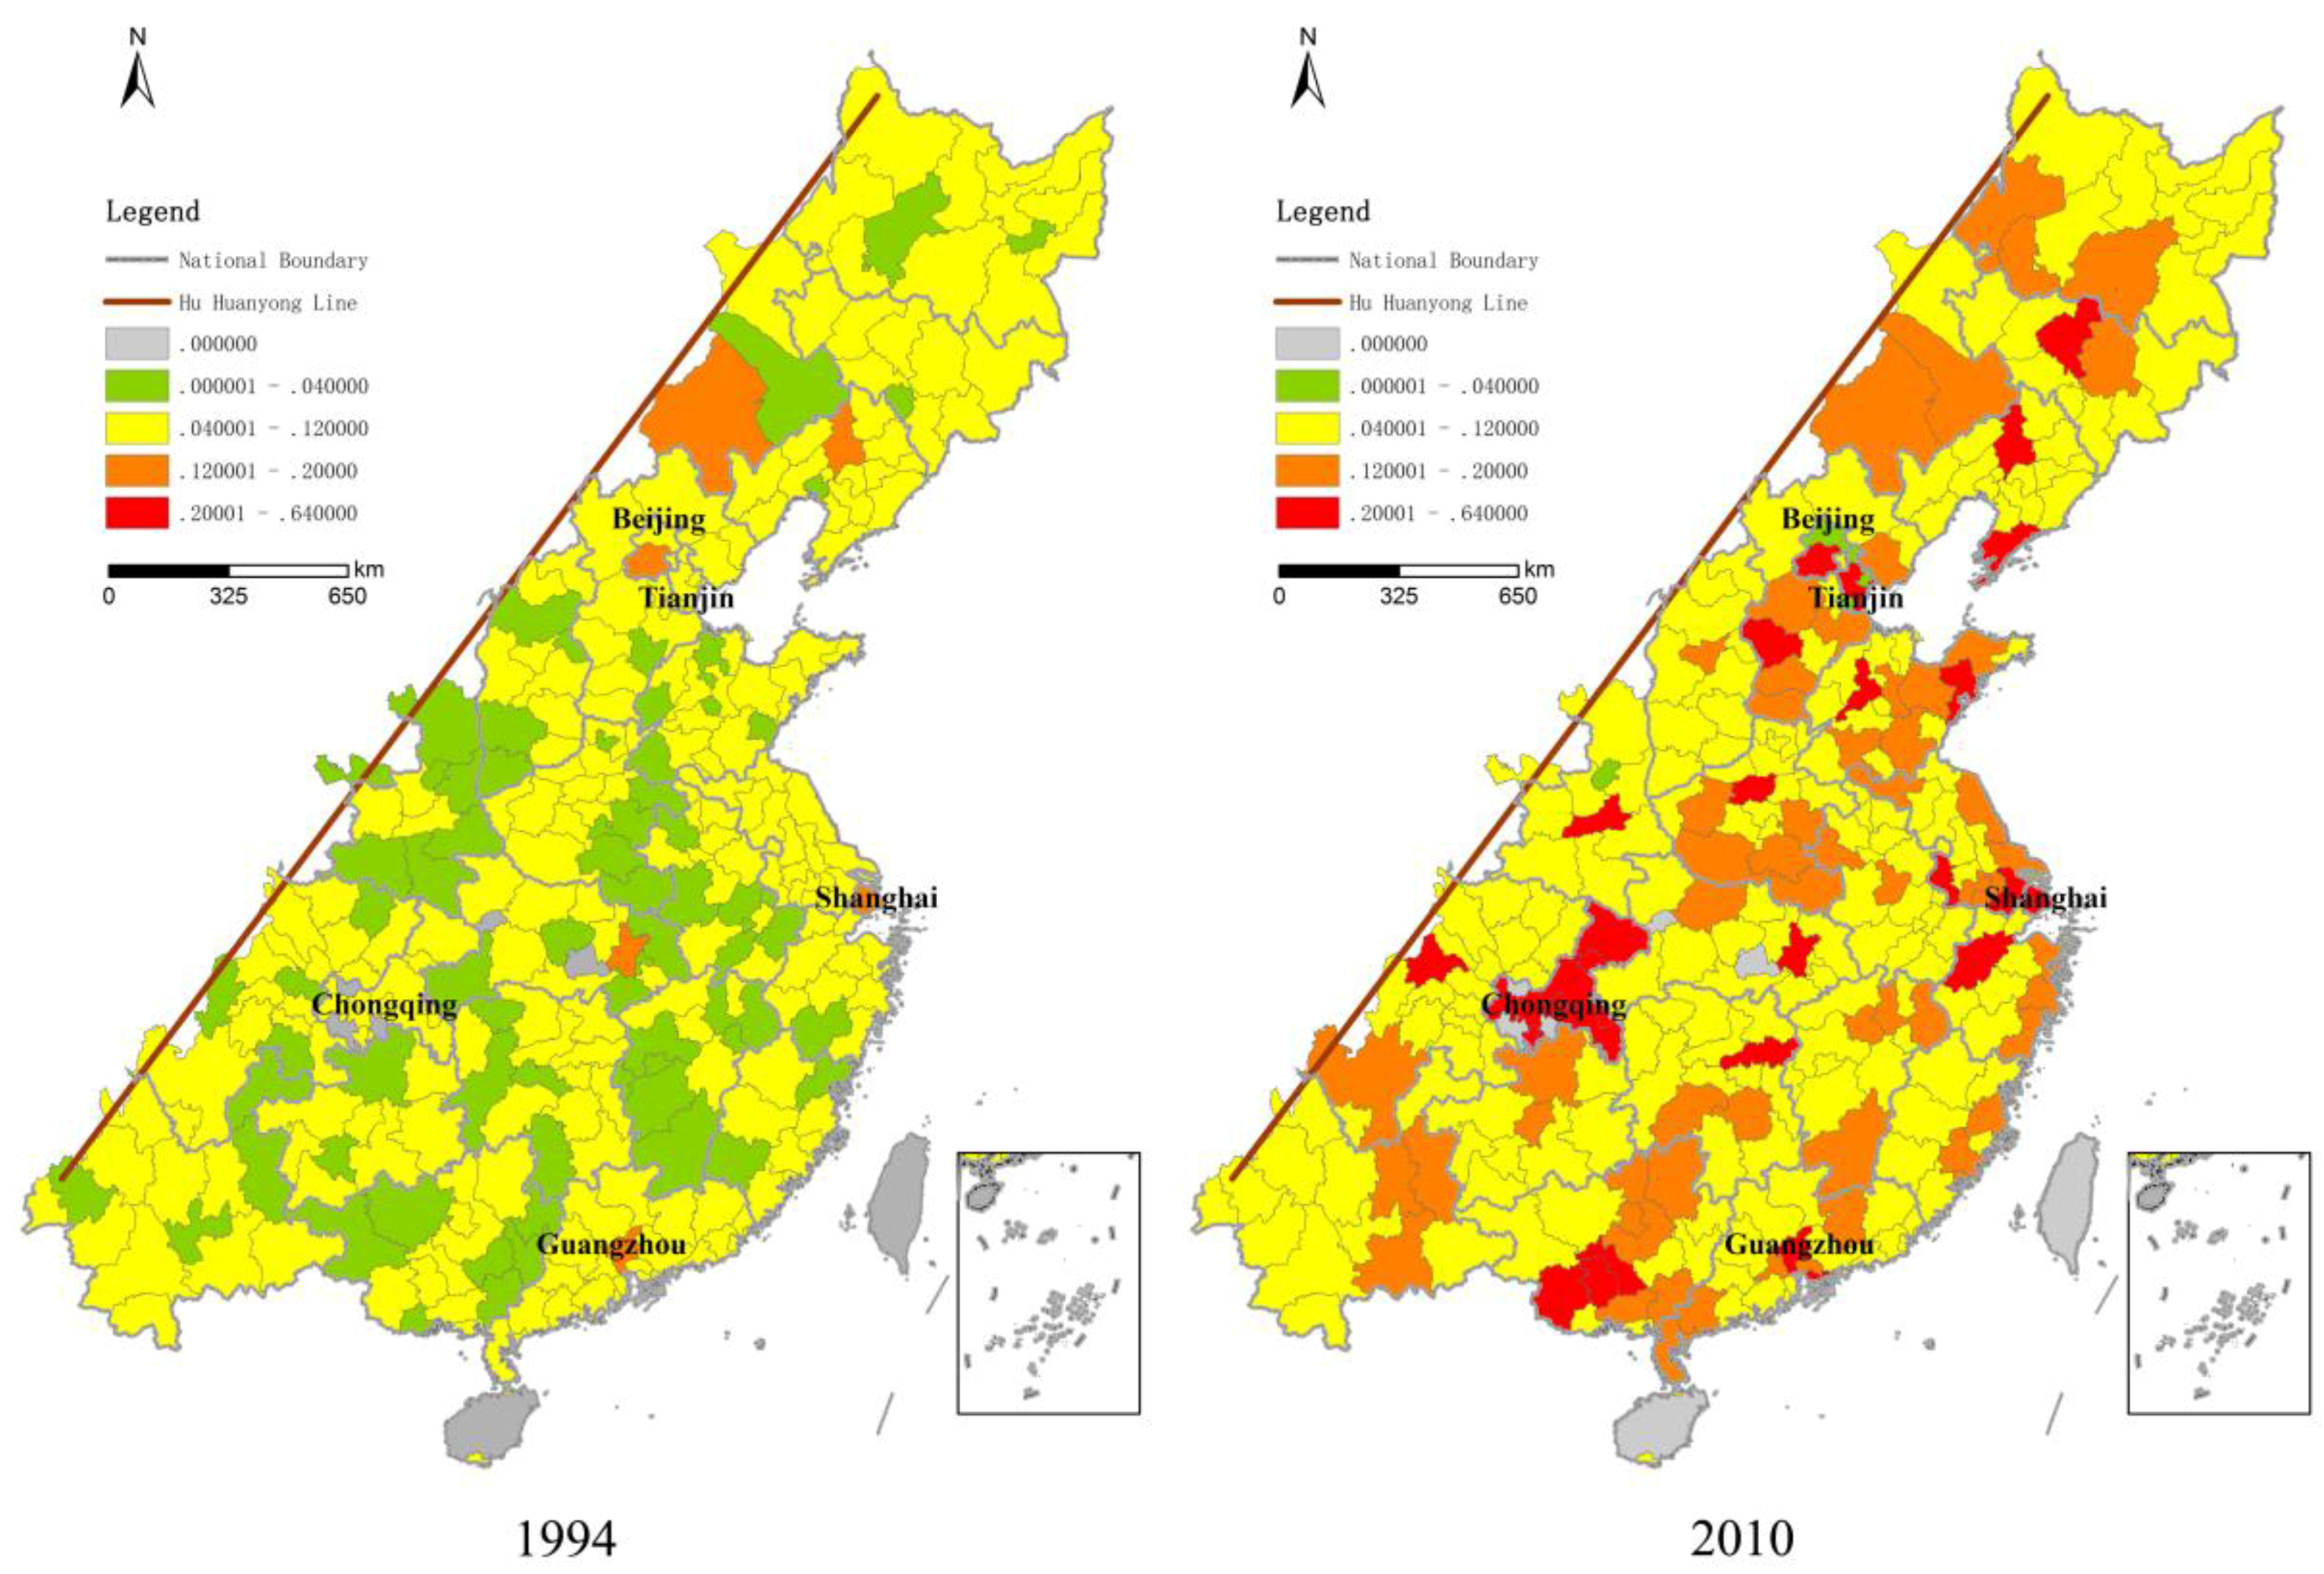
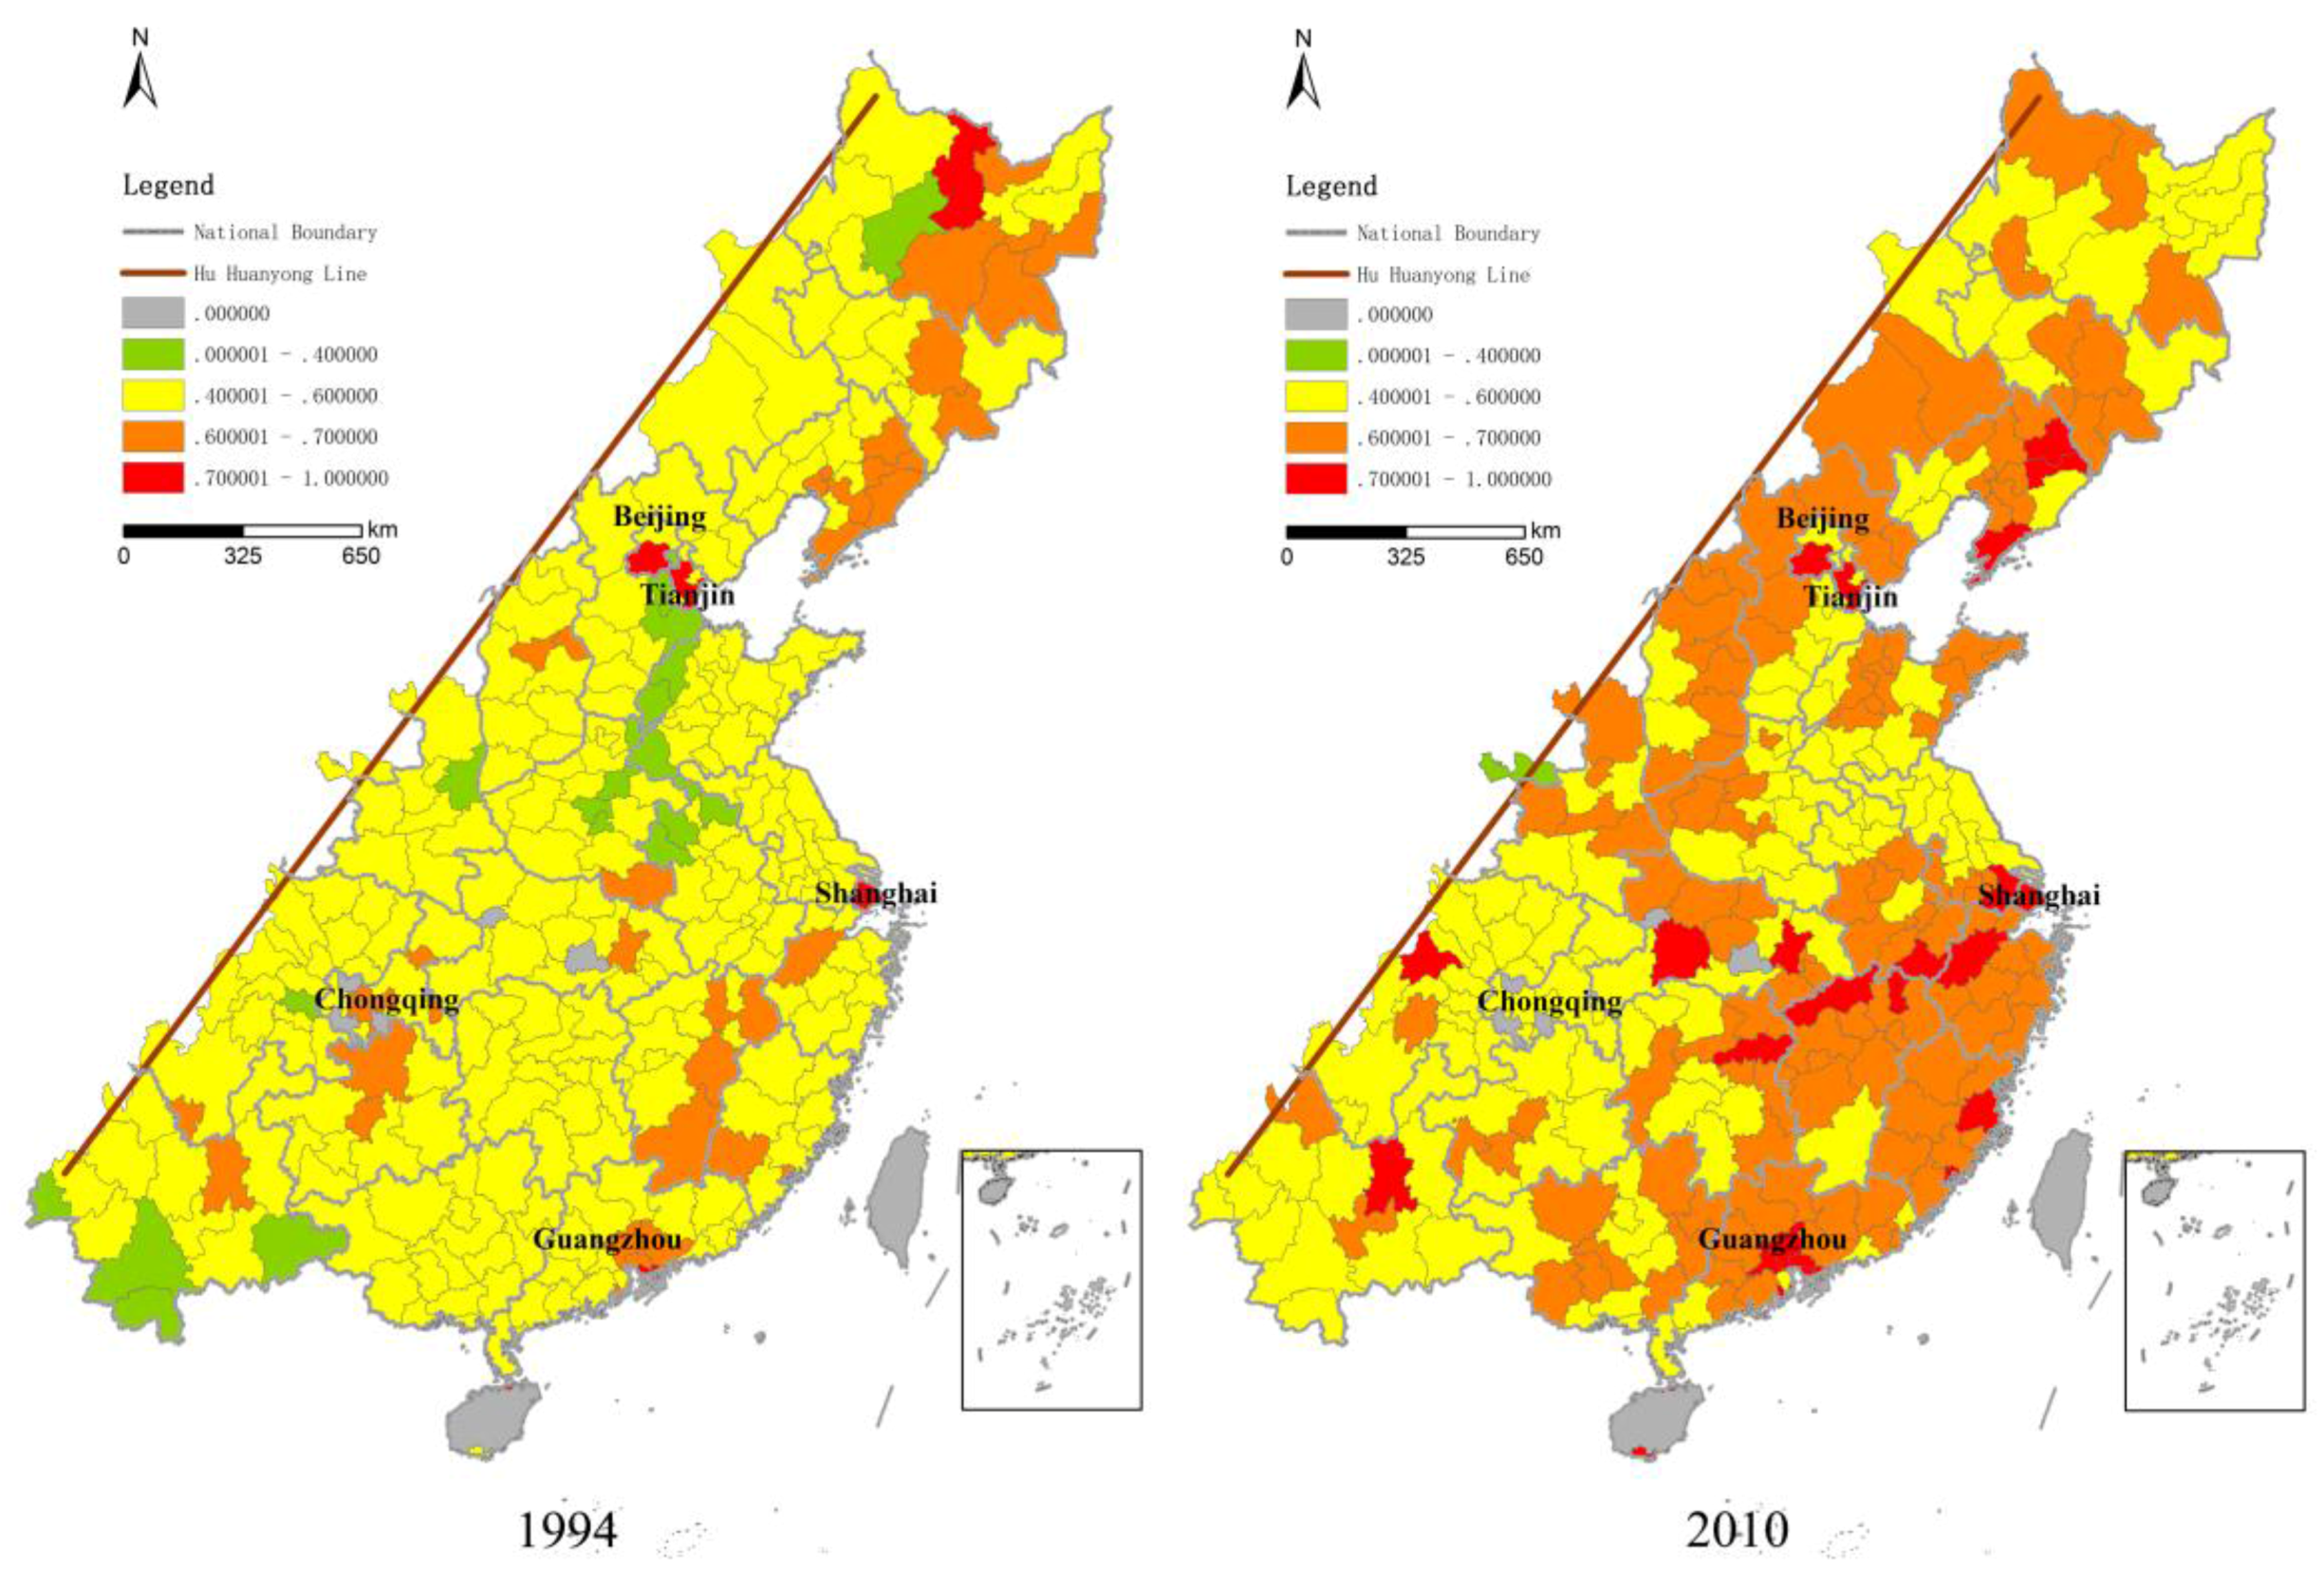
4.1. Spatial Patterns of the DI and TI
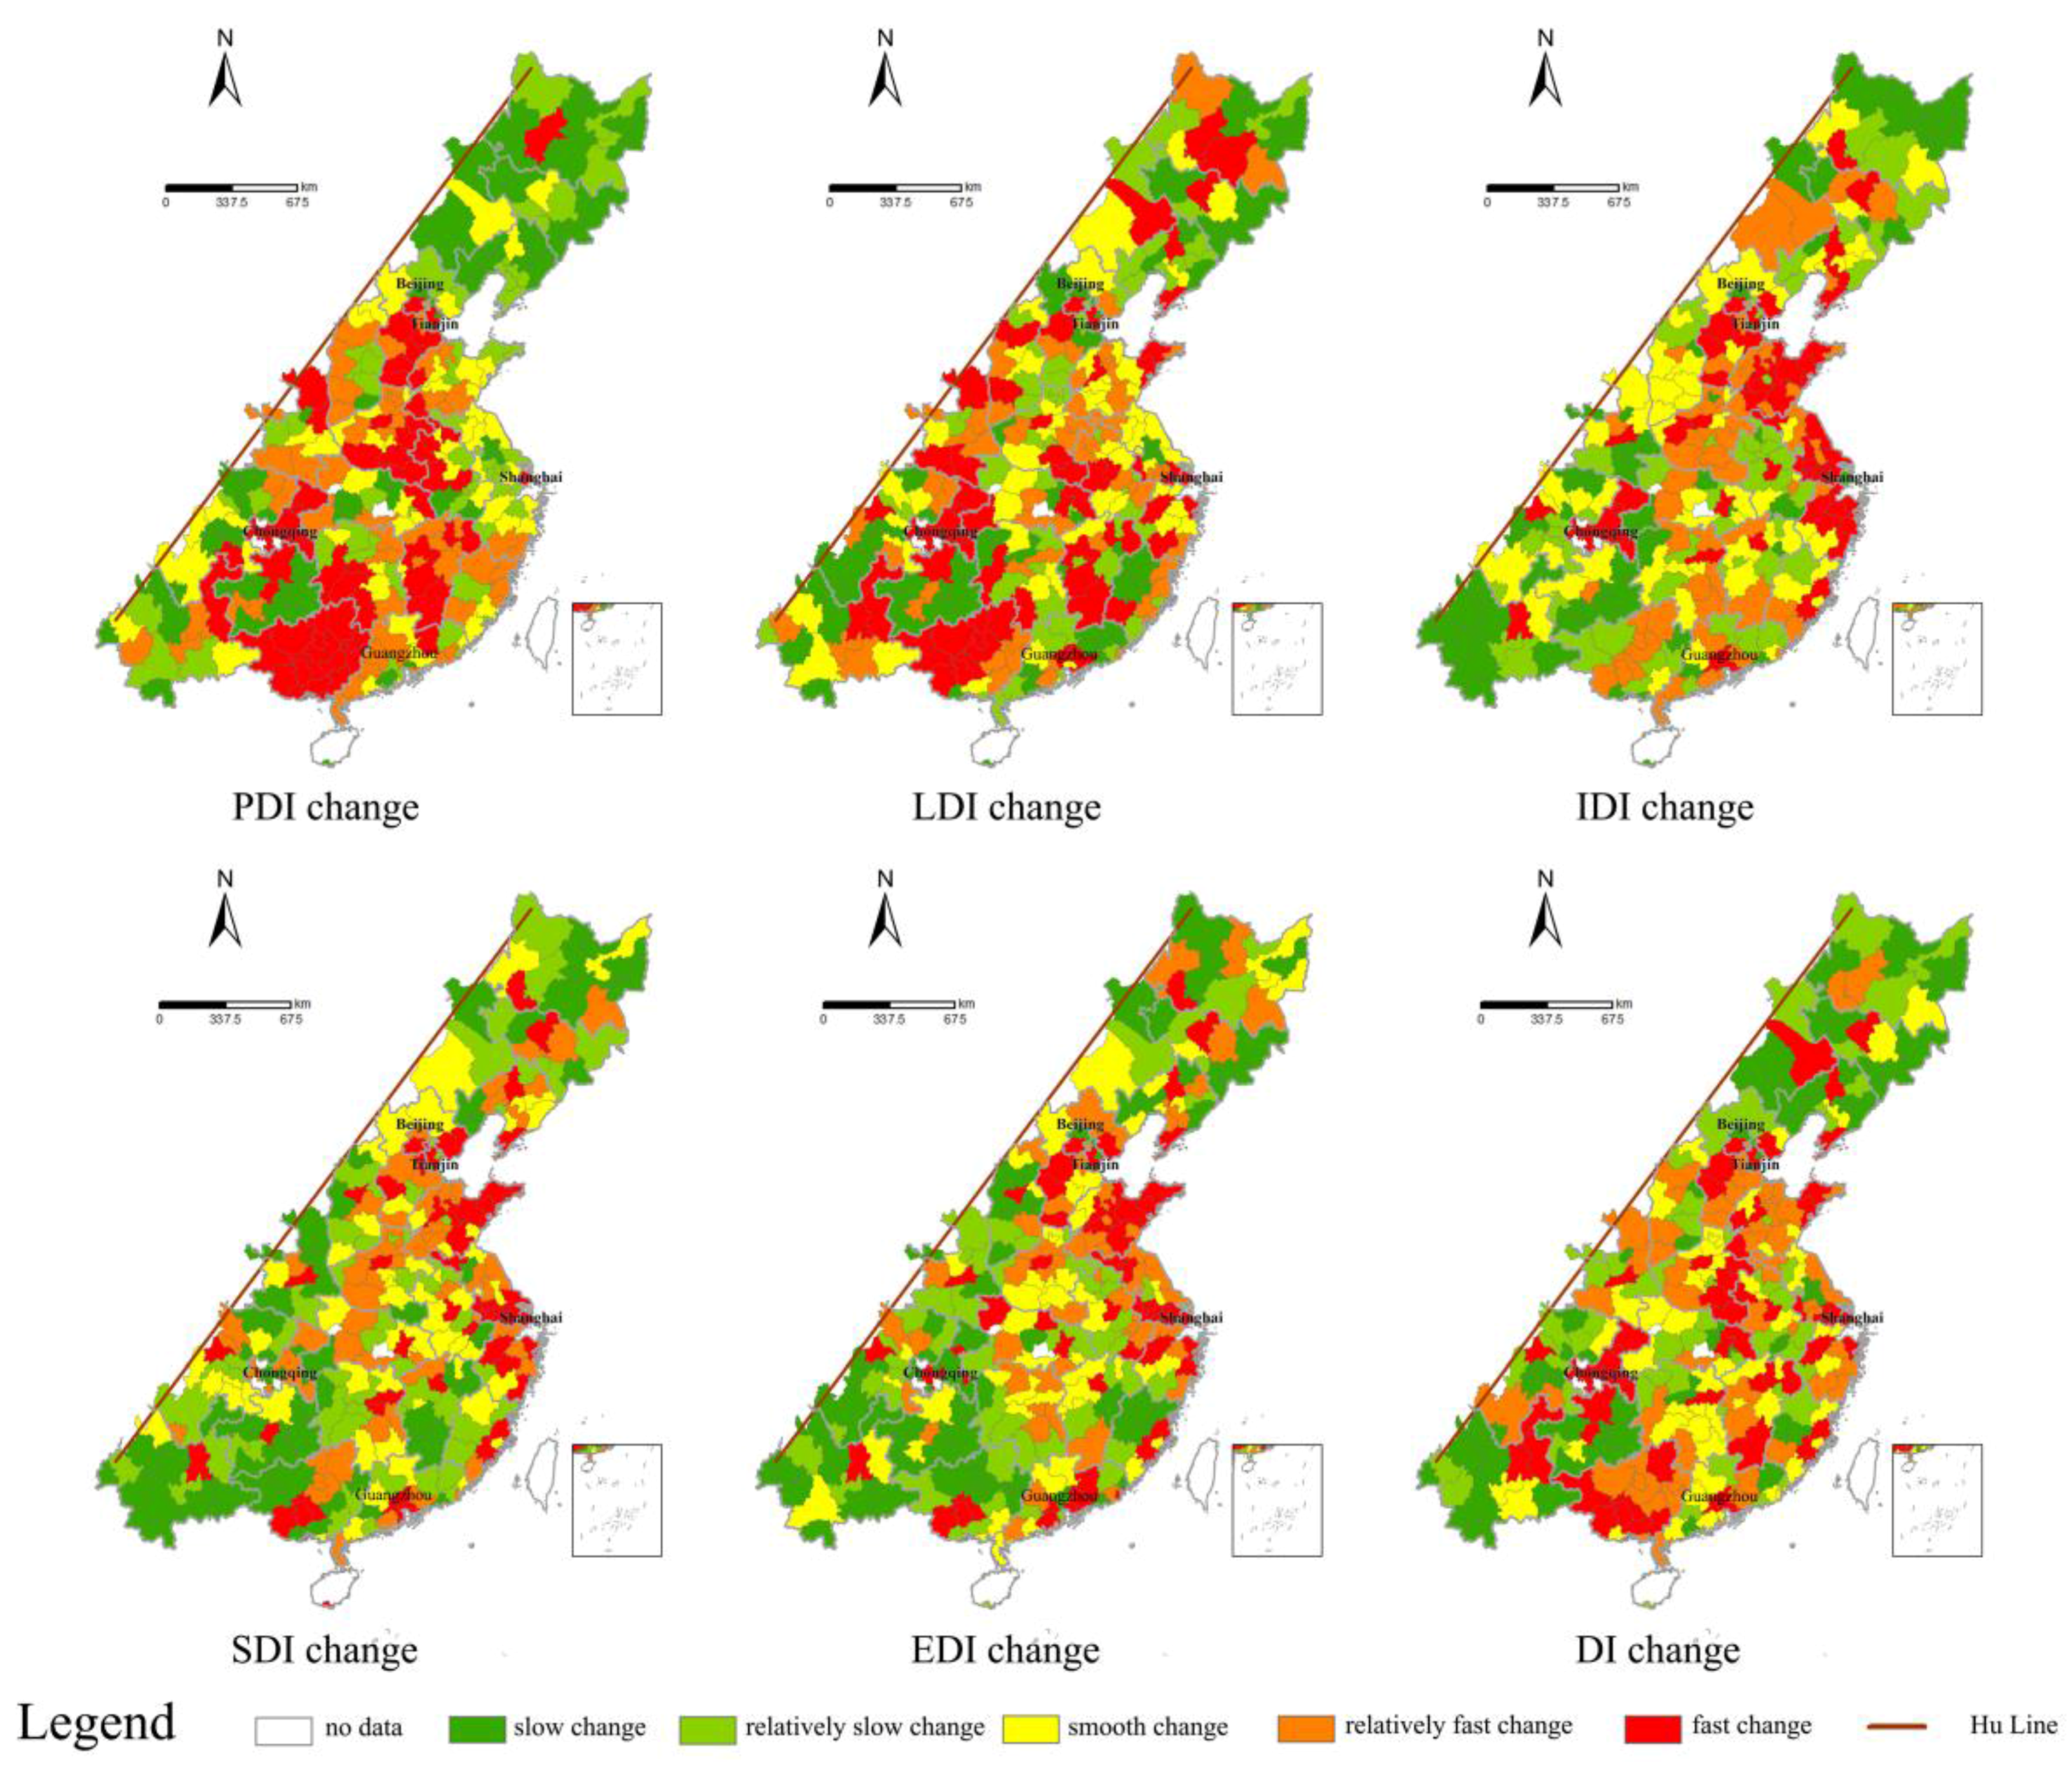
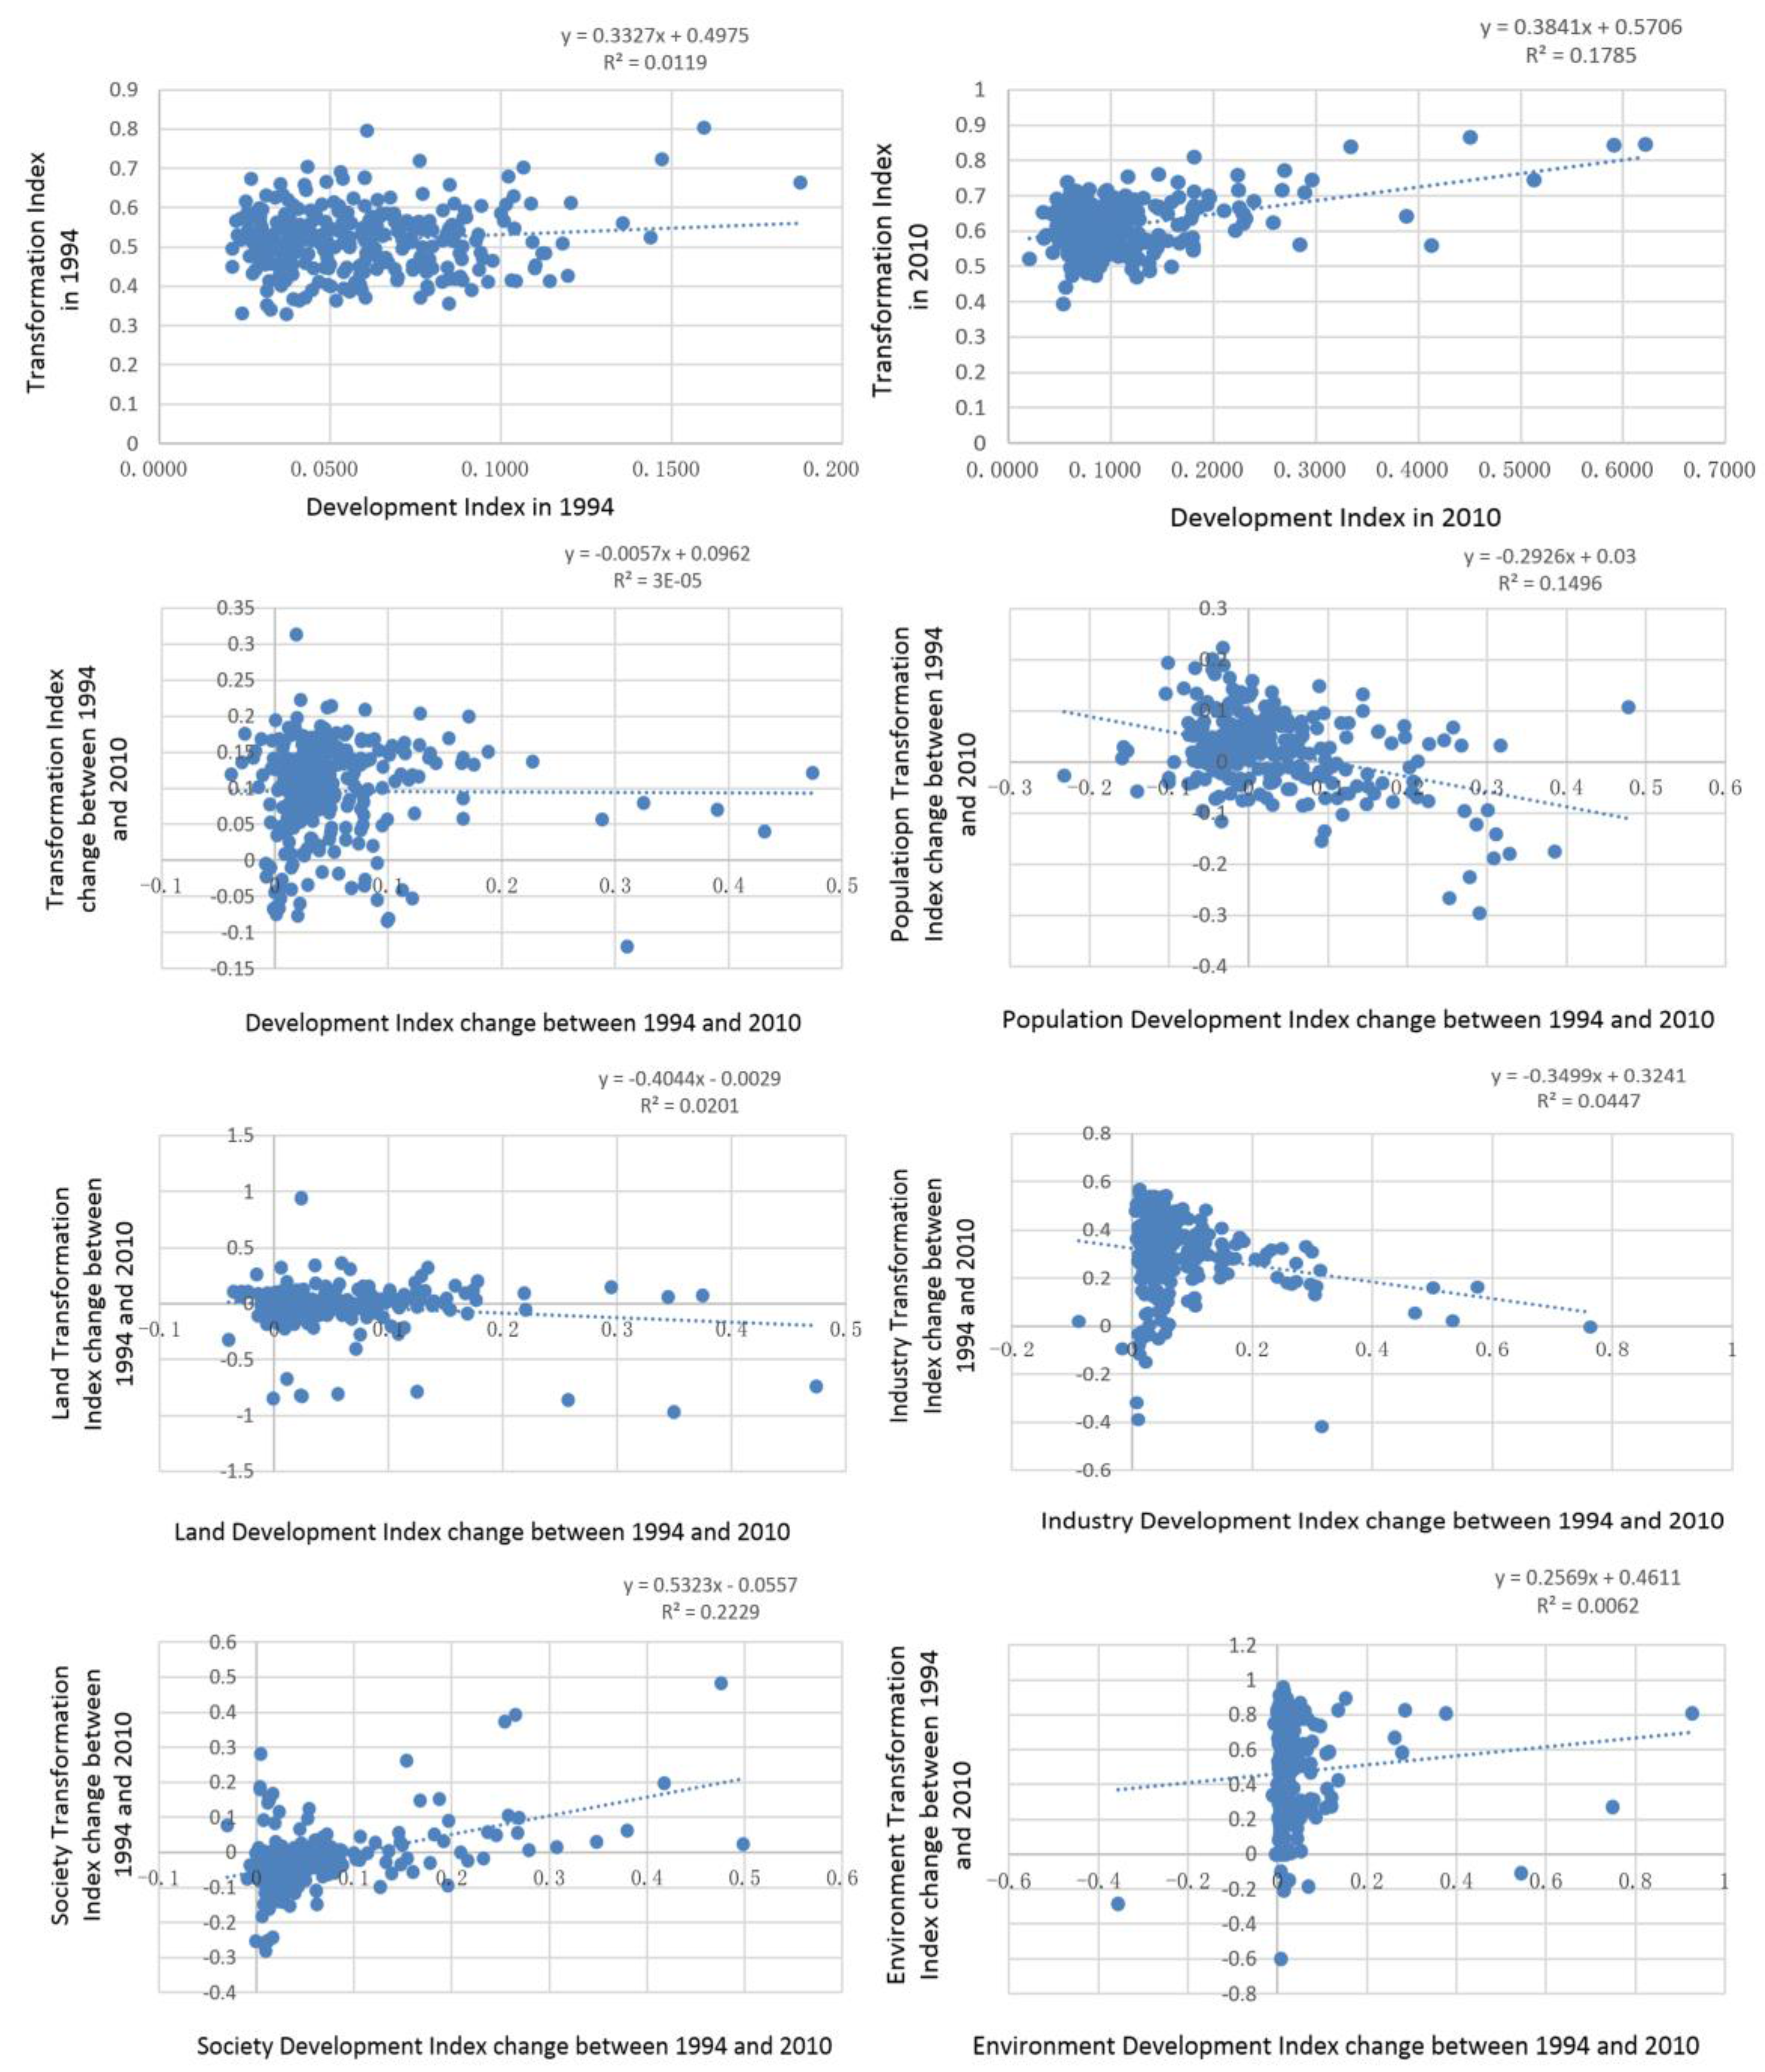
4.2. Spatio-Temporal Characteristics of Changes in the DI and TI Over Time
4.3. Spatio-Temporal Patterns of the DIs and TIs by Region
5. Conclusions
Acknowledgments
Author Contributions
Conflicts of Interest
References
- United Nations Development Programme. A Global Report: Reducing Disaster Risk a Challenge for Development; United Nations Development Programme: New York, NY, USA, 2004. [Google Scholar]
- Dilley, M.; Chen, R.S.; Deiehmann, U.; Lerner Lam, A.L.; Arnold, M. Natural Disaster Hotspots: A Global Risk Analysis; The Word Bank: Washington, DC, USA, 2005; p. 145. [Google Scholar]
- World Resources Institute. Millennium Ecosystem Assessment Synthesis Reports: Ecosystems and Human Well-Being; World Resources Institute: Washington, DC, USA, 2005. [Google Scholar]
- Tacoli, C.; Mabala, R. Exploring mobility and migration in the context of rural-urban linkages: Why gender and generation matter. Environ. Urban. 2010, 22, 389–395. [Google Scholar] [CrossRef]
- Victor, O.U.; Hope, E.N. Rural-urban “Symbiosis”, community self-help, and the new planning mandate: Evidence from Southeast Nigeria. Habitat Int. 2011, 35, 350–360. [Google Scholar] [CrossRef]
- Smith, D.P.; Higley, R. Circuits of education, rural gentrification, and family migration from the global city. J. Rural Stud. 2012, 28, 49–55. [Google Scholar] [CrossRef]
- Henderson, J.V.; Wang, H.G. Aspects of the rural-urban transformation of countries. J. Econ. Geogr. 2005, 5, 23–42. [Google Scholar] [CrossRef]
- Liu, Y.S.; Chen, Y.F.; Long, H.L. Regional diversity of peasant household response to new countryside construction based on field survey in eastern coastal China. J. Geogr. Sci. 2011, 21, 869–881. [Google Scholar] [CrossRef]
- Hardy, S.; Lloyd, G. An impossible dream? Sustainable regional economic and environmental development. Reg. Stud. 1994, 28, 773–780. [Google Scholar] [CrossRef]
- Sullivan, W.C.; Lovell, S.T. Improving the visual quality of commercial development at the rural-urban fringe. Landsc. Urban Plan. 2006, 77, 152–166. [Google Scholar] [CrossRef]
- Inwood, S.M.; Sharp, J.S. Farm persistence and adaptation at the rural-urban interface: Succession and farm adjustment. J. Rural Stud. 2011, 27, 107–117. [Google Scholar] [CrossRef]
- McGee, T.G. Managing the rural-urban transformation in East Asia in the 21st century. Sustain. Sci. 2008, 3, 155–167. [Google Scholar] [CrossRef]
- Long, H.L.; Liu, Y.S. Building new countryside in China: A geographical perspective. Land Use Policy 2010, 27, 457–470. [Google Scholar] [CrossRef]
- Liu, Y.S.; Fang, F.; Li, Y.H. Key issues of land use in China and implications for policy making. Land Use Policy 2014, 40, 6–12. [Google Scholar] [CrossRef]
- Siciliano, G. Urbanization strategies, rural development and land use changes in China: A multiple-level integrated assessment. Land Use Policy 2012, 29, 165–178. [Google Scholar] [CrossRef]
- Li, Z.G.; Wang, Y.L.; Zhou, Q.B.; Wu, J.S.; Peng, J.; Chang, H. Spatiotemporal variability of land surface moisture based on vegetation and temperature characteristics in Northern Shaanxi Loess Plateau, China. J. Arid Environ. 2008, 72, 974–985. [Google Scholar] [CrossRef]
- Long, H.L.; Woods, M. Rural restructuring under globalization in eastern coastal China: What can be learned from Wales? J. Rural Community Dev. 2011, 6, 70–94. [Google Scholar]
- Long, H.L.; Zou, J.; Pykett, J.; Li, Y.R. Analysis of rural transformation development in China since the turn of the new millennium. Appl. Geogr. 2011, 31, 1094–1105. [Google Scholar] [CrossRef]
- Li, Y.R.; Liu, Y.S.; Long, H.L.; Cui, W.G. Community-based rural residential land consolidation and allocation can help to revitalize hollowed villages in traditional agricultural areas of China: Evidence from Dancheng County, Henan Province. Land Use Policy 2014, 39, 188–198. [Google Scholar] [CrossRef]
- Liu, Y.S.; Lu, S.S.; Chen, Y.F. Spatio-temporal change of urban-rural equalized development patterns in China and its driving factors. J. Rural Stud. 2013, 23, 320–330. [Google Scholar] [CrossRef]
- Liu, Y.S.; Yang, R.; Long, H.L.; Gao, J.; Wang, J.Y. Implications of land-use change in rural China: A case study of Yucheng, Shandong province. Land Use Policy 2014, 40, 111–118. [Google Scholar] [CrossRef]
- Long, H.L. Land consolidation: An indispensable way of spatial restructuring in rural China. J. Geogr. Sci. 2014, 24, 211–225. [Google Scholar] [CrossRef]
- Long, H.L.; Heilig, G.K.; Li, X.B.; Zhang, M. Socio-economic development and land-use change: Analysis of rural housing land transition in the Transect of Yangtze River, China. Land Use Policy 2007, 24, 141–153. [Google Scholar] [CrossRef]
- Tayyebi, A.; Pekin, B.K.; Pijanowski, B.C.; Plourde, J.D.; Doucette, J.S.; Braun, D. Hierarchical modeling of urban growth across the conterminous USA: Developing meso-scale quantity drivers for the land transformation model. J. Land Use Sci. 2013, 8, 422–442. [Google Scholar] [CrossRef]
- Tayyebi, A.; Pijanowski, B.C.; Linderman, M.; Gratton, C. Comparing three global parametric and local non-parametric models to simulate land use change in diverse areas of the world. Environ. Model. Softw. 2014, 59, 202–221. [Google Scholar] [CrossRef]
- Long, H.L.; Liu, Y.Q.; Hou, X.G.; Li, T.T.; Li, Y.R. Effects of land use transitions due to rapid urbanization on ecosystem services: Implications for urban planning in the new developing area of China. Habitat Int. 2014, 44, 536–544. [Google Scholar] [CrossRef]
- Long, H.L. Differentiation of rural development driven by industrialization and urbanization in eastern coastal China. Habitat Int. 2009, 33, 454–462. [Google Scholar] [CrossRef]
- Liu, Y.S.; Chen, C.; Li, Y.R. Differentiation regularity of urban-rural equalized development at prefecture-level city in China. J. Geogr. Sci. 2015, 25, 1075–1088. [Google Scholar] [CrossRef]
- Li, Y.H. Urban-Rural Relations in China: A Study of the Beijing-Tianjin-Hebei Metropolitan Region. Ph.D. Thesis, KTH Royal Institute of Technology, Stockholm, Sweden, 2011. [Google Scholar]
- Liu, Y.S.; Hu, Z.C.; Li, Y.H. Process and cause of urban-rural development transformation in the Bohai Rim Region, China. J. Geogr. Sci. 2014, 24, 1147–1160. [Google Scholar] [CrossRef]
- Kim, J.; Rejmánková, E. The paleoecological record of human disturbance in wetlands of the Lake Tahoe Basin. J. Paleolimnol. 2001, 25, 437–454. [Google Scholar] [CrossRef]
- Valero-Garcés, B.L.; González-Sampériz, P.; Navas, A.; Machín, J.; Mata, P.; Delgado-Huertas, A.; Bao, R.; Moreno, A.; Carrión, J.S.; Schwalb, A.; et al. Human impact since medieval times and recent ecological restorationin a Mediterranean Lake: The Laguna Zoñar, Southern Spain. J. Paleolimnol. 2006, 35, 441–465. [Google Scholar] [CrossRef]
- Dou, H.Y.; Zhao, X.Y. Climate change and its human dimensions based on GIS and meteorological statistics in Pearl River Delta, Southern China. Meteorol. Appl. 2010, 18, 111–122. [Google Scholar] [CrossRef]
- Li, S.C.; Zhao, Z.Q.; Xie, M.M.; Wang, Y.L. Investigating spatial non-stationary and scale-dependent relationships between urban surface temperature and environmental factors using geographically weighted regression. Environ. Model. Softw. 2010, 25, 1789–1800. [Google Scholar] [CrossRef]
- Gao, J.B.; Li, S.C. Detecting spatially non-stationary and scale-dependent relationships between urban landscape fragmentation and related factors using Geographically Weighted Regression. Appl. Geogr. 2011, 31, 292–302. [Google Scholar] [CrossRef]
- Ólafsdóttir, R.; Dowling, R. Geotourism and geoparks—A tool for geoconservation and rural development in vulnerable environments: A case study from Iceland. Geoheritage 2014, 6, 71–87. [Google Scholar] [CrossRef]
- Smith, N.R. Beyond top-down/bottom-up: Village transformation on China’s urban edge. Cities 2014, 41, 209–220. [Google Scholar] [CrossRef]
- Yan, J.M.; Xia, F.Z.; Bao, H.X.H. Strategic planning framework for land consolidation in China: A top-level design based on SWOT analysis. Habitat Int. 2015, 48, 46–54. [Google Scholar] [CrossRef]
- Lewis, W.A. The Theory of Economic Growth: A “Classical” Perspective; Edward Elgar Publishing: Northampton, MA, USA, 1955. [Google Scholar]
- Saaty, T.L. How to make a decision: The analytic hierarchy process. Eur. J. Oper. Res. 1990, 48, 9–26. [Google Scholar] [CrossRef]
- Tayyebi, A.; Pijanowski, B.C. Modeling multiple land use changes using ANN, CART and MARS: Comparing tradeoffs in goodness of fit and explanatory power of data mining tools. Int. J. Appl. Earth Obse. Geoinf. 2014, 28, 102–116. [Google Scholar] [CrossRef]
- Yunus, A.P.; Dou, J.; Sravanthi, N. Remote sensing of chlorophyll-a as a measure of red tide in Tokyo Bay using hotspot analysis. Remote Sens. Appl. Soc. Environ. 2015, 2, 11–25. [Google Scholar] [CrossRef]
- Kohonen, T. Self-organized formation of topologically correct feature maps. Biol. Cybern. 1982, 43, 59–69. [Google Scholar] [CrossRef]
- Tayyebi, A.; Pijanowski, B.C.; Pekin, B.K. Land use legacies of the Ohio River Basin: Using a spatially explicit land use change model to assess past and future impacts on aquatic resources. Appl. Geogr. 2015, 57, 100–111. [Google Scholar] [CrossRef]
- National Bureau of Statistics of China (NBSC). China City Statistical Yearbook; China Statistics Press: Beijing, China, 1995. (In Chinese) [Google Scholar]
- National Bureau of Statistics of China (NBSC). China City Statistical Yearbook; China Statistics Press: Beijing, China, 2011. (In Chinese) [Google Scholar]
- Population Census Office under the State Council of China. The 1990 Population Census of the People’s Republic of China; China Statistics Press: Beijing, China, 1991. (In Chinese) [Google Scholar]
- Population Census Office under the State Council of China. The 2010 Population Census of the People’s Republic of China; China Statistics Press: Beijing, China, 2011. (In Chinese) [Google Scholar]


| Chief Target Layer | Target Layer | Criterion Layer | Weight | Direction |
|---|---|---|---|---|
| Urban-rural Development Index (DI) | Population Development Index (PDI) | Total population | 0.67 | + |
| The natural population growth rate | 0.33 | + | ||
| Land Development Index (LDI) | Land area of administrative region | 0.44 | + | |
| Built-up area | 0.56 | + | ||
| Industry Development Index (IDI) | Regional GDP | 0.53 | + | |
| Non-agricultural output | 0.47 | + | ||
| Society Development Index (SDI) | Total retail sales of consumer goods | 0.22 | + | |
| College students per 10,000 people | 0.28 | + | ||
| Number of beds in health institutions | 0.25 | + | ||
| Residential electricity consumption | 0.25 | + | ||
| Environment Development Index (EDI) | Green land area | 1 | + | |
| Urban-rural Transformation Index (TI) | Population Transformation Index (PTI) | Proportion of non-agricultural population | 0.27 | + |
| Proportion of labor force | 0.25 | + | ||
| Average education level | 0.24 | + | ||
| Degree of population aging | 0.24 | − | ||
| Land Transformation Index (LTI) | Proportion of rural construction land | 1 | − | |
| Industry Transformation Index (ITI) | Proportion of non-agricultural output | 0.5 | + | |
| Proportion of non-agricultural employment | 0.5 | − | ||
| Society Transformation Index (STI) | Income gap between urban and rural residents | 0.35 | − | |
| Public library collection per 100 people | 0.35 | + | ||
| The actual use of foreign capital amount | 0.3 | + | ||
| Environment Transformation Index (ETI) | Domestic sewage treatment rate | 1 | + |
| Population DI | Land DI | Industry DI | Society DI | Environment DI | ||
|---|---|---|---|---|---|---|
| Population DI | Pearson correlation coefficient | 1.000 | 0.397 ** | 0.362 ** | 0.338 ** | 0.260 ** |
| Land DI | Pearson correlation coefficient | 0.397 ** | 1.000 | 0.612 ** | 0.602 ** | 0.584 ** |
| Industry DI | Pearson correlation coefficient | 0.362 ** | 0.612 ** | 1.000 | 0.849 ** | 0.718 ** |
| Society DI | Pearson correlation coefficient | 0.338 ** | 0.602 ** | 0.849 ** | 1.000 | 0.740 ** |
| Environment DI | Pearson correlation coefficient | 0.260 ** | 0.584 ** | 0.718 ** | 0.740 ** | 1.000 |
| Population TI | Land TI | Industry TI | Society TI | Environment TI | ||
|---|---|---|---|---|---|---|
| Population TI | Pearson correlation coefficient | 1.000 | 0.218 ** | 0.526 ** | 0.527 ** | 0.357 ** |
| Land TI | Pearson correlation coefficient | 0.218 ** | 1.000 | 0.093 | 0.032 | −0.105 |
| Industry TI | Pearson correlation coefficient | 0.526 ** | 0.093 | 1.000 | 0.217 ** | 0.440 ** |
| Society TI | Pearson correlation coefficient | 0.527 ** | 0.032 | 0.217 ** | 1.000 | 0.286 ** |
| Environment TI | Pearson correlation coefficient | 0.357 ** | −0.105 | 0.440 ** | 0.286 ** | 1.000 |
© 2016 by the authors; licensee MDPI, Basel, Switzerland. This article is an open access article distributed under the terms and conditions of the Creative Commons by Attribution (CC-BY) license (http://creativecommons.org/licenses/by/4.0/).
Share and Cite
Hu, Z.; Wang, Y.; Liu, Y.; Long, H.; Peng, J. Spatio-Temporal Patterns of Urban-Rural Development and Transformation in East of the “Hu Huanyong Line”, China. ISPRS Int. J. Geo-Inf. 2016, 5, 24. https://doi.org/10.3390/ijgi5030024
Hu Z, Wang Y, Liu Y, Long H, Peng J. Spatio-Temporal Patterns of Urban-Rural Development and Transformation in East of the “Hu Huanyong Line”, China. ISPRS International Journal of Geo-Information. 2016; 5(3):24. https://doi.org/10.3390/ijgi5030024
Chicago/Turabian StyleHu, Zhichao, Yanglin Wang, Yansui Liu, Hualou Long, and Jian Peng. 2016. "Spatio-Temporal Patterns of Urban-Rural Development and Transformation in East of the “Hu Huanyong Line”, China" ISPRS International Journal of Geo-Information 5, no. 3: 24. https://doi.org/10.3390/ijgi5030024
APA StyleHu, Z., Wang, Y., Liu, Y., Long, H., & Peng, J. (2016). Spatio-Temporal Patterns of Urban-Rural Development and Transformation in East of the “Hu Huanyong Line”, China. ISPRS International Journal of Geo-Information, 5(3), 24. https://doi.org/10.3390/ijgi5030024