1. Introduction
Hospital performance and patient safety are central concerns for health systems worldwide. According to the Global Patient Safety Report 2024 by the World Health Organization (WHO), unsafe care causes more than 3 million deaths annually worldwide [
1]. In low- and middle-income countries alone, 134 million adverse events occur annually in hospitals, leading to an estimated 2.6 million deaths. While considerable attention has been paid to improving patient safety in high-income settings, critical gaps exist in hospital performance and patient safety culture in low- and middle-income countries due to limited capacity and health budget constraints [
2].
Indonesia is the world’s fourth most populous country and has a decentralized healthcare system [
3]. According to the Indonesia Health Profile 2024, there are 3288 hospital facilities nationwide, each with distinct ownership, administrative class, hospital type, and accreditation status,- all of which may influence care quality in distinct ways [
4]. Approximately 95.3% of hospitals are accredited [
4], though average compliance with national quality indicator reporting remains around 69% [
5]. Hence, accreditation status alone does not guarantee full compliance with hospitals’ performance or patient safety outcomes. Analyses of reporting compliance have further revealed significant variation across provinces and hospital classes [
6]. Additionally, there is evidence of variation in healthcare outcomes at the district level [
7,
8]. Such heterogeneity raises important questions about whether these disparities in hospital performance and patient safety follow a geographic pattern at the hospital or district scale.
Geospatial methods offer a powerful approach to answering this question. Geographic information systems (GIS) have been applied extensively to investigate healthcare systems from various perspectives. For instance, Cuadros et al. [
9] used GIS for early detection and management of viral outbreaks. Similarly, Weiland et al. [
10] identified geographical inequalities that led to avoidable infant mortality. Furthermore, Moragues et al. [
11] investigated the accessibility of public hospital services in Mallorca using GIS. Recent applications of GIS for public health also include research assessing spatial accessibility and equity of public hospitals for older adults in Shanghai [
12]. Notably, GIS-based approaches were adopted widely and rapidly in response to COVID-19, underscoring the usefulness of spatial analysis for public health [
13,
14]. Additional evidence supports the application of GIS in public health research across a wide range of countries, including Japan [
15], Pakistan [
16], and Canada [
17]. However, despite this growing adoption, its application to hospital performance and patient safety outcomes is lacking in the Indonesian context.
The spatial autocorrelation technique belongs to the spatial statistics component of GIS. Global Moran’s I and local Moran’s I are two main types of spatial autocorrelation analysis. Global Moran’s I measures overall data trends across the whole study area, whereas local Moran’s I identifies specific pockets or clusters of hotspots and cold spots in a localized context. If applied in healthcare research, it enables the detection of non-random geographic clustering in health outcomes, thereby identifying hotspots of elevated risk or concentrated underperformance [
9,
10]. Previous studies have demonstrated the usefulness of spatial autocorrelation in measuring healthcare resource distribution and workforce allocation [
18,
19]. A study by Wu and Liu (2026) [
20] employed local Moran’s I and identified geographic clusters of surgical complications. Moreover, a study conducted in Taiwan used spatial autocorrelation to describe and map spatial clusters of leading causes of death in Taiwan [
21]. Despite the growing application, the use of spatial autocorrelation methods to assess hospital performance and patient safety outcomes remains limited, particularly in low- and middle-income country contexts.
Against the backdrop of this gap, the aim of this study was to identify and visualize spatial clustering of hospital performance and patient safety outcomes. This study addresses its objectives by conducting a comprehensive spatial analysis of 428 hospitals across East Java province. Standardized composite indices of hospital performance and mortality-oriented patient safety outcomes are constructed from routinely collected indicators including bed occupancy rate (BOR), average length of stay (ALOS), bed turnover (BTO), gross death rate (GDR), and net death rate (NDR). These indices are used in conjunction with spatial autocorrelation analysis to examine whether hospital performance and mortality-oriented patient safety outcomes are spatially clustered at the hospital or district scale. The findings have direct relevance for health system planners seeking to identify geographical disparities, strengthen quality governance, and prioritize regulatory efforts where risk is greatest.
2. Materials and Methods
2.1. Study Area
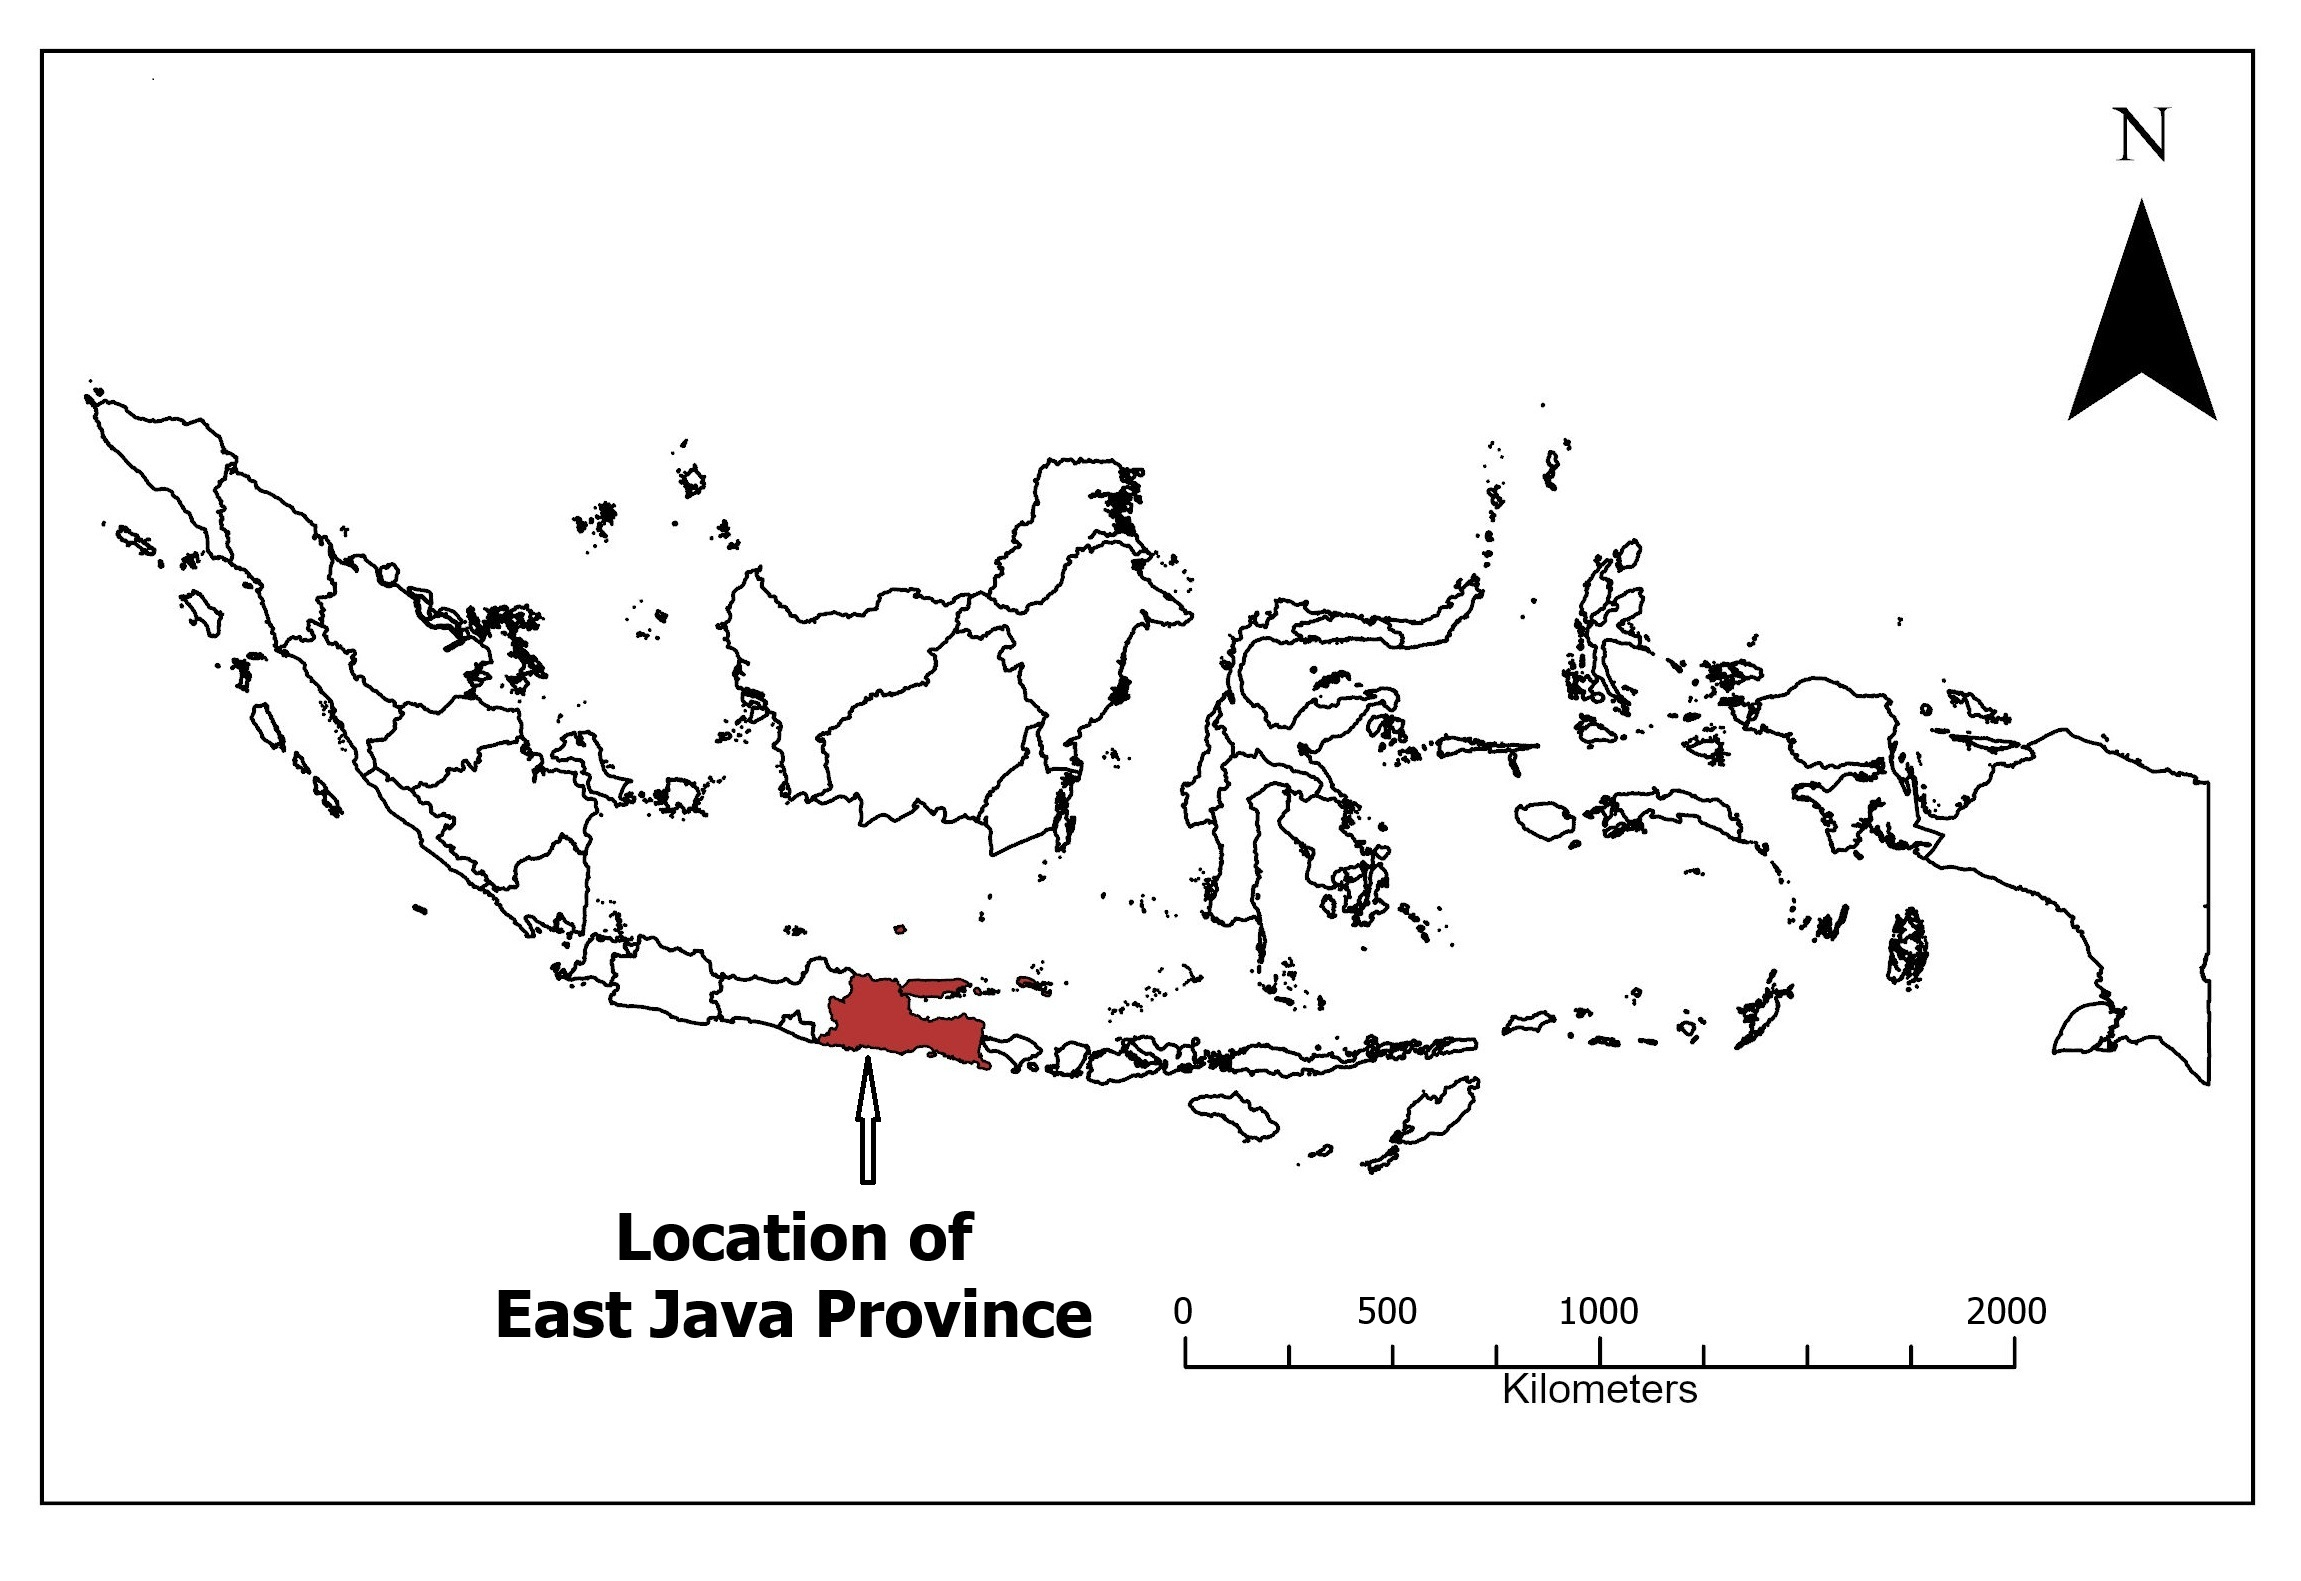
This research was conducted in East Java province, one of Indonesia’s 38 provinces (
Figure 1). It is among the most populous provinces and has the highest concentration of hospitals as well as specialist and advanced services [
22]. The hospital network in East Java is structurally diverse, spanning urban centers and rural districts while covering a broad spectrum of ownership types, accreditation levels, and class categories. These characteristics make East Java an ideal place to investigate whether geographic inequalities manifest in hospital performance and mortality-oriented patient safety outcomes.
2.2. Data Acquisition and Explanation of Variables
Data for the year 2024 (annual aggregate) were obtained from the East Java Provincial Health Office. These data are collected as part of monthly reports submitted by hospitals to the provincial authorities. The dataset comprised 445 hospitals, each listed with hospital identification variables, institutional attributes, hospital performance indicators, and patient safety indicators. All indicators and their definitions are listed in
Table 1.
2.3. Data Cleaning and Preprocessing
The data were stored in a spreadsheet. Using filtering and visualization, nine hospitals were found to have missing data relating to hospital performance and patient safety indicators; these hospitals were excluded from further analysis. Additionally, eight hospitals were identified as “newly opened” hospitals using the remarks column. As these hospitals were new, their values against indicators were zero and were excluded from further analysis. Ultimately, 428 hospitals remained and were included in the final analysis.
Further, the 17 types of ownership were grouped into 6 analytically meaningful ownership groups: private sector, local government, central government, faith-based organizations, social/non-governmental organizations (NGOs), and military and police.
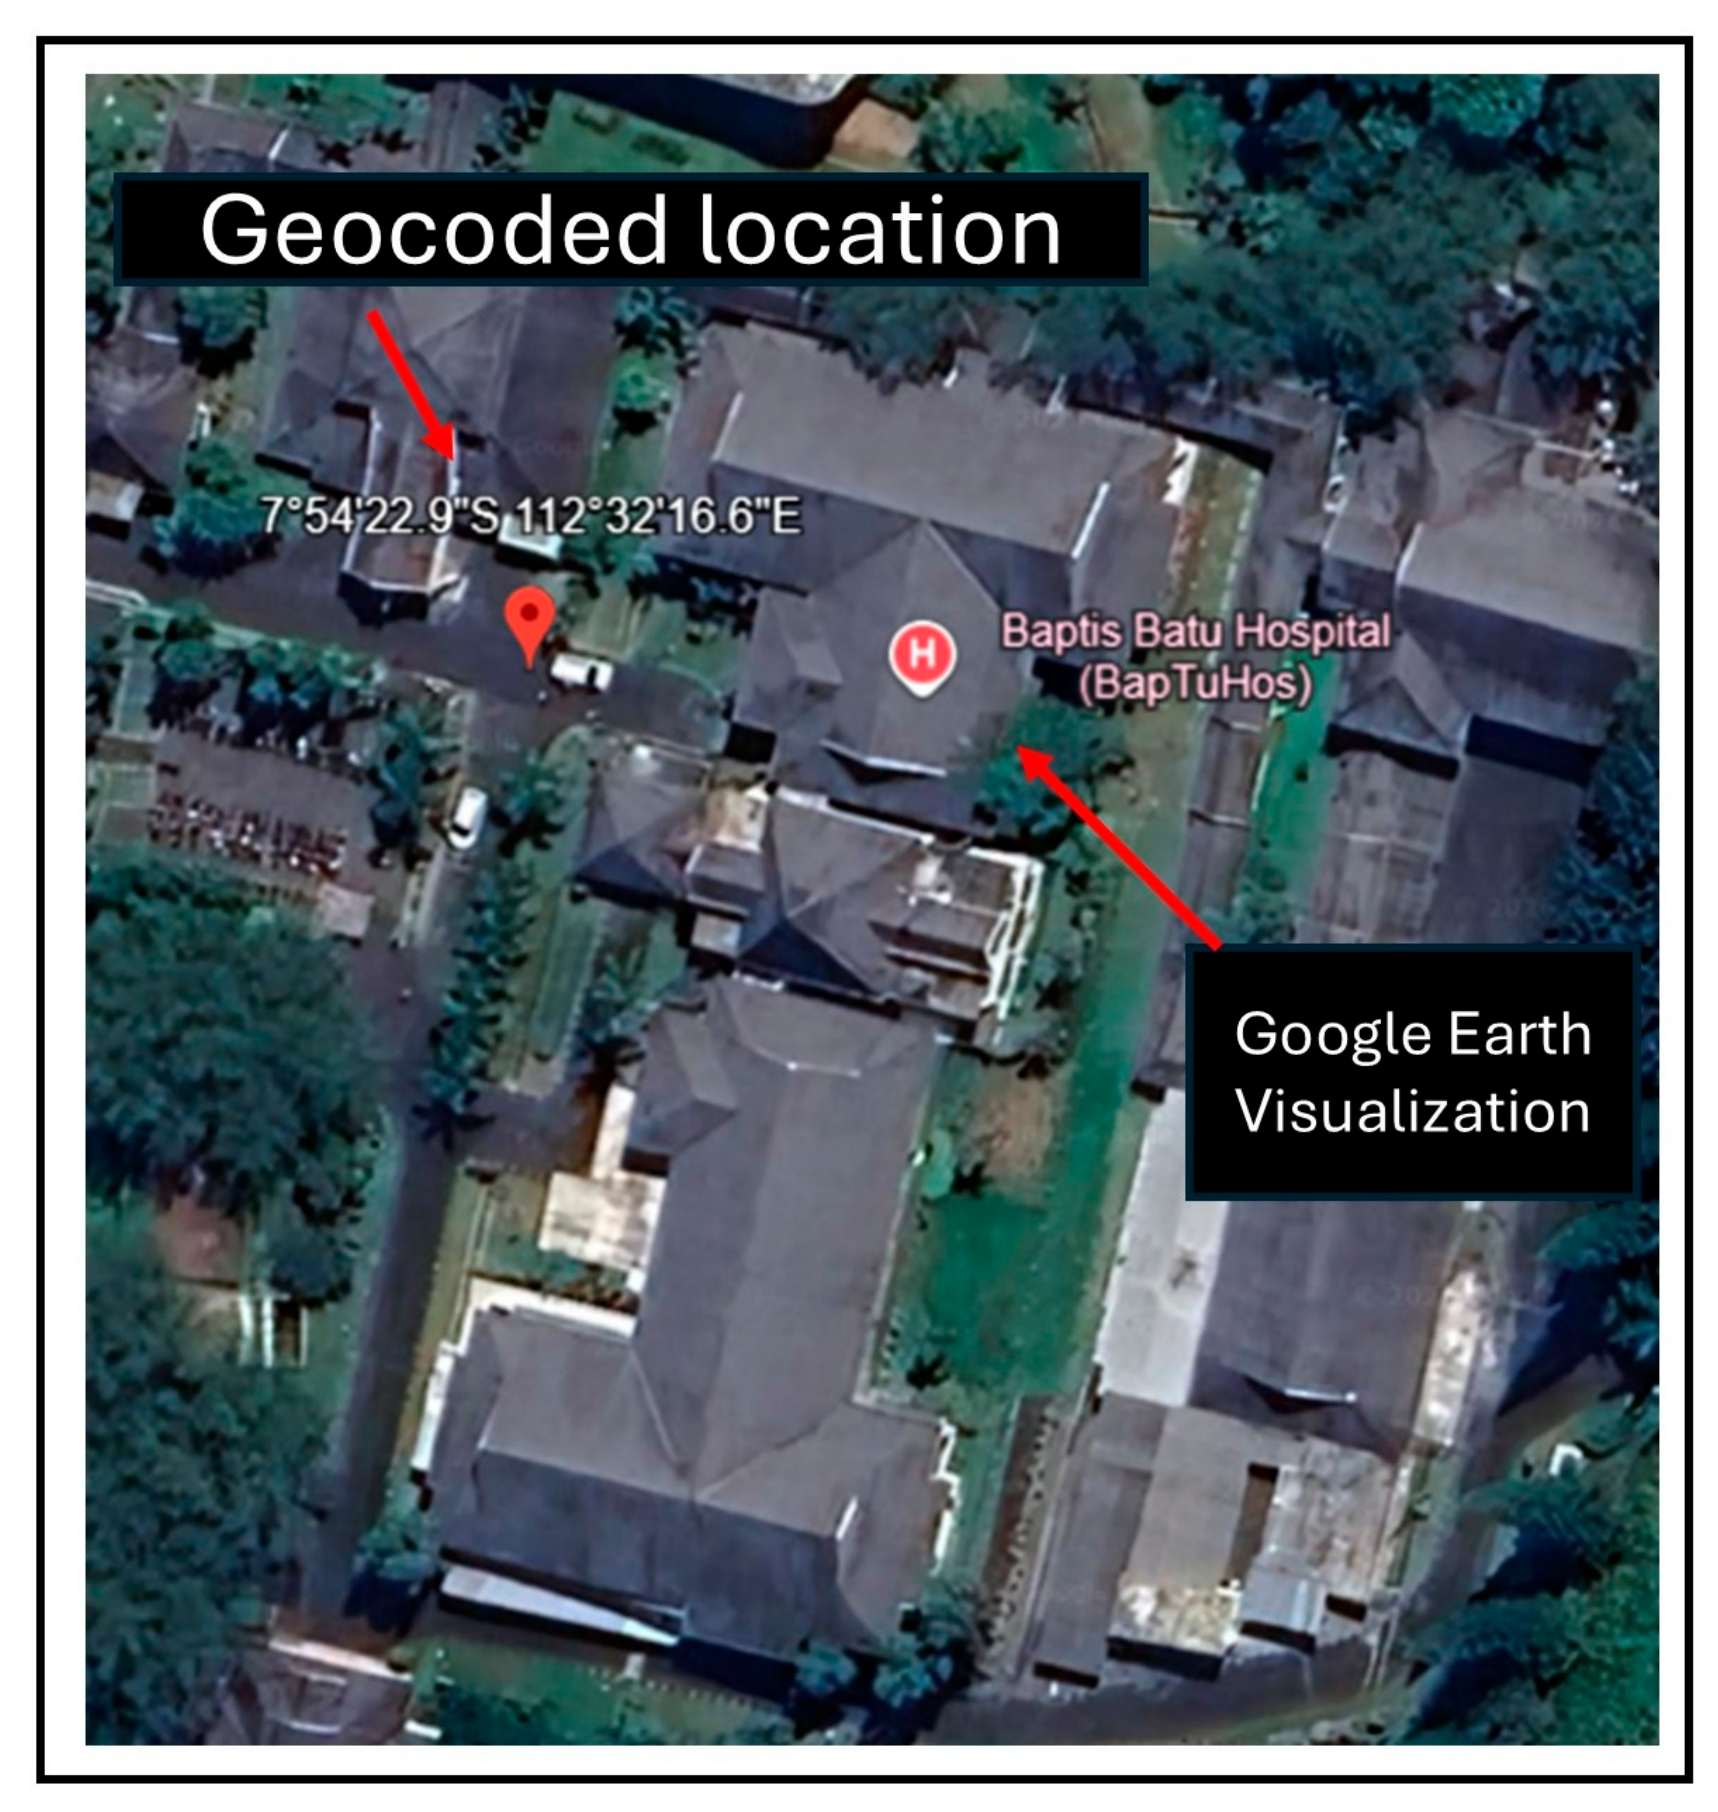
Finally, the latitude and longitude of all hospitals were recorded through a geocoding process, which involves converting location descriptions—such as place name, street address, and postal code—into geographic coordinates [
25]. Using hospital names and district information, each hospital was located via Google Maps, and coordinates were recorded in the spreadsheet. This step was crucial for enabling data to be represented in a GIS environment for spatial analysis. To ensure positional accuracy, all geocoded hospital locations were manually verified using Google Earth Pro. Each geocoded point was visually inspected against high-resolution satellite imagery and available cartographic information to confirm correct placement at the corresponding hospital facility (
Figure 2). Where a point was found to be displaced from the hospital building, its immediate grounds, parking area, or adjacent land, the coordinates were manually adjusted to accurately represent the facility location. This verification process was conducted prior to spatial analysis, ensuring that locational errors do not influence the results.
2.4. Transformation and Standardization of Indicators
GDR and NDR are indicators where generally higher values represent poorer outcomes. Conversely, higher values for BOR and BTO indicate better outcomes. To ensure consistency and comparability, the values for GDR and NDR were inverted so that higher values indicate better outcomes.
ALOS requires different consideration because its relationship with hospital performance is not strictly monotonic. According to the Indonesian Ministry of Health, an ALOS of 6–9 days represents the recommended range, whereas excessively short stays may indicate premature discharge or inadequate treatment. Accordingly, an optimal-range scoring approach was initially considered, in which hospitals with ALOS values within the recommended range would receive the highest scores. However, examination of the empirical distribution revealed substantial divergence from this reference range. Specifically, 98.1% of hospitals in the study dataset had an ALOS below 6 days, while only 1.2% fell within the recommended 6–9-day range. The overall mean ALOS was 2.95 days. Thus, applying the 6–9-day criterion would classify most hospitals as having suboptimal ALOS and would provide limited discrimination among hospitals. Such a distribution would substantially reduce the variability of the resulting performance score and could distort its contribution to the composite index. Given these empirical characteristics, ALOS was therefore treated as a negatively oriented indicator and inversely transformed, consistent with GDR and NDR. This approach reflects the efficiency perspective put forward by Lindner & Woitok et al. (2020) [
26] that prolonged hospitalization is generally associated with greater resource utilization and costs and may increase patients’ exposure to hospital-acquired infections.
In the case of BOR, the optimal threshold for BOR is 75–85%, as suggested by Barber–Johnson’s theory [
27]. The Ministry of Health of the Republic of Indonesia, however, recognizes a broader acceptable range of 65–85% to accommodate differences in healthcare access and service demand across regions [
28]. The midpoint of this broader range is 72.5%, which falls slightly short of the 75% threshold suggested by the Barber–Johnson framework. Given that the 75% BOR threshold provides a common reference point consistent with both frameworks, this study adopted it as the optimal value. BOR was transformed using Equation (1).
where BOR is the original bed occupancy rate (%) and BOR
trans is the transformed value. This transformation assigns higher scores to hospitals with occupancy rates closer to the optimal level, while equally penalizing deviations above and below 75%.
In the next step, all five indicators were standardized using z-score normalization [
29]. This procedure was performed separately for each hospital type (general, maternity, and specialist) to account for structural and functional differences across hospital types, which differ significantly in terms of patient case mix, service complexity, and operational characteristics. Given that these differences can lead to systematic variation in performance and safety indicators, applying a single global standardization across all hospitals could bias the results by unfairly comparing inherently different hospital types. Therefore, type-specific standardization ensures that each hospital is evaluated relative to its peer group, enabling more meaningful comparison and reducing structural bias in the final composite indices. The transformation is conducted as per Equation (2):
where
= value of indicator for hospital
in type
,
= mean of indicator within hospital type
, and
= standard deviation within hospital type
.
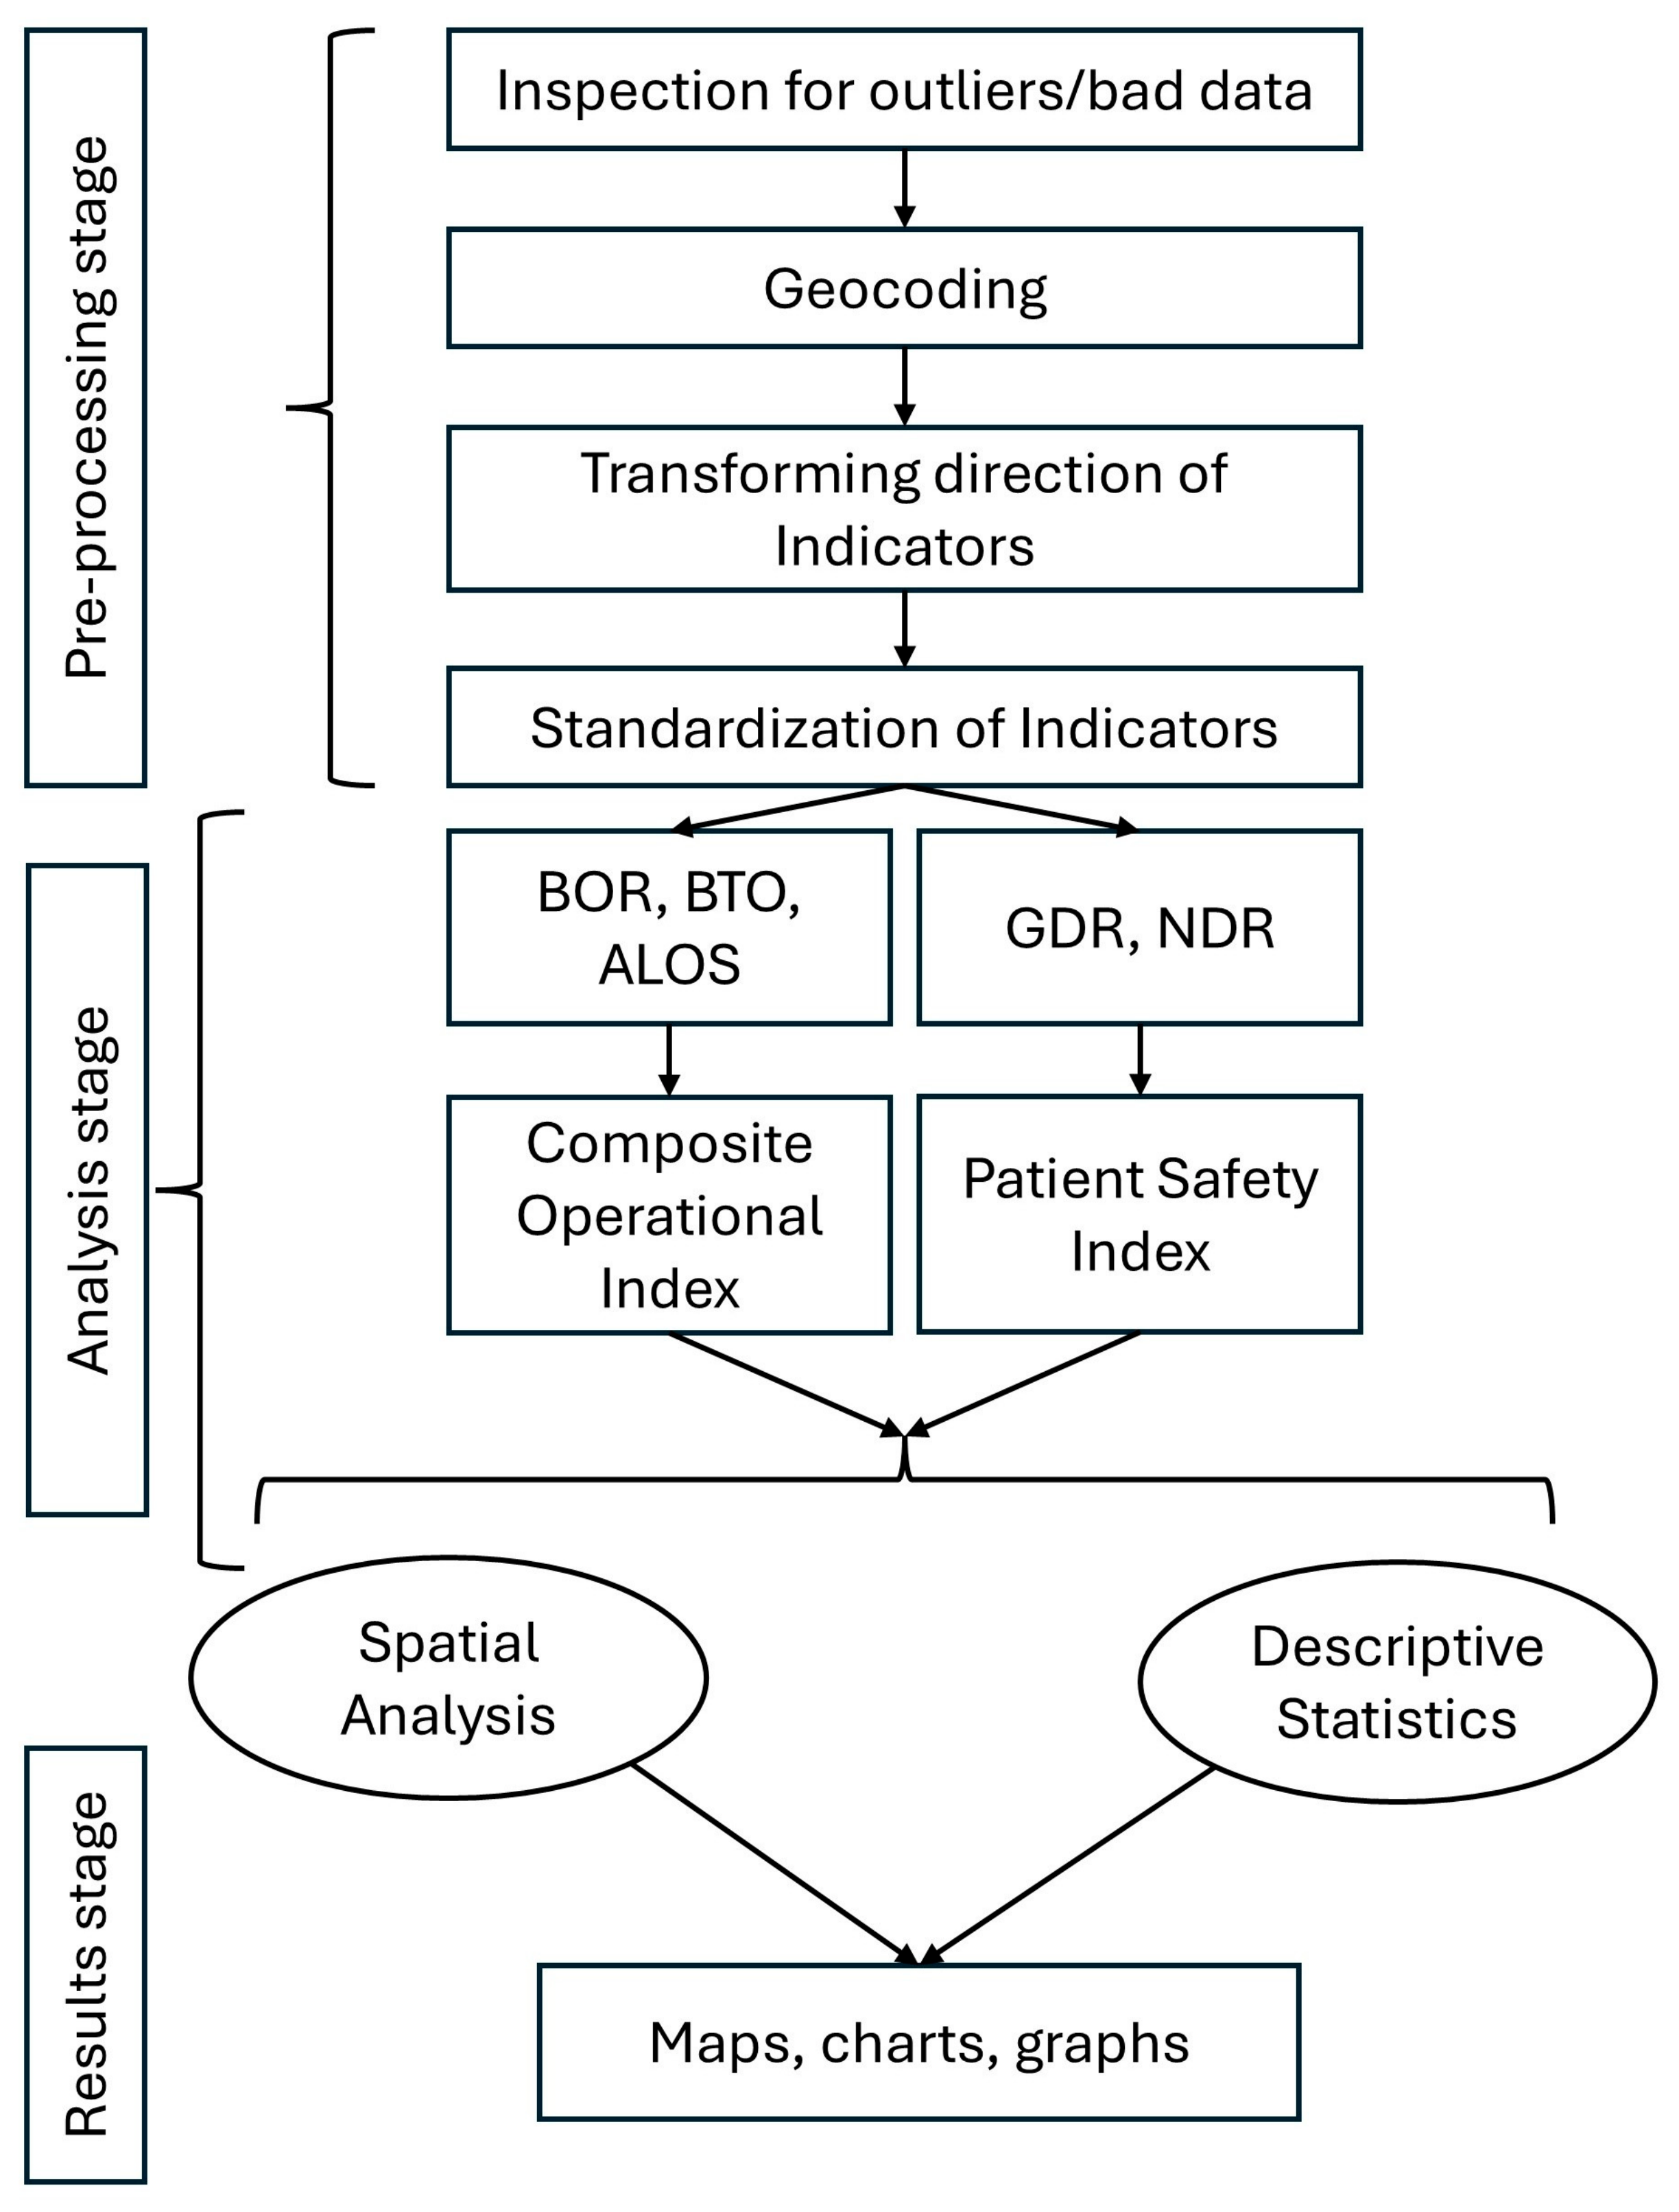
Figure 3 offers an overview of the main steps of data processing and analysis.
2.5. Construction of Composites
Rather than relying on individual indicators, composite indices offer an excellent approach to reliably rank hospitals within certain contexts (e.g., operational performance or safety risk) [
30]. The five indicators in our dataset correspond to two different themes, i.e., hospitals’ performance and mortality-oriented patient safety outcomes. Thus, two separate composite indices were developed to summarize individual indicators into these themes while preserving their conceptual distinction. These indices were created following the established methodologies for indicator normalization and aggregation outlined in the OECD’s
Handbook on Composite Indicators [
31] and widely applied in health system performance assessment frameworks [
32].
The allocation of weights reflects the relative importance of constituent indicators in the development of composite indices. Weights may be calculated by participatory or statistical methods such as principal component analysis and factor analysis [
33]. Previous studies have also used other methods such as the benefit-of-the-doubt approach, item response theory, and Grey Relational Analysis. However, the equal-weighting approach remained the most adopted and transparent approach in healthcare quality research, particularly when there is insufficient empirical or theoretical evidence to justify differential weighting [
34]. A systematic review of publications constructing composite indices across multiple dimensions of healthcare quality found that 107 out of 118 studies applied equal weights [
35]. The adoption of equal weighting avoids the subjectivity inherent in expert-derived or statistically derived weighting schemes, which can introduce bias and reduce transparency and replicability across settings [
31]. For these reasons, this study also adopts the equal-weighting aggregation approach. A sensitivity analysis was also conducted to confirm the robustness of composite indices to the weighting choice, the results of which are reported in the
Supplementary Material S1.
2.5.1. Composite Operational Index
The composite operational index (COI) was constructed to capture hospital efficiency and service delivery performance using standardized values of BOR, ALOS, and BTO. It was calculated as the average of the standardized values (Equation (3)), providing a unified measure of hospitals’ performance from an operational perspective. Higher values indicate better efficiency and utilization of hospital resources.
where
,
, and
represent standardized values of BOR, BTO, and ALOS, respectively.
As described in
Section 2.4, ALOS was reverse-coded prior to COI construction, an approach determined to be most appropriate given the observed distribution of ALOS values in this dataset. Nevertheless, it should be acknowledged that this transformation implicitly assumes a monotonic relationship between length of stay and operational performance. To examine the robustness of the COI to this methodological choice, a sensitivity analysis was conducted in which the reverse-coded ALOS was replaced by a percentile-based scoring function that penalizes deviations from the within-type median in both directions, thereby treating both unusually short and unusually long stays as suboptimal relative to the type-specific norm. Classification agreement between the original and sensitivity COI was 80.6%, with all disagreements confined to adjacent performance categories. Full results are presented in
Supplementary Material S2. These findings confirm that hospital performance classifications derived from the COI are robust to alternative ALOS transformation approaches.
2.5.2. Patient Safety Index
The patient safety index (PSI) was constructed to represent mortality-oriented hospital safety outcomes using directionally adjusted and standardized values of GDR and NDR. In the final PSI, higher values indicate better patient safety. The composite index was computed as the average of the standardized indicators (Equation (4)), providing an integrated measure of hospital-level safety outcomes.
where
and
denote standardized values of directionally adjusted GDR and NDR.
The Pearson correlation between raw GDR and NDR was r = 0.937. After GDR and NDR were standardized within the hospital type, the correlation was r = 0.826. These values confirm that the two indicators share substantial common variance. Accordingly, PSI should be interpreted as a composite summary measure of overall crude mortality burden. It should not be interpreted as an integration of two genuinely independent patient safety dimensions. Despite this statistical overlap, GDR and NDR were retained as separate components because they capture clinically distinct phases of the hospital mortality pathway. GDR includes all inpatient deaths, including those occurring within 48 h of admission. It is therefore sensitive to admission severity, triage quality, and early emergency management. NDR includes only deaths occurring after 48 h of admission. It more directly reflects the quality of sustained in-hospital care processes such as monitoring, infection control, and clinical decision-making. Both indicators are routinely used as complementary measures in Indonesian hospital performance monitoring.
2.6. Descriptive Statistics
Descriptive statistics were computed to summarize the distribution of hospital characteristics and the five indicators. Continuous variables were summarized using means and standard deviations, whereas categorical variables were presented as frequencies and proportions. The distribution of hospitals across ownership groups, hospital types, and class categories was examined to provide an overview of the study sample. Additionally, the distribution of standardized indicators and composite indices was assessed to identify potential outliers and verify comparability across hospital types following standardization.
2.7. Spatial Analysis
2.7.1. Spatial Distribution and Visualization
In order to examine the distribution of hospitals’ operational performance and mortality-oriented patient safety outcomes across East Java, both the COI and PSI were classified into four performance categories prior to mapping. Classification was based on z-score threshold boundaries following established practice in composite index studies [
36,
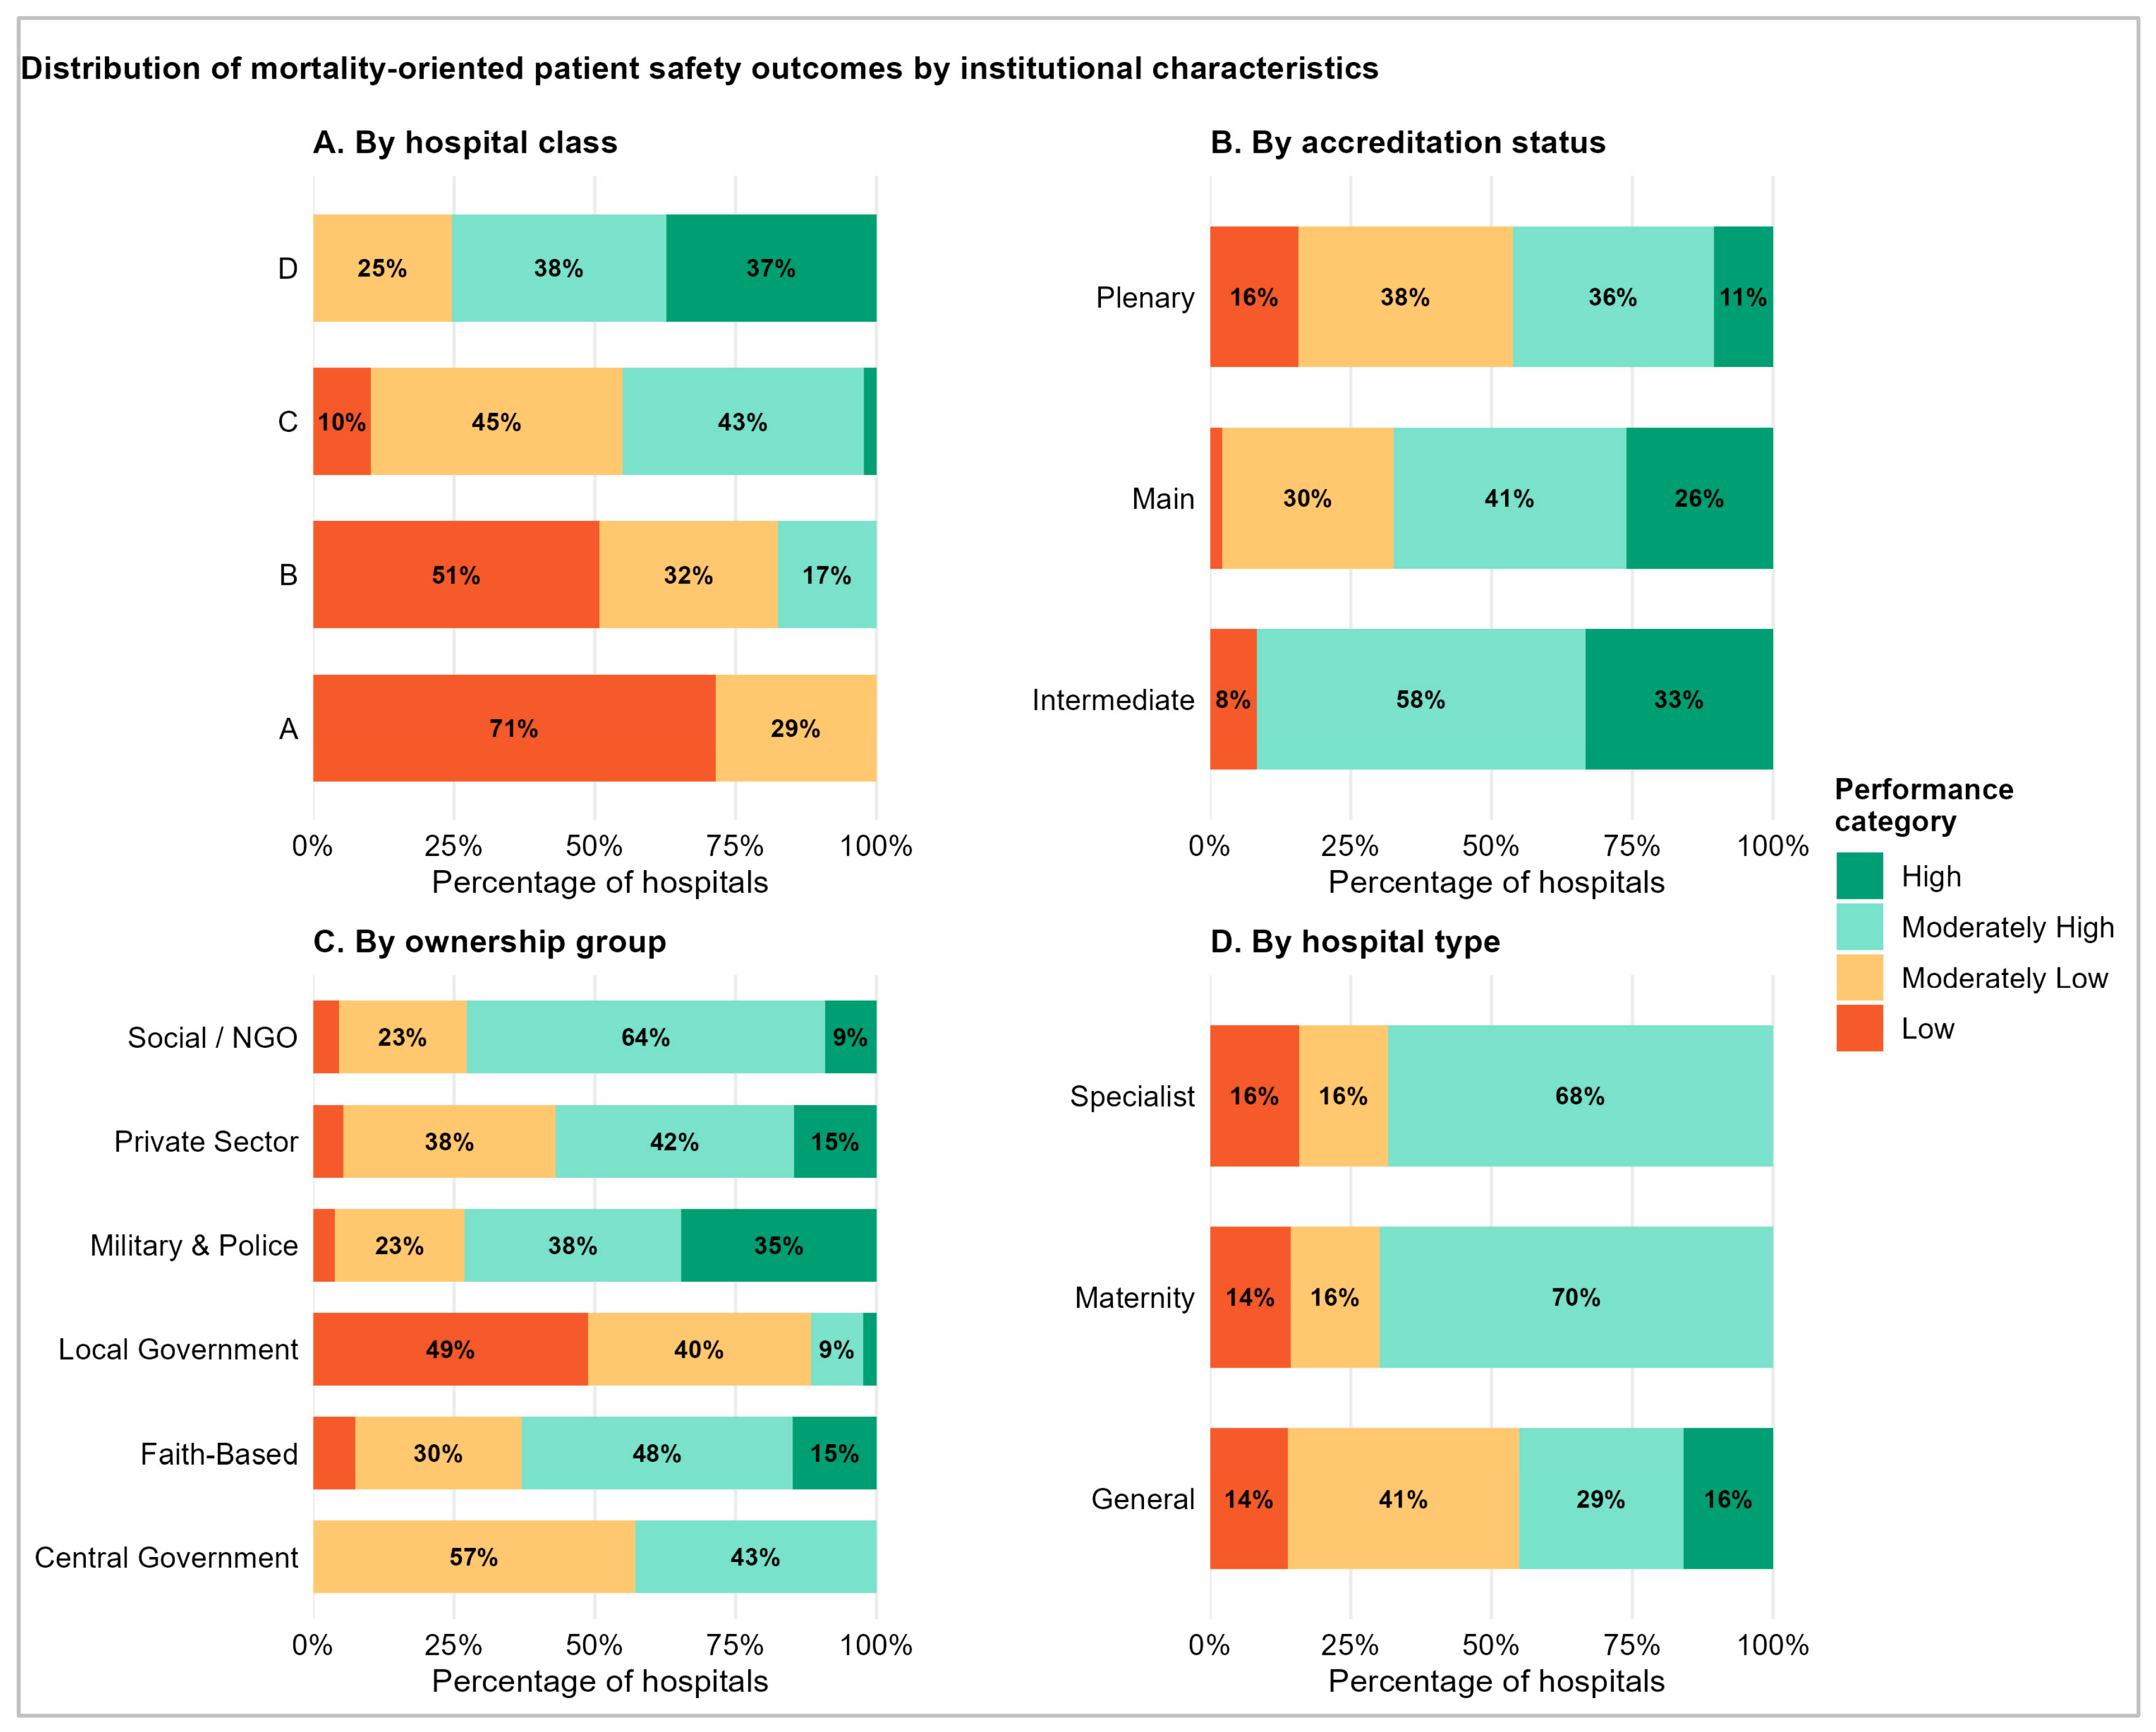
37]. The values and labels of classification include high (≥1), moderately high (0–<1), moderately low (>−1–<0), and low (≤−1). Classified COI and PSI were mapped in QGIS 3.44. visually distinguish performance tiers across the province. To further examine the institutional composition of performance categories, the distribution of COI and PSI classifications was summarized by hospital class, accreditation status, ownership group, and hospital type. These summaries are presented as stacked bar charts showing the percentage of hospitals in each performance category within each institutional group, enabling visual comparison of performance profiles across structurally different facility types.
2.7.2. Spatial Autocorrelation Analysis
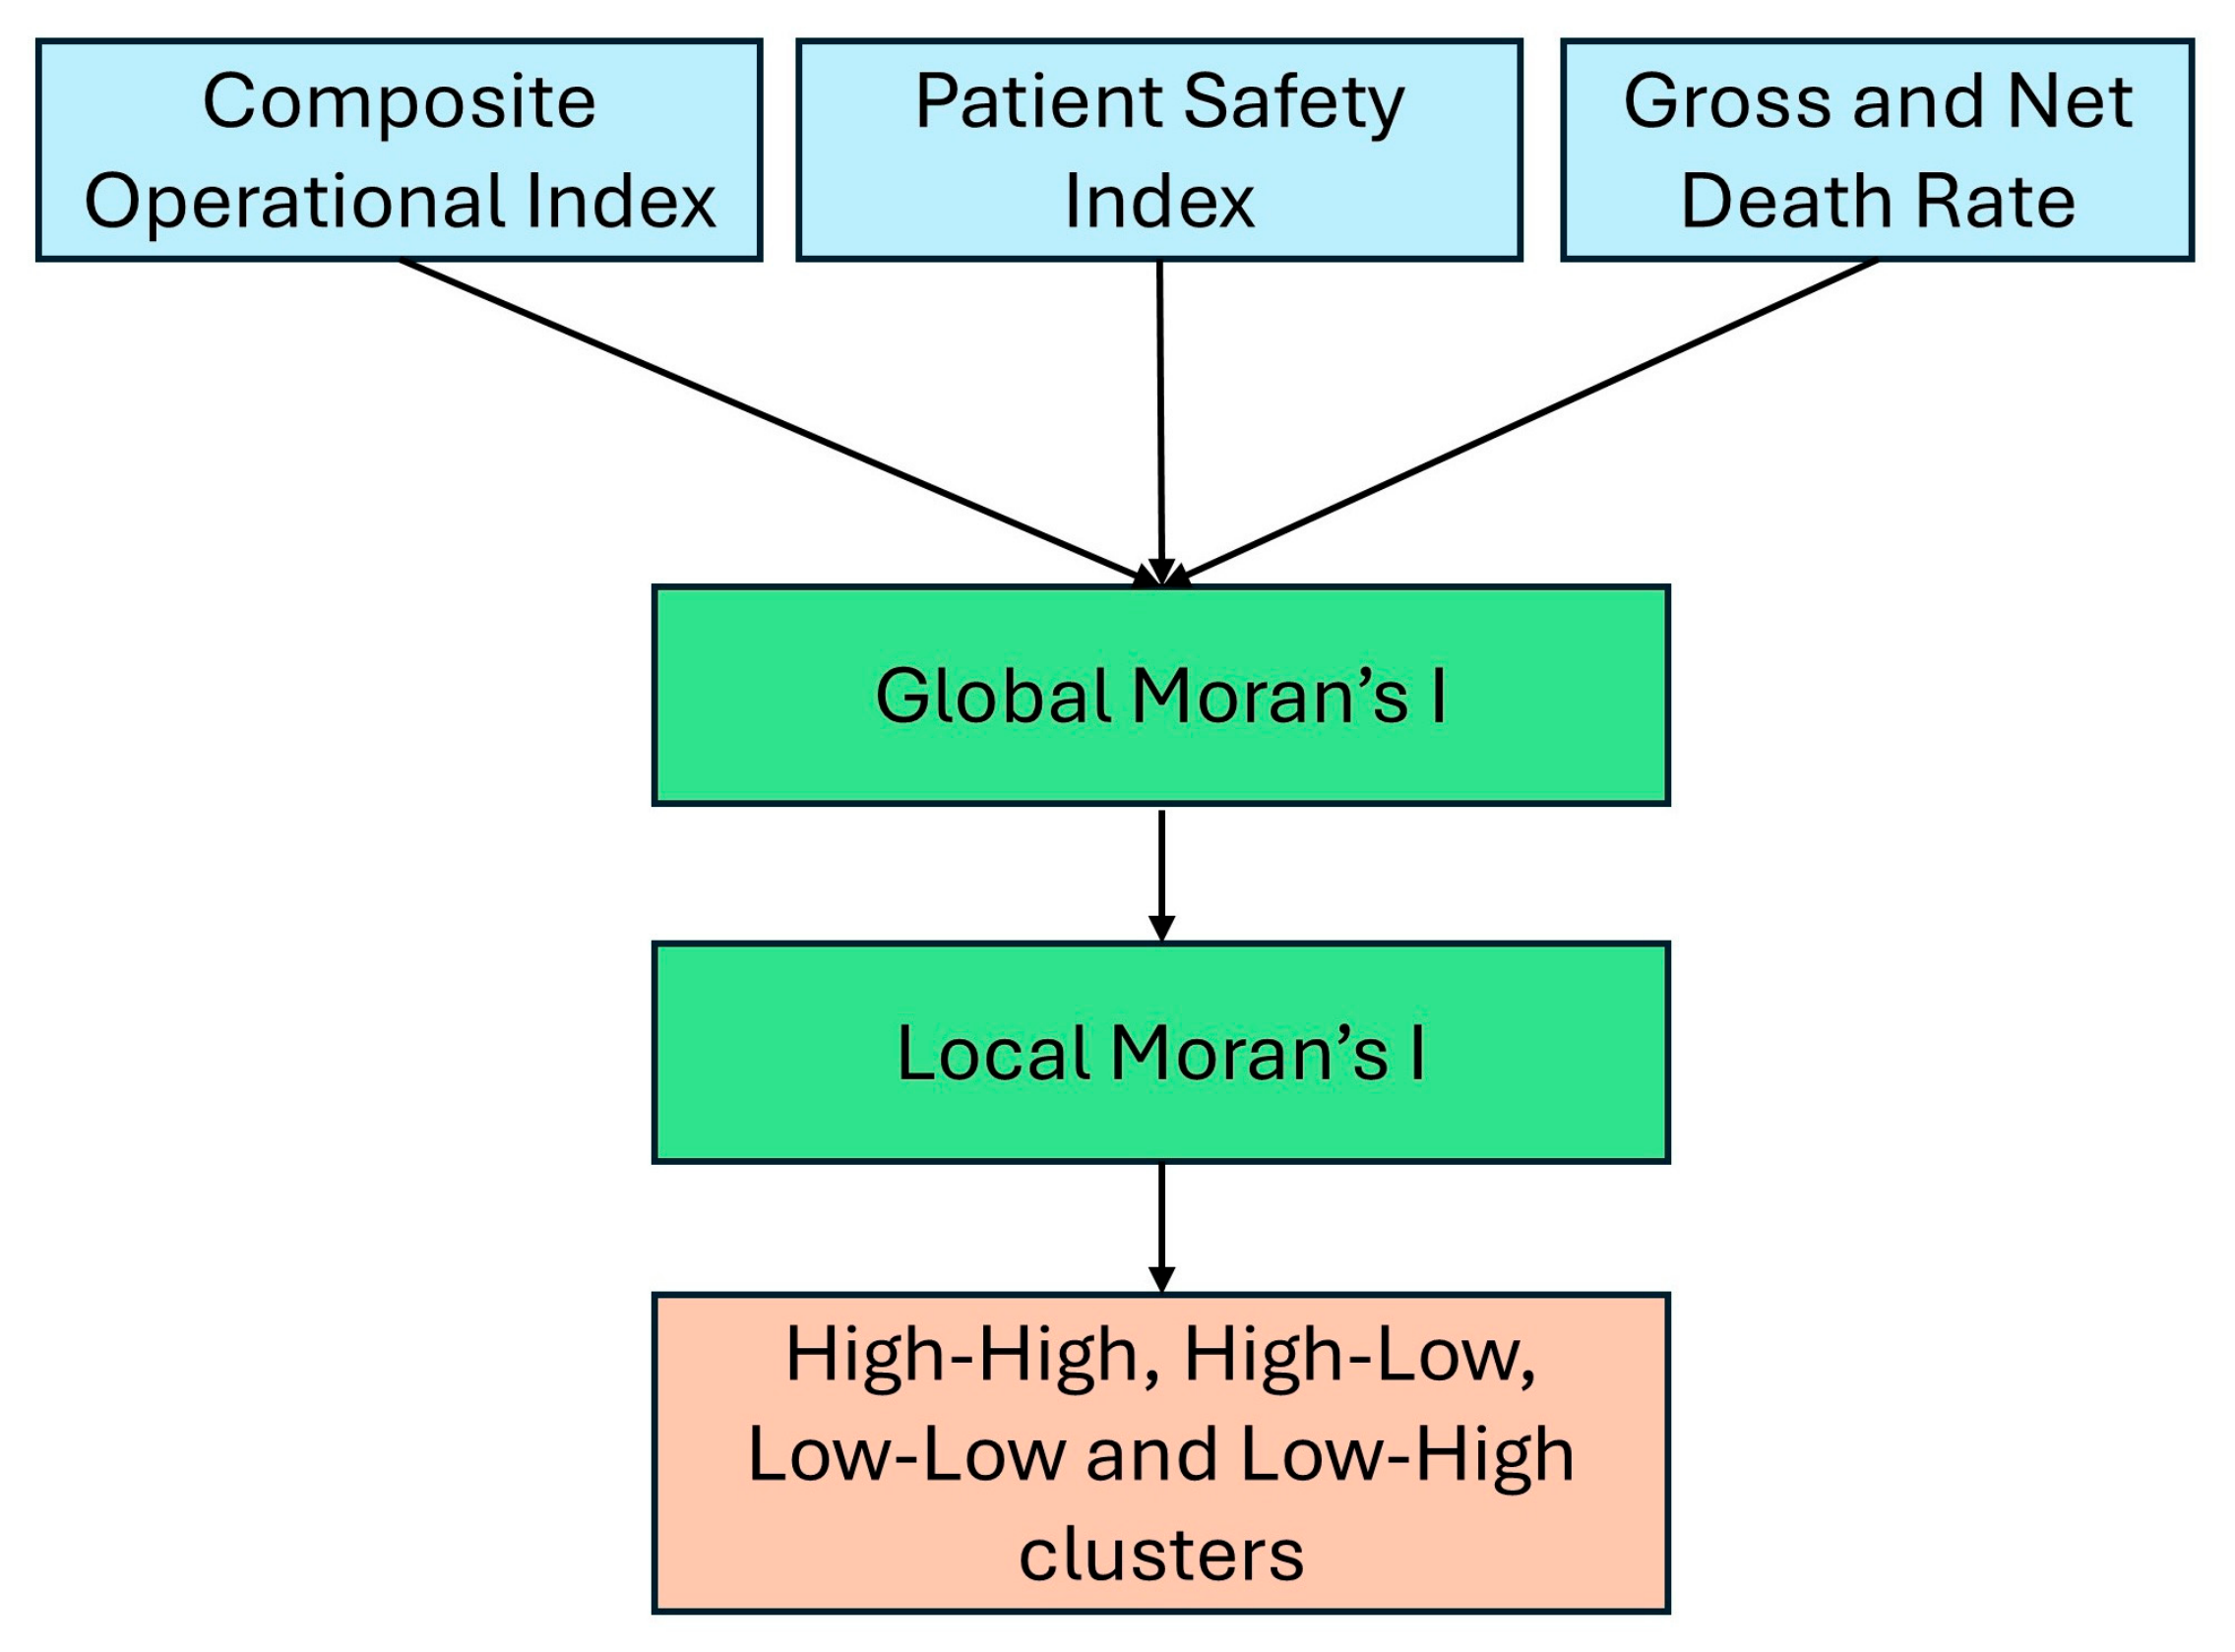
Figure 4 outlines the workflow of spatial autocorrelation analysis. To evaluate the spatial dependence of hospital performance and mortality-oriented patient safety indicators, global spatial autocorrelation was quantified using Moran’s I statistics. This metric tests whether observed values are spatially clustered, dispersed, or randomly distributed across geographic space [
38,
39]. In the next step, local Moran’s I (Anselin local Moran’s I) analysis was performed, which can further reveal the underlying spatial heterogeneity. Local Moran’s I is also called cluster and outlier analysis, as it identifies concentrations of high and low values and spatial outliers [
40,
41].
Initially, point-based global and local Moran’s I analyses were conducted using QGIS 3.44.12 at the hospital scale separately for COI and PSI values. To further disaggregate the spatial dynamics of mortality, global and local Moran’s I were also independently calculated for standardized GDR and NDR. In addition, to check whether spatial clustering patterns differed across institutional subgroups, supplementary Global Moran’s I analyses were conducted on stratified subsets of the hospital dataset. Hospitals were stratified by administrative class (Class A/B versus Class C/D), ownership type (public hospitals versus private sector hospitals), and hospital type (general versus maternity). Specialist hospitals (n = 19) were excluded from subgroup analyses due to insufficient sample size for reliable spatial autocorrelation estimation. Each subgroup analysis used the KNN spatial weights specification with k = 8 neighbors and row standardization as the primary analysis. These analyses were conducted to provide empirical evidence on whether the overall absence of hospital-level spatial clustering masked differential clustering patterns across institutional categories.
Furthermore, global and local spatial autocorrelation was subsequently evaluated at district level to assess broader regional trends. Using a spatial join procedure, district-level mean composite index values were aggregated from the hospital data. Furthermore, to analyze scale-dependent patterns of mortality, local Moran’s I was analyzed individually for standardized GDR and NDR at district scale. The analysis classified districts into four categories: high–high (HH), low–low (LL), high–low (HL), and low–high (LH), representing clusters of similar values and spatial outliers.
Global and local Moran’s I analysis at the individual hospital level was conducted using a K-Nearest Neighbors (KNN) spatial weights matrix with k = 8 neighbors, computed using Euclidean distance. Row standardization was applied. The value of k = 8 was selected to ensure sufficient local context for each hospital while remaining sensitive to local spatial variation. Spatial autocorrelation analysis at the district level was performed using a Queen contiguity (Contiguity Edges and Corners) spatial weights matrix and 999 conditional permutations to generate an empirical reference distribution for significance testing. Similar to hospital-level analysis, row standardization was applied to ensure that districts with differing numbers of neighbors contribute equally to the spatial lag computation, preventing bias toward districts with larger numbers of contiguous neighbors.
Queen contiguity defines neighbors as all polygons sharing either a common edge or a common corner with the target polygon. The permutation approach avoids unreliable
p-values caused by normal approximation in small samples. This is critical for this study given the small sample size of 38 districts. In addition, false discovery rate correction is applied to account for multiple simultaneous comparisons across 38 district units [
42]. The pseudo
p-value measures the proportion of permuted statistics as extreme as or more extreme than the observed Moran’s I. With 999 permutations, the minimum achievable
p-value is 0.001.
3. Results
3.1. Descriptive Statistics and Spatial Distribution of Hospitals
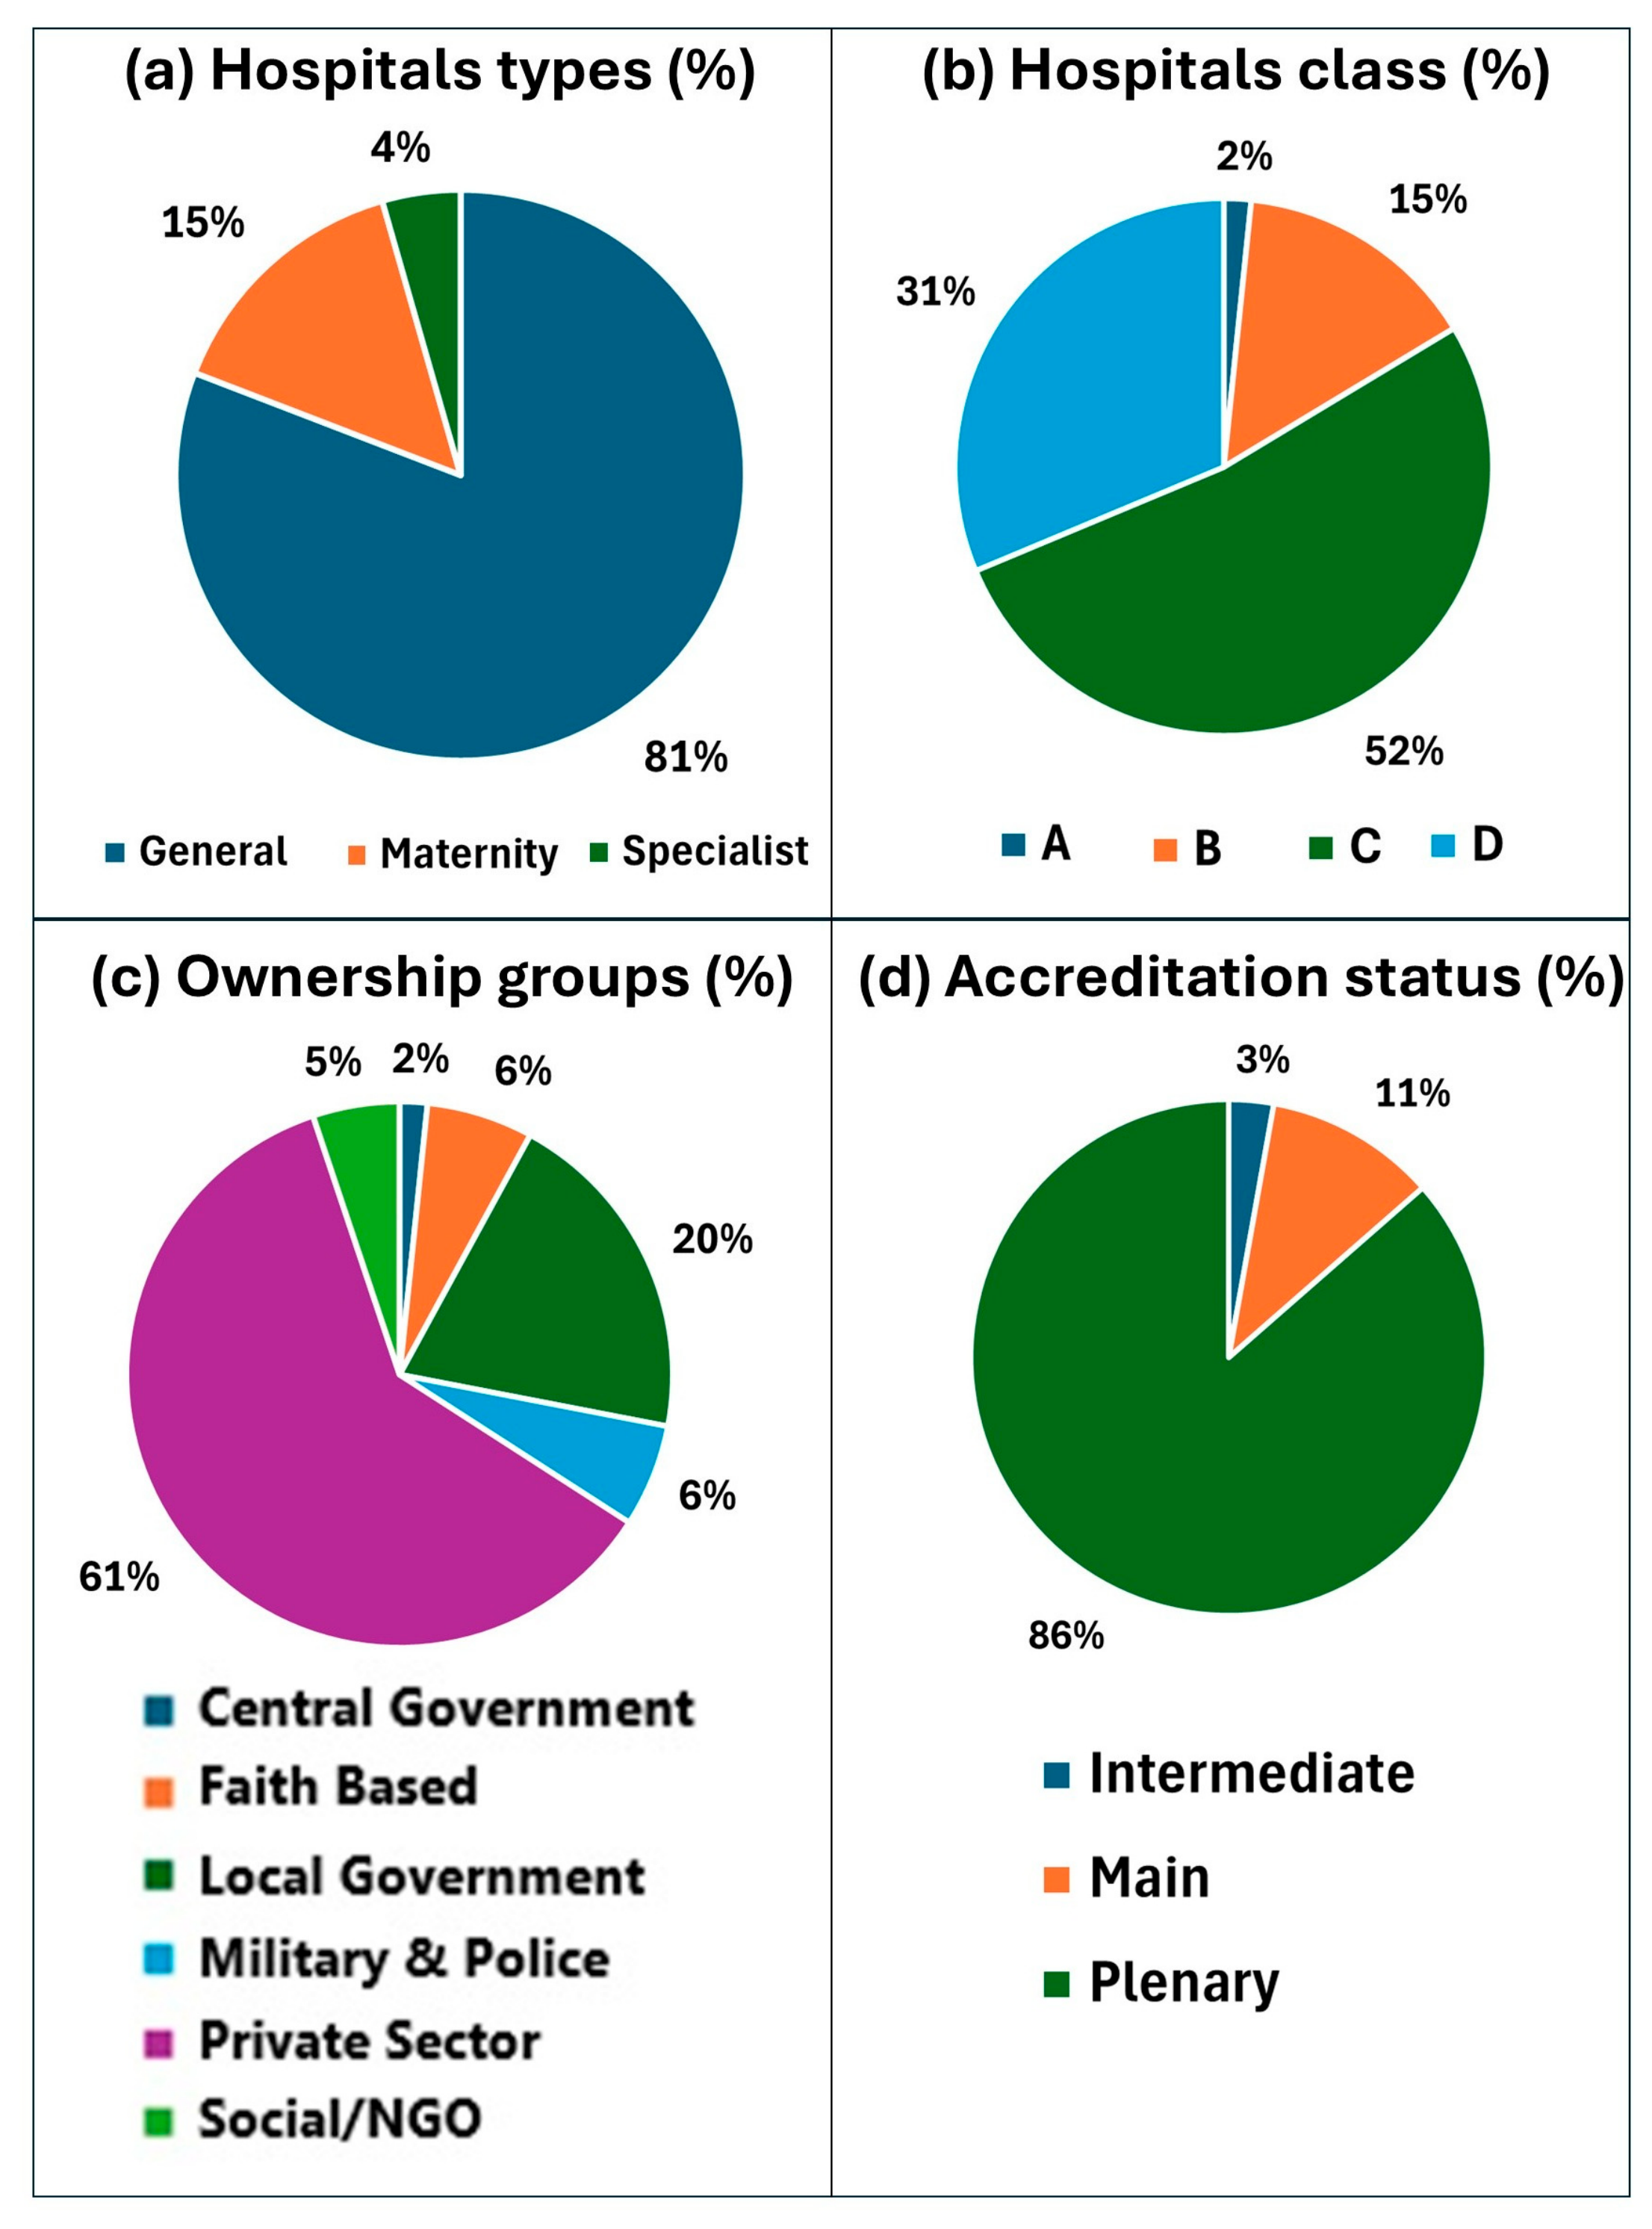
A total of 428 hospitals from across East Java province were included in the analysis. As illustrated in
Figure 5a, general hospitals were by far the predominant hospital type in the sample (
n = 346, 80.8%), followed by maternity hospitals (
n = 63, 14.7%); specialist hospitals represented only a small proportion (
n = 19, 4.4%).
Regarding hospital classification (
Figure 5b), most facilities were categorized as Class C (
n = 224, 52.3%), followed by Class D (
n = 134, 31.3%), and Class B (
n = 63, 14.7%); Class A hospitals constituted a very limited share (
n = 7, 1.6%). According to Indonesian regulations, hospital classification is partly determined by bed capacity: Class A hospitals have at least 250 beds; Class B hospitals have 200–249 beds; Class C hospitals have 100–199 beds; and Class D Hospitals have a minimum of 50 beds.
In terms of ownership structure (
Figure 5c), most hospitals were run by the private sector (
n = 260, 60.7%), with a substantial contribution from local government hospitals (
n = 86, 20.1%). Other ownership categories included faith-based organizations (
n = 27, 6.3%), military and police institutions (
n = 26, 6.1%), and social/NGO-owned hospitals (
n = 22, 5.1%), while central government hospitals accounted for only a marginal proportion (
n = 7, 1.6%).
As shown in
Figure 5d, the vast majority of hospitals had achieved plenary accreditation or Paripurna status (
n = 370, 86.4%), representing the highest level of accreditation. This indicates a high level of compliance with national healthcare standards. In contrast, main accreditation or Utama status, which reflects a moderate level of compliance, was observed in 10.7% (
n = 46 hospitals); only 2.8% (
n = 12 hospitals) received intermediate accreditation (Madya status).
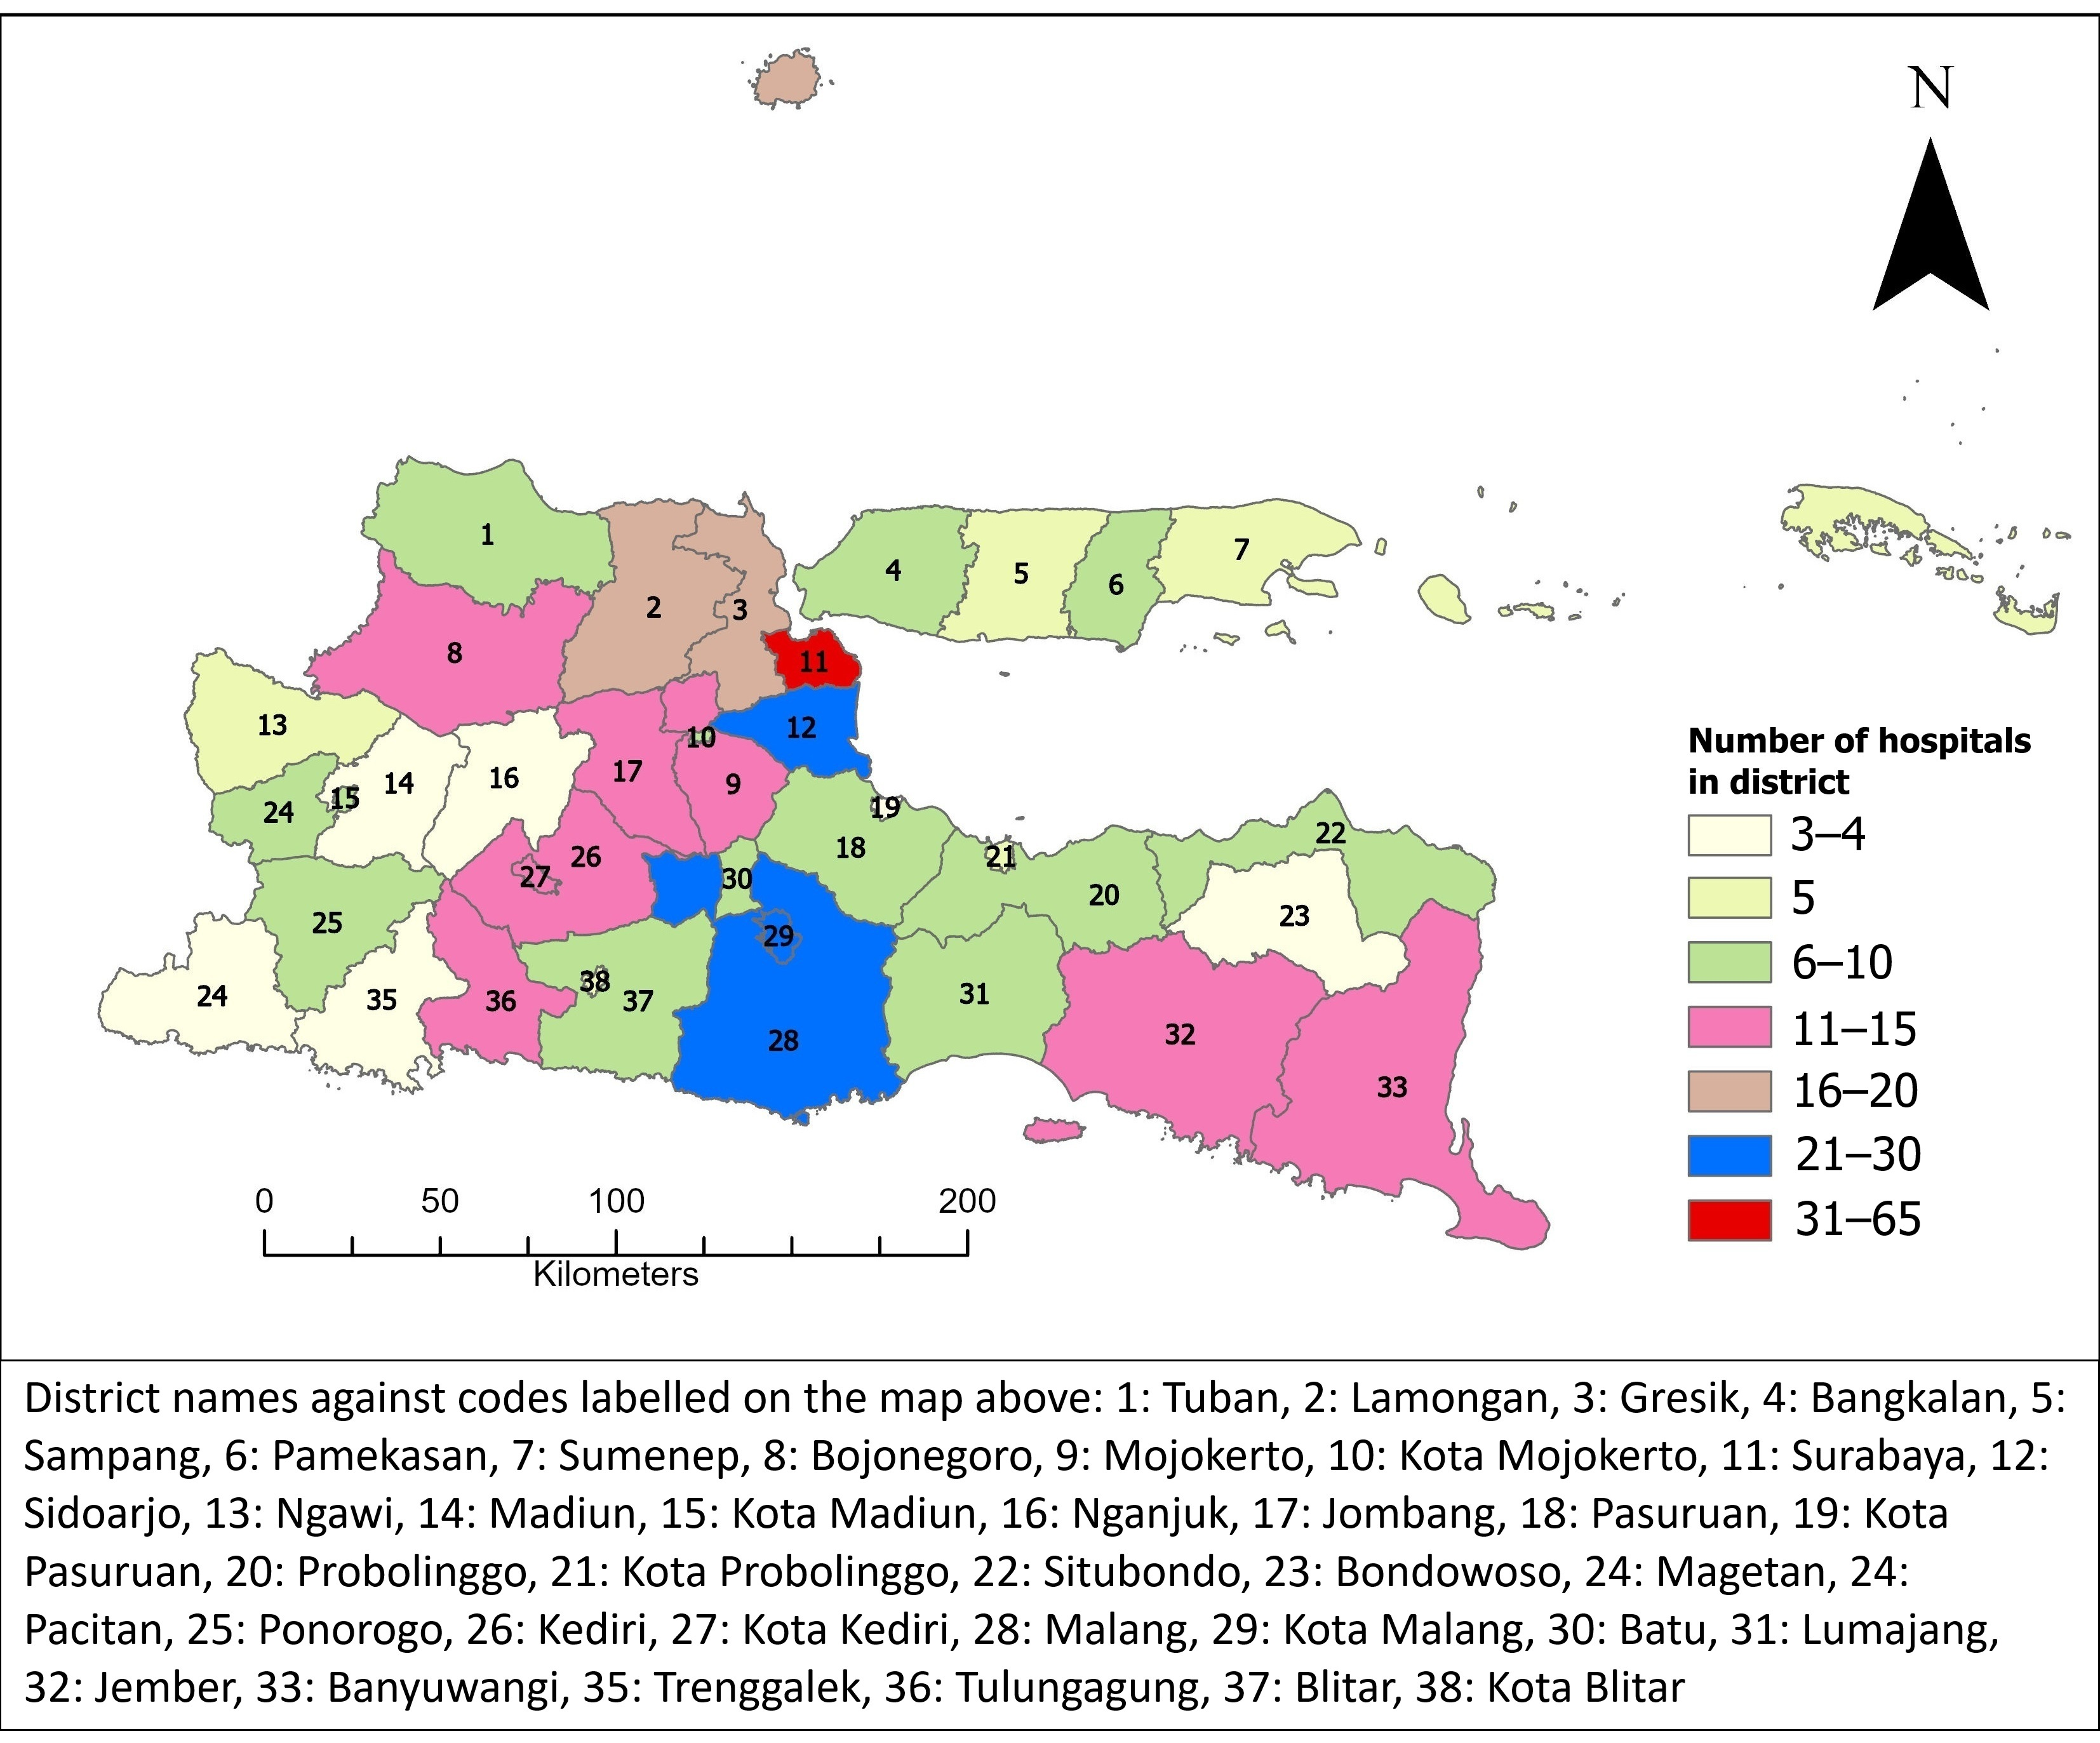
The spatial distribution of hospitals across districts is shown in
Figure 6. Only one district, Kota Surabaya (
n = 62), was found in the highest range of hospital concentration (>30–65 hospitals). This is because Surabaya is the capital and largest city of East Java province and the second-largest city in Indonesia, after Jakarta. This was followed by districts in the 20–30 category, including Sidoarjo (
n = 30), Kota Malang (
n = 28), and Malang (
n = 25). A moderate-to-high distribution (>15–20 hospitals) was observed in Gresik (
n = 19) and Lamongan (
n = 18), while districts such as Jombang (
n = 15) and Jember (
n = 14) fell within the 10–15 range. The majority of districts were concentrated in the 5–10 category, whereas several districts, including Bondowoso, Nganjuk, and Trenggalek, were classified in the lowest range (3–4).
3.2. Institutional Characteristics of Hospital Performance Categories
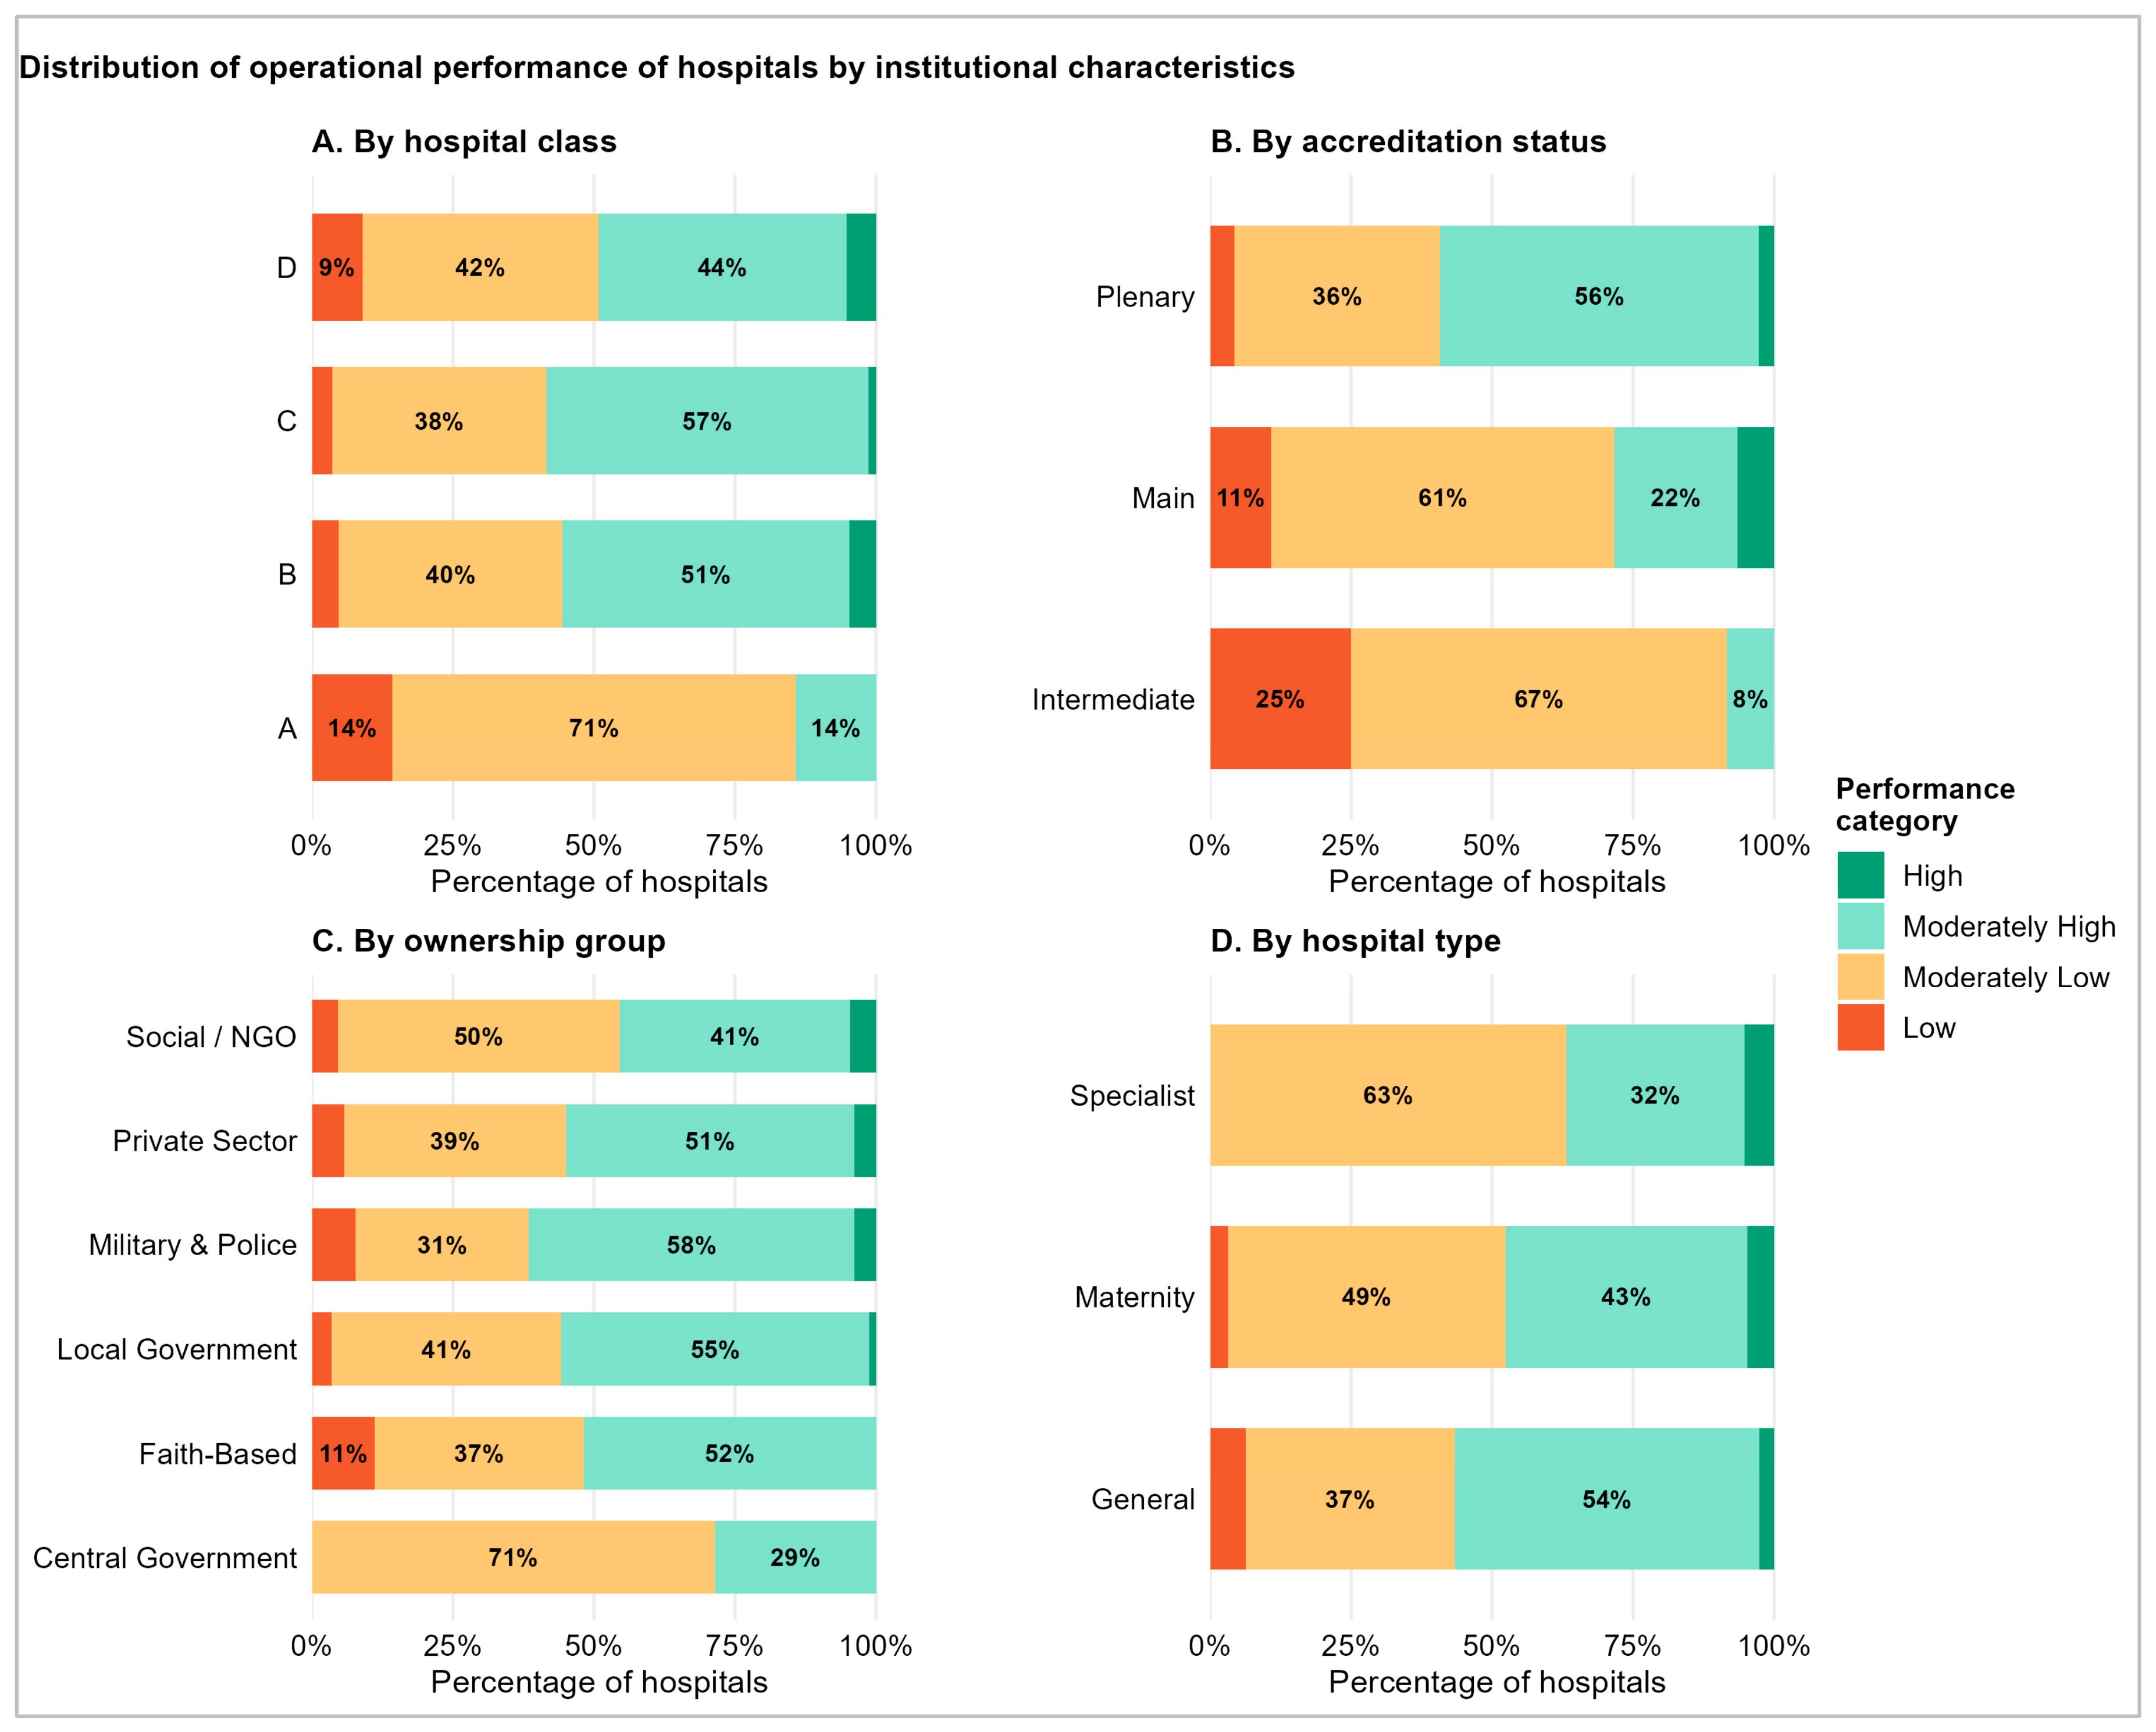
The distribution of COI and PSI performance categories varied considerably across institutional characteristics.
Figure 7 and
Figure 8 present the percentage distribution of performance categories by hospital class, accreditation status, ownership group, and hospital type for COI and PSI, respectively.
Regarding operational performance, Class B hospitals showed the highest proportion of moderately high performers at 50.8%, while Class D hospitals had the greatest proportion of low performers at 9.0%. No Class A hospital achieved a high COI rating. The majority of hospitals across all classes fell within the moderately high and moderately low categories, indicating that extreme performance in either direction was relatively uncommon across the province.
Accreditation status showed a clear gradient in COI performance. Plenary-accredited hospitals had the highest proportion of moderately high performers at 56.5%. Intermediate-accredited hospitals showed the highest proportion of low performers at 25.0%, suggesting that lower accreditation levels are associated with weaker operational performance. Across ownership groups, faith-based hospitals showed the strongest operational performance with 51.9% in the moderately high category. Central government hospitals had no high performers and the highest proportion of moderately low performers at 71.4%. By hospital type, general hospitals had the highest proportion of high performers at 2.6%, while Specialist hospitals were predominantly moderately low at 63.2%.
For mortality-oriented patient safety outcomes, a notably different pattern emerged across hospital classes compared to operational performance. Class A hospitals had the highest proportion of low PSI scores at 71.4%, indicating poor patient safety outcomes in terms of crude mortality burden. Class D hospitals, conversely, showed the highest proportion of high PSI scores at 37.3%, reflecting lower crude mortality rates. This pattern is consistent with referral concentration bias, as higher-tier hospitals receive the most critically ill patients transferred from lower-tier facilities, accumulating higher crude mortality rates independent of care quality, which is captured as lower PSI scores in this study.
Regarding accreditation, intermediate-accredited hospitals showed the highest proportion of high PSI scores at 33.3%, while plenary-accredited hospitals had the highest proportion of low PSI scores at 15.7%. Among ownership groups, local government hospitals showed the worst patient safety outcomes with 48.8% in the Low PSI category, reflecting their role as district-level referral destinations. In contrast, maternity and specialist hospitals showed predominantly better patient safety outcomes, with 69.8% and 68.4% respectively in the moderately high PSI category, consistent with the more specialized and less acutely complex case mix managed by these facility types.
3.3. Spatial Distribution of Composite Operational and Patient Safety Indexes
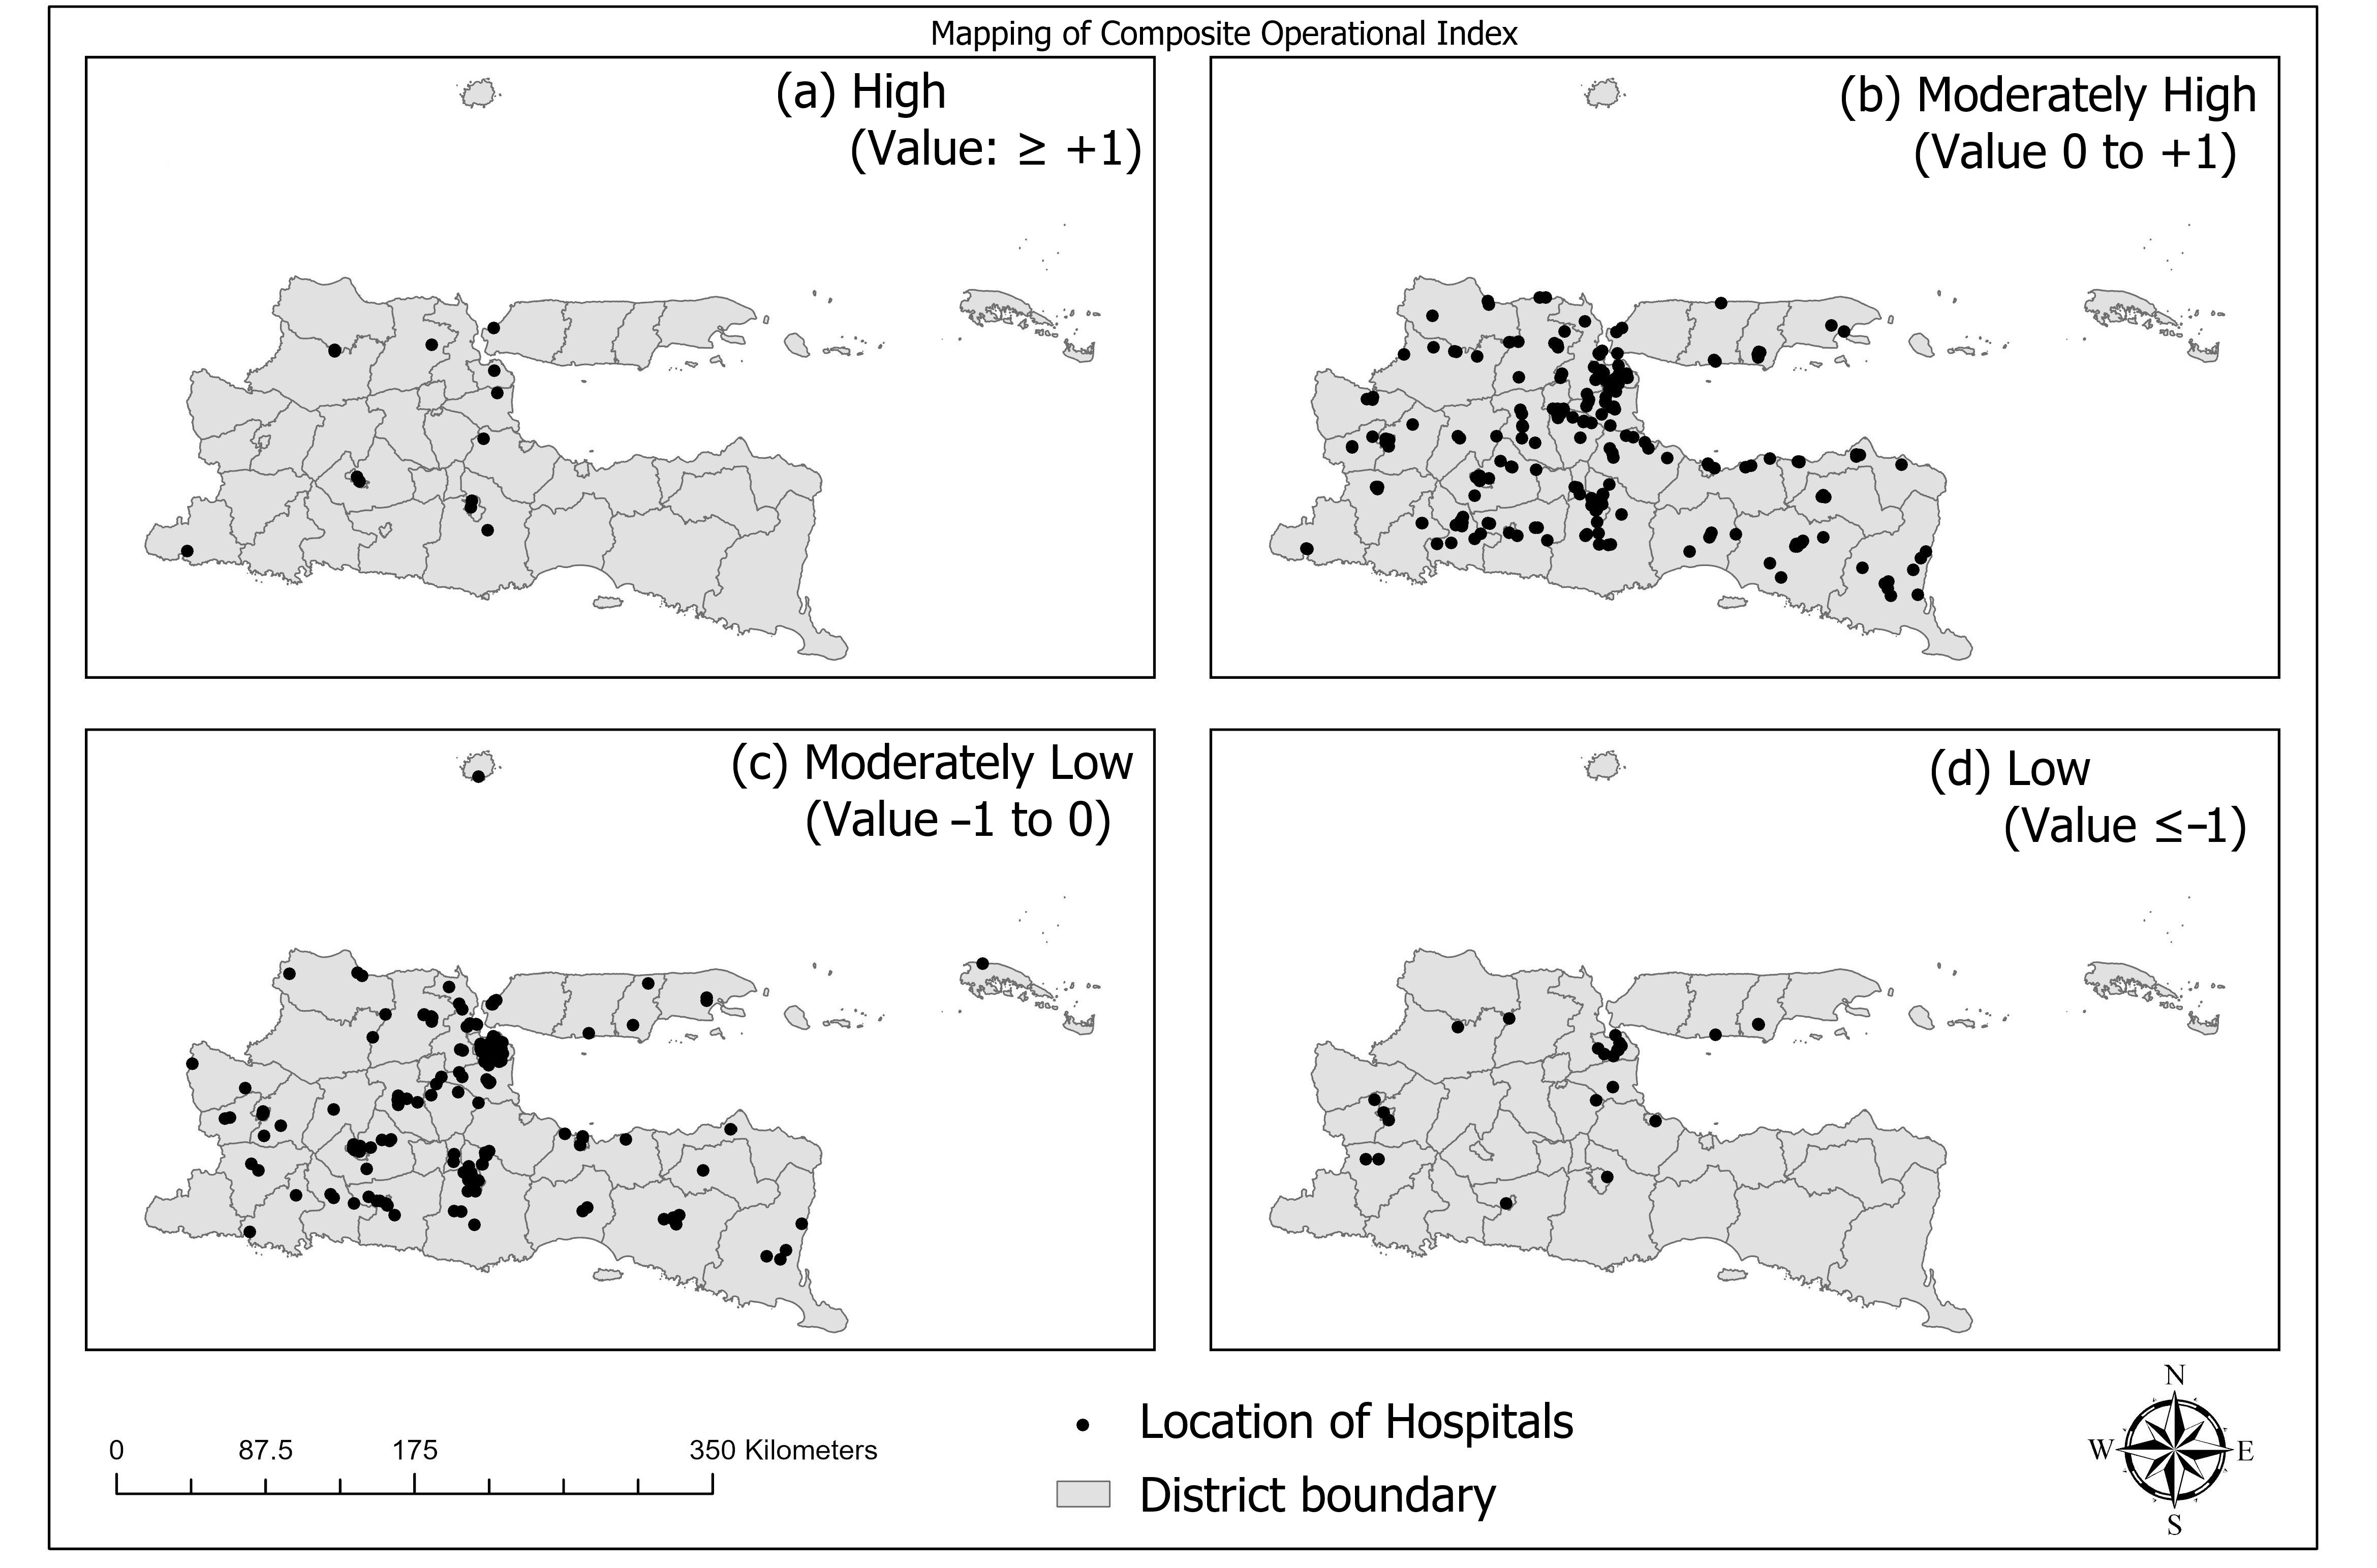
The spatial distribution of COI across districts reveals a clear dominance of moderately performing hospitals, with most facilities clustered within the moderately high and moderately low categories (
Figure 9). Across most districts, hospitals in the moderately high category consistently outnumber those in the high-performance group. Thus, while performance is generally acceptable, only a limited proportion of hospitals achieve optimal efficiency levels. For instance, districts such as Surabaya (
n = 21), Sidoarjo (
n = 14), and Malang (
n = 14) exhibited relatively higher concentrations of moderately high-performing hospitals, reflecting stronger operational capacity in these urbanized and resource-rich areas. However, even within these districts, a substantial number of hospitals remained in the moderately low category, highlighting notable intra-district variability in performance.
Additionally, the high-performance category was sparse across the province, with only a few districts such as Bojonegoro (n = 2), Kota Kediri (n = 2), and Kota Malang (n = 2) exhibiting more than one high-performing hospital; the remaining districts recorded either a single or no hospitals in this category. Conversely, the presence of low-performing hospitals was spatially uneven, with the higher concentration observed in Surabaya (n = 9) and smaller counts in districts such as Bojonegoro, Pamekasan, and Ponorogo. Overall, the spatial pattern indicates that hospital performance across East Java is concentrated at intermediate levels, with limited representation at the extremes, highlighting both the absence of widespread high-performance clusters and the persistence of localized pockets of lower operational efficiency.
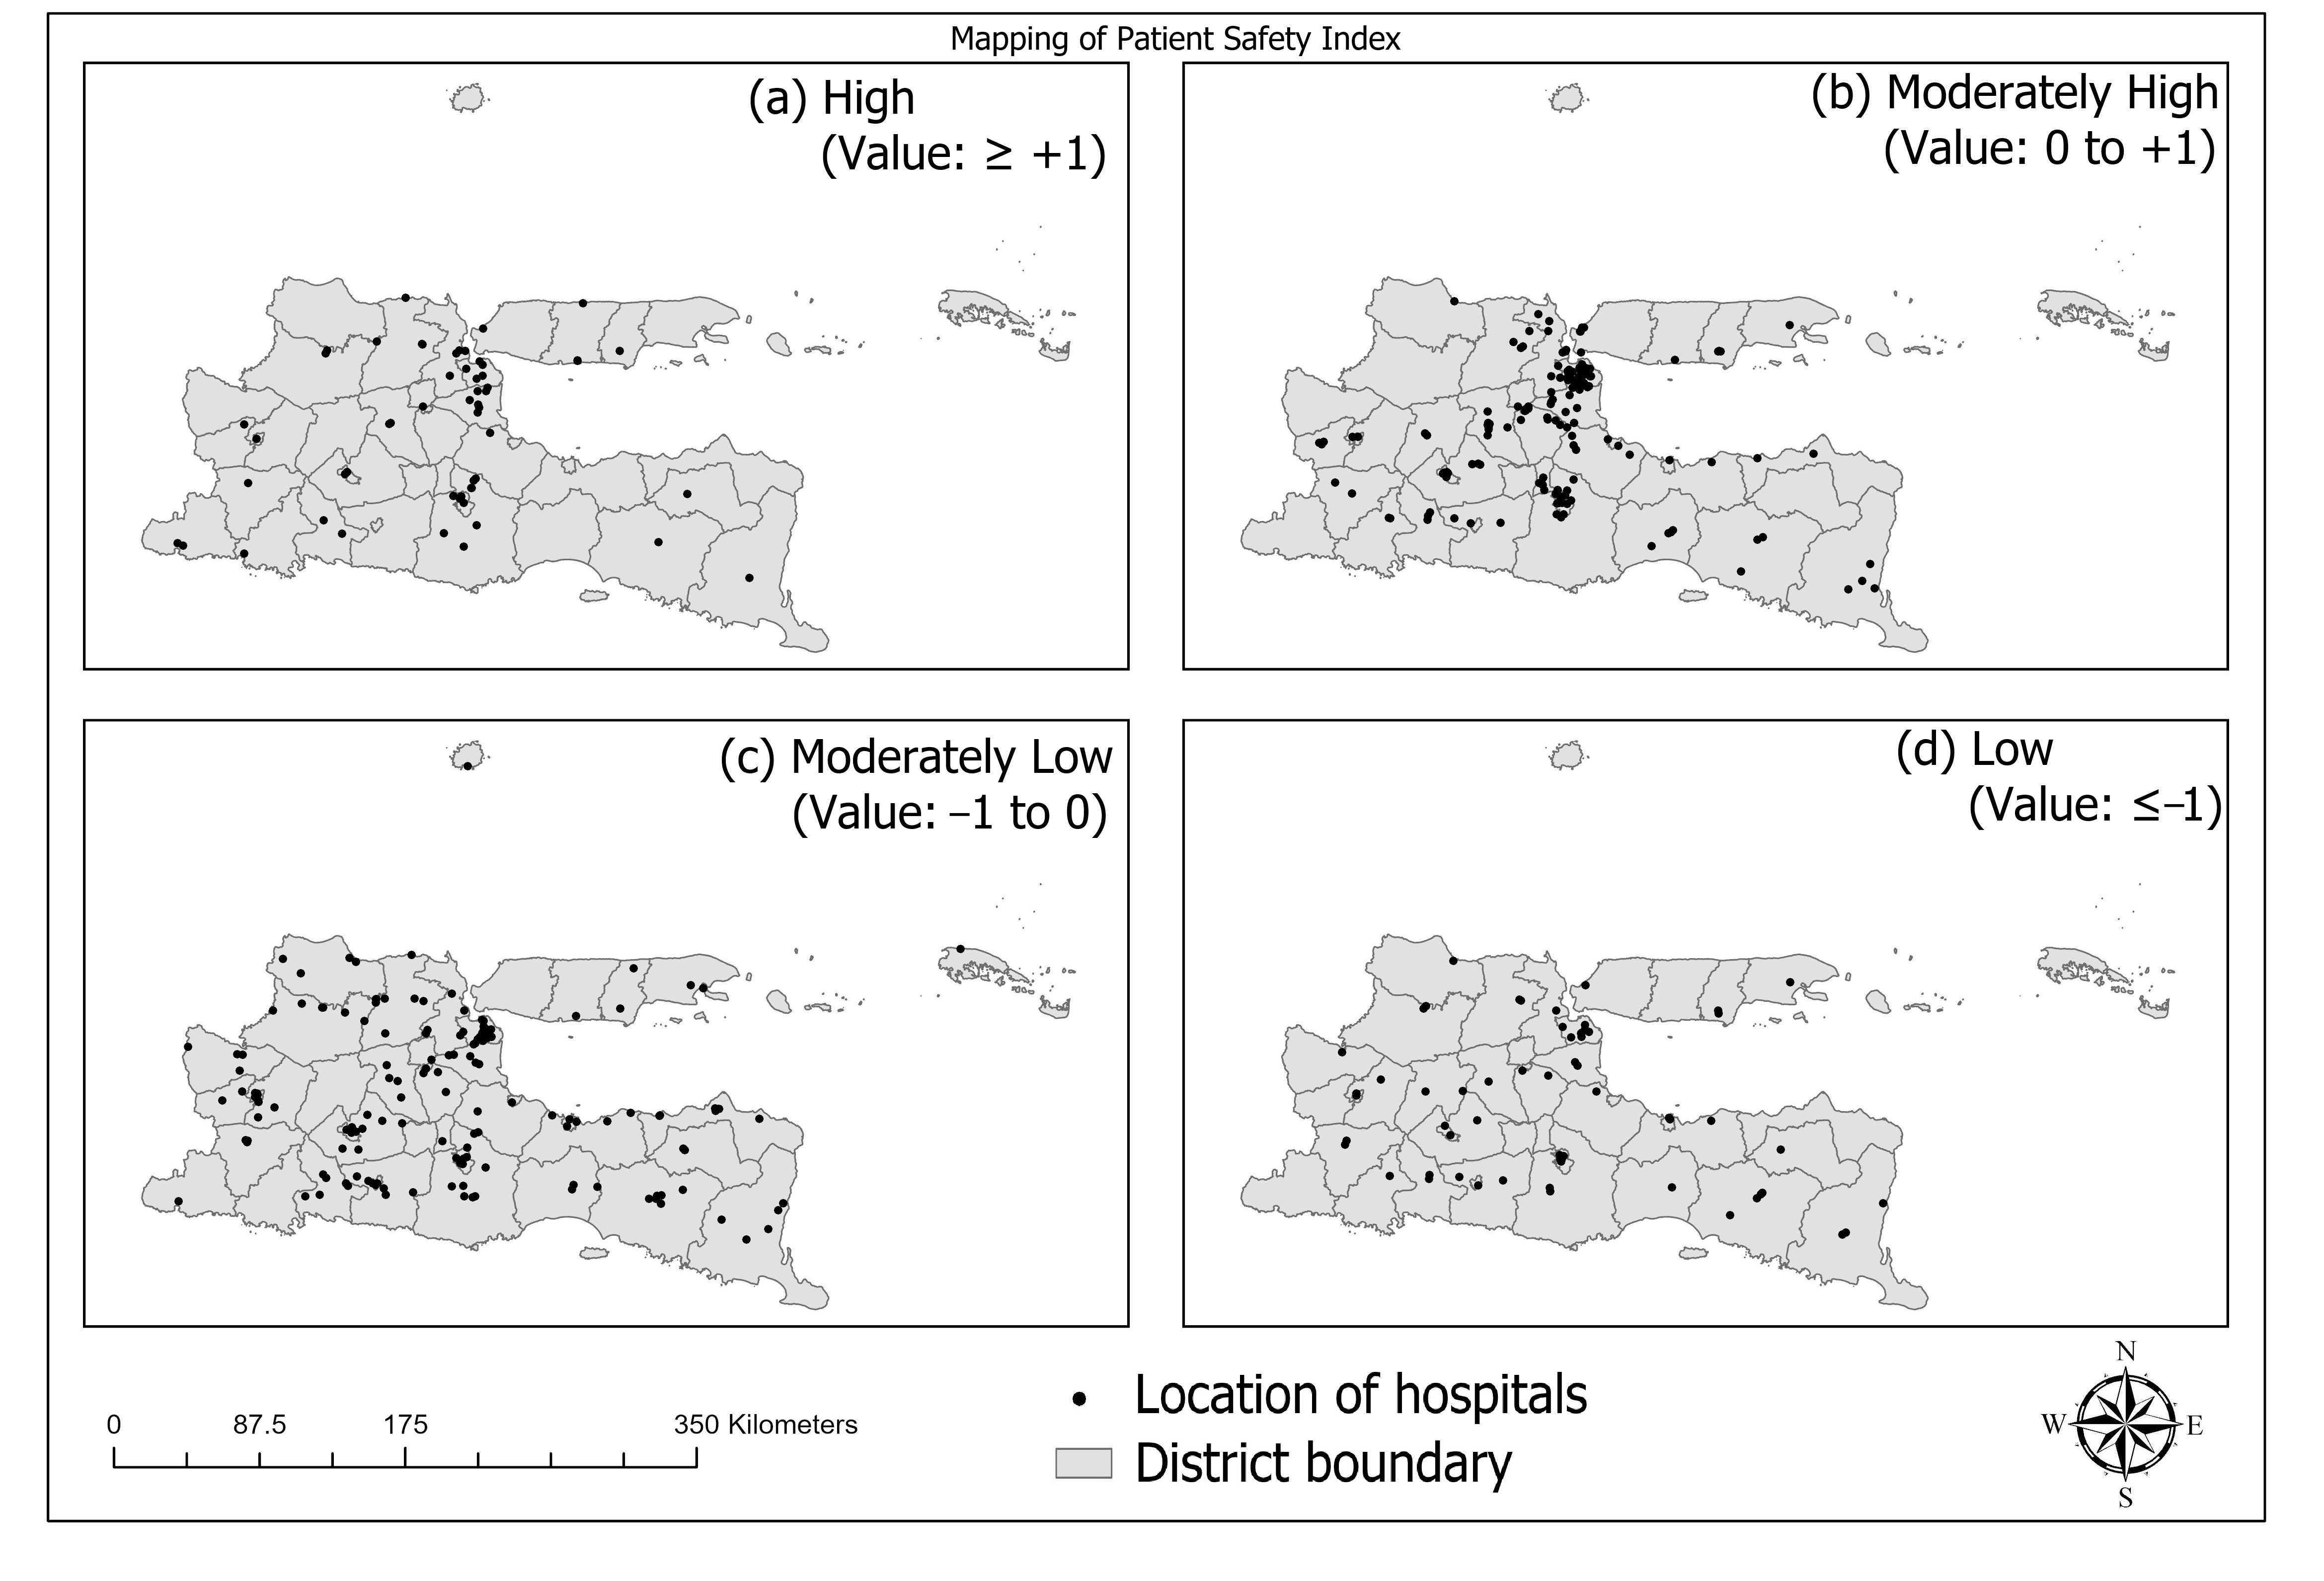
Similar to COI, the spatial distribution of the PSI, where higher values indicate lower mortality rates and better mortality-oriented patient safety performance, reveals predominantly intermediate safety levels across East Java districts (
Figure 10). Most hospitals were clustered within the moderately high and moderately low categories, indicating that mortality-oriented patient safety outcomes are generally acceptable but not consistently optimal. Districts such as Surabaya (moderately high:
n = 31) and Sidoarjo (moderately high:
n = 13) exhibited relatively strong safety profiles, reflecting better clinical performance in highly urbanized and resource-rich settings. Similarly, Malang (high:
n = 7; moderately high:
n = 7) and Gresik (high:
n = 4; moderately high:
n = 9) demonstrated comparatively favorable distributions, suggesting concentration of hospitals with stronger outcomes. The PSI should be interpreted as a composite summary of the overall crude mortality burden across East Java hospitals. Given the high correlation between its component indicators (r = 0.826 between Z_GDR and Z_NDR), it does not represent a multidimensional measure of independent mortality-oriented patient safety constructs.
Despite these encouraging patterns, hospitals classified within the high-PSI category remained relatively scarce across the province. Notable concentrations were observed only in a limited number of districts, including Malang (
n = 7), Sidoarjo (
n = 7), and Surabaya (
n = 5). In contrast, hospitals with lower-PSI category were more widely dispersed, with the largest number located in Surabaya (
n = 8) and Malang (
n = 5), as well as in several other districts with smaller clusters. Additionally, a substantial number of hospitals fell within the moderately low PSI category in districts such as Malang (
n = 11) and Surabaya (
n = 18), indicating substantial variations in mortality-oriented patient safety outcomes within the same districts. Overall, the findings suggest that while extremely poor safety outcomes are relatively uncommon, the absence of a strong concentration of high-performing hospitals and the persistence of intra-district disparities indicate significant opportunities for improvement. Strengthening quality and safety initiatives, particularly in hospitals performing within the moderately low category, may help reduce geographic variation and support more consistently high mortality-oriented patient safety standards across the province (
Figure 6).
3.4. Outcomes of Global Moran’s I
Table 2 summarizes Global Moran’s I results at the hospital and district level. The spatial analysis showed different patterns between hospital-level and district-level indicators. At the hospital level, neither the COI (Moran’s I = −0.005,
p = 0.905) nor the PSI (Moran’s I = 0.025,
p = 0.218) demonstrated significant spatial autocorrelation, indicating that hospital performance and mortality outcomes were not geographically clustered or relatively randomly distributed across East Java. The low Moran’s I value indicates that variations in patient safety outcomes are spatially random across individual hospitals. These findings imply that geographic proximity does not play a dominant role in shaping patient safety outcomes at the micro (hospital-level) scale.
In contrast, at the district level, PSI showed significant positive spatial autocorrelation (Moran’s I = 0.348, p = 0.004), indicating that districts with similar patient safety outcomes tended to be located near one another. Districts with similar poor outcomes were more likely to be surrounded by districts with similar outcomes. This finding suggests that patient safety outcomes, in this case the mortality pattern, may be influenced by broader contextual factors operating at the district level, such as healthcare resources, referral systems, workforce availability, and socioeconomic conditions.
Because PSI was derived from two mortality indicators, GDR (Moran’s I = 0.353, p = 0.004) and NDR (Moran’s I = 0.342, p = 0.005), these indicators were analyzed separately to assess the robustness of the findings. Both GDR and NDR also demonstrated significant spatial clustering. These results suggest that the observed spatial pattern in PSI is primarily driven by geographic differences in mortality outcomes across districts.
3.5. Subgroup Spatial Autocorrelation by Institutional Characteristics
To examine whether the overall absence of hospital-level spatial clustering in COI and PSI masked differential patterns across institutional subgroups, Global Moran’s I was computed separately for hospitals stratified by class, ownership, and type. Results are presented in
Table 3.
The most notable finding was significant positive spatial autocorrelation of PSI among Class A and B hospitals (Moran’s I = 0.206, p < 0.001), indicating that higher-tier hospitals meaningfully differed in their mortality-oriented safety outcomes. In contrast, Class C and D hospitals showed no significant COI clustering (Moran’s I = −0.008, p = 0.829) and only borderline significant PSI clustering (Moran’s I = 0.053, p = 0.020). Among ownership groups, private sector hospitals showed borderline significant COI clustering (Moran’s I = 0.052, p = 0.047) while public hospitals showed no significant clustering for either index. General and maternity hospitals showed no significant clustering for COI or PSI.
3.6. Local Spatial Autocorrelation of Individual Patient Safety Indicators
Local Moran’s I analysis was conducted to identify the specific location of spatial clusters at the district level for COI, PSI, and individual indicators of PSI, i.e., GDR and NDR. This analysis provides a more detailed understanding of localized patterns of outcomes across East Java.
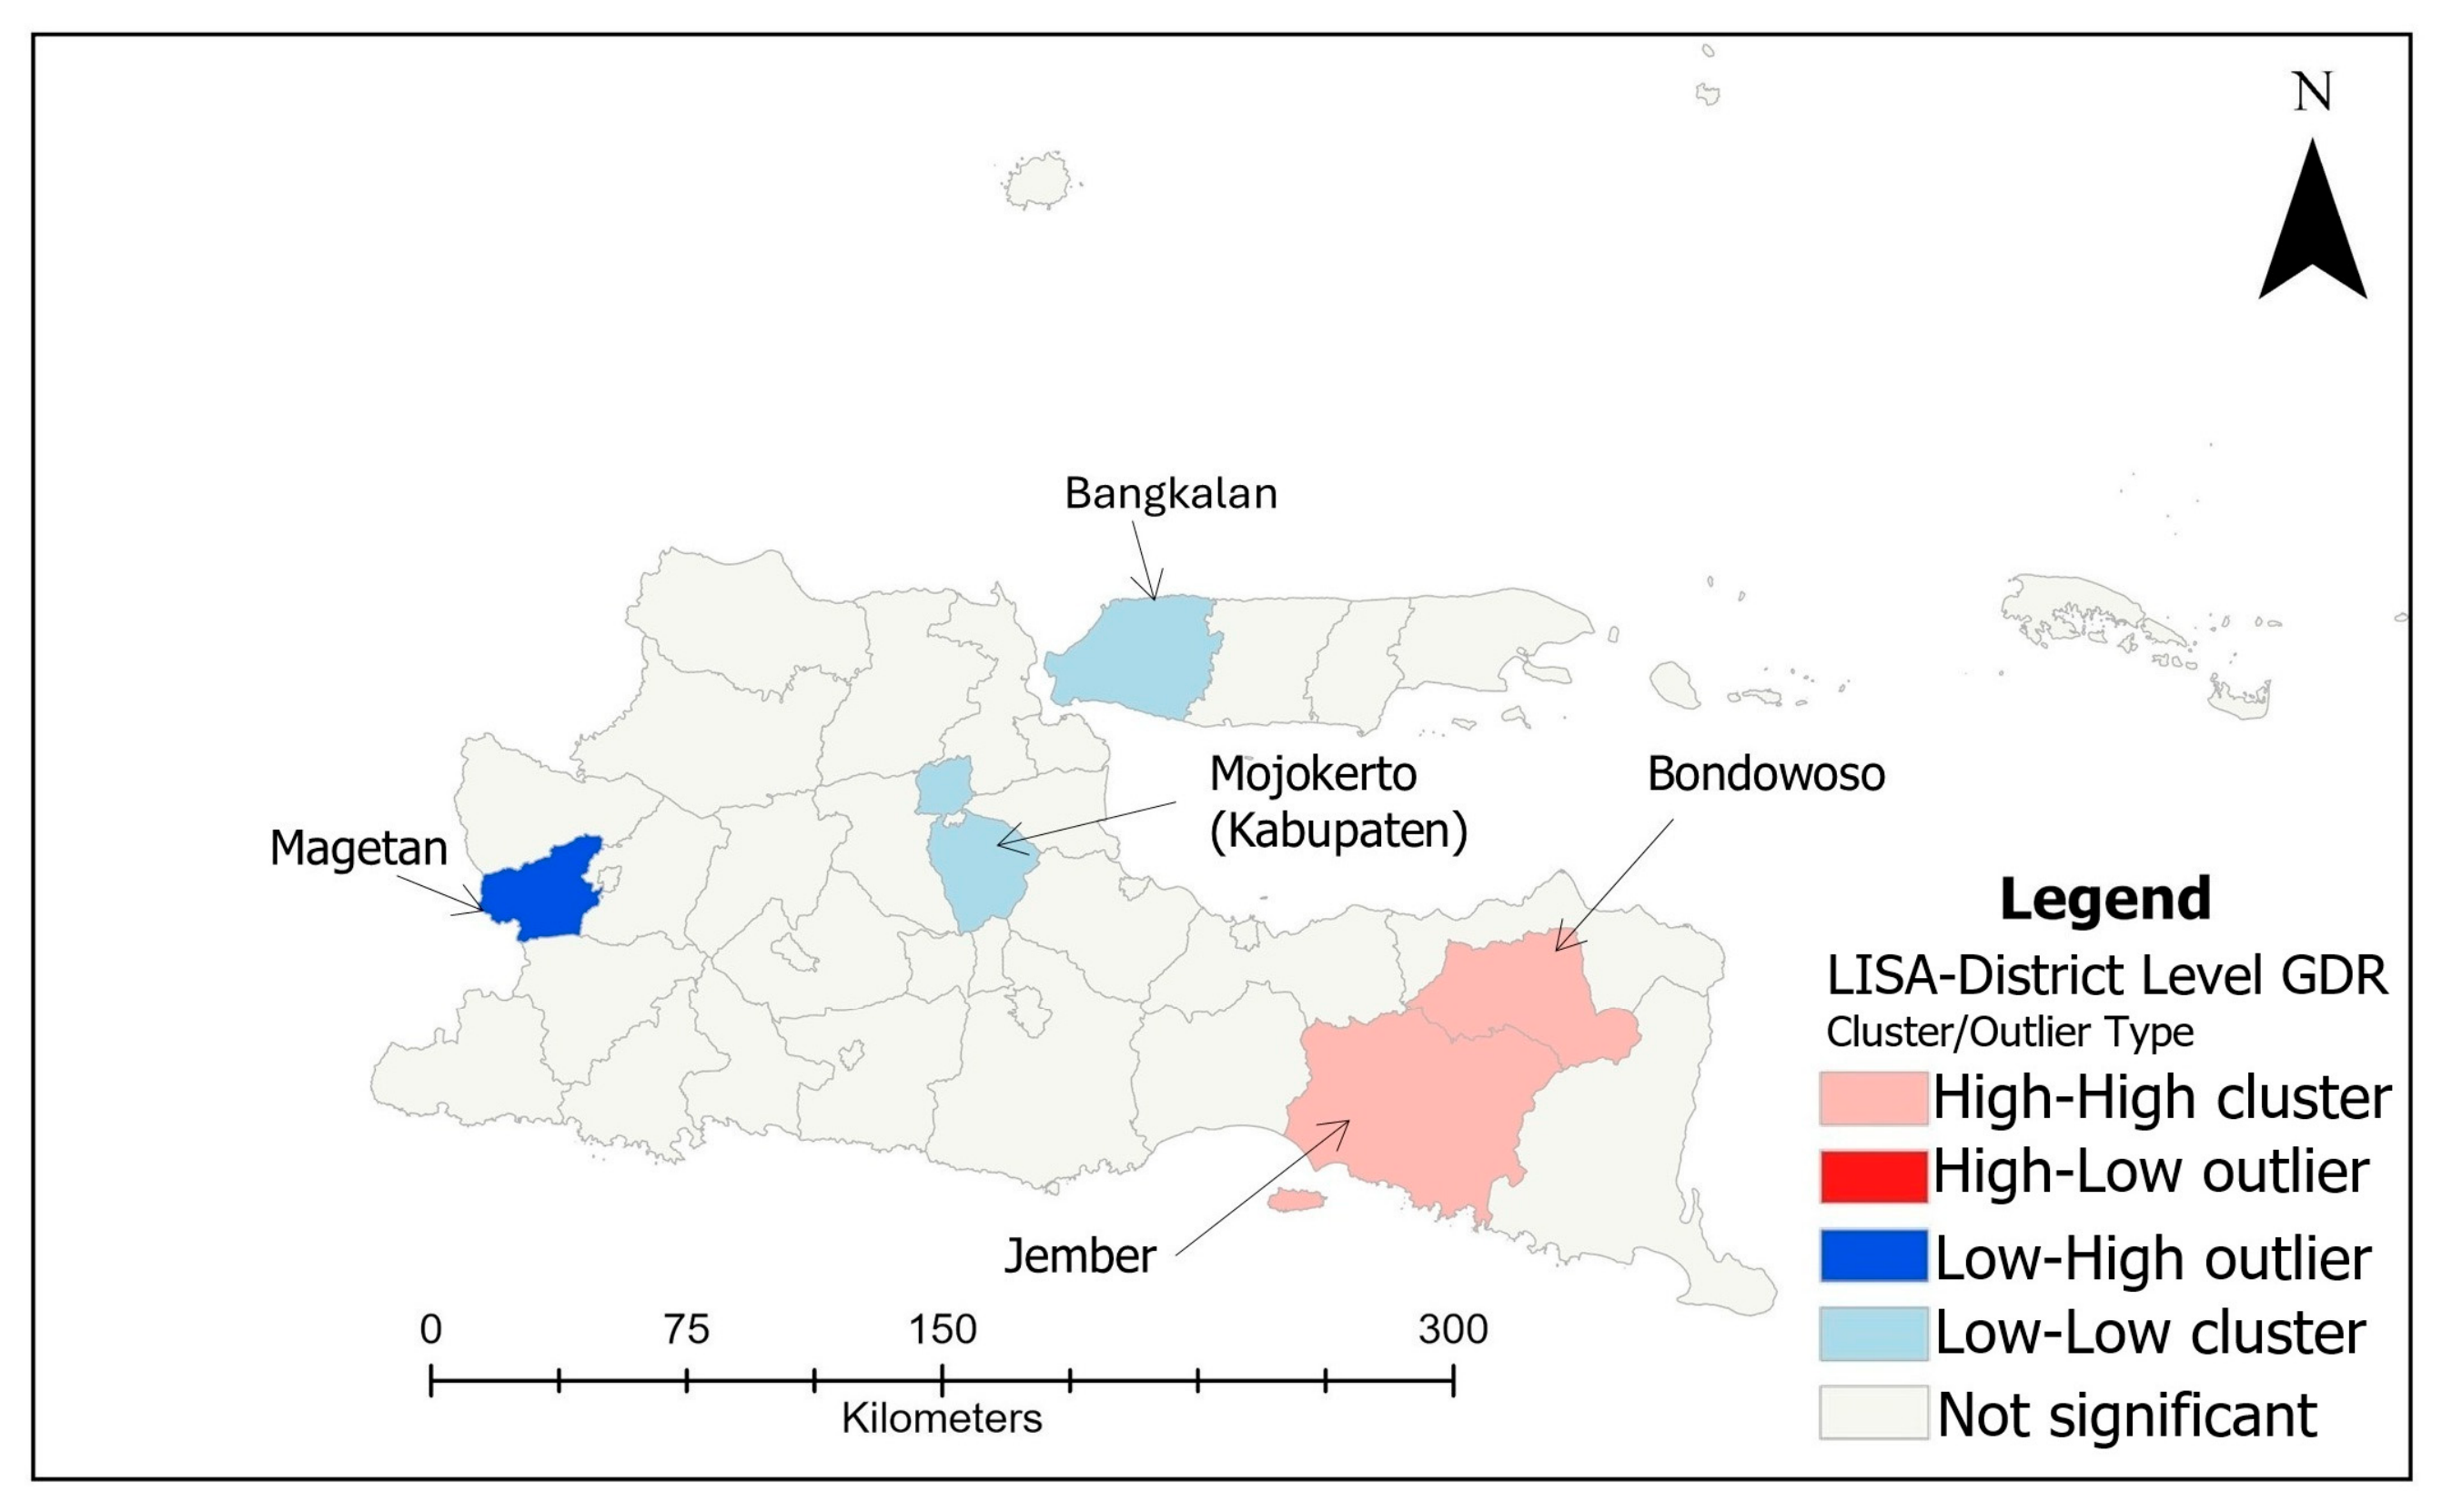
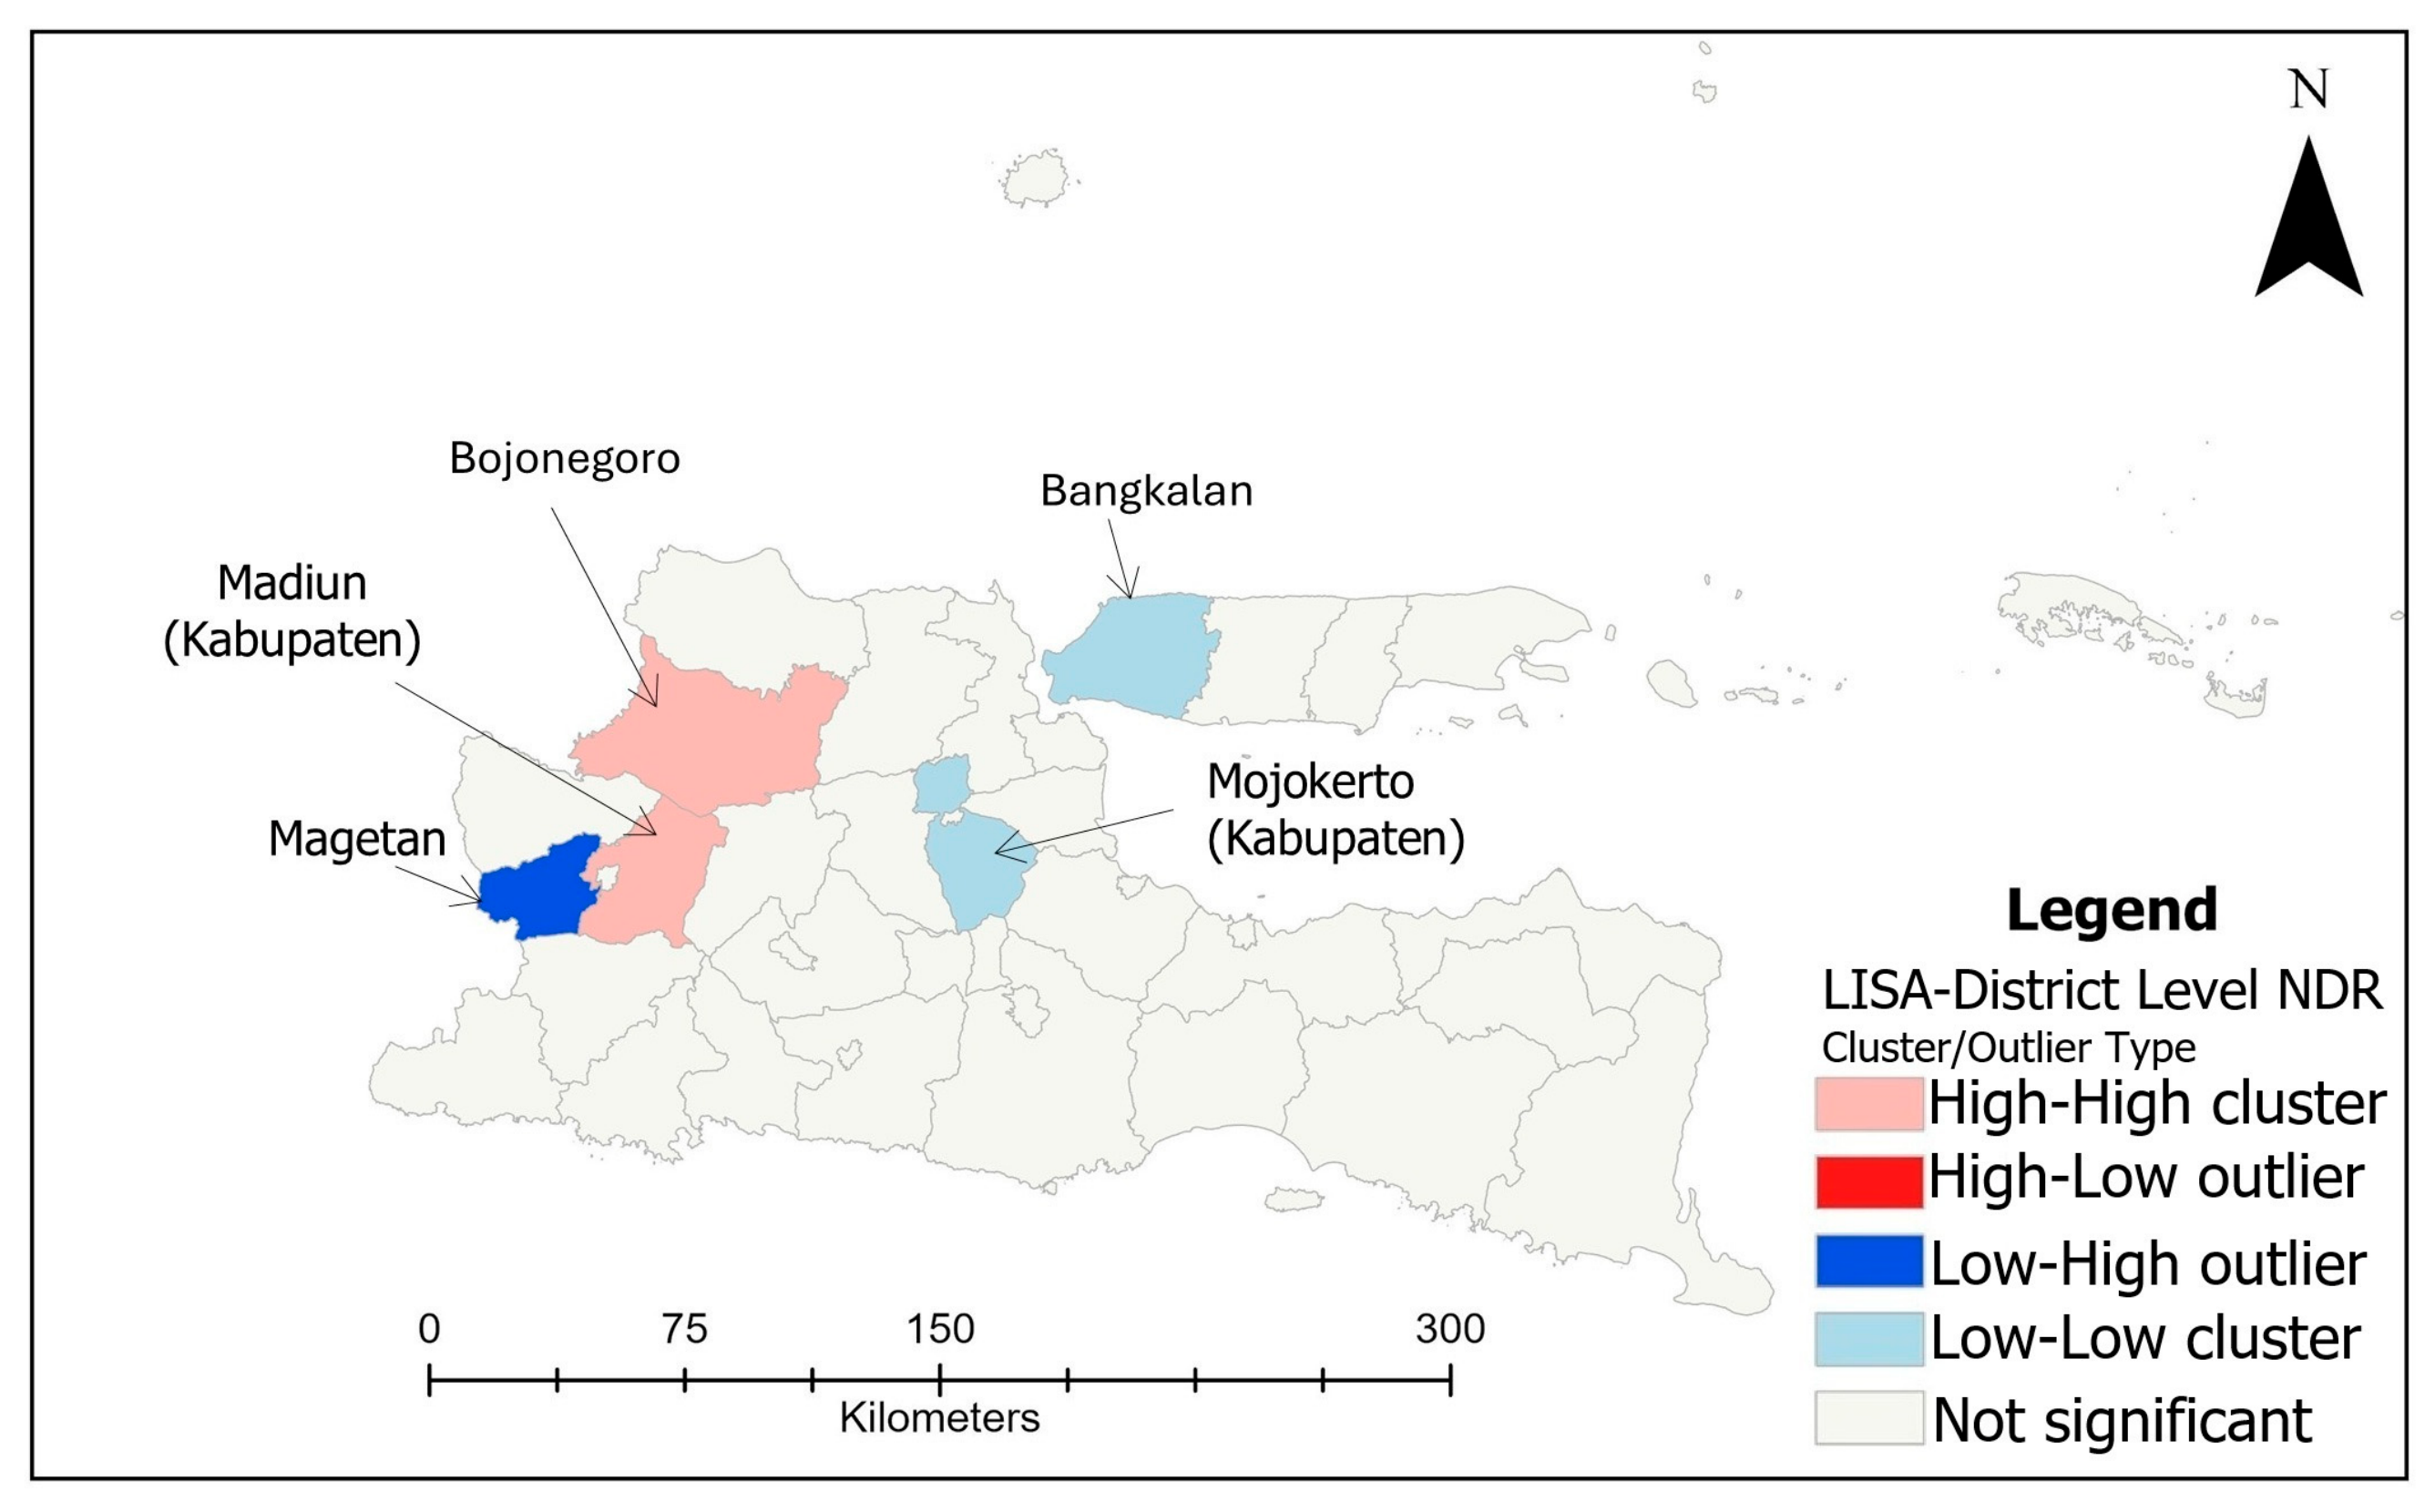
For both COI and PSI, the local Moran’s I remained insignificant. However, for both GDR and NDR, significant low–low (LL) clusters were identified in Mojokerto and Bangkalan (
Figure 11 and
Figure 12), indicating districts with consistently low mortality rates that were surrounded by neighboring districts exhibiting similarly favorable outcomes. Additionally, a low–high (LH) spatial outlier was observed in Magetan, representing a district with relatively low mortality surrounded by relatively higher-risk neighboring districts. High–high (HH), representing districts with elevated mortality rates surrounded by neighboring districts with similarly high mortality, were also detected for both indicators, although their exact locations varied slightly. For GDR, HH clusters were observed in Bondowoso and Jember, whereas for NDR, they were identified in Madiun and Bojonegoro. Importantly, these HH clusters were in adjacent districts, suggesting the presence of a regional hotspot of elevated mortality as compared to surrounding regions. No high–low (HL) cluster was observed in either GDR or NDR.
Overall, the appearance of high-risk clusters across both indicators, together with the spatial proximity of low-risk areas, indicates robust and spatially coherent patterns in PSI outcomes at the district level, reflecting underlying regional disparities.
4. Discussion
4.1. Scale-Dependent Spatial Clustering and Institutional Heterogeneity
The absence of significant spatial autocorrelation in hospital operational performance and mortality-oriented patient safety outcomes at the overall facility level suggests that geographic proximity between hospitals does not uniformly explain variations in outcomes across East Java. This finding indicates that outcomes are probably driven by facility-specific characteristics such as workforce capacity, organizational governance, and institutional classification rather than geographic location alone. In a structurally heterogeneous hospital system where private, public, military, faith-based, and specialist facilities coexist within the same geographic space, such institutional diversity can surpass any detectable spatial signal when all hospitals are analyzed together [
40].
Subgroup spatial autocorrelation analyses stratified by institutional characteristics reveal that overall absence of clustering conceals underlying spatial pattern across hospital types. Class A and B hospitals showed significant spatial clustering of mortality-oriented patient safety outcomes (Moran’s I = 0.206, p < 0.001), while Class C and D hospitals showed no significant clustering for operational performance and only borderline clustering for mortality-oriented patient safety. This contrast indicates that higher-tier hospitals, which are fewer in number and more geographically concentrated in urban and peri-urban centers like Surabaya, share common patient safety environments, and referral concentration and institutional proximity are possible factors contributing to their mortality-oriented patient safety outcomes. Lower-tier hospitals in overall Indonesia, including East Java, are widely dispersed across both suburban and rural districts, and their outcomes reflect local institutional conditions rather than shared geographic environments. Public hospitals showed no significant clustering for either index, reflecting their more uniform geographic distribution mandated by government service delivery obligations.
These subgroup spatial autocorrelation findings provide a specific and empirically grounded explanation for the scale-dependent clustering pattern originally observed in this study. A possible explanation for this might be that when all hospital types are pooled, the spatial signals from geographically concentrated higher-tier facilities are diluted by the dispersed distribution of lower-tier facilities. This resulted in overall nonsignificant results. However, aggregation to the district level recovers the district-level shared characteristics, likely the governance and resource environment that influences all hospitals within a district simultaneously. It is notable that administrative districts in Indonesia function as governance units that impose common structural conditions, including health budget allocation, workforce deployment, and referral system organization, on all hospitals operating within them. Thus, the role of shared governance in shaping district-level clustering cannot be ruled out. But it cannot be asserted with certainty because the present analysis does not directly test the underlying causes of spatial patterns.
The spatial patterns discovered in our results are in line with those obtained by studies of similar scope. For instance, scale-dependent clustering similar to our findings has been reported by Roberson et al. (2016) [
43]. In their study, they found no evidence (
p > 0.05) of significant global clustering of stroke hospitalization risks, but local Moran’s revealed spatially significant clusters of mortality risks. Similarly, district-level spatial clustering of health outcomes has been documented by a study conducted in Beijing, China [
44]. In this study, they identified districts where the impact of health services has weakened over time using spatial analysis. Obviously, no direct comparison can and should be made between our study and the studies referred to above since our study investigates the hospital’s performance and mortality-oriented patient safety outcomes while the other studies investigated different dimensions of healthcare outcomes. However, mentioning it is worthwhile in this discussion due to commonality in the method of spatial analysis.
4.2. Institutional Composition of Performance and Safety Categories
The distribution of COI and PSI across institutional characteristics offers empirical grounding for understanding what drives hospitals’ performance variation in East Java. These findings explain which types of hospitals are linked to better or worse outcomes, based on their institutional characteristics.
Regarding operational performance, the majority of hospitals across all classes fell within the moderately high and moderately low categories, indicating that extreme performance in either direction is relatively uncommon across the province. Plenary-accredited hospitals had the highest proportion of moderately high COI performers at 56.5%, while intermediate-accredited hospitals had the highest proportion of low performers at 25.0%, suggesting that a higher accreditation level is associated with meaningful operational performance differences. Similar results have been reported by an earlier study by Wardhani et al. (2019) [
45], in which accredited hospitals had higher utility and efficiency indicators.
For mortality-oriented patient safety outcomes, a notably different pattern emerged. Class A hospitals had the highest proportion of low PSI scores at 71.4%, indicating worse patient safety outcomes in terms of crude mortality burden, while Class D hospitals showed the highest proportion of high PSI scores at 37.3%, reflecting lower crude mortality rates. One possible explanation for high mortality is that Class A hospitals are top-level referral hospitals where critically ill patients are transferred from lower-tier facilities across the province. This does not necessarily reflect low care quality. This interpretation is reinforced by the subgroup spatial clustering findings in which Class A and B hospitals cluster significantly in their PSI outcomes, consistent with their shared role as referral destinations concentrated in specific geographic zones and receiving similar patient profiles of high complexity and severity. Furthermore, maternity and specialist hospitals showed predominantly better mortality-oriented patient safety outcomes. The possible reasons include availability of specialized doctors, emergency readiness, and standardized protocols tailored strictly to maternal and newborn care.
These institutional composition findings demonstrate that the absence of overall hospital-level spatial clustering should not be interpreted as evidence of performance homogeneity. Rather, it reflects a complex mix of institutional types with systematically different performance profiles that, when analyzed together, produce a spatially dispersed overall distribution. Institutional stratification is therefore an essential complementary analytical lens alongside spatial analysis for understanding hospital performance variation in heterogeneous health systems.
4.3. Governance Implications and Policy Recommendations
The convergence of spatial and institutional findings in this study points to a dual governance challenge in East Java’s hospital system. At the district level, shared governance environments shape common mortality-oriented patient safety profiles across all hospitals within a district. At the facility level, institutional characteristics, including hospital class, accreditation status, and ownership type, systematically stratify both operational performance and mortality-oriented patient safety outcomes in ways that are not geographically determined but are amenable to targeted institutional intervention.
These findings are consistent with evidence from Indonesia’s decentralized health system, in which district governments bear primary responsibility for health service management and quality oversight [
8]. Moreover, the variation in service delivery can be caused by several interrelated factors, including health workforce availability, financing, and governance. Similar variation across districts and homogeneity inside the districts has also been documented in Pakistan, which also operates a decentralized healthcare system [
46].
For policymakers, these findings suggest that improving hospital patient safety in East Java requires interventions operating at two levels simultaneously. Implementing customized approaches for high-risk districts identified through spatial cluster analysis is likely to be more effective than uniform policies applied equally across all facilities. At the facility level, the strong institutional stratification of performance and safety outcomes points to the need for differentiated quality improvement strategies that account for hospital class, accreditation level, and ownership type. Interventions focused exclusively on individual hospitals without addressing the shared district-level governance conditions that shape their operating environment are unlikely to produce sustained improvements in patient safety. These findings are directly relevant to SDG Target 3.8 on universal health coverage and SDG Target 3.d on strengthening health system resilience [
47,
48].
4.4. Limitations and Future Directions
Several limitations should be acknowledged. First, the non-availability of patient-level clinical data means that case-mix adjustment was not possible, and the analysis is limited to the use of reported administrative data that may have its own potential inconsistencies, particularly among smaller private facilities. In addition, the crude mortality indicators used in this study should be interpreted as measures of mortality-oriented patient safety rather than adjusted quality-of-care estimates. Second, the PSI was constructed using only GDR and NDR, which share substantial statistical variance. The PSI therefore functions primarily as a composite summary of overall crude mortality burden rather than a multidimensional patient safety construct, and its findings should be interpreted at that level of abstraction. Third, the 38 administrative districts represent governance boundaries rather than analytically optimized spatial units, and alternative boundary definitions may yield different clustering patterns.
Future research should incorporate longitudinal data to examine whether spatial clustering patterns and institutional performance gradients are stable over time or sensitive to policy changes. Patient-level clinical data including case-mix variables would enable risk-adjusted mortality analysis. A broader set of patient safety indicators, including healthcare-associated infection rates, surgical complication rates, and unplanned readmission rates, would enable construction of a more genuinely multidimensional patient safety composite. Spatial regression models incorporating district-level contextual variables, such as health expenditure per capita, workforce density, and socioeconomic indicators, would help identify the specific governance and resource mechanisms that are responsible for certain spatial patterns in mortality-oriented patient safety outcomes.
5. Conclusions
This study makes a methodological contribution by implementing comprehensive spatial mapping, spatial autocorrelation analysis, and institutional composition analysis within the context of hospital operational performance and mortality-oriented patient safety outcomes. By constructing separate composite indices for operational performance and mortality-oriented patient safety, and by examining their spatial patterns at both hospital and district scales, the analysis provides a more comprehensive understanding of healthcare quality than single-indicator approaches. The subgroup spatial analyses further demonstrate that overall spatial patterns at the hospital level mask important institutional heterogeneity, a finding that advances methodological understanding of how to apply spatial analysis in structurally diverse hospital systems.
The findings suggest that variations in hospital performance and patient safety outcomes in East Java are driven by institutional characteristics rather than geographic proximity. However, it does not establish that geography has no role at all because certain spatial patterns exist. For instance, while no significant clustering was observed at the overall hospital level, meaningful spatial patterns emerged at the district level for patient safety outcomes, highlighting the importance of local governance environments in shaping outcomes across facilities within the same administrative boundary. Importantly, subgroup analyses revealed that Class A and B hospitals show significant spatial clustering of patient safety outcomes. The institutional composition analysis further showed that hospital class, accreditation status, and ownership type are systematically associated with performance and safety category distributions, providing empirical grounding for the governance interpretation advanced in this study.
These results contribute to the growing application of GIS in public health research by demonstrating how routinely collected administrative data can be leveraged to identify geographic disparities, examine institutional drivers of performance, and support evidence-informed decision-making. For policymakers, the findings highlight the need to prioritize districts with persistently elevated mortality burden while simultaneously addressing the institutional conditions. Geographically targeted governance strategies focusing on high-risk districts should be combined with institution-specific quality improvement efforts tailored to hospital class and accreditation level. A structured cross-district peer learning mechanism, enabling districts with favorable outcomes to share effective management practices with high-risk neighbors, represents a practical and low-cost policy instrument that the findings of this study can directly inform.