Article

Quantifying Spatial Complexity and Signage Distribution in Large-Scale Hospital Wayfinding: A Space Syntax Analysis of a Medical Center


by
Keunhye Lee
,
Taebean Lim
,
Kilho Lee
and
Chong-Ku Park
*
Department of Interior Architecture, Gachon University, Seongnam-si 13120, Republic of Korea
*
Author to whom correspondence should be addressed.
ISPRS Int. J. Geo-Inf. 2026, 15(9), 399; https://doi.org/10.3390/ijgi15090399
Submission received: 29 June 2026 / Revised: 16 August 2026 / Accepted: 26 August 2026 / Published: 2 September 2026

Abstract

Wayfinding difficulty in large-scale hospitals constitutes a form of healthcare accessibility barrier, affecting patient experience, appointment adherence, and operational efficiency—particularly for elderly, first-time, and cognitively burdened users. This study examines the relationship between spatial configuration and signage distribution as a spatial diagnostic framework for evaluating healthcare navigability, using the outpatient department of Asan Medical Center (AMC), one of the largest tertiary hospitals in Republic of Korea, as a critical case. Using a non-intrusive analytical framework grounded in GIScience and spatial analysis, the study combines axial analysis, Visibility Graph Analysis (VGA), and a georeferenced inventory of 194 wayfinding signs to evaluate the degree of correspondence between movement structure, visual accessibility, and informational support across two outpatient floors. The results show that the outpatient circulation system is organized around a dominant southern horizontal corridor that functions as the principal configurational and visual spine. Existing signage is spatially concentrated along this corridor and at several major nodal intersections; however, no significant monotonic relationship was found between axial integration and signage count on either floor. Instead, the Ground floor showed a significant U-shaped distribution across integration groups, with denser signage in both highly integrated and peripheral segments than in intermediate-integration segments, while the First floor showed a comparatively even distribution. Together with the VGA and georeferenced signage analyses, these results reveal a differentiated spatial relationship that cannot be explained by a simple reinforcement model alone. These findings demonstrate the importance of evaluating how informational support is distributed across spatially differentiated environments, with implications for healthcare accessibility planning and evidence-based hospital design.

1. Introduction

Navigating large-scale hospitals presents significant cognitive and spatial challenges for patients, visitors, and first-time users, and these challenges constitute a form of healthcare accessibility barrier that has direct consequences for patient outcomes and institutional efficiency. Hospital layouts are often characterized by multi-wing structures, interconnected floor plates, layered circulation systems, and repeated decision points, all of which can increase disorientation, prolong travel times, and intensify reliance on staff assistance [1,2,3]. These difficulties are not merely matters of inconvenience; they constitute measurable barriers to healthcare access, linked to patient anxiety, missed appointments, reduced operational efficiency, health inequity for vulnerable populations, and the overall quality of the healthcare experience [4,5].
These challenges are especially pronounced in contemporary Korean tertiary hospitals, which represent a distinctive and internationally significant case for healthcare accessibility research. Over the past two decades, Korean tertiary hospitals have undergone rapid and large-scale growth driven by centralized healthcare policy, high patient concentration, and successive institutional expansions. Major facilities now routinely exceed 100,000 square meters in floor area and accommodate daily outpatient volumes that are extraordinary by global standards [6,7]. Asan Medical Center, for example, reports an average of 11,377 outpatients per day [8], illustrating the overall operational scale of the institution. This scale of operation, combined with the layered and heterogeneous spatial structures that result from phased construction, creates navigational conditions that are both more extreme and more structurally complex than those found in most Western hospital settings studied in the existing literature. Examining wayfinding and spatial accessibility within this context therefore offers insights that extend beyond the Korean case, contributing to a broader international understanding of how healthcare navigability can be evaluated in high-density, high-complexity medical environments.
Traditional responses to hospital wayfinding problems have focused primarily on signage enhancement, color-coding systems, digital navigation tools, and environmental graphics [5,9,10]. While such interventions can improve navigational support, they do not necessarily address the underlying spatial conditions that contribute to wayfinding difficulty. In hospitals with deep corridor networks, ambiguous decision points, and limited visual continuity, even well-developed signage systems may struggle to compensate for configurational weakness [11,12,13,14,15]. For this reason, wayfinding should not be understood solely as a problem of providing more information, but as a question of how informational support relates to the spatial and visual structure of the built environment.
Despite growing recognition of the importance of spatial configuration in navigation, substantial gaps remain in hospital wayfinding research. Many Korean studies have relied on user surveys, interviews, or post-occupancy evaluations to capture navigation experience [16,17,18,19]. Although such approaches are valuable for understanding perceived difficulty, they are less suited to identifying the structural spatial properties that shape navigation [20,21,22]. Earlier space syntax studies of Korean hospitals demonstrated that integration-based analysis can offer useful insight into outpatient wayfinding and signage placement; however, these studies focused primarily on configurational structure or sign location in isolation, and were generally conducted in hospital settings considerably smaller in scale and operational complexity than contemporary Korean tertiary hospitals [16,17,23,24]. More recent Korean research also suggests that, as hospital systems have grown in scale and complexity, signage has become increasingly important not only for directional guidance but also for the delivery of clear information throughout the patient journey [16,17,25]. Taken together, these studies suggest that hospital wayfinding problems should be understood not simply as issues of user confusion, but as outcomes shaped by the interaction between spatial structure and information systems.
A further limitation of the existing literature is that spatial configuration and signage are often examined separately. Studies grounded in space syntax frequently focus on circulation structure, integration, or movement patterns, whereas signage studies tend to focus on visibility, legibility, or user satisfaction. Fewer studies have investigated how the distribution of wayfinding signage corresponds to configurational and visual structure within large-scale healthcare environments. Yet this relationship is important, because effective wayfinding depends not only on the presence of signage, but also on whether informational support is distributed in ways that respond appropriately to uneven spatial and perceptual conditions.
This issue is particularly important in operational hospital settings, where direct behavioral observation is often limited by ethical and practical constraints. Although international space syntax studies have shown meaningful association between configurational measures and navigation-related behavior [11,15,22,26], continuous user tracking or experimental observation is not always feasible in active clinical environments. There is therefore a need for non-intrusive analytical frameworks that can interpret hospital wayfinding environments through the relationship between spatial structure and informational support.
This study addresses these gaps through a spatial-signage alignment analysis of the outpatient department of Asan Medical Center. Rather than treating signage as an isolated graphic layer, the study examines it as part of the broader navigational environment in relation to spatial configuration and visual accessibility. Specifically, the study aims to: (1) examine the configurational and visual structure of the hospital layout through axial and VGA-based measures; (2) map the distribution of the existing wayfinding signage system across the study area; (3) evaluate the degree of correspondence between spatial structure and signage distribution, with particular attention to whether the existing system operates through informational reinforcement or compensatory support; and (4) develop an interpretive framework for identifying areas of potential wayfinding difficulty in large-scale healthcare environments.
By integrating space syntax measures, visibility-based analysis, and a georeferenced signage inventory, this study proposes a non-intrusive spatial diagnostic framework for interpreting hospital wayfinding. This study extends healthcare accessibility research to the building-interior scale by treating circulation, visual accessibility, and georeferenced wayfinding infrastructure as components of healthcare access. By doing so, it seeks to contribute not only to hospital wayfinding research, but also to the broader use of spatial analysis for evaluating how informational infrastructure is embedded within complex built environments.

2. Literature Review

2.1. Wayfinding in Healthcare Environments

Wayfinding is commonly understood as the cognitive and behavioral process through which individuals determine, follow, and confirm a route to a desired destination [9,10,14,27]. Research in environmental psychology and architectural studies has long shown that successful navigation depends not only on individual cognitive ability but also on the legibility of the built environment itself. Lynch’s (1960) work on imageability demonstrated that spatial structure influences how environments are perceived and remembered [28], while Arthur and Passini further argued that wayfinding is a staged process involving information processing, decision making and decision execution [1,9,27]. From this perspective, navigation is not a simple act of movement, but an ongoing interaction between users and spatial cues embedded in the environment.
Within healthcare environments, this interaction becomes especially demanding. Hospital users often navigate under conditions of time pressure, emotional stress, physical discomfort, unfamiliarity, and reduced attentional capacity [2,21]. These conditions increase dependence on environmental support and make clear spatial organization particularly important. In such settings, wayfinding difficulty cannot be explained solely by individual confusion; it is closely related to how spatial structure, visual access, and informational cues are organized within the facility. Irregular geometries, repeated corridors, unclear junctions, and weak visual continuity can all increase the burden of orientation, particularly in multi-level or large-scale hospitals [29,30]. Conversely, access to visual anchors, broad sightlines, and clearly structured circulation can support orientation and reduce cognitive load.
Signage plays an important role in this process, but its contribution is conditioned by the environment in which it is placed. Previous studies have shown that signs are most effective when they are positioned at moments of decision demand, such as intersections, vertical transitions, or route-choice points [4,5,9,10]. At the same time, signage cannot fully compensate for spatially problematic environments, and excessive informational content can itself become burdensome in already complex settings. The design issue is therefore not simply whether a hospital has enough signs, but whether informational support is distributed in ways that correspond appropriately to underlying spatial and perceptual conditions. This is especially important for user groups such as elderly visitors, who may rely more strongly on landmarks and environmental cues than an abstract route knowledge [31].
A complementary body of wayfinding research has focused on the visual, perceptual, and communicative qualities of signage itself. Sign effectiveness depends not only on spatial location but also on characteristics such as color and contrast, pictogram design, typographic legibility, graphic complexity, and the clarity of information presentation [32,33,34,35,36]. Studies in healthcare settings have shown that color contrast, pictogram complexity, graphic symbols, and text characteristics can affect sign recognition, comprehension, and user preference, particularly among older users and people with visual limitations [32,34,35]. Research in environmental graphic design and cartographic communication similarly emphasizes that signs and maps function as communicative interfaces whose effectiveness depends on visual hierarchy, symbolization, consistency, and interpretability [37]. These studies highlight an important distinction between the spatial availability of wayfinding information and its communicative effectiveness. The present study addresses the former by examining how different types of signs are spatially distributed in relation to configurational and visual conditions, rather than evaluating the graphic, semantic, or perceptual performance of individual signs.
Taken together, international studies have established that healthcare wayfinding is influenced by spatial configuration, visual access, decision-point complexity, signage, and other environmental cues. They have also demonstrated the value of both behavioral approaches and spatial analytical methods for identifying conditions associated with navigational difficulty. However, these dimensions have often been examined separately. Behavioral studies have primarily focused on users’ perceived difficulty, route choice, or wayfinding performance, whereas spatial studies have tended to analyze configurational or visibility properties independently of the actual distribution of signage. Likewise, signage research has largely concentrated on information design, legibility, or user comprehension rather than on its spatial correspondence with configurational structure. As a result, the relationship between spatial configuration, visual accessibility, and the distribution of different types of wayfinding signs within large hospital environments remains insufficiently examined.
Wayfinding challenges comparable to those found in large hospitals have also been examined in other large-scale public and semi-public environments, particularly airport terminals and railway stations. Studies of airport terminals have shown that passenger orientation is influenced by terminal configuration, signage placement, and visual guidance, and have developed quantitative methods for evaluating both wayfinding performance and optimal sign location [38,39]. Research in mass-transit and railway-station environments has likewise demonstrated that navigation emerges from the interaction between spatial organization, decision points, pedestrian flow, and operational conditions [40,41]. Although transport terminals differ functionally from healthcare environments, both involve unfamiliar users navigating large, multi-destination circulation systems in which spatial configuration and environmental information must operate together. These studies therefore provide a broader context for examining signage as spatially embedded navigational infrastructure rather than as an isolated graphic system.
Within this broader international context, Korean hospital wayfinding research has increasingly recognized these issues, but much of the literature has remained divided between user experience studies and spatial analysis studies. Earlier work documented widespread patient difficulty in navigating hospital environments, while later studies began to examine the role of outpatient layout, signage systems, and visibility conditions more directly [16,17,18,23,24,25]. Some studies using space syntax showed that low-integration departments tend to be associated with increased wayfinding difficulty and greater need for guidance signage [17,23]. Within the Korean literature, however, most studies have still focused either on subjective difficulty or on signage as an independent support system, rather than examining how signage distribution corresponds to configurational and visual structure in large contemporary hospital environments. In relation to these findings, both international and Korean studies have demonstrated the importance of spatial configuration, visibility, environmental information, and user experience in hospital wayfinding. However, these dimensions have frequently been examined separately. Behavioral studies have primarily investigated perceived difficulty, route choice, or wayfinding performance, while spatial studies have focused on configurational or visibility properties, and signage studies have tended to examine information design or signage systems independently. Comparatively fewer studies have quantitatively examined how the georeferenced distribution of different signage types corresponds to both configurational and visual properties within a large operational hospital. From a GIScience perspective, spatial accessibility to healthcare has been extensively studied at the urban and regional scale [42,43], with foundational frameworks distinguishing multiple dimensions of access including physical proximity, availability, and usability [42,43,44]. More recently, GIS-based approaches have been applied to evaluate accessibility within healthcare environments at the building and neighborhood scale [45,46]. Intra-building accessibility, however, concerns a related but distinct scale: once users enter a healthcare facility, navigational access is conditioned by circulation networks, visual fields, decision points, vertical transitions, and the spatial distribution of information.
Space syntax provides a graph-based means of representing these internal configurational relationships, while visibility graph analysis (VGA) evaluates the visual accessibility generated by plan geometry [22,38,47,48,49]. In this study, georeferenced signage data are incorporated as an additional spatial information layer, allowing the distribution of informational elements to be compared with configurational and visual measures. This approach addresses the comparatively limited attention given in GIScience to the internal spatial organization of healthcare facilities and to the relationship between configurational, visual, and informational conditions within them. Importantly, these measures represent modelled properties of the physical environment rather than direct observations of user movement, cognition, route choice, or navigation success. The analysis therefore evaluates potential spatial conditions for wayfinding rather than actual behavioral performance.

2.2. Space Syntax in Healthcare Architecture

Space syntax provides an analytical framework for examining how spatial configuration influences movement, accessibility, and environmental intelligibility [50,51,52]. Rather than focusing primarily on functional zoning or aesthetic composition, it addresses the relational structure of space and the ways in which this structure can shape patterns of movement and perception. A core premise of the approach is that the positional properties of a space, its integration, connectivity, and role within a larger configuration, affect how easily users can navigate and interpret the environment [11,26,51]. For this reason, space syntax has been widely used to investigate circulation hierarchy, route accessibility, and the spatial logic of complex buildings and urban systems.
In hospital settings, these analytical capacities are especially relevant because circulation systems are often large, layered, and internally differentiated. Integration has commonly been used to identify how centrally or accessibly a space is positioned within a configuration, while connectivity provides a local measure of how many spaces are directly linked to a given location [17,22,26]. These measures are useful for identifying dominant spines, secondary routes, and junctions where route choice may become more demanding. Visibility-based analysis extends this approach by examining how much of the surrounding environment is visually accessible from particular positions [14,22]. VGA-based measures such as visual integration and visual connectivity therefore make it possible to analyze not only movement structure but also perceptual accessibility and the spatial distribution of visual support [53,54]. These methods offer a useful basis for examining how circulation structure and visual accessibility interact in wayfinding environments.
Previous healthcare studies have shown that space syntax can provide meaningful insight into hospital performance beyond simple movement prediction. Early work demonstrated relationships between configurational structure and building wayfinding, while subsequent studies linked low-integration zones to increased staff assistance, stress, or navigation difficulty [11,21,26]. More recent research has extended these concerns to healthcare efficiency, patient experience and visually supported navigation [14,20,47,55]. This body of work suggests that spatial configuration is not a neutral background to wayfinding, but an active contributor to how healthcare environments are interpreted and used. At the same time, recent reviews have emphasized that the strength of these relationships varies according to building type, user group, and the specific outcome under consideration [20,47,56]. This reinforces the need for methodological clarity when translating configurational measures into design interpretation.
Despite its strengths, space syntax also has limitations that are important to acknowledge in healthcare research. Hospital environments combine multiple activity types, user groups, and operational constraints, and a purely configurational analysis cannot capture all of these complexities [14,15,20,38]. Moreover, two-dimensional axial or visibility models may not fully reflect the challenges of multi-level navigation, vertical circulation, or the interpretive role of signage and environmental graphics [5,12,38,56]. Space syntax is therefore most useful not as a complete account of navigation behavior, but as a diagnostic method for identifying spatial conditions that are likely to shape navigational demand. In this study, its value lies in providing a structured basis for comparing configurational and visual conditions with the distribution of informational support across the outpatient system. To control the scope of these limitations, the Ground and First floors were analyzed as separate two-dimensional spatial systems, and the study does not attempt to model vertical movement as an integrated three-dimensional network. Accordingly, the findings are interpreted as floor-specific spatial conditions rather than as a complete representation of multi-level navigation or actual user behavior. Vertical transition points are treated as components of the floor-level spatial setting rather than as dynamically connected elements within a multi-level navigation sequence. The implications of vertical circulation and inter-floor reorientation are therefore treated as limitations of this analysis and as priorities for future research.

2.3. Conceptual Framework

Based on the preceding review, this study proposes a conceptual framework for examining the relationship between spatial structure and signage distribution in hospital wayfinding. In this framework, spatial configuration constitutes the underlying condition of navigability and is examined through axial integration, connectivity, and visibility-based accessibility. Signage distribution is understood not as an isolated graphic layer, but as part of the broader navigational environment that may either reinforce dominant spatial structure or compensate for configurational and perceptual weakness. Rather than treating wayfinding performance as directly observed behavior, the study approaches it as a condition of potential wayfinding difficulty that can be interpreted through the relationship between spatial burden and informational support under non-intrusive analytical conditions.
The framework is guided by four propositions. First, directional signage is expected to be concentrated along highly integrated axial routes, where it can support route continuity and reinforce the main movement spine. Second, global orientation signs are expected to be located at visually prominent nodes, where broad fields of visibility enable users to relate informational content to the surrounding spatial structure. Third, local directional signs are expected to appear at transition points and junctions where dominant routes connect to the secondary routes, thereby supporting route choice and directional continuity at decision-relevant locations. Fourth, particular attention should be given to locations where movement structure and visual accessibility are spatially concentrated, since these nodes may involve a heightened degree of navigational demand. In the present study, such locations are interpreted not as confirmed sites of functional conflict, but as areas of spatial overlap or potential dual navigational demand, where configurational movement potential, visual accessibility, and informational support are concentrated within the same spatial setting.
These propositions are examined across complementary analytical units, including axial configuration as an indicator of movement structure, VGA-based measures as indicators of visual accessibility, and signage location as an indicator of informational support. Through this framework, the study evaluates whether and how the existing signage system is spatially aligned with dominant movement and visibility patterns, and the extent to which reinforcement and compensatory distributional tendencies are expressed across different spatial conditions. These categories are used as descriptive interpretive devices for examining the present case rather than as universal models of hospital signage distribution. Their relative expression may vary according to the spatial, functional, and informational conditions of individual healthcare environments. Put differently, the framework does not merely describe the presence of signage, but provides a basis for interpreting how informational infrastructure is embedded within the spatial organization of hospital navigation.

3. Materials and Methods

3.1. Study Site Selection and Spatial Characteristics

This study focuses on the outpatient department of Asan Medical Center (AMC) in Seoul, Republic of Korea, as a critical case for investigating wayfinding in large-scale healthcare environments. AMC was selected because it represents a highly complex tertiary hospital setting in terms of scale, circulation intensity, and spatial growth over time. As one of the largest hospitals in Korea, AMC accommodates substantial daily outpatient traffic and has developed through successive phases of expansion, resulting in a layered and heterogeneous circulation system [8]. These characteristics make the hospital an appropriate case for examining the relationship between spatial configuration and wayfinding support infrastructure. The case was therefore selected for its analytical relevance rather than for statistical representativeness, and the empirical distributional patterns identified here are interpreted as specific to this case.
The analytical boundary was restricted to the publicly accessible outpatient circulation zones on the Ground and First floors, which together constitute the principal ‘first-encounter’ environment for patients and visitors. AMC consists of three major building wings developed through successive phases of expansion and connected to form a large multi-level hospital complex. The three major building wings comprise 13, 15, and 18 storeys, respectively, and the upper levels are predominantly occupied by inpatient wards, intensive care units, operating rooms, seminar facilities, offices, and other functions that are not generally accessible to outpatients. The Ground and First floors therefore constitute the principal publicly accessible levels through which outpatient arrival, orientation, and horizontal circulation occur [8]. These two levels were selected because they contain the main entrance sequences, primary horizontal circulation routes, waiting areas, and key vertical transition points within the publicly accessible outpatient environment. Their selection was therefore based on their spatial and functional role in outpatient navigation rather than on an assumption of floor-specific pedestrian volume. Rather than analyzing the hospital in its entirety, the study therefore focuses on the circulation environment most directly associated with first-time navigation and orientation. The selection of these two floors was purposive rather than intended to be statistically representative of the hospital as a whole. Accordingly, findings derived from this analytical boundary should be interpreted as specific to the publicly accessible outpatient environment and should not be generalized to inpatient areas, restricted clinical zones, or the hospital’s entire multi-level circulation system. More broadly, because AMC represents an exceptionally large and complex tertiary hospital, the spatial and signage distribution patterns identified in this study should not be assumed to represent hospitals with different scales, architectural organizations, signage systems, or cultural contexts.
Within this analytical boundary, only publicly accessible circulation and waiting areas were included. Clinical rooms, diagnostic and examination areas outside the defined public circulation boundary, staff-only spaces, administrative zones, service areas, and other restricted spaces were excluded from both the configurational and visual models. This boundary definition was used consistently across the axial analysis, VGA, and signage mapping in order to ensure comparability between spatial measures and the informational environment actually encountered by outpatients.

3.2. Data Acquisition and Signage Inventory

The base drawings used in this study were constructed from publicly available floor plans showing structural boundaries, departments, circulation routes, and vertical circulation elements such as lifts, stairs, and escalators. To improve analytical reliability, these plans were checked through site visits conducted in October 2025. During these visits, visible post-construction changes, including relocated partitions and updated wayfinding elements, were documented and incorporated into the final digital models. The resulting plans were then used as the common base for spatial analysis and signage mapping.
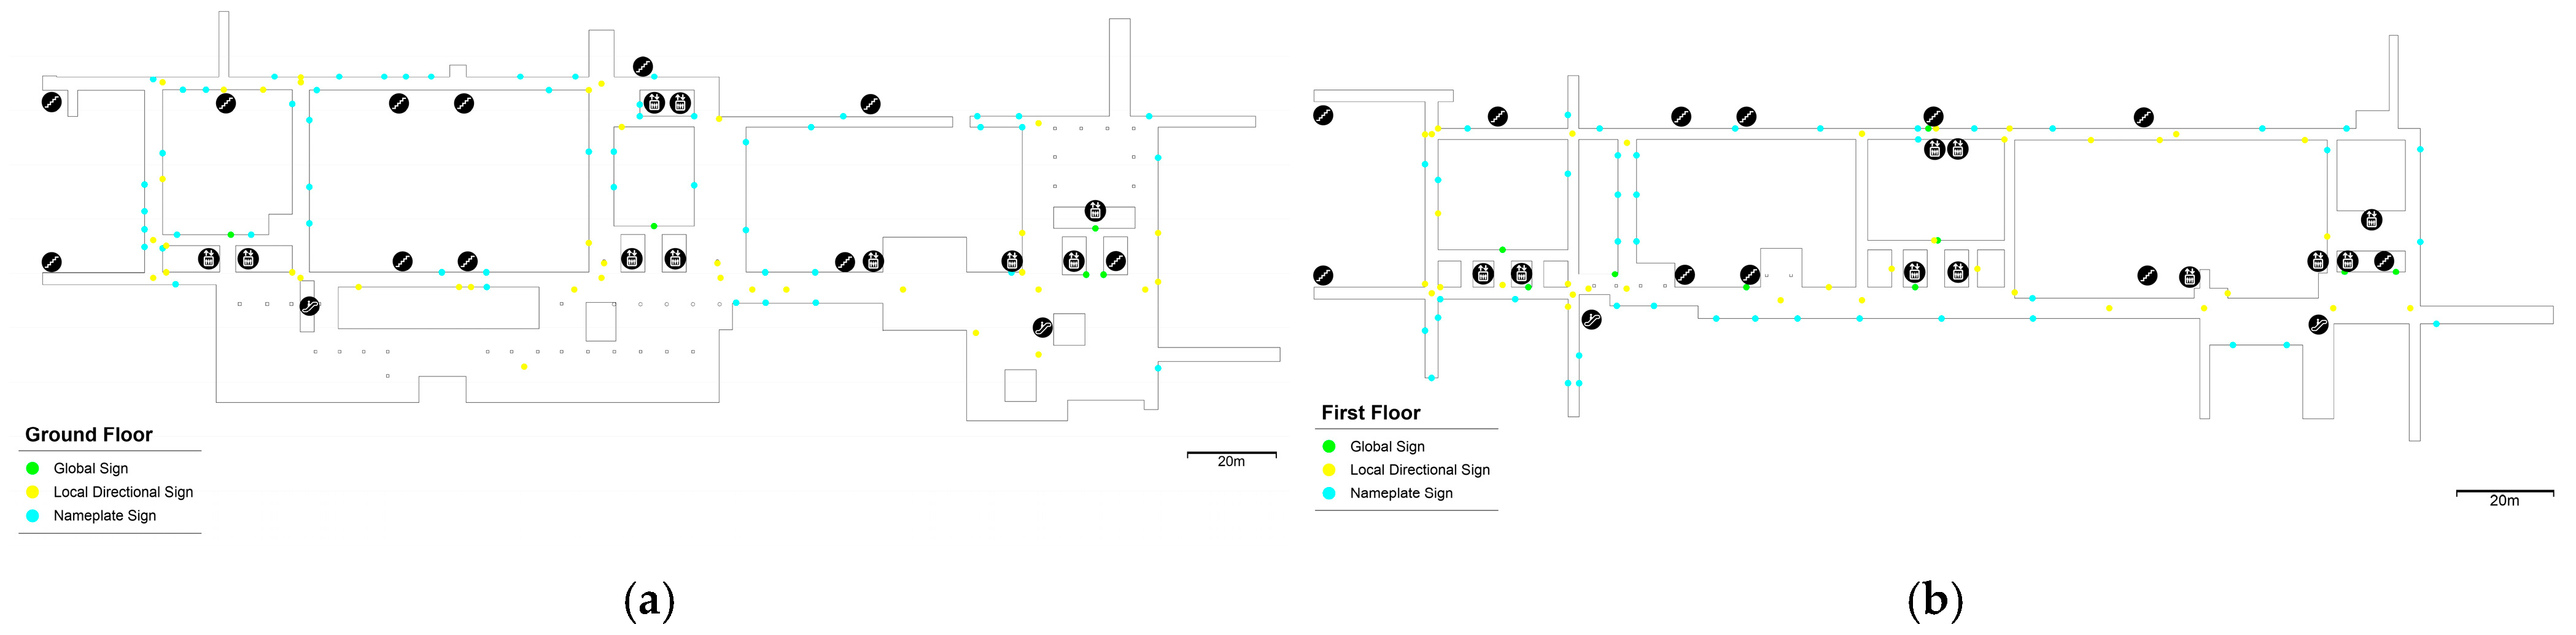
A systematic signage inventory was undertaken during the same period in order to document the existing wayfinding support system within the selected outpatient zones. The survey included directional and orientation signs located in publicly accessible areas, including ceiling-hung directional signs, wall-mounted directional signs, freestanding directories, and nameplate signs. Regulatory, safety, and promotional graphics were excluded so that the analysis would focus specifically on signage intended to support wayfinding. In total, 194 signs were recorded and georeferenced on the floor plans. Each sign was mapped according to its location and classified by informational function.
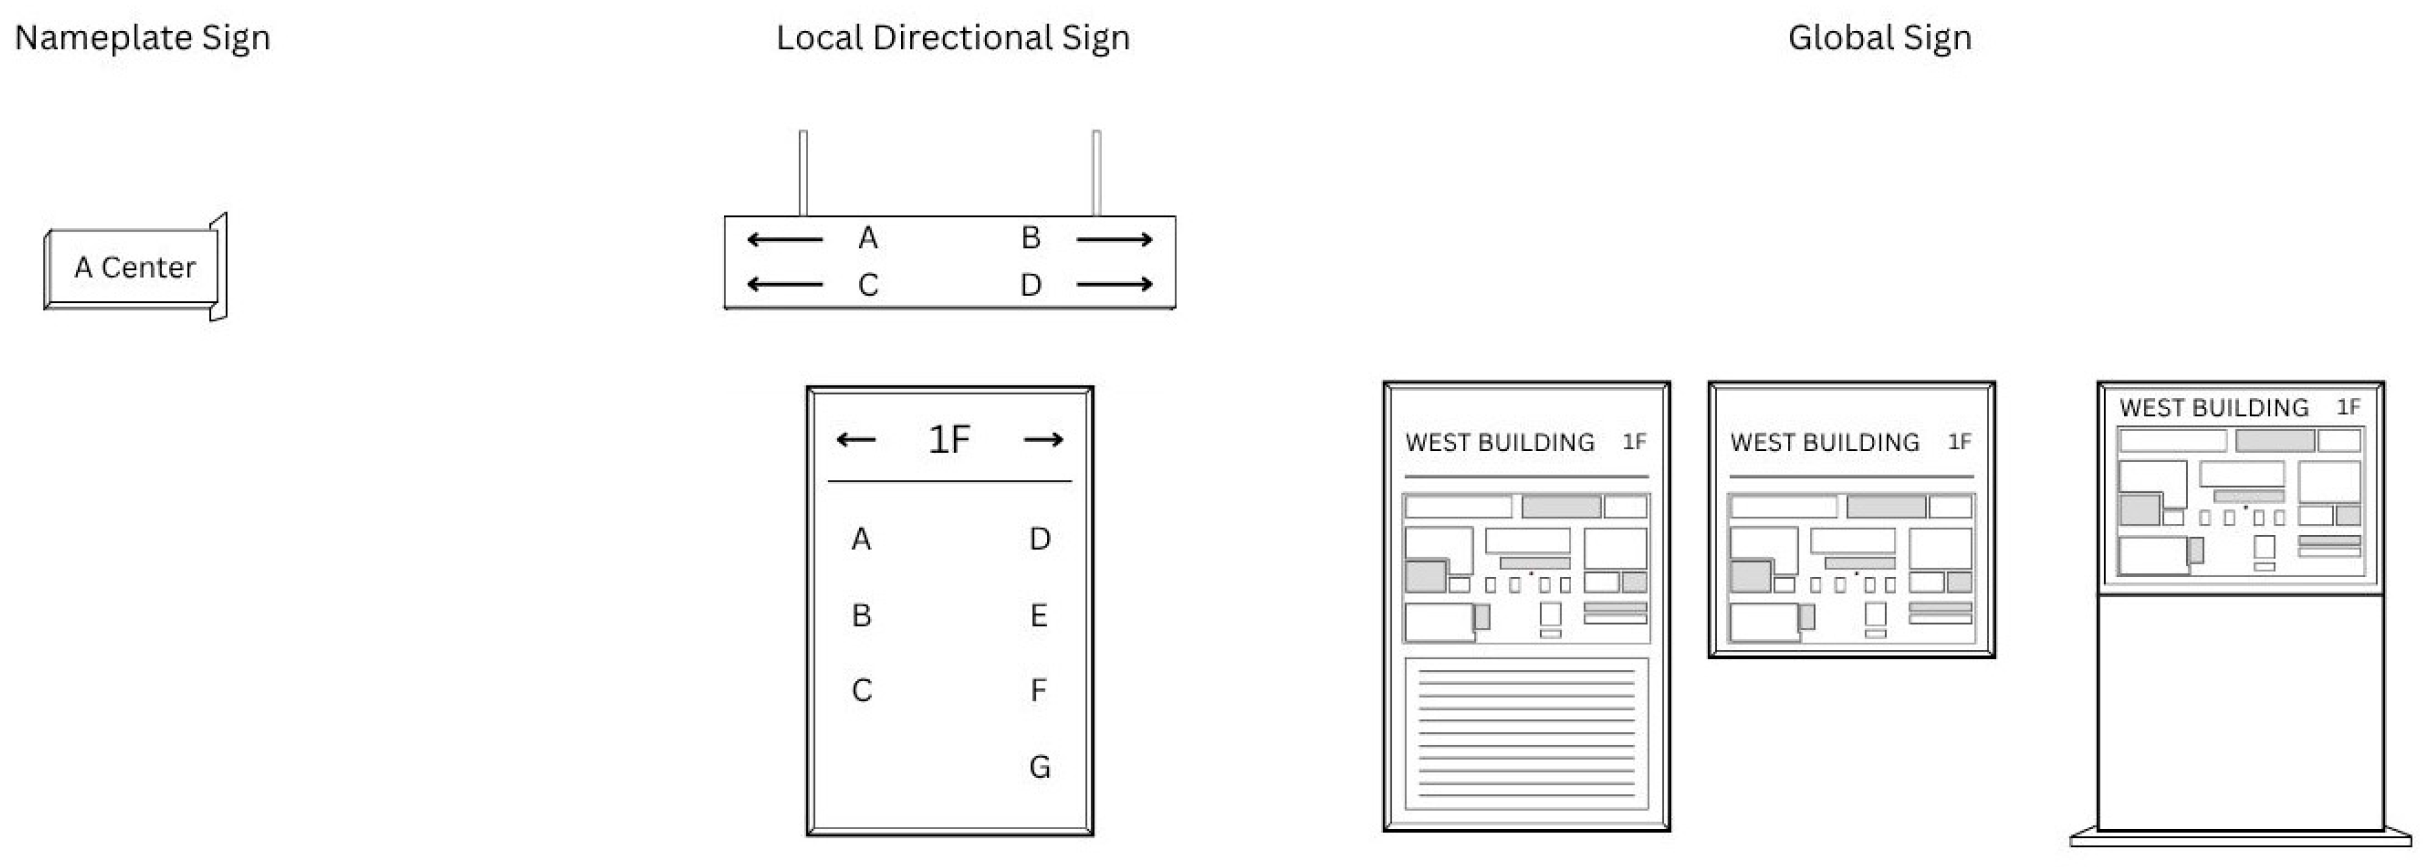
The informational classification distinguished three categories (see Figure 1 & Table 1). First, global signs were defined as signs providing broad orientation information, including floor-level or area-level guidance, major destinations, and overall directional structure. Second, local directional signs were defined as intermediate guidance elements located at junctions or along routes to support route choice and directional continuity. Third, nameplate signs were defined as labels positioned at individual rooms or department entrances to confirm arrival at a destination.
Where a physical sign contained multiple informational elements, such as a map, directional arrows, and department names, it was assigned to a single informational category according to its dominant wayfinding function (see Figure 2). Signs primarily supporting floor- or area-level orientation were classified as Global signs; signs primarily guiding route choice through directional arrows or intermediate destination information were classified as Local Directional signs; and signs primarily confirming arrival at a room or department entrance were classified as Nameplate signs. Multiple informational coding was not applied, and each physical sign was counted only once.

3.3. Axial and Visibility-Based Spatial Analysis

Spatial analysis was performed using DepthmapX (version 0.9.1). The purpose of the analysis was to examine the relationship between movement structure, visual accessibility, and informational support within the outpatient circulation system. The axial and VGA models were generated from the verified digital floor plans described in Section 3.2. These plans included structural boundaries, publicly accessible corridors and waiting areas, department access points, fixed partitions, enclosed cores, and vertical circulation elements such as lifts, stairs, and escalators within the selected outpatient boundary. Two complementary forms of analysis were applied: Axial analysis for configurational structure and Visibility Graph Analysis (VGA) for perceptual accessibility.
Axial analysis was used to represent the movement structure of the publicly accessible outpatient layout. For each floor, the circulation system was modelled using the minimum set of longest straight lines covering accessible public space. In the resulting axial maps, each line represents an axial segment generated by the DepthmapX Fewest Line Map algorithm, and line color indicates relative Integration [HH] values. Rather than manually drawing individual axial lines, the axial maps were generated using the Fewest Line Map procedure implemented in DepthmapX. Based on the defined accessible open-space geometry, this procedure algorithmically derives a reduced axial representation using a minimal set of longest straight lines covering the accessible spatial system. This approach reduces researcher intervention in the selection and placement of individual axial lines and ensures that the same generation procedure is applied consistently across both analyzed floors. The resulting axial models consisted of 44 lines on the Ground floor and 34 lines on the First floor. The principal configurational measures used in this study were global integration [HH] and connectivity. Integration [HH] represents the relative configurational accessibility of each axial line within the entire analyzed spatial system. Higher Integration [HH] values indicate that an axial line is configurationally closer to the rest of the system, requiring fewer changes in direction or axial steps to reach other lines, whereas lower values indicate a more segregated or peripheral position. Connectivity is a local measure representing the number of axial lines directly intersecting or connected to a given axial line. Higher Connectivity values therefore indicate a greater number of immediate spatial connections, whereas lower values indicate fewer direct connections. Both measures are dimensionless configurational indices generated by DepthmapX and are interpreted comparatively within each analyzed floor rather than as physical distances or direct measures of pedestrian movement. Although choice is relevant to through-movement and decision demand, the present analysis places greater emphasis on integration and connectivity because these measures correspond more directly to the spatial patterns interpreted in the Section 4 and to the distributional logic of the signage system.
To examine perceptual accessibility, a Visibility Graph Analysis (VGA) was conducted using a 90 cm grid across the same public-access boundary. In the VGA maps, color coding represents the relative distribution of visual integration values across the analyzed floor area. This grid resolution was selected as a human-scale sampling interval appropriate to the corridor-based structure of the outpatient environment. It provided sufficiently detailed sampling to capture local variations in visibility across corridors, intersections, lobbies, and waiting areas. The 90 cm grid represents the spatial resolution of the visibility model rather than observer eye height and is not intended as a universal VGA standard. Walls, fixed partitions, and enclosed cores were treated as opaque obstacles. From this model, visual integration and visual connectivity were derived in order to identify zones of broad visual access, restricted visual fields, and visually prominent intersections. The VGA outputs were then aligned with the signage inventory so that the relationship between visibility conditions and sign placement could be examined directly.
Because VGA results may vary according to grid resolution, a formal multi-resolution sensitivity analysis would provide additional methodological validation. Such a sensitivity test was not conducted in this study; however, the same 90 cm resolution was applied consistently to both floors to ensure internal comparability. Accordingly, the VGA results are interpreted as plan-based measures of relative visual accessibility within the selected analytical setting rather than as direct measures of actual sign visibility. The analysis does not account for sign-specific factors such as orientation, mounting height, viewing angle, font size, or graphic legibility, all of which may influence whether a sign can be effectively seen and read in practice.

3.4. Analytical Framework for Spatial-Signage Alignment

This study adopts a comparative overlay approach to examine the degree of correspondence between spatial structure and the distribution of wayfinding signage. Rather than treating signage as an isolated graphic layer, the analysis interpreted it as part of the broader navigational environment, whose effectiveness depends in part on how closely it responds to configurational and visual conditions. Accordingly, signage locations were compared with axial integration, axial connectivity, visual integration and visual connectivity in order to evaluate whether the existing system is aligned with dominant movement structure, visually prominent nodes, and locally demanding decision points.
To quantify the relationship between spatial configuration and signage distribution, each georeferenced sign included in the relevant analytical subset was associated with the corresponding axial line, and the number of signs assigned to each line was calculated. The line-based assignment of Global and Local Directional signs on the Ground and First floors is illustrated in Supplementary Figure S1. Because axial lines vary in physical length, raw sign counts may partly reflect the greater opportunity for sign installation along longer circulation segments. To account for this potential confounding effect, signage density was additionally calculated for each axial line as the number of signs per 100 m of axial-line length. The relationship between integration [HH] and signage distribution was therefore examined using both raw sign counts and length-normalized signage density. Raw counts were retained as a descriptive measure of the absolute concentration of informational elements, whereas the length-normalized measure was used to assess spatial correspondence while accounting for differences in axial-line length.
The spatial-signage alignment analysis is guided by the first three propositions set out in Section 2.3. First, if the signage system is configurationally aligned, directional signs are expected to be concentrated along the major integrated movement spine and at key branching locations connected to it. Second, if the system is visually aligned, global orientation signs are expected to be located at visually prominent nodes where users can access broad fields of information and relate signage content to the surrounding space. Third, a compensatory distributional tendency would be indicated where wayfinding-functional signage is comparatively concentrated in lower-integration areas rather than only in configurationally dominant routes.
Based on these propositions, the quantitative classification of reinforcement and compensation in this study is operationalized using axial integration. A reinforcement tendency refers to a disproportionate concentration of wayfinding-functional signage in high-integration axial lines, whereas a compensatory tendency refers to comparatively greater provision in low-integration axial lines. VGA is used separately to contextualize visual conditions and identify spatial overlap rather than to determine the reinforcement-compensation classification.
To operationalize this distinction, axial lines on each floor were classified as low-integration (≤Q1), intermediate-integration (>Q1 and <Q3), and high-integration (≥Q3) based on the floor-specific distribution of Integration [HH]. The distribution of wayfinding-functional signage (Global + Local signs) across these categories was then evaluated using a chi-square goodness-of-fit test. A reinforcement tendency was defined as a disproportionate concentration of wayfinding-functional signage within the high-integration group, whereas a compensatory tendency was defined as comparatively greater informational provision within the low-integration group. Where signage distribution did not differ significantly across integration groups, the pattern was interpreted as comparatively even rather than as evidence of either tendency. Where both high- and low-integration groups showed comparatively greater provision than the intermediate group, the pattern was interpreted as mixed rather than assigned to a single logic. These categories describe observed distributional tendencies and do not imply deliberate design intent. Through this framework, the Results section evaluates whether the observed signage distribution exhibits reinforcement-oriented, compensation-oriented, mixed or comparatively even tendencies across different configurational conditions.
The present study adopts a non-intrusive spatial diagnostic framework and does not include direct behavioral observation such as user tracking or movement recording. Accordingly, the findings are interpreted as potential navigational conditions derived from spatial structure, visual accessibility, and signage distribution rather than as direct evidence of actual wayfinding difficulty or user performance. The framework therefore identifies spatial conditions that may warrant behavioral validation rather than locations of empirically confirmed wayfinding difficulty. Terms such as “dual navigational demand” are used as spatially derived interpretive concepts rather than as empirically verified user outcomes. In addition, the analysis focuses on the spatial distribution and informational classification of signage rather than on its qualitative design characteristics. Each recorded sign is treated as one georeferenced informational element for the purpose of spatial distribution analysis; this does not imply that individual signs provide equivalent informational value or usability. Graphic and perceptual characteristics—including typography, iconography, color coding, multilingual content, mounting height, viewing angle, sign orientation, and readability—were not systematically evaluated. The semantic content and continuity of information across successive signs were also outside the scope of the analysis. In particular, the study did not evaluate whether destination names, pictograms, or other information presented on global orientation signs, including ‘You are here’ maps, were consistently carried through subsequent local directional signs and destination-identification signs along specific routes. Accordingly, the present analysis does not assess the coherence of complete sign sequences, or the quantity and consistency of information provided along individual navigation routes. Signage density in this study therefore represents the spatial provision of informational support rather than a direct measure of signage effectiveness or wayfinding quality. These boundaries define the interpretive scope of the study.

4. Results

4.1. Axial Analysis: Configurational Structure of the Outpatient Circulation System

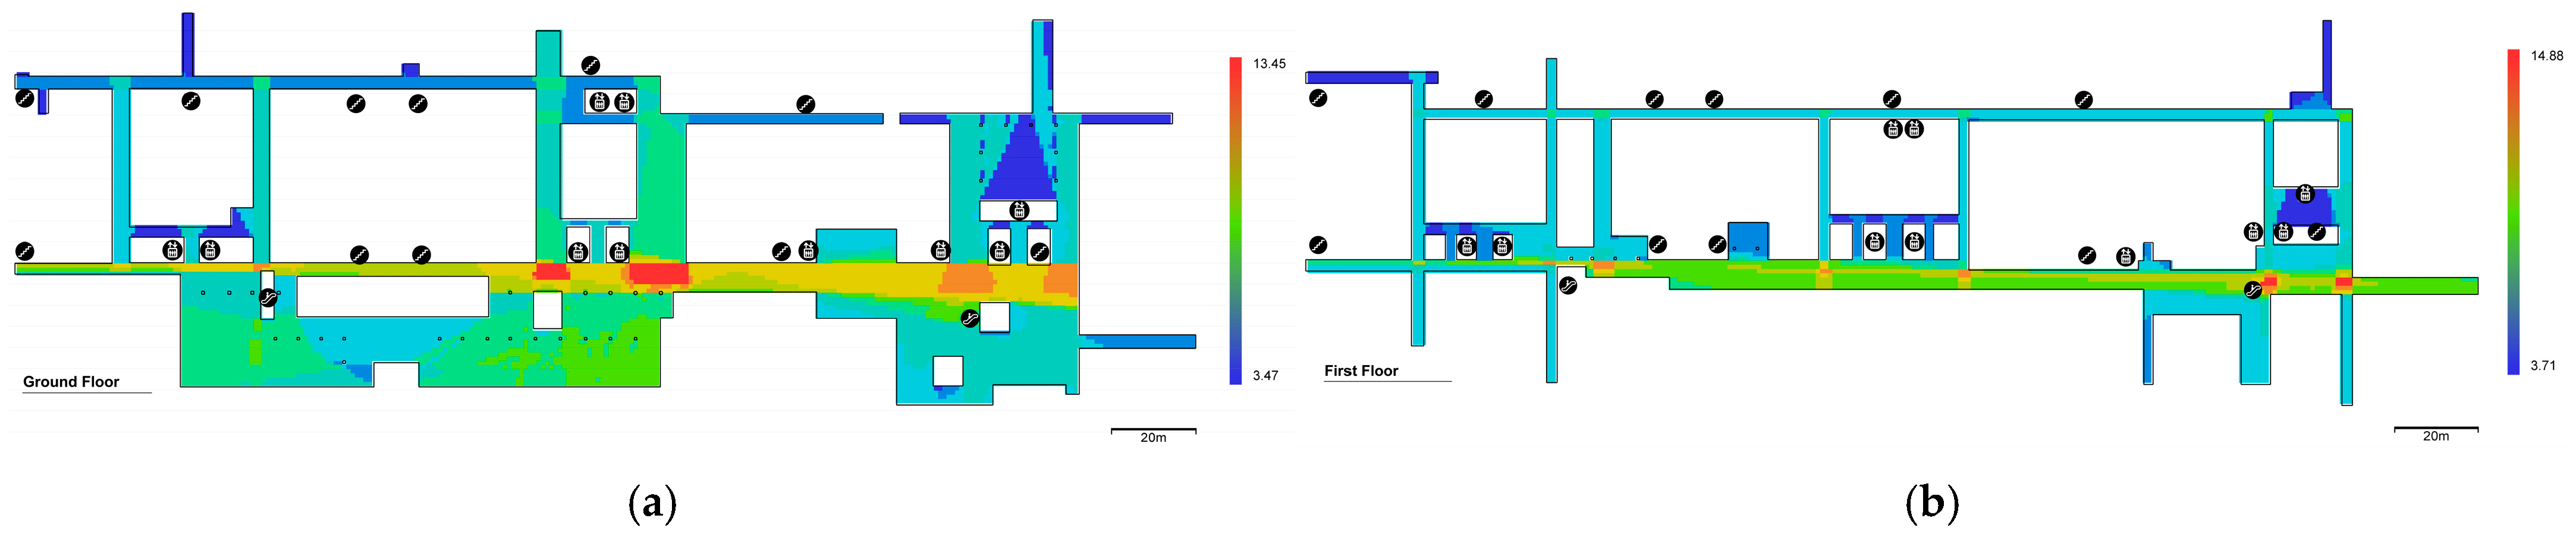
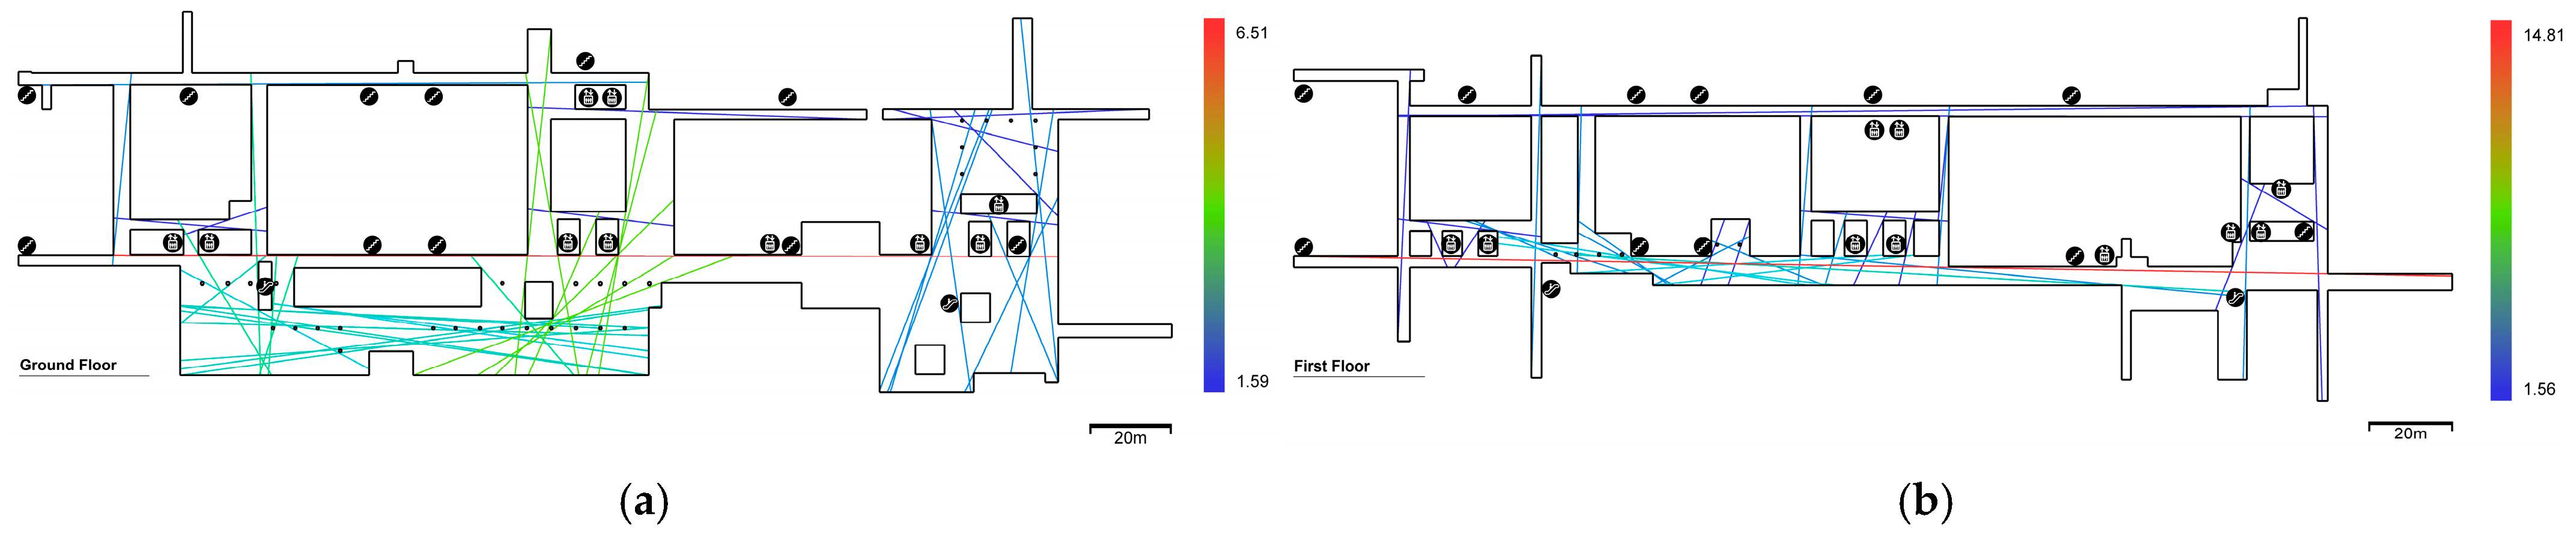
The axial analysis revealed a strongly hierarchical circulation structure on both analyzed floors (see Figure 3). On the Ground floor, the southern horizontal corridor emerged as the most integrated axial component within the public outpatient system. This corridor traverses the building laterally and functions as the principal configurational spine connecting major outpatient destinations. The central north–south connection linking this corridor to the vertical circulation core also showed relatively high integration, indicating that the main horizontal route and the principal vertical transition system are closely coupled within the overall spatial structure. Overall, the Ground floor configuration is therefore characterized by a dominant southern movement axis rather than an evenly distributed ring of equivalent routes.
A similar pattern was observed on the First floor. Again, the southern horizontal corridor displayed the highest integration values and appeared to structure the overall circulation hierarchy. The recurrence of this pattern across both floors indicates a degree of configurational consistency in the hospital’s main outpatient circulation system. In other words, the layout on each floor is not spatially neutral; instead, it privileges a particular lateral corridor as the primary route of access and distribution. This consistency suggests that the hospital’s outpatient navigation system is anchored to a repeated spatial spine across levels.
These configurational patterns are reflected in the descriptive statistics. On the Ground floor (n = 44 axial lines), Integration [HH] ranged from 1.589 to 6.515 (mean = 3.126, SD = 1.023), with the dominant southern corridor (Line 11) recording the highest value (6.515)—more than four times the minimum (integration range ratio: 4.10×). On the First floor (n = 34 axial lines), Integration [HH] ranged from 1.560 to 14.815 (mean = 3.543, SD = 2.198), with a substantially wider spread (range ratio: 9.50×), indicating a more polarized configurational hierarchy in which a single axis is markedly more integrated than the rest of the system. Across both floors, Integration [HH] was strongly positively associated with Connectivity (Ground floor: Spearman r = 0.763, p < 0.001; First floor: r = 0.865, p < 0.001), indicating that axial lines with higher global configurational accessibility also tended to have a greater number of direct local connections.
At the same time, the axial maps also revealed peripheral weakness. Northern corridors and secondary lateral routes exhibited substantially lower integration values than the southern spine. Although these spaces remain connected within the overall system, they are configurationally less accessible. This does not demonstrate greater actual wayfinding difficulty but identifies spatial conditions that may be associated with greater navigational demand and therefore warrant behavioral evaluation. From a wayfinding perspective, such areas represent structurally weaker segments within the overall outpatient system.
Taken together, the axial analysis shows that the outpatient circulation system is organized asymmetrically rather than evenly. A dominant southern corridor structures the main movement hierarchy, while peripheral zones remain configurationally less prominent. This asymmetry provides the configurational basis for evaluating whether the existing signage system primarily reinforces the dominant spatial hierarchy or also supports weaker areas of the layout.

4.2. Visibility Graph Analysis (VGA): Visual Accessibility and Perceptual Structure

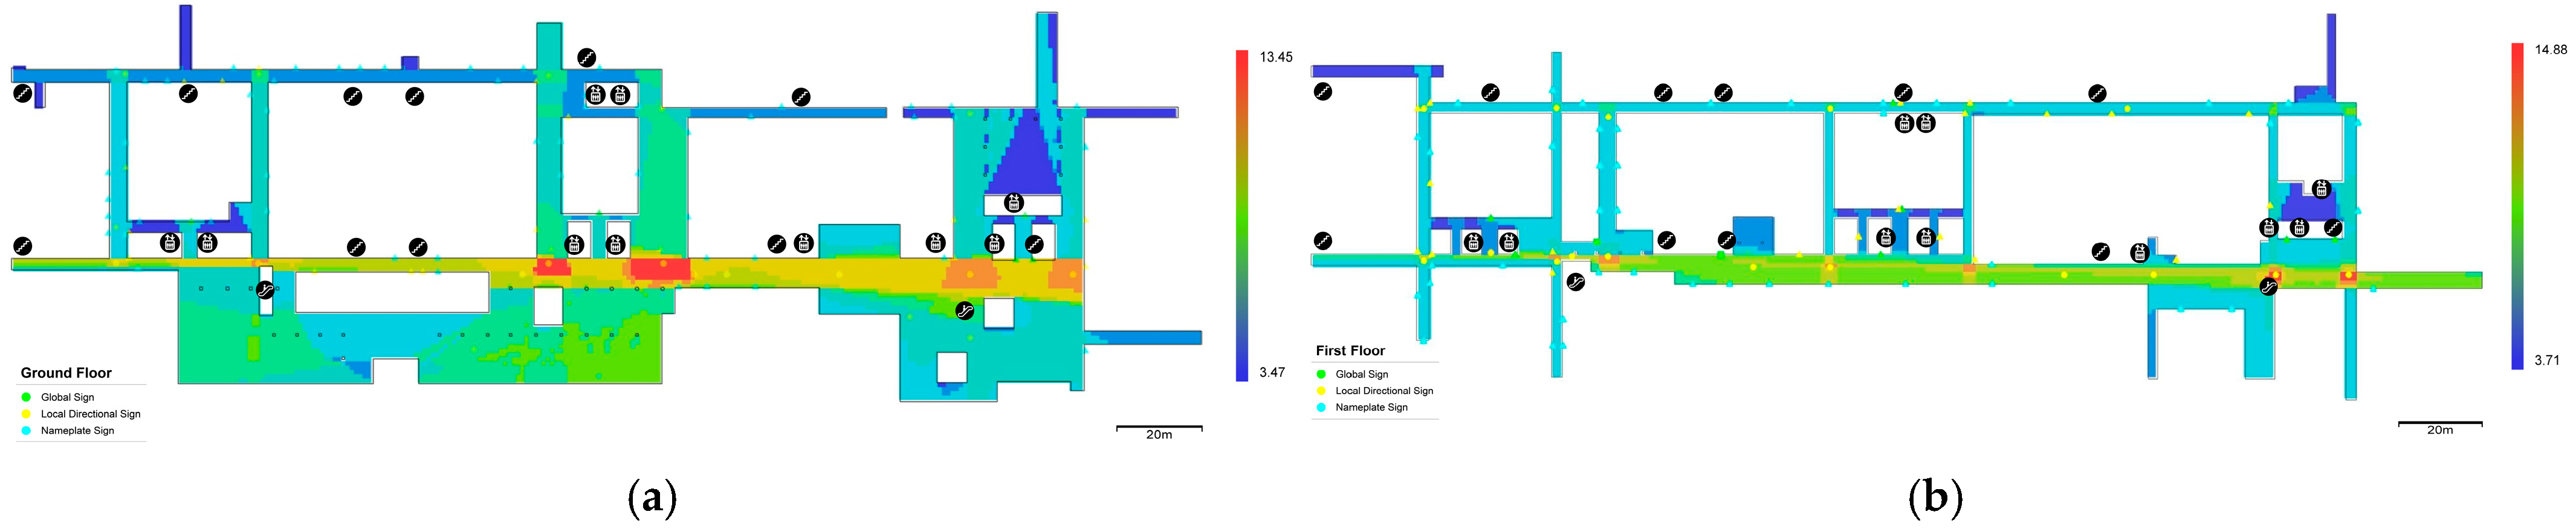
The VGA results complemented the axial findings by showing that visual accessibility is also unevenly distributed across the two-floor outpatient environment (see Figure 4). On the Ground floor, the highest levels of visual integration were concentrated around the intersection between the southern corridor and the central connecting corridor. This location is therefore not only configurationally central but also visually prominent, offering broad fields of visibility and multiple lines of sight into adjoining spaces. Such a condition indicates that this node functions as a major point of visual accessibility within the outpatient system.
By contrast, several peripheral corridor segments, including western and northern zones, showed relatively low visual integration. In these areas, the visual field is more restricted and the environment is more spatially segmented. This does not in itself indicate navigational failure, but it does suggest weaker visual legibility. In practical terms, such areas provide fewer perceptual cues for self-orientation and are therefore more likely to depend on supplementary informational support.
On the First floor, visually prominent areas again appeared along the southern corridor, but the overall distribution of visual accessibility was somewhat less concentrated than on the Ground floor. This indicates that, although the broader circulation structure remains comparable across the two levels, the perceptual structure of navigation is not fully replicated from floor to floor. In particular, the locations of the strongest visual dominance do not entirely coincide between levels. This suggests that vertical transitions may involve a degree of perceptual discontinuity even where configurational continuity is maintained.
Overall, the VGA indicates that visual accessibility is concentrated at a limited number of central nodes and along the southern corridor, while peripheral zones remain visually weaker and more fragmented. The outpatient environment can therefore be understood as containing both visually strong anchors and visually vulnerable segments, making it appropriate to assess whether the signage system is distributed in a way that responds to these differences.

4.3. Spatial Distribution of Signage in Relation to Configurational and Visual Structure

When the georeferenced signage inventory was overlaid onto the axial and VGA maps, a clear distributional pattern emerged. Across both floors, signage was concentrated predominantly along the southern corridor, which had already been identified as the principal integrated spine of the outpatient system. Local directional signs appeared repeatedly along this route, forming a continuous guidance sequence through the most configurationally dominant part of the layout. In addition, the most prominent global signs were generally located near central intersections and entrance-related nodes, where both configurational access and visual exposure were high. By contrast, more peripheral areas contained a greater proportion of nameplate signs and relatively fewer directional signs (see Figure 5).
The relationship between axial integration and signage distribution was re-examined through supplementary analysis. When all sign types were included, no statistically significant monotonic relationship was found between axial integration and sign count per axial line on either floor (Ground floor: r = −0.136, ns; First floor: r = 0.270, ns). After controlling for axial-line length, the associations remained non-significant (Ground floor: r = −0.215, ns; First floor: r = 0.068, ns). A post hoc power analysis for the First-floor Global + Local subset indicated low statistical power (9.9% at α = 0.05), suggesting that the study may have been underpowered to detect an association of the observed magnitude. The non-significant result should therefore not be interpreted as definitive evidence of no relationship. Because nameplate signs primarily function as destination-confirming information rather than route-guiding information, an additional analysis was conducted using only Global and Local signs. This subset analysis also showed no significant monotonic correlation between axial integration and sign count (Ground floor: r = −0.065, ns; First floor: r = 0.101, ns), and the length-controlled results remained non-significant (Ground floor: r = −0.120, ns; First floor: r = −0.005). These findings indicate that the spatial relationship between axial integration and sign count cannot be characterized as a simple linear or monotonic correspondence.
A group-based distribution test nevertheless revealed an important difference between the two floors. On the Ground floor, the distribution of Global + Local signs across high-, mid-, and low-integration groups was statistically significant (χ2 = 16.8, p = 0.0002). However, the pattern was U-shaped rather than purely reinforcing, with both the high- and low-integration groups receiving more signs than the mid-integration group. On the First floor, the corresponding distribution was not statistically significant (χ2 = 3.0, p = 0.22), indicating a comparatively even distribution across the integration hierarchy.
Taken together, these results suggest that the signage system cannot be interpreted as following a single reinforcement logic based solely on axial integration. Rather, the Ground floor shows a mixed distributional pattern, whereas the First floor shows a more even and less configurationally differentiated distribution.
This distribution indicates a more differentiated relationship between signage placement and spatial structure than a simple reinforcement account would suggest. On the Ground floor, both the most configurationally dominant segments and the most peripheral, low-integration segments received denser signage support than intermediate-integration segments, forming the U-shaped pattern described above. At the same time, several peripheral low-integration segments also received a comparatively high density of signage, suggesting that in at least part of the layout, signage placement is consistent with a compensatory distributional tendency in relation to lower-integration conditions rather than simply following configurational prominence.
This pattern indicates that the signage system does not operate according to a single logic. Rather than representing mutually exclusive tendencies, the Ground-floor data show patterns consistent with both reinforcement and compensation in different parts of the layout: reinforcement-oriented provision along the dominant integrated spine and comparatively greater support in isolated peripheral segments, with lower informational provision in mid-integration segments. This mixed pattern was statistically confirmed by the chi-square goodness-of-fit test (χ2 = 16.8, p < 0.001), while the Spearman correlation between axial integration and signage count remained non-significant regardless of sign-type subset or length control. On the First floor, by contrast, the distribution of signage across integration tiers did not differ significantly from a proportional allocation (χ2 = 3.0, p = 0.22), indicating a comparatively even distribution not strongly differentiated by configurational status.
From a wayfinding perspective, this mixed pattern has different implications than a purely reinforcement-based account. Concentrating signage along the dominant integrated spine is consistent with a reinforcement tendency that provides repeated directional information along the primary circulation structure. However, the presence of comparatively dense signage in low-integration segments on the Ground floor suggests that signage placement does not neglect configurationally weaker zones altogether; whether this reflects a deliberate compensatory design decision or the influence of other factors—department location, decision-point density, or practical mounting constraints—cannot be determined from spatial analysis alone. The comparatively even distribution on the First floor further suggests that configurational integration is not the sole determinant of signage placement; destination structure, local decision demand, and operational considerations likely play a substantial role [9,10,17,52] and warrant investigation through direct behavioral or qualitative data in future work [9,10,17,52].

4.4. Configurational-Visual Overlap and Informational Concentration

A further result of the combined axial and VGA analyses is the spatial overlap between configurational prominence and visual accessibility along the primary outpatient corridor. As shown in the spatial overlays, the southern horizontal corridor consistently emerges as the dominant movement spine, while several key nodal points along this axis, particularly the central intersection and the major junction toward the eastern side, also display intensified visual accessibility and relational visibility. When read together with the signage distribution, these locations appear not only as routes of movement but also as major points of orientation and informational concentration within the outpatient system.
This overlap indicates that the hospital’s main circulation route is also a location where configurational movement potential, visual accessibility, and informational support are spatially concentrated. Such concentration does not demonstrate greater actual wayfinding difficulty; rather, it identifies spatial conditions that may be associated with comparatively high potential navigational demand and therefore warrant behavioral evaluation.
The analysis also shows that this concentration is not distributed evenly across the outpatient system. While the southern corridor and its major junctions show both configurational and visual strength, peripheral areas remain comparatively weaker in terms of both integration and visual accessibility. This asymmetry reinforces the interpretation that the outpatient environment is organized around a limited number of highly dominant spatial nodes rather than a uniformly legible network.
Accordingly, the overlap identified here is understood as a condition of potential dual navigational demand, in which configurational movement potential, visual accessibility, and informational support are spatially concentrated. From a wayfinding perspective, these nodes may warrant closer evaluation of informational support, not because they are confirmed sites of navigational difficulty, but because multiple spatial and informational conditions converge within the same location.
These results indicate that the outpatient wayfinding environment is organized around a limited number of spatially dominant nodes, where configurational prominence, visual accessibility, and informational support are concentrated. This provides the basis for discussing whether the current signage system operates primarily through reinforcement or compensatory support.

5. Discussion

5.1. Configurational Alignment and Signage Distribution Logic

This study examined the spatial relationship between configurational structure, visual accessibility, and the distribution of wayfinding signage in the outpatient department of a large tertiary hospital. The spatial overlay shows that prominent signage clusters occur along the southern horizontal corridor, which also exhibits high configurational and visual prominence. However, the statistical analyses indicate that this spatial correspondence should not be interpreted as a simple monotonic relationship between integration and signage density across the circulation system. From a space syntax perspective, highly integrated routes tend to structure movement and co-presence within built environments [26,46,47,50]. In this sense, the concentration of signage along the dominant corridor suggests that the existing wayfinding system is not randomly distributed, but broadly aligned with the hospital’s underlying spatial logic.
However, configurational alignment does not translate into a simple reinforcement relationship. Statistical re-analysis found no significant linear correlation between axial integration and signage count on either floor, whether measured using the full sign inventory or the wayfinding-relevant Global + Local subset, and whether or not axial-line length was controlled. Instead, a chi-square goodness-of-fit test revealed a significant non-random distribution on the Ground floor (χ2 = 16.8, p < 0.001): both the most integrated and the most peripheral, low-integration segments carried denser signage than intermediate-integration segments, forming a U-shaped pattern. The First-floor distribution did not differ significantly from proportional allocation (χ2 = 3.0, p = 0.22). The present signage strategy, in other words, cannot be described as a uniform reinforcement of spatial hierarchy; it instead reflects a more differentiated, and only partially configurationally driven, distributional logic. The spatial overlays indicate local correspondence between prominent circulation structures and signage concentrations, but the statistical analyses do not support a simple or consistently strong relationship between axial integration and signage provision across either floor. Instead, the Ground floor exhibits a significant U-shaped distribution across integration groups, while the First floor shows no statistically significant differentiation by integration level. The differences between the two floors further caution against treating reinforcement and compensation as fixed or universal hospital-wide patterns; rather, they are interpreted here as case-specific descriptive tendencies. Importantly, these classifications are based on the quantitative distributional criteria defined in Section 3.4 and refer to observed spatial patterns rather than to the intentions underlying the original signage design.
This distinction is important for interpreting wayfinding support in complex hospital settings. Rather than a system that reinforces only the dominant circulation spine, the Ground-floor pattern suggests that some informational support is also directed toward configurationally weaker, low-integration zones—a pattern consistent with, though not conclusive evidence of, a compensatory distributional tendency [4,9,30,52]. The observed distribution should not, however, be attributed to spatial integration alone. Sign placement may also reflect corridor length, the number and distribution of departments and destinations, decision-point density, vertical circulation, visibility conditions, and operational movement patterns. With the exception of axial-line length, these factors were not systematically controlled in the present analysis and therefore remain alternative explanations for the observed pattern. At the same time, intermediate-integration segments received comparatively little signage, raising the question of whether the informational provision in these zones is proportionate to their spatial and functional roles [4,9,30,52]. Because no behavioral data were collected, however, lower signage density in these areas cannot be interpreted as evidence of actual wayfinding difficulty.
Reinforcement and compensatory provision should therefore be understood as context-dependent rather than hierarchically ordered strategies. Reinforcement may be operationally appropriate along primary circulation routes, where repeated directional confirmation and continuity of information are required along a dominant movement structure. Its advantage lies in maintaining coherent guidance along major routes, although excessive concentration may provide limited additional benefit where the spatial structure is already highly legible. Compensatory provision, by contrast, may be appropriate where less integrated or visually fragmented areas contain important destinations, transitions, or decision points that cannot be readily understood from spatial configuration alone. Its potential advantage lies in supplementing weaker environmental cues, although additional signage does not necessarily improve wayfinding if its content, sequence, or visibility is poorly coordinated. The two logics should therefore be evaluated in relation to spatial function and informational demand rather than treated as better or worse alternatives.
Table 2 summarizes this interpretive pattern. Taken together, the findings suggest that the present signage system does not follow a single organizing logic: it shows characteristics consistent with reinforcement along the dominant spine and comparatively high signage provision in peripheral low-integration zones, while intermediate-integration segments show comparatively lower informational provision.
This summary helps clarify that the contribution of signage in the present case is not uniform across the circulation system and does not follow a simple gradient from strong to weak configurational zones. Instead, signage appears to respond to spatial extremity in a more complex way, with the least differentiated (intermediate) zones receiving the least informational support. Such variation is critical to understanding how informational infrastructure is embedded within the hospital’s broader spatial organization and underscores the need for caution in attributing sign placement to configurational logic alone.

5.2. Spatial Overlap and Potential Dual Navigational Demand

A second important finding concerns the spatial overlap between movement structure and visual accessibility identified in Section 4.4. Axial integration highlights the primary routes that organize through-movement, whereas VGA integration identifies areas of expanded visibility and perceptual prominence [22,51,52,54]. In the present case, these two conditions converge along the southern corridor and particularly at its major nodal intersections. As a result, the hospital’s principal movement spine also appears to function as its principal orientation spine.
Rather than treating this convergence as evidence of confirmed functional conflict, it is more appropriate to interpret it as a condition of dual navigational demand. In such locations, movement, visual scanning, route interpretation, and directional confirmation are concentrated within the same spatial event. Wayfinding theory conceptualizes navigation as a staged cognitive process involving orientation, decision-making, and confirmation [5,9,10,55]. When these spatial and informational conditions converge at major corridor intersections, they may indicate comparatively high potential navigational demand. Because no behavioral data were collected, however, the present analysis cannot determine whether users actually experience greater difficulty at these locations.
This interpretation is especially relevant in healthcare settings, where stress, time pressure, and emotional vulnerability may reduce users’ cognitive capacity for processing spatial information [9,10,20]. Within such contexts, nodes that combine configurational prominence, broad visual exposure, and concentrated informational content may become especially demanding points within the navigation sequence. Importantly, however, this should not be understood as a design failure in itself. Major hospitals inevitably contain highly dominant nodes that combine circulation and orientation functions [4,9,10,52]. The issue is therefore not the existence of such nodes, but how spatial and informational systems are coordinated to support users within them.
From this perspective, the contribution of signage is not simply to add more information at already prominent locations, but to mediate the relationship between movement logic and perceptual demand [9,14,17,20]. The present findings suggest that signage planning should consider not only locations with strong configurational movement potential, but also nodes where spatial and visual conditions indicate comparatively high orientation-related demand. This shifts the discussion from signage quantity alone to the more precise question of how informational support corresponds to spatially differentiated navigational conditions within the hospital. The spatial conditions identified here should also be distinguished from those experienced during actual hospital operation. Axial analysis and VGA represent static, unoccupied geometric conditions and therefore do not account for crowd density, waiting queues, temporary equipment, or peak pedestrian flows. In practice, these dynamic factors may obstruct sightlines, alter the visibility of signage, and modify the spatial conditions encountered by users. Accordingly, VGA-based visual accessibility should be interpreted as a measure of plan-based visual potential rather than as equivalent to actual sign visibility under occupied conditions. Actual sign visibility additionally depends on sign orientation, mounting height, viewing angle, graphic scale, and other sign-specific characteristics that were not evaluated in the present study. Future research should combine the present spatial framework with pedestrian-flow observation or simulation, dynamic visibility analysis, and behavioral route tracking to examine how occupancy modifies configurational and visual conditions during real-world use.

5.3. Theoretical Contribution and Design Implications

This paper contributes to the intersection of space syntax and wayfinding studies by empirically overlaying axial measures, VGA metrics, and georeferenced signage inventories within a large outpatient hospital environment. Although previous studies have often correlated spatial integration with movement behavior [26,51,52], fewer have examined signage as a spatially embedded component of the wayfinding systems rather than as a purely graphic or managerial intervention. By integrating signage in relation to configurational and visual structure, this study demonstrates that informational infrastructure can be interpreted as part of the spatial organization of navigation itself. The methodological contribution therefore lies in the triangulated synthesis of configurational structure, VGA-based visual accessibility, and georeferenced signage distribution rather than in any single spatial indicator. The significant U-shaped distribution observed on the Ground floor further indicates a mixed distributional tendency that cannot be reduced to a simple reinforcement model.
It is important, however, to distinguish the spatial provision of signage from its communicative effectiveness. The present analysis identifies where informational elements are concentrated or comparatively sparse but does not establish whether those signs are perceptually accessible, semantically clear, or effective in supporting actual navigation. Nor does it evaluate whether information is logically and consistently transferred across successive wayfinding elements, such as from ‘You are here’ maps to local directional signs and ultimately to destination-identification signs.
Several practical implications follow this interpretation. First, the observed U-shaped pattern on the Ground floor—in which both highly integrated and low-integration zones receive denser signage than intermediate zones—indicates comparatively lower informational provision in intermediate-integration segments. This pattern warrants further evaluation to determine whether the observed level of informational provision corresponds appropriately to the spatial and functional roles of these segments. Second, highly dominant nodes require not only sign presence but also careful informational calibration, so that spatial prominence is supported without producing unnecessary informational concentration. Third, vertical transition points require particular attention because configurational continuity across floors does not necessarily guarantee perceptual or informational continuity during floor-to-floor navigation. Although the present analysis identifies these transition points within each floor, it does not model the vertical movement sequence itself. Finally, configurational analysis has value not only as a post-occupancy diagnostic tool, but also as a design-stage framework for anticipating where wayfinding support is likely to be most needed.
More broadly, the study suggests that hospital signage should be understood not merely as a graphic layer added after spatial planning, but as a component of navigational infrastructure whose spatial role varies according to configurational and visual conditions. From a healthcare accessibility perspective, the non-intrusive diagnostic framework proposed here provides a means of identifying spatial conditions that may warrant closer investigation in relation to informational support. Such analysis can inform subsequent behavioral evaluation and signage planning, while recognizing that configurational measures alone cannot establish actual wayfinding difficulty or determine the optimal form of intervention.

6. Conclusions

This study investigated the relationship between spatial configuration and wayfinding signage distribution in the outpatient department of a large tertiary hospital. By combining axial analysis, VGA, and a georeferenced signage inventory, it examined whether the existing wayfinding system corresponds to the configurational and visual structure of the hospital environment. Rather than treating signage as an isolated graphic layer, the study approached it as part of the broader navigational environment through which movement, perception, and orientation are organized.
The findings indicate a more differentiated relationship between signage placement and the underlying spatial hierarchy than a simple reinforcement account would suggest. On the Ground floor, wayfinding-functional signage (Global and Local types) did not increase monotonically with axial integration; rather, both the most configurationally dominant segments and the most peripheral, low-integration segments received denser signage support than intermediate-integration segments, forming a statistically significant U-shaped distribution and indicating that reinforcement- and compensatory-oriented tendencies coexist in different parts of the layout rather than either tendency occurring alone. On the First floor, signage distribution across integration levels did not differ significantly from an even allocation, suggesting a less configurationally differentiated pattern. Taken together, these findings suggest that the present signage system cannot be characterized as operating uniformly through either reinforcement or compensatory distribution, and that intermediate-integration zones showed comparatively lower informational provision than both spatial extremes.
This study also identified key nodes where movement structure, visual accessibility, and informational support are concentrated in the same locations. These nodes are interpreted as areas of potential dual navigational demand, where configurational movement potential, visual accessibility, and informational support are spatially concentrated. This finding suggests that hospital wayfinding planning should consider how informational support corresponds to locations where configurational and visual demands overlap.
Overall, this research demonstrates that signage should be understood as a spatially embedded component of the wayfinding environment rather than a purely graphic layer. The principal contribution of the study lies in providing a multi-layer spatial diagnostic approach that integrates configurational structure, visual accessibility, and georeferenced signage distribution to reveal differentiated spatial relationships within a complex outpatient environment. Several limitations define the scope of these findings. First, this study is based on a purposively selected single tertiary hospital and is restricted to two publicly accessible outpatient floors; inpatient areas, diagnostic and examination zones outside the defined circulation boundary, and the wider multi-level hospital system were not analyzed. Although the analytical procedure may be applicable to other complex healthcare environments, the empirical distributional patterns identified here should be interpreted as case-specific rather than generalized to other hospital types or spatial organizations, signage systems, or cultural contexts. Comparative multi-hospital studies are therefore required to determine whether similar relationships recur across different healthcare environments. Second, the axial and VGA analyses are two-dimensional and represent floor-specific, static geometric conditions. Although vertical circulation elements such as lifts, escalators, and stairs are represented within the floor plans, movement between levels and the associated processes of transition and reorientation were not modelled as an integrated three-dimensional circulation network. The analysis therefore cannot capture the continuity or disruption that may arise during multi-level navigation. Dynamic operational factors such as crowd density, queues, and temporary obstructions were also not incorporated. Third, the study does not include direct behavioral validation and evaluates the spatial distribution and informational classification of signage rather than its graphic, linguistic, semantic, or perceptual effectiveness. Characteristics such as typography, iconography, color coding, multilingual content, mounting height, viewing angle, sign orientation, and readability were not systematically assessed. The analysis also did not examine the semantic continuity of information across complete wayfinding sequences, including the consistency between ‘You are here’ maps, local directional signs, and destination-identification signs. Consequently, signage density in this study should be interpreted as a measure of the spatial provision of informational support rather than as a direct measure of signage effectiveness or navigational quality. Signage-to-axial-line assignment at high-connectivity junctions also involves some spatial ambiguity, and the floor-level statistical analyses were constrained by modest statistical power. Accordingly, the findings should be interpreted as spatial distributional tendencies rather than as direct evidence of wayfinding performance or universal signage principles.
Future research should extend the present framework through comparative multi-hospital studies and three-dimensional circulation modelling that explicitly integrates horizontal routes with lifts, escalators, stairs, and floor-to-floor transition points, alongside pedestrian-flow observation or simulation, dynamic visibility analysis, behavioral route tracking, and route-based evaluation of signage content. Such work would allow for the relationship between the spatial patterns identified here and actual user experience to be tested more directly and would clarify the transferability of the framework across different hospital contexts.

Supplementary Materials

The following supporting information can be downloaded at https://www.mdpi.com/article/10.3390/ijgi15090399/s1, Supplementary Figure S1. Line-based assignment of Global and Local Directional signs to the axial system used for floor-level statistical analyses: (1) Ground Floor and (2) First Floor.

Author Contributions

Conceptualization, Keunhye Lee and Chong-Ku Park; methodology, Keunhye Lee and Taebean Lim; software, Taebean Lim and Kilho Lee; formal analysis, Keunhye Lee and Taebean Lim; investigation, Keunhye Lee, Taebean Lim and Kilho Lee; data curation, Taebean Lim and Kilho Lee; writing—original draft preparation, Keunhye Lee; writing—review and editing, Keunhye Lee and Chong-Ku Park; visualization, Taebean Lim and Kilho Lee; supervision, Chong-Ku Park; project administration, Chong-Ku Park. All authors have read and agreed to the published version of the manuscript.

Funding

This work was supported by the Gachon University research fund of 2023 (GCU-202400460001).

Data Availability Statement

The data presented in this study are available on request from the corresponding author. The signage inventory data are not publicly available due to institutional access restrictions applicable to the study site.

Acknowledgments

The authors thank Gachon University for institutional support during this research.

Conflicts of Interest

The authors declare no conflicts of interest.

References

  1. Arthur, P.; Passini, R. Wayfinding: People, Signs, and Architecture; McGraw-Hill Ryerson: Toronto, ON, Canada, 1992. [Google Scholar]
  2. Carpman, J.R.; Grant, M.A. Design That Cares: Planning Health Facilities for Patients and Visitors; John Wiley & Sons: Hoboken, NJ, USA, 2016. [Google Scholar]
  3. Carpman, J.R.; Grant, M.A. Wayfinding: A Broad View. In Handbook of Environmental Psychology; Bechtel, R.B., Churchman, A., Eds.; John Wiley & Sons: New York, NY, USA, 2002; pp. 427–442. [Google Scholar]
  4. Ulrich, R.S.; Zimring, C.; Zhu, X.; DuBose, J.; Seo, H.-B.; Choi, Y.-S.; Quan, X.; Joseph, A. A review of the research literature on evidence-based healthcare design. HERD Health Environ. Res. Des. J. 2008, 1, 61–125. [Google Scholar] [CrossRef] [Scilit] [PubMed]
  5. Mollerup, P. Wayshowing–A Guide to Environmental Signage: Principles and Practices; Lars Müller Publishers: Baden, Switzerland, 2005. [Google Scholar]
  6. Kim, H.; Hong, G.; Kong, S. A Study on the Spatial Structure Analysis of Medical part in General Hospital using the Complex System. J. Korea Intitute Spat. Des. 2019, 14, 12. [Google Scholar] [CrossRef] [Scilit]
  7. Cho, J. A Study on the Change of General Hospitals Size in Seoul during 15 years—Focused on General Hospitals bed and Gross Area in Seoul since 2005. J. Korea Inst. Healthc. Archit. 2022, 28, 9. [Google Scholar]
  8. Asan-Medical-Center. Information of Asan Medical Center. Available online: https://www.amc.seoul.kr/asan/hospitalinfo/review/guidance.do#:~:text=%EC%84%9C%EC%9A%B8%EC%95%84%EC%82%B0%EB%B3%91%EC%9B%90%EC%9D%80%20%EC%97%B0%EA%B1%B4%ED%8F%89,%EC%9D%98%20%EA%B5%AD%EB%82%B4%20%EC%B5%9C%EB%8C%80%20%EB%B3%91%EC%9B%90%20%EC%9D%B4%EB%8B%A4 (accessed on 5 December 2025).
  9. Passini, R. Wayfinding design: Logic, application and some thoughts on universality. Des. Stud. 1996, 17, 319–331. [Google Scholar] [CrossRef] [Scilit]
  10. Huelat, B.J. Wayfinding: Design for Understanding. A Position Paper for the Environmental Standards Council of the Center for Health Design; Center for Health Design: Concord, CA, USA, 2007. [Google Scholar]
  11. Peponis, J.; Zimring, C.; Choi, Y.K. Finding the building in wayfinding. Environ. Behav. 1990, 22, 555–590. [Google Scholar] [CrossRef] [Scilit]
  12. Hölscher, C.; Meilinger, T.; Vrachliotis, G.; Brösamle, M.; Knauff, M. Up the down staircase: Wayfinding strategies in multi-level buildings. J. Environ. Psychol. 2006, 26, 284–299. [Google Scholar] [CrossRef] [Scilit]
  13. Rooke, C.N.; Koskela, L.; Tzortzopoulos, P. Achieving a lean wayfinding system in complex hospital environments: Design and through-life management. In Proceedings of the IGLC 18: 18th Annual Conference of the International Group for Lean Construction, Haifa, Isreal, 14–16 July 2010. [Google Scholar]
  14. Morag, I.; Pintelon, L. Digital wayfinding systems in hospitals: A qualitative evaluation based on managerial perceptions and considerations before and after implementation. Appl. Ergon. 2021, 90, 103260. [Google Scholar] [CrossRef] [Scilit] [PubMed]
  15. Morag, I.; Sonmez, V.; Van Puyvelde, A.; Pintelon, L. Improving wayfinding in hospitals for people with diverse needs and abilities: An exploratory approach based on multi-criteria decision making. Appl. Ergon. 2024, 114, 104149. [Google Scholar] [CrossRef] [Scilit] [PubMed]
  16. Yoon, J.; Park, J. A Study on the Analysis of the Factors Affecting Patients’ Way: Finding in the Hospital-Focused on a Case of ‘A’ General Hospital. J. Korea Inst. Healthc. Archit. 2008, 14, 12. [Google Scholar]
  17. Kim, S.; Paik, J. A Study on the Guidance Signage System of Outpatient in General Hospital using Spatial Configuration Theory: View from G.D.Weisman’s Way-finding Influence Factors. J. Korea Inst. Healthc. Archit. 2015, 21, 11. [Google Scholar] [CrossRef] [Scilit]
  18. Lee, S. A Study on Wayfinding System for Walkability: Focusing on General Hospital; Hongik University: Seoul, Republic of Korea, 2017. [Google Scholar]
  19. Bae, S.; Hur, D.; Lee, C.; Lee, Y. A Qualitative Exploratory Study of Older Adults’ Wayfinding Behaviors in Hospitals: Focusing on Key Movement Areas in a Large Healthcare Facility. Korean J. Hum. Ecol. 2026, 35, 375–385. [Google Scholar] [CrossRef] [Scilit]
  20. Jamshidi, S.; Hashemi, S.; Tran, D.-M.T. Costs and effects of ineffective wayfinding in US hospitals: A survey of hospital staff. HERD Health Environ. Res. Des. J. 2025, 18, 259–275. [Google Scholar] [CrossRef] [Scilit] [PubMed]
  21. Devlin, A.S. Wayfinding in healthcare facilities: Contributions from environmental psychology. Behav. Sci. 2014, 4, 423–436. [Google Scholar] [CrossRef] [Scilit] [PubMed]
  22. Pouyan, A.E.; Ghanbaran, A.; Shakibamanesh, A. Impact of circulation complexity on hospital wayfinding behavior (Case study: Milad 1000-bed hospital, Tehran, Iran). J. Build. Eng. 2021, 44, 102931. [Google Scholar] [CrossRef] [Scilit]
  23. Han, G.; Lee, T. A Study on the Characteristics of Spatial Configuration for Wayfinding in General Hospital OPD. Korean Inst. Inter. Des. J. 2006, 15, 183–192. [Google Scholar]
  24. Lee, H.; SukTae, K. A Study on the Hierarchy in Spatial Configuration of Geriatrics Hospital. Korean Inst. Inter. Des. J. 2009, 18, 183–190. [Google Scholar]
  25. Go, D.; Lee, D.; Han, H.; Choi, Y.; Lee, Y. AR Way Finding Service Design focused on User Experience: Focusing on the General Hospital. J. HCI Soc. Korea 2022, 17, 59–69. [Google Scholar] [CrossRef] [Scilit]
  26. Haq, S.; Zimring, C. Just down the road a piece: The development of topological knowledge of building layouts. Environ. Behav. 2003, 35, 132–160. [Google Scholar]
  27. Golledge, R.G. Wayfinding Behavior: Cognitive Mapping and Other Spatial Processes; JHU Press: Baltimore, MD, USA, 1999. [Google Scholar]
  28. O’Neill, M.J. Effects of signage and floor plan configuration on wayfinding accuracy. Environ. Behav. 1991, 23, 553–574. [Google Scholar] [CrossRef] [Scilit]
  29. Carlson, L.A.; Hölscher, C.; Shipley, T.F.; Dalton, R.C. Getting lost in buildings. Curr. Dir. Psychol. Sci. 2010, 19, 284–289. [Google Scholar] [CrossRef] [Scilit]
  30. Moffat, S.D. Aging and spatial navigation: What do we know and where do we go? Neuropsychol. Rev. 2009, 19, 478–489. [Google Scholar] [CrossRef] [Scilit] [PubMed]
  31. Guagliardo, M.F. Spatial accessibility of primary care: Concepts, methods and challenges. Int. J. Health Geogr. 2004, 3, 3. [Google Scholar] [CrossRef] [Scilit] [PubMed]
  32. Luo, W.; Wang, F. Measures of spatial accessibility to health care in a GIS environment: Synthesis and a case study in the Chicago region. Environ. Plan. B Plan. Des. 2003, 30, 865–884. [Google Scholar] [CrossRef] [Scilit] [PubMed]
  33. Penchansky, R.; Thomas, J.W. The concept of access: Definition and relationship to consumer satisfaction. Med. Care 1981, 19, 127–140. [Google Scholar] [PubMed]
  34. Kim, Y.; Byon, Y.; Yeo, H. Enhancing healthcare accessibility measurements using GIS: A case study in Seoul, Korea. PLoS ONE 2018, 13, e0193013. [Google Scholar] [CrossRef] [Scilit] [PubMed]
  35. Stasinos, N.; Kalogeropoulos, K.; Tsatsaris, A.; Mantzorou, M. Uneven Paths to Health: A Spatial Analysis of Sidewalk Conditions and Healthcare Access for Older Adults. ISPRS Int. J. Geo-Inf. 2026, 15, 137. [Google Scholar] [CrossRef] [Scilit]
  36. Deng, L.; Romainoor, N.H. A bibliometric analysis of published literature on healthcare facilities’ wayfinding research from 1974 to 2020. Heliyon 2022, 8, e10723. [Google Scholar] [CrossRef] [Scilit] [PubMed]
  37. McLafferty, S.L. GIS and health care. Annu. Rev. Public Health 2003, 24, 25–42. [Google Scholar] [CrossRef] [PubMed]
  38. Churchill, A.; Dada, E.; de Barros, A.G.; Wirasinghe, S.C. Quantifying and validating measures of airport terminal wayfinding. J. Air Transp. Manag. 2008, 14, 151–158. [Google Scholar] [CrossRef] [Scilit]
  39. Tam, M.L. An optimization model for wayfinding problems in terminal building. J. Air Transp. Manag. 2011, 17, 74–79. [Google Scholar] [CrossRef] [Scilit]
  40. Puttipakorn, P.; Upala, P. Comparative Analysis of Environmental Graphic Design for Wayfinding on the Exit Patterns of Mass Transit Stations. Open Transp. J. 2018, 12, 150–166. [Google Scholar] [CrossRef] [Scilit]
  41. Yamada, T.; Utaka, M. Evaluating ticket gate directional restrictions using simulations of pedestrian flow considering stationary people in a railroad station concourse. J. Asian Archit. Build. Eng. 2023, 22, 2058–2073. [Google Scholar] [CrossRef] [Scilit]
  42. Lipson-Smith, R.; McLaughlan, R. Mapping healthcare spaces: A systematic scoping review of spatial and behavioral observation methods. HERD Health Environ. Res. Des. J. 2022, 15, 351–374. [Google Scholar] [CrossRef] [Scilit] [PubMed]
  43. Hillier, B.; Hanson, J. The Social Logic of Space; Cambridge University Press: Cambridge, UK, 1989. [Google Scholar]
  44. Hillier, B.; Penn, A.; Hanson, J.; Grajewski, T.; Xu, J. Natural movement: Or, configuration and attraction in urban pedestrian movement. Environ. Plan. B Plan. Des. 1993, 20, 29–66. [Google Scholar] [CrossRef] [Scilit]
  45. Haq, S.; Luo, Y. Space syntax in healthcare facilities research: A review. HERD Health Environ. Res. Des. J. 2012, 5, 98–117. [Google Scholar] [CrossRef] [Scilit] [PubMed]
  46. Conroy-Dalton, R.A. Spatial Navigation in Immersive Virtual Environments; University of London: London, UK, 2001. [Google Scholar]
  47. Turner, A.; Penn, A. Encoding natural movement as an agent-based system: An investigation into human pedestrian behaviour in the built environment. Environ. Plan. B Plan. Des. 2002, 29, 473–490. [Google Scholar] [CrossRef] [Scilit]
  48. Mustikawati, T.; Yatmo, Y.A.; Atmodiwirjo, P. Reading the visual environment: Wayfinding in healthcare facilities. Environ.-Behav. Proc. J. 2017, 2, 169–175. [Google Scholar] [CrossRef] [Scilit]
  49. Gath-Morad, M.; Grübel, J.; Steemers, K.; Sailer, K.; Ben-Alon, L.; Hölscher, C.; Aguilar, L. The role of strategic visibility in shaping wayfinding behavior in multilevel buildings. Sci. Rep. 2024, 14, 3735. [Google Scholar] [CrossRef] [Scilit] [PubMed]
  50. Montello, D.R. The contribution of space syntax to a comprehensive theory of environmental psychology. In Proceedings of the 6th International Space Syntax Symposium, Istanbul, Turkey, 12–15 June 2007; pp. 1–12. [Google Scholar]
  51. Rousek, J.B.; Hallbeck, M.S. Improving and analyzing signage within a healthcare setting. Appl. Ergon. 2011, 42, 771–784. [Google Scholar] [CrossRef] [Scilit] [PubMed]
  52. Lee, S.; Dazkir, S.S.; Paik, H.S.; Coskun, A. Comprehensibility of universal healthcare symbols for wayfinding in healthcare facilities. Appl. Ergon. 2014, 45, 878–885. [Google Scholar] [CrossRef] [Scilit] [PubMed]
  53. Rodrigues, R.; Coelho, R.; Tavares, J.M.R.S. Healthcare Signage Design: A Review on Recommendations for Effective Signing Systems. HERD Health Environ. Res. Des. J. 2019, 12, 45–65. [Google Scholar] [CrossRef] [Scilit] [PubMed]
  54. Rodrigues, R.; Coelho, R.; Tavares, J.M.R.S. Users’ Perceptions of Signage Systems at Three Portuguese Hospitals. HERD Health Environ. Res. Des. J. 2020, 13, 36–53. [Google Scholar] [CrossRef] [Scilit] [PubMed]
  55. Kalantari, S.; Tripathi, V.; Kan, J.; Rounds, J.D.; Mostafavi, A.; Snell, R.; Cruz-Garza, J.G. Evaluating the impacts of color, graphics, and architectural features on wayfinding in healthcare settings using EEG data and virtual response testing. J. Environ. Psychol. 2022, 79, 101744. [Google Scholar] [CrossRef] [Scilit]
  56. Nestel, C.M. Designing an Experience: Maps and Signs at the Archaeological Site of Ancient Troy. Cartogr. Perspect. 2020, 94, 25–47. [Google Scholar] [CrossRef] [Scilit]
Figure 1. Classification of Wayfinding Signs by Informational Function.
Ijgi 15 00399 g001
Figure 2. Georeferenced Signage Distribution in the analyzed outpatient circulation zones of AMC (a) Ground Floor and (b) First Floor. Sign symbols indicate Global, Local Directional, and nameplate signs.
Ijgi 15 00399 g002
Figure 3. Axial Integration map of the analyzed outpatient circulation zones: (a) Ground-floor; (b) First-floor. The lines represent the axial map generated in DepthmapX using the Fewest Line Map algorithm. Line color indicates relative integration [HH] values from low to high, as shown in the legend.
Ijgi 15 00399 g003
Figure 4. VGA Integration maps of the analyzed outpatient circulation zones: (a) Ground-floor; (b) First floor. Color coding indicates relative visual integration values from low to high, as shown in the legend.
Ijgi 15 00399 g004
Figure 5. Overlay of signage distribution and spatial analysis results in the analyzed outpatient circulation zones: (a) Ground floor; (b) First floor. Sign symbols indicate informational category (Global, Local Directional, and Nameplate), while the background color corresponds to the spatial analysis scale shown in the legend. This figure illustrates the spatial correspondence between sign placement and the underlying configurational and visual structure.
Ijgi 15 00399 g005
Table 1. Classification of Signage System.
CategoryDefinitionWayfinding Function
Global SignFloor- or building-level orientation boards (e.g., ‘You are here’ maps) located at major nodesSupports global cognitive mapping
Local Directional SignDirectional guidance at intersections or branch pointsAssists route choice at decision points
Nameplate SignRoom-level identification at door frontsConfirms destination arrival
Table 2. Comparative Interpretation of Signage Distribution by Spatial Condition.
Spatial ConditionObserved Signage PatternInterpretation
Highly integrated movement spineConcentration of Global and Local Signs along primary corridorConsistent with Informational reinforcement
Visually prominent nodalGlobal orientation signs located near major intersectionsSpatial correspondence between broad visual access and orientation information
Peripheral low-integration segmentsComparatively dense signage on the Ground floorConsistent with a degree of compensatory support; design intent not established
Intermediate-integration segmentsLowest relative signage provision on the Ground floorComparatively low informational provision; behavioral implication undetermined
Disclaimer/Publisher’s Note: The statements, opinions and data contained in all publications are solely those of the individual author(s) and contributor(s) and not of MDPI and/or the editor(s). MDPI and/or the editor(s) disclaim responsibility for any injury to people or property resulting from any ideas, methods, instructions or products referred to in the content.