Article

Spatiotemporal Dynamics of Ecosystem Services Under Land Use and Climate Change Scenarios on Hainan Island, China

1
College of Applied Arts and Science, Beijing Union University, Beijing 100191, China
2
Institute of Geographic Sciences and Natural Resources Research, Chinese Academy of Sciences, Beijing 100101, China
*
Author to whom correspondence should be addressed.
ISPRS Int. J. Geo-Inf. 2026, 15(7), 291; https://doi.org/10.3390/ijgi15070291
Submission received: 29 April 2026 / Revised: 21 June 2026 / Accepted: 26 June 2026 / Published: 30 June 2026

Abstract

Understanding the spatiotemporal dynamics and driving mechanisms of ecosystem services in response to land use change is critical for regional ecological security and sustainable development, especially under the combined pressure of intensive human activities and future climate change in tropical regions. Existing studies often lack an integrated framework for multi-scenario simulation, multi-dimensional ecosystem service quantification, and spatial driving factor identification. To support sustainable management, this study focused on Hainan Island and utilized land use data from 2000 to 2025. The Markov-Patch-generating Land Use Simulation (PLUS) model was employed to simulate land use patterns for 2050 under historical trend, SSP1-1.9, and SSP5-8.5 scenarios, incorporating future climate data. The Integrated Valuation of Ecosystem Services and Tradeoffs (InVEST) model was used to quantify habitat quality, carbon storage, water yield, and soil conservation. The Multi-weighted Entropy Ecosystem Service Index (MEESI) was established to evaluate ecosystem service performance. Furthermore, the GeoDetector model was applied to assess the explanatory power of the Normalized Difference Vegetation Index (NDVI), Normalized Difference Water Index (NDWI), Normalized Difference Built-up Index (NDBI), and Bare Soil Index (BSI) on ecosystem service dynamics. The results indicated that: (1) during 2000–2025, land use change in Hainan Island was dominated by forest-to-cropland conversion and impervious surface expansion, while future suggestions included stronger ecological protection under SSP1-1.9 and greater ecological pressure under SSP5-8.5; (2) during 2000–2025, habitat quality and carbon storage generally declined, whereas water yield and soil conservation increased, and SSP1-1.9 maintained higher overall ecosystem service performance (habitat quality = 0.6207, carbon storage = 327.89 × 10⁶ t, and MEESI = 0.3509) than the historical trend and SSP5-8.5 scenarios in 2050; and (3) NDVI exhibited the strongest explanatory power for ecosystem service variation, whereas NDBI showed the weakest. These findings suggest that ecosystem management should consider the trade-offs and synergies among multiple ecosystem services rather than focusing on a single service. This study provides a systematic and spatially explicit framework for ecosystem service assessment under future scenarios. The study can also support scientific land use optimization, ecological conservation, and sustainable management decisions in tropical island regions.

1. Introduction

Since the Industrial Revolution, large-scale fossil fuel consumption and the continuous exploitation of natural resources have triggered significant responses in the global climate system, manifested as rising temperatures, altered precipitation patterns, and increased frequency and intensity of extreme climate events [1]. These changes have exerted profound impacts on ecosystem structure and function, particularly in environmentally sensitive regions where ecosystem stability and sustainability are facing unprecedented challenges [2]. Meanwhile, land use and land cover change, driven by human activities, have continuously reshaped terrestrial ecological patterns [3]. Processes such as urban expansion, agricultural reclamation, and forest degradation alter key biogeochemical processes, including surface albedo, carbon cycling, and hydrological regulation, thereby directly influencing regional climate feedback mechanisms [4]. In addition, these changes exacerbate habitat fragmentation, biodiversity loss, and reduced ecological connectivity, further weakening the capacity of ecosystems to provide essential services [5]. Under the context of global change, climate change and land use change exhibit strong coupling and synergistic effects, jointly driving the reconfiguration of ecosystem service patterns across space and time [6]. Consequently, identifying the coupled mechanisms of climate and land use change and elucidating their pathways of influence on ecosystem services have become critical issues in contemporary ecological research.
Ecosystem services serve as a crucial bridge linking natural ecological processes and human well-being [7]. The concept can be traced back to the notion of “environmental services” proposed in the 1960s, referring to the diverse benefits that ecosystems provide to human society, including food provision, climate regulation, water resource management, soil conservation, and biodiversity maintenance [8]. With the advancement of the Millennium Ecosystem Assessment and continued efforts by the Organization for Economic Co-operation and Development, ecosystem services have been systematically classified into provisioning, regulating, supporting, and cultural services, and have been widely applied at regional and global scales [9]. Recent ecosystem service classification frameworks further emphasize the integration of ecosystem services and nature’s contributions to people, highlighting provisioning, cultural, and regulating and supporting services as key dimensions of ecosystem sustainability [10]. The ecosystem services including habitat quality, carbon storage, water yield, and soil conservation belong to regulating and biodiversity-related ecosystem services, which are closely linked to ecosystem stability and human well-being. As a result, ecosystem services have gradually become a core theoretical framework in environmental management, land use planning, and natural resource conservation [11]. In terms of assessment methods, the equivalent factor method has been widely adopted due to its simplicity; however, it is highly sensitive to regional socio-economic conditions and subjective parameter assignment, making it difficult to accurately capture spatial heterogeneity [12]. Multi-criteria evaluation approaches can integrate diverse datasets but still suffer from uncertainties in indicator selection and weight determination [13]. In contrast, process-based ecological models provide a mechanistic representation of ecosystem service formation and have increasingly become the dominant approach [14]. With the rapid development of geospatial technologies, such models have significantly improved the quantitative assessment of ecosystem services in both magnitude and quality, enabling long-term and multi-scale analyses [15]. Among these models, the InVEST model has been widely applied due to its modular structure, moderate data requirements, and capability for scenario-based simulations [16]. Numerous studies have demonstrated that land use change strongly influences landscape patterns and ecological processes, thereby affecting ecosystem services [17]. Consequently, integrated assessments of land use and ecosystem services have become a major research focus, aiming to explore the mechanisms by which land use change affects ecosystem services and to reveal their spatiotemporal dynamics and interactions [18]. In particular, analyzing trade-offs and synergies among ecosystem services under different land use patterns provides a scientific basis for land management and policy-making, facilitating the optimal allocation and sustainable utilization of ecosystem services [19]. Nevertheless, existing studies have largely focused on typical watershed regions, and systematic investigations of ecosystem service responses in tropical island systems under the combined influence of climate change and human activities remain limited [20]. Moreover, existing ecosystem service studies have focused either on historical assessments of ecosystem service dynamics or on future land use simulations, while few studies have linked land use projections, ecosystem service responses, and their driving mechanisms in a unified framework. This limitation is particularly evident in tropical islands, where ecological processes are highly sensitive to both climate variability and intensive human activities. Therefore, there remains a need for an integrated analysis connecting future land use change, ecosystem service evolution, and the underlying drivers of spatial heterogeneity.
Hainan Island, the only tropical island province in China, is located in the tropical monsoon climate zone and is characterized by diverse ecosystem types and high levels of biodiversity [21]. It serves as a critical ecological security barrier and a key ecological functional region [22]. However, with rapid economic development, intensified agricultural expansion, and increasing infrastructure construction, the land use pattern of Hainan Island has undergone significant transformations, exerting profound impacts on regional ecosystem services [23]. Evaluating the spatiotemporal dynamics of ecosystem services under land use change is therefore of great importance for achieving ecological protection and high-quality regional development. Nevertheless, existing studies in Hainan Island have primarily focused on single ecosystem services or individual driving factors, lacking a comprehensive assessment framework based on multi-scenario simulations [24]. To address these gaps, this study developed an integrated Markov-PLUS–InVEST–GeoDetector framework for Hainan Island. Rather than applying these models independently, the framework links future land use simulation, ecosystem service assessment, and driving-factor identification within a unified workflow. This integration enables a comprehensive evaluation of how future land use changes may influence ecosystem services and reveals the dominant factors shaping ecosystem service patterns in tropical island ecosystems. Based on six phases of land use data from 2000 to 2025, land use patterns for 2050 were simulated under future climate scenarios, including historical trend, SSP1-1.9, and SSP5-8.5. The spatiotemporal variations of habitat quality, carbon storage, water yield, and soil conservation were systematically assessed. Furthermore, the MEESI was constructed, and the driving effects of NDVI, NDWI, NDBI, and BSI on ecosystem services were analyzed. This study aims to elucidate the response mechanisms of ecosystem services to land use change in tropical island regions and to provide scientific support for land use optimization and ecosystem management.

2. Materials and Methods

2.1. Study Area

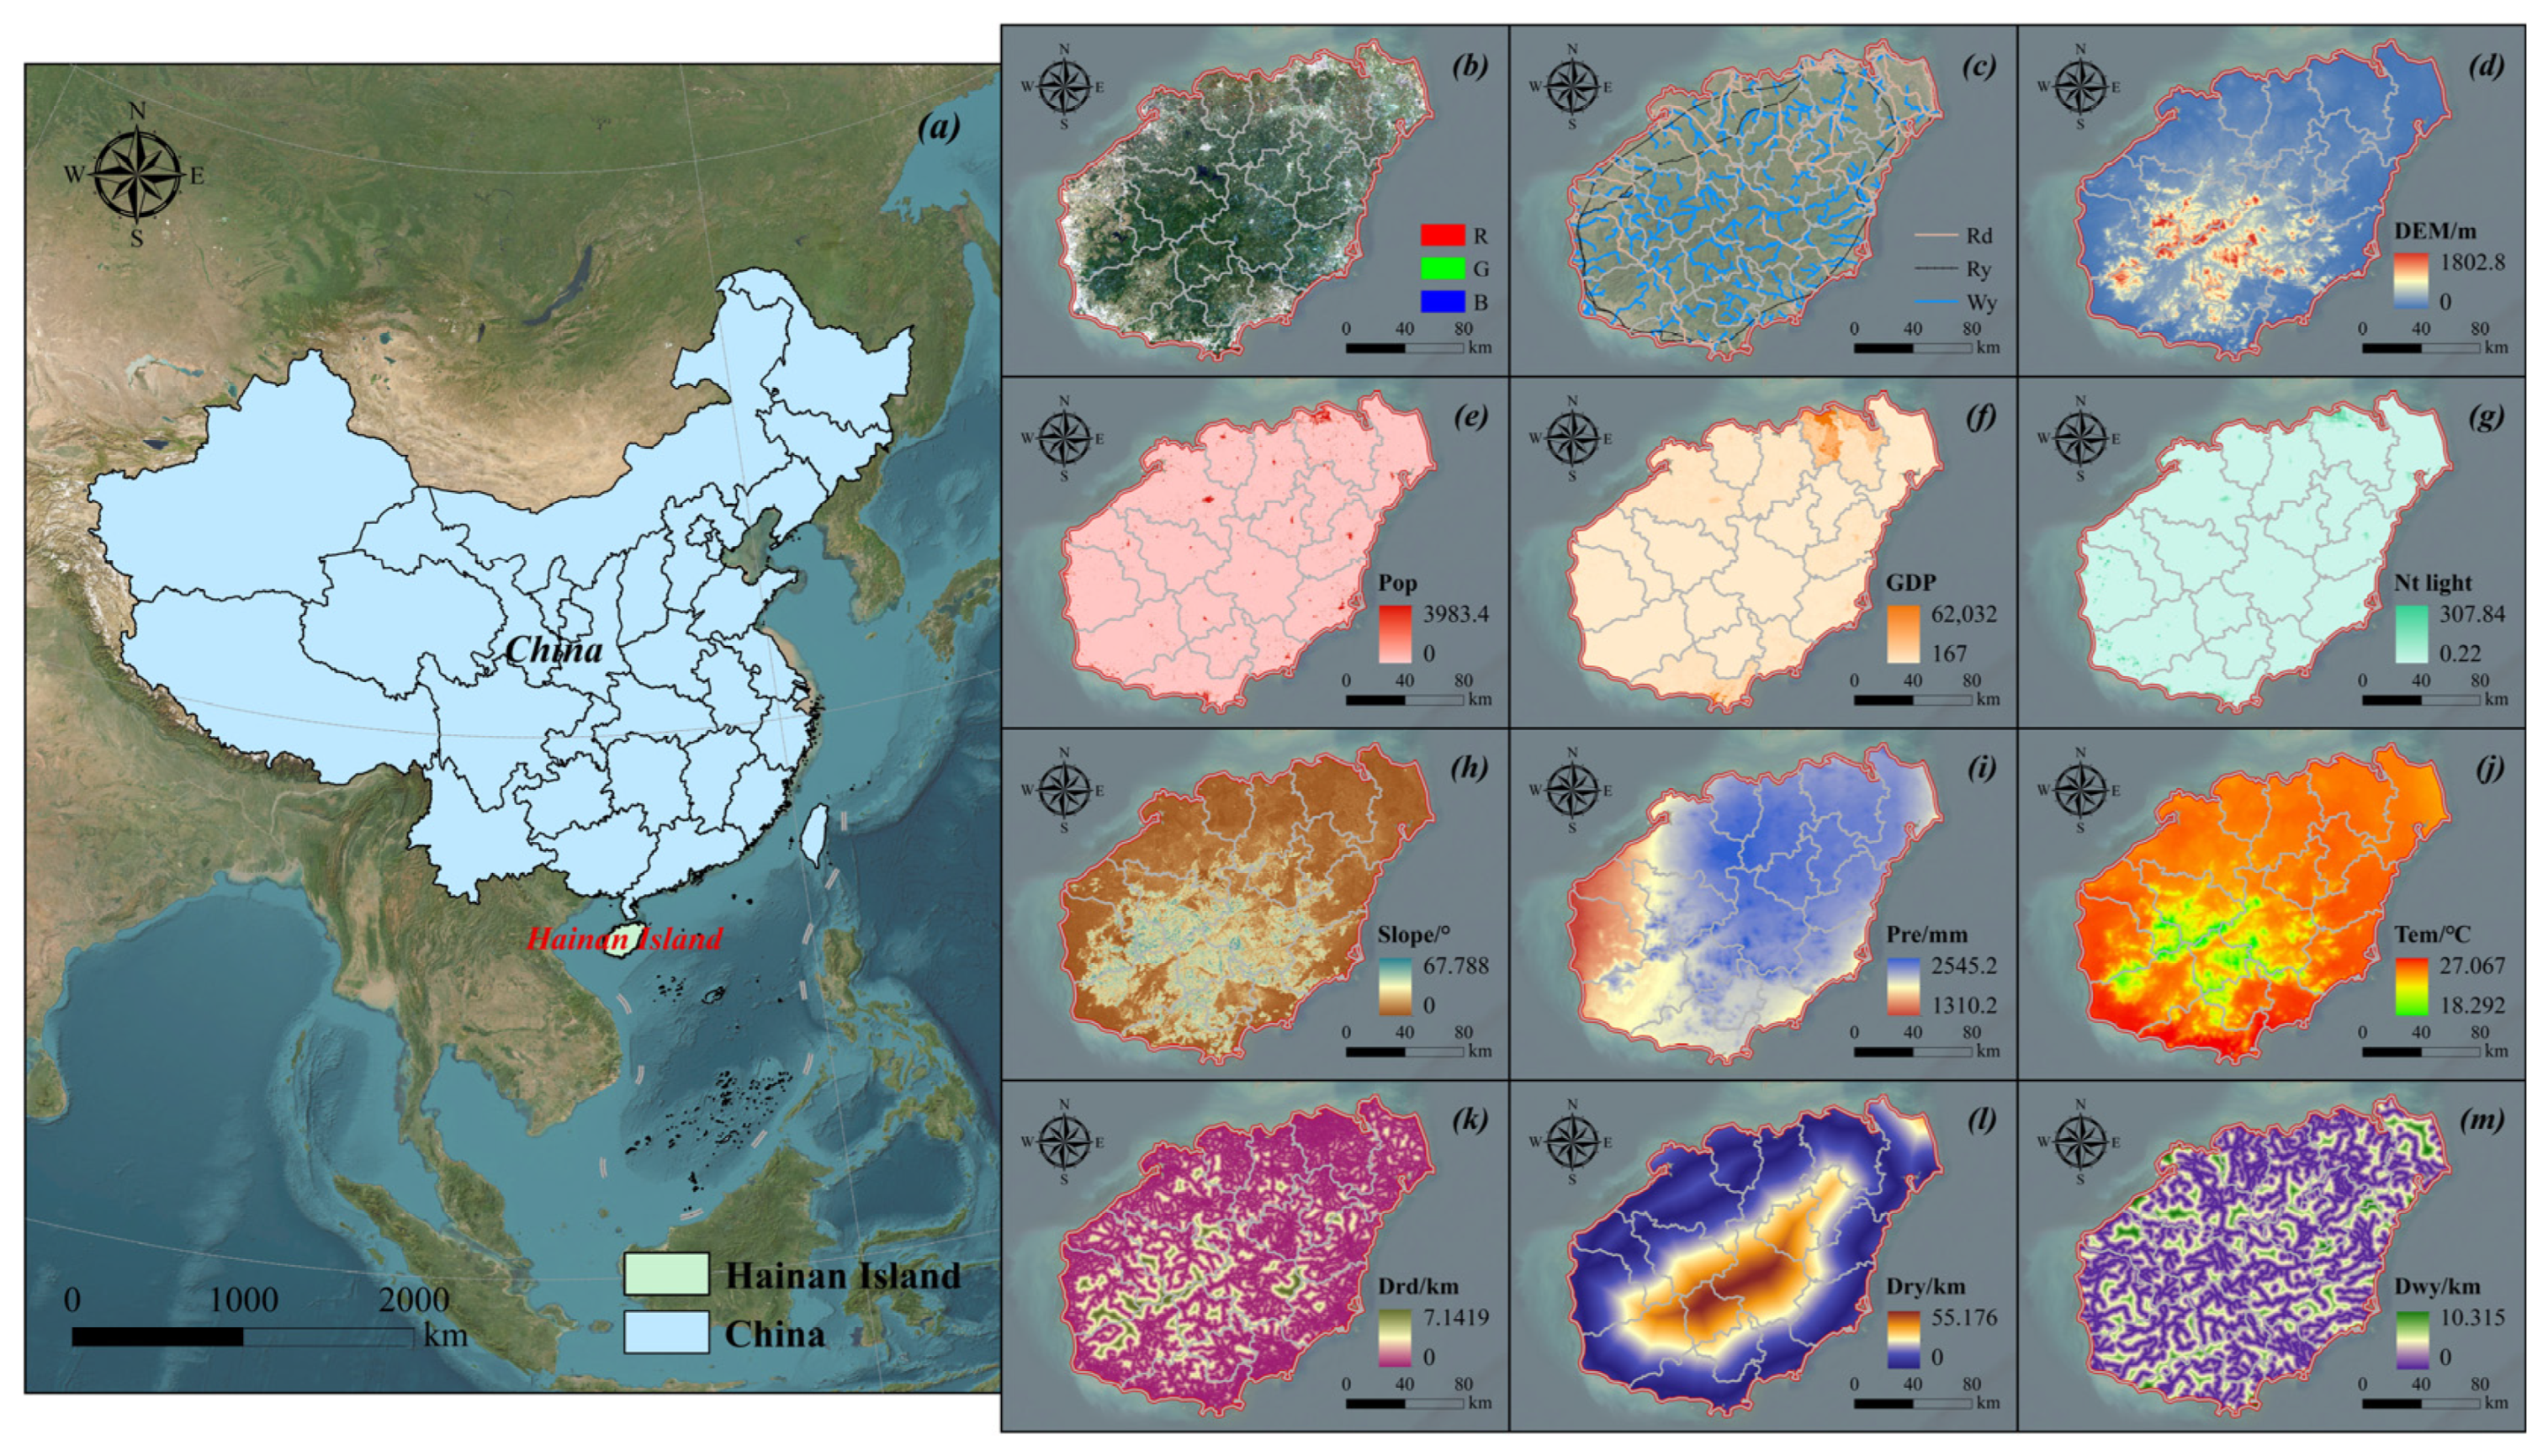
Hainan Island is located in the southern coastal region of China, extending approximately from 18°10′ to 20°10′ N and 108°37′ to 111°03′ E, with a total area of about 3.39 × 10⁴ km2 [25]. The island is surrounded by the sea and characterized by a ring-shaped topography with higher elevations in the central region and lower elevations toward the periphery. It lies within the tropical monsoon climate zone, featuring high temperatures and abundant precipitation throughout the year. The mean annual temperature ranges from 22 to 26 °C, and the annual precipitation varies between 1000 and 2500 mm, with the majority occurring from May to October, resulting in distinct wet and dry seasons [26]. Hainan Island hosts diverse ecosystem types, including tropical rainforests, evergreen broadleaf forests, coniferous forests, grasslands, croplands, and coastal wetlands, making it one of the biodiversity hotspots in China. The complexity and diversity of these ecosystems endow the island with significant ecological functions, such as habitat maintenance, carbon cycling, water conservation, and soil retention [27]. In recent years, rapid economic development has led to substantial changes in land use patterns, with notable conversion of forests into cropland and impervious surfaces. Urban expansion and transportation infrastructure development have further intensified landscape fragmentation [28]. Under the background of climate change, rising temperatures and increasing precipitation variability, coupled with land use change, exert compound effects on ecosystem services. Therefore, analyzing land use change and the spatiotemporal dynamics of ecosystem services in Hainan Island is of great significance for understanding ecological response mechanisms in tropical island regions and supporting sustainable development (Figure 1).

2.2. Data Sources and Descriptions

Land use data were extracted from the China Land Cover Dataset and reclassified into five categories: cropland, forest, grassland, water bodies, and impervious surfaces. Spatial data on roads, railways, and water systems were derived from OpenStreetMap, and Euclidean distance was calculated to represent the distance from each pixel to the nearest feature. Digital Elevation Model (DEM), slope, population density, nighttime light, NDVI, NDWI, NDBI, BSI, and evapotranspiration data were acquired from Google Earth Engine. The DEM was corrected using a sink-filling process to generate a continuous surface. Gross Domestic Product (GDP) and watershed data were obtained from the Resource and Environment Science Data Center of the Chinese Academy of Sciences. Precipitation and temperature were collected from ground-based observation stations. Kriging interpolation was applied to generate spatially continuous annual total precipitation and mean annual temperature. Rainfall erosivity was calculated based on annual precipitation using raster-based analysis. Future climate data were sourced from the National Tibetan Plateau Data Center. Soil data were derived from the Harmonized World Soils Database, from which plant available water content and soil erodibility were calculated using raster operations. Root restricting layer depth data were obtained from the Chinese soil depth dataset. Considering the relatively large extent of Hainan Island and the needs to balance computational efficiency with spatial detail, all raster datasets were resampled to a common spatial resolution of 100 × 100 m and were projected to the Albers_Conic_Equal_Area coordinate system (Table 1).

2.3. Research Framework

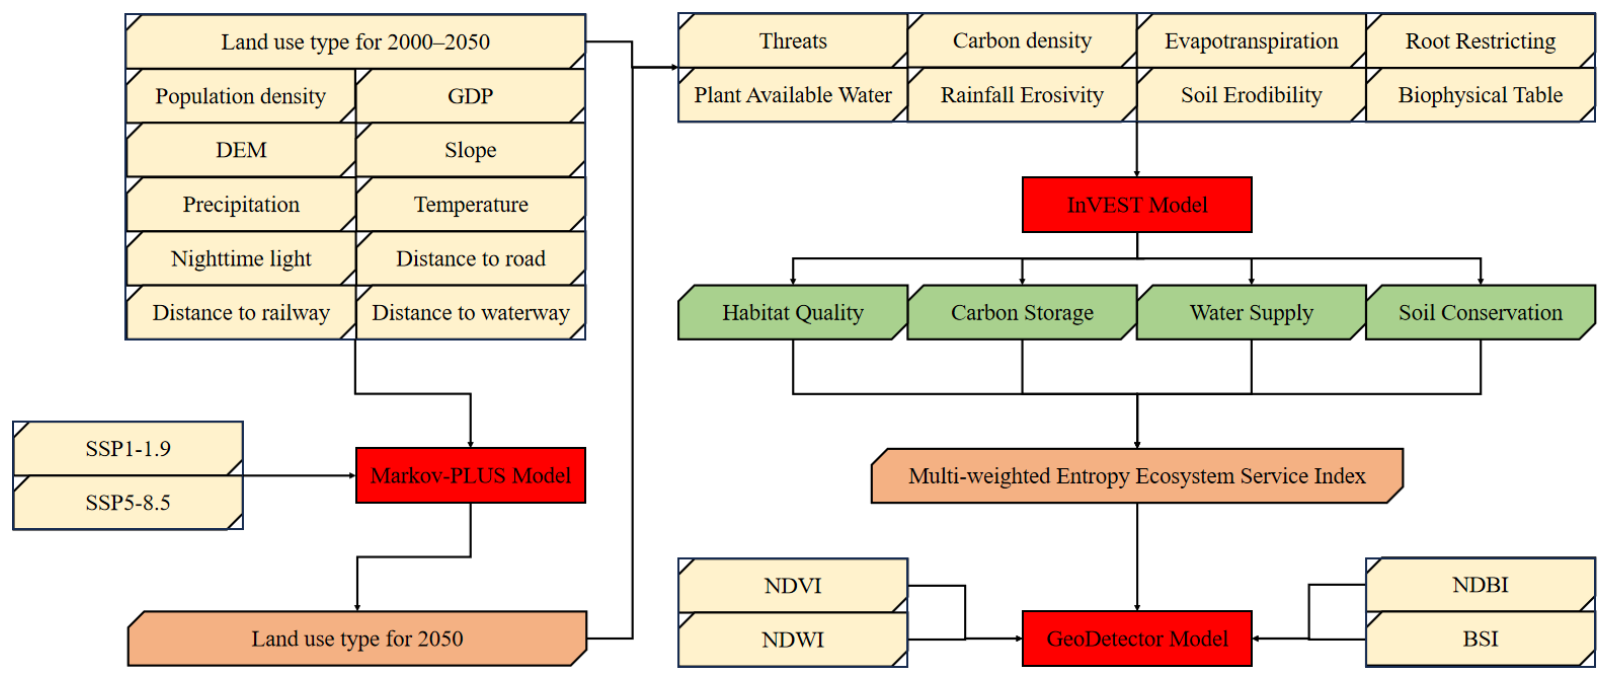
Based on land use data from 2000 to 2025, the Markov-PLUS model was employed to simulate land use patterns for 2050 under three scenarios: historical trend, SSP1-1.9, and SSP5-8.5. The simulation incorporated multiple driving factors, including population density, GDP, and other natural and socio-economic variables. Using historical and simulated data, the InVEST model was applied to quantify four key ecosystem services: habitat quality, carbon storage, water yield, and soil conservation. Based on the above results, the MEESI was constructed to evaluate the spatiotemporal patterns and variation characteristics of ecosystem services. The GeoDetector model was utilized to investigate the driving mechanisms underlying ecosystem service variation. NDVI, NDWI, NDBI, and BSI were selected as explanatory variables to assess the individual and interactive effects on ecosystem service dynamics in Hainan Island (Figure 2).

2.4. Methods

2.4.1. Markov-PLUS Model

Compared with conventional land use models, the Markov-PLUS model adopts a spatially explicit dynamic simulation framework, aiming to enhance the predictive accuracy of land use change and demonstrating distinct advantages in several key aspects [29]. By integrating spatial autocorrelation with temporal transition analysis, the model effectively captures the spatial dependence inherent in land use dynamics and provides a robust representation of complex ecological processes [30]. Moreover, the incorporation of external driving factors, including climate variability, socio-economic development, and policy interventions, significantly improves model adaptability and overcomes the limitations of traditional models that rely on fixed transition probabilities [31]. This enables a more realistic simulation of land use evolution under multiple interacting drivers. In this framework, the Markov model provides a “top-down” constraint by determining the overall quantity of land use demand, while the PLUS model operates in a “bottom-up” manner to allocate spatial patterns [32]. The integration of these two components allows for simulations with higher spatial resolution and longer temporal horizons. Specifically, the Land Expansion Analysis Strategy module quantifies the contribution of driving factors to land use expansion by extracting development probabilities for each land category, thereby improving model interpretability. The Cellular Automata based on Random Seeds module incorporates a stochastic seed generation mechanism and a threshold-decreasing rule to regulate land use competition and control the evolution of land use quantity, ensuring consistency with projected demand.
Based on previous studies and relevant literature, ten driving factors were selected for the Markov-PLUS model, including five natural variables (DEM, slope, annual total precipitation, annual mean temperature, and distance to waterways) and five socio-economic variables (population density, nighttime light, GDP, distance to roads, and distance to railways). Neighborhood weights were determined according to the proportion of land use expansion for each category in Hainan Island during the period 2000–2025 (Table 2). To evaluate model performance, land use patterns in 2025 were simulated using historical data, yielding a Kappa coefficient of 0.60 and an overall accuracy of 0.80. In addition, the producer’s and user’s accuracy for the major land use types were above 0.60 (cropland was 0.730 and 0.727, forest was 0.848 and 0.852, grassland was 0.233 and 0.027, water bodies was 0.750 and 0.760, impervious surfaces was 0.633 and 0.629), indicating that the model effectively captured the spatial distribution characteristics of the land use types in Hainan Island and was suitable for future land use simulations. Based on the validated model, future land use patterns for 2050 were projected under three scenarios: historical trend, SSP1-1.9, and SSP5-8.5. The historical trend scenario assumed continuation of historical land transition probabilities derived from the 2000–2025 transition matrix. The adjustment coefficients applied to land use transition probabilities were not intended to represent exact quantitative projections. Instead, they were designed to reflect the relative differences among development pathways described by the SSP framework. Following previous scenario-based land use simulation studies, transition probabilities were modified within a moderate range (20–40%) to represent strengthened ecological protection under SSP1-1.9 and intensified development pressure under SSP5-8.5. The SSP1-1.9 scenario represented a sustainable development pathway, in which the transition probabilities of forest and water bodies to other land use types were reduced by 40%, and that of grassland was reduced by 20%, reflecting strengthened ecological protection. In contrast, the SSP5-8.5 scenario represented a high-emission development pathway, where the transition probability from cropland to impervious surfaces was increased by 40%, and the conversion probabilities from forest to cropland and impervious surfaces were increased by 20% and 40%, while the transition probability from impervious surfaces to other land types was reduced by 40%. In all scenarios, nature reserves in Hainan Island were treated as restricted zones where land conversion is prohibited (Table 3). To characterize the dynamics of land use transitions, change rate and stability were calculated based on the transfer-in and transfer-out areas of each land use type. Land use change rate reflects the relative balance between transfer-in and transfer-out areas, while stability reflects the proportion of area that remained unchanged during the study period.
C R i = ( 1 A . i A i . ) × 100 ,
S i = A i i A i × 100 ,
where A . i represents the total area converted from other land use types into land use type i during the study period; A i . represents the total area converted from land use type i to other land use types during the study period. Positive values indicate that the transfer-out area exceeds the transfer-in area, whereas negative values indicate that the transfer-in area exceeds the transfer-out area. Values exceeding 100% may occur because the metric is derived from transition flows rather than total land use area. A i i represents the area that remained unchanged as land use type i at the end of the study period; A i . represents the area of land use type i at the beginning of the study period.

2.4.2. InVEST Model

  • Habitat quality
The habitat quality module includes habitat degradation and disturbance, providing a comprehensive assessment of the potential impacts of land use change and human activities on ecosystems [33]. It reflects biodiversity status and ecological suitability. By identifying threat factors within the landscape and incorporating their influence distance and spatial weighting, the model quantifies the cumulative impacts of these threats on different land use types [34]. Based on spatially explicit analysis, habitat quality and degradation indices are calculated to evaluate habitat conditions across different land units. Land use change in Hainan Island indicated that the expansion of cropland and impervious surfaces had largely occurred at the expense of ecological land types such as forest, grassland, and water bodies. Therefore, cropland and impervious surfaces were selected as primary threat sources in this study. Referring to the InVEST model user guide and the relevant literature [35], parameters including maximum distance, decay type of threats, and sensitivity of each land use type to different threats were determined to ensure a realistic representation of habitat degradation processes (Table 4).
Q r l = H l × 1 D r l z / ( D r l z + K z ) ,
where Q r l represents the habitat quality index for unit r in type l ; D r l represents the degradation degree of unit r in type l ; H l represents the habitat suitability of type l ; K represents the half-saturation coefficient; Z represents the normalization constant.
2.
Carbon storage
The carbon storage module simplifies the calculation of carbon stocks and carbon transfer processes by assuming that carbon storage is static and does not change over time [36]. Ecosystem carbon is divided into four fundamental pools: aboveground biomass carbon, belowground biomass carbon, soil carbon, and dead matter carbon. Based on land use classification, the average carbon density of each pool for different land use types is estimated, and total carbon storage is calculated as the product of area and corresponding carbon density [37]. The accuracy of carbon density parameters is critical to model outputs. In this study, carbon density data for different land use types were obtained from the National Ecosystem Science Data Center and further refined using region-specific literature to enhance their applicability [38]. Considering the characteristics of tropical ecosystems in Hainan Island, carbon density values for major land use types, including forest, cropland, and impervious surfaces, were carefully calibrated to better reflect regional carbon storage patterns (Table 5).
C t o t a l = C a + C b + C s + C d ,
where C t o t a l represents the total carbon storage; C a represents aboveground biomass carbon storage; C b represents belowground biomass carbon storage; C s represents soil organic carbon storage; C d represents dead organic carbon storage.
3.
Water yield
The water yield module integrates multiple factors, including precipitation, vegetation cover, and soil properties, to estimate the annual water yield at the regional scale [39]. Based on the water balance principle, actual evapotranspiration and surface runoff are calculated for each grid cell, generating a spatial distribution of water supply services and providing quantitative support for watershed management and ecological planning [40]. Although the computational framework is relatively simple, it has been demonstrated to produce reliable results. Based on previous studies and the relevant literature [41], key parameters such as root depth and vegetation evapotranspiration coefficients were obtained. In addition, factors such as surface runoff velocity under different land use types, topographic influences on runoff, and soil permeability were incorporated to determine water yield at the grid level. The total water yield of Hainan Island was then calculated and used as an indicator to evaluate the ecosystem water supply service (Table 6).
Y r l = 1 A E T r l / P r × P r ,
where Y r l represents the annual water yield for grid unit r in type l ; A E T r l represents the annual actual evapotranspiration for grid unit r in type l ; and P r represents the annual precipitation for grid unit r .
4.
Soil conservation
The soil conservation module focuses on slope soil erosion and sediment transport processes at the watershed level [42]. It is based on the Revised Universal Soil Loss Equation, which incorporates rainfall erosivity, soil properties, and other relevant factors to simulate soil loss [43]. Soil erosion per unit area is calculated, and by comparing potential erosion under natural (bare soil) conditions with actual erosion under current land use, the capacity of ecosystems to retain soil is assessed. Based on the relevant literature [44], vegetation cover factors and conservation practice factors for different land use types were determined. Soil conservation was calculated as the difference between potential soil erosion, representing erosion under bare soil conditions without any conservation measures, and actual soil erosion, which accounted for existing biological and engineering conservation practices in Hainan Island. This approach can enable quantification of the soil retention service provided by ecosystems (Table 7).
S D = R × K × L S × ( 1 C × P ) ,
where S D represents soil retention; R represents the precipitation erosivity factor; K represents the soil erodibility factor; L S represents slope length and steepness factor; C represents vegetation cover factor; P represents the soil conservation measures factor.
5.
MEESI construction.
The four ecosystem services evaluated in this study, namely habitat quality, carbon storage, water yield, and soil conservation, differ substantially in their physical meaning, dimensional units, and numerical ranges [45]. Carbon storage was expressed in mass units, whereas water yield and soil conservation were represented in volumetric or flux-based units, resulting in significant discrepancies in magnitude among indicators. Direct aggregation or comparison of these variables may lead to dominance by high-value indicators, thereby obscuring the relative importance of other ecosystem services [46]. Currently, most studies employ normalization methods to construct composite ecosystem service indices, typically using min–max scaling or range standardization to transform different indicators into dimensionless values [47]. Although this approach facilitates multi-indicator integration, it essentially represents a linear transformation and does not adequately account for differences in the individual ecosystem services. To address these limitations, this study integrated the entropy weighting method with the conventional composite ecosystem service index to construct the MEESI. The entropy method is grounded in information entropy theory and determines indicator weights based on the degree of data dispersion. Indicators with greater variability and higher information content are assigned larger weights, whereas those with lower variability receive smaller weights. This approach effectively reduces subjective bias in weight assignment and enhances the sensitivity of the composite index to spatial heterogeneity in ecosystem services. It should be noted that the entropy weighting method determines indicator weights according to the degree of data dispersion. Therefore, the resulting weights reflect the relative statistical information contributed by each ecosystem service rather than their normative ecological importance or management priority.

2.4.3. GeoDetector Model

The GeoDetector model, based on spatial statistics and spatial stratified heterogeneity theory, is widely used to detect spatial differentiation and to identify the underlying driving mechanisms of geographical phenomena [48]. It evaluates the explanatory power of multiple driving factors on the spatial distribution of a target variable and explores both individual effects and interactions among factors. The model consists of four main components: factor detection, interaction detection, ecological detection, and risk detection [49]. The factor detector quantifies the explanatory power of each independent variable on spatial variation, revealing the relative importance of different driving factors. The interaction detector evaluates not only the individual effects but also the combined influence of multiple factors, with interaction types including nonlinear weakening, univariate nonlinear weakening, bi-factor enhancement, and nonlinear enhancement [50]. Ecosystem services are inherently dynamic and vary with changes in habitat quality, carbon storage, water yield, and soil conservation. Although land use type is a primary determinant of these variations, external driving factors can significantly alter their spatial distribution patterns, thereby influencing ecosystem service functions. Numerous studies have demonstrated that environmental factors exert both direct and indirect effects on ecosystem services, particularly through their interactions with climatic conditions and human activities [51]. In this study, a pixel-based approach was employed to extract four representative indicators, including NDVI, NDWI, NDBI, and BSI, reflecting vegetation conditions, surface moisture, urban development intensity, and land disturbance, respectively. To ensure spatial representativeness while maintaining computational efficiency, 1000 random sampling points were generated across Hainan Island. This sample size was sufficient to capture the major environmental gradients and land use heterogeneity of the study area. All continuous variables were discretized using the Natural Breaks method prior to GeoDetector analysis. The explanatory power of these factors on ecosystem service variations was then quantified to identify the dominant drivers of ecosystem service dynamics.

3. Results

3.1. Changes in Land Use Types from 2000 to 2050

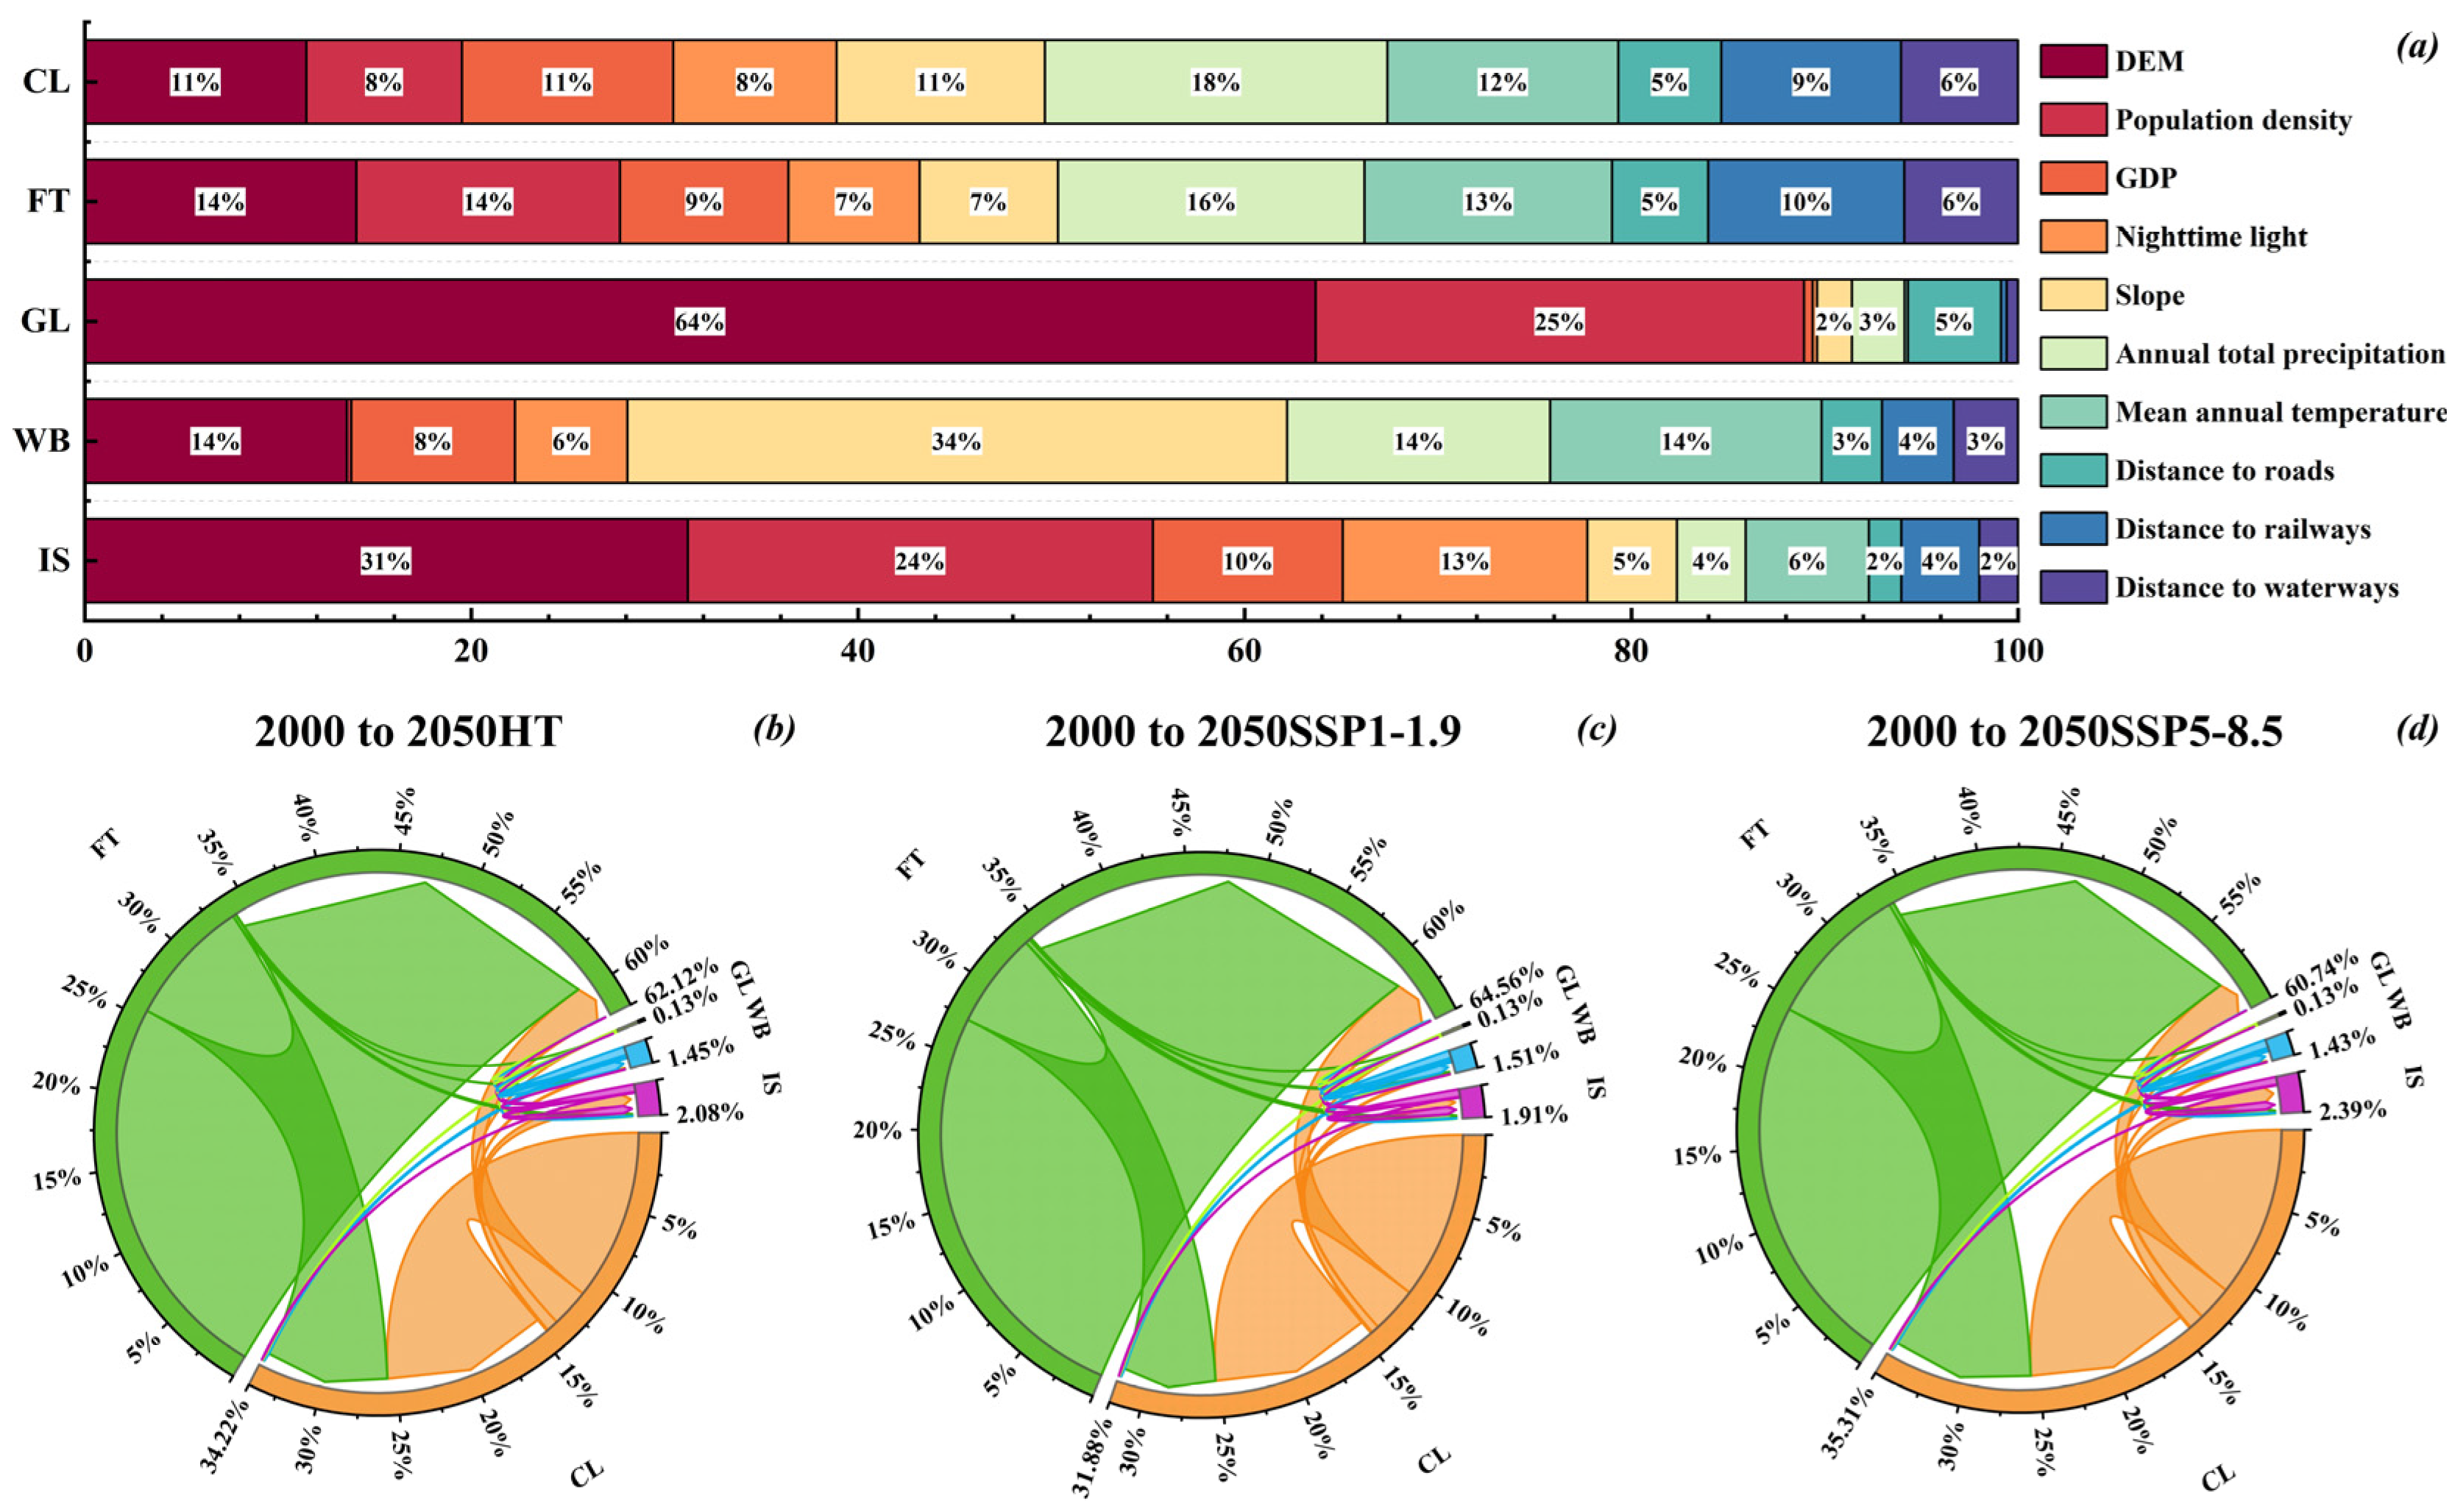
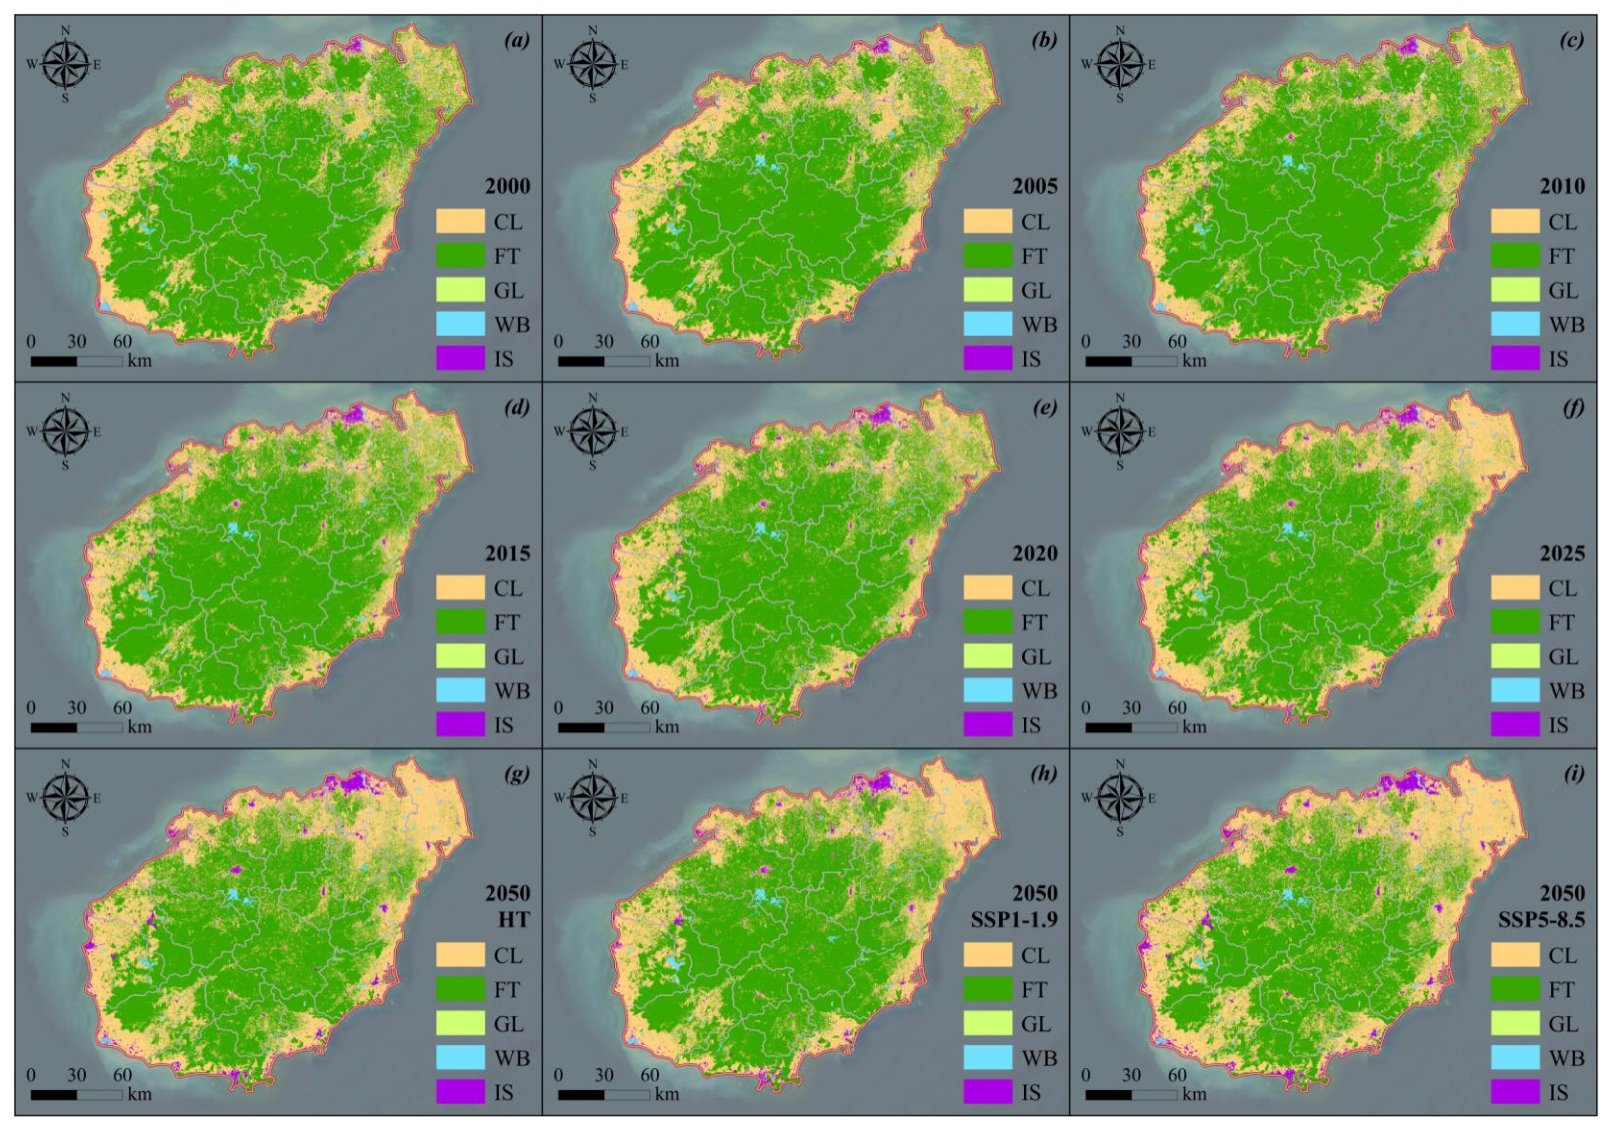
From 2000 to 2050, land use patterns in Hainan Island were characterized by a forest-dominated structure, accompanied by the co-expansion of cropland and impervious surfaces. Forest remained the dominant land use type throughout the study period, accounting for approximately 60% of the total area, although it exhibited a gradual declining trend. Cropland represented the second largest land use category, accounting for around 30%, and showed a continuous increasing trend. Impervious surfaces expanded steadily with the advancement of urbanization, displaying a clear linear growth pattern. In contrast, grassland and water bodies fluctuated at different stages, influenced by localized ecological restoration, land consolidation, and climatic variability, while their overall proportions remained relatively stable. In terms of spatial patterns, cropland was mainly distributed across the northern, western, and eastern coastal plains, closely associated with population distribution and agricultural activities. Forest was concentrated in the central mountainous region and ecological conservation zones, forming a critical ecological security barrier. Impervious surfaces were primarily located in core cities such as Haikou and Sanya, as well as along coastal economic corridors, and expanded along transportation networks and urban nodes. Grassland and water bodies were mainly distributed in transitional zones and low-lying areas. Overall, Hainan Island exhibited a typical spatial configuration characterized by a “central ecological core-peripheral development zone” (Figure 3). The constraint variables derived from the Markov-PLUS model indicated that cropland was mainly controlled by precipitation, temperature, and DEM, highlighting its strong dependence on climatic and topographic conditions. Forest was influenced by precipitation, DEM, and population density, suggesting that it was jointly constrained by natural conditions and human disturbances. Grassland was affected by DEM, population density, and distance to roads, reflecting its sensitivity and instability within ecological transition zones. Water bodies were primarily governed by slope, temperature, and precipitation, indicating strong dependence on hydrological and terrain conditions. In contrast, the expansion of impervious surfaces was mainly driven by socio-economic factors such as DEM, population density, and nighttime light, demonstrating a clear dominance of human activities (Figure 4a).
Significant differences in land use transition patterns were observed under different scenarios. Under the historical trend scenario, forest and cropland were identified as the primary land types undergoing conversion. The total area of forest conversion reached 5764.28 km2, with 97.24% transitioning to cropland, mainly distributed in Wenchang and Haikou in the northeast, and Dongfang and Ledong in the southwest. In addition, a portion of forest was converted into impervious surfaces, particularly in urban expansion areas such as Haikou. Cropland conversion amounted to 2253.28 km2, with 74.37% transitioning to forest, mainly in Danzhou and Lingao, while part of cropland was also converted into impervious surfaces in economically developed regions such as Haikou and Sanya. Overall, the historical trend scenario reflected a continuation of historical development trajectories, where economic growth was achieved at the expense of sustained pressure on ecological land (Figure 4b). Under the SSP1-1.9 scenario, the intensity of land use transitions was significantly reduced, and the protection of ecological land was markedly enhanced. The forest conversion area decreased to 4520.55 km2, substantially lower than that in the historical trend scenario, while the total forest area reached 20,592.5 km2, indicating a net increase. Cropland conversion reached 2432.71 km2, with the proportion transitioning to forest increasing to 83.31%, suggesting strengthened ecological restoration processes. Changes in grassland and water bodies were relatively minor, and the overall ecosystem structure tended toward stability. Meanwhile, the expansion of impervious surfaces was effectively constrained. Under this sustainable development pathway, optimized land use management alleviated ecological land loss and promoted a balance between ecological conservation and economic development (Figure 4c). In contrast, the SSP5-8.5 scenario exhibited more intensive land use transformation. Forest conversion reached 6570.45 km2, significantly exceeding that in other scenarios, with 96.98% converted into cropland, indicating severe encroachment on forest resources under high-intensity development. Cropland conversion amounted to 2281.18 km2, with a markedly increased proportion transitioning to impervious surfaces, reaching up to 29.55%, the highest among all scenarios. Meanwhile, the inflow area of impervious surfaces increased substantially, reflecting accelerated urban expansion and infrastructure development. Under this scenario, large-scale conversion of ecological land to support economic growth led to a pronounced decline in ecosystem structural stability and a significant increase in potential ecological risks (Figure 4d).
From the perspective of change rate and stability, cropland exhibited a change rate of −156.53% and a stability of 76.98%, indicating that its inflow area was significantly greater than its outflow area. Driven by the dual demands of food security and cash crop production, cropland expanded continuously into surrounding ecological land, particularly in relatively flat coastal regions with favorable transportation conditions. Forest showed a change rate of 70.41% and a stability of 74.94%, indicating that it remained dominated by net loss while maintaining a certain degree of structural stability. Although the central mountainous region served as an ecological core that protected forest resources, peripheral areas continued to experience pressure from agricultural expansion and impervious surface growth, especially in the northeastern and southwestern regions. Grassland exhibited a change rate of 95.25% and an extremely low stability of 1.63%, indicating high spatial instability and sensitivity, making it the most dynamic land use type. Located primarily in transition zones between forest, cropland, and impervious surfaces, grassland underwent frequent conversion under competing land use demands. Water bodies showed a change rate of 40.04% and a stability of 71.54%, indicating relatively stable overall dynamics, although localized changes remained significant. In coastal development and urban expansion processes, some water bodies were reclaimed or transformed into impervious surfaces. Impervious surfaces exhibited a change rate of −1711.48% and a stability of 89.45%, indicating the most pronounced expansion trend. The rapid urbanization of Hainan Island, particularly in core cities such as Haikou and Sanya and along coastal economic corridors, drove the outward expansion of impervious surfaces along transportation networks and urban boundaries, resulting in substantial encroachment on surrounding cropland and ecological land. Meanwhile, the high stability of impervious surfaces suggested that once established, they were difficult to revert to ecological land in the short term, reflecting a strong “irreversibility” characteristic (Table 8).

3.2. Changes in Ecosystem Service Functions from 2000 to 2050

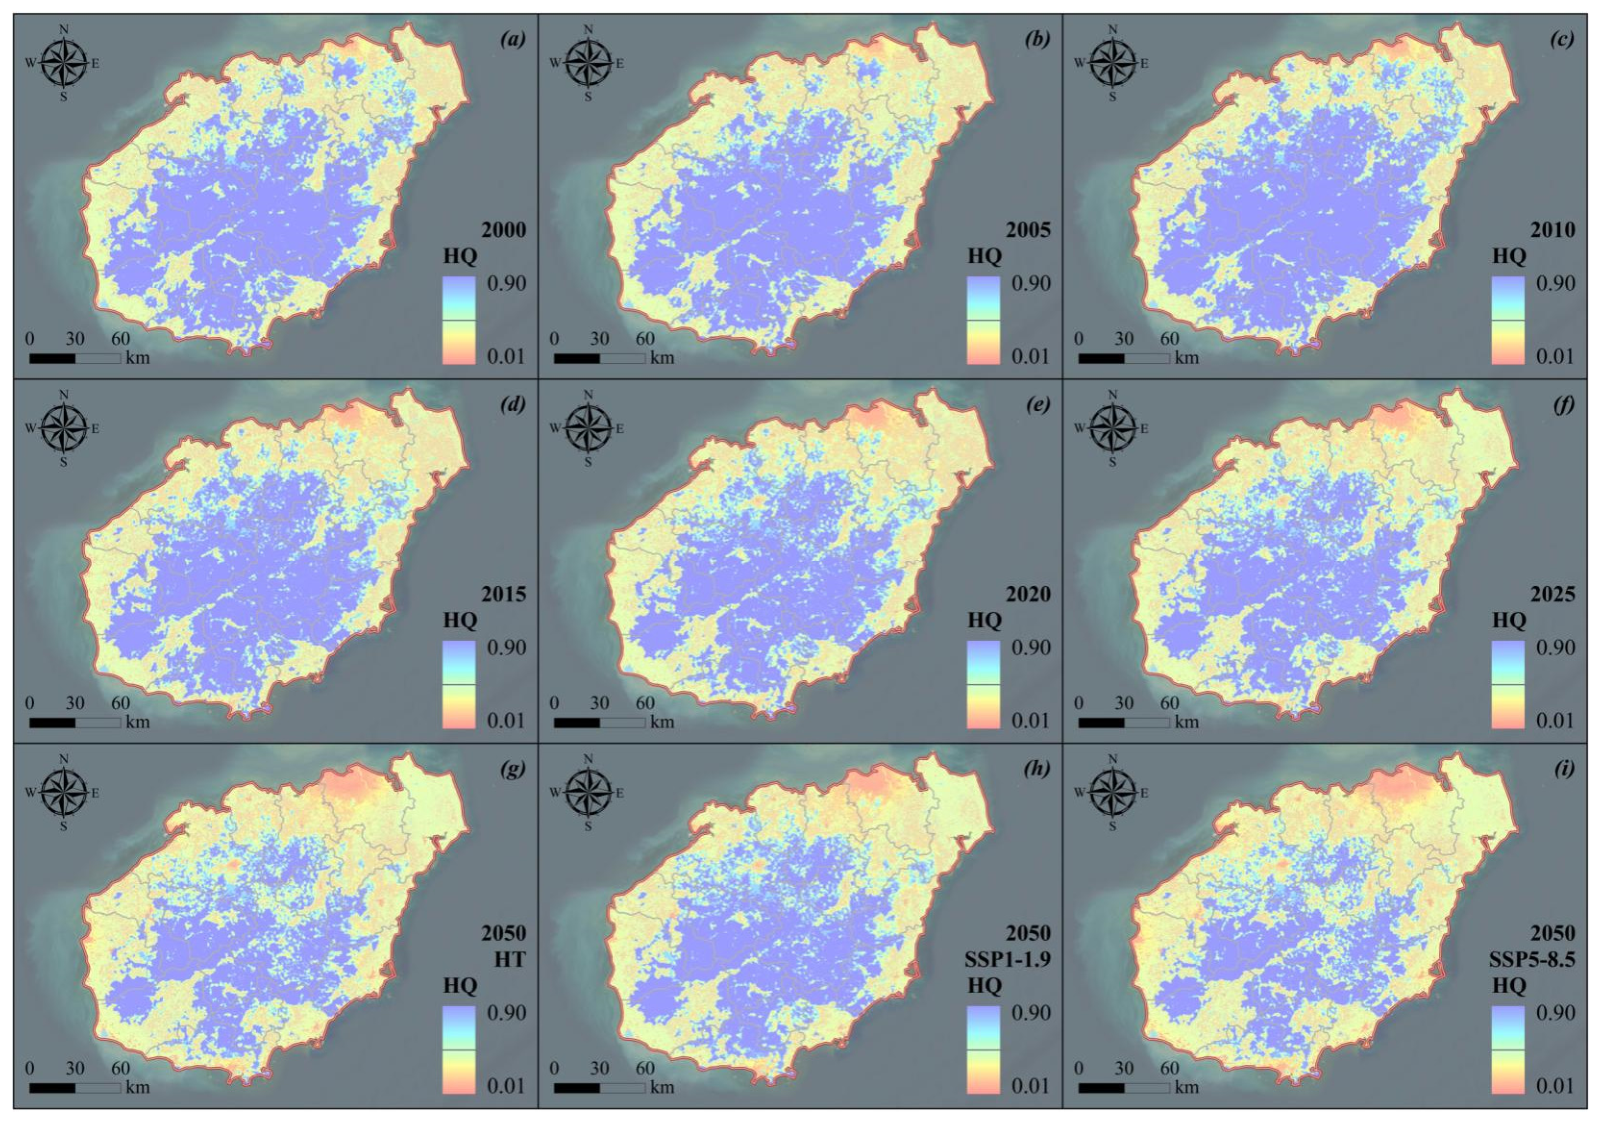
From 2000 to 2025, the mean habitat quality values in Hainan Island were 0.6784, 0.6603, 0.7014, 0.6616, 0.6373, and 0.6224, while those under the historical trend, SSP1-1.9, and SSP5-8.5 scenarios in 2050 were 0.5725, 0.6207, and 0.5493. Overall, habitat quality exhibited a fluctuating yet declining trajectory, indicating a long-term degradation trend. The peak value in 2010 was associated with a reduction in cropland and an expansion of forest. Because cropland was identified as a major threat source, its reduction alleviated anthropogenic pressure, while increased forest coverage provided more suitable habitats. However, after 2010, the continuous expansion of cropland and impervious surfaces, accompanied by reductions in forest, grassland, and water bodies, intensified habitat fragmentation, leading to a subsequent decline in habitat quality. Spatially, a typical pattern of “high in the central region and low in coastal areas” was observed. The central mountainous region, characterized by complex terrain, limited human disturbance, and high forest coverage, maintained relatively intact habitats. In contrast, coastal areas, affected by urban expansion, tourism development, and intensive agricultural activities, experienced pronounced declines in habitat quality. 66.74% of the area underwent changes, with degradation-dominated regions prevailing, reflecting an overall ecological deterioration trend. Areas with improved habitat quality were mainly concentrated in Danzhou and Lingao, where cropland-to-forest conversion was prominent, resulting in significant ecological restoration effects. In contrast, degraded areas were primarily distributed in Haikou, Wenchang, and Ledong, where forests were converted into cropland and impervious surfaces. In terms of scenario differences, habitat quality under the SSP1-1.9 scenario was significantly higher than that under the historical trend and SSP5-8.5 scenarios. This was mainly attributed to strengthened ecological protection policies, which effectively restricted the conversion of forests into cropland and impervious surfaces, thereby maintaining and locally expanding high-quality habitats. Conversely, under the SSP5-8.5 scenario, the prioritization of economic development accelerated the expansion of cropland and impervious surfaces. Intensive human activities further exacerbated habitat fragmentation, particularly in coastal economic zones, where habitat quality declined to its lowest levels. These results highlighted that land use regulation and ecological redline policies played a decisive role in maintaining habitat quality (Figure 5).
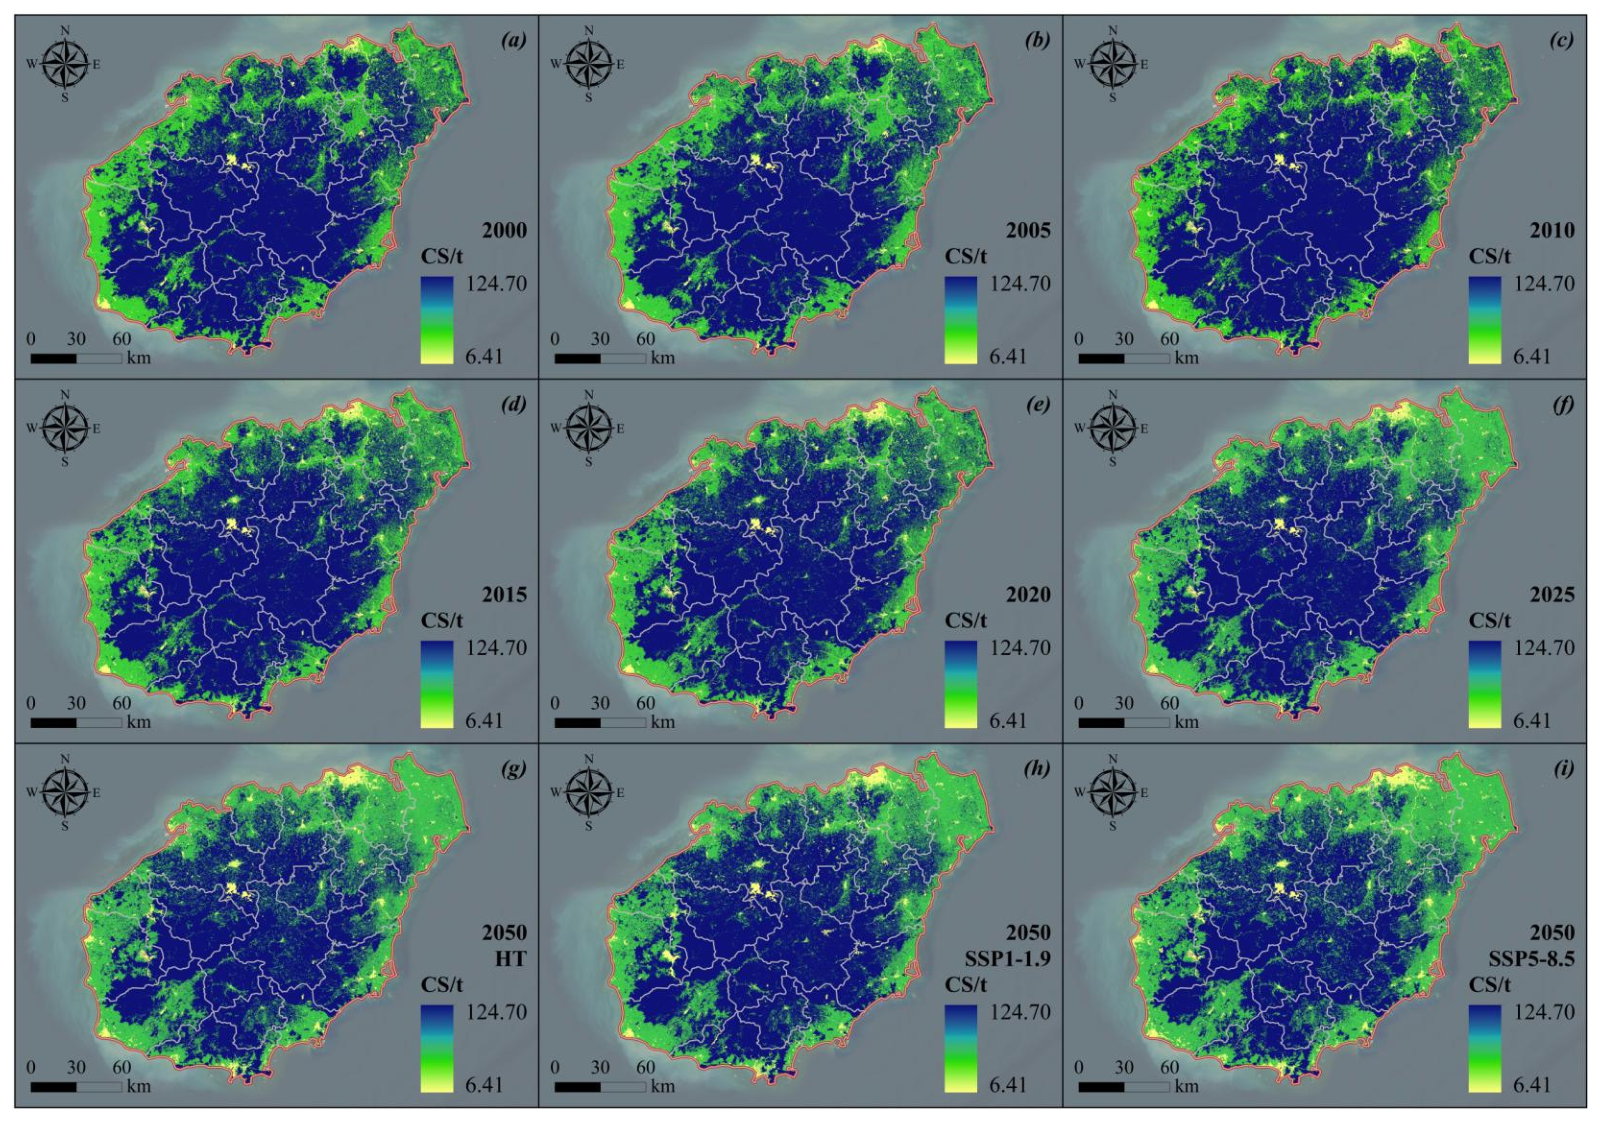
From 2000 to 2025, the total carbon storage in Hainan Island was 346.08 × 10⁶ t, 338.32 × 10⁶ t, 353.46 × 10⁶ t, 343.49 × 10⁶ t, 338.81 × 10⁶ t, and 328.55 × 10⁶ t, while the values under the historical trend, SSP1-1.9, and SSP5-8.5 scenarios in 2050 were 316.78 × 10⁶ t, 327.89 × 10⁶ t, and 309.73 × 10⁶ t. Carbon storage showed a persistent declining trend overall. From a modeling perspective, carbon storage consisted of four components: aboveground biomass carbon, belowground biomass carbon, soil organic carbon, and dead organic carbon. Significant differences in carbon density among land use types were identified, with forests exhibiting the highest carbon density and serving as the primary regional carbon sink. Therefore, once forests were converted into cropland or impervious surfaces, carbon storage declined sharply. Spatially, areas with increased carbon storage were mainly located in Danzhou, reflecting enhanced carbon sequestration due to cropland-to-forest conversion. In contrast, areas with decreased carbon storage were concentrated in coastal cities such as Haikou, Wenchang, and Sanya, where rapid urban expansion led to the conversion of high-carbon-density forests into low-carbon-density land use types, thereby resulting in carbon emissions. Temporally, only 24.54% of the area experienced changes, but these areas were mainly located in regions with intensive development, exerting a disproportionate influence on the regional carbon cycle. Under different scenarios, carbon storage under SSP1-1.9 showed a recovery trend, primarily due to strengthened ecological protection policies and net forest expansion, which enhanced regional carbon sequestration capacity. In contrast, under SSP5-8.5, large-scale conversion of forests into cropland and impervious surfaces resulted in the most significant decline in carbon storage. Notably, carbon storage was relatively less sensitive to climatic factors, and its variation was primarily driven by land use change (Figure 6).
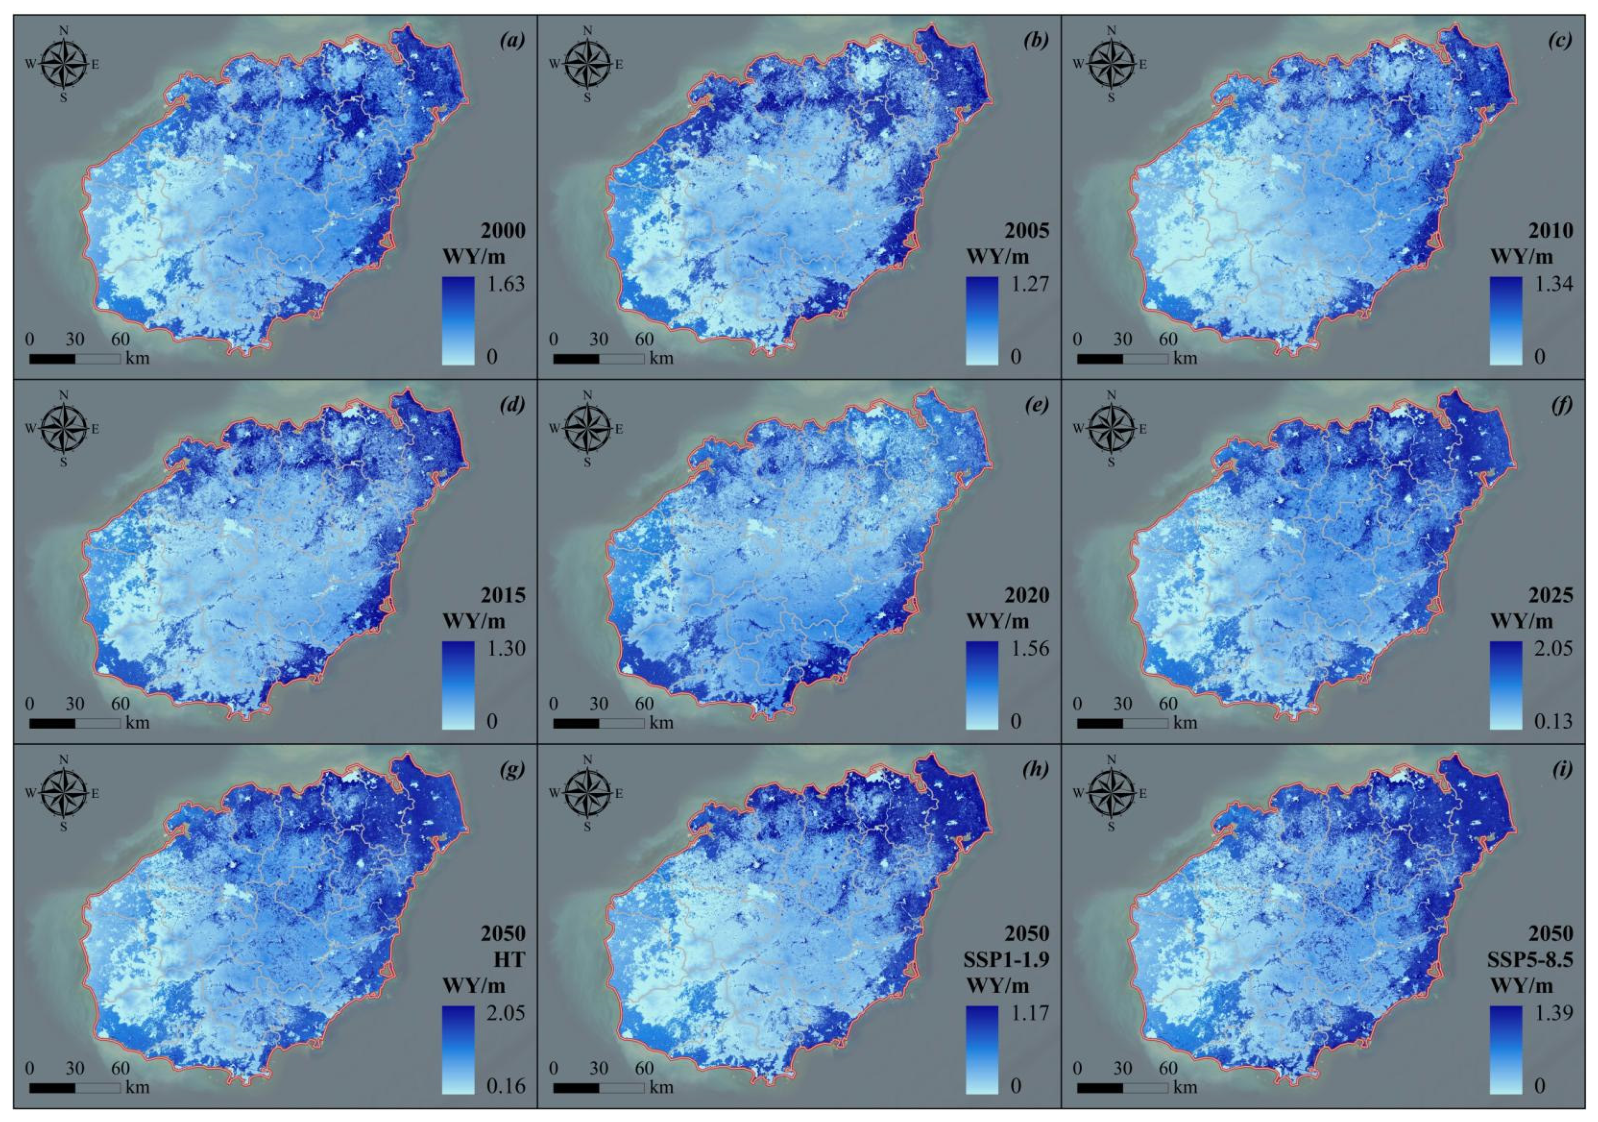
From 2000 to 2025, the total water yield in Hainan Island was 2442.87 × 106 m3, 1557.05 × 106 m3, 1519.25 × 106 m3, 1549.75 × 106 m3, 1931.62 × 106 m3, and 3485.56 × 106 m3, while the values under the historical trend, SSP1-1.9, and SSP5-8.5 scenarios in 2050 were 3586.94 × 106 m3, 1421.29 × 106 m3, and 2020.09 × 106 m3. Overall, water yield exhibited an increasing trend with significant fluctuations. Water yield was controlled by precipitation, actual evapotranspiration, plant-available water content, and root-restricting layer depth, among which precipitation served as the dominant factor. The pronounced increase between 2020 and 2025 was driven by climatic and land use changes. In this period, mean annual precipitation increased substantially from 1705.80 mm to 2171.70 mm, providing greater water input to the ecosystem. Meanwhile, the continuous expansion of cropland and impervious surfaces, accompanied by reductions in forest, grassland, and water bodies, altered surface hydrological processes by reducing evapotranspiration and increasing runoff generation. These land use transitions further amplified the effect of increased precipitation, resulting in a marked rise in water yield. Spatially, increased water yield areas were mainly distributed in Haikou, Wenchang and the southwestern regions, where land use changes were dominated by forest conversion into cropland and impervious surfaces, leading to reduced evapotranspiration and increased runoff. In contrast, decreased areas were mainly located in Danzhou and Lingao, where cropland was converted into forest, enhancing evapotranspiration and reducing water yield. In terms of scenario mechanisms, the two scenarios exhibited distinct patterns. Under SSP1-1.9, water yield decreased significantly, primarily due to forest expansion driven by ecological protection policies. In the InVEST simulations, forest vegetation was assigned relatively high evapotranspiration characteristics, resulting in a larger proportion of precipitation being partitioned into evapotranspiration rather than runoff. Under SSP5-8.5, although cropland and impervious surfaces expanded, which would typically increase water yield, the significantly lower precipitation under this scenario imposed strong climatic constraints, preventing water yield from reaching its maximum level. Therefore, water yield dynamics reflected a dual mechanism of “climate dominance and land use regulation”, being highly sensitive to precipitation while also influenced by underlying surface conditions (Figure 7).
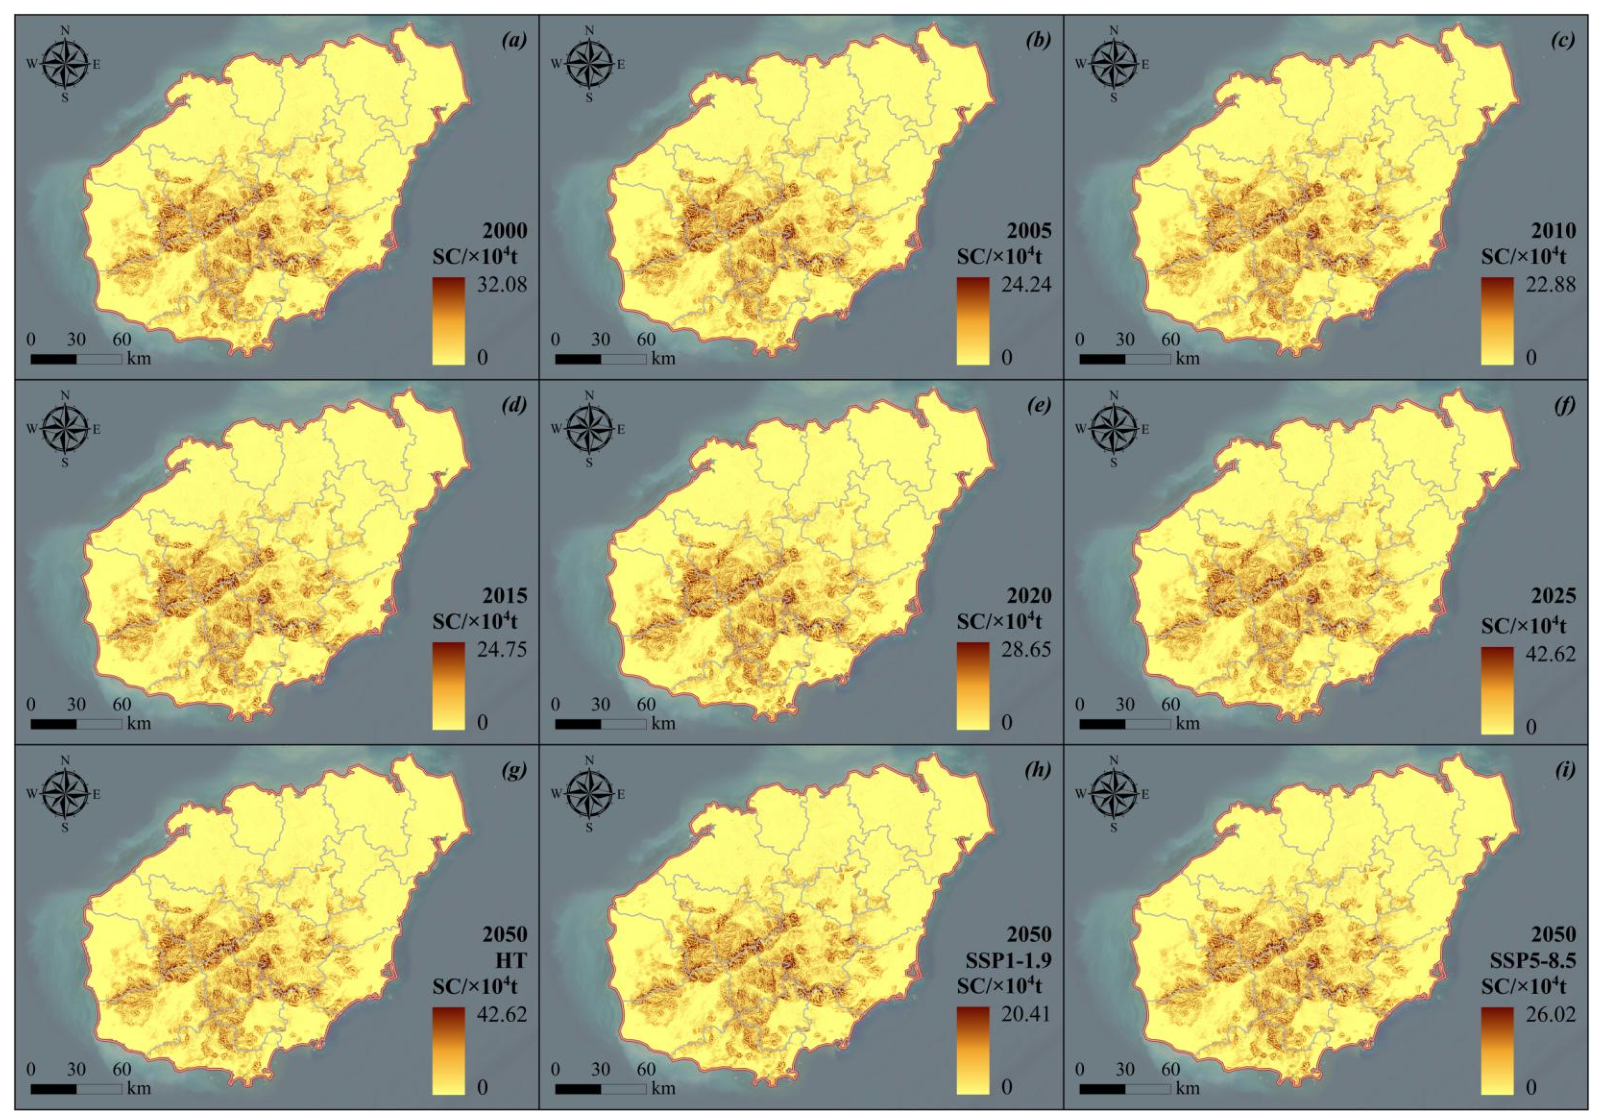
From 2000 to 2025, the total soil conservation in Hainan Island was 8617.94 × 106 t, 6378.77 × 106 t, 6153.63 × 106 t, 6797.97 × 106 t, 8308.24 × 106 t, and 11,277.18 × 106 t, while the values under the historical trend, SSP1-1.9, and SSP5-8.5 scenarios in 2050 were 11,285.76 × 106 t, 5427.36 × 106 t, and 6880.76 × 106 t. Overall, soil conservation showed an increasing trend, with pronounced differences among scenarios. Soil conservation was primarily determined by rainfall erosivity, soil erodibility, slope, and vegetation cover, among which vegetation cover played a critical regulatory role. Spatially, increased soil conservation areas were mainly concentrated in the central and western mountainous regions including Baisha, Wuzhishan, and Qiongzhong, where steep slopes and concentrated rainfall were effectively mitigated by high forest coverage. In contrast, coastal regions experienced a decline in soil conservation due to the conversion of forests into cropland and impervious surfaces, leading to reduced vegetation cover. Approximately 96.68% of the area underwent changes, indicating high sensitivity of soil conservation to environmental variations. In terms of scenario differences, SSP1-1.9 exhibited the most significant decline in soil conservation, driven by a mechanism distinct from that of water yield. According to the InVEST soil conservation model, although forest expansion improved vegetation protection, the lower precipitation erosivity under SSP1-1.9 reduced potential soil loss, resulting in lower estimated soil conservation values. In contrast, under SSP5-8.5, although precipitation conditions were relatively higher, the degradation of ecological land and reduced vegetation cover weakened soil conservation capacity. Thus, the simulated responses suggested different controlling mechanisms among scenarios: SSP1-1.9 represented “reduced erosion leading to lower conservation”, whereas SSP5-8.5 reflected “vegetation degradation leading to reduced conservation capacity”. Overall, soil conservation dynamics were jointly governed by climatic erosivity and land use structure, with mechanisms that differed significantly from those of water yield and carbon storage (Figure 8).

3.3. Changes in MEESI from 2000 to 2050

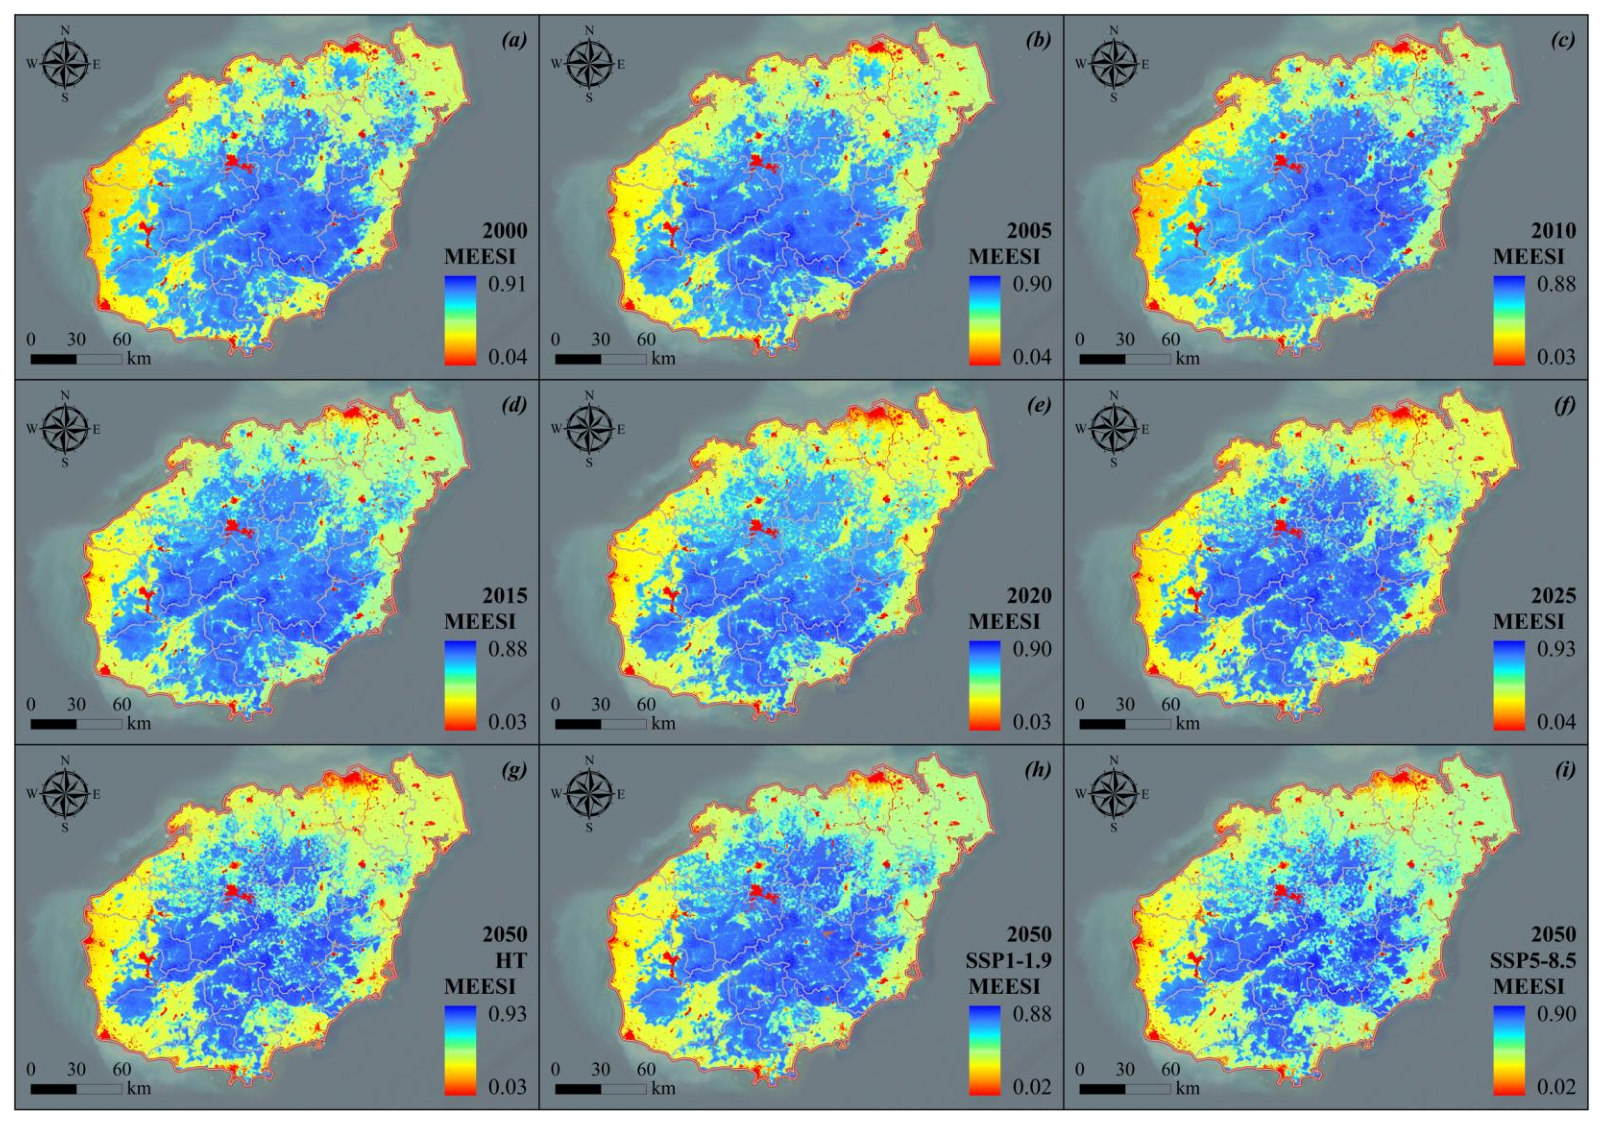
From the perspective of ecological processes, habitat quality and carbon storage generally exhibited strong synergetic relationships, as both depended on high-coverage ecological land such as forests. In contrast, water yield often showed a trade-off relationship with forest coverage, as forest ecosystems, characterized by strong evapotranspiration, reduced surface runoff. Soil conservation was generally consistent with habitat quality and vegetation coverage to some extent, but it was also regulated by rainfall erosivity and topographic conditions. From 2000 to 2025, the mean MEESI in Hainan Island was 0.3552, 0.3481, 0.3402, 0.3457, 0.3476, and 0.3684, while the values under the historical trend, SSP1-1.9, and SSP5-8.5 scenarios in 2050 were 0.3565, 0.3509, and 0.3395. The index exhibited a phased pattern characterized by an initial decline, followed by recovery, and subsequent stabilization, although the long-term trend remained slightly decreasing. Spatially, high-value areas were mainly concentrated in the central hilly zones, including Baisha, Wuzhishan, and Qiongzhong. These areas, dominated by forest, maintained high habitat quality, high carbon storage, and strong soil conservation capacity. Although water yield in these regions was relatively low, their overall ecosystem service index remained high due to the combined contribution of multiple services. In contrast, low-value areas were distributed in Haikou and coastal development zones, where cropland and impervious surfaces dominated. Although some of these areas exhibited relatively higher water yield, their habitat quality, carbon storage, and soil conservation capacity were significantly lower, resulting in reduced overall ecosystem service performance after weighting. Approximately 80.51% of the study area experienced changes in the ecosystem service index, with increasing areas still concentrated in forest land use types, while decreasing areas were mainly located in impervious surfaces land use types (Figure 9).
At the regional scale of Hainan Island, forests, as the core ecological land type, played a crucial role in maintaining habitat quality, carbon storage, and soil conservation, demonstrating strong synergetic effects and serving as the primary contributor to comprehensive ecosystem service capacity. In contrast, cropland and impervious surfaces mainly enhanced specific services, such as water yield, but tended to exhibit negative contributions in the overall evaluation due to their weakening effects on other services. In the SSP1-1.9 scenario, the MEESI showed a relatively moderate decline compared with the other scenarios. This pattern was associated with controlled expansion of cropland and impervious surfaces, which contributed to maintaining ecological land and preserving the relationship between habitat quality and carbon storage. In contrast, the SSP5-8.5 scenario was characterized by a larger decline in the MEESI, accompanied by increased conversion of forest to cropland and impervious surfaces. Correspondingly, habitat quality, carbon storage, and soil conservation decreased to varying degrees. Although certain ecosystem services showed localized increases in this scenario, the overall ecosystem service capacity remained lower than that under the SSP1-1.9 scenario. Notably, impervious surfaces exhibited relatively high values in an individual service, particularly water yield; however, under this multi-weighted entropy framework, their overall contribution remained limited or even negative, indicating that improvements in single ecosystem services did not necessarily translate into overall ecological optimization (Table 9).

3.4. Driving Mechanisms of MEESI from 2000 to 2025

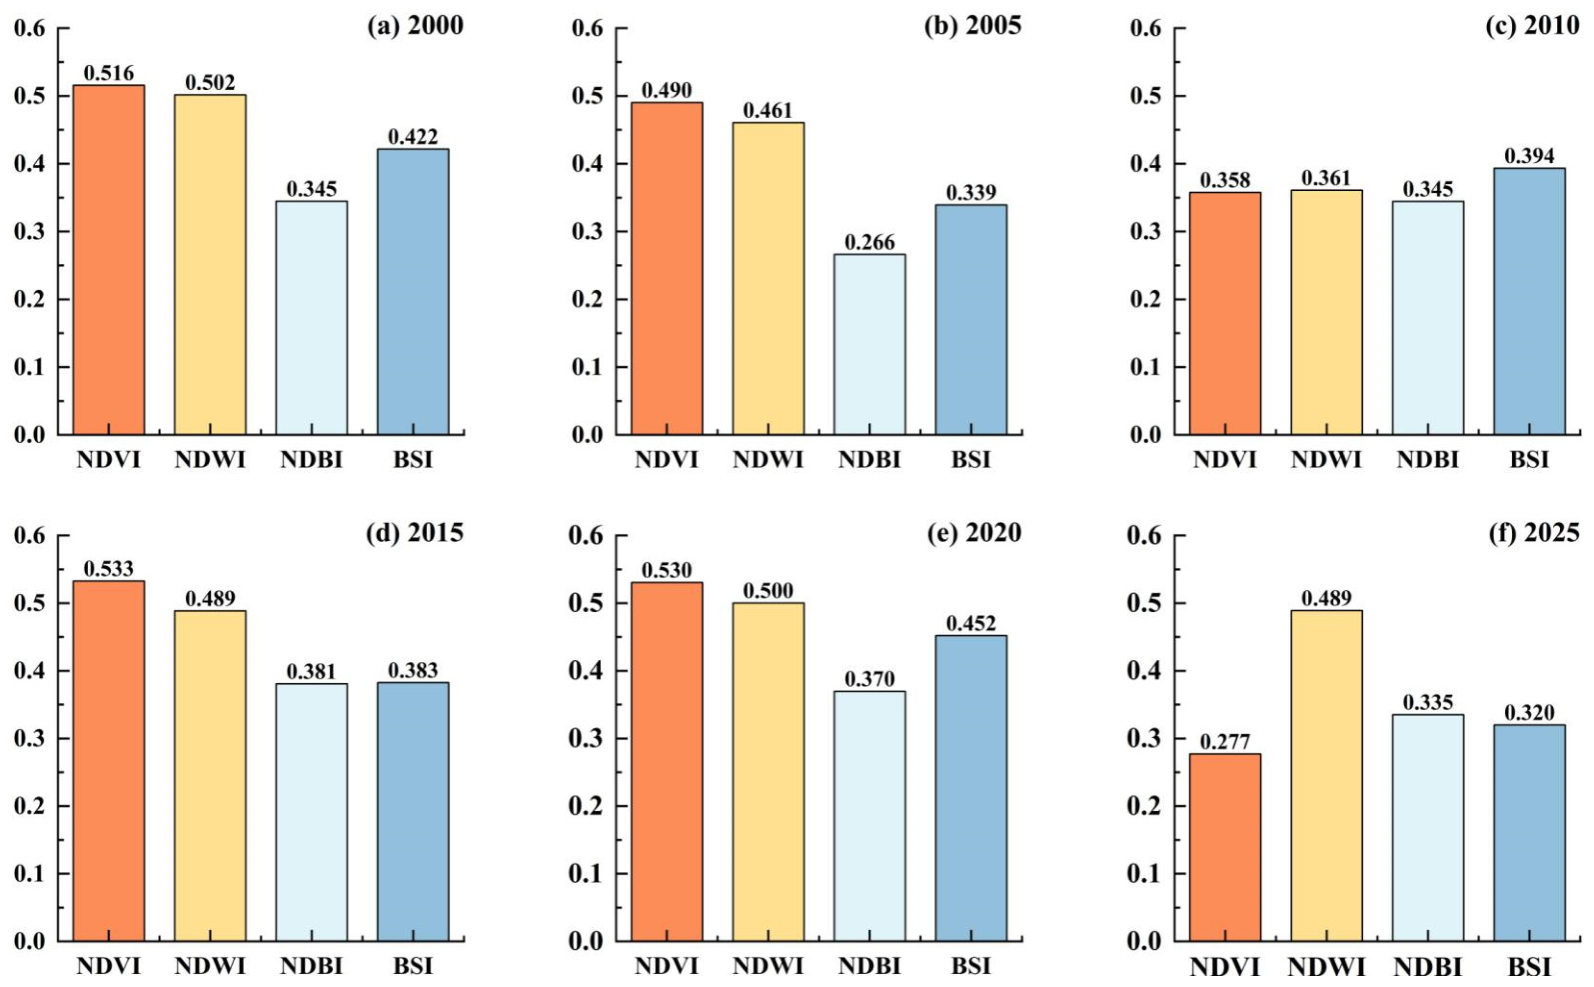
Land use type served as the core carrier regulating ecosystem service functions, but it was not the sole determining factor. As a multi-process coupled integrated response, the spatial pattern of ecosystem services was not only controlled by land use structure, but also jointly influenced by vegetation growth conditions, moisture availability, surface wetness–dryness status, and anthropogenic disturbance intensity. In this study, NDVI, NDWI, NDBI, and BSI were selected as driving factors to represent vegetation condition, surface moisture, built-up intensity, and bare soil exposure, respectively, thereby characterizing the integrated influence mechanism of natural processes and human activities on ecosystem service dynamics from an eco-process perspective. During 2000–2025, the explanatory power of different driving factors in Hainan Island showed clear variability. NDVI and NDWI generally exhibited higher explanatory power than NDBI throughout most study periods, although the factor with the highest q-value varied among years. Overall, vegetation and moisture-related indicators maintained relatively strong explanatory ability, indicating that ecological conditions played an important role in shaping the spatial differentiation of ecosystem services. Notably, NDVI showed a marked decline in 2025, suggesting that the explanatory contribution of vegetation conditions decreased relative to other factors under intensified land use change, and the control mechanism of ecosystem services gradually shifted toward a multi-factor co-driven regime. In contrast, NDBI exhibited relatively lower explanatory power (approximately 0.3) but remained stable over time, indicating that urban expansion exerted a persistent but non-dominant influence on ecosystem services. Although urbanization progressed rapidly in coastal regions, forest still dominated at the island scale, thereby maintaining the relatively strong influence of vegetation-related factors at the island scale. BSI, which reflects bare land and low-coverage surfaces, showed intermediate explanatory power between NDVI and NDBI, suggesting that land disturbance and ecological degradation processes had localized but not system-wide control effects, primarily concentrated in cropland expansion zones and urban fringe areas (Figure 10).
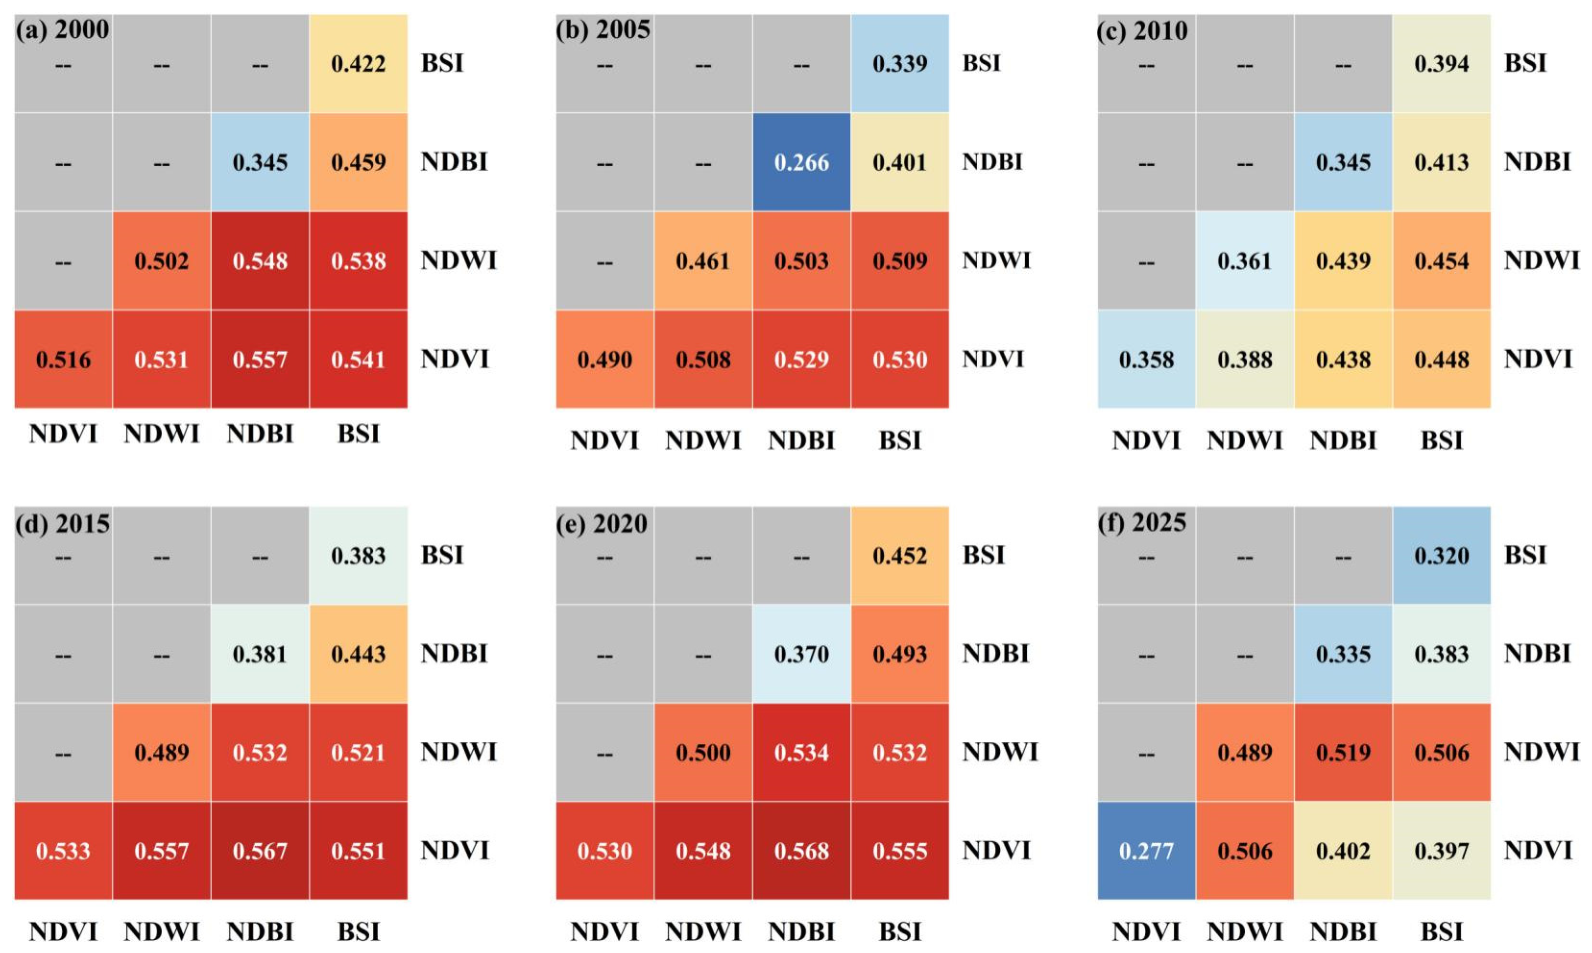
Based on single-factor analysis, interaction detection further revealed nonlinear coupling relationships among driving factors. All factor interactions were significantly stronger than individual effects, and were mainly characterized by “two-factor enhancement”, indicating that ecosystem service formation was not driven by a single factor but resulted from synergistic multi-factor interactions. Specifically, the interactions between NDVI and NDBI, as well as NDVI and BSI, exhibited the strongest explanatory power, both reaching approximately 0.5, substantially higher than single-factor effects. NDVI represents vegetation condition, whereas NDBI and BSI reflect built-up expansion and bare land exposure, respectively; their interactions essentially capture the dynamic trade-off between ecological land and anthropogenic land use. In contrast, the interaction between NDBI and BSI was relatively weaker (around 0.4), indicating partial redundancy in information representation, as both variables primarily reflect anthropogenic disturbance or low ecological quality, and their combination did not significantly enhance explanatory power. This further suggested that human activity indicators alone were insufficient to explain spatial heterogeneity in ecosystem services, and must be combined with natural ecological factors such as vegetation to achieve effective interpretation. From a temporal evolution perspective, changes in interaction strength also reflected the land use transition process in Hainan Island. In the early period, forest dominated and NDVI played a primary controlling role. With cropland expansion and urban development, the influence of NDBI and BSI gradually increased, making interaction effects a key pathway for explaining ecosystem service variation. In the later period (particularly by 2025), although the single-factor explanatory power of NDVI declined, its interaction with other factors remained relatively strong, indicating that the driving mechanism of ecosystem services was shifting from a “single-dominant control” pattern toward a “multi-factor coupled system” framework (Figure 11).

4. Discussion

4.1. Impacts of Land Use on Ecosystem Service Functions

Land use types served as the fundamental carriers of ecosystem service functions, and their spatial configuration directly influenced not only the magnitude of ecosystem service supply but also the interactions among different services [52]. Forest played an important role in maintaining habitat quality, carbon storage, and soil conservation because they simultaneously regulated multiple ecological processes, including habitat connectivity, biomass accumulation, and soil stabilization. Forests functioned not merely as providers of individual ecosystem services but as ecological infrastructure supporting the overall stability and resilience of regional ecosystems. In contrast, cropland and impervious surfaces contributed to a narrower range of ecosystem services. Although cropland supported food production and maintained certain ecosystem services, its expansion often occurred at the expense of regulating services. Impervious surfaces increased local water yield by reducing infiltration and evapotranspiration, yet they disrupted ecological connectivity, reduced carbon sequestration capacity, and intensified habitat fragmentation. Consequently, the ecological consequences of land use conversion depended not only on the amount of land transformed but also on the ecological functionality of the resulting land use type [53]. Similar concerns have been reported in other tropical regions. Recent studies in Indonesia have shown that deforestation remains one of the primary drivers of biodiversity decline and ecosystem degradation, while emphasizing that policy instruments alone may not fully compensate for ecological losses once critical habitats are converted [54]. In addition, ecosystem management should not rely solely on maximizing the MEESI value as the only optimization objective. Ecosystem services were characterized by complex synergies and trade-offs, and the ecological importance of a land use type could not be fully represented by a single composite indicator. For example, water bodies played a critical role in maintaining hydrology despite their relatively low composite index values, whereas impervious surfaces might contribute positively to specific services such as water yield while exerting overall negative impacts on ecosystem integrity. This pattern should not be interpreted as evidence that impervious surfaces provide superior ecosystem functions. Rather, it reflects the fact that ecosystem services contribute to the MEESI according to their statistical variability under the entropy weighting. Therefore, future land use optimization should be guided by a “functional complementarity” perspective that recognizes the diverse ecological functions of different land use types. Establishing a coordinated ecological land allocation system that balances ecological conservation, agricultural production, and urban development will be essential for achieving long-term improvements in ecosystem service provision.
From a future scenario perspective, the contrasting ecosystem services under different development pathways highlighted the critical role of land use planning in determining long-term ecological sustainability. The differences in scenarios did not simply reflect variations in land use quantity. More importantly, they revealed relationships between economic development and ecosystem protection. Under the SSP1-1.9 scenario, sustainable development strategies helped preserve landscape connectivity, and support ecological restoration. Therefore, the synergies among habitat quality, carbon storage, and soil conservation could be maintained, thereby enhancing resilience. The stable ecosystem services under this scenario implied that ecological conservation and socio-economic development were not necessarily contradictory objectives, provided that effective land use planning was implemented. Under the SSP5-8.5 scenario, the ecological deterioration reflected the cumulative effects of high-intensity development on ecosystem function. Although some services, particularly water yield, might experience localized improvements, these gains were insufficient to offset the losses associated with declining habitat quality, carbon storage, and ecological stability. This finding suggested that ecosystem responses to land use change were highly nonlinear. Once ecological land decreased beyond a certain threshold, multiple ecosystem services deteriorated, resulting in amplified ecological risks and reduced ecosystem resilience. Such threshold-like responses were important for island ecosystems such as Hainan, where ecological space was limited and the capacity to absorb environmental disturbances was constrained. From a driving mechanism perspective, NDVI consistently exhibited the strongest explanatory power among all factors, indicating that vegetation cover was the core determinant of ecosystem services. Vegetation had information related to ecosystem productivity, ecological health, and restoration status, making it a direct indicator of the ecological processes underlying ecosystem service generation. Therefore, maintaining high-quality vegetation might be as important as controlling land use conversion for sustaining ecosystem services. Furthermore, the strong interactions between NDVI and both NDBI and BSI indicated that ecosystem services were shaped by the balance between ecological land and human-modified land. Human disturbance alone could not fully explain ecosystem service heterogeneity, but ecosystem outcomes emerged from the coupled interactions between natural ecological processes and anthropogenic activities. This finding suggested that reducing impervious surface expansion alone was unlikely to completely mitigate ecosystem degradation. Greater emphasis should be placed on improving vegetation quality, strengthening ecological connectivity, and enhancing the functional integrity of ecological land. From a management perspective, these findings provide important implications for the ongoing development of the Hainan Free Trade Port. Future land use planning should adopt an “ecology-first and spatial zoning control” framework that balances economic development with ecological conservation. The central mountainous region should continue to serve as a core ecological protection zone, with strict restrictions on activities that may compromise forest integrity and ecological functions. Meanwhile, coastal development areas should integrate ecological considerations into urban planning through the construction of ecological corridors, urban green infrastructure, and multifunctional ecological spaces. In this context, the SSP1-1.9 scenario can be regarded as a desirable development pathway that promotes the coordination of ecological protection and socio-economic expansion, whereas the SSP5-8.5 scenario serves as a warning of the ecological risks associated with uncontrolled land use expansion. Therefore, long-term sustainability in Hainan Island will depend on whether future development strategies can effectively reconcile economic growth with the maintenance of ecosystem integrity and resilience.

4.2. Limitations and Future Perspectives

This study systematically analyzed the spatiotemporal evolution of land use change and ecosystem service functions in Hainan Island through the integrated application of the Markov-PLUS, InVEST, and GeoDetector models. Several uncertainties and limitations remain. At the data level, datasets with different original spatial resolutions were standardized to 100 m. For habitat quality, resampling might slightly modify the boundaries between ecological land and threat sources, thereby affecting estimates near transition zones. For water yield and soil conservation, some input parameters were available at coarser resolutions (500 m or 1000 m), and resampling to 100 m did not generate additional errors but might smooth variability. In land use simulation, although the Markov-PLUS model can effectively reproduce land use dynamics, its internal reliance on machine learning algorithms such as random forests introduces stochastic uncertainty in estimating land expansion probabilities [55]. Moreover, the model is sensitive to parameter settings, including transition matrices, neighborhood weights, and development probabilities. Scenario construction inevitably involves a degree of subjectivity, and different parameter configurations may lead to variations in simulation outcomes. In ecosystem service assessment, most biophysical parameters required by the InVEST model, such as carbon density, vegetation coefficients, soil erodibility, and root restriction depth, were derived from the existing literature or global databases [56]. These parameters are typically treated as static values and do not fully capture temporal variability, and the lack of systematic field observations limits the accuracy and local representativeness of the results. In the driving mechanism analysis, although the GeoDetector model effectively identified key factors influencing spatial heterogeneity of ecosystem services, the absence of future projections of driving variables prevented the coupling of driving mechanisms with future scenario simulations. As a result, only historical driving patterns were analyzed, without fully integrating dynamic future responses. Furthermore, although uncertainty methods such as error propagation assessment, confidence interval estimation, and model sensitivity analysis could provide additional insights, these methods required probabilistic or ensemble-based simulations. The integrated Markov-PLUS, InVEST, and GeoDetector framework primarily generated deterministic outputs and therefore did not directly support such analyses. Consequently, uncertainty was addressed through multi-scenario simulations and model validation rather than through probabilistic uncertainty quantification.
Future study should solve these limitations in several ways. First, higher-resolution remote sensing data and multi-source data fusion techniques should be employed to improve land use classification accuracy and temporal consistency. Second, multi-model ensembles or policy-constrained scenarios could be introduced to reduce uncertainties associated with single-model simulations. Third, long-term field observations should be strengthened to establish dynamic databases of key biophysical parameters such as carbon density, vegetation characteristics, and soil erosion factors, thereby improving the regional applicability of the InVEST model. Finally, coupling climate model outputs with driving factor projections could enable a fully dynamic framework linking ecosystem service responses with future land use and environmental change scenarios.

5. Conclusions

This study integrated the Markov–PLUS, InVEST, and GeoDetector models and utilized multi-temporal land use data from 2000 to 2025 to systematically assess the spatiotemporal dynamics of habitat quality, carbon storage, water yield, and soil conservation in Hainan Island. A MEESI was constructed, and future changes in ecosystem services under historical trend, SSP1-1.9, and SSP5-8.5 scenarios for 2050 were projected, thereby revealing the spatial relationships and response patterns between land use change and ecosystem service functions. The main conclusions are as follows:
(1) From 2000 to 2050, land use types in Hainan Island underwent significant transformations, characterized primarily by the conversion of forest into cropland and impervious surfaces. As the dominant land use type, forest area continuously declined, while cropland and impervious surfaces expanded to varying degrees. Under future scenarios, the SSP1-1.9 scenario effectively constrained forest loss and promoted ecological land restoration, whereas the SSP5-8.5 scenario, driven by economic growth priorities, increased cropland and built-up land, indicating that different pathways (ecological and economy) may substantially influence regional landscape patterns.
(2) Habitat quality and carbon storage exhibited overall declining trends, whereas water yield and soil conservation showed increasing tendencies. Forest loss led to reductions in habitat quality and carbon storage, while the expansion of cropland and impervious surfaces enhanced water yield but weakened overall ecosystem stability. The MEESI displayed a fluctuating yet declining trajectory, with a clear spatial pattern characterized by “high values in the central region and low values in coastal areas”. Specifically, forest-dominated mountainous regions in central Hainan exhibited higher overall ecosystem service capacity, whereas coastal urban and agricultural development zones showed relatively lower levels.
(3) Scenario analysis indicated that the SSP1-1.9 scenario was associated with relatively higher ecosystem service levels compared with the historical trend and SSP5-8.5 scenarios. NDVI and NDWI generally exhibited stronger explanatory power for ecosystem service variation, while NDBI and BSI showed important interactive effects with ecological indicators. The identified relationships should be interpreted as explanatory associations rather than direct causal mechanisms of ecosystem processes. Therefore, land use optimization should not rely on the conversion of a single land use type to enhance individual ecosystem services. Instead, it is essential to consider trade-offs among multiple services and avoid achieving localized functional gains at the expense of critical ecological land.

Author Contributions

Conceptualization, Jing Chen, Xiaodong Huang and Ying Wang; methodology, Jing Chen, Xiaodong Huang and Ying Wang; software, Jing Chen and Xiaodong Huang; validation, Ying Wang, Zhixuan Chen and Xiangning Feng; formal analysis, Xiaodong Huang; investigation, Jing Chen and Xiaodong Huang; resources, Xiaodong Huang and Ying Wang; data curation, Jing Chen, Xiaodong Huang, Zhixuan Chen and Xiangning Feng; writing—original draft preparation, Jing Chen; writing—review and editing, Jing Chen, Xiaodong Huang and Ying Wang; visualization, Jing Chen, Zhixuan Chen and Xiangning Feng; supervision, Xiaodong Huang and Ying Wang; project administration, Xiaodong Huang; funding acquisition, Jing Chen, Xiaodong Huang and Ying Wang. All authors have read and agreed to the published version of the manuscript.

Funding

This study was funded by the National Natural Science Foundation of China (42271112), the R&D Program of Beijing Municipal Education Commission (KM202011417013), the 2026 Educational Teaching Research and Reform Project of Beijing Union University (JJ2026Y004), and the Science and Technology Innovation Project for College Students at Beijing Union University (180151).

Data Availability Statement

Publicly available datasets were analyzed in this study. These data sources and access links were indicated in the text.

Acknowledgments

We thank the China Land Cover Dataset, the Resource and Environment Science and Data Center of the Chinese Academy of Sciences, the Chinese meteorological station, the Google Earth Engine, and the OpenStreetMap websites for providing the free data.

Conflicts of Interest

The authors declare no conflicts of interest.

Abbreviations

The following abbreviations are used in this manuscript:
PLUSPatch-generating Land Use Simulation
InVESTIntegrated Valuation of Ecosystem Services and Tradeoffs
MEESIMulti-weighted Entropy Ecosystem Service Index
NDVINormalized Difference Vegetation Index
NDWINormalized Difference Water Index
NDBINormalized Difference Built-up Index
BSIBare Soil Index
DEMDigital Elevation Model
GDPGross Domestic Product
CLCropland
FTForest
GLGrassland
WBWater bodies
ISImpervious surfaces

References

  1. Forster, P.M.; Smith, C.; Walsh, T.; Lamb, W.F.; Lamboll, R.; Cassou, C.; Hauser, M.; Hausfather, Z.; Lee, J.-Y.; Palmer, M.D.; et al. Indicators of Global Climate Change 2024: Annual Update of Key Indicators of the State of the Climate System and Human Influence. Earth Syst. Sci. Data 2025, 17, 2641–2680. [Google Scholar] [CrossRef]
  2. Ohlert, T.; Smith, M.D.; Collins, S.L.; Knapp, A.K.; Dukes, J.S.; Sala, O.; Wilkins, K.D.; Munson, S.M.; Anderson, M.I.; Avolio, M.L.; et al. Drought Intensity and Duration Interact to Magnify Losses in Primary Productivity. Science 2025, 390, 284–289. [Google Scholar] [CrossRef] [PubMed]
  3. Yang, D.; Liu, Y. Human Activities Unevenly Disturbed Climatic Impacts on Vegetation Dynamics across Natural-Anthropogenic-Integrated Ecosystem Types in China. Habitat. Int. 2025, 162, 103451. [Google Scholar] [CrossRef]
  4. Chigbu, U.E. Connecting Land Tenure to Climate Change. Land Use Policy 2025, 155, 107587. [Google Scholar] [CrossRef]
  5. Dem, P.; Hayashi, K.; Fujii, M.; Mohmmed, E.E.E. Integrating Biodiversity and Ecosystem Services in Land Use Change Assessment through Sustainability Indicator. Environ. Impact Assess. Rev. 2025, 114, 107971. [Google Scholar] [CrossRef]
  6. Fartyal, A.; Bargali, S.S.; Bargali, K.; Negi, B. Changes in Soil Properties, Organic Carbon, and Nutrient Stocks After Land-Use Change from Forests to Grasslands in Kumaun Himalaya, India. Land Degrad. Dev. 2025, 36, 2438–2457. [Google Scholar] [CrossRef]
  7. Xia, P.; Zheng, H.; Hu, T.; Xu, Z.; Peng, J. Linking Perceptions of Ecological Restoration Projects’ Impacts on Ecosystem Services and Human Well-Being for Achieving Regional Sustainability. Appl. Geogr. 2025, 178, 103570. [Google Scholar] [CrossRef]
  8. Qu, J.; Xu, Z.; Dong, B.; Wang, H.; Han, Y. Analyzing Trade-Offs, Synergies, and Driving Factors of Ecosystem Services in Anhui Province Using Spatial Analysis and XG-Boost Modeling. Ecol. Indic. 2025, 171, 113098. [Google Scholar] [CrossRef]
  9. Zhang, J.; Wang, M.; Liu, K.; Chen, S.; Zhao, Z. Social-Ecological System Sustainability in China from the Perspective of Supply-Demand Balance for Ecosystem Services. J. Clean. Prod. 2025, 497, 145039. [Google Scholar] [CrossRef]
  10. Shmelev, S.E.; Agbleze, L.; Spangenberg, J.H. Multidimensional Ecosystem Mapping: Towards a More Comprehensive Spatial Assessment of Nature’s Contributions to People in France. Sustainability 2023, 15, 7557. [Google Scholar] [CrossRef]
  11. Dang, L.; Zhao, F.; Teng, Y.; Teng, J.; Zhan, J.; Zhang, F.; Liu, W.; Wang, L. Scale Dependency of Trade-Offs/Synergies Analysis of Ecosystem Services Based on Bayesian Belief Networks: A Case of the Yellow River Basin. J. Environ. Manag. 2025, 375, 124410. [Google Scholar] [CrossRef] [PubMed]
  12. Cao, H.; Zhu, Q.; Bai, H.; He, H.; Liu, C. Analysis of Coupled Coordination and Driving Factors of Urbanization, Ecosystem Services, and Human Well-Being in the High and Coarse Sediment Yield in the Middle Yellow River. Land 2025, 14, 100. [Google Scholar] [CrossRef]
  13. Chidodo, S.; Zhang, L.; Zarei, A.; Feger, K.-H. Remote Sensing-Based Assessment of Four Decades of Land Use/Land Cover Change in the Sigi River Watershed, East Usambara Mountains, Tanzania. Front. Remote Sens. 2025, 6, 1594331. [Google Scholar] [CrossRef]
  14. Aghaloo, K.; Sharifi, A. Balancing Priorities for a Sustainable Future in Cities: Land Use Change and Urban Ecosystem Service Dynamics. J. Environ. Manag. 2025, 382, 125460. [Google Scholar] [CrossRef] [PubMed]
  15. Eckert, S.; Thanasack, P.; Hett, C.; Zaehringer, J.G. Understanding Spatial Patterns of Ecosystem Service Supply and Demand in Savannakhet Province, Laos. Ecosyst. Serv. 2025, 75, 101769. [Google Scholar] [CrossRef]
  16. Karimi, H.; Staudhammer, C.L.; Therrell, M.D.; Kleindl, W.J.; Mungai, L.M.; Amanambu, A.C.; Jones, C.N. Mapping Tradeoffs and Synergies in Ecosystem Services as a Function of Forest Management. Land 2025, 14, 1591. [Google Scholar] [CrossRef]
  17. Wu, Q.; Cao, Y.; Su, D.; Cao, Y. A Multi-Scale Framework for Understanding Spatial Scale Effects on Ecosystem Service Heterogeneity, Interactions, Drivers and Their Socio-Ecological Impact Pathways for Adaptive Management. J. Clean. Prod. 2025, 516, 145757. [Google Scholar] [CrossRef]
  18. Mumtaz, F.; Li, J.; Liu, Q.; Dong, Y.; Liu, C.; Gu, C.; Zhang, H.; Zhao, J.; Akhtar, M.; Bashir, B.; et al. A Comprehensive Framework for Evaluating Ecosystem Quality Changes and Human Activity Contributions in Inner Mongolia and Xinjiang, China. Land Use Policy 2025, 151, 107494. [Google Scholar] [CrossRef]
  19. Zhou, J.; Yang, J.; Tang, Z.; Xue, L.; Zhang, W.; Zhang, J. Driving Mechanisms of Ecosystem Services and Their Trade-Offs and Synergies in the Transition Zone between the Qinghai-Tibet Plateau and the Loess Plateau. Ecol. Indic. 2025, 171, 113148. [Google Scholar] [CrossRef]
  20. Li, Y.; Zheng, L.; Cui, H.; Wu, D.; Wang, Y. Climate and Human Activities Shaping Carbon-Water-Food Interactions: Implications for Governance in the Yangtze River Basin and Its Sub-Basins, China. J. Environ. Manag. 2025, 377, 124582. [Google Scholar] [CrossRef] [PubMed]
  21. Lei, J.; Zhang, L.; Chen, Z.; Wu, T.; Chen, X.; Li, Y. The Impact of Land Use Change on Carbon Storage and Multi-Scenario Prediction in Hainan Island Using InVEST and CA-Markov Models. Front. For. Glob. Change 2024, 7, 1349057. [Google Scholar] [CrossRef]
  22. Lai, J.; Qi, S.; Chen, J.; Guo, J.; Wu, H.; Chen, Y. Exploring the Spatiotemporal Variation of Carbon Storage on Hainan Island and Its Driving Factors: Insights from InVEST, FLUS Models, and Machine Learning. Ecol. Indic. 2025, 172, 113236. [Google Scholar] [CrossRef]
  23. Ren, B.; Xiao, Y.; Liu, B.; Geng, J.; Wu, W.; Qin, D. Exploring the Transmission Process of Carbon Sequestration Services and Its Applications: A Case Study of Hainan. Forests 2025, 16, 136. [Google Scholar] [CrossRef]
  24. Yang, L.; Peng, Y.; Zhu, G.; Yue, F.; Zhao, X.; Fu, J. The Landscape Pattern Evolution and Ecological Security Pattern Construction Under the Interference of Transportation Network in National Park. Forests 2025, 16, 1393. [Google Scholar] [CrossRef]
  25. Liu, J.; Hou, Y.; Li, F.; Zheng, B.; Chen, Z.; Zheng, F.; Zhang, X.; Yu, R. Land Use Change Projection and Driving Factors Exploration in Hainan Island Based on the PLUS Model. Front. Mar. Sci. 2025, 12, 1534508. [Google Scholar] [CrossRef]
  26. Wang, L. A Comparative Analysis of Protected Area Expansion Strategies for Biodiversity and Ecosystem Services: A Case Study of Hainan Island. Front. Ecol. Evol. 2025, 12, 1483133. [Google Scholar] [CrossRef]
  27. Shi, X.; Wu, L.; Zheng, Y.; Zhang, X.; Wang, Y.; Chen, Q.; Sun, Z.; Nie, T. Dynamic Estimation of Mangrove Carbon Storage in Hainan Island Based on the InVEST-PLUS Model. Forests 2024, 15, 750. [Google Scholar] [CrossRef]
  28. Wei, L.; Mao, M.; Zhao, Y.; Wu, G.; Wang, H.; Li, M.; Liu, T.; Wei, Y.; Huang, S.; Huang, L.; et al. Spatio-Temporal Characteristics and Multi-Scenario Simulation Analysis of Ecosystem Service Value in Coastal Wetland: A Case Study of the Coastal Zone of Hainan Island, China. J. Environ. Manag. 2024, 368, 122199. [Google Scholar] [CrossRef] [PubMed]
  29. Fang, Y.; Liu, Y.; Wang, Y.; Cao, Y.; Cheng, Y. Spatiotemporal Heterogeneity Analysis of Net Primary Productivity in Nanjing’s Urban Green Spaces Based on the DLCC–NPP Model: A Long-Term and Multi-Scenario Approach. ISPRS Int. J. Geo-Inf. 2026, 15, 38. [Google Scholar] [CrossRef]
  30. Ma, L.; Xiao, J.; Teng, G.; Zhang, T.; Chen, L. An Integrated Model Based on CNN-Transformer and PLUS for Urban Expansion Simulation in the Yangtze River Delta, China. Remote Sens. 2026, 18, 1071. [Google Scholar] [CrossRef]
  31. Wu, X.; Li, M.; Chen, Z.; Li, Q.; Feng, H. An Explainable Machine Learning Framework Coupled with the PLUS Model for Ecological Resilience Simulation and Zoning under SSP-RCP Scenarios: A Case Study in Eastern Jilin, China. Environ. Model. Softw. 2026, 200, 106952. [Google Scholar] [CrossRef]
  32. Zhu, Y.; Zhu, Y.; Liang, X. Integrating Land Use Dynamics and Human Health Risk: A Multi-Scale Assessment of Future Urban Heat Exposure Using PLUS and Explainable AI. J. Environ. Manag. 2026, 398, 128586. [Google Scholar] [CrossRef] [PubMed]
  33. Umwali, E.D.; Isabwe, A.; Kayitesi, N.M.; Chen, X. Bi-Decadal Changes in Selected Ecosystem Services and Their Integrated Drivers in East Africa. Glob. Environ. Change 2026, 97, 103115. [Google Scholar] [CrossRef]
  34. Manna, H.; Pramanik, M.; Pal, R.; Sarkar, S.; Zhran, M.; Halder, B. Land Use Land Cover Change and Habitat Quality Degradation in the Tropical Megacity of Bangkok: An Integrated CA–Markov and InVEST Modeling Approach (1995–2045). Environ. Sustain. Indic. 2025, 28, 101036. [Google Scholar] [CrossRef]
  35. Miao, J.; Xia, H.; Li, F.; Yang, J. Analysis of the Spatio-Temporal Evolution Characteristics and Influencing Factors of Habitat Quality in Hubei Province over the Past Three Decades. ISPRS Int. J. Geo-Inf. 2025, 14, 98. [Google Scholar] [CrossRef]
  36. Mohammadyari, F.; Abdollahi, K.; Tavakoli, M. Enhancing Ecosystem Services and Climate Resilience through Urban Forestry in Dehloran Region, Iran. J. Urban Manag. 2026, 15, 297–310. [Google Scholar] [CrossRef]
  37. Moyano, N.; Duque, F.; Sanchez, K. Impacts of Land Use Change and Climate-Forcing Scenarios on Carbon Storage Dynamics in the Farallones de Cali National Natural Park. Environ. Sustain. Indic. 2026, 29, 101108. [Google Scholar] [CrossRef]
  38. Zhang, L.; Lei, J.; Chen, Z.; Zhou, P.; Wu, T.; Chen, X.; Li, Y.; Pan, X. Spatiotemporal Differentiation and Trade-Offs and Synergies of Ecosystem Services in Tropical Island Basins: A Case Study of Three Major Basins of Hainan Island. J. Clean. Prod. 2025, 490, 144798. [Google Scholar] [CrossRef]
  39. Akbar, A.; Samat, A.; Abuduwaili, J.; Wang, L.; Du, P.; Shokparova, D.; Saparov, G.; Bissenbayeva, S. Unveiling Kazakhstan’s Ecosystem Service Puzzle: Spatiotemporal Shifts and Drivers of Supply and Demand through Multi-Model Integration and Machine Learning Methods. Ecol. Indic. 2026, 182, 114569. [Google Scholar] [CrossRef]
  40. Wang, Z.; Wang, R.; Luo, K.; Liang, S.; Xie, M. Machine Learning Insights into Supply–Demand Mismatch, Interactions and Driving Mechanisms of Ecosystem Services Across Scales: A Case Study of Xingtai, China. ISPRS Int. J. Geo-Inf. 2025, 14, 452. [Google Scholar] [CrossRef]
  41. Chiaka, J.C.; Yang, Q.; Zhao, Y.; Agostinho, F.; Almeida, C.M.V.B.; Giannetti, B.F.; Li, H.; Wu, M.; Liu, G. Assessment of Water-Related Ecosystem Services and Beneficiaries in the Hainan Tropical Rainforest National Park. Land 2024, 13, 1804. [Google Scholar] [CrossRef]
  42. Gadisa, D.A.; Aneseyee, A.B.; Ogo, H.A.; Olana, H.E.; Huang, J.; Yu, S.; Sun, J.; Yan, X. Soil Erosion and Sediment Export under Rainfed Agriculture Dominated Landscapes: Model-Based Evidence from the Didessa Watershed, Southwestern Ethiopia. Environ. Sustain. Indic. 2026, 30, 101200. [Google Scholar] [CrossRef]
  43. Yadav, R.; Pandey, S.; Chand, T.; Nautiyal, R. A Scenario-Based Approach to Valuation of the Erosion Prevention Service in the Himalayan Region. Ecosyst. Serv. 2026, 77, 101810. [Google Scholar] [CrossRef]
  44. Du, R.; Liu, B.; Chen, Z.; Xu, M. Exploring the Multiscale Island Terrestrial Ecosystem Service Relationships and Coastal Vulnerability under the Influence of Coastal Ecosystems. Ocean Coast. Manag. 2024, 256, 107267. [Google Scholar] [CrossRef]
  45. Lin, Z.; He, Z.; Ye, C.; Li, Y.; Liu, H.; Ding, S.; Qiao, X.; Xiong, J.; Huang, J.; Hu, X.; et al. Spatiotemporal Evolution of Trade-off/Synergy Relationships and Bundles in Ecosystem Services in Fujian, China: An Integrated PLUS-InVEST-SOM Framework. J. Clean. Prod. 2026, 550, 147925. [Google Scholar] [CrossRef]
  46. Shen, J.; Zhao, M.; Tang, X.; Wu, C. Ecological Restoration Zoning and Strategy Based on Ecosystem Service Supply and Demand Relationships: A Case Study of the Yellow River Basin. J. Nat. Conserv. 2025, 84, 126837. [Google Scholar] [CrossRef]
  47. Tang, Z.; Jia, Y.; Lu, Z.; Duan, W.; He, Y.; Lei, G.; Fang, L.; Li, W.; Wu, Y.; Wang, T.; et al. Thresholds of Ecosystem Service Trade-Offs and Synergies at Different Spatio-Temporal Scales in Hilly Region of Southern China. Environ. Sustain. Indic. 2026, 30, 101131. [Google Scholar] [CrossRef]
  48. Guo, Y.; Cheng, L.; Ding, A.; Yuan, Y.; Li, Z.; Hou, Y.; Ren, L.; Zhang, S. Geodetector Model-Based Quantitative Analysis of Vegetation Change Characteristics and Driving Forces: A Case Study in the Yongding River Basin in China. Int. J. Appl. Earth Obs. Geoinf. 2024, 132, 104027. [Google Scholar] [CrossRef]
  49. Li, W.; Chen, X.; Zheng, J.; Zhang, F.; Yan, Y.; Hai, W.; Yang, J.; Han, C.; Liu, L. Effectiveness and Driving Mechanisms of Ecological Conservation and Restoration in Sichuan Province, China. Ecol. Indic. 2025, 172, 113238. [Google Scholar] [CrossRef]
  50. Chen, W.; Duan, B.; Bian, J.; Zeng, J. Decoding the Formation Mechanisms of Rural Settlements Expansion Patterns in Transitional China. Land Use Policy 2025, 154, 107561. [Google Scholar] [CrossRef]
  51. Dong, F.; Qin, F.; Zhang, T.; Dong, X.; Wu, Y.; Guo, Z. kNDVI Reveals Vegetation Dynamics and Hydro–Edaphic Controls in Inner Mongolia (2000–2024). Sci. Rep. 2026, 16, 5244. [Google Scholar] [CrossRef] [PubMed]
  52. Ji, P.; Su, R.; Wu, G.; Xue, L.; Zhang, Z.; Fang, H.; Gao, R.; Zhang, W.; Zhang, D. Projecting Future Wetland Dynamics Under Climate Change and Land Use Pressure: A Machine Learning Approach Using Remote Sensing and Markov Chain Modeling. Remote Sens. 2025, 17, 1089. [Google Scholar] [CrossRef]
  53. An, Z.; Sun, C.; Hao, S. Exploration of Ecological Compensation Standard: Based on Ecosystem Service Flow Path. Appl. Geogr. 2025, 178, 103588. [Google Scholar] [CrossRef]
  54. Shmelev, S.E. Biodiversity Offset Schemes for Indonesia: Pro et Contra. Sustainability 2025, 17, 6283. [Google Scholar] [CrossRef]
  55. Zhang, Y.; Liao, X.; Sun, D. A Coupled InVEST-PLUS Model for the Spatiotemporal Evolution of Ecosystem Carbon Storage and Multi-Scenario Prediction Analysis. Land 2024, 13, 509. [Google Scholar] [CrossRef]
  56. Sun, A.; Xia, X.; Wang, Y.; Zhang, H.; Zheng, X. Altitudinal Gradient and Influencing Factors of Carbon Storage in the Gonghe Basin of the Qinghai–Tibet Plateau. ISPRS Int. J. Geo-Inf. 2026, 15, 48. [Google Scholar] [CrossRef]
Figure 1. (a) Geographical location of Hainan Island.(b) Remote sensing image. (c) Road, railway, and waterway. (d) DEM. (e) Population density. (f) GDP. (g) Nighttime light. (h) Slope. (i) Annual total precipitation. (j) Mean annual temperature. (k) Distance to roads. (l) Distance to railways. (m) Distance to waterways.
Ijgi 15 00291 g001
Figure 2. Research framework for ecosystem service analysis.
Ijgi 15 00291 g002
Figure 3. Land use types of Hainan Island from 2000 to 2050. (a) 2000; (b) 2005; (c) 2010; (d) 2015; (e) 2020; (f) 2025; (g) 2050 historical trend; (h) 2050 SSP1-1.9; (i) 2050 SSP5-8.5.
Ijgi 15 00291 g003
Figure 4. Contributions and changes in land use types from 2000 to 2050. (a) Contribution of variables. (b) Changes from 2000 to 2050 in historical trend. (c) Changes from 2000 to 2050 in SSP1-1.9. (d) Changes from 2000 to 2050 in SSP5-8.5.
Ijgi 15 00291 g004
Figure 5. Habitat quality of Hainan Island from 2000 to 2050. (a) 2000; (b) 2005; (c) 2010; (d) 2015; (e) 2020; (f) 2025; (g) 2050 historical trend; (h) 2050 SSP1-1.9; (i) 2050 SSP5-8.5.
Ijgi 15 00291 g005
Figure 6. Carbon storage of Hainan Island from 2000 to 2050. (a) 2000; (b) 2005; (c) 2010; (d) 2015; (e) 2020; (f) 2025; (g) 2050 historical trend; (h) 2050 SSP1-1.9; (i) 2050 SSP5-8.5.
Ijgi 15 00291 g006
Figure 7. Water yield of Hainan Island from 2000 to 2050. (a) 2000; (b) 2005; (c) 2010; (d) 2015; (e) 2020; (f) 2025; (g) 2050 historical trend; (h) 2050 SSP1-1.9; (i) 2050 SSP5-8.5.
Ijgi 15 00291 g007
Figure 8. Soil conservation of Hainan Island from 2000 to 2050. (a) 2000; (b) 2005; (c) 2010; (d) 2015; (e) 2020; (f) 2025; (g) 2050 historical trend; (h) 2050 SSP1-1.9; (i) 2050 SSP5-8.5.
Ijgi 15 00291 g008
Figure 9. MEESI of Hainan Island from 2000 to 2050. (a) 2000; (b) 2005; (c) 2010; (d) 2015; (e) 2020; (f) 2025; (g) 2050 historical trend; (h) 2050 SSP1-1.9; (i) 2050 SSP5-8.5.
Ijgi 15 00291 g009
Figure 10. Factor detection of MEESI from 2000 to 2025. (a) 2000; (b) 2005; (c) 2010; (d) 2015; (e) 2020; (f) 2025.
Ijgi 15 00291 g010
Figure 11. Interaction detection of MEESI from 2000 to 2025. (a) 2000; (b) 2005; (c) 2010; (d) 2015; (e) 2020; (f) 2025.
Ijgi 15 00291 g011
Table 1. Data sources in this study (accessed on 25 June 2026).
DataTypeYearPixelSource
Land use typesRaster2000–202530 mhttps://zenodo.org/
RoadsVector2025-http://www.openstreetmap.org/
RailwaysVector2025-http://www.openstreetmap.org/
WaterwaysVector2025-http://www.openstreetmap.org/
DEMRaster202530 mhttp://earthengine.google.com/
SlopeRaster202530 mhttp://earthengine.google.com/
Population densityRaster2025100 mhttp://earthengine.google.com/
Nighttime lightRaster2025500 mhttp://earthengine.google.com/
GDPRaster20251000 mhttp://www.resdc.cn/
NDVIRaster2000–202530 mhttp://earthengine.google.com/
NDWIRaster2000–202530 mhttp://earthengine.google.com/
NDBIRaster2000–202530 mhttp://earthengine.google.com/
BSIRaster2000–202530 mhttp://earthengine.google.com/
PrecipitationVector2000–2025-http://data.cma.cn/
TemperatureVector2000–2025-http://data.cma.cn/
Future climateRaster20501000 mhttp://data.tpdc.ac.cn/
WatershedVector2025-http://www.resdc.cn/
SoilRaster20201000 mhttp://www.fao.org/
EvapotranspirationRaster2000–2025500 mhttp://earthengine.google.com/
Root restricting layer depthRaster2020100 mhttp://globalchange.bnu.edu.cn
Table 2. Neighborhood weights of each land use type.
Type *CLFTGLWBIS
Weights0.6520.2780.0010.0140.055
* CL means cropland; FT means forest; GL means grassland; WB means water bodies; IS means impervious surfaces.
Table 3. Rule matrix of land use conversion under three scenarios.
*Historical TrendSSP1-1.9SSP5-8.5
CLFTGLWBISCLFTGLWBISCLFTGLWBIS
CL111111111110001
FT110110101011111
GL111110111011111
WB111110101011111
IS100011000100001
* 0 means that converting is not permitted and 1 means that converting is permitted.
Table 4. Threat factors and sensitivity to threat factors.
TypeSuitabilityWeightMaximum Impact
Distance/km
Decay TypeSensitivity
CLIS
CL0.40.41Linear00.6
FT0.9---0.60.5
GL0.7---0.80.6
WB0.7---0.20.3
IS0.10.88Exponential0.20
Table 5. Carbon density for each land use type (t/ha).
TypeAboveground Carbon DensityBelowground Carbon DensitySoil Carbon
Density
Dead Carbon Density
CL20.71127.50.4
FT45.623.153.22.8
GL20.83.910.11.4
WB1.91.530
IS31.450
Table 6. Biophysical data for each land use type (Annual Water Yield).
TypeRoot Depth/mmVegetation Evapotranspiration
CL8000.7
FT30001
GL15000.6
WB01
IS00.3
Table 7. Biophysical data for each land use type (SDR Sediment Delivery Ratio).
TypeVegetation CoverSoil Conservation
CL0.20.2
FT0.11
GL0.11
WB01
IS01
Table 8. Transfers in and out of land use types from 2000 to 2050.
TypeTransfers in/km2Transfers out/km2Change Rate/%Stability/%
HT1-1.95-8.5HT1-1.95-8.5HT1-1.95-8.5HT1-1.95-8.5
CL5780.424384.986546.842253.282432.712281.18−156.53−80.25−186.9976.9875.1476.69
FT1705.522111.911579.335764.284520.556570.4570.4153.2875.9674.9480.3571.43
GL3.844.303.6680.8980.8780.9795.2594.6895.481.631.651.53
WB88.58169.6985.92147.73185.36155.2040.048.4544.6471.5464.2970.10
IS706.84588.35909.0539.0239.7437.00−1711.48−1380.50−2356.8989.4589.2690.00
Table 9. Average MEESI values for cities of Hainan Island from 2000 to 2050.
City200020052010201520202025HT1-1.95-8.5
Sanya0.370.360.350.360.370.380.360.340.34
Baoting0.410.410.390.400.420.430.410.400.39
Lingshui0.350.350.330.350.360.350.340.340.34
Ledong0.340.350.330.340.350.350.340.330.32
Changjiang0.310.330.290.320.330.340.340.320.31
Baisha0.410.410.380.390.410.440.420.410.39
Lingao0.310.300.300.310.310.330.320.330.30
Dengmai0.350.330.340.350.330.370.360.350.34
Tunchang0.390.370.400.380.380.420.400.400.38
Dingan0.350.320.350.330.320.350.330.340.32
Haikou0.320.290.300.280.250.280.270.280.27
Qiongzhong0.440.430.420.420.430.460.440.430.42
Danzhou0.320.320.310.330.330.360.350.350.33
Dongfang0.300.300.270.290.300.310.300.290.28
Wanning0.380.370.370.370.370.380.360.360.35
Wenchang0.310.290.300.290.270.290.290.300.30
Qionghai0.360.340.360.350.340.370.360.360.35
Wuzhishan0.430.430.390.410.440.460.460.430.43
Disclaimer/Publisher’s Note: The statements, opinions and data contained in all publications are solely those of the individual author(s) and contributor(s) and not of MDPI and/or the editor(s). MDPI and/or the editor(s) disclaim responsibility for any injury to people or property resulting from any ideas, methods, instructions or products referred to in the content.