1. Introduction
1.1. Industrial Reshoring Under Climate Constraints
The recent wave of semiconductor manufacturing reshoring in the United States represents a major spatial reconfiguration of advanced industrial production [
1,
2]. Federal policies such as the CHIPS and Science Act have accelerated the construction of large-scale fabrication facilities (“fabs”), including the Taiwan Semiconductor Manufacturing Company (TSMC) facility in Phoenix, Arizona, and the Samsung Semiconductor expansion in Austin, Texas [
3,
4]. These projects are typically located in peri-urban or greenfield areas where land availability, infrastructure scalability, and regional development incentives are favorable. Within planning and urban development debates, these large-scale industrial investments are increasingly discussed not only as economic growth strategies but also as major spatial interventions capable of reshaping infrastructure demand, suburban development patterns, and regional mobility systems [
5,
6,
7].
Semiconductor fabrication is among the most energy- and water-intensive forms of advanced manufacturing [
8,
9]. Continuous production processes require stable baseload electricity and tightly controlled environments, resulting in sustained and highly concentrated electricity demand [
10]. When such facilities are introduced into peri-urban environments, the concentration of industrial electricity demand may interact with existing urban infrastructure systems in ways that extend beyond the factory site itself [
11,
12,
13]. Urban planning and infrastructure studies have also increasingly emphasized that large industrial developments should be understood not only in terms of employment or production outputs but also in relation to metropolitan infrastructure capacity, climate vulnerability, and everyday urban activity systems [
5,
6,
7,
14].
These interactions become especially salient in regions exposed to recurrent extreme heat. In the American Southwest, electricity demand already exhibits strong seasonal peaks driven by air-conditioning loads during summer months [
15,
16,
17,
18,
19,
20,
21]. The introduction of continuous industrial baseload demand into these systems may therefore intensify pressure on regional infrastructure during periods when residential cooling demand is simultaneously elevated. Under these climate-constrained conditions, questions arise about how large industrial infrastructures interact with surrounding patterns of commercial activity, mobility, and urban temporal rhythms in rapidly growing metropolitan regions. Accordingly, this study asks: how does the early operational period of large energy-intensive industrial facilities correspond with changes in the spatial and temporal organization of surrounding urban commercial activity during periods of climatic stress?
1.2. Agglomeration, Infrastructure, and Grid Resilience: Divergent Explanations
Existing scholarship offers competing explanations for how large-scale industrial investments reshape urban space, yet these perspectives often operate at different analytical scales and rarely intersect directly [
22,
23,
24]. Urban economic theory frequently frames high-technology manufacturing as a catalyst for localized growth through agglomeration mechanisms [
25,
26]. In this perspective, anchor firms generate employment multipliers, attract supplier networks, and stimulate complementary services, thereby reinforcing surrounding commercial ecosystems. Empirical evidence supporting this argument is typically derived from annual employment statistics, regional output measures, or input–output modeling frameworks [
27,
28,
29,
30]. While effective in identifying long-term structural transformation, these approaches are generally less capable of capturing short-term spatial adjustments occurring during the early operational phases of large industrial facilities.
In contrast, research in urban infrastructure and planning studies emphasizes uneven integration within networked urban systems [
31,
32,
33,
34]. Large-scale infrastructural projects may reinforce enclave-like development patterns, redistribute accessibility, or reshape surrounding patterns of mobility and service concentration [
35,
36,
37]. This strand of scholarship highlights how infrastructural concentration can generate differentiated spatial outcomes rather than uniform spillover effects. However, much of this literature relies on qualitative case studies or macro-scale spatial interpretation. As a result, relatively limited empirical work has examined, using high-frequency behavioral indicators, whether surrounding commercial activity measurably changes during the early operational period of major industrial facilities. In parallel with these debates, research on engineering and infrastructure resilience has examined how regional electricity systems respond to extreme weather events and peak-load conditions [
38,
39,
40]. These studies primarily focus on system reliability, redundancy, and load-balancing capacity under predefined demand scenarios. Although such models are effective for evaluating infrastructure performance, they generally treat human activity patterns as externally specified demand profiles rather than as spatially differentiated urban processes that may vary across metropolitan contexts [
41].
Collectively, these strands of literature point to an unresolved analytical gap. Agglomeration theory often anticipates localized economic expansion, whereas infrastructure and urban planning scholarship highlights the possibility of uneven spatial adjustment associated with major industrial development. At the same time, resilience-oriented infrastructure research primarily focuses on system performance rather than localized commercial dynamics. As a result, relatively little is known about how the early operational period of large energy-intensive industrial facilities corresponds with surrounding commercial activity patterns, particularly in peri-urban metropolitan environments exposed to recurrent climatic stress. This gap is especially evident in studies that employ high-frequency behavioral indicators to capture fine-grained spatiotemporal changes during periods of industrial transition. Existing evidence is also drawn largely from mature industrial regions, leaving limited understanding of how commercial vitality evolves during the early operational period of greenfield industrial developments [
42,
43,
44,
45,
46].
1.3. Commercial Activity and Infrastructure Context in Greenfield Industrial Development
Despite extensive research on agglomeration, infrastructural differentiation, and infrastructure resilience, the distinction between mature industrial clusters and greenfield industrial development remains comparatively underexplored. Much of the existing literature is based on regions where major industrial facilities are embedded within established economic and commercial systems, such as Silicon Valley or Austin [
47,
48,
49,
50,
51]. In these settings, industrial expansion occurs within already diversified metropolitan environments. Consequently, less is known about how commercial activity evolves across space, sectors, and time-of-day categories when semiconductor facilities are introduced into less-mature peri-urban or greenfield suburban contexts.
Greenfield developments differ structurally [
52,
53,
54]. Large industrial facilities introduced into lower-density suburban environments may initially coexist with relatively sparse commercial landscapes and emerging service networks. Under these conditions, whether agglomeration benefits emerge during the early operational period remains uncertain. It is also unclear whether industrial development reinforces local commercial concentration, redistributes activity across suburban space, or generates only limited short-term spillovers. The Phoenix TSMC development provides an opportunity to examine these questions empirically. Publicly available information indicates that TSMC Arizona currently employs more than 3500 workers, with additional expansion planned as future fabs become operational. Semiconductor manufacturing is also characterized by continuous production schedules, specialized technical labor, and shift-based staffing arrangements. Although worker demographics, residential locations, and commuting patterns are not directly observed in this study, these characteristics provide relevant context for interpreting potential changes in surrounding commercial activity [
7,
8,
9,
55].
A related limitation in existing research concerns the tendency to examine infrastructure demand and urban commercial activity separately. Engineering and infrastructure studies have long recognized that human activity patterns shape energy demand profiles [
41,
56,
57]. However, these insights are less often extended to metropolitan-scale questions of how large industrial facilities coexist with surrounding commercial environments, mobility systems, and suburban activity rhythms. This separation is particularly important in rapidly growing Sunbelt metropolitan areas exposed to recurrent extreme heat, where industrial energy demand, cooling-related regional load, and commercial activity coexist within the same urban system.
Although this study does not model a direct causal relationship between electricity demand and commercial vitality, the concept of human–grid coupling provides a useful planning context for understanding why large energy-intensive facilities matter under extreme heat. Within this framework, electricity demand, climatic stress, and commercial activity are treated as co-located urban processes rather than variables linked through a single causal mechanism. Regional electricity load records, therefore, provide contextual information on broader infrastructure conditions, while mobility-derived indicators provide the empirical basis for evaluating commercial activity patterns. The analysis examines whether the early operational period of a greenfield semiconductor mega-project is associated with spatial and temporal shifts in surrounding commercial activity. In doing so, commercial vitality is considered one observable dimension of metropolitan adjustment during a period of industrial and infrastructure transition.
1.4. Research Objectives and Questions
These strands of literature leave an unresolved empirical question. When large-scale semiconductor facilities enter their early operational period in peri-urban or greenfield settings, how do surrounding commercial activity systems change over time, across space, and activity types? Do localized activity patterns exhibit signs of expansion, spatial redistribution, or contraction relative to broader benchmark trajectories? Empirical evidence capable of addressing these questions remains limited, particularly at the high temporal resolution required to capture short-term spatial and behavioral adjustment during the early phases of industrial development.
To address these gaps, this study examines whether the early operational period of large energy-intensive semiconductor facilities, particularly those in greenfield peri-urban contexts, is associated with measurable changes in surrounding urban commercial vitality and its spatial organization. The analysis focuses on identifying high-frequency temporal variation, distance-dependent spatial gradients, and sectoral-temporal differences in commercial activity rather than presuming either immediate agglomeration benefits or predetermined enclave outcomes. This research compares the spatiotemporal evolution of commercial activity surrounding the TSMC facility in Phoenix with broader benchmark patterns observed in the Austin metropolitan context. The study is guided by three research questions:
RQ1 (Temporal Dynamics): How does localized commercial vitality around the Phoenix facility change during the early operational period relative to the Austin benchmark trajectory?
RQ2 (Spatial Extent): How does the magnitude of vitality change vary across distance bands from the facility site, and where, if anywhere, do identifiable zones of activity contraction emerge?
RQ3 (Sectoral and Temporal Heterogeneity): Are observed changes concentrated within specific sectors and temporal activity windows, such as dining versus retail activity and daytime versus nighttime activity, suggesting differentiated patterns of commercial adjustment?
By providing a comparative high-frequency analysis of commercial activity surrounding semiconductor mega-projects in peri-urban metropolitan environments, this study contributes to ongoing discussions in urban planning, infrastructure studies, and metropolitan economic geography in three ways. First, it provides empirical evidence on how localized commercial activity evolves during the early operational period of large industrial facilities under climate-constrained conditions. Second, it demonstrates the value of high-frequency mobility indicators for examining commercial vitality around large industrial facilities through facility-centered spatial analysis, distance-band comparison, and sectoral-temporal stratification. Third, it contributes to debates on industrial development and agglomeration by showing that activity responses may vary unevenly across suburban space, commercial sectors, and daily activity periods rather than following a uniform pattern of localized spillover.
2. Materials and Methods
This study adopts a quasi-experimental design to examine whether the early operational period of a large-scale semiconductor manufacturing facility is associated with changes in localized commercial activity in a greenfield peri-urban setting. The analytical strategy combines facility-centered spatial sampling with a Difference-in-Differences (DiD) framework [
58,
59,
60] to compare commercial activity around the Phoenix facility with benchmark patterns observed in Austin. The early operational period refers to the phase during which equipment installation, workforce onboarding, and initial operational activities were progressively introduced at the facility.
The methodological framework consists of two components. First, a consistent facility-centered sampling structure is used to define comparable commercial catchments around the Phoenix and Austin facilities. Second, temporal change and spatial variation in commercial vitality are evaluated through DiD models, distance-band analysis, and subgroup comparisons by sector and time-of-day category (
Section 2.3).
2.1. Site of Study and Analytical Scope
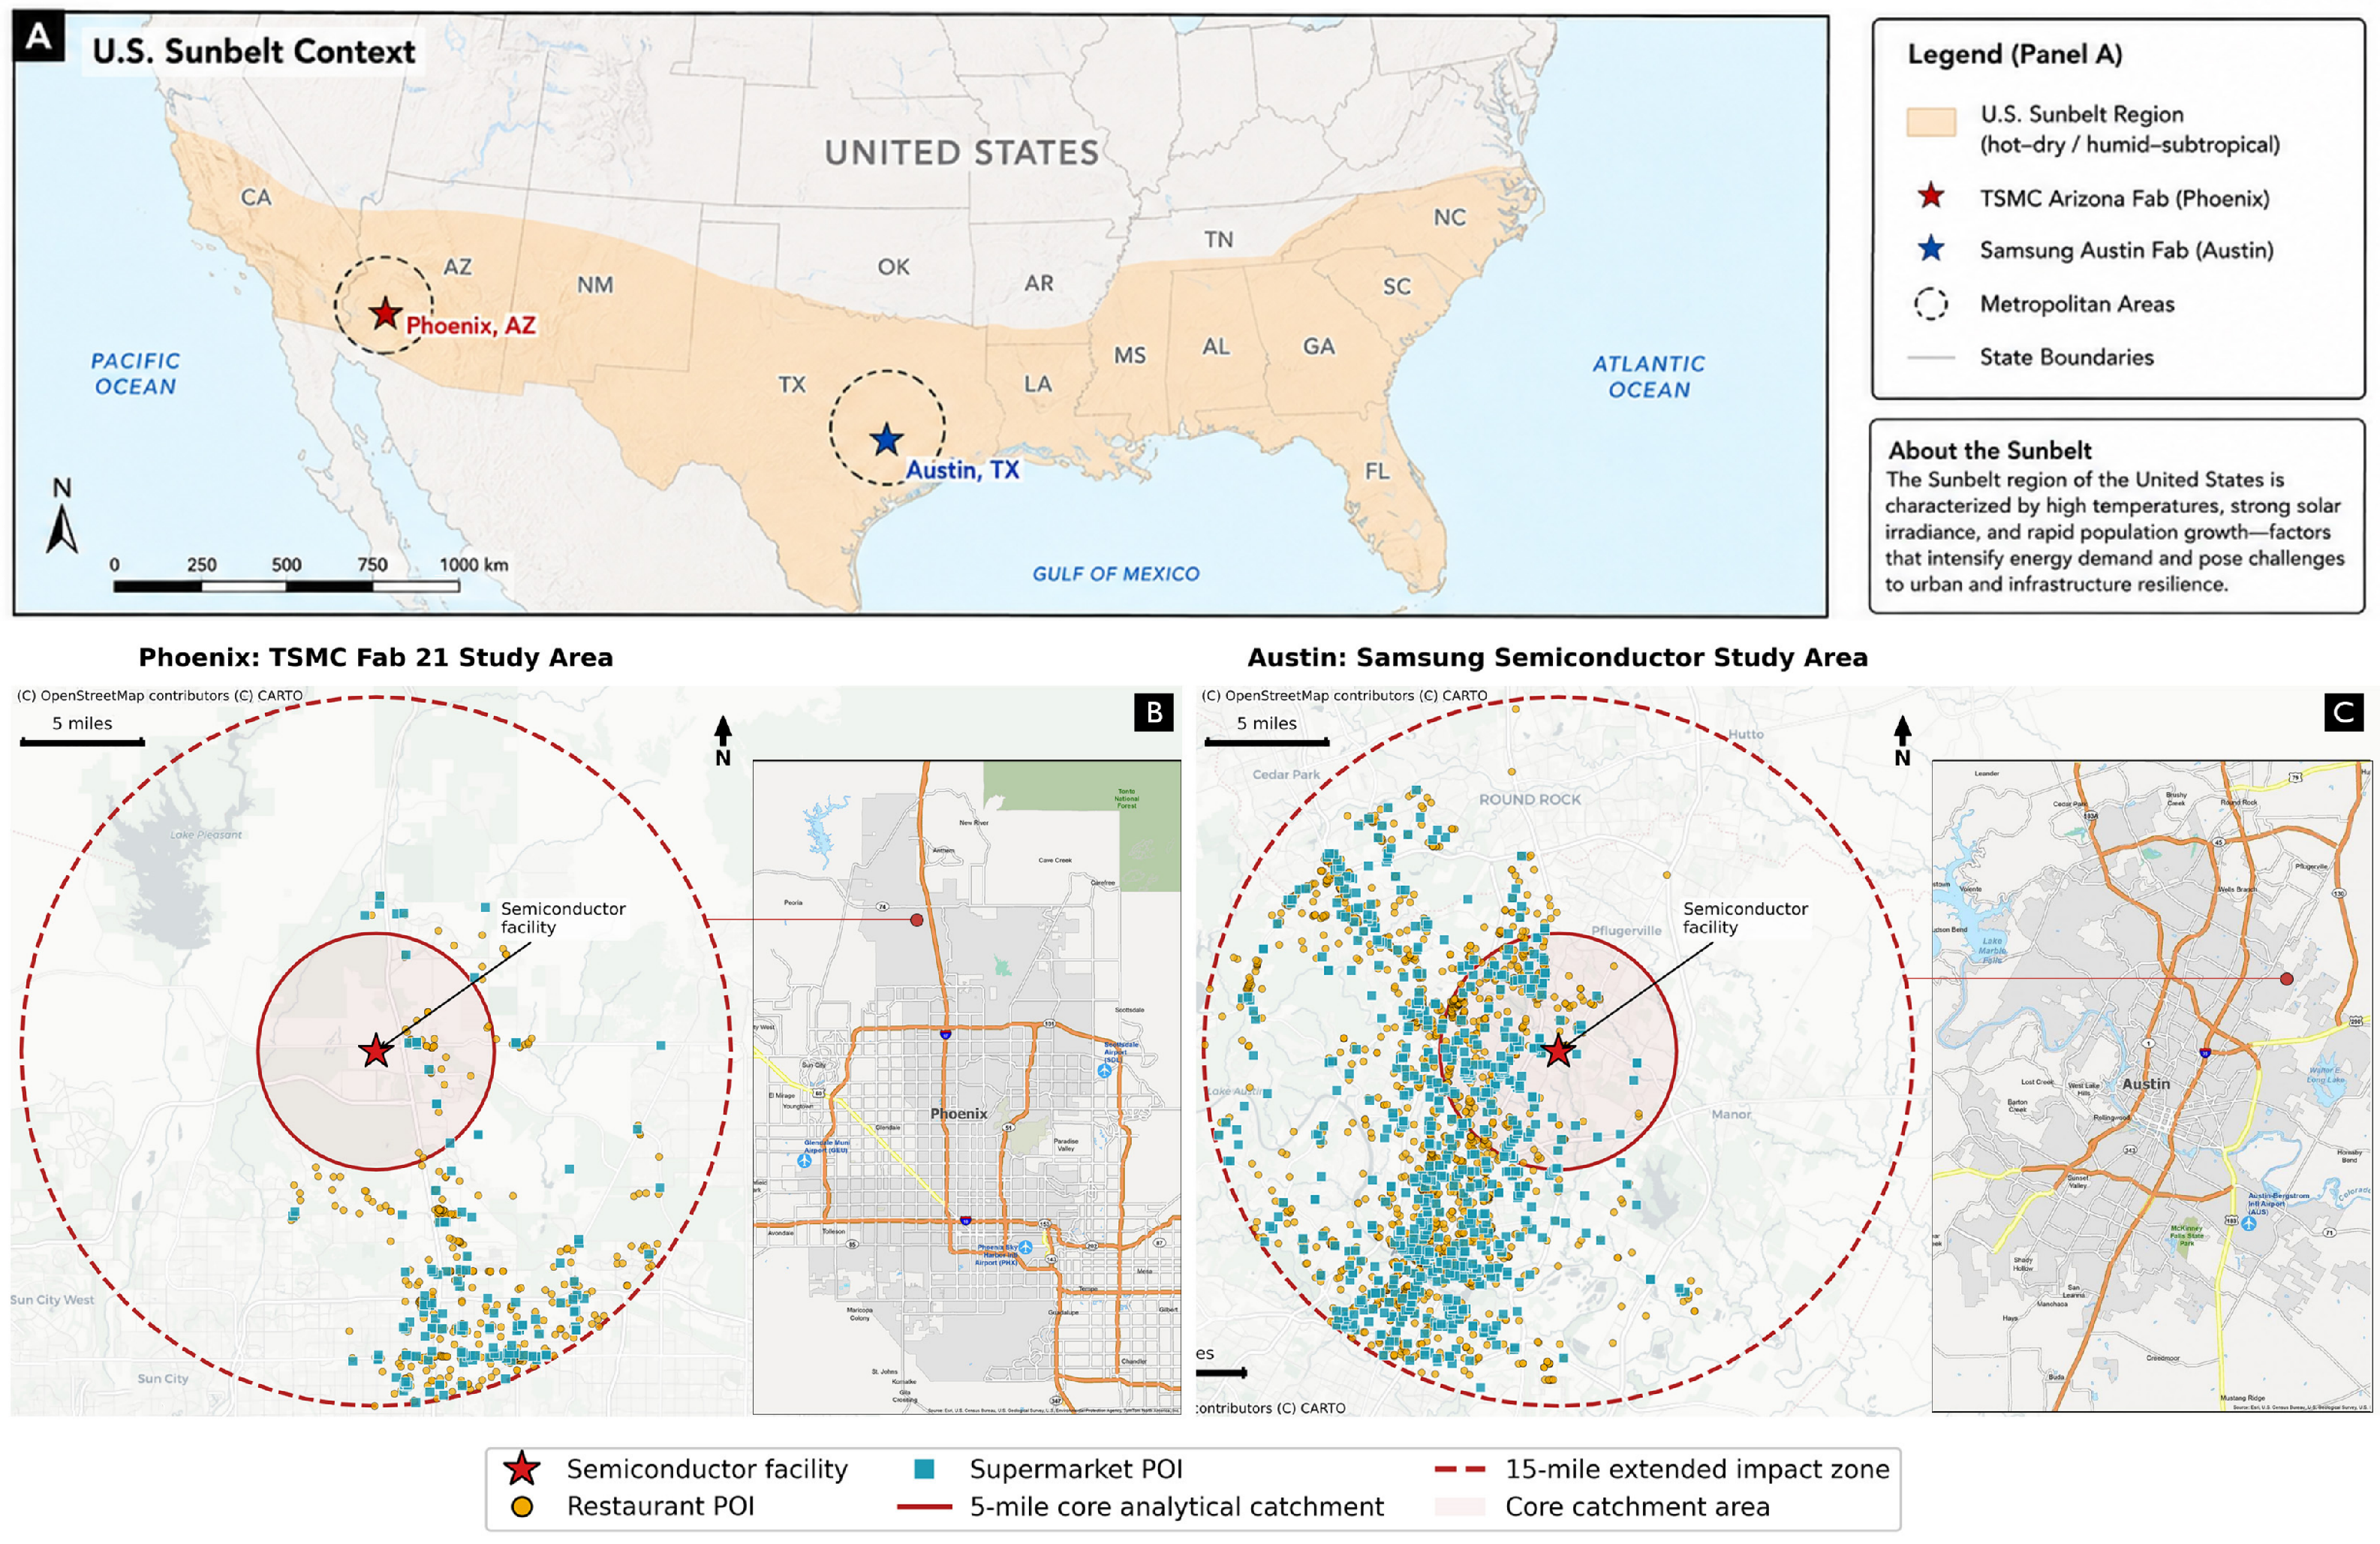
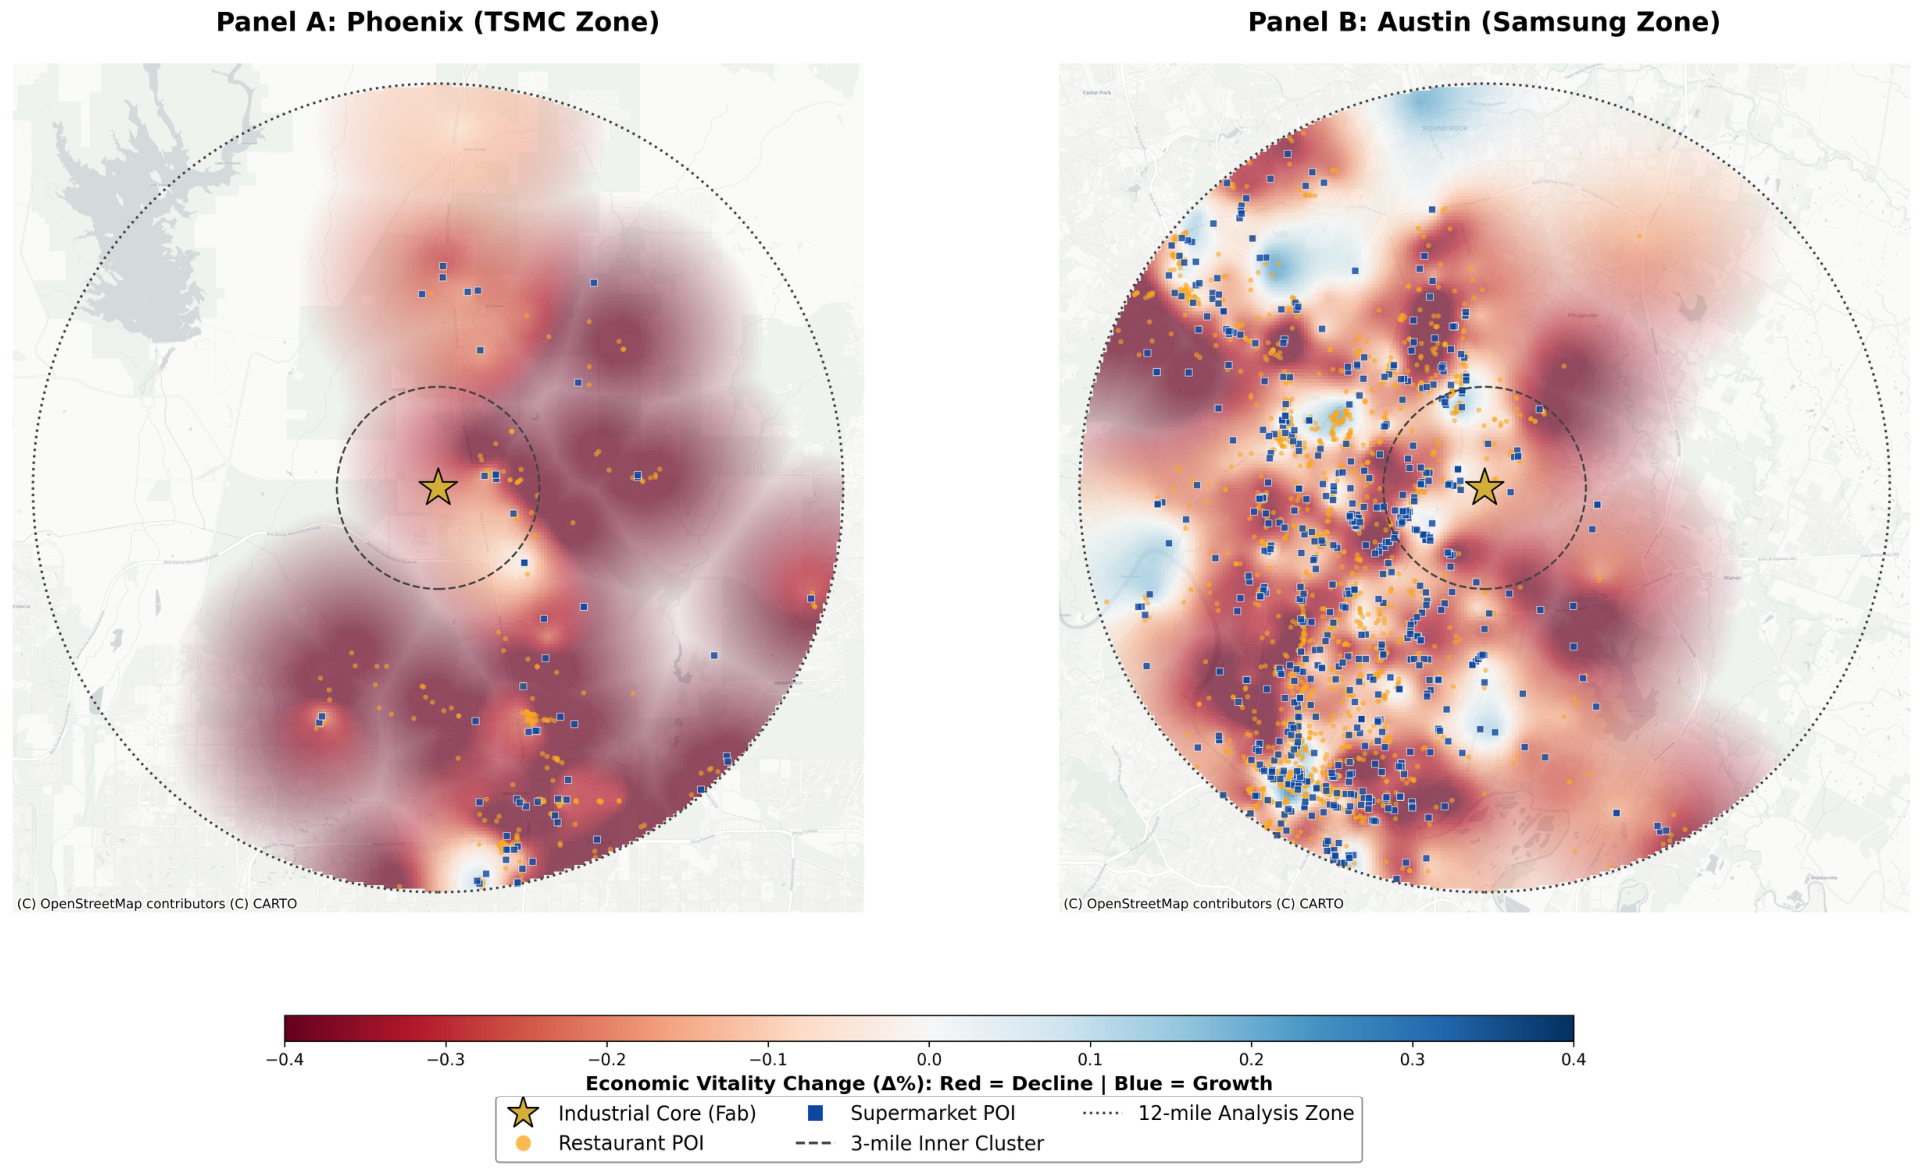
To establish comparable metropolitan study settings, this study delineates facility-centered commercial catchments using a GIS-based sampling approach (
Figure 1). Commercial vitality is measured through visitation patterns to restaurants and supermarkets, which serve as high-frequency mobility-based indicators of localized consumption activity rather than direct measures of business revenue or establishment performance. The analysis focuses on two commercially prevalent sectors with distinct temporal and behavioral profiles: Restaurants (North American Industry Classification System (NAICS) code 7225) and Supermarkets (NAICS code 4451) [
61]. Restaurant visitation generally reflects discretionary, service-oriented consumption, whereas supermarket visitation is more closely associated with routine, household-oriented activity.
For each metropolitan context, Points of Interest (POIs) are sampled within two nested spatial extents. The 5-mile core catchment includes restaurants and supermarkets located within 5 miles of the TSMC Fab 21 site in North Phoenix and within 5 miles of the Samsung semiconductor site in North Austin near Parmer Lane. This core catchment captures the immediate commercial environment surrounding each facility while maintaining a consistent sampling framework across the two metropolitan contexts.
The 15-mile extended zone is used to evaluate broader spatial variation in commercial activity. Within this zone, POIs are assigned to five concentric distance bands: 0–3, 3–6, 6–9, 9–12, and 12–15 miles. The 0–3-mile band represents the immediate facility-adjacent subzone, while the subsequent bands capture progressively more distant suburban environments. This spatial structure balances local specificity with broader metropolitan coverage: the 5-mile core catchment serves as the primary econometric sampling area, while the 15-mile extended zone supports the analysis of distance-dependent spatial gradients. The 3-mile distance-band interval provides a consistent spatial partition while maintaining sufficient POI representation within each band for comparative analysis.
Phoenix and Austin were selected because they represent two major Sunbelt semiconductor contexts with comparable exposure to rapid growth, extreme heat, and large-scale advanced manufacturing investment, but different stages of industrial development. The Phoenix site represents a greenfield semiconductor development at the urban fringe, where surrounding commercial systems are still emerging alongside new industrial land development. The Austin site, by contrast, is located within a more established semiconductor manufacturing region with a longer history of advanced industrial activity. Austin is therefore used as a benchmark metropolitan context rather than a directly equivalent control case. The comparison evaluates Phoenix’s relative commercial activity trajectory against a semiconductor-adjacent Sunbelt benchmark while maintaining a consistent facility-centered sampling framework across both regions.
Figure 1 maps the distribution of sampled POIs and facility-centered buffers used in the analysis. The study does not model the determinants of facility siting. Facility locations are treated as fixed spatial anchors for constructing comparable analytical catchments. The analysis therefore examines how mobility-derived commercial activity changed around these sites during the study period, rather than whether pre-existing commercial vitality influenced the original placement of the facilities.
2.2. Data Sources
This study draws on two complementary data sources: high-frequency human mobility records and regional electricity load records. Human mobility data provide the primary empirical basis for constructing the Commercial Vitality Index (CVI), which serves as the outcome variable in the econometric analysis. Regional electricity load records are used to characterize broader metropolitan demand conditions and provide infrastructure context. This distinction is maintained throughout the analysis: POI visitation data support the estimation of localized commercial activity, while electricity load data provide descriptive background on regional demand conditions.
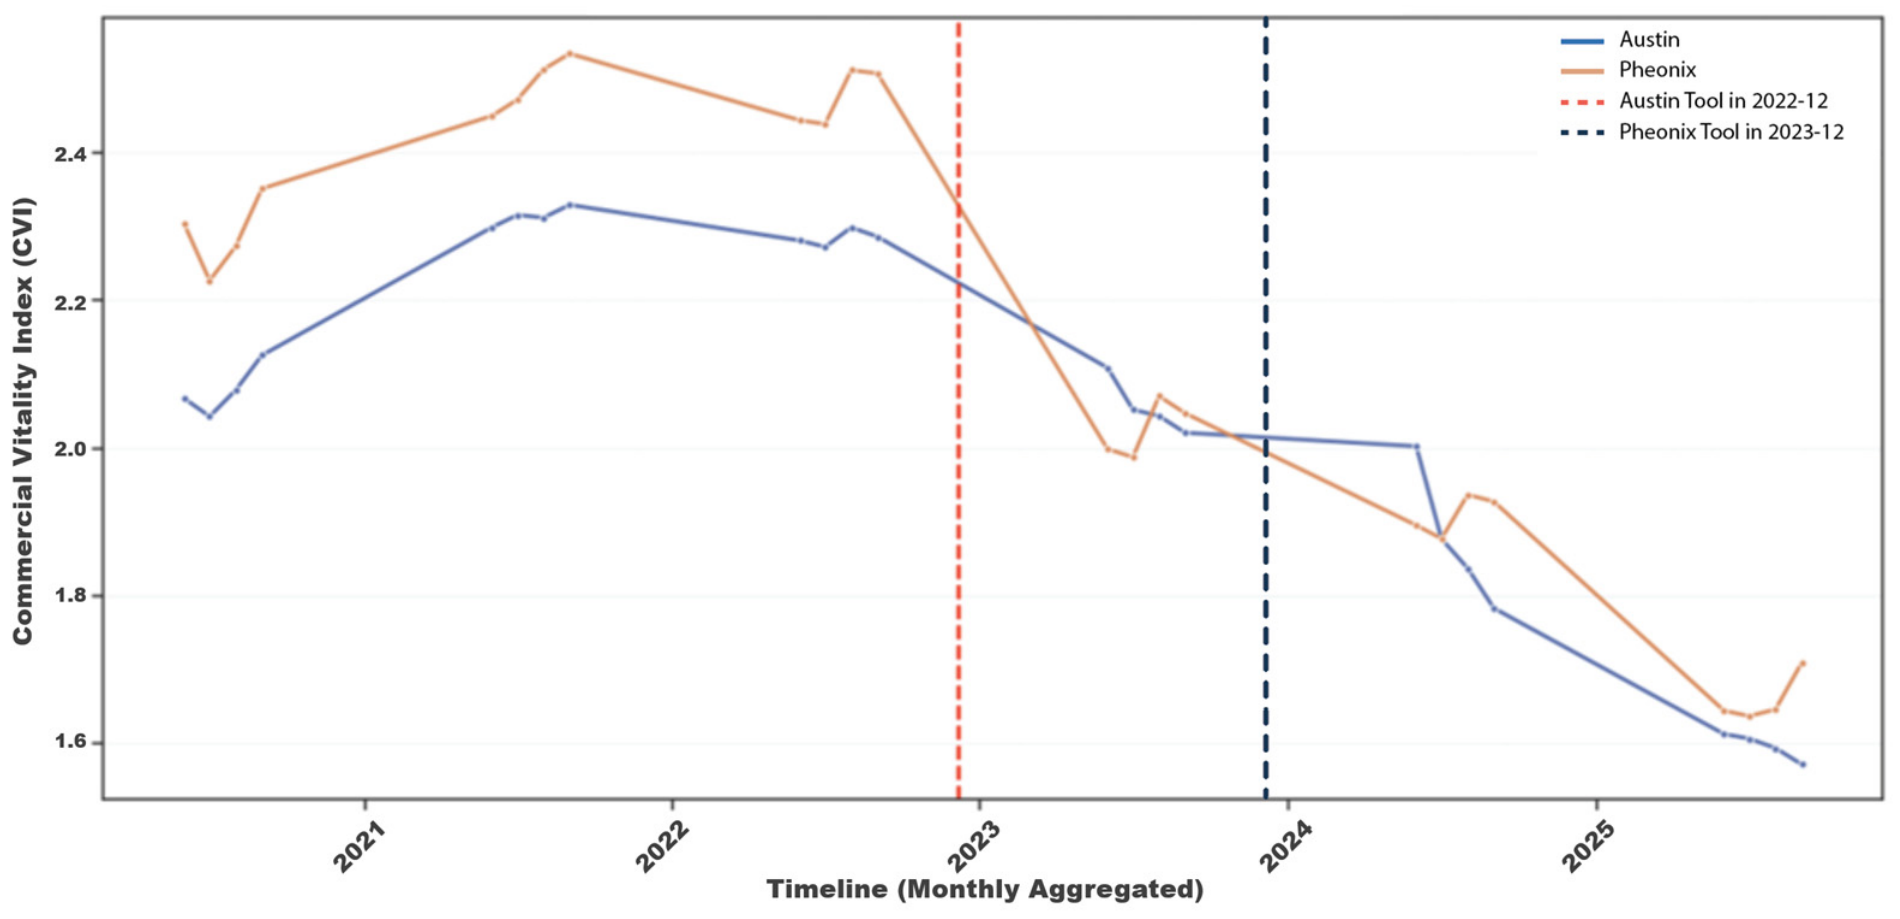
The primary temporal breakpoint is January 2023, corresponding to the start of the early operational period at the TSMC facility in Phoenix, including equipment move-in and initial operational activities. Although the Samsung facility in North Austin followed a different development timeline, the shared January 2023 breakpoint allows Austin to serve as a benchmark for comparison during the period when the Phoenix facility entered its early operational phase. This temporal alignment supports the comparative DiD framework described in
Section 2.3.
To characterize periods of elevated regional demand, the analysis defines extreme heat periods using a percentile-based threshold. Heat events are defined as hours in which the apparent temperature exceeds the 95th percentile of the June–September distribution for each metropolitan area. The resulting thresholds are 41.38 °C for Phoenix and 39.32 °C for Austin. This approach identifies locally relative thermal extremes rather than applying a single absolute temperature threshold across both regions. These heat-period indicators provide a climatic context for descriptive assessments of regional demand conditions.
Human mobility data are obtained from the Advan “Weekly Patterns” dataset provided through the Dewey Data Platform. The dataset spans 1 January 2020 through 31 December 2025 and aggregates anonymized mobile device signals into hourly POI-level visit counts. The geographic sample corresponds to the facility-centered catchments defined in
Section 2.1 and is restricted to Restaurants and Supermarkets within the 5-mile core zones surrounding each facility. Hourly visit counts are aggregated to construct the CVI, a mobility-derived indicator of localized consumption-oriented commercial activity. The CVI is based on log-transformed visit counts and serves as the primary outcome variable in the econometric analysis. To preserve cross-metropolitan comparability, the main models use log-transformed mobility measures rather than indicators standardized separately within each metropolitan area.
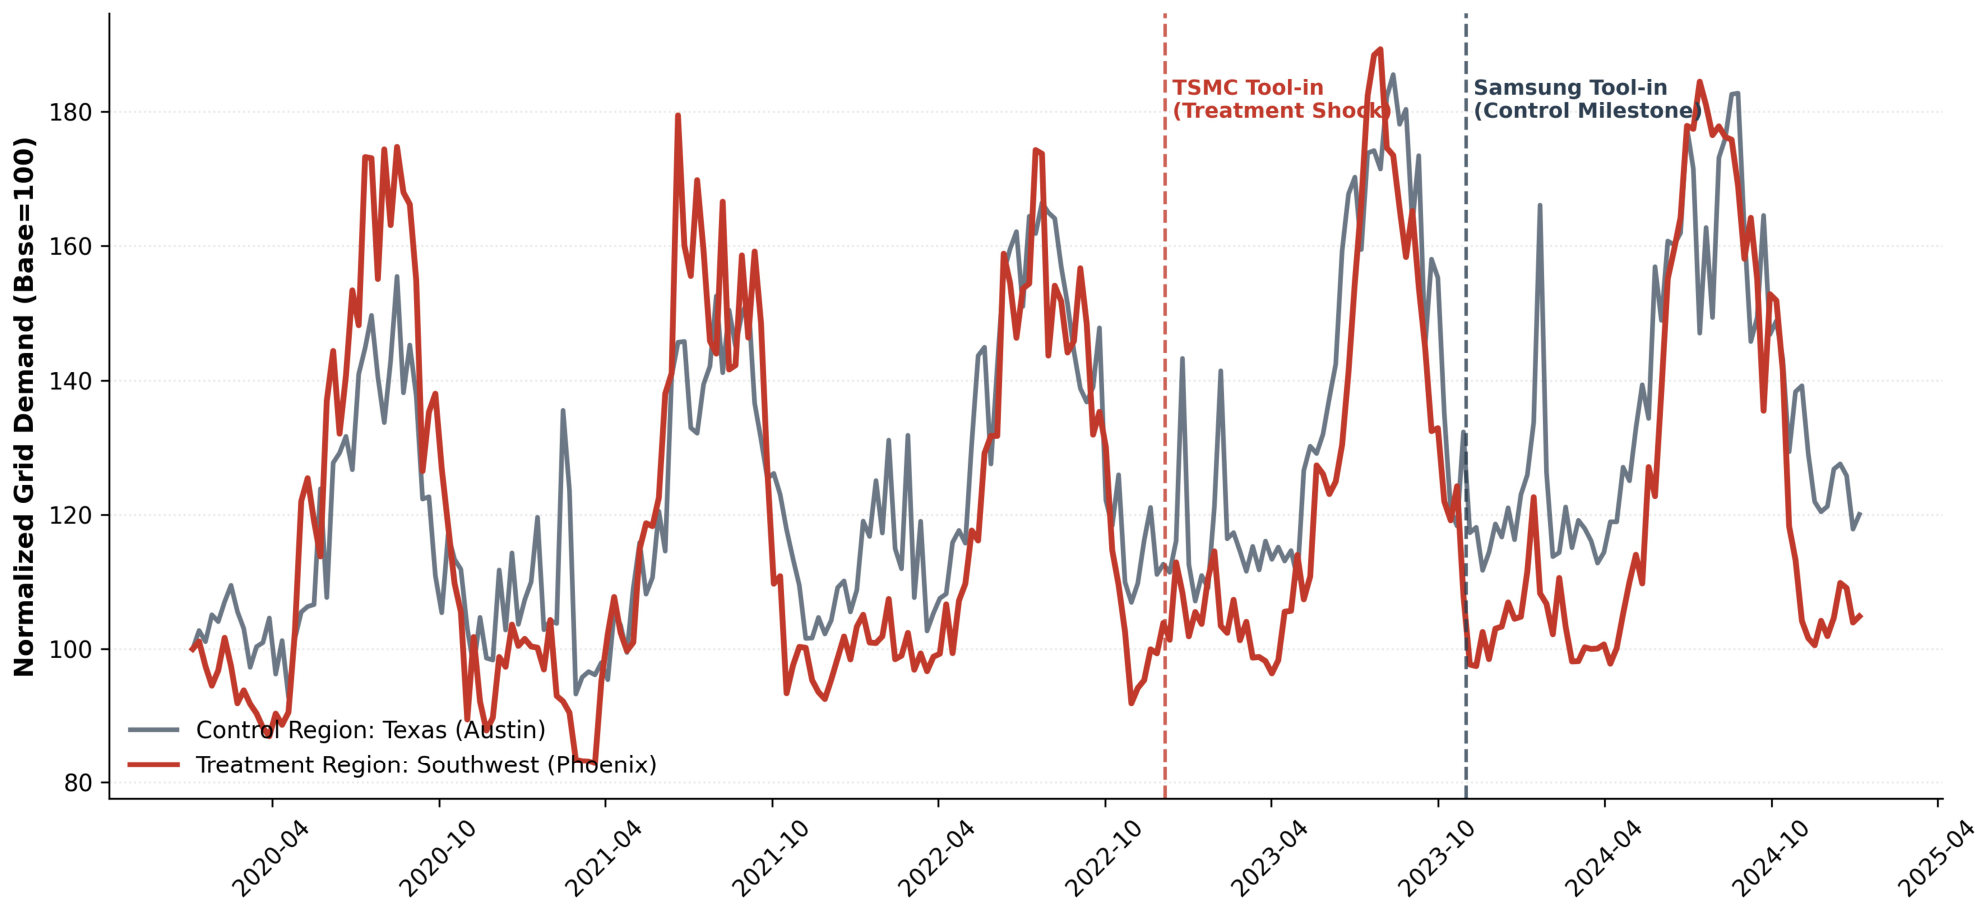
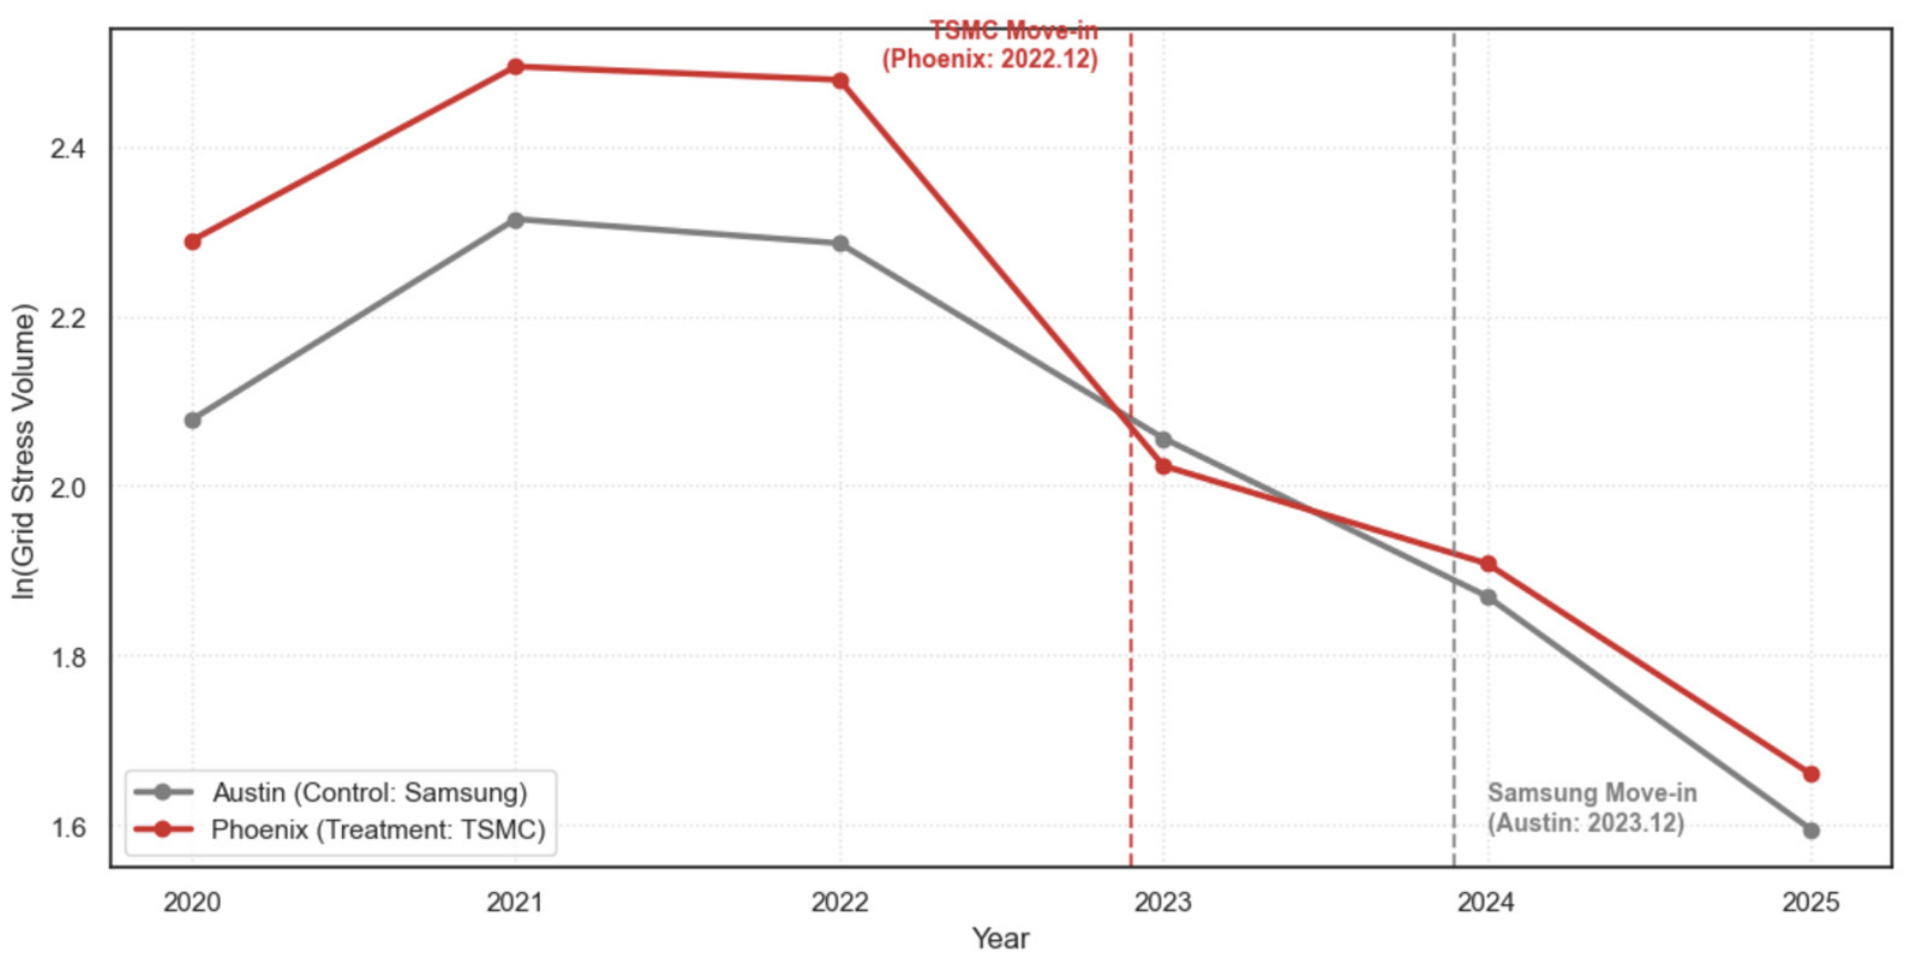
Regional electricity load data are obtained from the U.S. Energy Information Administration (EIA) Form EIA-930 Hourly Electric Grid Monitor. The analysis uses Total Net Load, measured in megawatts (MW), from Balancing Authority and regional datasets. For Phoenix, load data are drawn from Arizona Public Service (AZPS) and Southwest (SW) regional files. For Austin, load data are drawn from the Electric Reliability Council of Texas (ERCOT) and Texas (TEX) regional files. All load records are maintained at hourly resolution and aligned with local time zones: Mountain Standard Time (MST) for Phoenix and Central Standard Time (CST) for Austin. Electricity load values are used only to characterize regional demand conditions and metropolitan-scale infrastructure context. The descriptive assessment focuses on June–September, when cooling demand and extreme heat exert the strongest influence on regional load profiles.
2.3. Data Analysis Methods
This section presents the econometric specifications used to examine spatiotemporal variation in commercial vitality across the Phoenix and Austin study settings. The analysis proceeds in three components: (1) a dynamic comparative DiD specification estimating annual divergence patterns, (2) a distance-band extension evaluating spatial variation around the facility sites, and (3) subgroup models assessing sectoral and time-of-day heterogeneity. All models use POI-level panel data aggregated at the monthly scale. Heterogeneity is measured through differences in estimated regression coefficients across predefined analytical strata, including distance bands, commercial sectors, and time-of-day categories. The analysis does not estimate global spatial autocorrelation or dispersion statistics such as Moran’s I, entropy, or variance across time slices. Instead, heterogeneity is operationalized as comparative variation in model-estimated activity changes across spatial, sectoral, and temporal groups.
The CVI serves as the primary outcome variable throughout the analysis. For each sampled POI, hourly visit counts from the Advan dataset are aggregated to the monthly level and transformed using a natural logarithm to reduce skewness in visitation volumes across establishments. No additional weighting, temporal smoothing, imputation, or city-specific normalization procedures are applied. The resulting measure provides a consistent mobility-based indicator of localized commercial activity across both metropolitan settings.
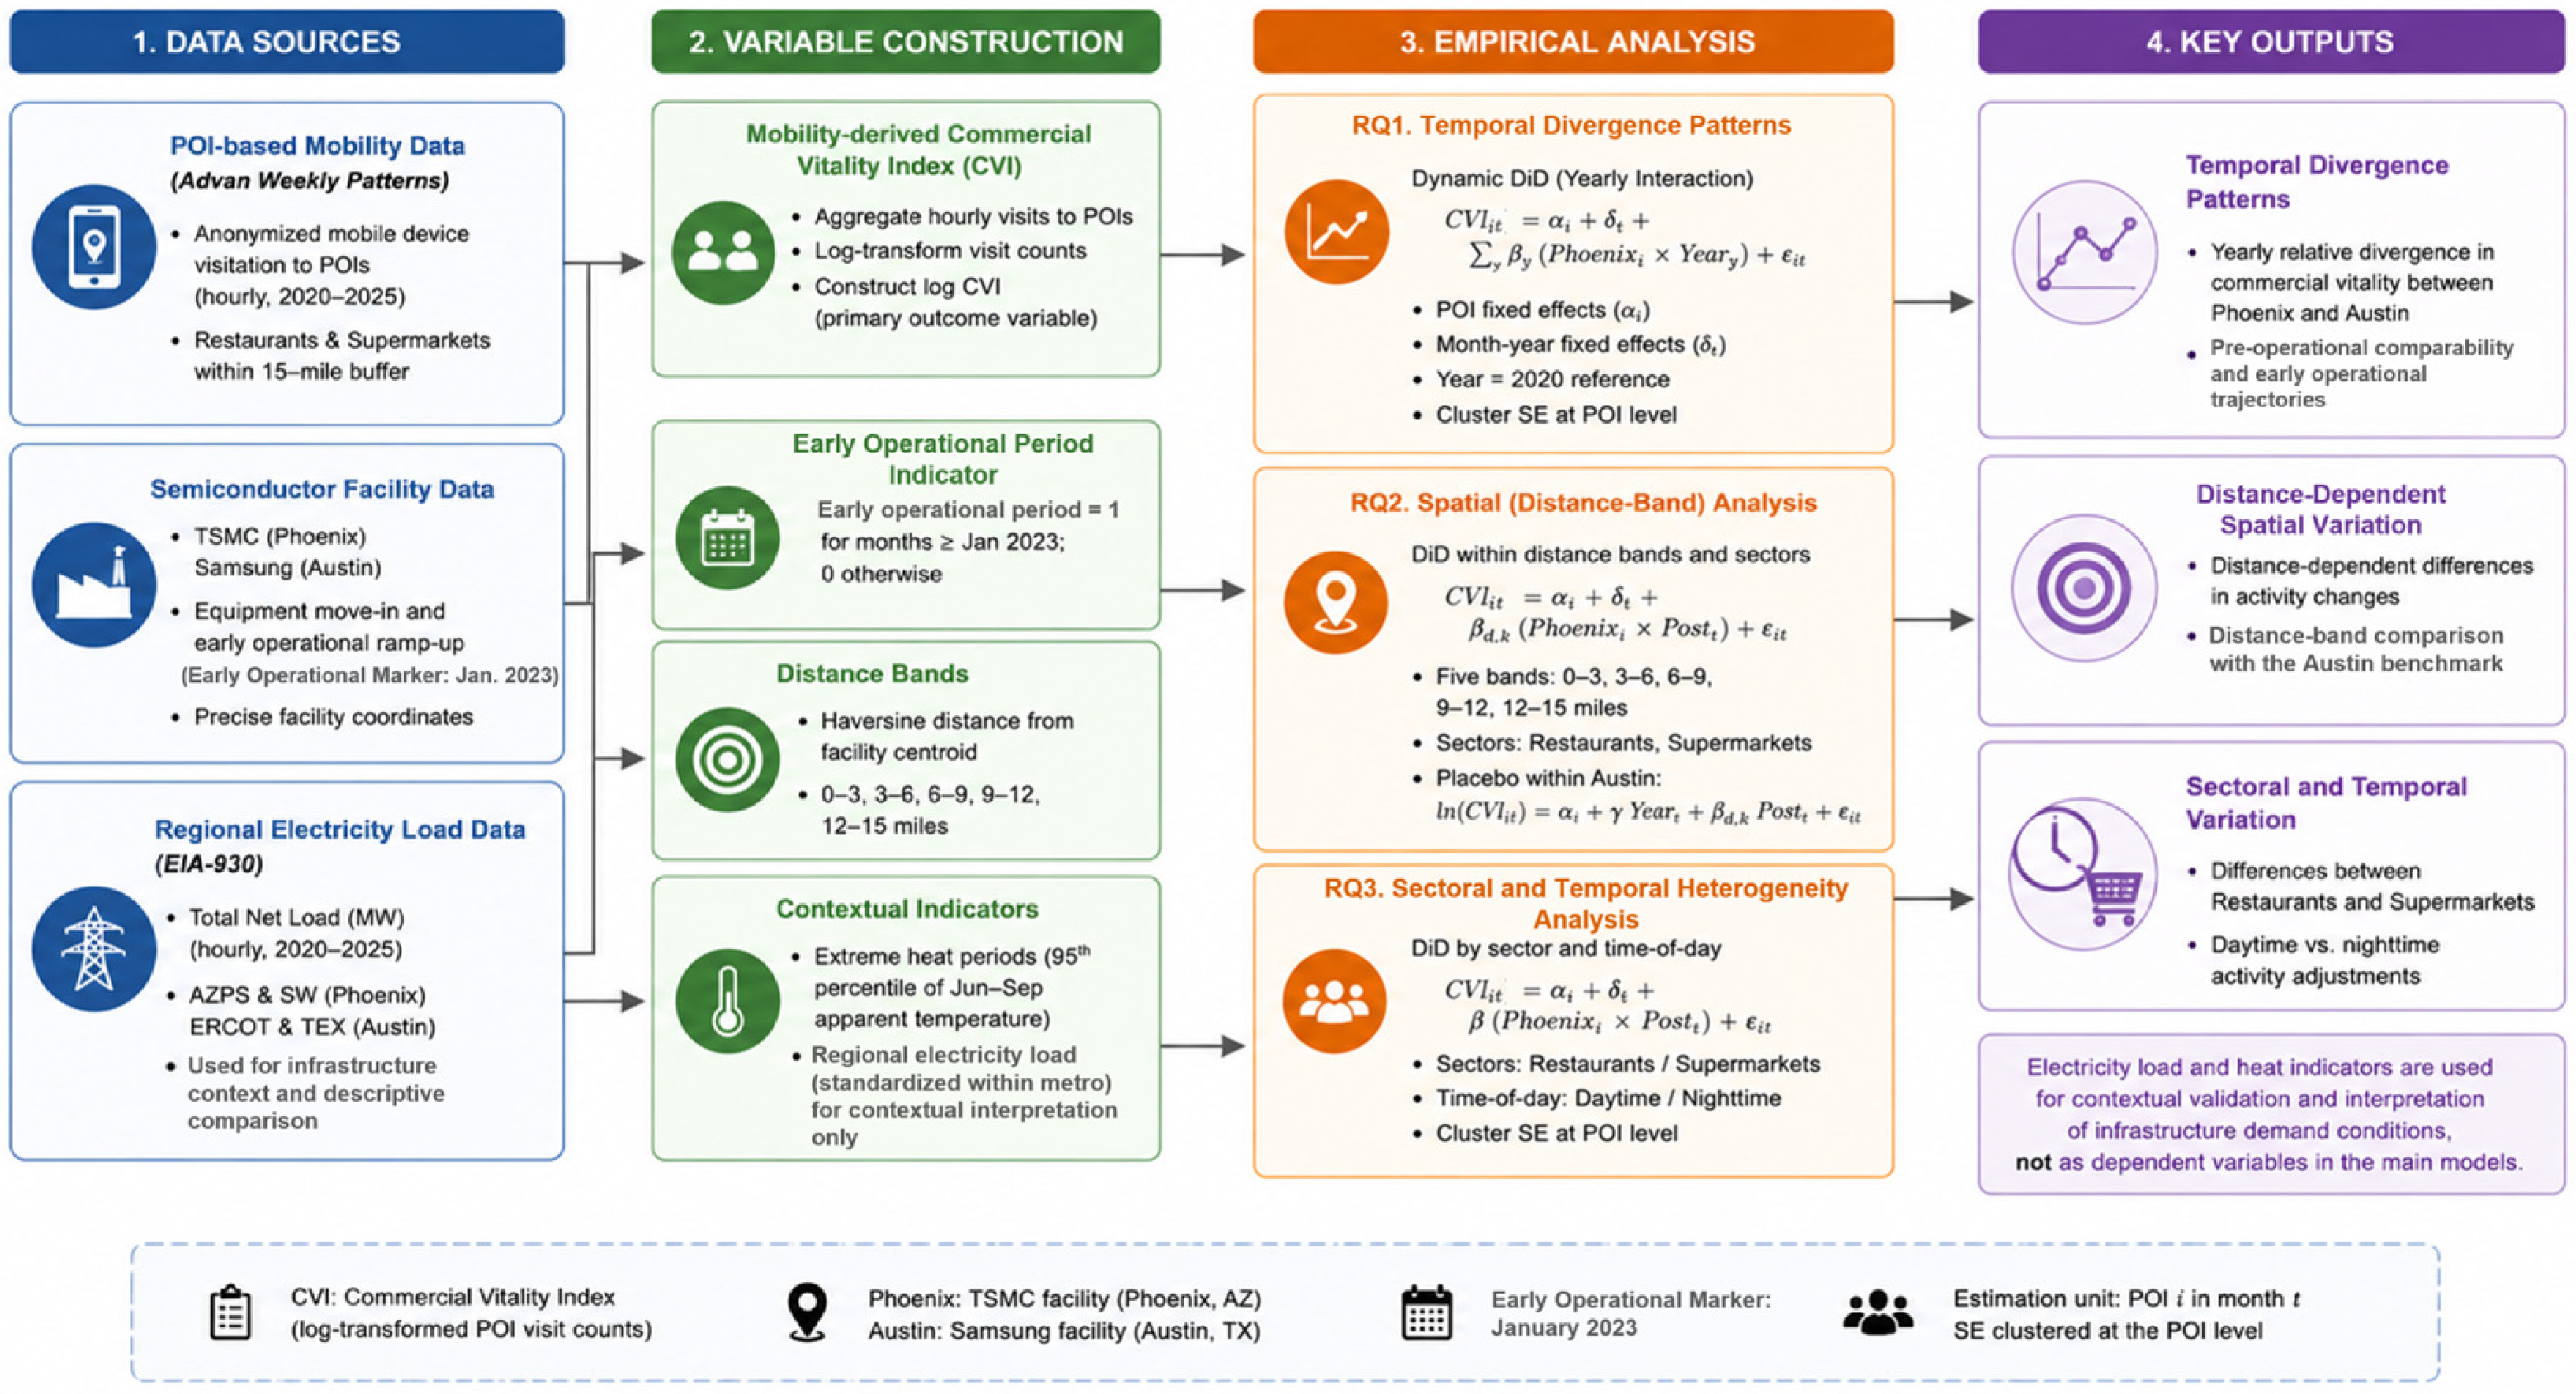
Figure 2 summarizes the analytical logic of the study. Facility locations and the January 2023 temporal breakpoint define the comparative spatial and temporal structure of the analysis. POI-based mobility data provide the empirical basis for constructing the CVI and estimating temporal, spatial, sectoral, and time-of-day differences in localized commercial activity. Regional electricity load records provide contextual information on metropolitan-scale demand conditions. Accordingly, the empirical contribution of the study lies in using high-frequency POI mobility indicators to examine spatiotemporal heterogeneity in commercial vitality through a facility-centered comparative framework, while electricity load data situate these patterns within a broader infrastructure context.
2.3.1. RQ1: Temporal Divergence Analysis
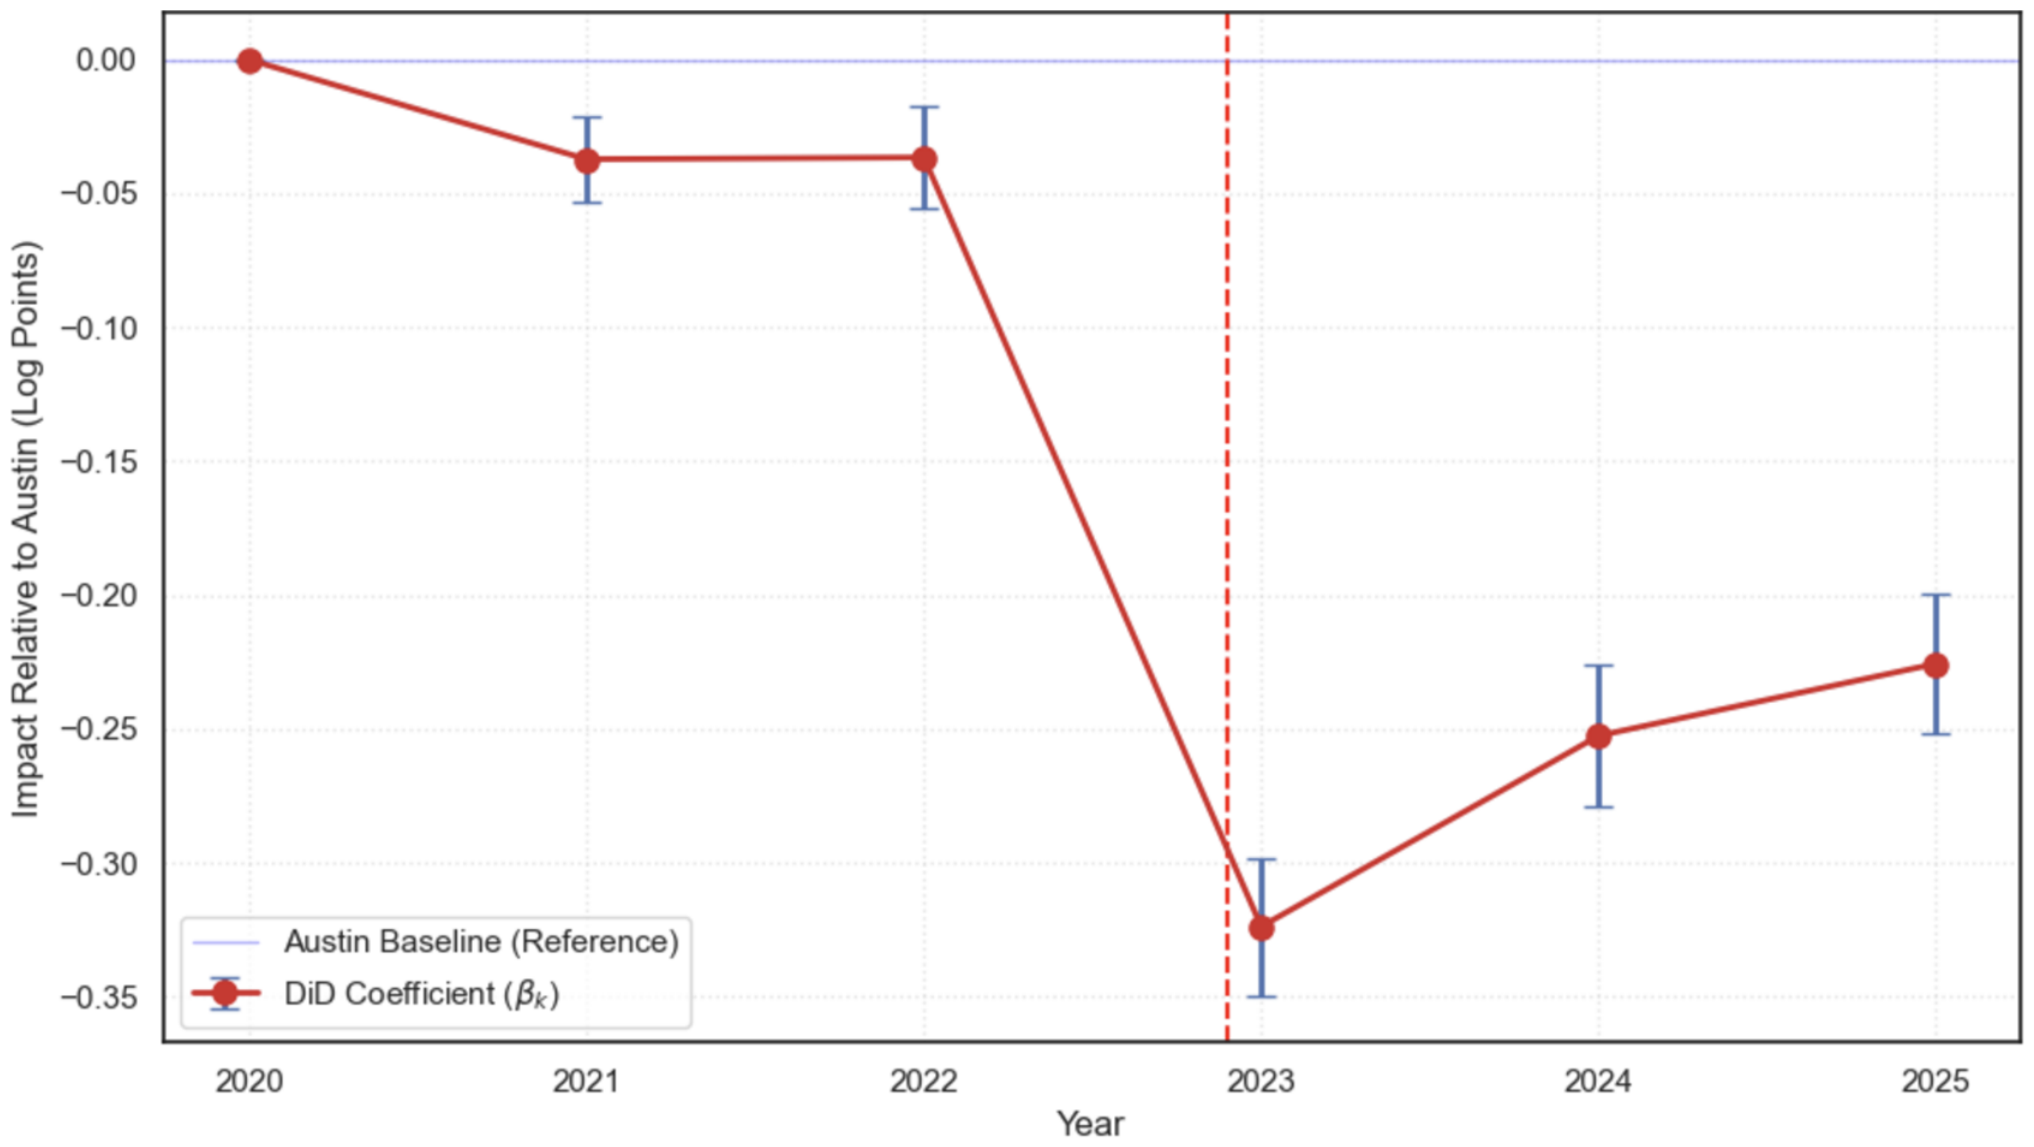
To evaluate how localized commercial activity changed during the early operational period beginning in January 2023, the analysis implements a dynamic comparative DiD specification [
62,
63]. The model estimates Phoenix’s yearly relative divergence from the Austin benchmark trajectory, using 2020 as the reference year. Yearly interaction terms are used because the study focuses on persistent annual divergence during the early operational period rather than short-term month-to-month fluctuations. Given the strong seasonality of commercial visitation and the uneven timing of industrial ramp-up activities, yearly coefficients provide a more stable summary of temporal divergence than a fully monthly event-study specification.
The model is expressed as follows:
where
denotes the mobility-derived CVI for POI
in month
, measured using log-transformed visit counts.
equals 1 for POIs located in the Phoenix study setting and 0 for POIs located in the Austin benchmark setting.
represents indicator variables for each analytical year relative to the 2020 reference period. The coefficients
capture Phoenix’s yearly relative difference in commercial vitality compared with the Austin benchmark trajectory. POI fixed effects (
) absorb time-invariant establishment characteristics, while month–year fixed effects (
) control for shared seasonal, macroeconomic, and broader temporal variation. Standard errors are clustered at the POI level to account for serial correlation within establishments over time. The coefficients for 2021 and 2022 are evaluated descriptively to assess pre-operational differences between the two metropolitan trajectories. Because these pre-period coefficients are statistically distinguishable from zero, the Phoenix and Austin trajectories cannot be treated as fully parallel before the early operational period. Accordingly, this specification is used to characterize relative temporal divergence between Phoenix and the Austin benchmark setting rather than to claim a definitive causal treatment effect.
2.3.2. RQ2: Spatial Stratification and Comparative Distance-Band Analysis
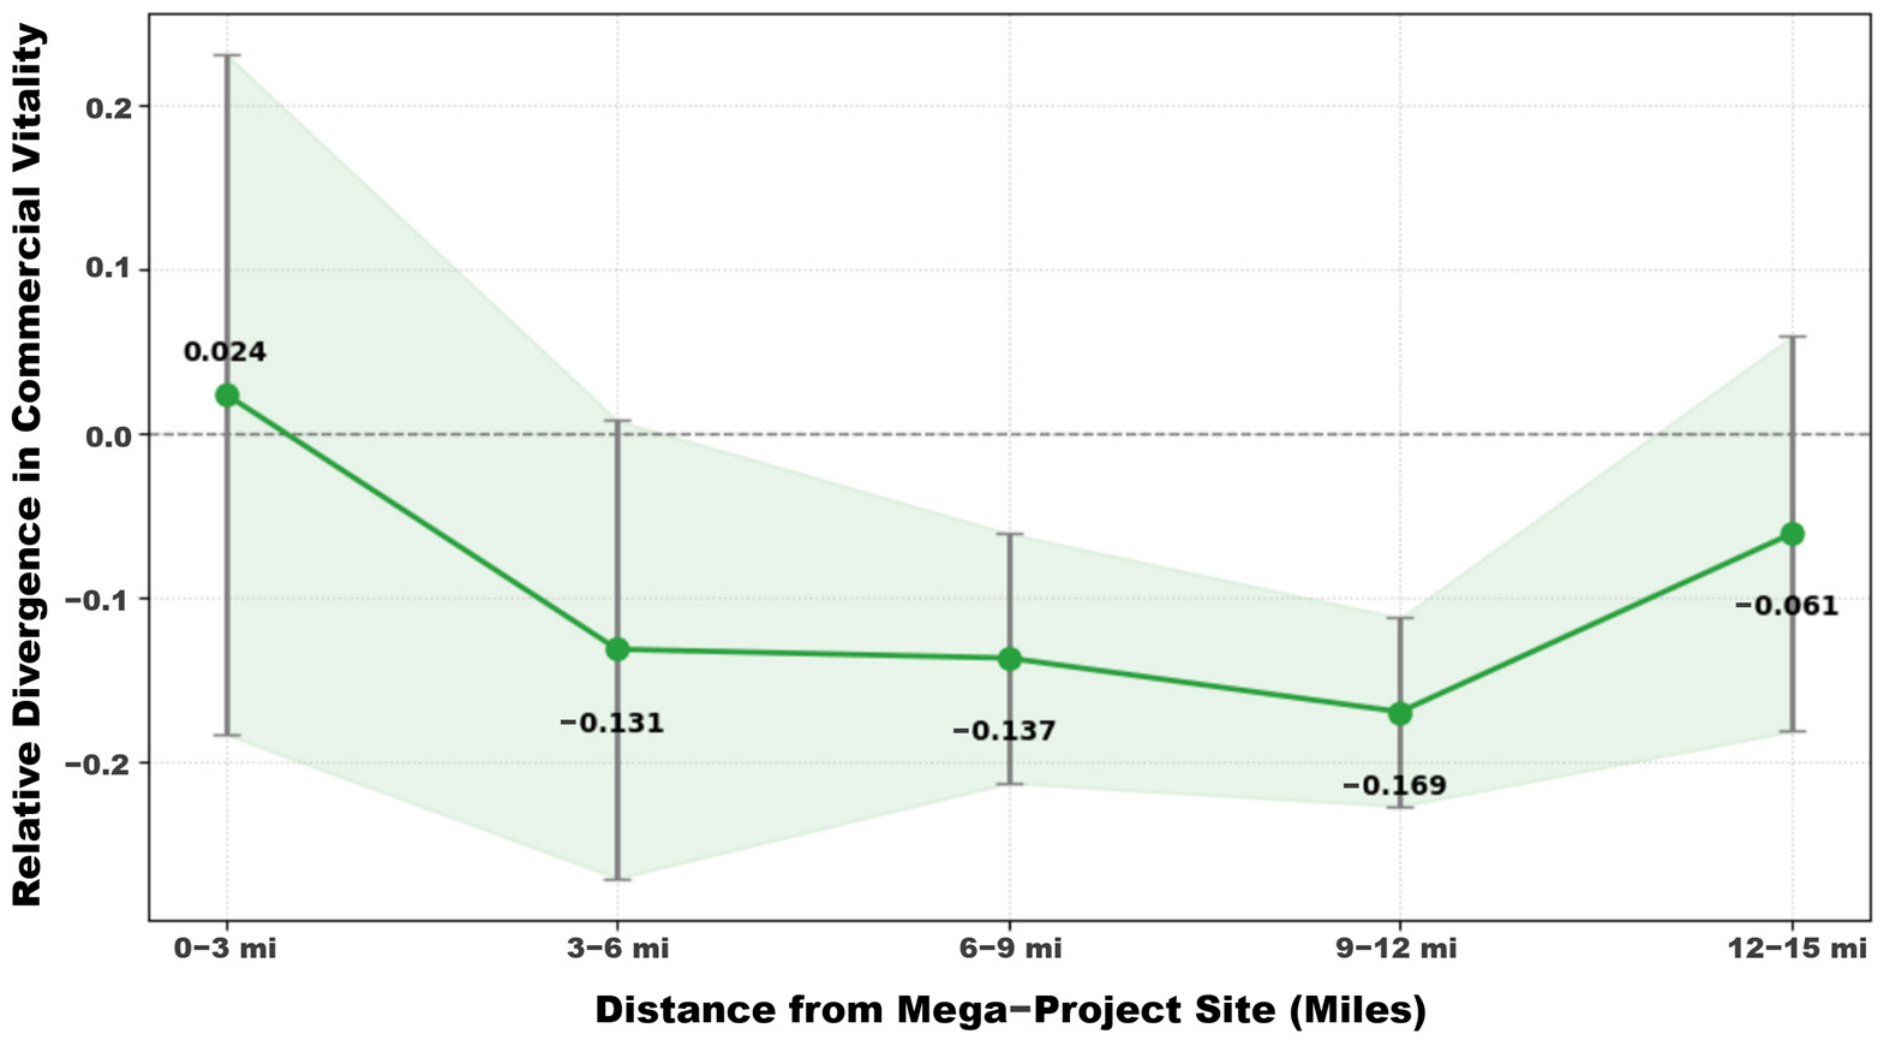
To evaluate spatial heterogeneity in activity changes, the analysis applies a distance-band stratification strategy within the 15-mile extended zone defined in
Section 2.1 [
64,
65,
66,
67]. Each POI is assigned to one of five concentric distance bands: 0–3, 3–6, 6–9, 9–12, and 12–15 miles. Distance is measured geodesically from each facility centroid. This measure captures straight-line spatial proximity and allows consistent measurement across the Phoenix and Austin study settings. It does not account for road-network distance, travel time, highway access, or route connectivity. Distances are calculated using the Haversine formula:
where
denotes Earth’s radius and
,
represent latitude and longitude coordinates.
For each distance band
and sector
(Restaurants and Supermarkets), the following specification is estimated:
where
equals 1 for observations during the early operational period beginning in January 2023. The coefficient
captures Phoenix’s relative difference from the Austin benchmark within each distance band
d and sector
k.
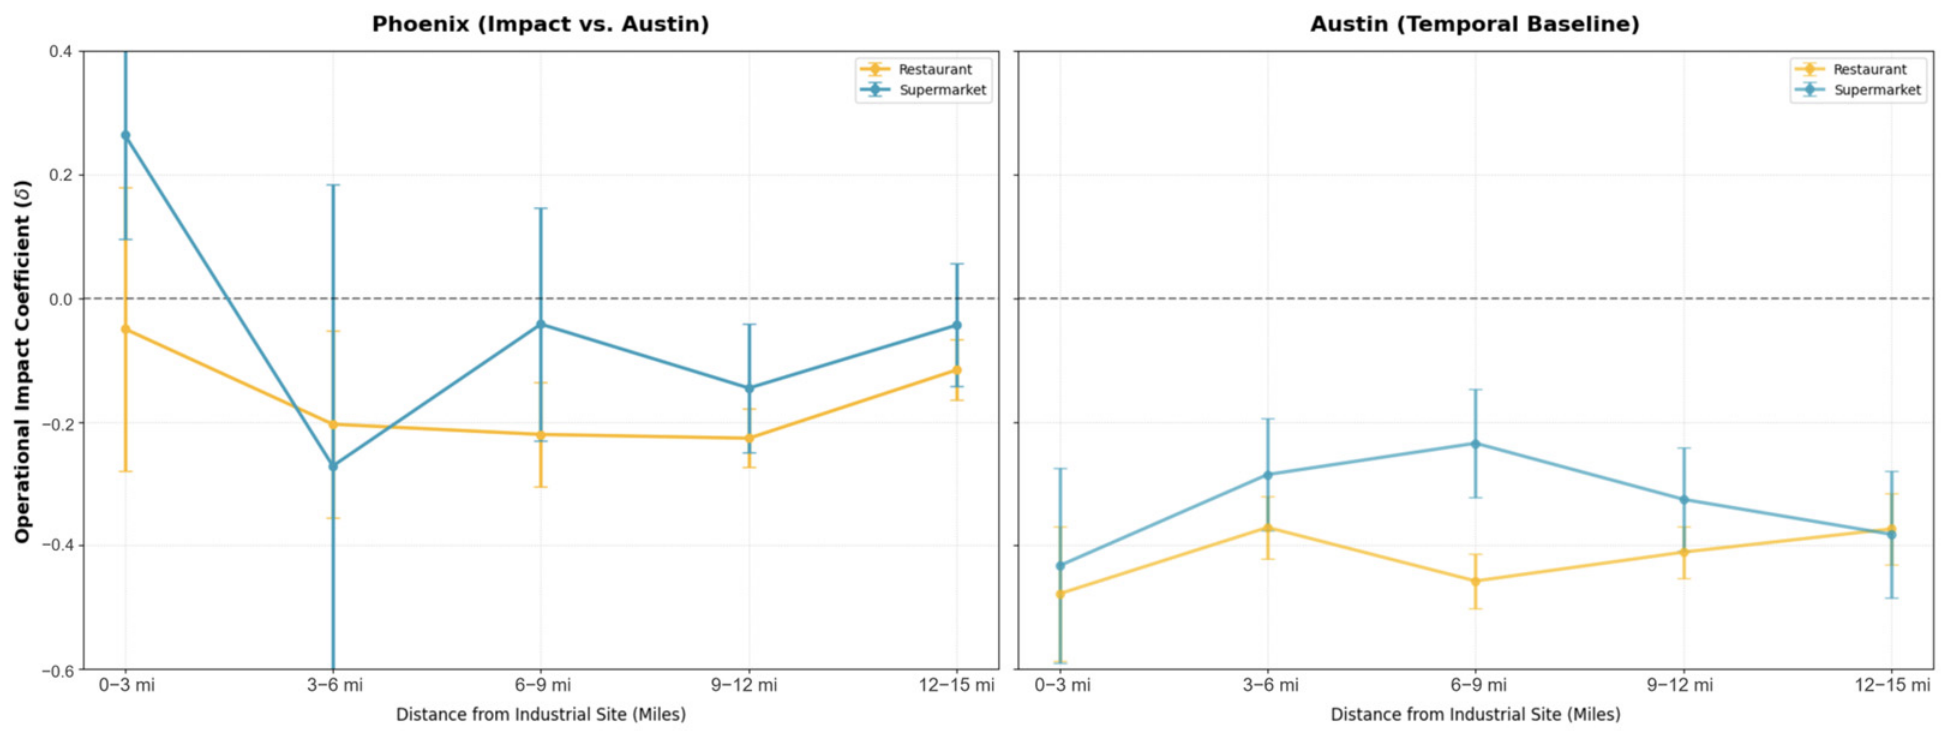
To assess whether observed spatial gradients reflect broader metropolitan temporal variation rather than localized adjustment during the early operational period, an additional benchmark specification is estimated within the Austin setting using the same distance-band and sector partitions:
where
denotes a linear temporal trend. A linear trend specification is used because the benchmark analysis is estimated within smaller distance-band subsamples and is intended to provide a parsimonious descriptive comparison of spatial variation rather than a full temporal decomposition. Spatial interpretation is based on comparing the distance-band variation observed in the Phoenix–Austin contrast with corresponding patterns estimated within the Austin benchmark setting.
2.3.3. RQ3: Sectoral and Temporal Heterogeneity Analysis
To examine whether commercial activity varied across behavioral dimensions during the early operational period, the analysis estimates additional fixed-effects specifications stratified by sector and time-of-day category [
68,
69]. These models allow relative differences between Phoenix and Austin to vary across consumption categories and daily activity periods while maintaining the same comparative framework used in the baseline models.
The specification is written as follows:
where the coefficient
captures the relative difference in localized commercial activity between the Phoenix and Austin settings during the early operational period.
The model is first estimated separately for Restaurants and Supermarkets to evaluate sectoral heterogeneity. Restaurant visitation primarily reflects discretionary, service-oriented activity, whereas supermarket visitation more closely reflects routine household-oriented consumption. Differences in estimated coefficients across these sectors indicate whether activity adjustments vary across different forms of commercial behavior.
The analysis then decomposes activity by time-of-day category. Daytime activity is defined as visits occurring between 6:00 a.m. and 7:59 p.m., while nighttime activity is defined as visits occurring between 8:00 p.m. and 5:59 a.m. This classification is intended to capture evening-oriented discretionary activity while preserving a consistent hourly threshold across both metropolitan settings and maintaining compatibility with the hourly structure of the mobility dataset. The selected threshold should therefore be interpreted as an analytical classification designed to distinguish broad daytime and nighttime activity periods, rather than as a universal definition of nighttime economic activity. All subgroup regressions retain POI fixed effects and month–year fixed effects, with standard errors clustered at the POI level to account for serial correlation within establishments over time. Estimated coefficients are interpreted as comparative differences in relative activity patterns.
4. Discussion
The results suggest that the early operational period of large-scale semiconductor fabrication facilities may coincide with differentiated patterns of surrounding commercial activity that are not fully captured by conventional expectations of agglomeration-driven spillovers. Across the temporal, spatial, sectoral, and time-of-day analyses, the findings indicate uneven changes in mobility-derived commercial activity, including relative temporal divergence, intermediate-distance declines, and larger reductions in discretionary and nighttime activity categories. Because the CVI used in this study is based on POI visitation, the findings should be interpreted as mobility-derived commercial activity patterns rather than direct measures of electricity demand, grid stress, business revenue, or establishment performance. The following sections discuss these findings in relation to temporal divergence, spatial differentiation, behavioral heterogeneity, and the broader implications of large industrial development for suburban commercial environments. Regional electricity demand is treated as contextual infrastructure information rather than as a modeled driver of commercial vitality.
4.1. Industrial Mega-Projects and the Temporal Reconfiguration of Urban Activity (RQ1)
The temporal analysis shows a sustained relative divergence in mobility-derived commercial activity around the Phoenix facility during the early operational period. This pattern should be interpreted as an observed association relative to the Austin benchmark trajectory, rather than as evidence that semiconductor activity directly caused commercial decline. The divergence may reflect a combination of facility-related transition, regional growth dynamics, post-pandemic behavioral adjustment, inflationary pressure, fuel costs, migration patterns, and broader metropolitan economic conditions.
One possible interpretation relates to the organizational characteristics of semiconductor manufacturing. Semiconductor fabrication facilities typically operate through highly controlled production systems characterized by restricted-access environments, specialized technical labor, and shift-based workforce organization. These characteristics may influence the extent to which surrounding commercial districts capture facility-related activity flows during the early operational period. However, because this study does not include worker-level demographic, residential, or commuting data, this interpretation should be understood as contextual rather than as a directly tested mechanism.
From a temporal perspective, the findings may also reflect broader adjustments in metropolitan activity rhythms. Large industrial facilities can introduce new work schedules, commuting demands, and labor mobility patterns that influence when and where surrounding commercial interactions occur. In this sense, the observed changes may reflect a reorganization of activity timing and location rather than a simple reduction in total metropolitan activity.
These findings add another dimension to debates on the local economic effects of large-scale industrial investment. Much of the economic development literature examines whether anchor firms generate employment multipliers, supplier networks, or service-sector expansion in surrounding areas. Empirical results in this literature are mixed, with spillover effects varying across regions, industries, and time horizons [
42,
43,
44,
45]. In the present study, the Phoenix–Austin divergence should be interpreted in light of the different structural conditions of the two metropolitan regions. Austin represents a more established semiconductor and advanced manufacturing region, where commercial systems may already be adapted to industrial employment, commuting rhythms, and supplier-related activity. Phoenix, by contrast, represents a greenfield industrial setting in which commercial systems, workforce flows, and suburban service environments were still developing during the study period. The observed divergence may therefore reflect both early operational transition and longer-term metropolitan structural differences, rather than a discrete operational effect alone. The contribution of the analysis is to show how high-frequency mobility indicators can reveal differences in commercial activity trajectories across structurally distinct semiconductor-adjacent metropolitan contexts.
4.2. Spatial Differentiation of Commercial Vitality Decline (RQ2)
The spatial analysis identifies a distance-dependent pattern in activity changes surrounding the semiconductor facility. The largest relative reductions in mobility-derived commercial activity appear in intermediate suburban zones approximately 6–12 miles from the facility, while areas closest to the facility show smaller and less consistent changes. This pattern should be interpreted as a spatial association rather than a direct causal effect of the facility. Intermediate suburban zones may be shaped by multiple overlapping conditions, including commuting corridors, roadway accessibility, local land-use decisions, commercial supply, residential growth, fuel costs, and shifting consumer behavior. Previous studies of large infrastructure and industrial investment have similarly documented uneven spatial outcomes across metropolitan regions, often reflecting differences in accessibility, labor markets, and local consumption structures [
46,
70,
71].
Research in urban economic geography has long emphasized the role of suburban commercial corridors and mobility-dependent service clusters in supporting everyday consumption tied to commuting and dispersed metropolitan activity [
72,
73]. Intermediate suburban zones often function as transitional commercial environments shaped by commuting flows, discretionary stopping behavior, and recurring consumer circulation. The concentration of relative decline in these areas suggests that suburban commercial systems may be especially sensitive to shifts in metropolitan mobility organization during periods of industrial transition.
Several contextual factors may be associated with this intermediate-distance pattern. Employment linked to semiconductor facilities is often organized around structured shift schedules and specialized workplace environments, which may correspond with changes in discretionary travel behavior and flexible stopping activity in nearby commercial districts. In addition, portions of workforce activity and supporting services may remain concentrated within or immediately adjacent to the industrial complex rather than dispersing outward across surrounding suburban corridors. Commercial environments that depend heavily on commuter circulation and flexible evening mobility may therefore be more exposed to changes in visitation intensity. Comparable forms of spatial redistribution have also been discussed in studies examining how major employment nodes relate to metropolitan consumption and mobility structures [
74,
75].
The Phoenix–Austin contrast further illustrates how spatial activity patterns differ across semiconductor-adjacent metropolitan environments at different stages of industrial maturity. In Phoenix, the observed decline exhibits a more concentrated intermediate-distance structure. In Austin, activity reductions appear more spatially diffuse and less strongly organized around the facility site. This difference may reflect the structural contrast between a greenfield industrial development context and a mature semiconductor region. In Austin, commercial districts, labor flows, and suburban service environments may already be integrated into a longer-standing industrial geography. In Phoenix, surrounding commercial systems may still be adjusting to emerging industrial land development, workforce growth, and changing suburban mobility patterns. For this reason, the spatial contrast should be interpreted as evidence of different metropolitan structural conditions and activity geographies, rather than as a direct measure of facility impact alone.
More broadly, the findings suggest that the urban implications of large industrial mega-projects may extend beyond the immediate facility footprint. The observed activity changes do not radiate outward in a simple concentric manner. Instead, they appear selectively concentrated within suburban environments positioned between industrial cores and broader residential territories. This spatial selectivity highlights the importance of examining how industrial infrastructure interacts with existing metropolitan mobility systems, suburban commercial dependency, and everyday commuting geographies. Recent research on urban infrastructure and metropolitan restructuring has similarly emphasized the differentiated suburban consequences of large-scale infrastructural investment [
76,
77].
4.3. Behavioral Adjustment and the Uneven Sensitivity of Urban Activities (RQ3)
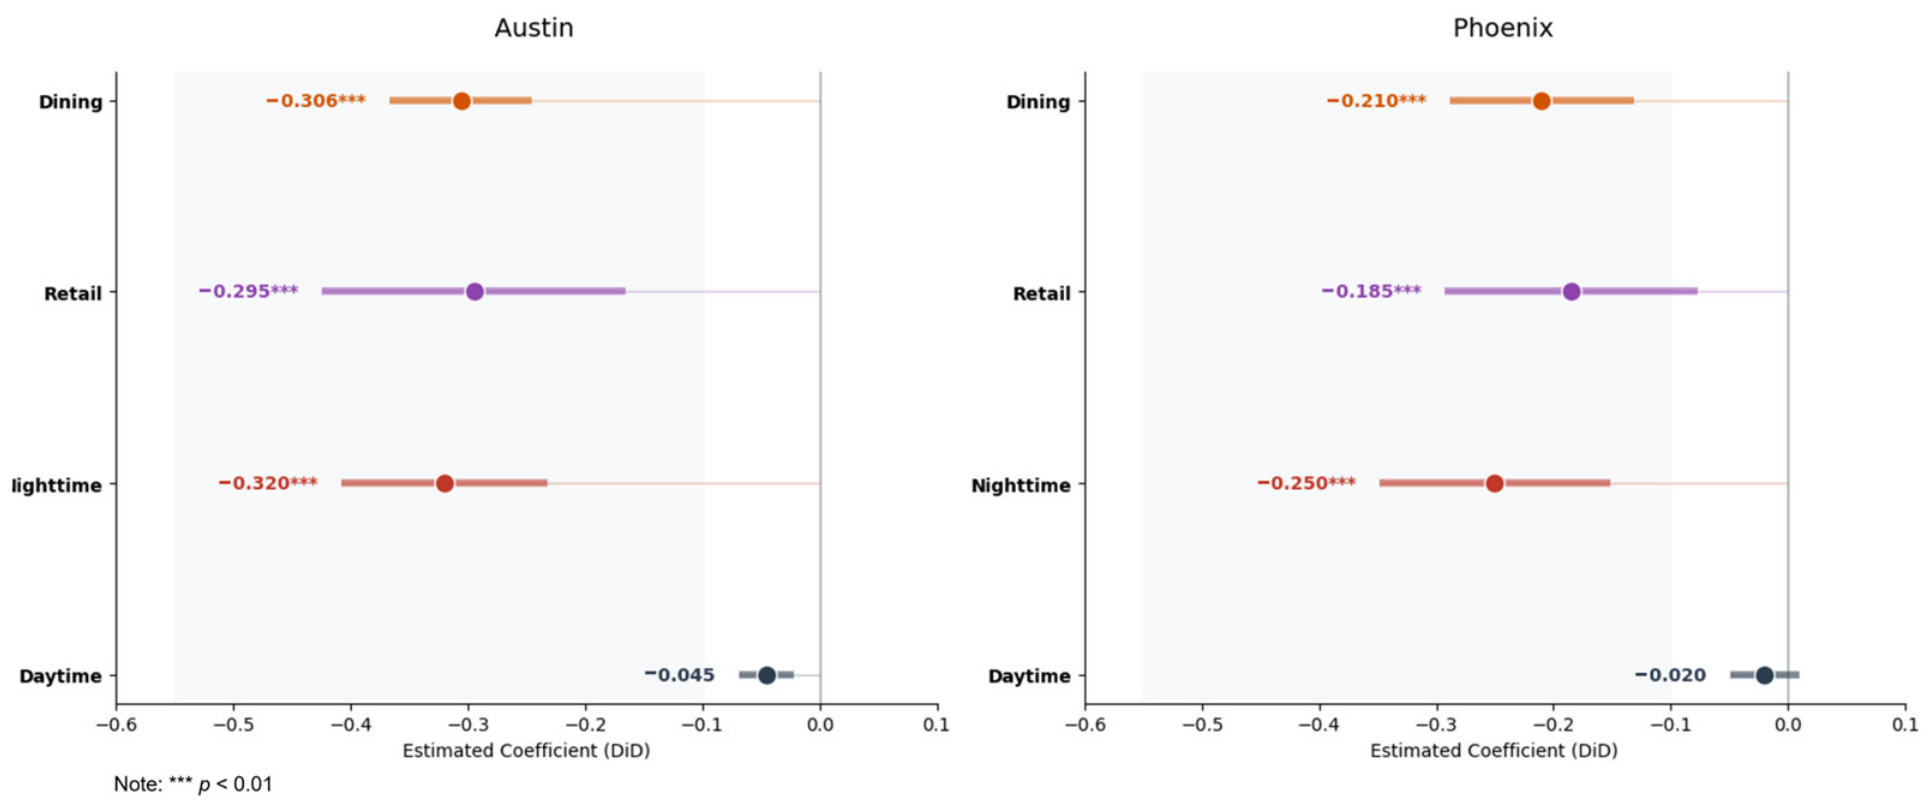
Beyond the spatial gradient, the analysis reveals heterogeneity in how different types of urban activity changed during the early operational period. In both metropolitan settings, service-oriented sectors, especially dining, show larger reductions than retail-related activity, while daytime activity remains more stable than nighttime activity. This pattern suggests a shared behavioral hierarchy across the two metros: discretionary and evening-oriented activities appear more sensitive than routine retail and daytime activity [
78,
79]. At the same time, the coefficients in
Figure 9 are larger in absolute magnitude for Austin than for Phoenix across most categories. The distinction between the two metros should therefore not be framed as Phoenix experiencing uniformly stronger activity decline across all behavioral categories. Instead, the main Phoenix-specific pattern is spatial: relative decline is more concentrated in intermediate suburban zones, whereas Austin shows a more diffuse pattern of activity reduction.
The stronger reductions observed in dining and nighttime activity provide insight into the uneven behavioral sensitivity of different urban functions. Restaurants and evening-oriented activities depend heavily on flexible schedules, spontaneous social interaction, and discretionary mobility. In contrast, daytime activities associated with routine errands, employment, or essential services generally follow more stable temporal structures. Research on urban time use and everyday mobility similarly emphasizes that discretionary social activities tend to cluster in flexible evening periods, whereas employment-related and household-oriented activities often remain more temporally stable [
79].
The decline in nighttime activity further reinforces this interpretation. Evening and late-night activities typically depend on dispersed mobility patterns, flexible social schedules, and informal urban interaction, all of which may be more sensitive to changes in commuting behavior and work organization associated with large industrial employment systems. Studies of nighttime economies have similarly emphasized the importance of temporal flexibility and informal mobility in sustaining evening urban activity [
80,
81,
82,
83,
84,
85]. In this context, structured shift schedules and concentrated workplace environments may reduce the frequency or spatial distribution of discretionary evening activities across surrounding commercial districts.
Overall, the behavioral results indicate that mobility-derived commercial activity changed unevenly across sectors and time periods during the early operational period. These differences should be interpreted as descriptive and comparative patterns rather than confirmed behavioral mechanisms. Dining and nighttime activity may be more sensitive to flexible mobility, discretionary time use, and changing urban rhythms, but the present analysis cannot distinguish facility-related effects from broader shifts in consumption, inflation, delivery use, pandemic-era behavioral adjustment, or regional economic change.
4.4. Implications for Urban Economic Geography and Infrastructure Planning
The findings contribute to a broader understanding of how large-scale industrial investments interact with the spatial and temporal organization of metropolitan activity. While economic development strategies often emphasize the regional growth potential of industrial mega-projects, the present results suggest that such developments may also be associated with localized adjustments in commercial activity that are less visible in conventional analyses of industrial development.
From the perspective of urban economic geography, the results highlight the importance of examining how major industrial infrastructures relate to existing patterns of mobility, consumption, and temporal activity organization. The observed spatial gradients and behavioral differences suggest that the implications of industrial development may extend beyond employment and production metrics to include changes in the distribution of commercial activity across suburban space, sectors, and daily time periods. Methodologically, the study demonstrates how high-frequency mobility data can be used to examine spatiotemporal variation in commercial vitality around major industrial developments, offering a complementary perspective to traditional employment- or output-based approaches used in regional economic analysis.
These findings also carry implications for infrastructure and urban planning. As metropolitan regions increasingly compete to attract large-scale manufacturing investment, especially in semiconductor production, integrating industrial facilities into surrounding urban systems becomes an important planning challenge. Planning strategies focused primarily on industrial output, employment generation, or land provision may overlook how such facilities interact with surrounding mobility patterns, commercial activity, and suburban service environments.
Recognizing these dynamics may support more integrated planning approaches that consider not only the economic benefits of industrial development but also its broader spatial and behavioral implications for surrounding metropolitan communities. In particular, the results highlight the importance of temporal activity structures, suburban commercial dependency, and mobility-sensitive service sectors when evaluating the wider urban consequences of large-scale industrial infrastructure investment. At the same time, commercial vitality in peri-urban environments is shaped by many factors beyond industrial development alone. Local zoning decisions, roadway accessibility, housing growth, business openings and closures, consumer preferences, inflationary pressure, delivery and online consumption, and broader metropolitan economic conditions may all influence POI visitation patterns. The findings should therefore be interpreted as observed spatiotemporal associations during the early operational period rather than as a complete explanation of all changes in surrounding commercial activity.
Several planning instruments may help translate these findings into practice. Local governments could coordinate phased commercial licensing with industrial ramp-up schedules to support restaurants, retail, and service uses as workforce activity gradually expands. Temporary or flexible-use permitting could help test demand for food service, convenience retail, and evening-oriented activity before permanent development patterns are fixed. In intermediate suburban zones where declines in mobility-derived activity appear more pronounced, targeted small-business support, wayfinding improvements, transit or shuttle coordination, and mixed-use zoning adjustments may help strengthen connections between industrial employment nodes and surrounding commercial districts. Because several estimated coefficients correspond to double-digit percentage changes in mobility-derived activity, these interventions are most relevant to intermediate suburban commercial areas, where even modest reductions in visitation frequency may affect customer exposure, staffing needs, and the timing of service demand.
4.5. Limitations
Several limitations should be acknowledged. First, the study relies on mobility-derived POI visitation as a proxy for localized commercial activity. Although this measure captures high-frequency changes in consumption-oriented activity, it does not directly measure business revenue, retail sales, tax receipts, profitability, or spending per visit. It also cannot fully capture changes associated with delivery services, online consumption, establishment-level pricing, or demographic shifts. Future research incorporating independent economic datasets, such as business tax receipts, retail sales, platform-based activity measures, or establishment-level revenue records, could further validate the relationship between POI visitation and commercial performance.
Second, the empirical design is comparative and exploratory rather than strictly causal. Phoenix and Austin differ in their long-term metropolitan and industrial structures: Austin is a more established semiconductor region, whereas Phoenix represents a greenfield industrial development context. These structural differences, together with the statistically significant pre-period coefficients, indicate that the two trajectories cannot be treated as fully comparable in the strict causal sense required by a conventional DiD design. The estimated coefficients are therefore interpreted as relative divergence patterns rather than definitive causal effects. Future work could strengthen causal inference by incorporating additional benchmark regions, matched comparison areas, placebo breakpoints, month-level event-study specifications, or synthetic control approaches. Relatedly, the study does not model the determinants of facility siting. Pre-existing commercial vitality, land availability, infrastructure capacity, local incentives, or broader development expectations may have influenced where semiconductor facilities were located.
Third, the analysis cannot directly identify the behavioral mechanisms underlying the observed patterns. Interpretations related to mobility restructuring, commuting behavior, shift-based labor organization, or workforce-related activity flows remain contextual rather than directly measured. Finer-grained mobility, commuting, employment, worker-residence, and workforce demographic datasets would help clarify how facility-related labor organization intersects with surrounding commercial activity.
Fourth, the spatial analysis relies on geodesic distance from each semiconductor facility to surrounding POIs. This approach provides a consistent facility-centered proximity measure across both metropolitan settings, but it does not capture road-network distance, travel time, highway accessibility, or route-based connectivity. The observed distance-band patterns should therefore be interpreted as spatial proximity gradients rather than network accessibility effects. Future research could test the sensitivity of these findings using network distance, travel-time catchments, or route-based accessibility measures. Finally, because the study focuses on only two semiconductor-adjacent metropolitan contexts, the findings should not be treated as universally representative of all industrial facilities or all semiconductor regions. Additional case studies across different industries, metropolitan areas, and stages of facility development would help evaluate the broader applicability of the observed patterns.
5. Conclusions
This study examined how the early operational period of large semiconductor manufacturing facilities is associated with changes in mobility-derived commercial activity across metropolitan regions. Using a comparative DiD framework, distance-band analysis, and sectoral-temporal stratification, the study identifies three main patterns. First, Phoenix shows a sustained relative divergence in mobility-derived commercial activity compared with the Austin benchmark trajectory. Second, this divergence is spatially uneven, with the strongest relative reductions concentrated in intermediate suburban zones rather than immediately adjacent to the industrial site. Third, activity changes vary across sectors and time periods, with dining and nighttime activity showing larger reductions than retail and daytime activity.
These findings should be interpreted as comparative spatiotemporal associations rather than definitive causal effects of semiconductor facility development. The analysis does not fully control for all metropolitan-level confounders, including inflation, post-pandemic behavioral shifts, migration patterns, fuel costs, regional labor market changes, or broader macroeconomic conditions. Nevertheless, the study demonstrates how high-frequency POI mobility data can reveal localized activity patterns that are not captured by conventional employment- or output-based measures. As metropolitan regions continue to pursue large-scale manufacturing investments, planning strategies may benefit from monitoring surrounding commercial activity, mobility structure, and temporal activity patterns alongside conventional indicators of industrial output and employment growth.