1. Introduction
In recent years, China has made remarkable progress in tunnel engineering, supporting the strategic transformation from a major tunnel-building country to a tunnel powerhouse [
1]. Intelligent tunnel construction has emerged as a key focus of engineering development, representing an inevitable trend to enhance the quality and efficiency of railway and highway projects amid new circumstances [
2]. During tunnel drilling and blasting operations, post-blast challenges include difficulty in rapidly assessing tunnel face concavity/convexity, complexity in measuring the resistance line accurately, dispersed blast piles, and oversized rock fragments. These issues directly impact subsequent construction progress and the optimization of blasting quality [
3].
Currently, the assessment of blasting effectiveness mainly relies on manual experience and partial instrumentation. Field technicians typically perform qualitative assessments of blasting effects by visually inspecting the rock face profile, fracture distribution, and over-excavation or under-excavation. They also use tools such as straight edges to measure local flatness. These observations are then used to evaluate the blasting outcomes. On the one hand, this approach is not only highly subjective and inefficient but also fails to yield comprehensive, quantitative information about the entire rock face [
4]. Although modern surveying technologies, such as total stations [
5] and 3D laser scanning [
6], can provide more accurate data, their operation often requires site clearance. Additionally, these methods involve complex setup procedures and high costs. On the other hand, traditional methods have significant limitations in characterizing internal rock structures and accurately depicting the concave and convex morphology of the tunnel face. As a result, they cannot provide sufficient data support for the precise optimization of subsequent blasting parameters. As tunnel construction scales expand and geological conditions grow increasingly complex, the limitations of traditional methods become ever more pronounced. There is an urgent need to introduce a new, efficient, precise, and non-contact technique for evaluating the quality of the tunnel face. Over the past few years, the rapid advancement of computer vision technology has provided entirely new approaches to addressing the aforementioned issues [
7]. One of the most prominent advantages of multi-view geometry-based 3D reconstruction lies in its exceptionally low hardware requirements. It does not rely on expensive 3D scanners. Instead, the true 3D spatial model of the object can be reconstructed using visual algorithms with a standard digital camera and a computer [
8]. This technical approach, which relies on consumer-grade hardware and advanced software algorithms, significantly reduces the cost of acquiring 3D digitization technology. As a result, it has great potential for large-scale deployment in applications such as on-site engineering monitoring.
Scholars, both domestically and internationally, have undertaken valuable explorations in this interdisciplinary field. Early research primarily focused on using photogrammetry for tunnel deformation monitoring or crack detection. For instance, Zhang et al. [
9] investigated a tunnel deformation monitoring method based on 3D laser scanning and Ji Kun [
10] studied a deep learning-based tunnel crack detection technique. In the area of 3D reconstruction, Li et al. [
11] demonstrated high-fidelity 3D scene recovery from multi-view RGB imagery, while Wang et al. [
12] developed an efficient learning-based multi-view stereo approach for high-resolution dense reconstruction with reduced memory and computational demands. Specifically for tunnel face analysis, Cao Yong [
13] proposed a method to calculate the joint volume index (Jv) of rock mass based on 3D geometric images of the tunnel face; Zhu Hehua et al. [
14] summarized research progress in collecting and identifying rock mass structural plane information; Li Chimou et al. [
15] explored rapid grading techniques for tunnel face surrounding rock using 3D reconstruction and the UNet neural network; Mehrishal et al. [
16] developed an automatic rock mass classification system based on digital tunnel face mapping, enabling automated and visualized extraction and digital archiving of geological information, thereby reducing reliance on traditional manual sketching and subjective field interpretation. Xian Qingyu et al. [
17] proposed a method for tunnel face image quality assessment based on deep convolutional neural networks (CNNs). By constructing a large-scale face image dataset and employing the Keras deep learning framework to train and compare multiple classical CNN algorithms, this research achieved automatic screening of high-quality images that meet engineering requirements from vast image collections. Ultimately, it realized the objective of automatically generating face sketches. Moreover, scholars both domestically and internationally have employed diverse methodologies for the intelligent identification of tunnel blasting outcomes, aiming to enhance the speed and precision of blasting effect recognition to subsequently optimize blasting schemes. Zou Baoping et al. [
18] established a comprehensive evaluation system for tunnel blasting quality, developing a visualized assessment method based on 3D digital models. Zhang Wanzhi et al. [
19] proposed a method for optimizing reaming hole blasting parameters. Yang Rui et al. [
20] presented an optimized blasting parameter scheme for smooth blasting tunnel projects. Liu Qingfeng et al. [
21] introduced a method for determining blasting parameters based on real-time rock mass perception, coupled with an intelligent borehole layout approach. Wang et al. [
22] developed a numerical analysis method to quantify the key factors influencing smooth blasting outcomes. Gong Min et al. [
23] conducted high-speed image acquisition at tunnel blasting sites to study precise parameter control. Xie Chaoqun et al. [
24] optimized blasting schemes for tunnel excavation in large-section tunnels with soft rock formations. However, existing research still faces a series of challenges when applied to the precise identification of tunnel blasting effects. Firstly, the harsh conditions within tunnels—such as uneven lighting and dust interference—place higher demands on image acquisition quality, necessitating the establishment of standardized image capture procedures and effective image enhancement and denoising methods. Secondly, repetitive rock textures and sparse features at the tunnel face frequently cause traditional feature matching algorithms to generate numerous false matches, directly compromising the accuracy and reliability of 3D reconstruction models. Furthermore, a systematic technical framework remains lacking for automatically and quantitatively extracting metrics directly relevant to blast effect evaluation from 3D point clouds or mesh models, thereby guiding the optimization of blasting parameters. Most existing approaches remain confined to the model visualization stage, failing to integrate deeply with blasting engineering practice to form a closed-loop optimization design process. Consequently, constructing a comprehensive technical framework—spanning image acquisition, high-precision 3D reconstruction, intelligent recognition, and parameter optimization—holds significant theoretical and engineering value.
In current practice, mainstream tunnel blasting assessment technologies typically include total-station or target-based surveying for local contour checks, terrestrial laser scanning (TLS) for dense geometry capture, and image-based approaches (photogrammetry or learning-based image interpretation) for rapid on-site documentation. In terms of assessment accuracy, TLS generally provides high geometric fidelity but requires relatively expensive equipment and site clearance; total stations are low-cost but deliver sparse, point-wise measurements; learning-based methods can be efficient for specific visual tasks but depend on labeled data and may not directly output metrically consistent 3D geometry. In contrast, the proposed multi-view reconstruction framework targets a practical balance: consumer-grade imaging with standardized acquisition and robust matching enables metrically meaningful 3D models for whole-face evaluation, while maintaining low hardware cost and minimal interruption to tunnel operations. A qualitative comparison is summarized in
Table 1.
Motivated by these limitations and by the engineering needs of the Huangtai Tunnel and Donghongshan Tunnel projects, this study investigates whether multi-view geometry-based 3D reconstruction can provide a reliable, low-cost, and non-contact basis for quantitative tunnel face blasting assessment and subsequent blasting parameter optimization under field conditions.
The core scientific problem is how to transform tunnel face blasting evaluation from an experience-driven and locally measured practice into a reproducible, quantitative, and feedback-enabled process that remains robust under adverse tunnel imaging conditions, such as dust and uneven illumination, yields metrically meaningful 3D models on feature-sparse and texture-repetitive rock surfaces, and converts reconstructed geometry into indices that can directly support blasting design adjustment.
To this end, the main contribution of this study is framework-level rather than algorithm-level. Specifically, (i) established multi-view reconstruction techniques are embedded into a standardized tunnel face image acquisition and preprocessing workflow to improve field usability under dust, uneven illumination, and repetitive rock textures; (ii) the reconstructed model is transformed from a visualization output into blasting-relevant geometric indicators, including structural-plane grouping, structural-trace statistics, and curvature-based flatness classification; (iii) these indicators are explicitly linked to blasting parameter adjustment, forming a closed-loop process from tunnel face perception and evaluation to design feedback; and (iv) the workflow is verified in the Huangtai Tunnel and Donghongshan Tunnel cases, demonstrating that geometric irregularities identified from reconstruction can support the practical optimization of cut-hole and auxiliary-hole parameters. Compared with existing 3D reconstruction-based studies that mainly focus on how to reconstruct or document the tunnel face, the proposed framework further addresses how reconstructed geometry can be used to evaluate blasting quality and guide subsequent blasting design adjustment.
2. Materials and Methods
This study adopts an established reconstruction framework composed of multi-view 3D reconstruction (SfM + CMVS/PMVS + Poisson), SIFT-based feature extraction, BBF/K-D tree nearest-neighbor search, and RANSAC-based mismatch rejection as the core technical pipeline. On this basis, tunnel-oriented adaptations were introduced in image acquisition, preprocessing, and robust matching parameter settings to improve workflow stability under adverse field conditions such as dust and uneven illumination. The reconstructed geometry was then further transformed into blasting-relevant quantitative indices, which were used to support closed-loop blasting evaluation and parameter adjustment.
2.1. Multi-View 3D Reconstruction Workflow
The input data for 3D reconstruction is a set of images taken by a camera at different unknown positions. During imaging, 3D points are mapped onto a two-dimensional image plane [
25]. When reconstructing the 3D model, these points are back-projected into 3D space by calculating the camera pose at the time of capture. The multi-view geometric 3D reconstruction process has three main parts: image preprocessing, feature extraction and matching, and 3D point cloud reconstruction [
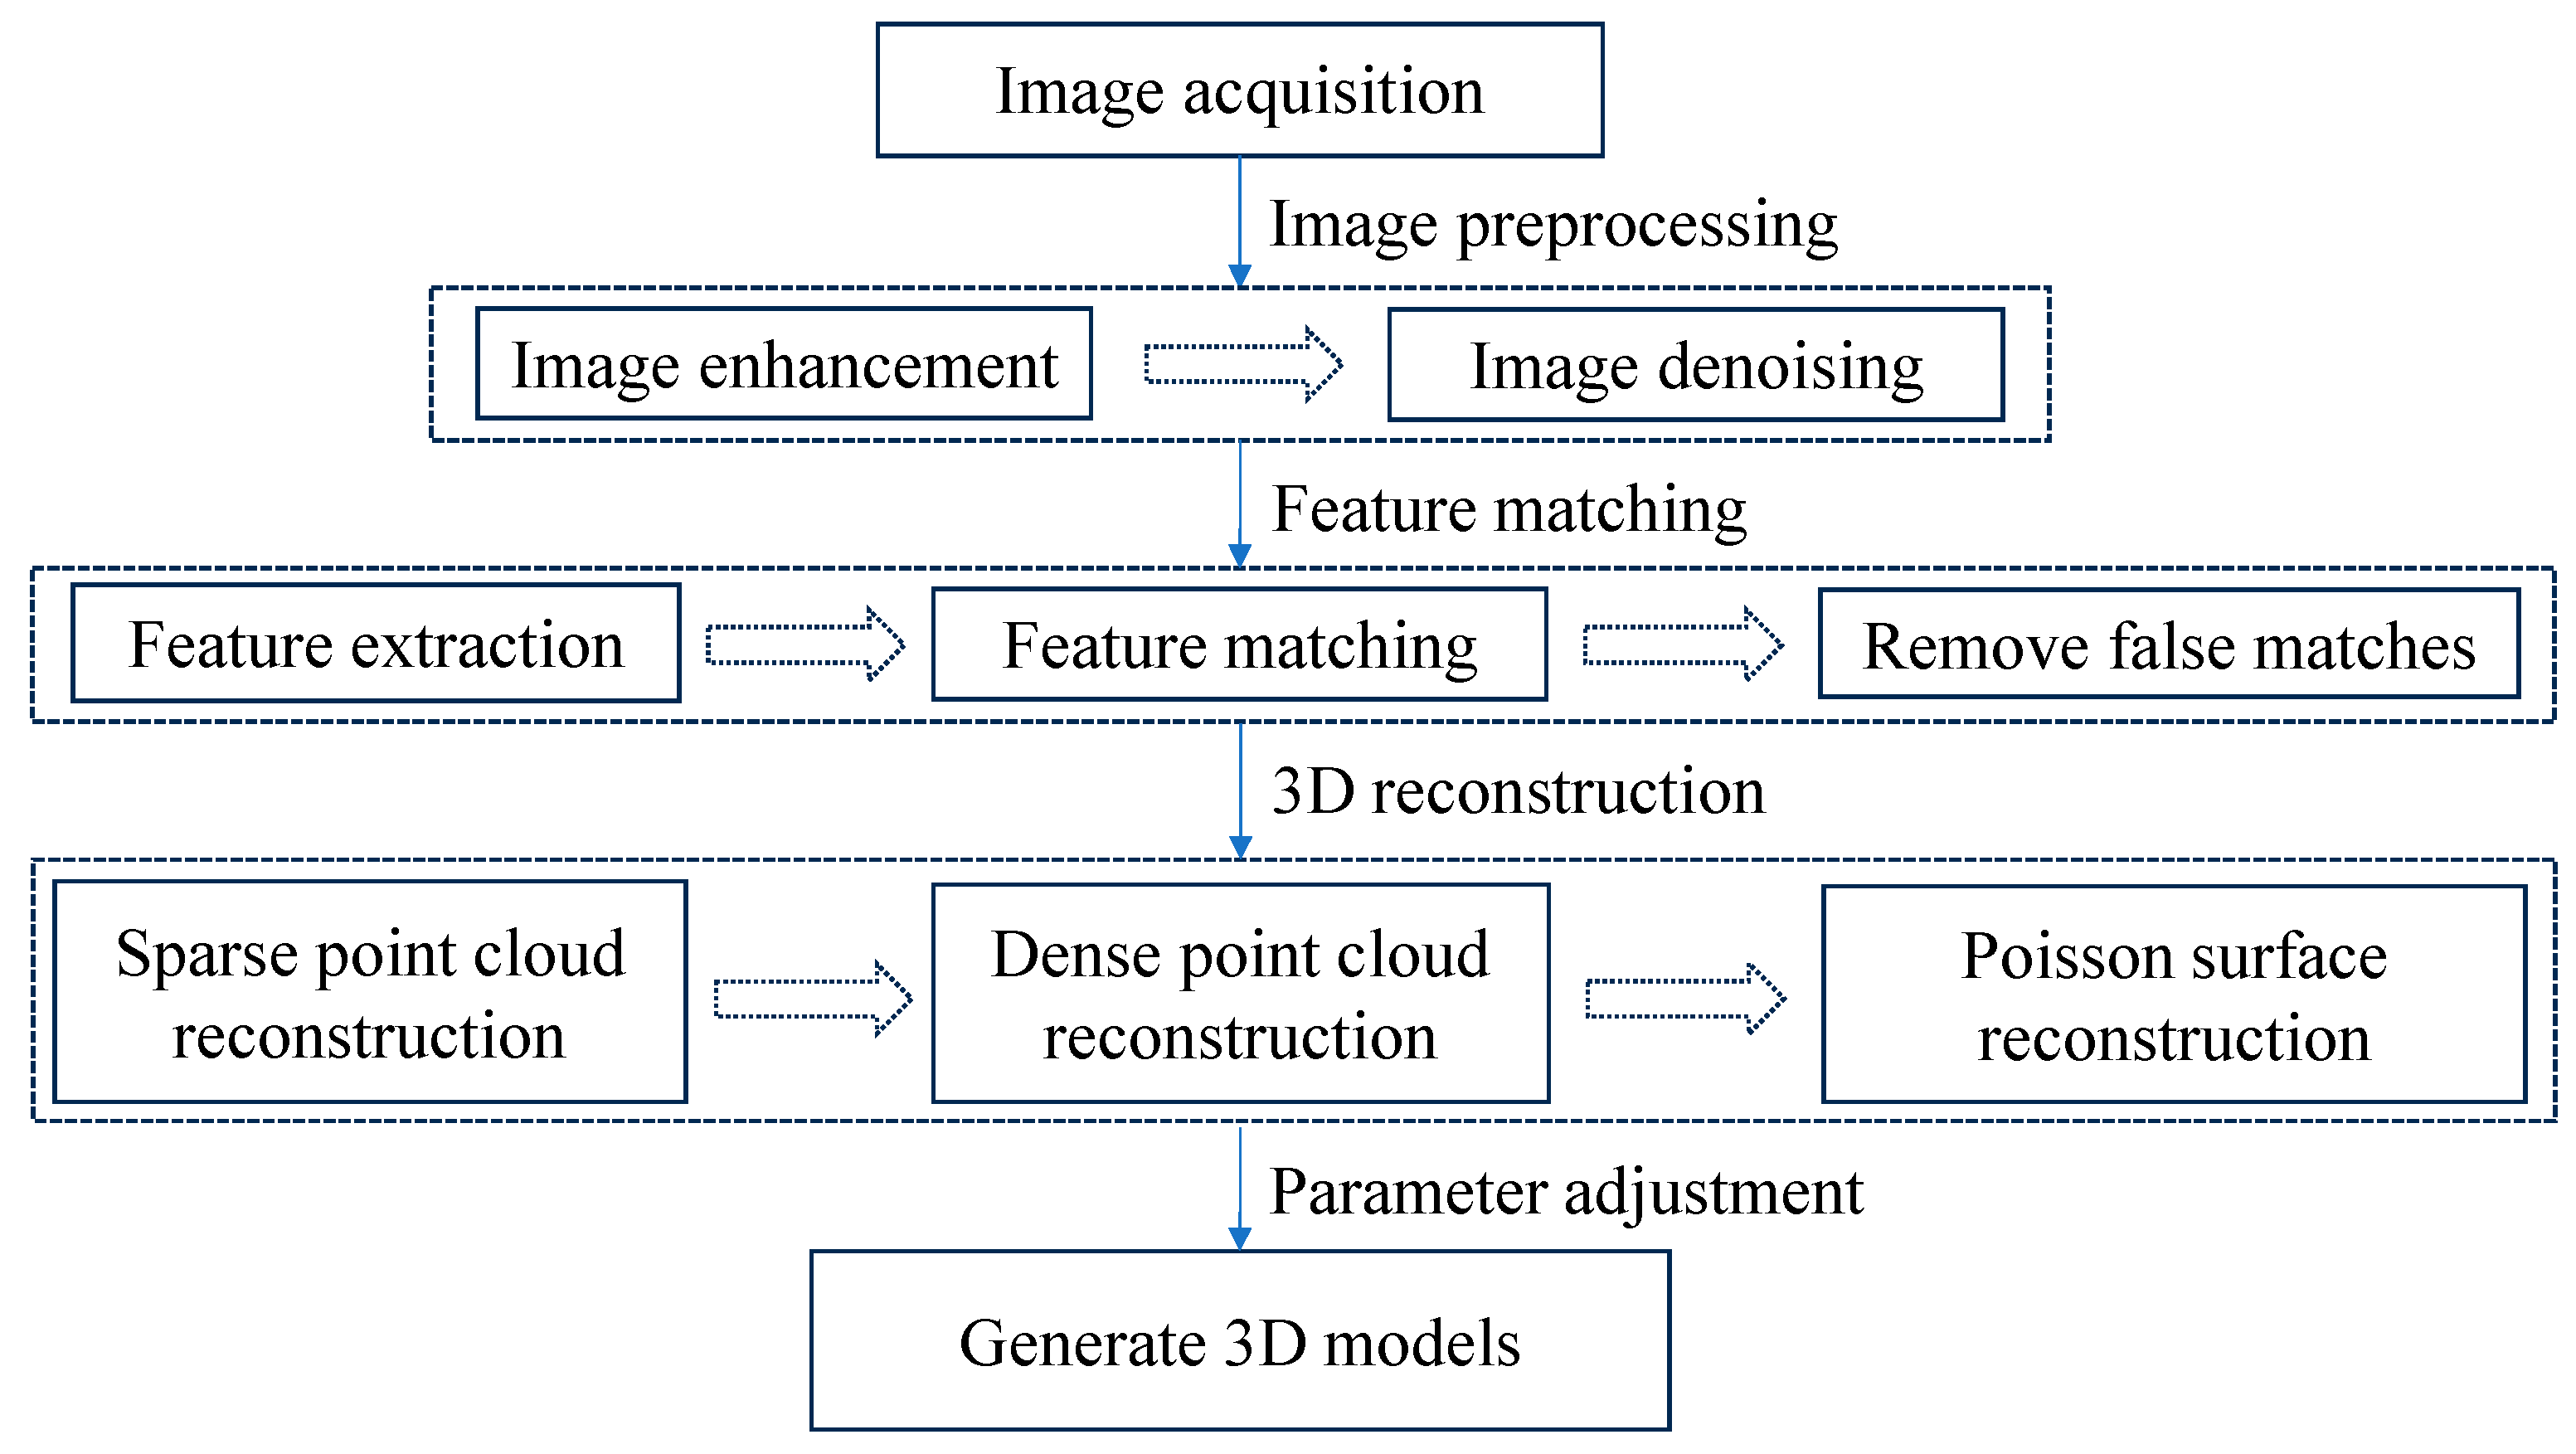
26].
Figure 1 illustrates the specific workflow.
2.2. Image Acquisition
2.2.1. Camera Calibration
A standard checkerboard-based Zhang calibration was conducted to estimate intrinsics and distortion parameters, and the calibration quality was validated using the reprojection-error distribution together with the recovered camera poses [
27]. The resulting parameters were used for image undistortion prior to SfM/BA.
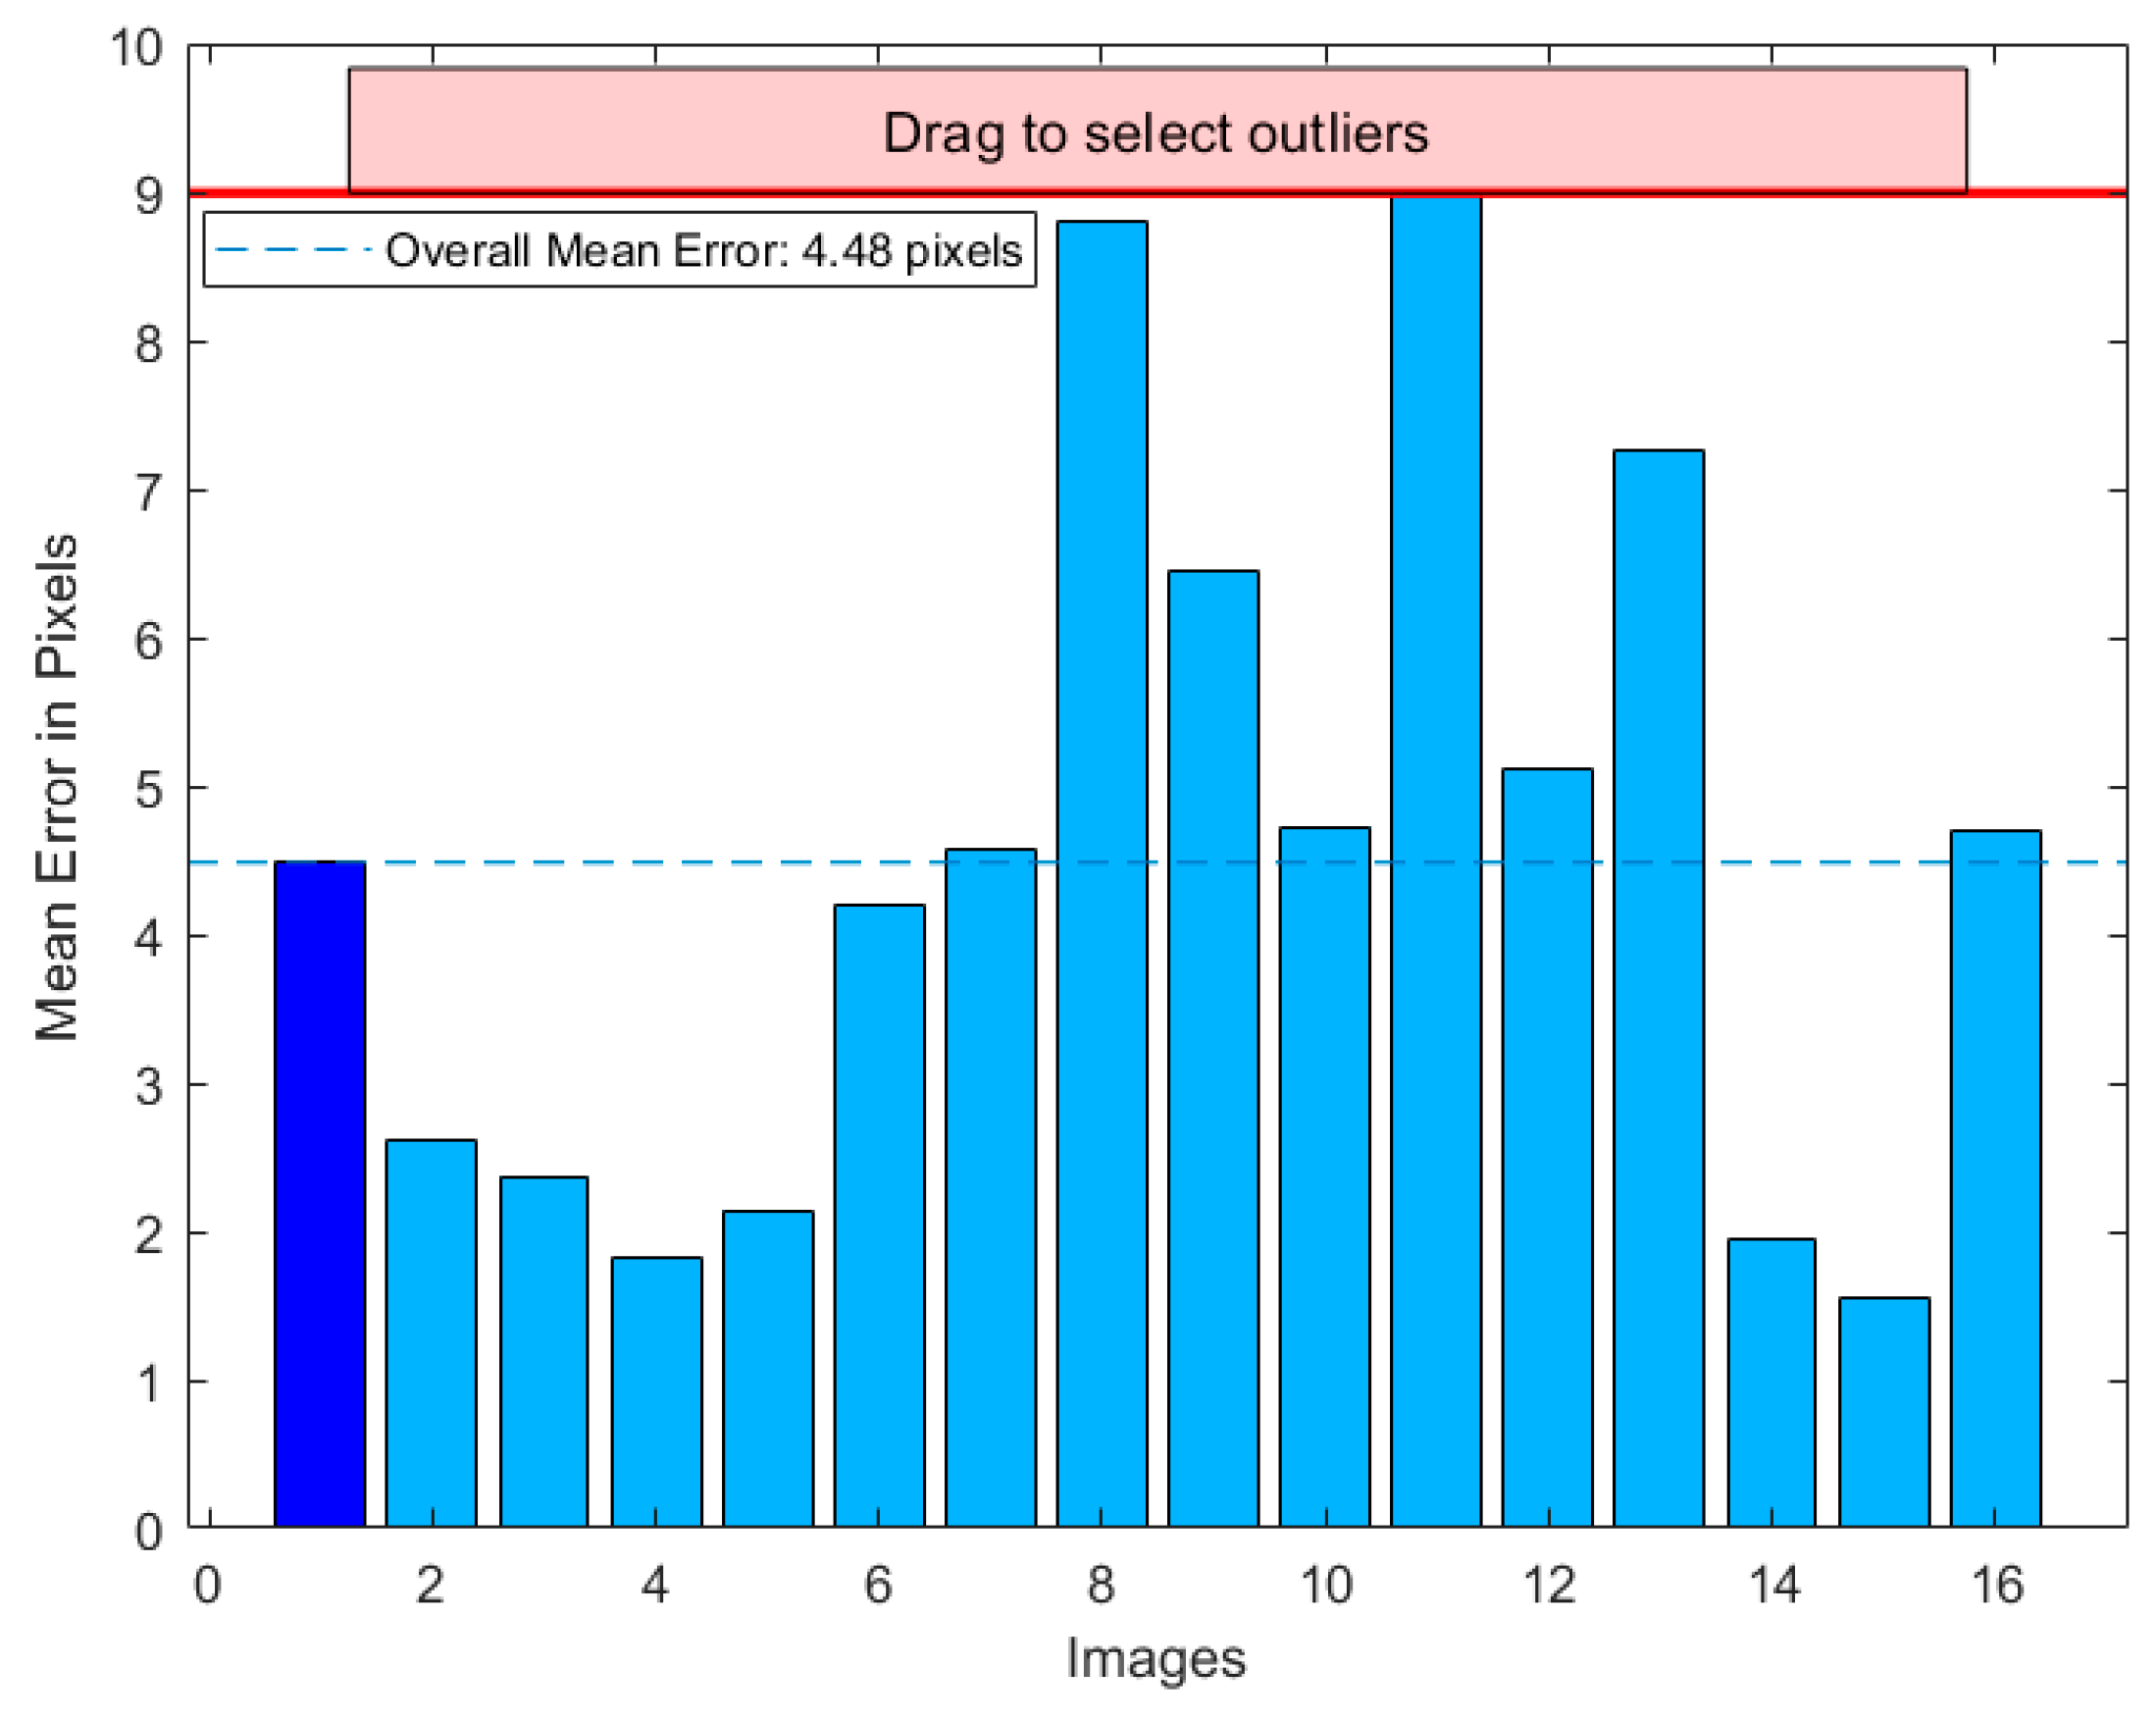
Following Zhang Zhengyou’s calibration algorithm, four sets of images with varying quantities were selected for comparative experiments. The distribution of camera reprojection errors is illustrated in
Appendix A Figure A1, while the visualization of extrinsic parameters is presented in
Appendix A Figure A2.
Combining the results of the camera’s intrinsic parameter calculations with the reprojection error map reveals that as the number of input images increases, the discrepancy between the predicted pixel positions and the actual observed positions gradually diminishes. The magnitude of the reprojection error directly reflects the calibration accuracy, with smaller error values indicating more precise calibration results. The external parameter visualization provides an intuitive representation of the camera’s position and orientation within 3D space. By comparing the calculated external parameter data with actual scene parameters, a minimal discrepancy is observed, further validating the reliability of the calibration results. According to the calibration results, the final intrinsic parameter matrix of the camera is obtained as follows:
2.2.2. Collection Design
The overlap ratio and camera-step spacing were designed to provide sufficient parallax and tie-point redundancy for robust SfM/BA while maintaining a practical image volume for field deployment. Their suitability was evaluated using reconstruction stability metrics and the completeness of the reconstructed tunnel face model [
28].
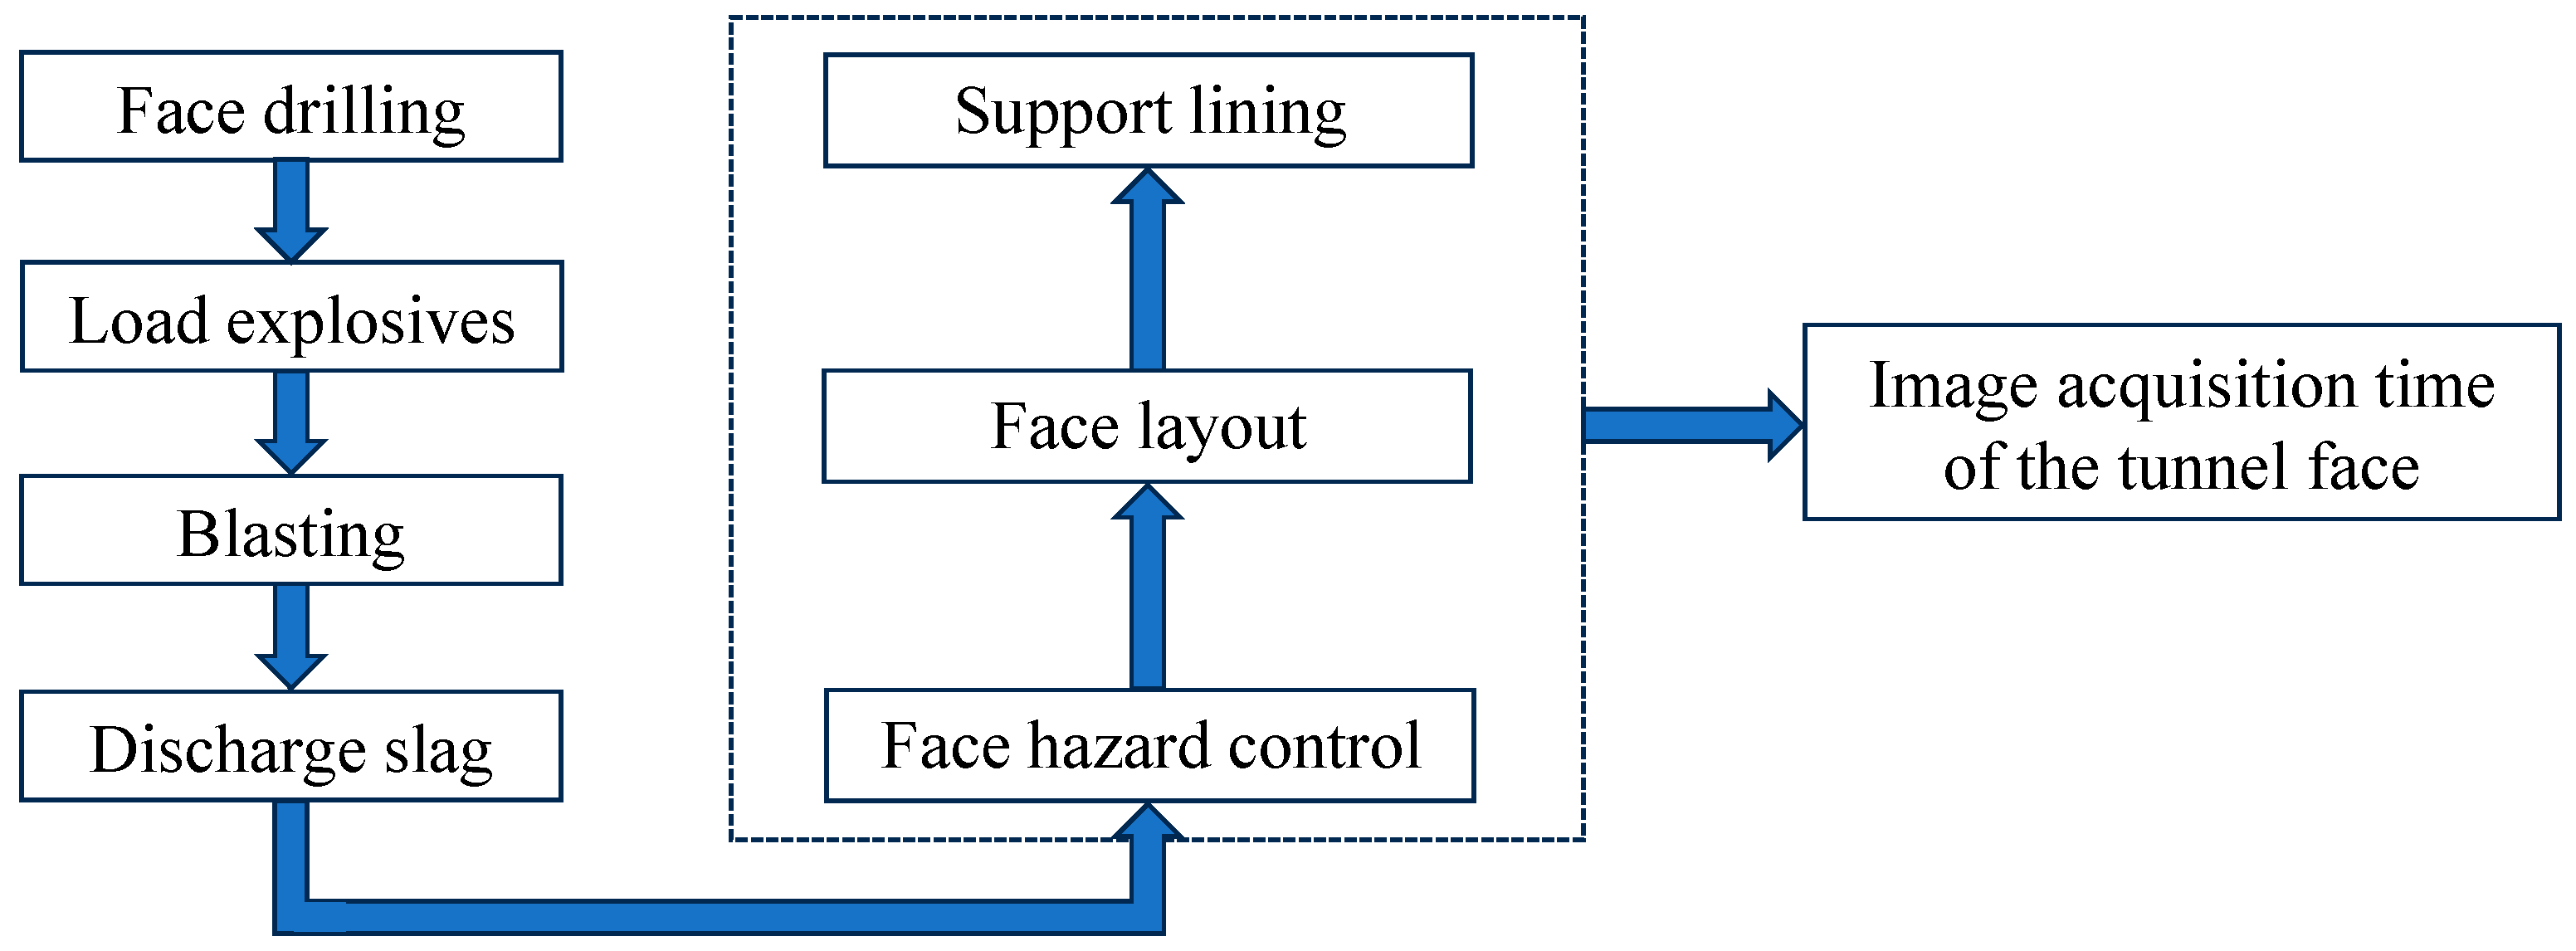
The optimal timing for image acquisition is after hazard clearance at the tunnel face and prior to the installation of support and lining. Although this stage may be affected by disturbances such as the movement of lining trolleys and surveying or setting-out operations, the dust concentration and lighting conditions inside the tunnel remain relatively stable compared with other construction phases. This stability provides an ideal window for photographic documentation. The construction sequence is illustrated in
Appendix A Figure A3.
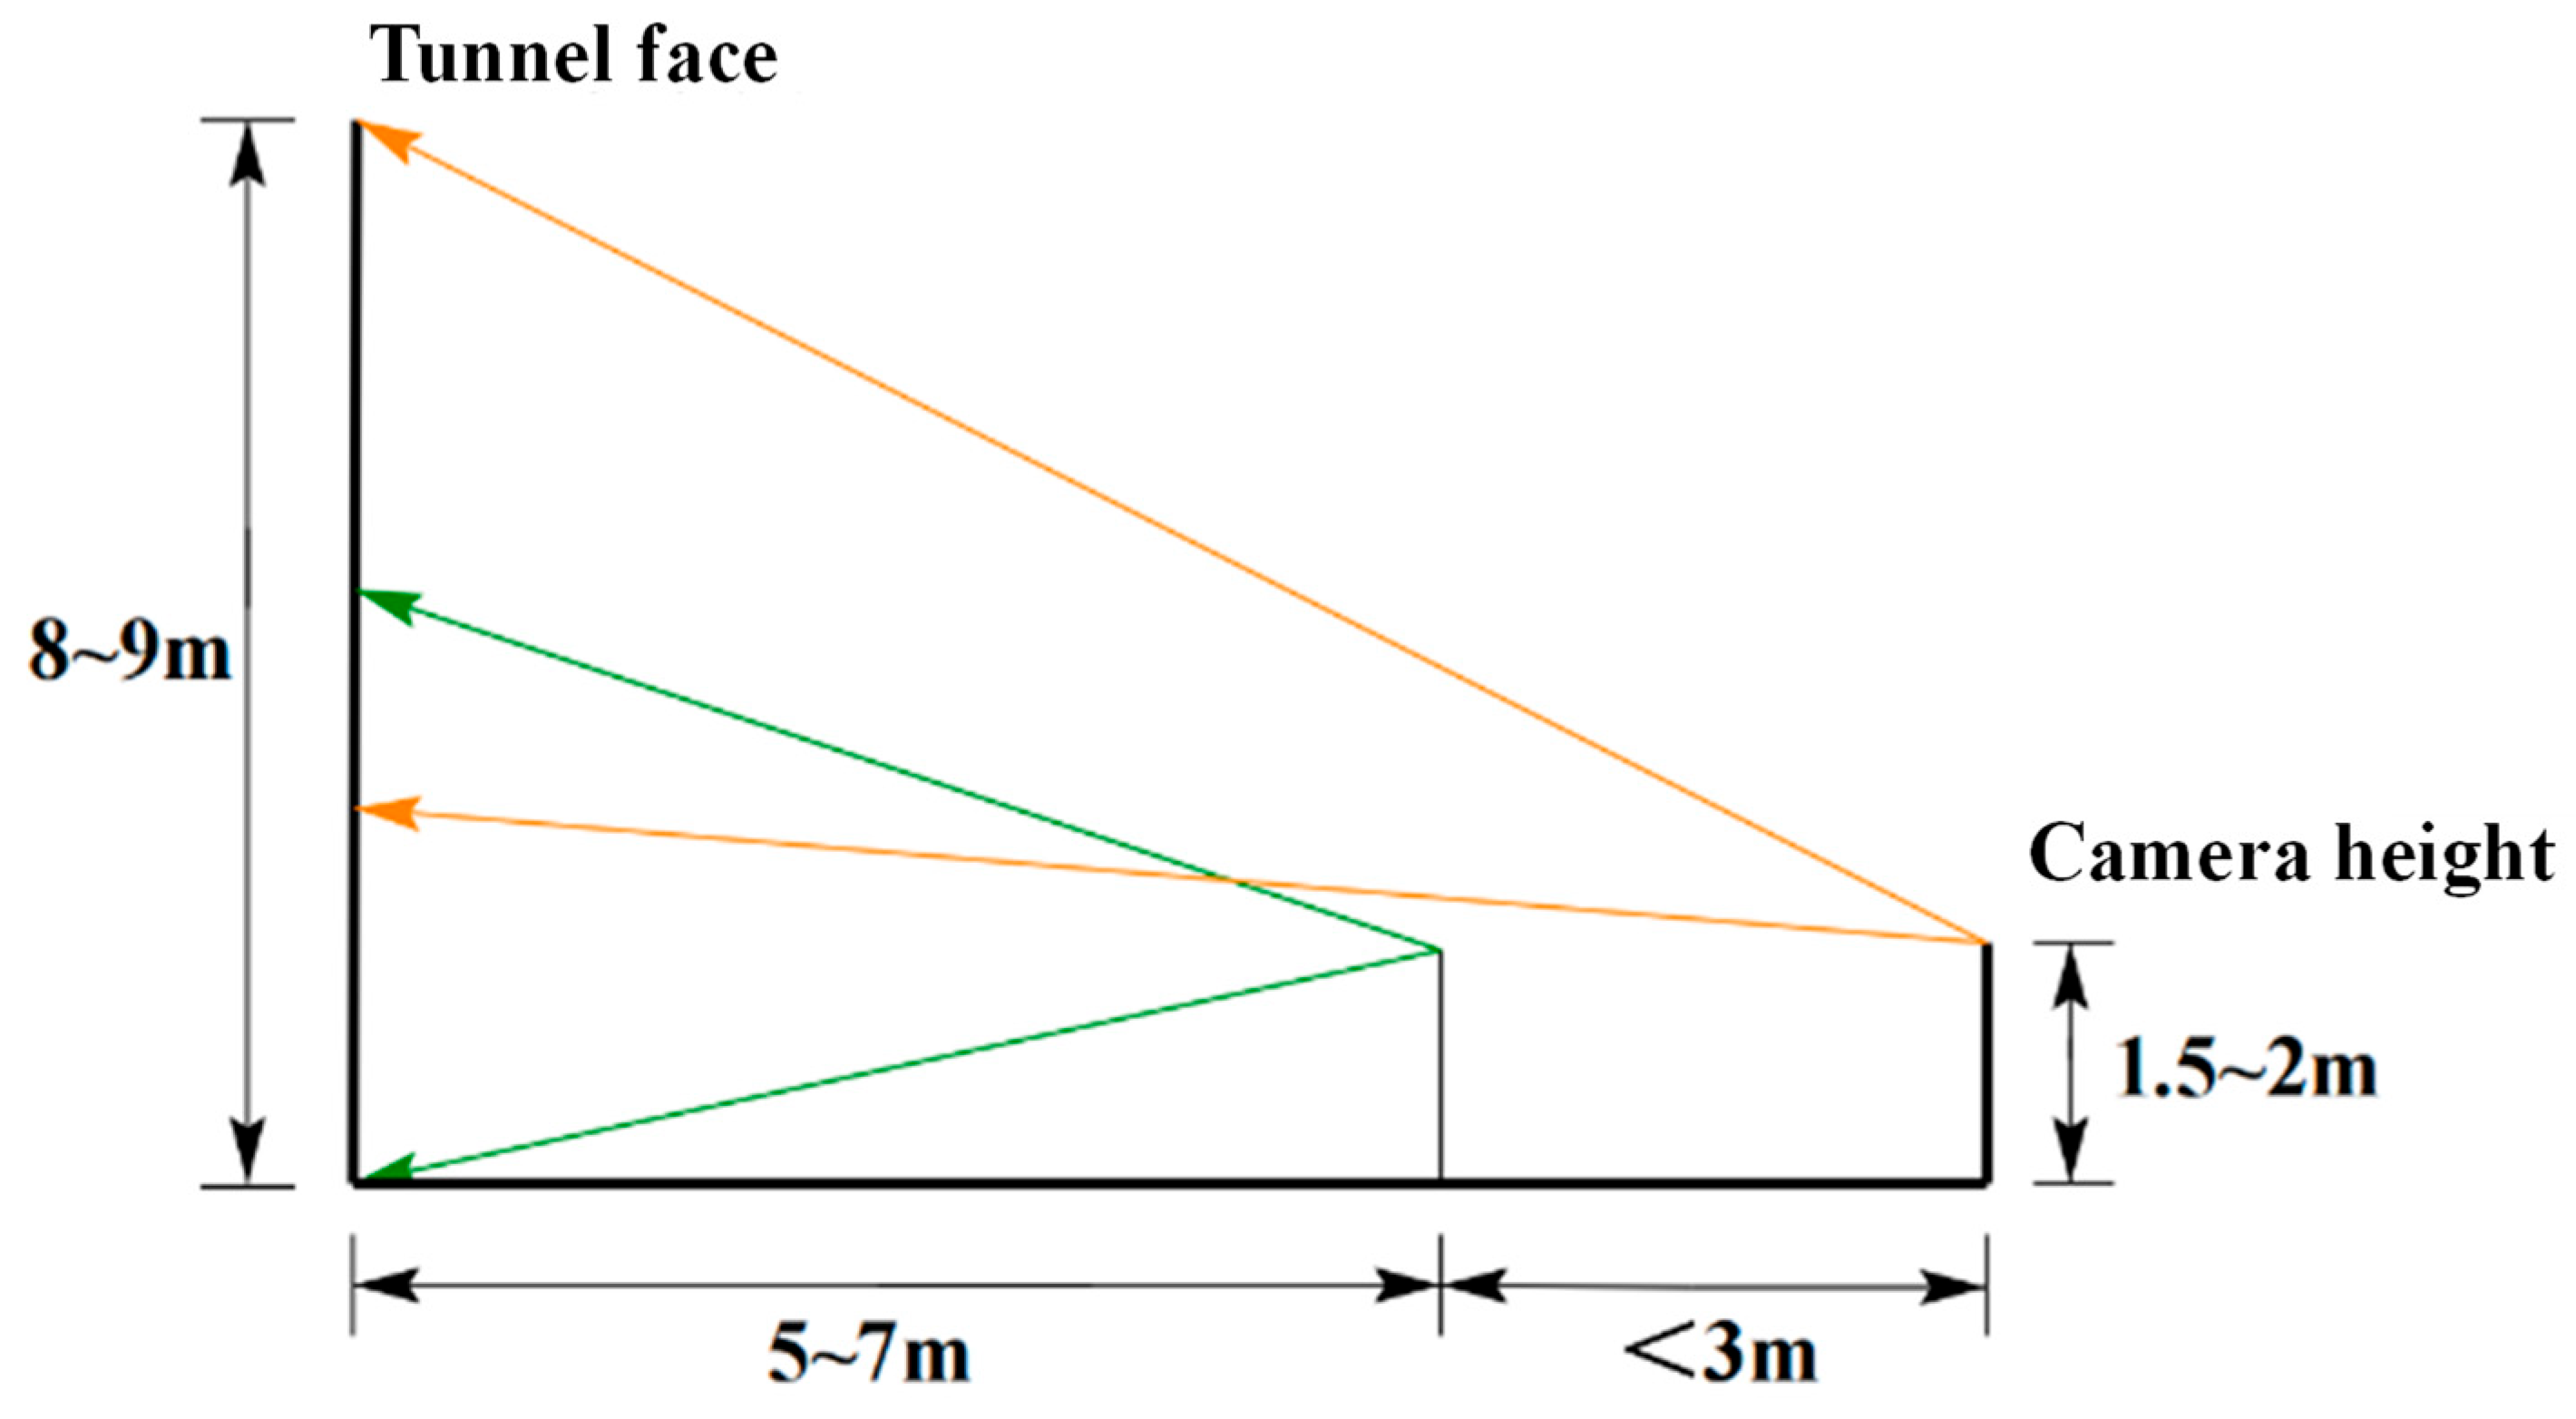
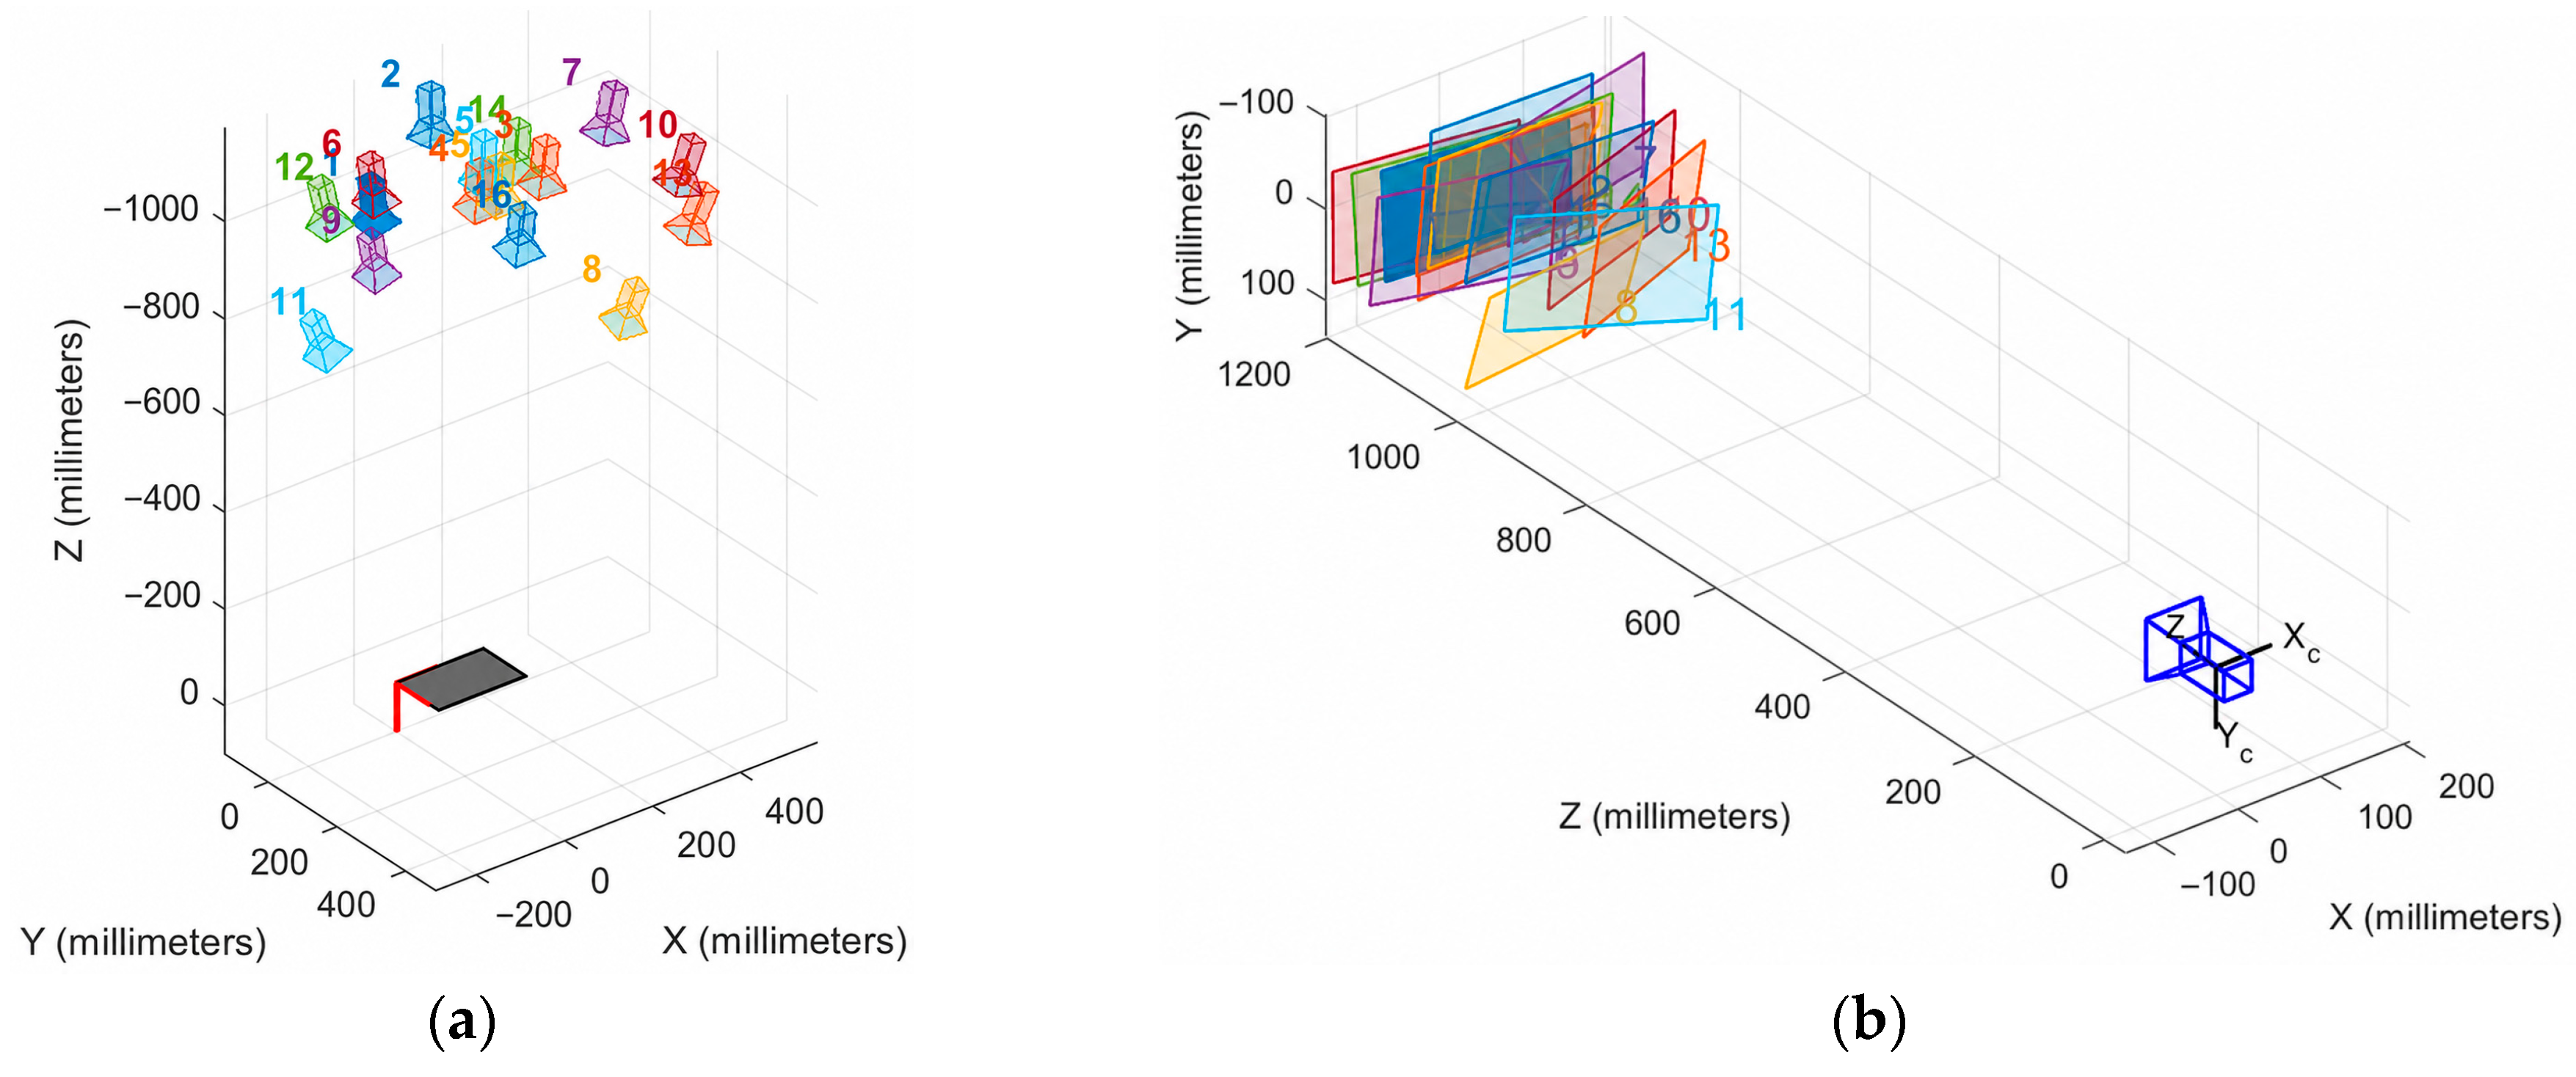
To obtain precise orthographic projections of the tunnel face, ensure the camera lens is perpendicular to the tunnel face during photography. Maintain an overlap rate of 30% to 50% between adjacent images to guarantee subsequent stitching accuracy. The specific photography plan is as follows: Photography points shall be arranged at intervals of 1.5 to 2.0 m along the tunnel’s longitudinal axis. At each point, 5 to 6 images shall be captured by translating the camera along the tunnel face while maintaining a near-constant viewing direction to cover different areas. Concurrently, the horizontal field of view should be controlled within 5 to 10 m to balance image resolution and coverage range (illustrative diagram illustrated in
Figure 2).
In this work, the camera position is defined by the optical center of the camera (lens principal point) in the tunnel coordinate frame, and the tunnel face reference surface refers to the exposed, freshly blasted rock surface prior to shotcrete or lining. The camera viewing direction is aligned as close as practical to the local normal of this raw face surface, so that each acquisition station provides sufficient parallax while avoiding large oblique angles that increase occlusion and degrade matching [
29].
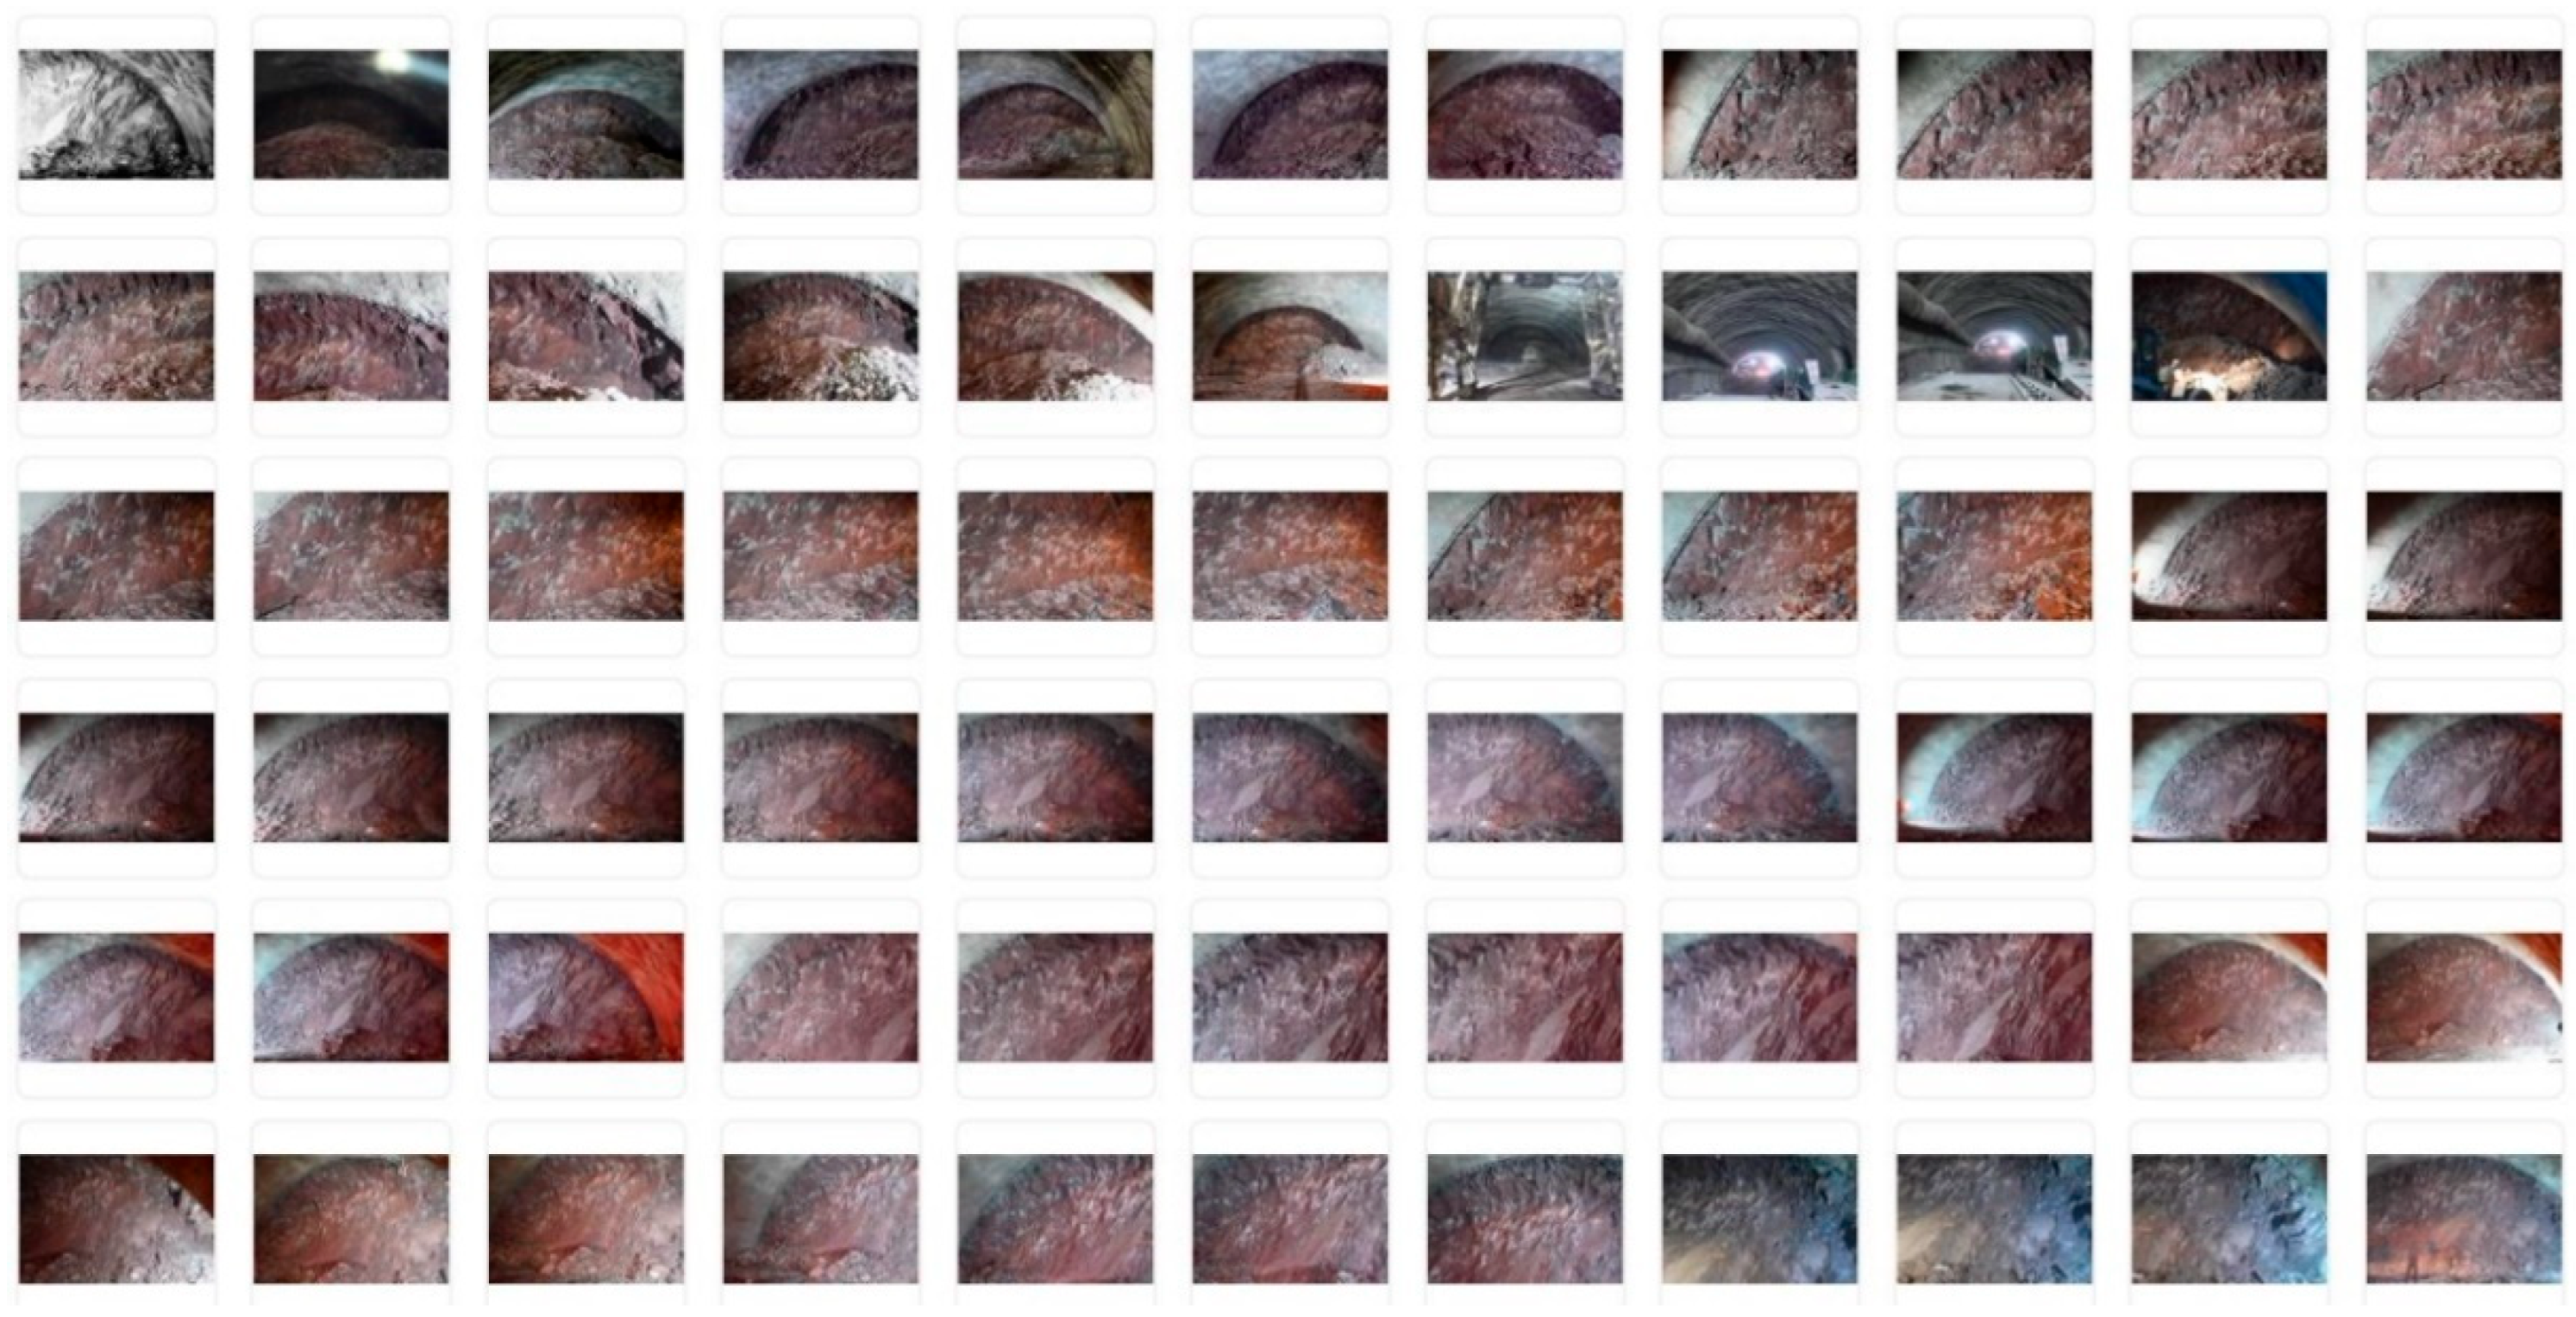
Following the aforementioned procedure, a total of 66 sets of post-blast tunnel cross-section images were acquired (as illustrated in
Appendix A Figure A4). Upon verification through image quality checks, the data demonstrated overall good quality with high usability and reliability, effectively supporting subsequent preprocessing operations.
2.3. Image Preprocessing
2.3.1. Histogram Equalization Image Enhancement Technique
Histogram equalization is a common image enhancement technique that operates by altering the image’s histogram to adjust the gray values of individual pixels. This method is particularly effective for enhancing contrast in images with a limited dynamic range. When the gray values of the original image are concentrated within a narrow interval, the minimal variation between pixel intensities leads to an overall blurred appearance. This effect commonly occurs in overexposed images, where gray values cluster in bright regions, or in underexposed images, where they accumulate in darker areas. By transforming the gray-level distribution into a more uniform form through histogram equalization, the dynamic range of pixel gray-level values can be significantly expanded, thereby enhancing contrast [
30].
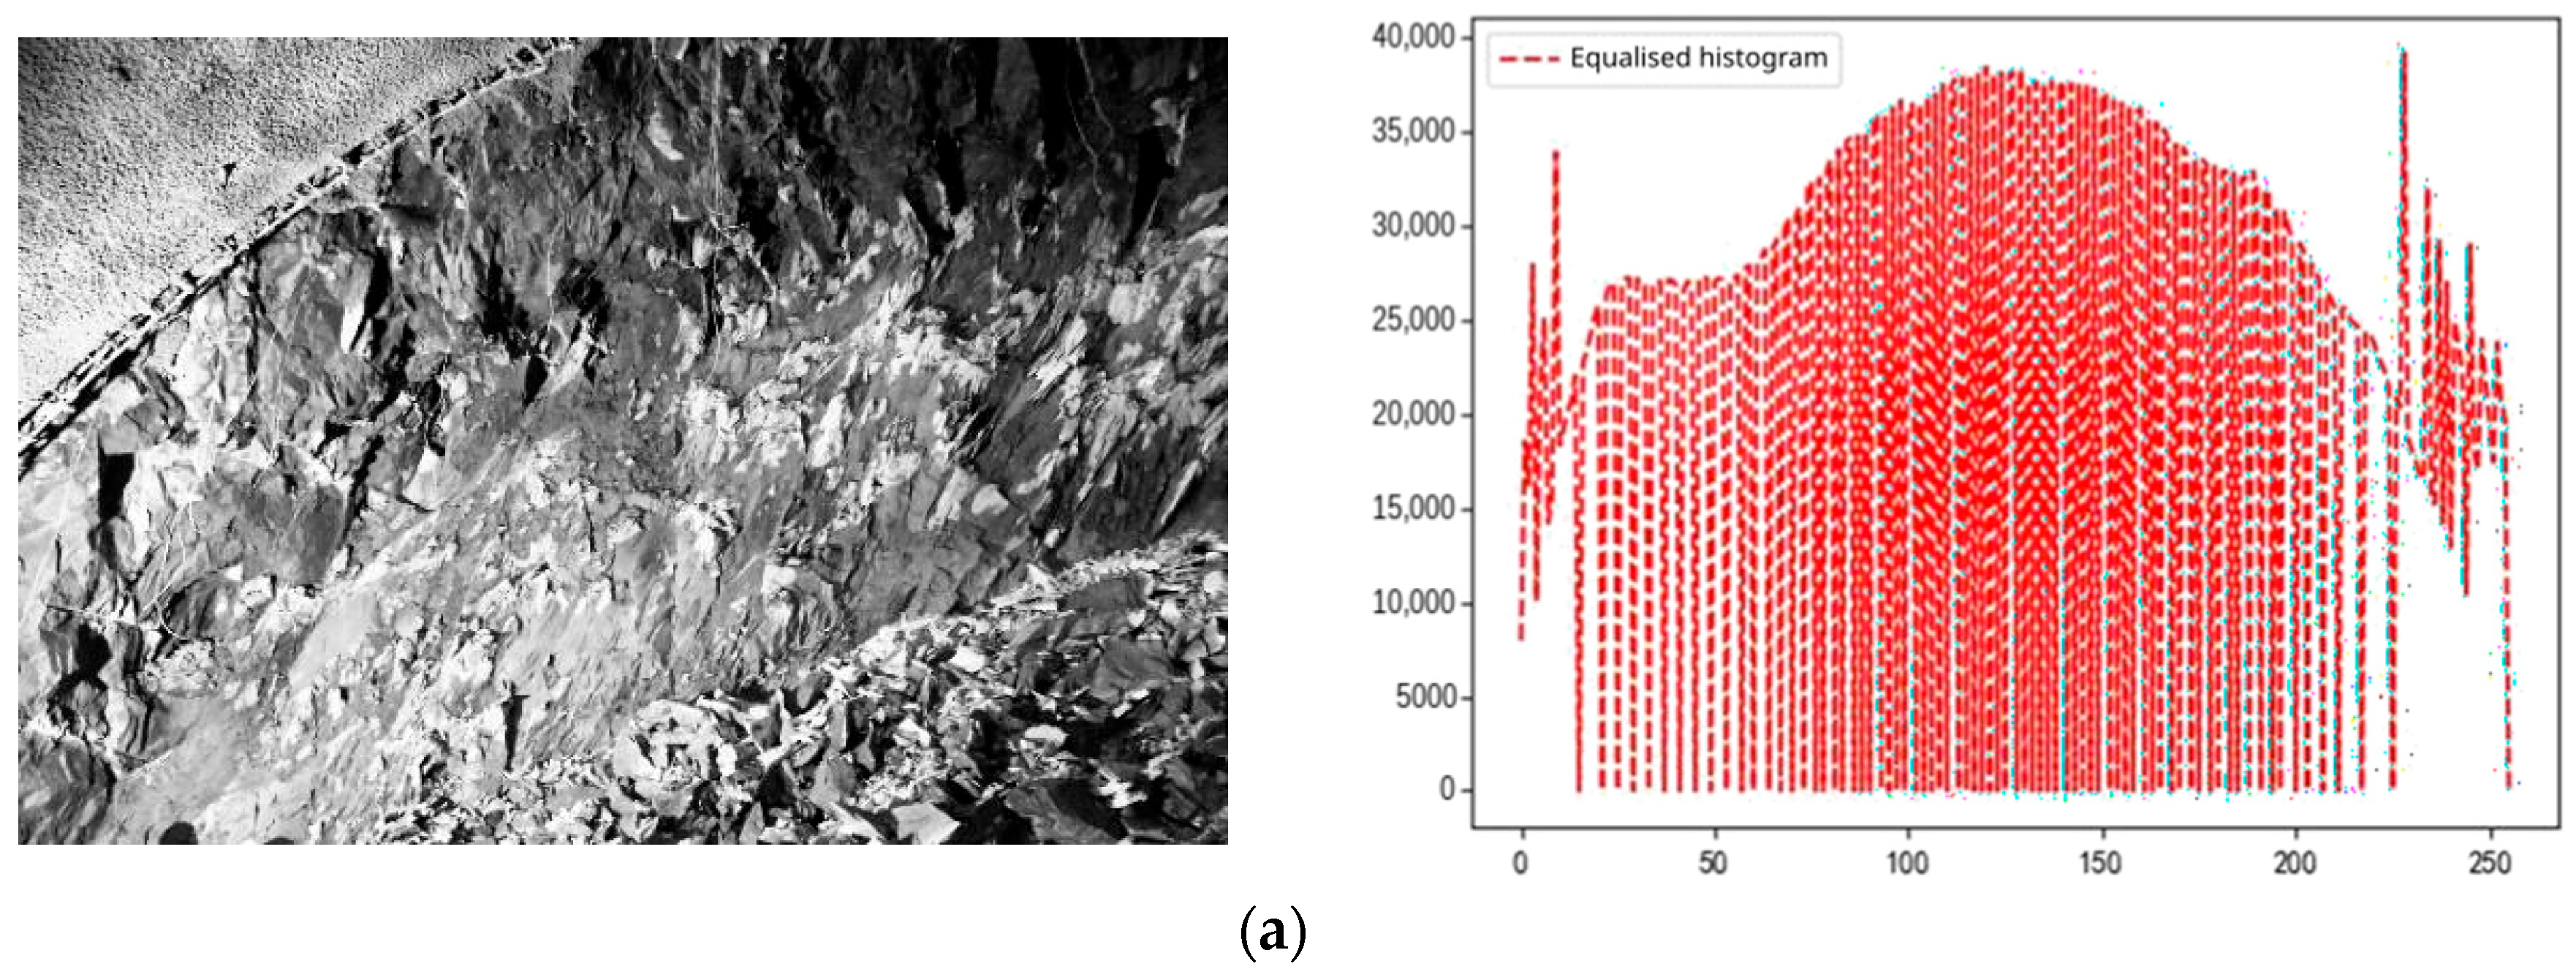
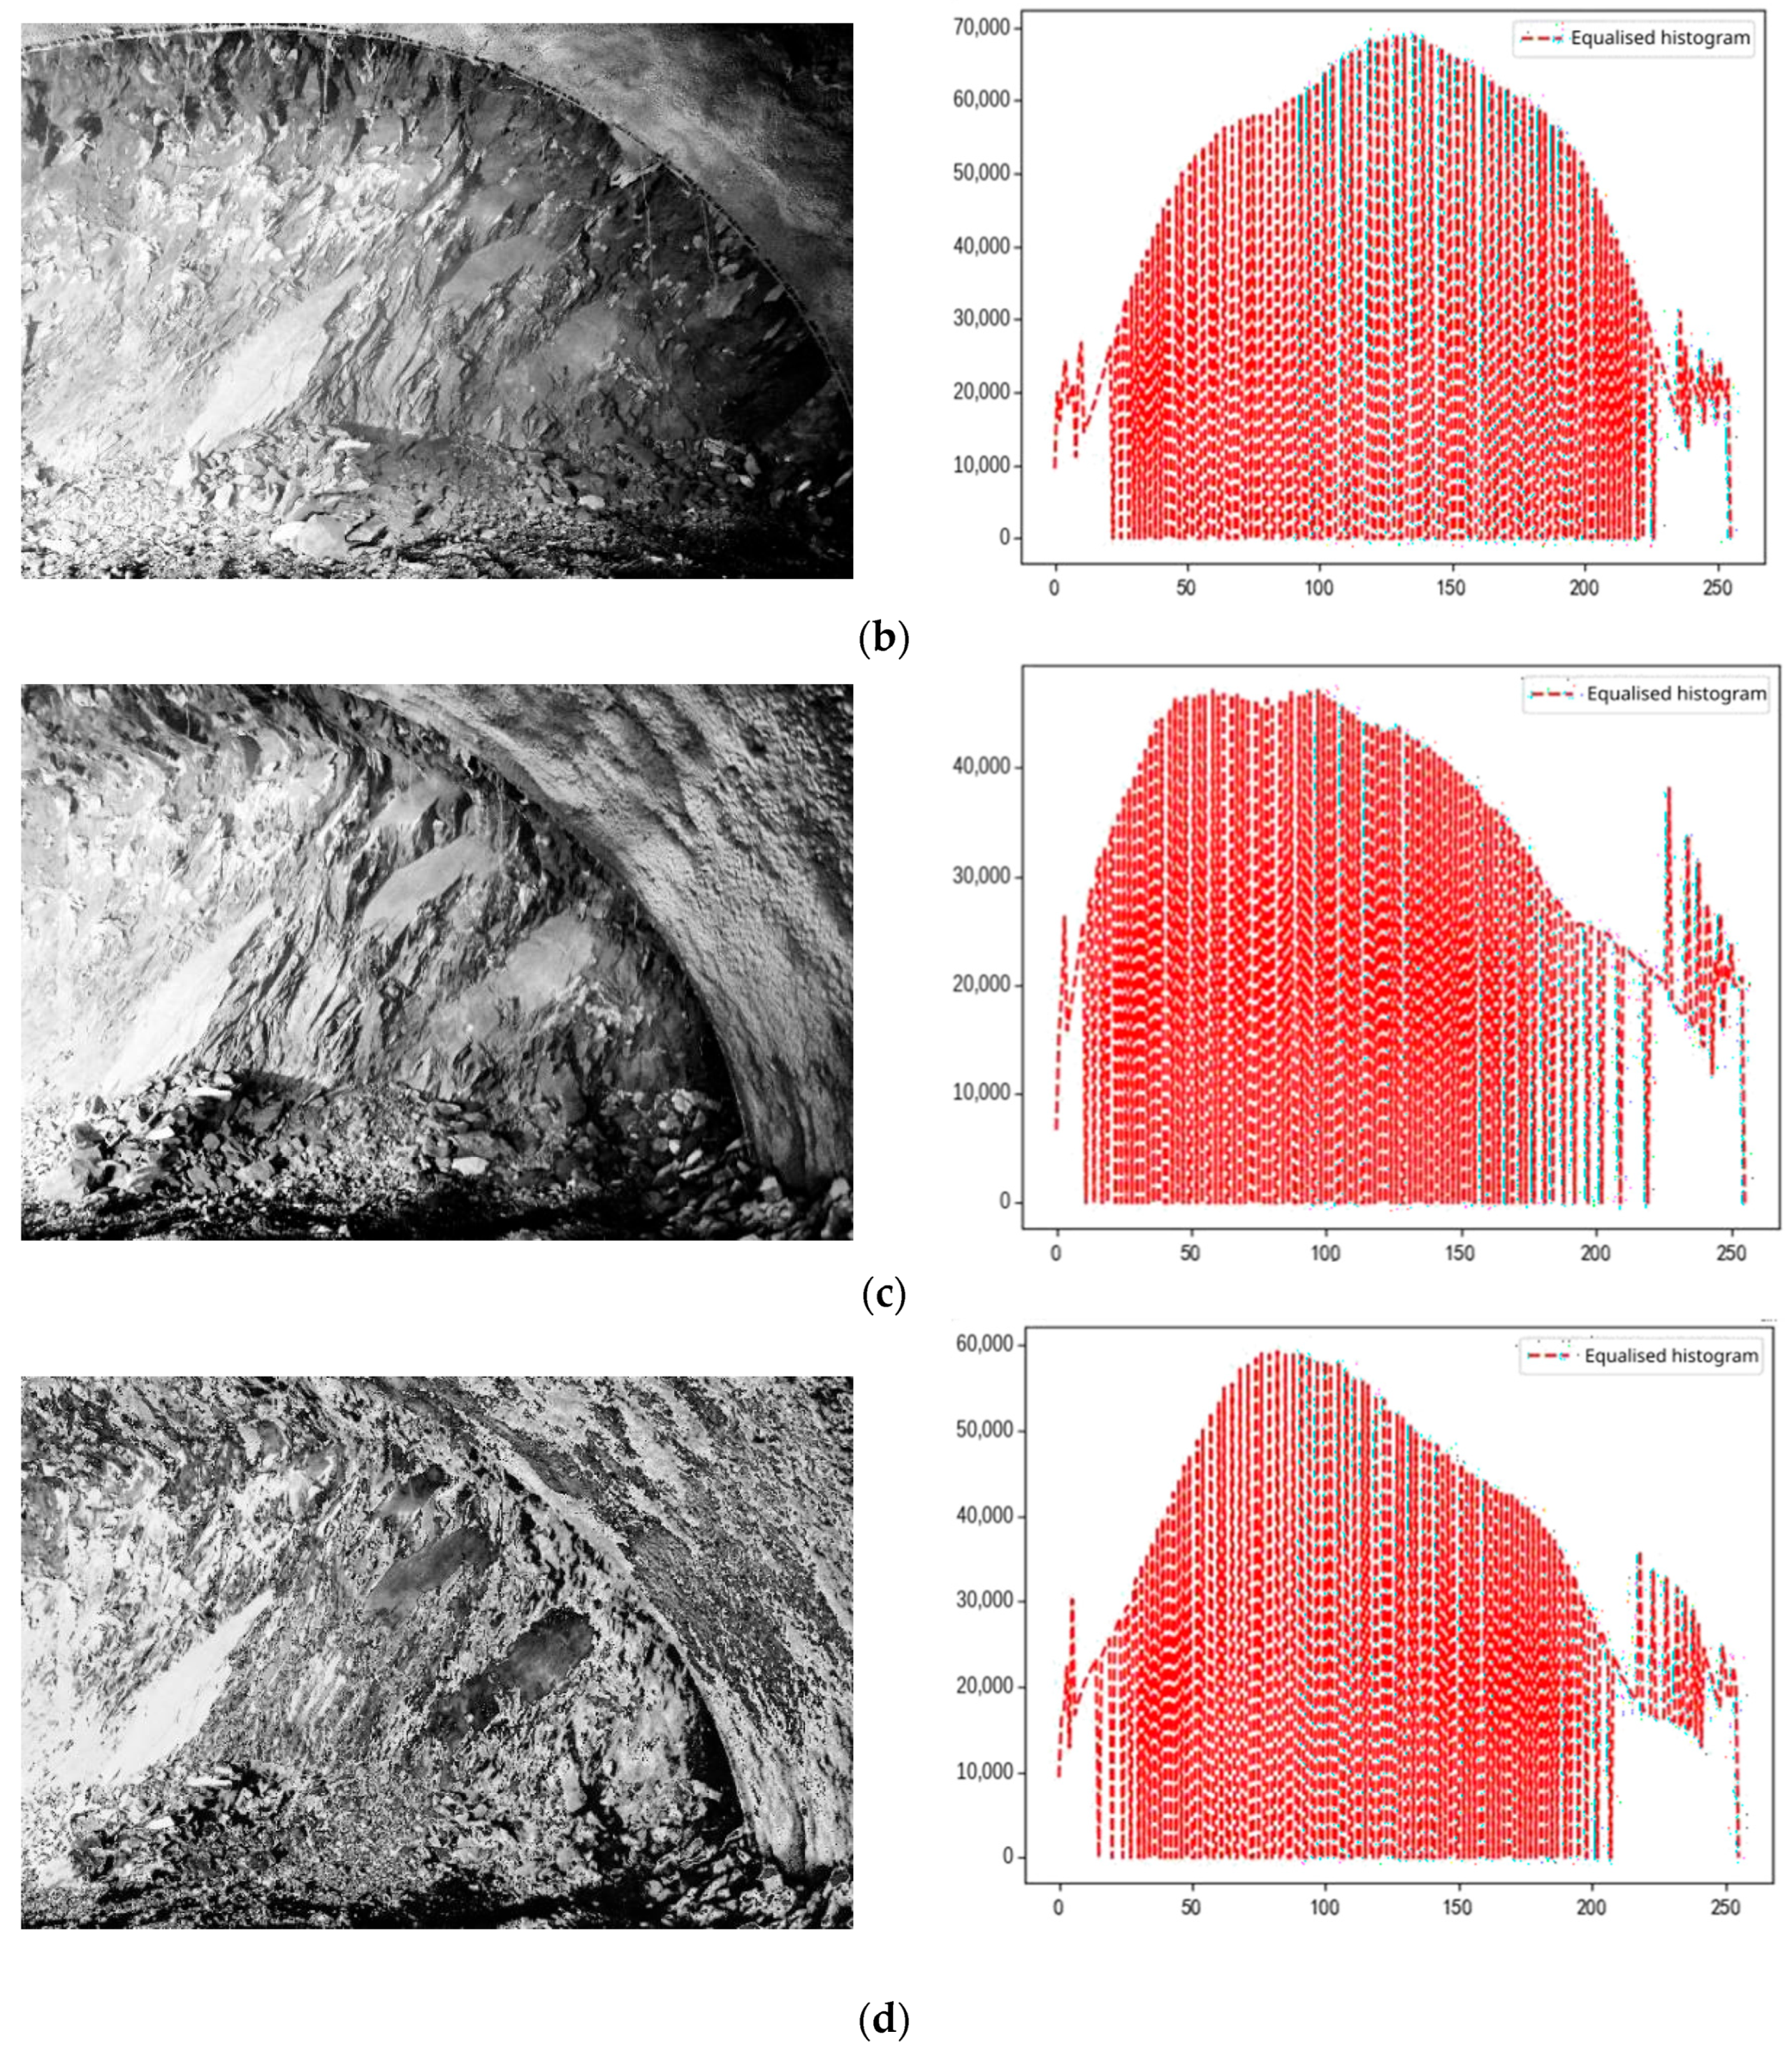
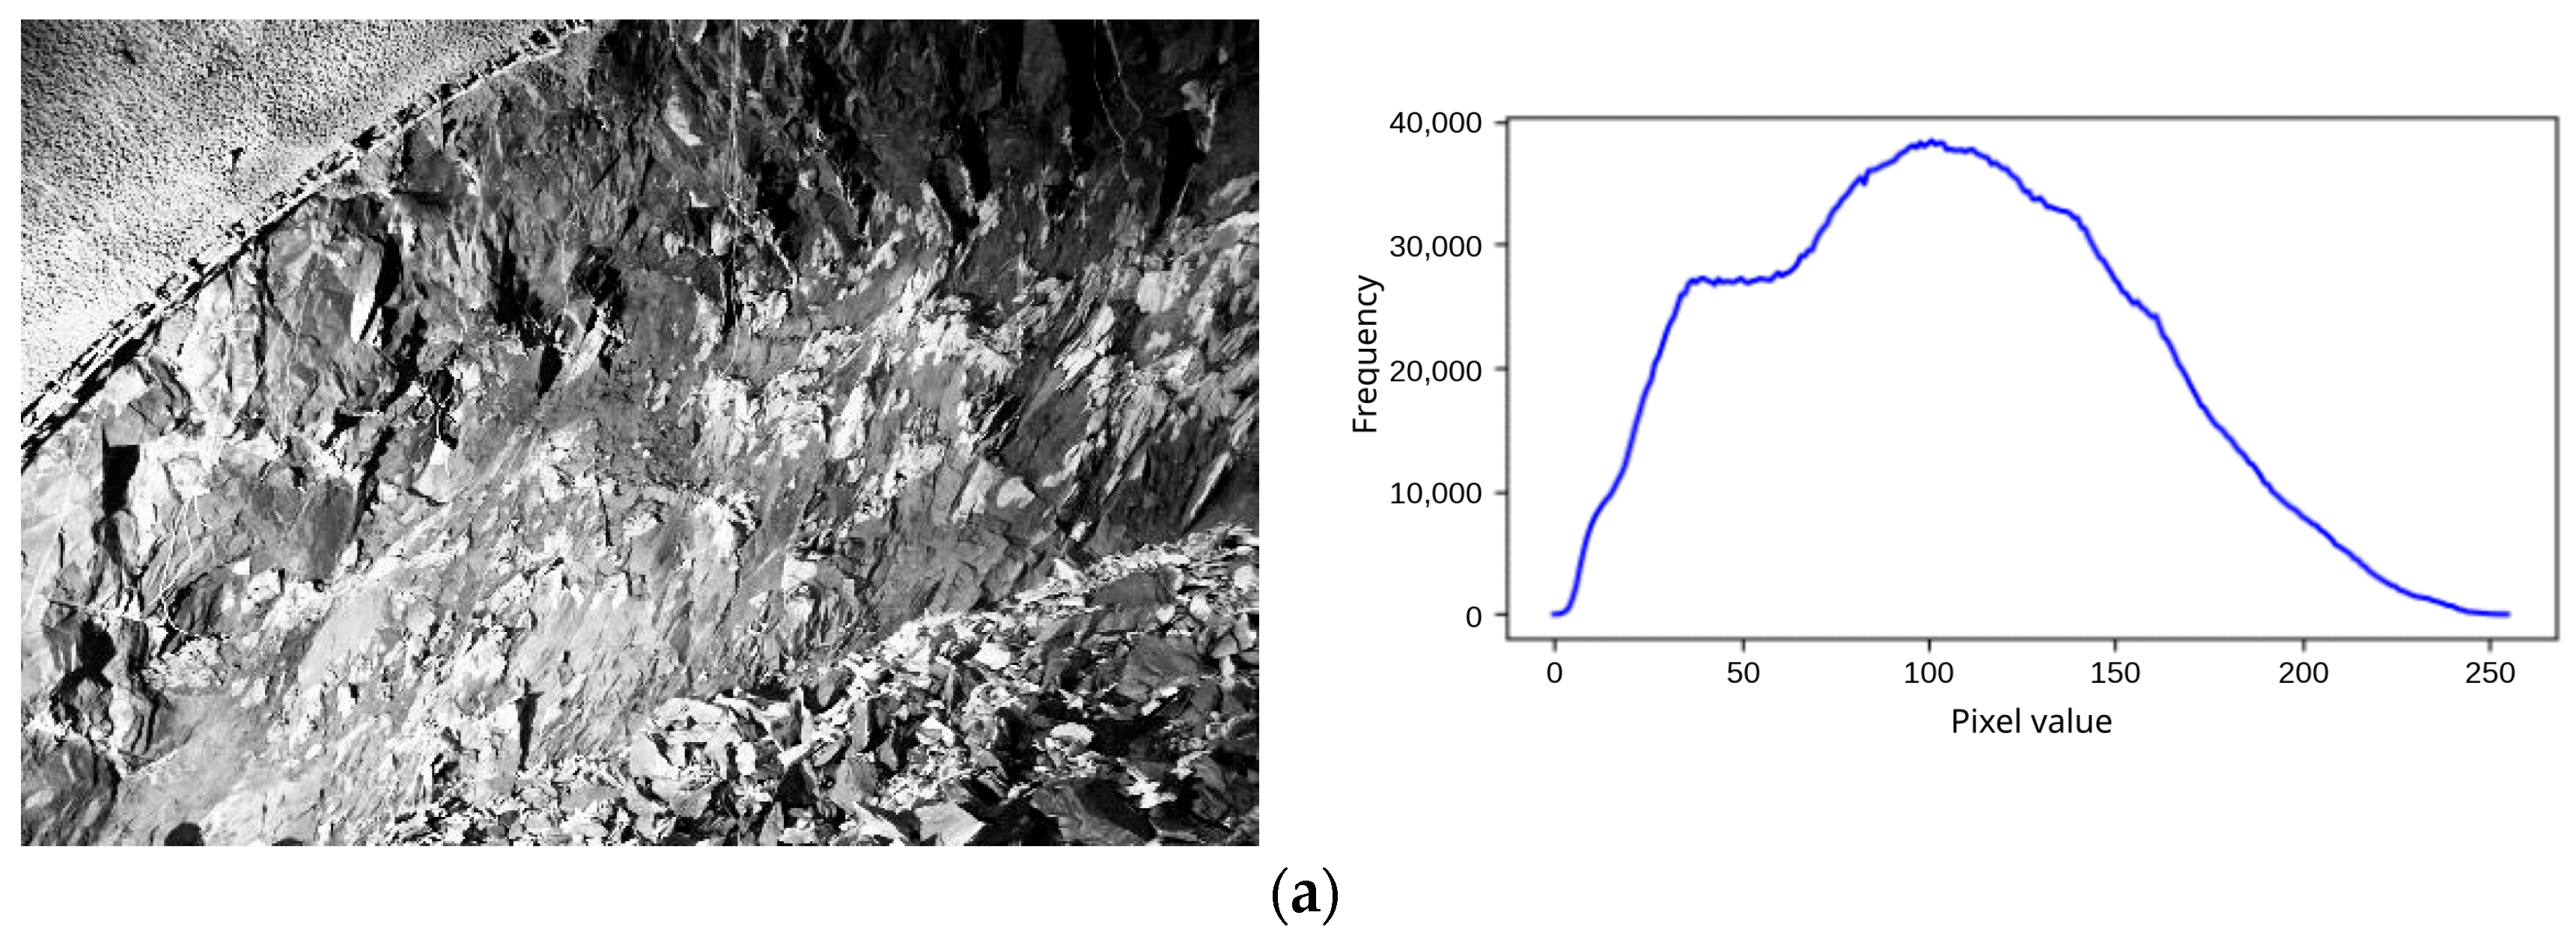
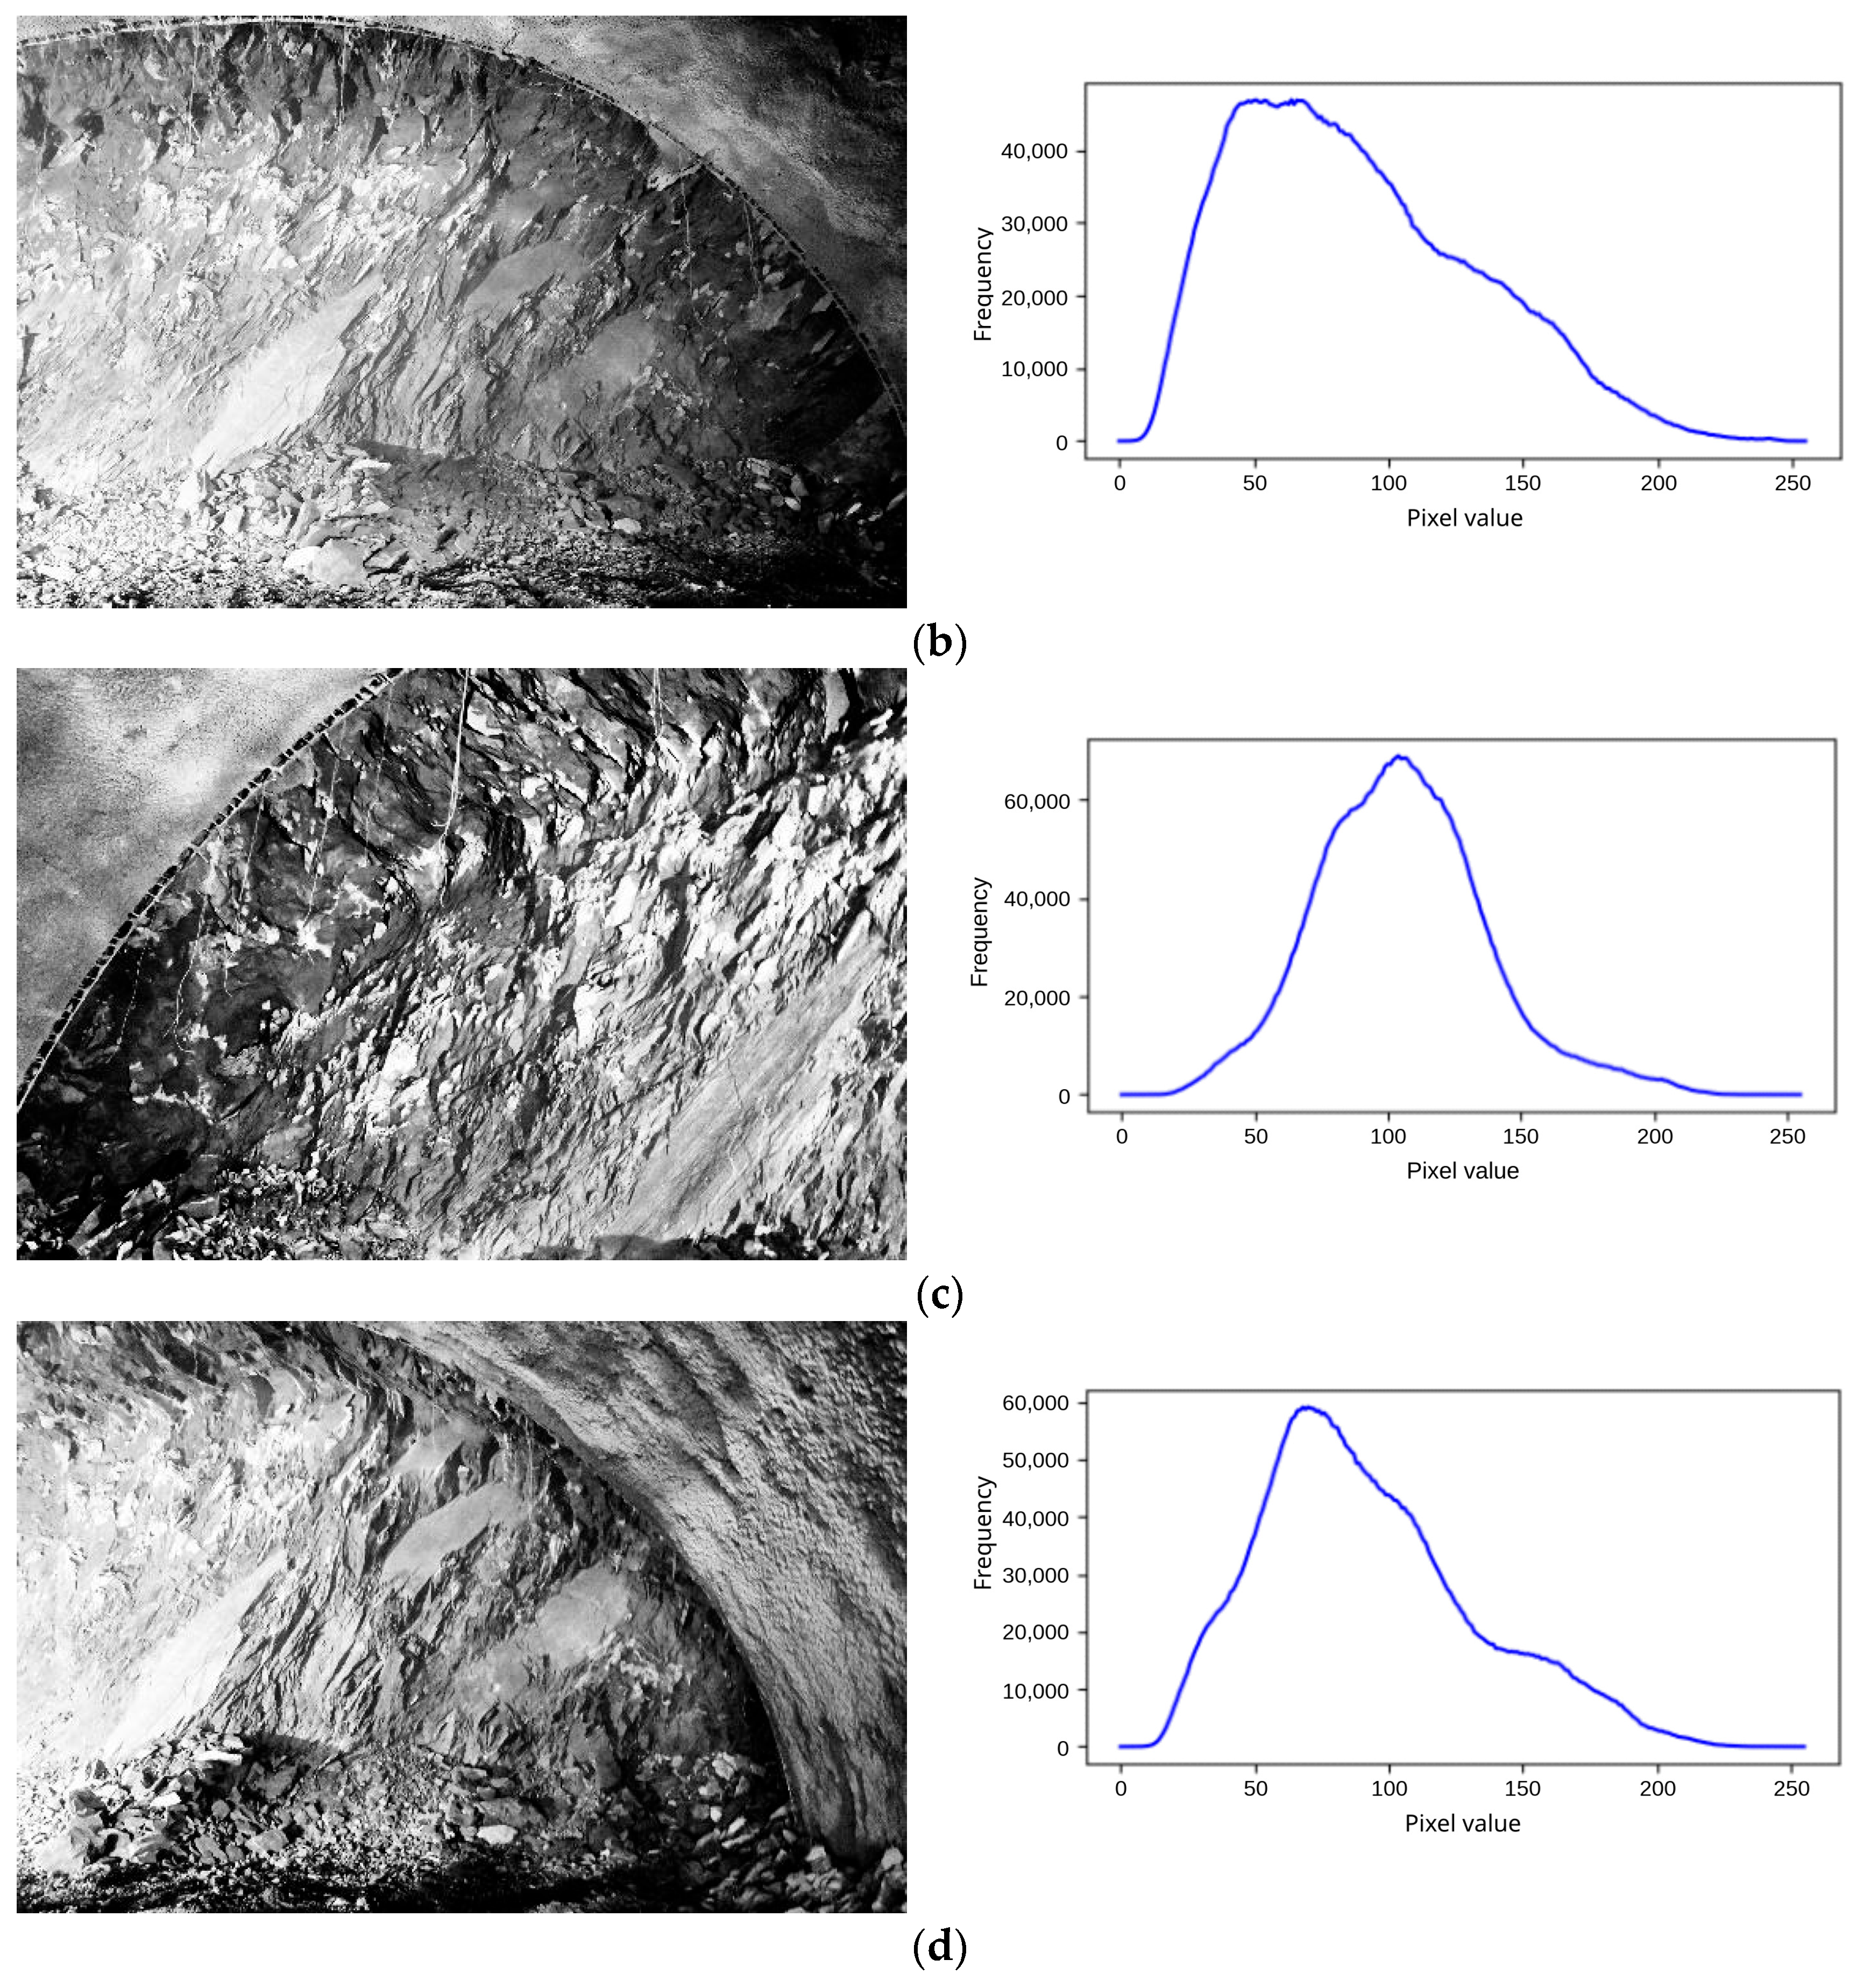
Histogram equalization is applied to mitigate uneven illumination in tunnels by expanding the effective gray-level dynamic range. This improves local contrast around edges, which increases the detectability and spatial coverage of SIFT keypoints. Downstream, the effect is reflected in the matching-distance distribution and inlier consistency after BBF and RANSAC filtering, and it contributes to more stable curvature statistics used for flatness evaluation. The enhanced image following histogram equalization and its histogram are illustrated in
Appendix A Figure A5.
2.3.2. Bilateral Filtering-Based Image Denoising Processing
During the acquisition of tunnel face imagery, the performance of the imaging equipment and surrounding environmental conditions can introduce varying degrees of noise and distortion into the images. Noise not only directly degrades image quality but also compromises the accuracy of subsequent edge detection. Consequently, image filtering (also termed image smoothing) is employed for denoising—a critical preprocessing step that must suppress noise while preserving image detail features wherever possible [
31]. Bilateral filtering is an optimization of traditional Gaussian filtering. While Gaussian filtering performs smoothing by directly convolving Gaussian weighting coefficients with the image, bilateral filtering refines these coefficients by combining a spatial Gaussian function with a luminance-similarity Gaussian function. The product of these two functions is then convolved with the image information. This refinement enables simultaneous consideration of edge information during filtering, effectively resolving the edge blurring inherent in traditional Gaussian filtering. It preserves edge sharpness while achieving smoother transitions at image boundaries. This method is applicable to both color and grayscale images, demonstrating strong practicality. However, due to its greater retention of high-frequency information (such as edges and textures), it cannot completely eliminate high-frequency noise (e.g., dense granular noise) in color images. It effectively suppresses only low-frequency noise, achieving a balance between edge sharpness and smoothness [
32].
Bilateral filtering is used because it suppresses noise while preserving discontinuity edges that dominate both SIFT keypoint formation and subsequent geometric measurements. In tunnel images, overly aggressive smoothing can reduce keypoint density and degrade matching, whereas insufficient smoothing increases spurious extrema and false correspondences. Therefore, the filter parameters are selected to improve RANSAC inlier consistency and reduce matching distances, while maintaining stable curvature-based flatness characterization.
To support the selection of the preprocessing strategy, three settings were examined on the same image set: no preprocessing, histogram equalization only, and histogram equalization followed by bilateral filtering. The comparison considered their effects on SIFT keypoint extraction, matching quality, and RANSAC inlier consistency. The denoising effect of the adopted preprocessing scheme is illustrated in
Appendix A Figure A6.
2.3.3. Preprocessing Parameter Setting and Consistency Control
The preprocessing operations were applied using a fixed workflow throughout the study. Histogram equalization was used to expand the gray-level dynamic range of tunnel face images under uneven illumination, and bilateral filtering was then used to suppress image noise while preserving local discontinuity edges. In the bilateral filtering step, the filter diameter d controls the spatial neighborhood size, sigmaColor controls the gray-level similarity range considered in the filtering operation, and sigmaSpace controls the spatial influence range. These parameters jointly determine the balance between noise suppression and edge preservation: excessively weak filtering may leave spurious noise that affects keypoint extraction, whereas overly strong filtering may smooth discontinuity edges that are important for feature matching and geometric characterization.
Because the present study did not include an independent parameter-sensitivity experiment, the influence of preprocessing parameters was controlled by applying the same preprocessing workflow and parameter configuration to all image sets involved in reconstruction, curvature computation, and pre- and post-optimization comparisons. Accordingly, the reported curvature statistics were interpreted under a consistent processing condition rather than as results obtained from differently processed image datasets. This consistency-control strategy reduces the possibility that the reported pre- and post-optimization differences are caused by inconsistent preprocessing.
2.4. Feature Extraction and Matching of Tunnel Face Images
In the 3D reconstruction workflow, precise feature extraction and robust stereo matching are fundamental for obtaining reliable depth information. Any inaccuracies in feature point localization or noise in the matching process can propagate directly into the reconstructed 3D point cloud, thereby degrading the geometric fidelity of the tunnel face contour and compromising overall reconstruction quality [
33]. To mitigate these issues, this study employs SIFT-based feature extraction and matching algorithms, implemented in a Python-based technical framework using Python 3.8.10 and OpenCV (opencv-contrib-python 4.5.5.64). Given tunnel face image datasets as input, the system performs feature detection, k-nearest-neighbor matching accelerated by BBF-KD tree structures, and mismatch elimination via RANSAC. The resulting sub-pixel-precision correspondences provide a robust foundation for subsequent multi-view geometric modeling and high-accuracy 3D point-cloud reconstruction.
2.4.1. Feature Point Extraction Based on the SIFT Algorithm
David Lowe proposed the SIFT algorithm (Scale Invariant Feature Transform) in 1999—a feature point extraction algorithm in computer vision designed to detect and describe local features within images. This was optimized in 2004, forming a feature point extraction algorithm based on scale pyramid theory. Essentially, this algorithm detects key points (feature points) across different scale spaces and calculates their orientation. The feature points extracted by SIFT exhibit strong invariance to rotation, scale, and brightness, alongside robust performance against lighting variations, noise, and affine transformations. Examples include corner points, edge points, bright spots in dark regions, and dark spots in bright regions [
34].
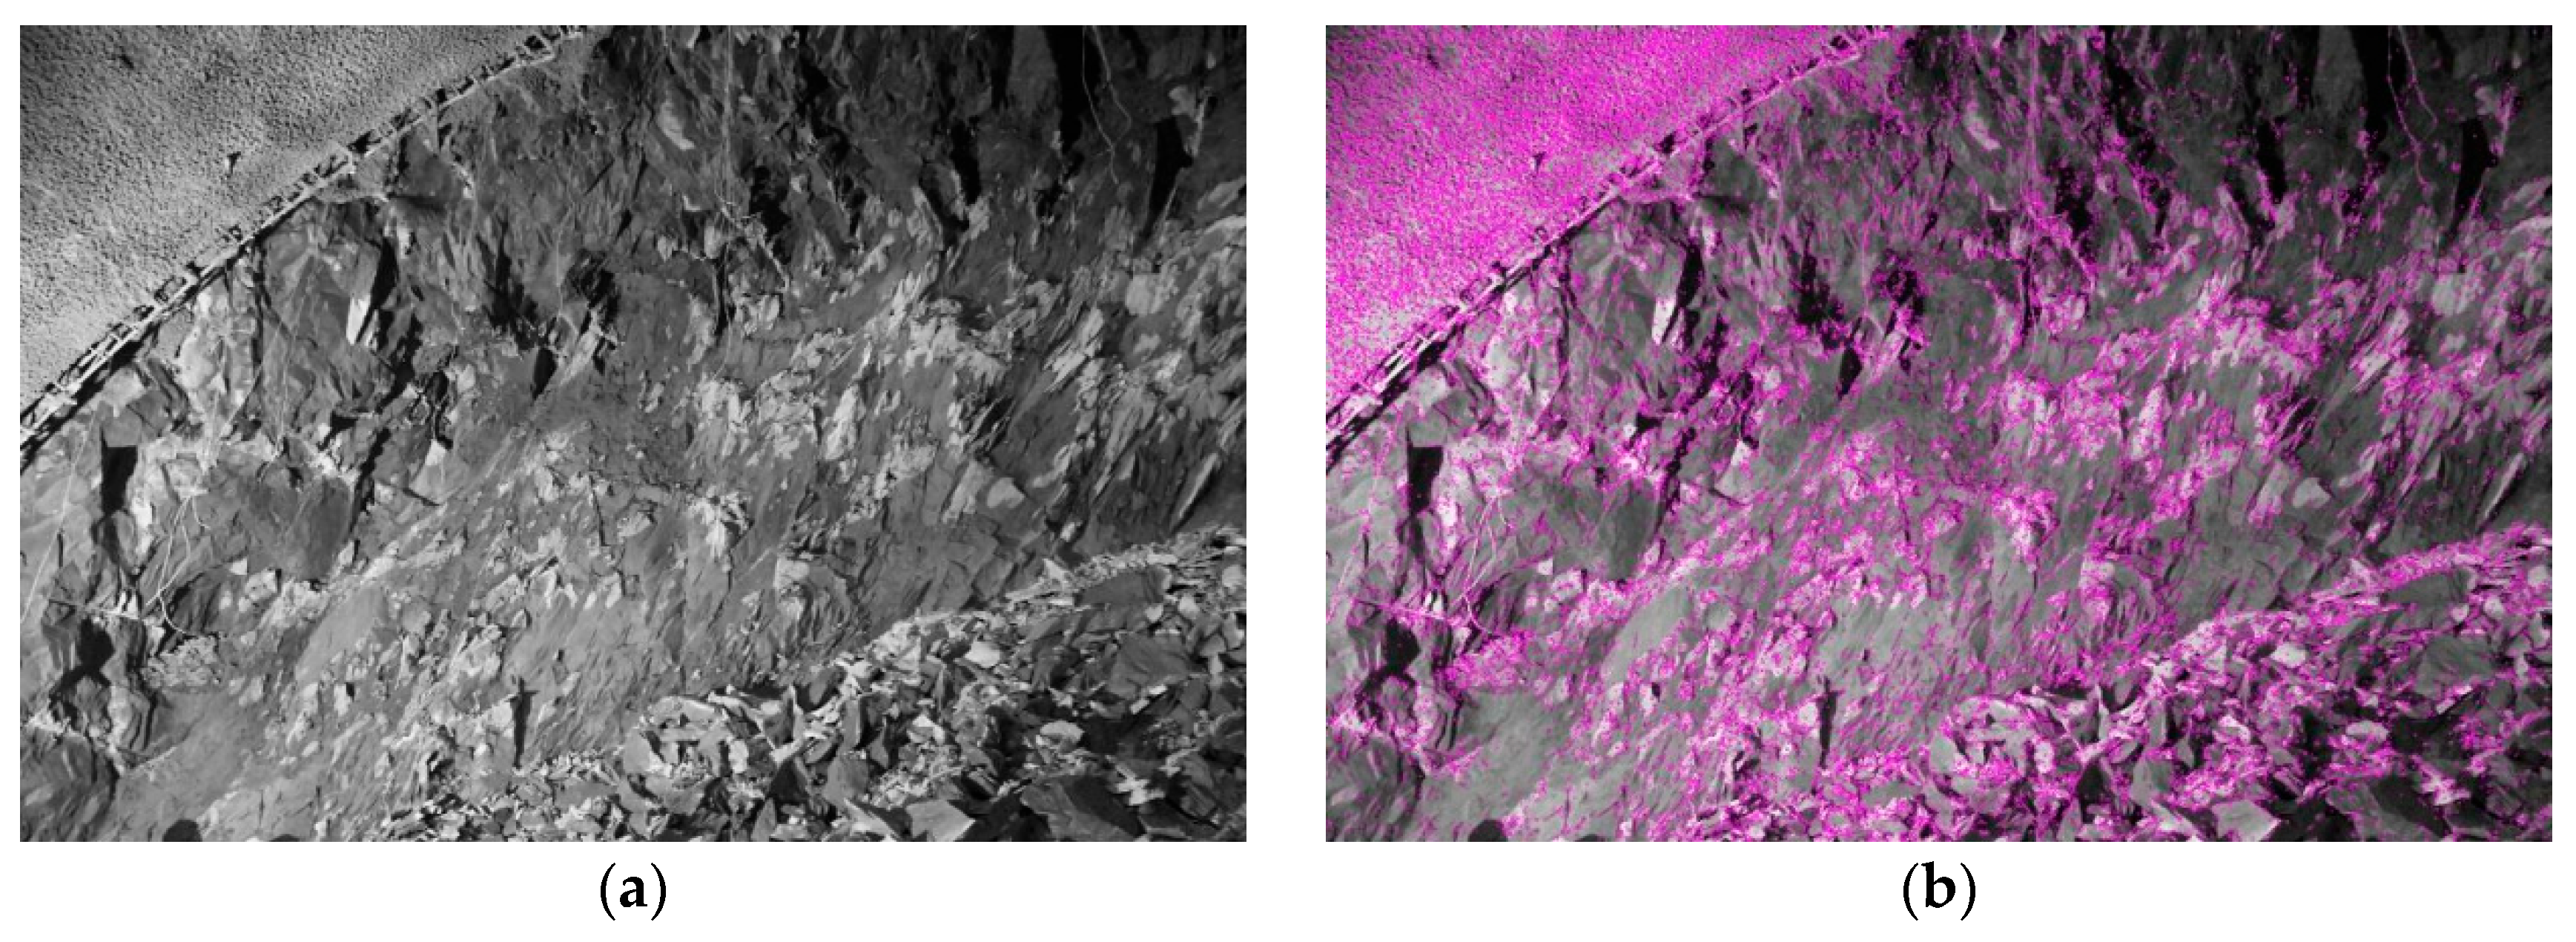
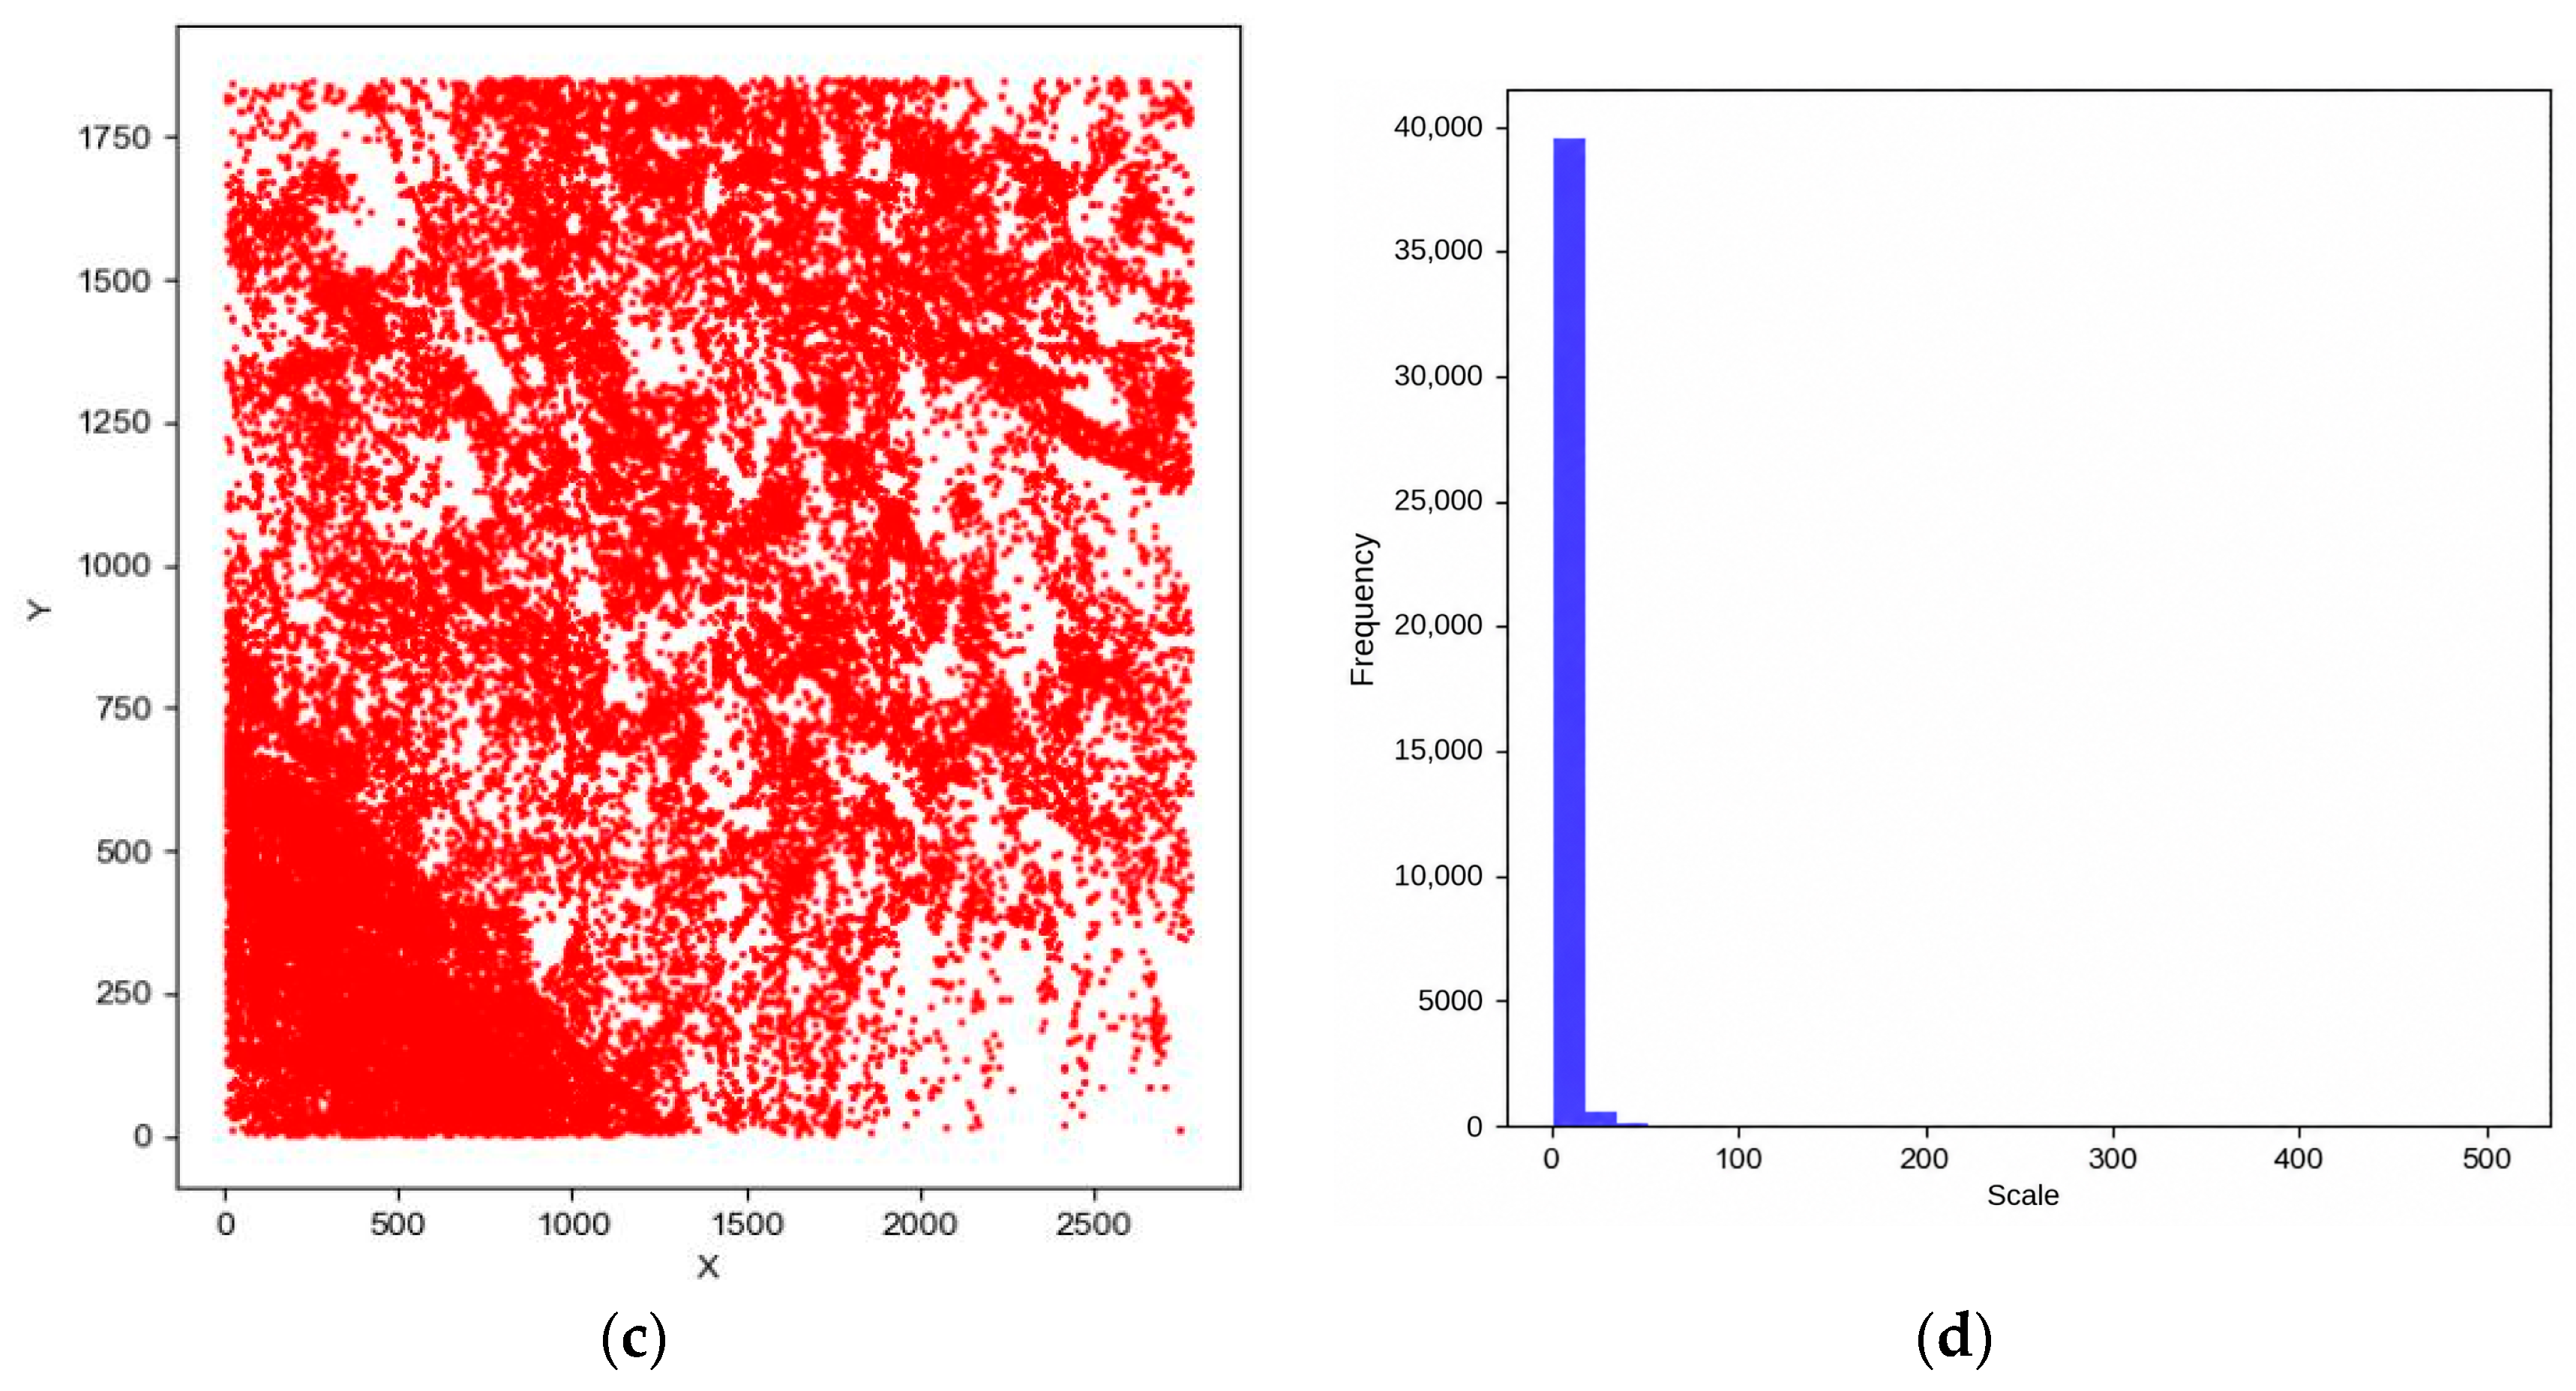
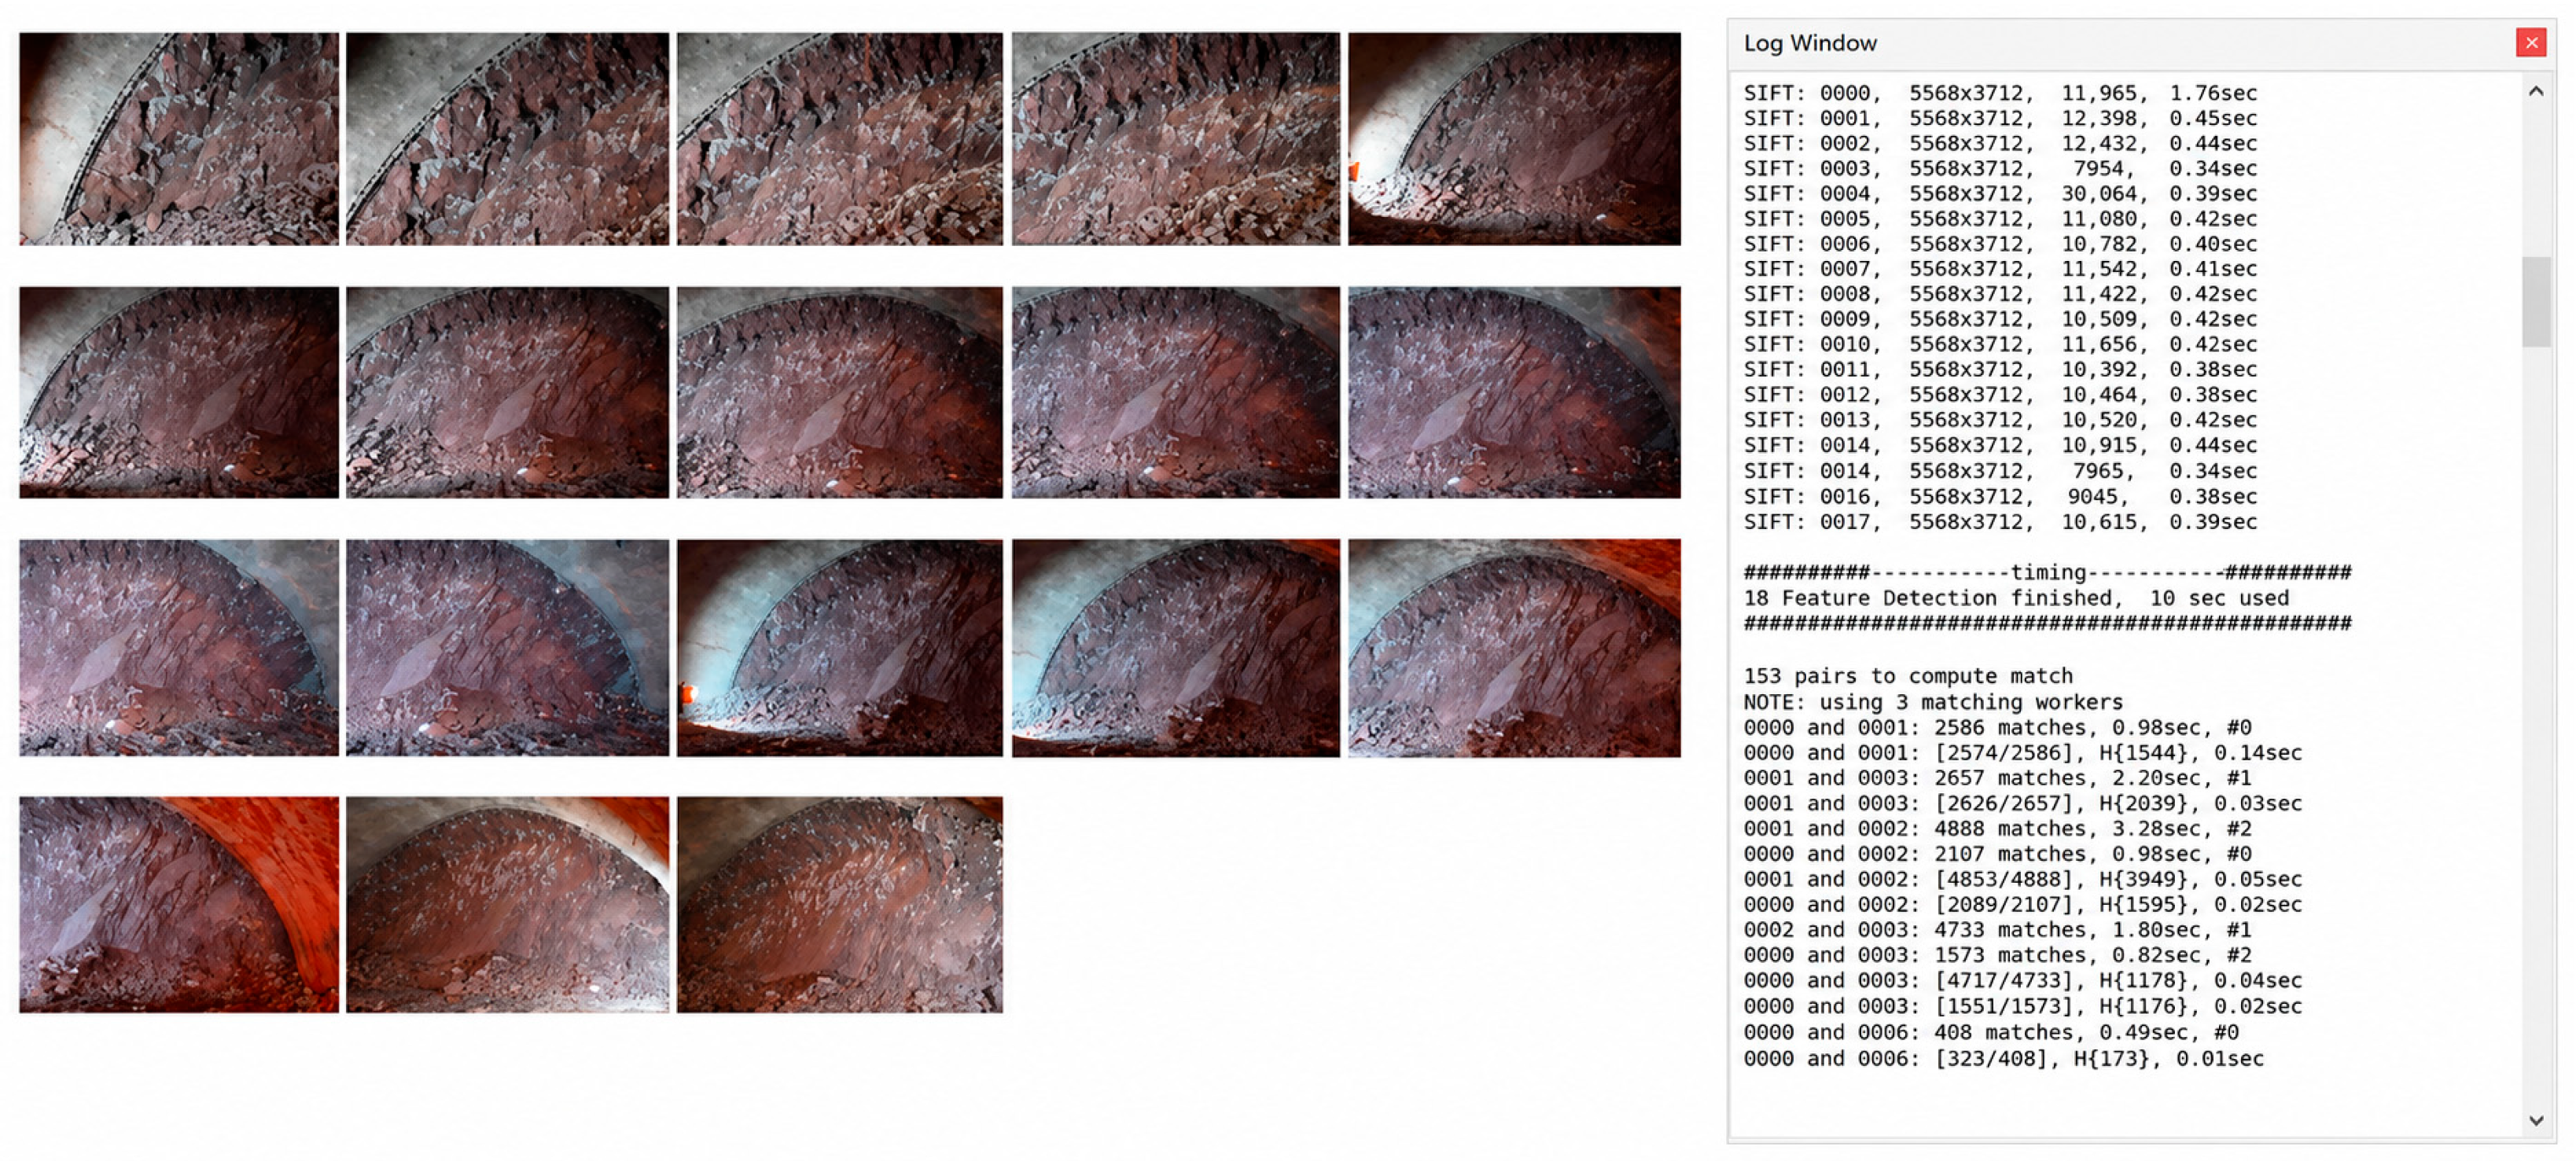
SIFT keypoints are detected across scales and assigned dominant orientations, and 128-D descriptors are constructed from local gradient histograms for subsequent matching. Within the Python-OpenCV programming environment, the preprocessed tunnel face image dataset was imported. The SIFT algorithm was employed to detect feature points and descriptors within the face images, subsequently calculating the distribution of these feature points across the tunnel face. The experimental results are illustrated in
Appendix A Figure A7.
Based on experimental results concerning feature point detection and extraction from the tunnel face, the SIFT algorithm has been demonstrated to effectively identify key points within images, yielding a total of 39,875 feature points. These points predominantly cluster within a relatively small scale range, reflecting the algorithm’s sensitivity to minute structural details and local characteristics within the image, such as edges, corners, and textural nuances. Overall, the SIFT algorithm successfully captures detailed information within the tunnel face images, providing a robust data foundation for subsequent feature matching tasks.
2.4.2. SIFT Feature Point Matching Based on an Improved K-D Tree Algorithm
Following the extraction of feature points from different images using the SIFT algorithm, the subsequent stage involves feature point matching. The core of this process lies in measuring the similarity between two feature vectors, typically achieved by calculating their Euclidean distance. Within the standard SIFT matching procedure, Euclidean distance serves as the primary criterion for determining whether feature points correspond to the same location in the real world. A smaller distance indicates greater similarity between the feature vectors, thereby enhancing the reliability of the match [
35].
On tunnel faces with repetitive or weak textures, locally similar gradient patterns can yield ambiguous SIFT descriptors, so multiple candidates exhibit comparable descriptor distances and the nearest-neighbor decision becomes unstable. In this context, the best-bin-first (BBF) search strategy in a K-D tree prioritizes candidate bins by their proximity to the query and allows controlled backtracking under a bounded query budget, which helps retrieve a more reliable neighbor set for the ratio test and subsequent RANSAC verification.
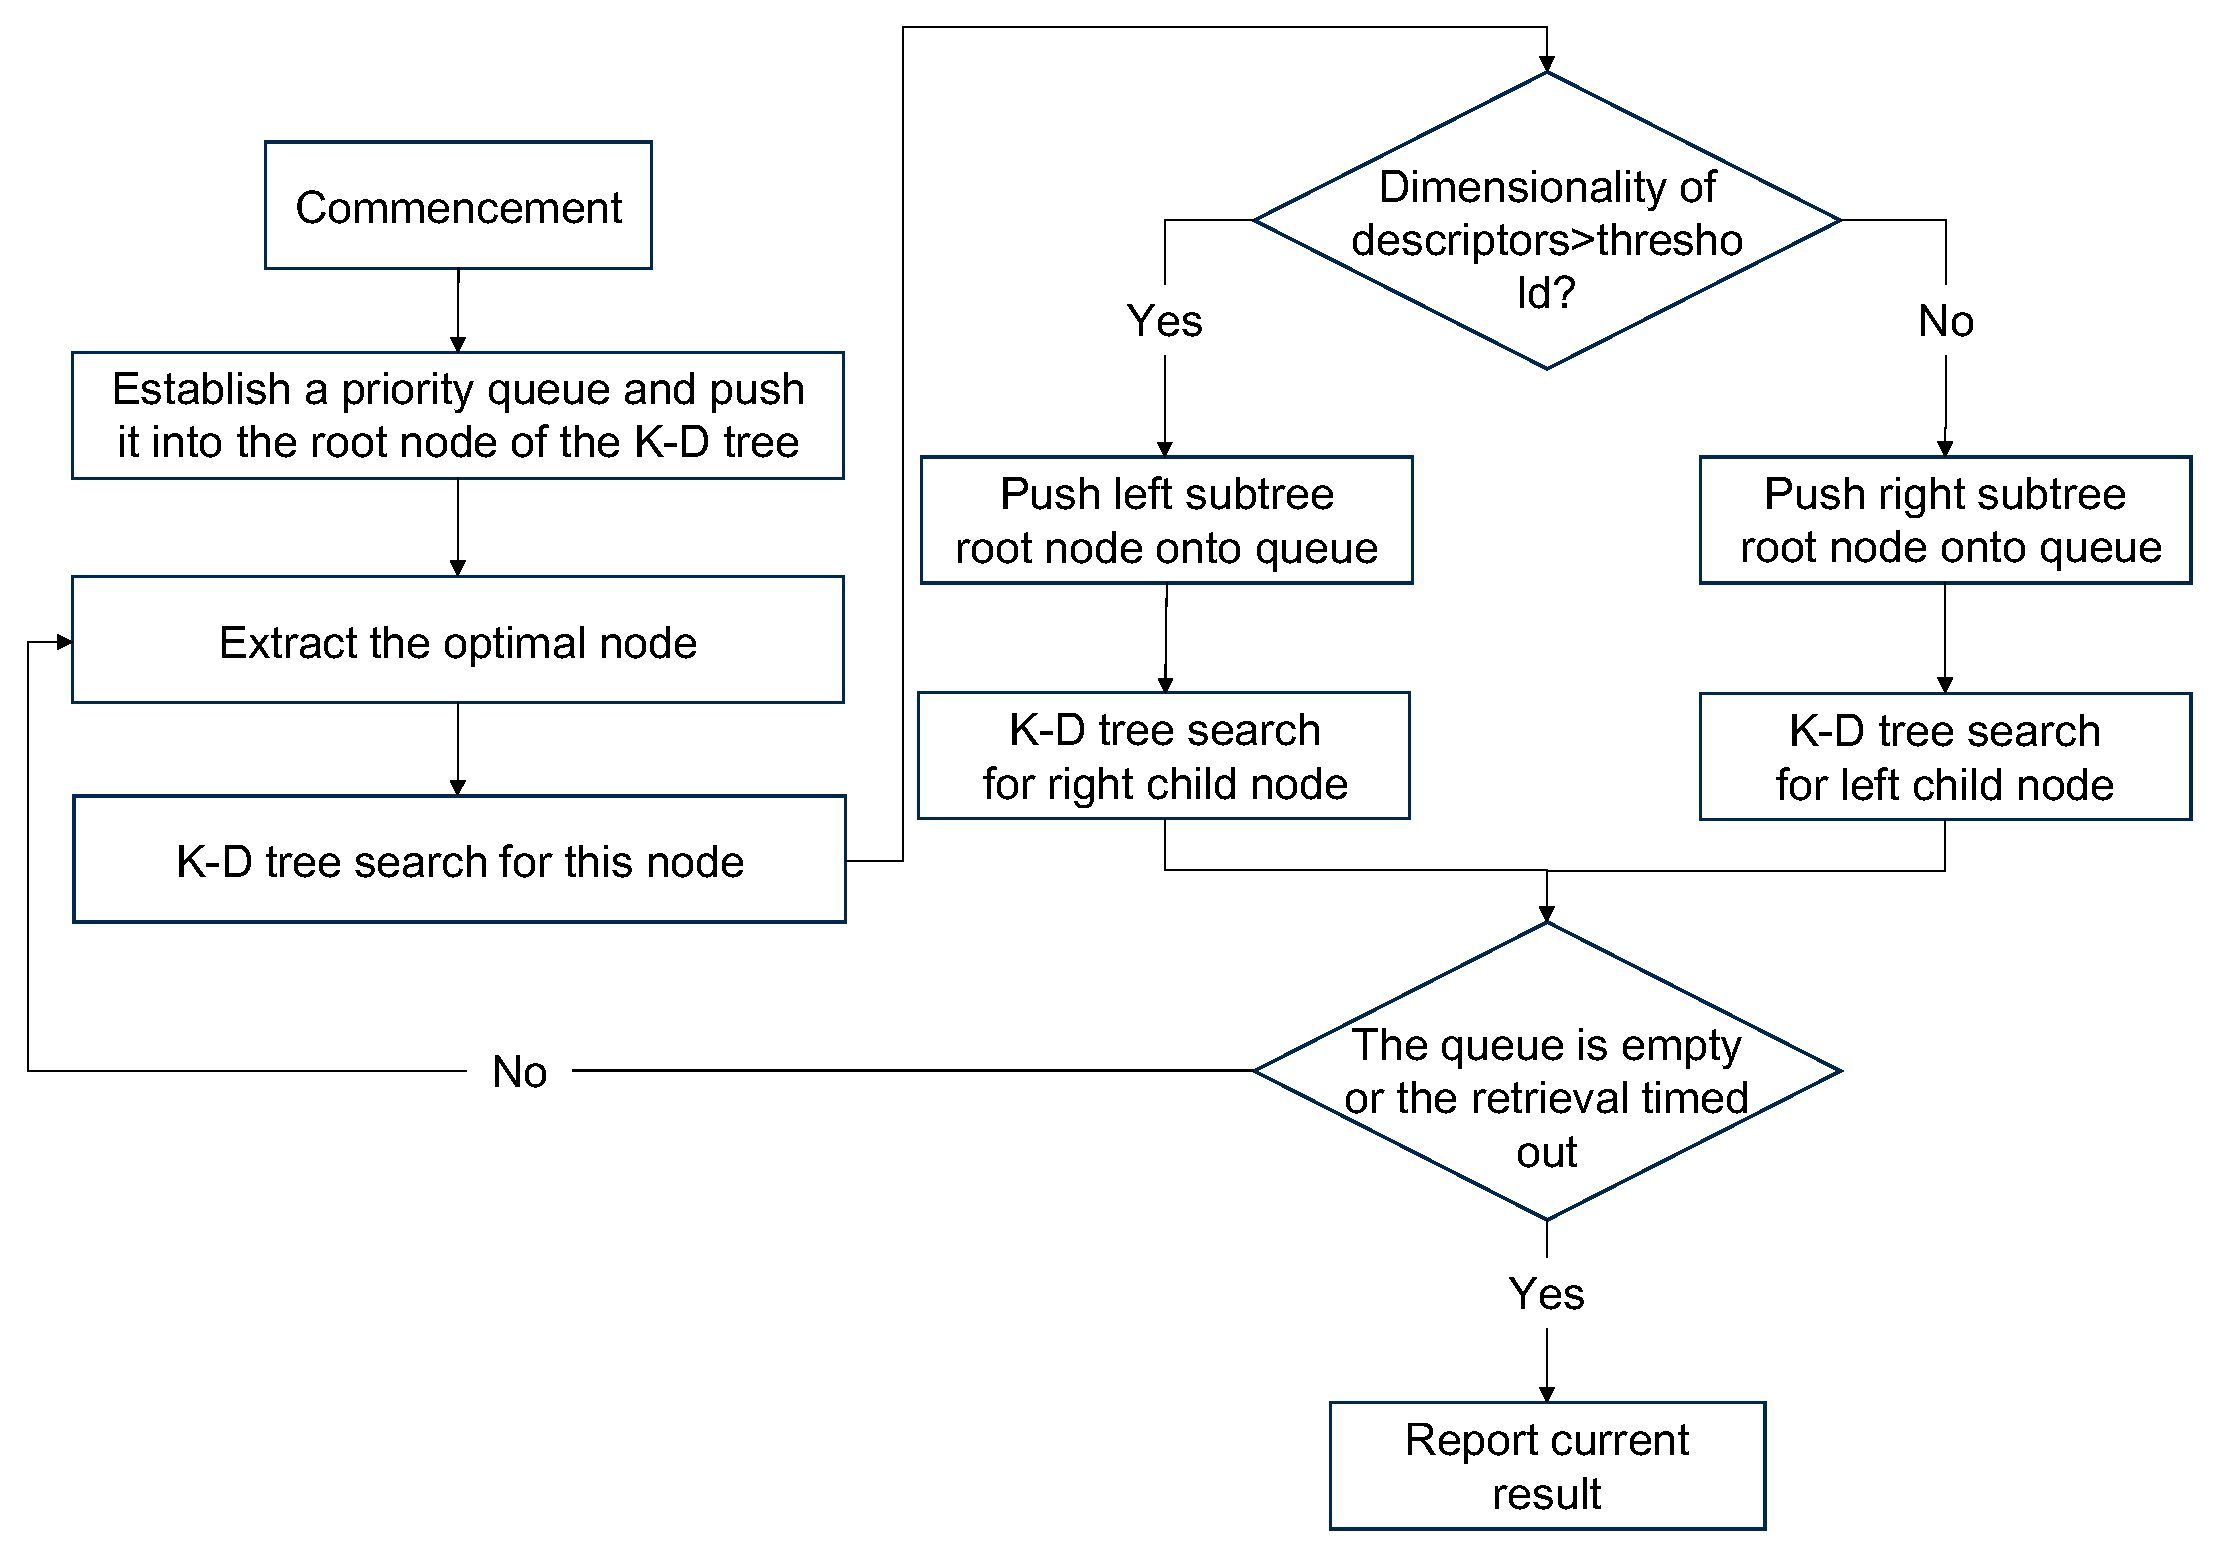
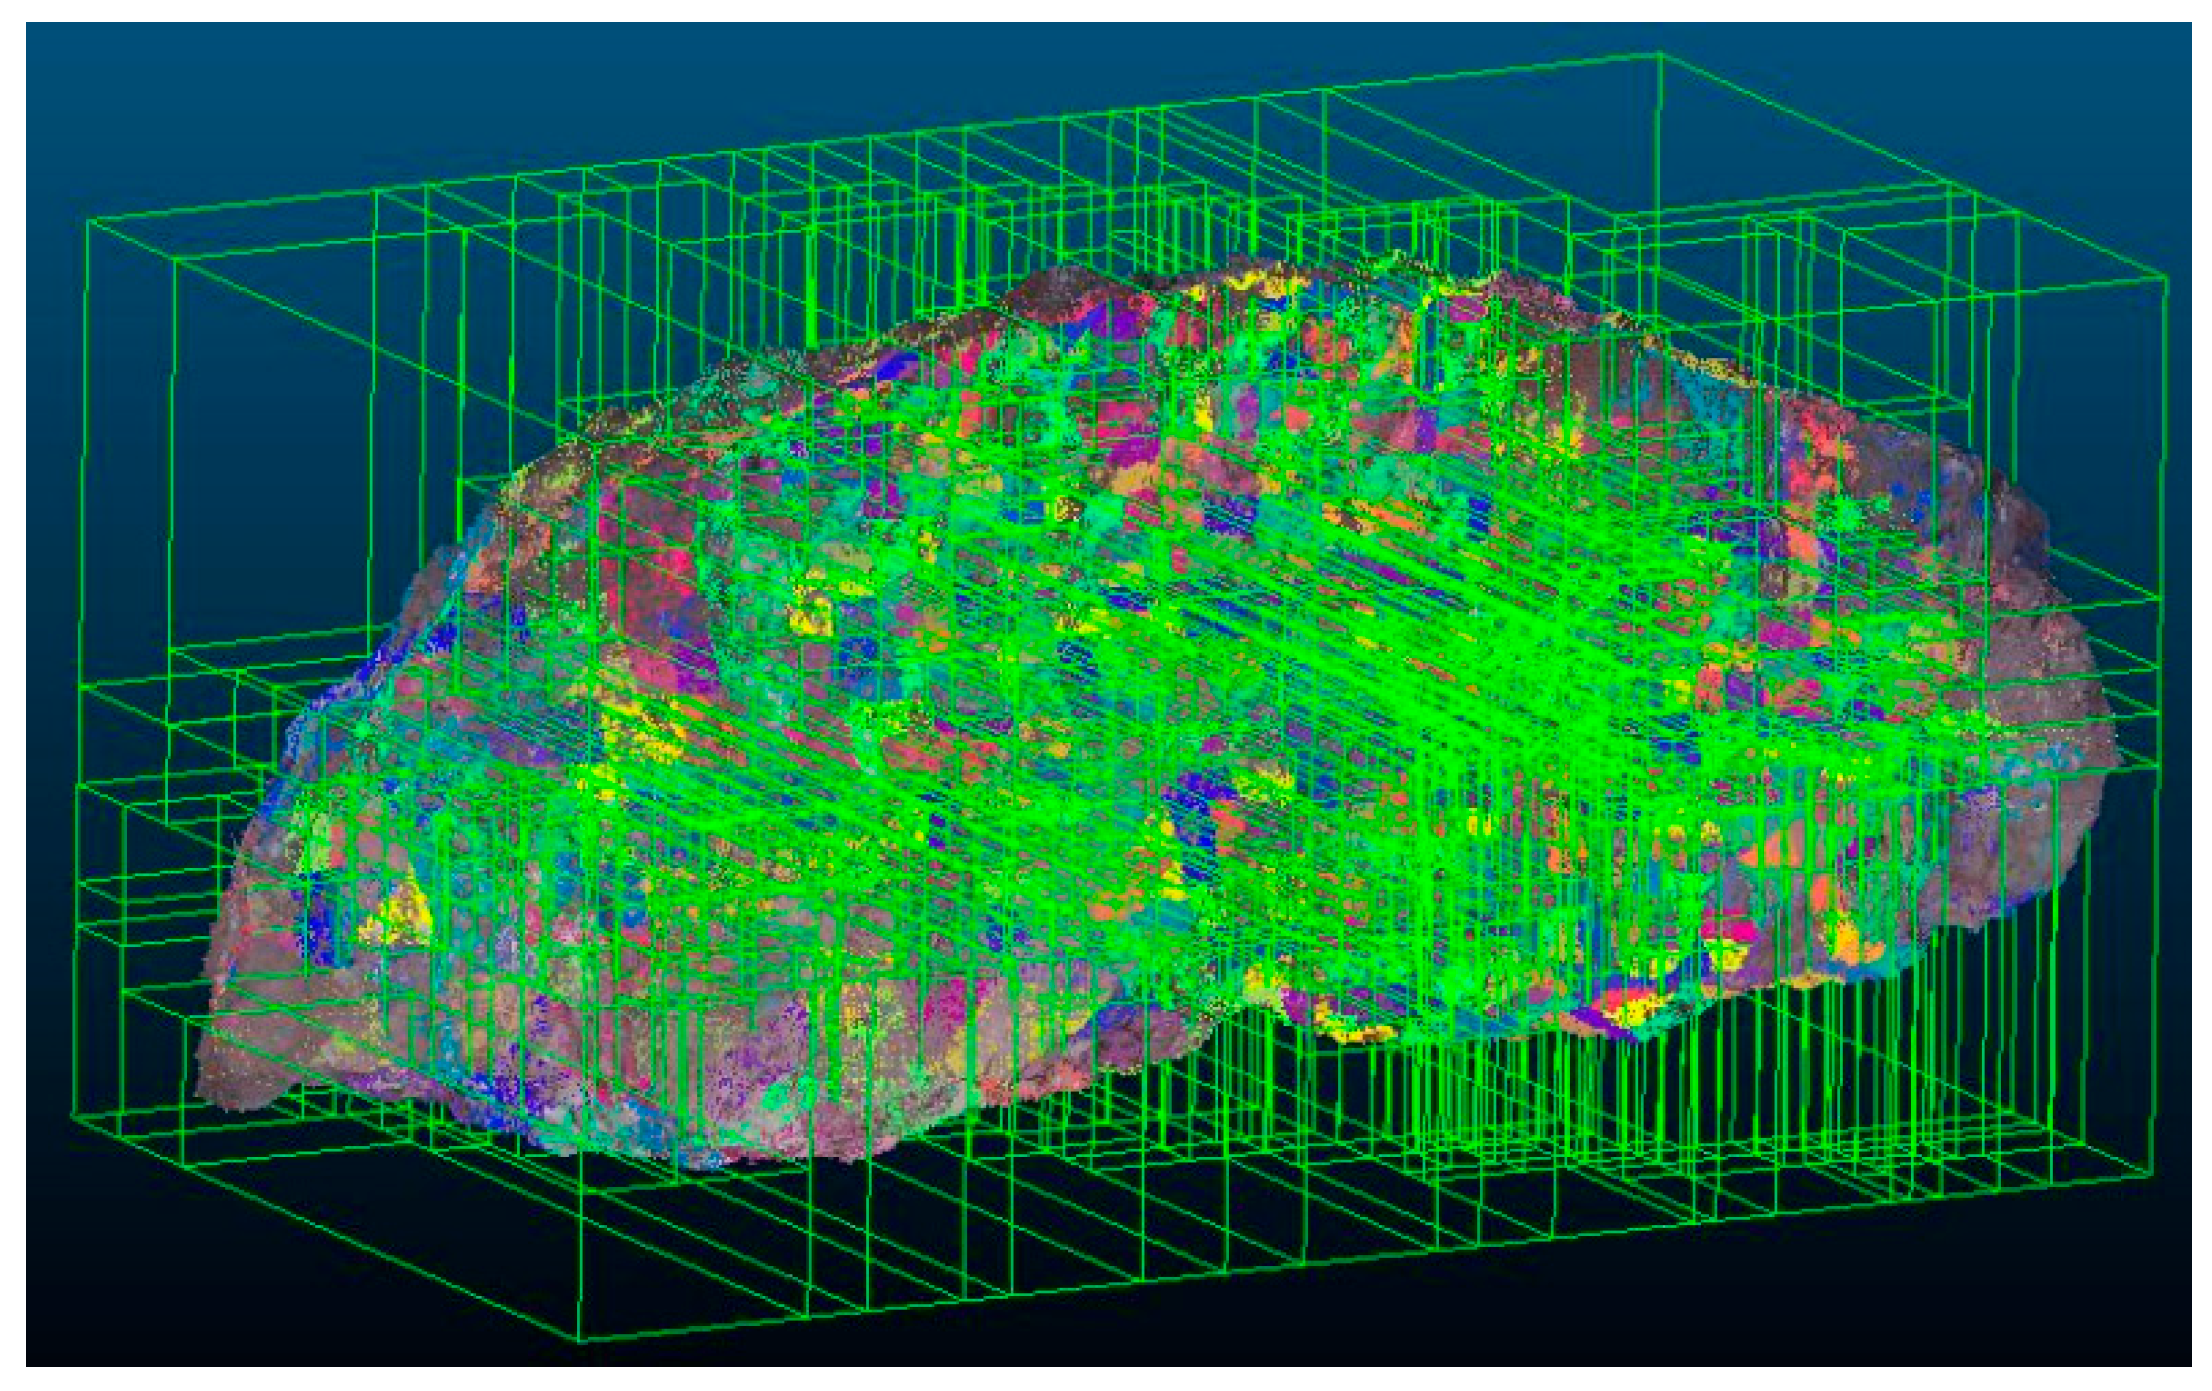
Tentative correspondences are obtained by nearest-neighbor matching of 128-D SIFT descriptors accelerated with a K-D tree and BBF search, followed by geometric verification. In practice, the BBF search is configured by the number of randomized K-D trees and the maximum number of leaf checks, and ambiguous matches are further suppressed using a nearest-neighbor distance ratio criterion before RANSAC verification. The algorithmic flow is illustrated in
Figure 3, while the spatial query structure for a tunnel face is depicted in
Figure 4.
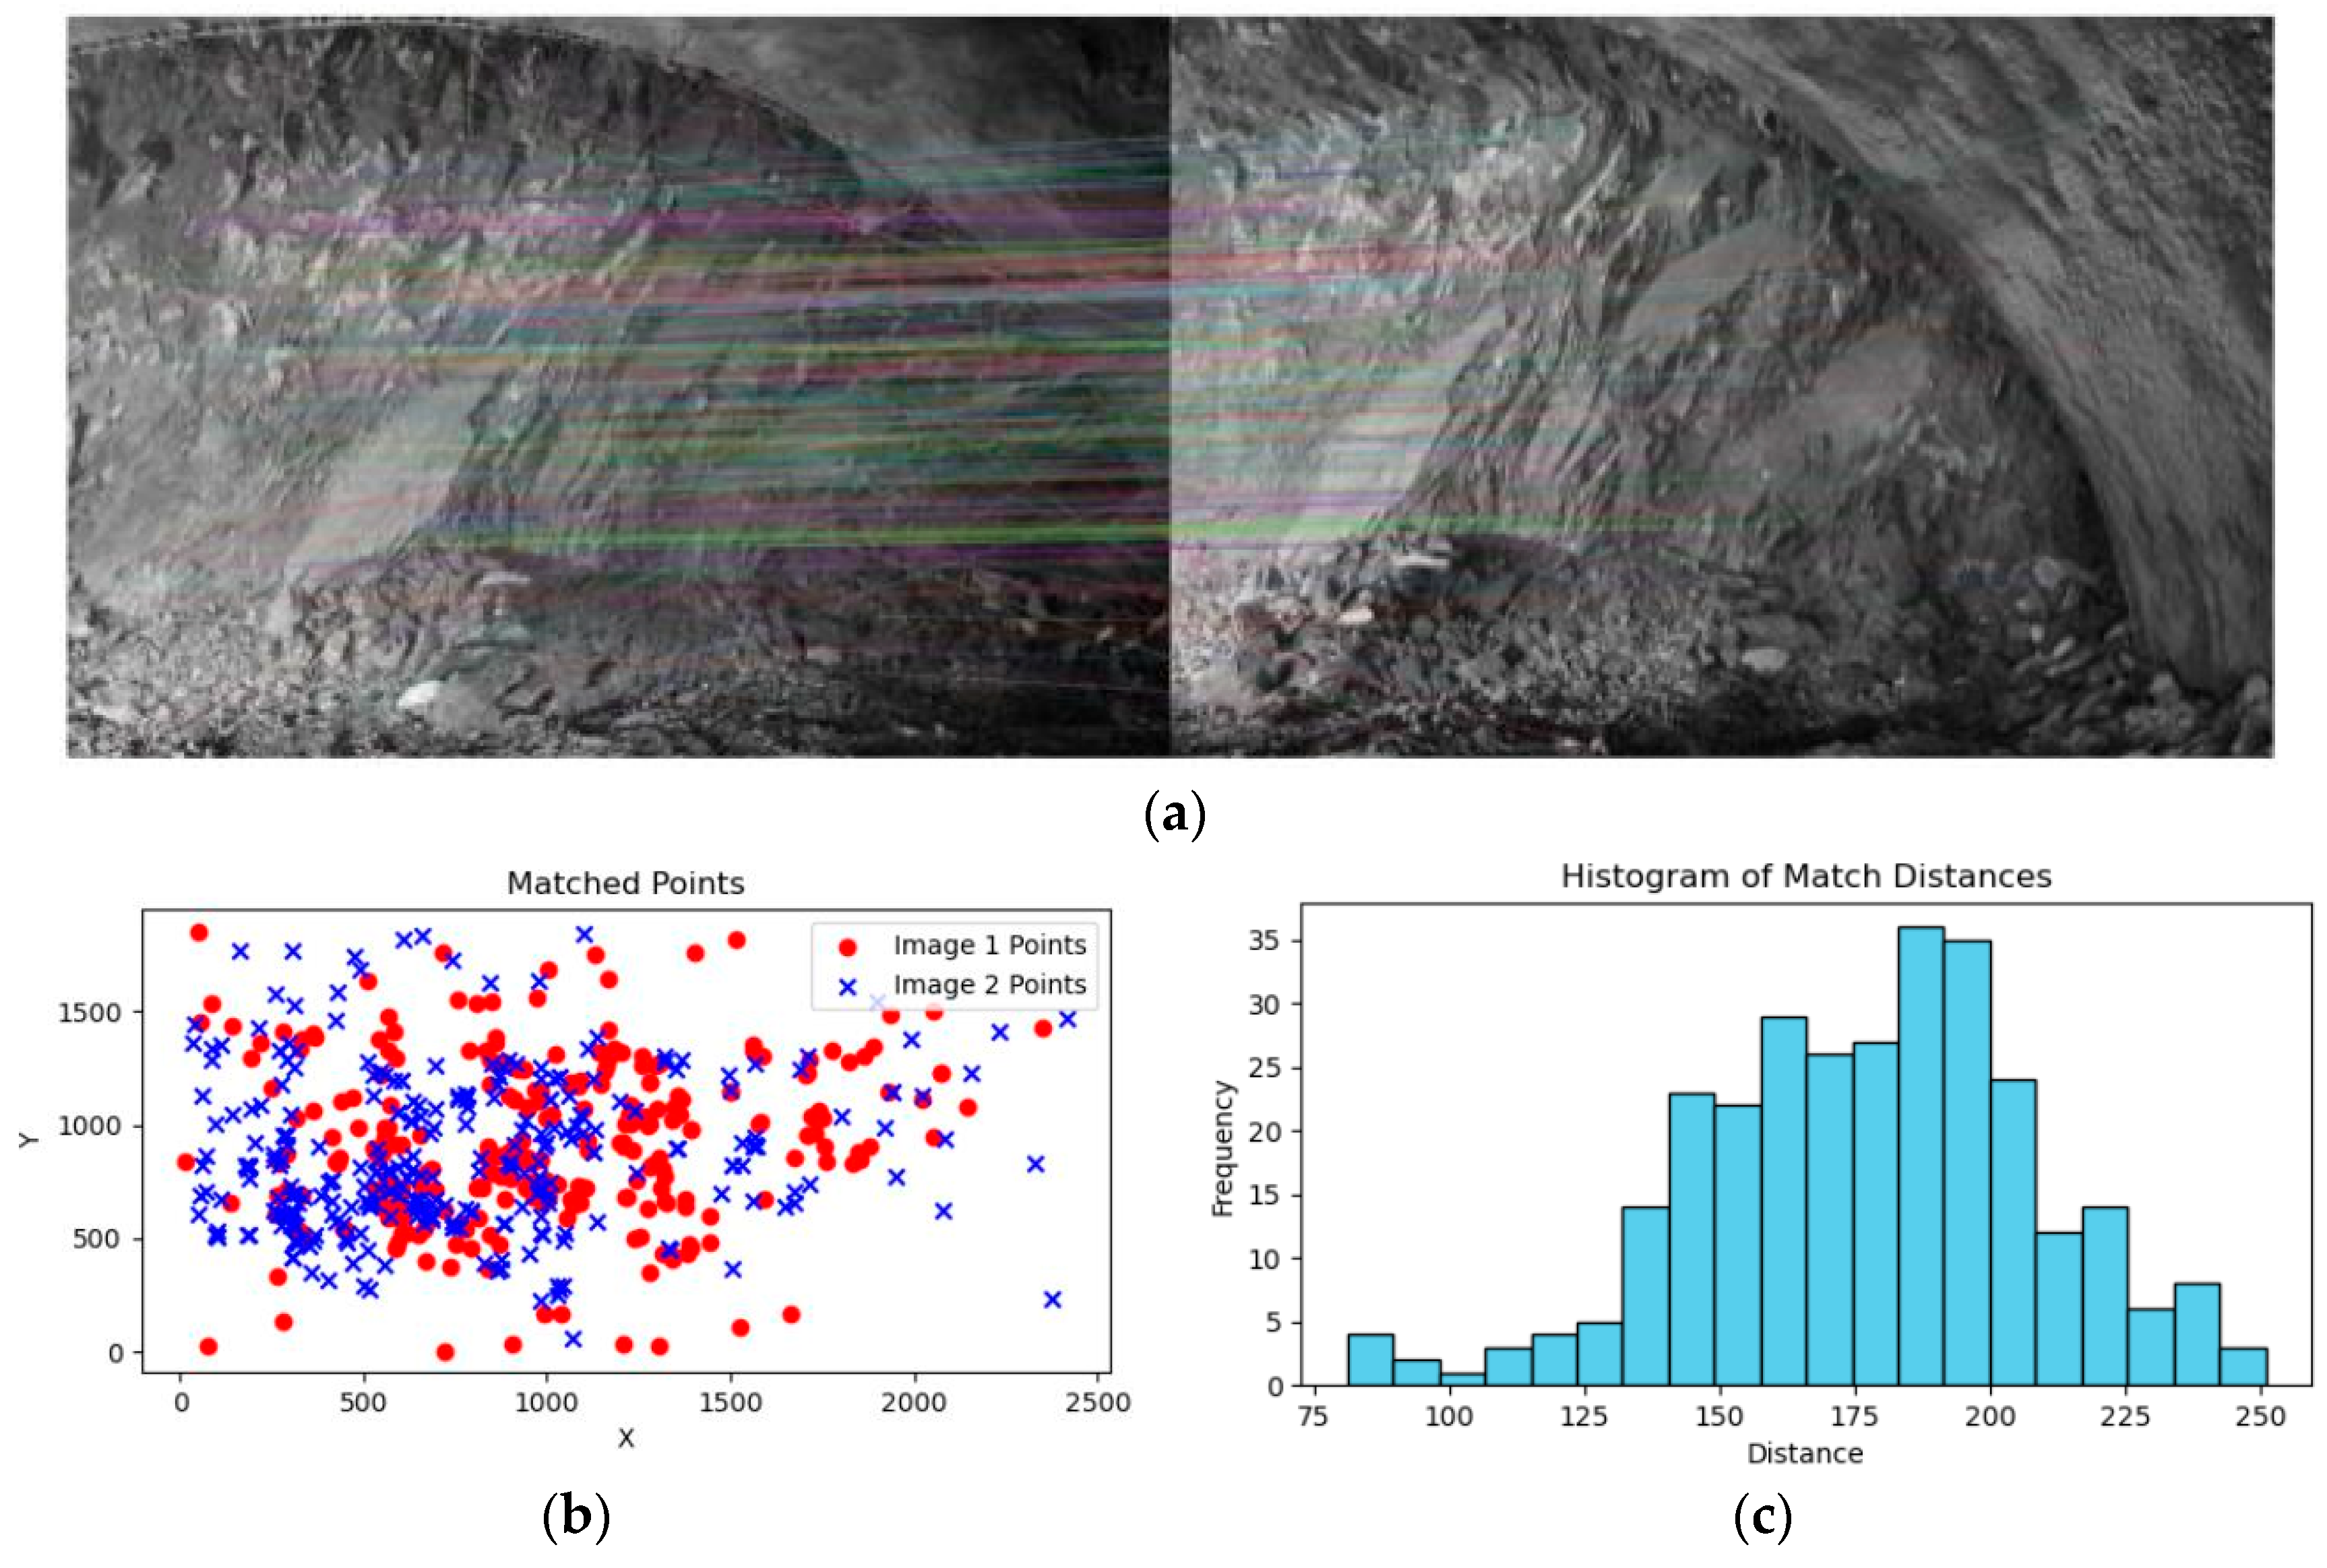
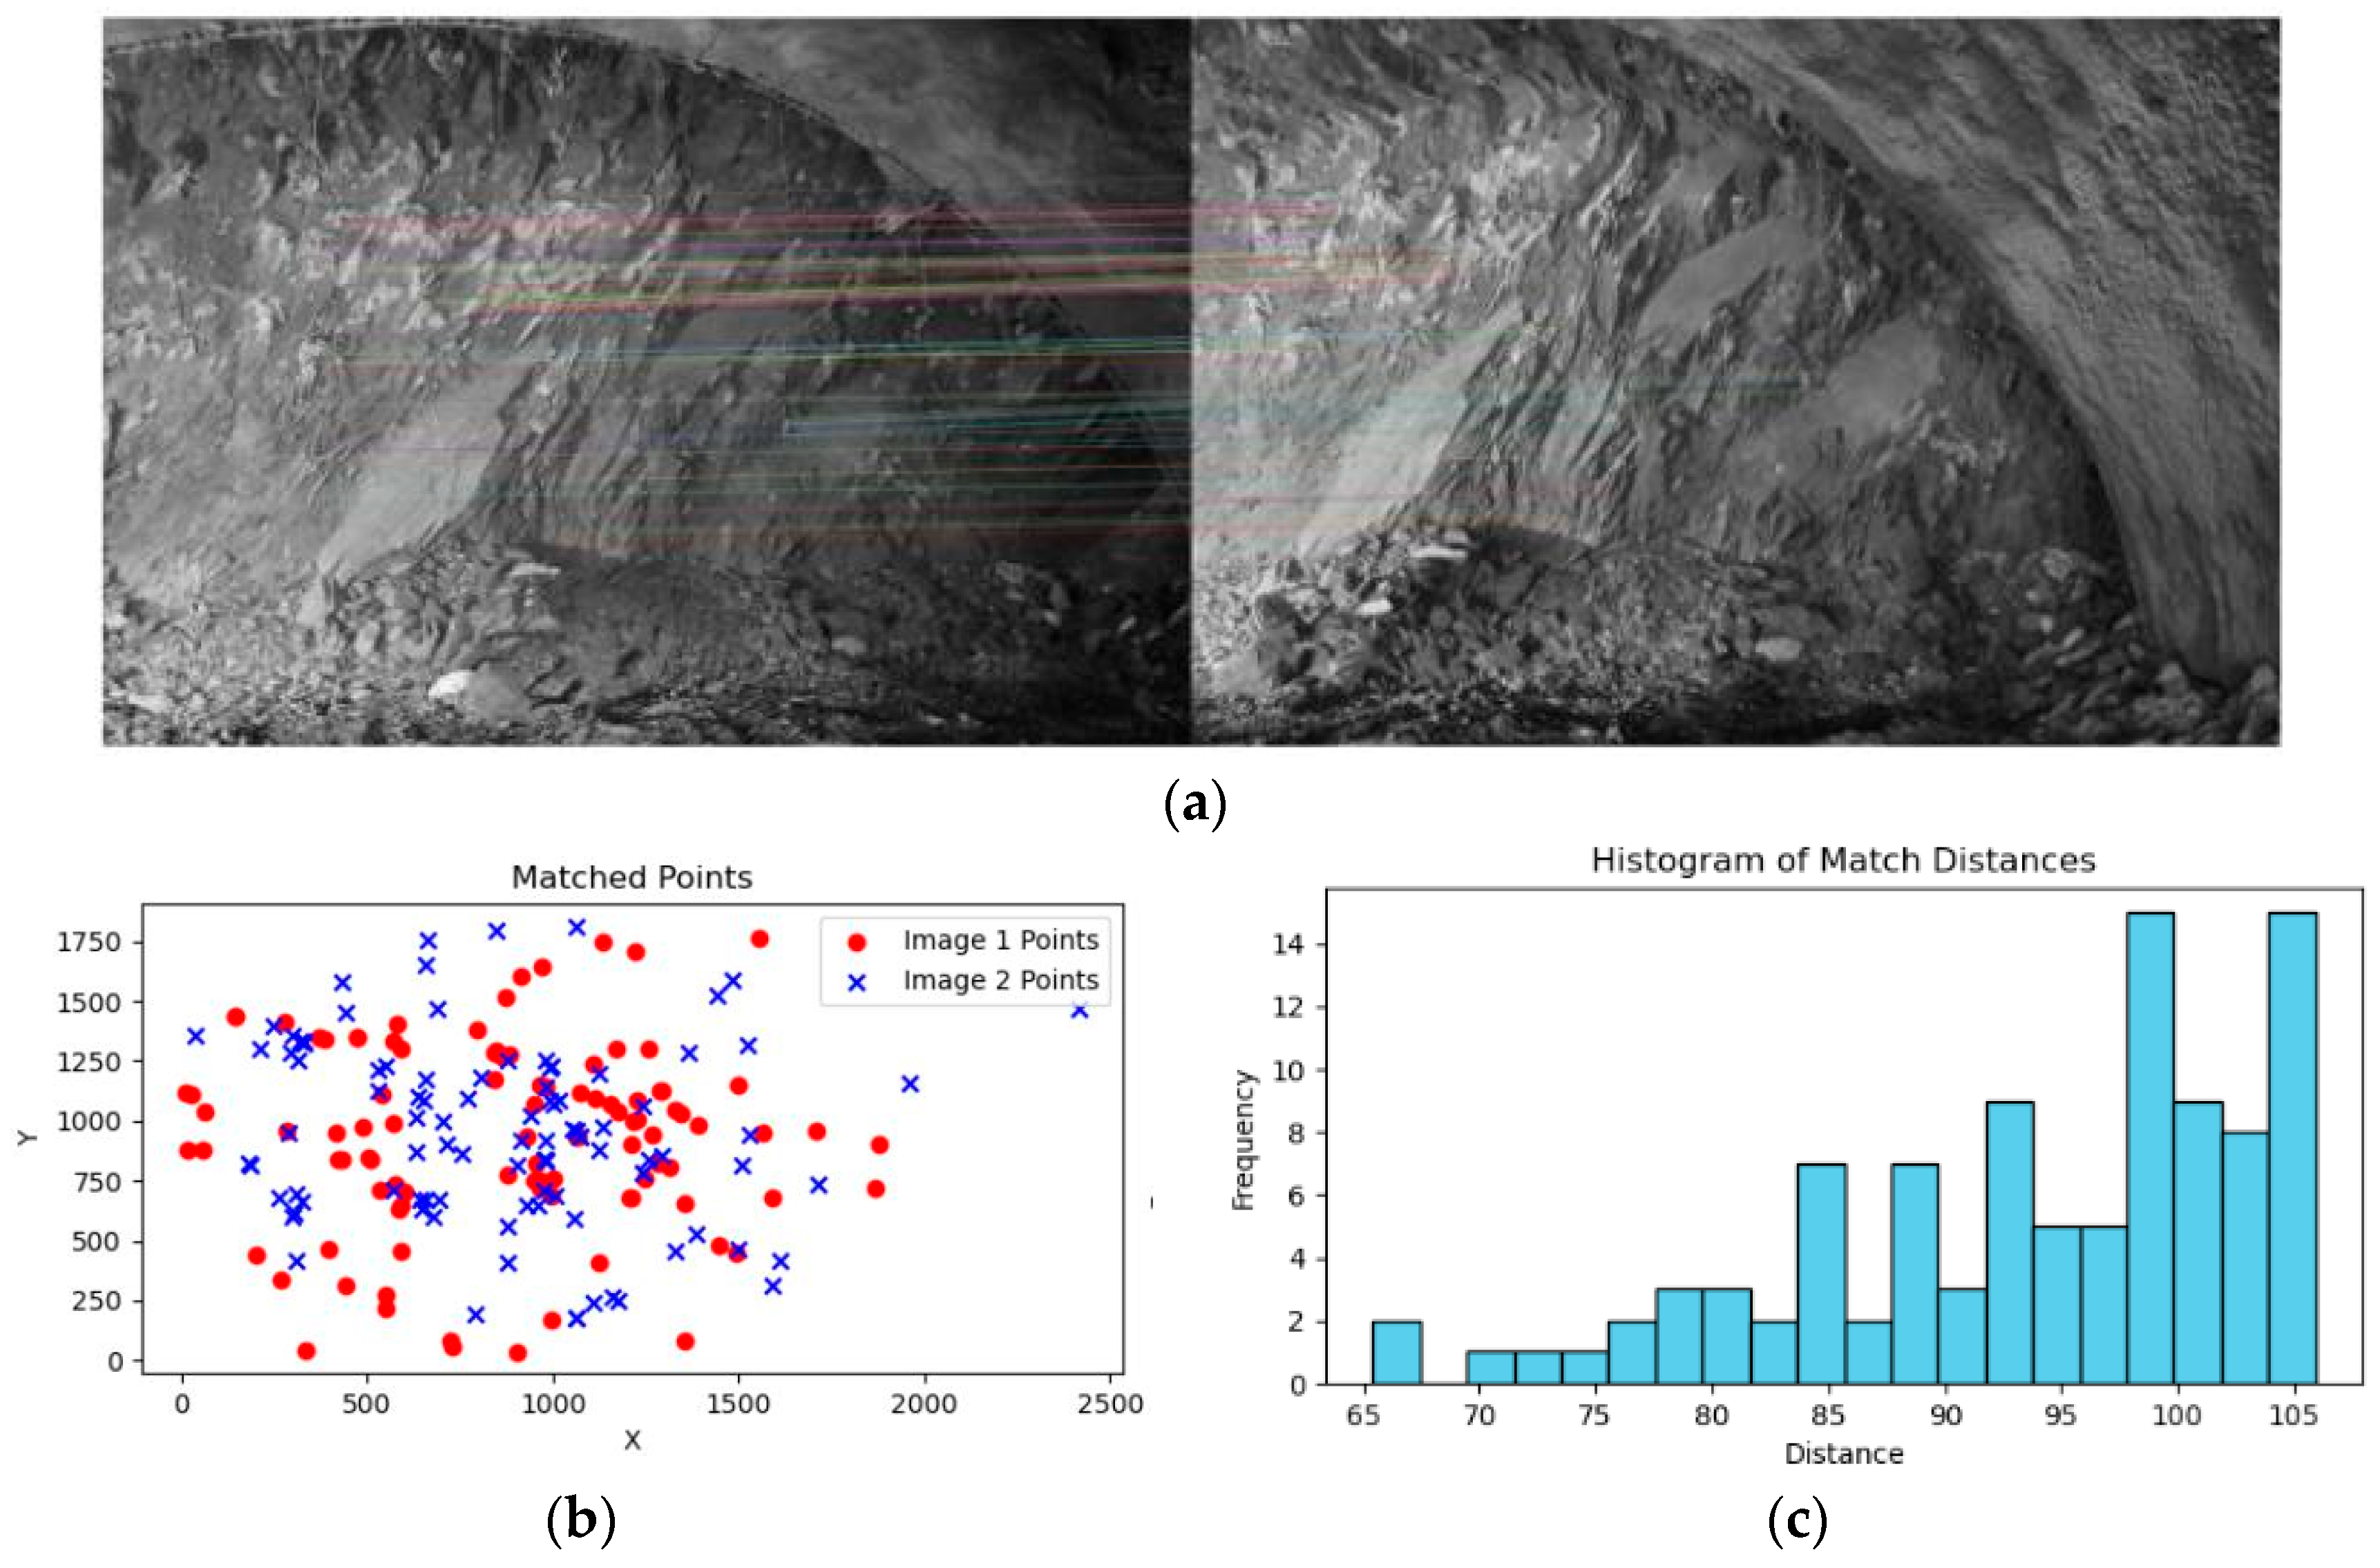
Based on the Python-OpenCV platform, feature point datasets from tunnel face images were imported. Feature point matching was performed using both the SIFT algorithm and an improved K-D tree nearest neighbor search algorithm based on BBF. The matching point coordinates and matching distances for the tunnel face images were calculated. Experimental results are illustrated in
Figure 5.
To ensure a fair comparison, the matching results are obtained using identical SIFT settings, the same ratio-test threshold and RANSAC configuration, while only the nearest-neighbor search strategy is varied (conventional K-D tree versus BBF-guided search). The observed left-shift in the matching-distance distribution and the cleaner correspondence patterns in the repetitive-texture regions indicate fewer ambiguous matches, which is consistent with the expected reduction in tentative-match misalignment on texture-repetitive rock surfaces.
The matching results indicate that the SIFT-based feature point matching algorithm yields a substantial number of matched pairs with relatively high density. However, the matching distances between these pairs are considerable. Greater matching distances imply greater differences between feature points and lower similarity, resulting in lower matching accuracy for this algorithm. Consequently, optimization is required based on this approach. In contrast, the feature point matching algorithm based on the improved K-D tree yields a more uniform distribution of matched pairs with moderate density. The matching distance between pairs is significantly reduced compared to the previous method. A smaller matching distance indicates lesser differences between feature points and higher similarity. Consequently, this algorithm achieves higher matching accuracy and is suitable for feature point matching at tunnel faces.
2.4.3. The RANSAC Algorithm Eliminates Erroneous Matching of Feature Points on Tunnel Face
Following the initial feature point matching of images, errors frequently arise during the matching process. To eliminate these errors, the Random Sampling and Consistency Algorithm (also known as the RANSAC algorithm) is employed. This algorithm effectively addresses mismatches within the matching results. Through random sampling and consistency testing, it filters out correct matching pairs, thereby enhancing the precision and stability of the matching process [
36,
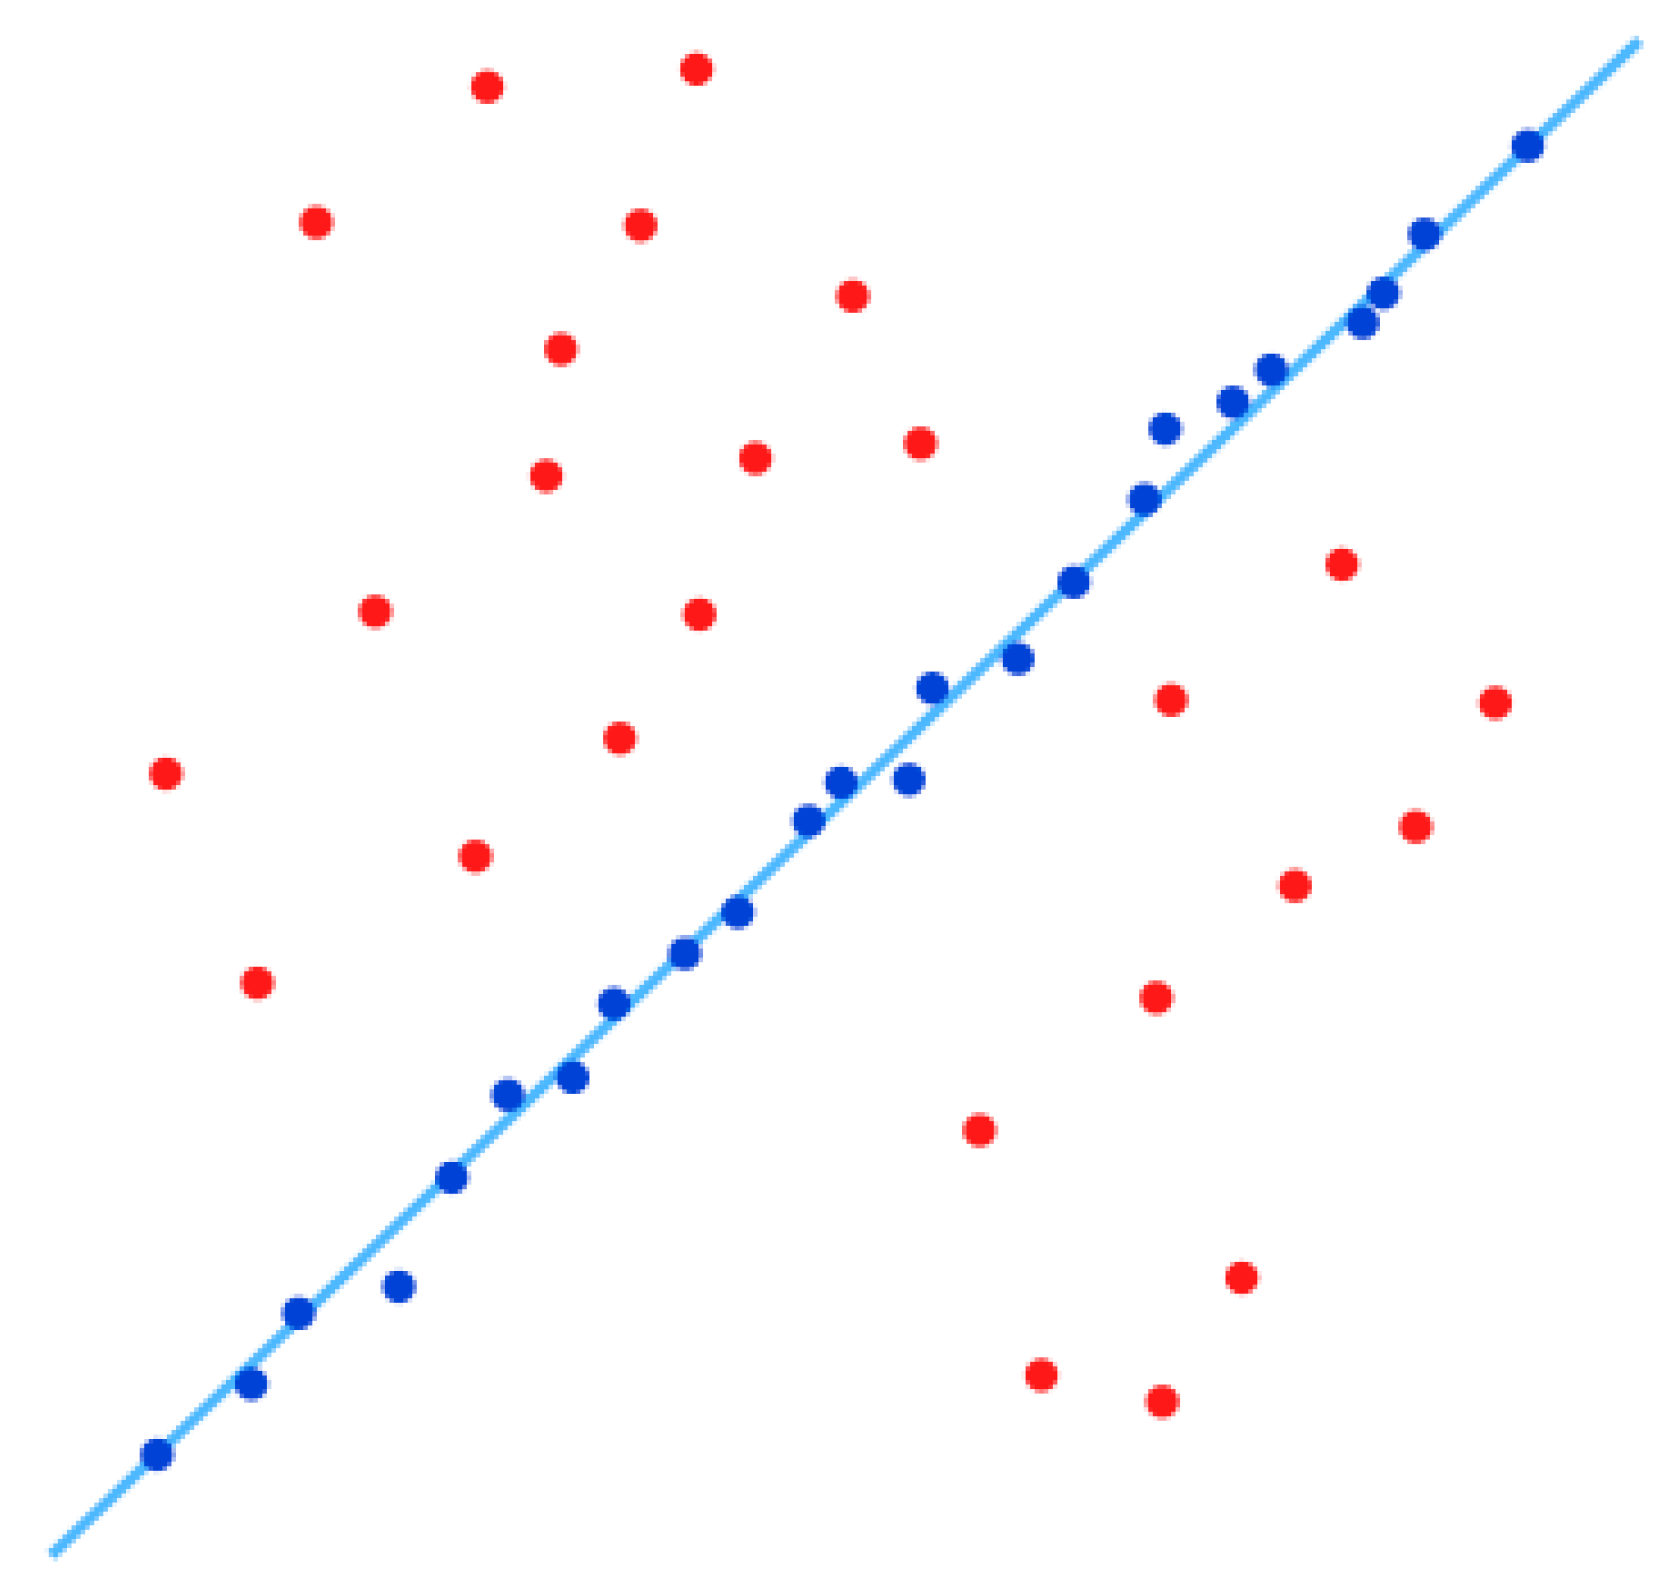
37]. RANSAC is used for geometric verification to reject outlier correspondences and retain an inlier set that supports stable SfM/BA optimization. The RANSAC algorithm employs an iterative strategy to estimate the parameters of a mathematical model from a noisy original dataset. Within this dataset, correct data points are termed inliers, which conform to the optimal parameter model being estimated; anomalous data points are termed outliers, typically representing noise, mismatches, or outliers within the data. Through continuous iteration, the RANSAC algorithm accurately estimates the optimal parameter model even in the presence of outliers, thereby functioning as an outlier detection algorithm. This enhances feature point matching efficiency by eliminating mismatches and identifying the optimal matching model during feature matching. The principle of the RANSAC algorithm is illustrated in
Appendix A Figure A8.
Based on the Python-OpenCV platform, the feature point dataset of the tunnel face image was imported. The RANSAC algorithm was employed to eliminate misalignments, and the matched point coordinates, matching distances, inlier ratio, distance-ratio statistics, and geometric residuals were calculated. The experimental results are illustrated in
Figure 6 and
Table 2.
As shown in the feature-match visualization and
Table 2, the BBF-KD matching results were further refined after RANSAC-based geometric verification. After nearest-neighbor distance-ratio screening, 105 tentative correspondences were obtained, of which 89 were retained as inliers after RANSAC, corresponding to an inlier ratio of 0.8476. Meanwhile, the distance-ratio and matching-distance statistics decreased slightly after geometric verification. Together with the visual reduction in mismatched correspondences, these results indicate that RANSAC effectively removed geometrically inconsistent matches and improved the reliability of the retained correspondences for subsequent 3D reconstruction.
2.5. Three-Dimensional Reconstruction of Tunnel Face Imagery
Following the completion of feature point matching, the process proceeds to the 3D model construction phase. This paper employs multi-image reconstruction for 3D reconstruction, with the primary workflow encompassing sparse point cloud reconstruction, dense point cloud reconstruction, and Poisson surface reconstruction. First, utilizing the feature point matching results, a sparse 3D point cloud is generated via the Structure from Motion (SfM) algorithm, concurrently recovering camera pose and calculating the 3D coordinates of feature points. Subsequently, the CMVS clustering algorithm is employed to optimize data segmentation, thereby reducing computational load. This is then combined with the PMVS algorithm to generate a dense 3D point cloud. Finally, the 3D model construction is completed through the Poisson surface reconstruction method.
- (1)
Sparse Point Cloud Reconstruction Process and Optimization.
Sparse point cloud reconstruction is a technique that restores the 3D coordinates of key feature points within a scene by leveraging feature matching relationships from multi-view two-dimensional images. Its core objective is to construct the fundamental geometric skeleton of the tunnel face. Within tunnel environments, this requires integration with robust incremental SfM algorithms [
38], following the specific workflow outlined below.
First, based on the extracted feature point matching information, the coordinate correspondence between images at different angles is determined using the principle of polar geometry. This enables the calculation of the fundamental matrix (F) and the essential matrix (E), thereby restoring the camera’s initial pose (rotation matrix R and translation vector T). Triangulation converts matched feature points into 3D coordinates, generating an initial sparse point cloud and local coordinate system. Subsequently, an incremental expansion strategy is employed: new images are progressively incorporated, utilizing the existing 3D point cloud to solve the camera pose of the new image via the PnP algorithm. Triangulation then supplements new 3D points, enabling the expansion of both the point cloud and the camera trajectory.
However, incremental algorithms are prone to drift issues during scaling due to accumulated errors (i.e., deviation between the point cloud and the actual scene). To address this, Bundle Adjustment (BA) optimization models must be introduced to resolve contradictory observations. Its core principle involves treating the projection from 3D spatial points onto the image plane as a beam. By minimizing the reprojection error (the Euclidean distance between the observed image point and the secondary projection point of the 3D point), all camera parameters and 3D point coordinates are simultaneously optimized. The objective function of the BA model is expressed as in Equation (1):
In Equation (1),
n denotes the number of 3D points;
m denotes the number of images;
xij represents the observed pixel of the
i-th 3D point in the
j-th image; and
Pj(
Xi) denotes the predicted coordinate of the 3D point
Xi through the projection matrix of the
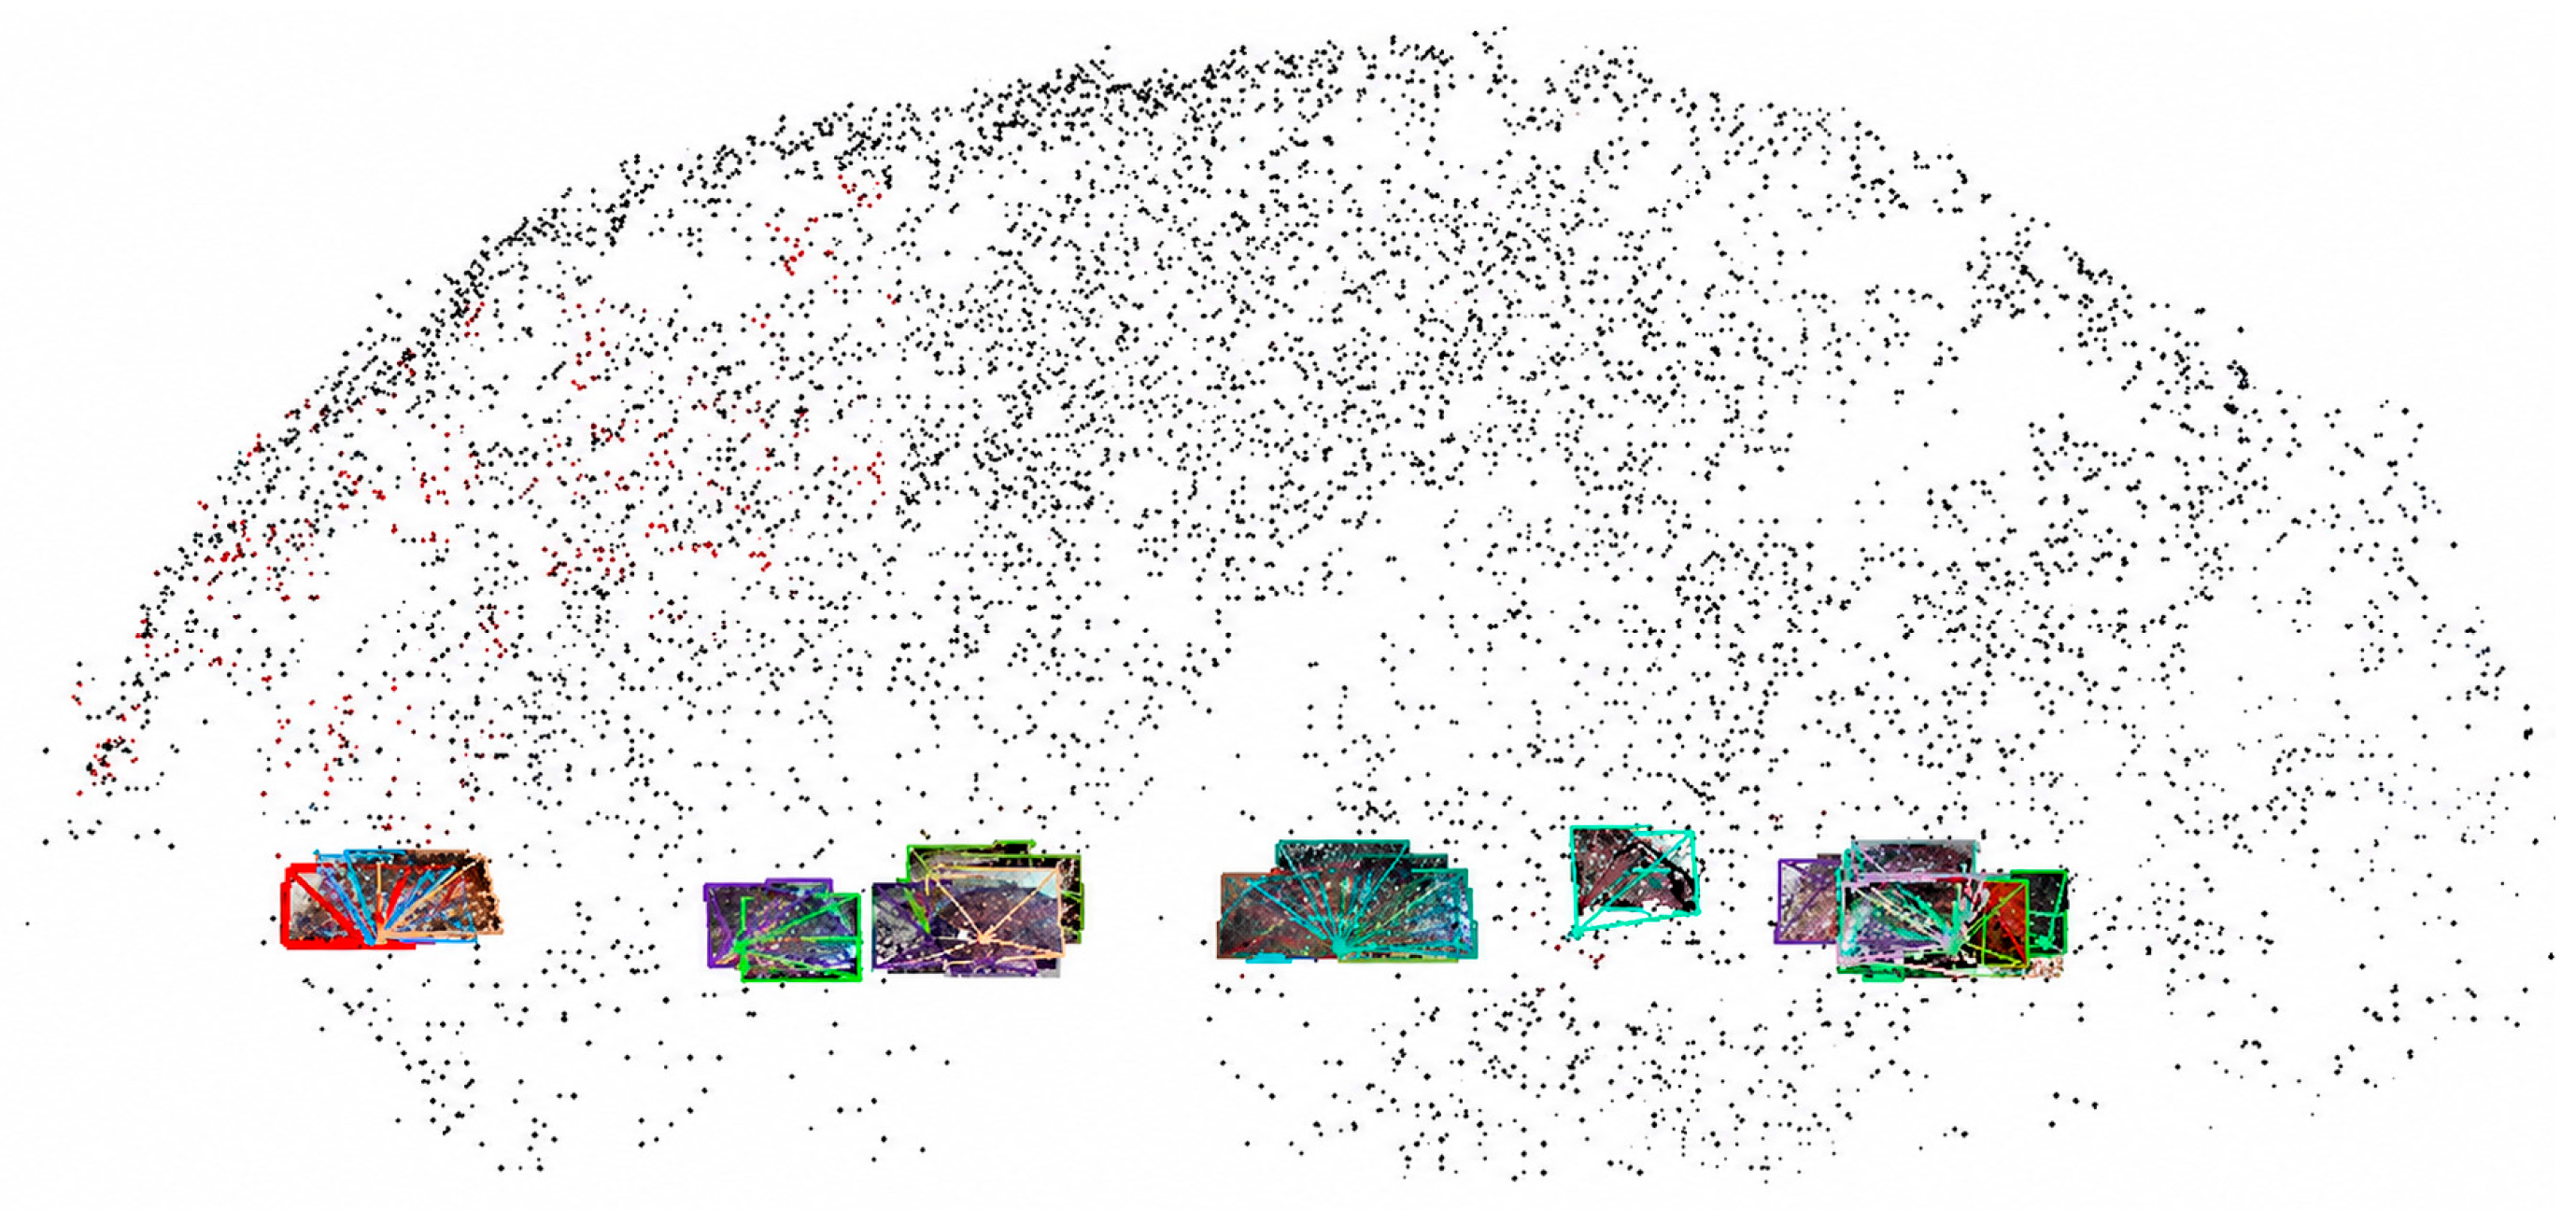
j-th camera. This model is solved using non-linear least squares, with the Levenberg–Marquardt (LM) algorithm being the preferred choice in practical applications. By dynamically adjusting the confidence region, it converges towards the Newton method when convergence is rapid (enhancing accuracy) and towards the steepest gradient method when convergence is slow (ensuring stability), thereby achieving efficient iterative optimization. Finally, the tunnel face images and corresponding feature point information were imported into the VisualSfM 0.5.26 platform (as illustrated in
Appendix A Figure A9). Through the aforementioned process, a high-precision sparse point cloud was generated (as illustrated in
Appendix A Figure A10), laying the foundation for subsequent dense reconstruction and blast effect analysis.
- (2)
Dense Point Cloud Reconstruction Algorithms and Workflow.
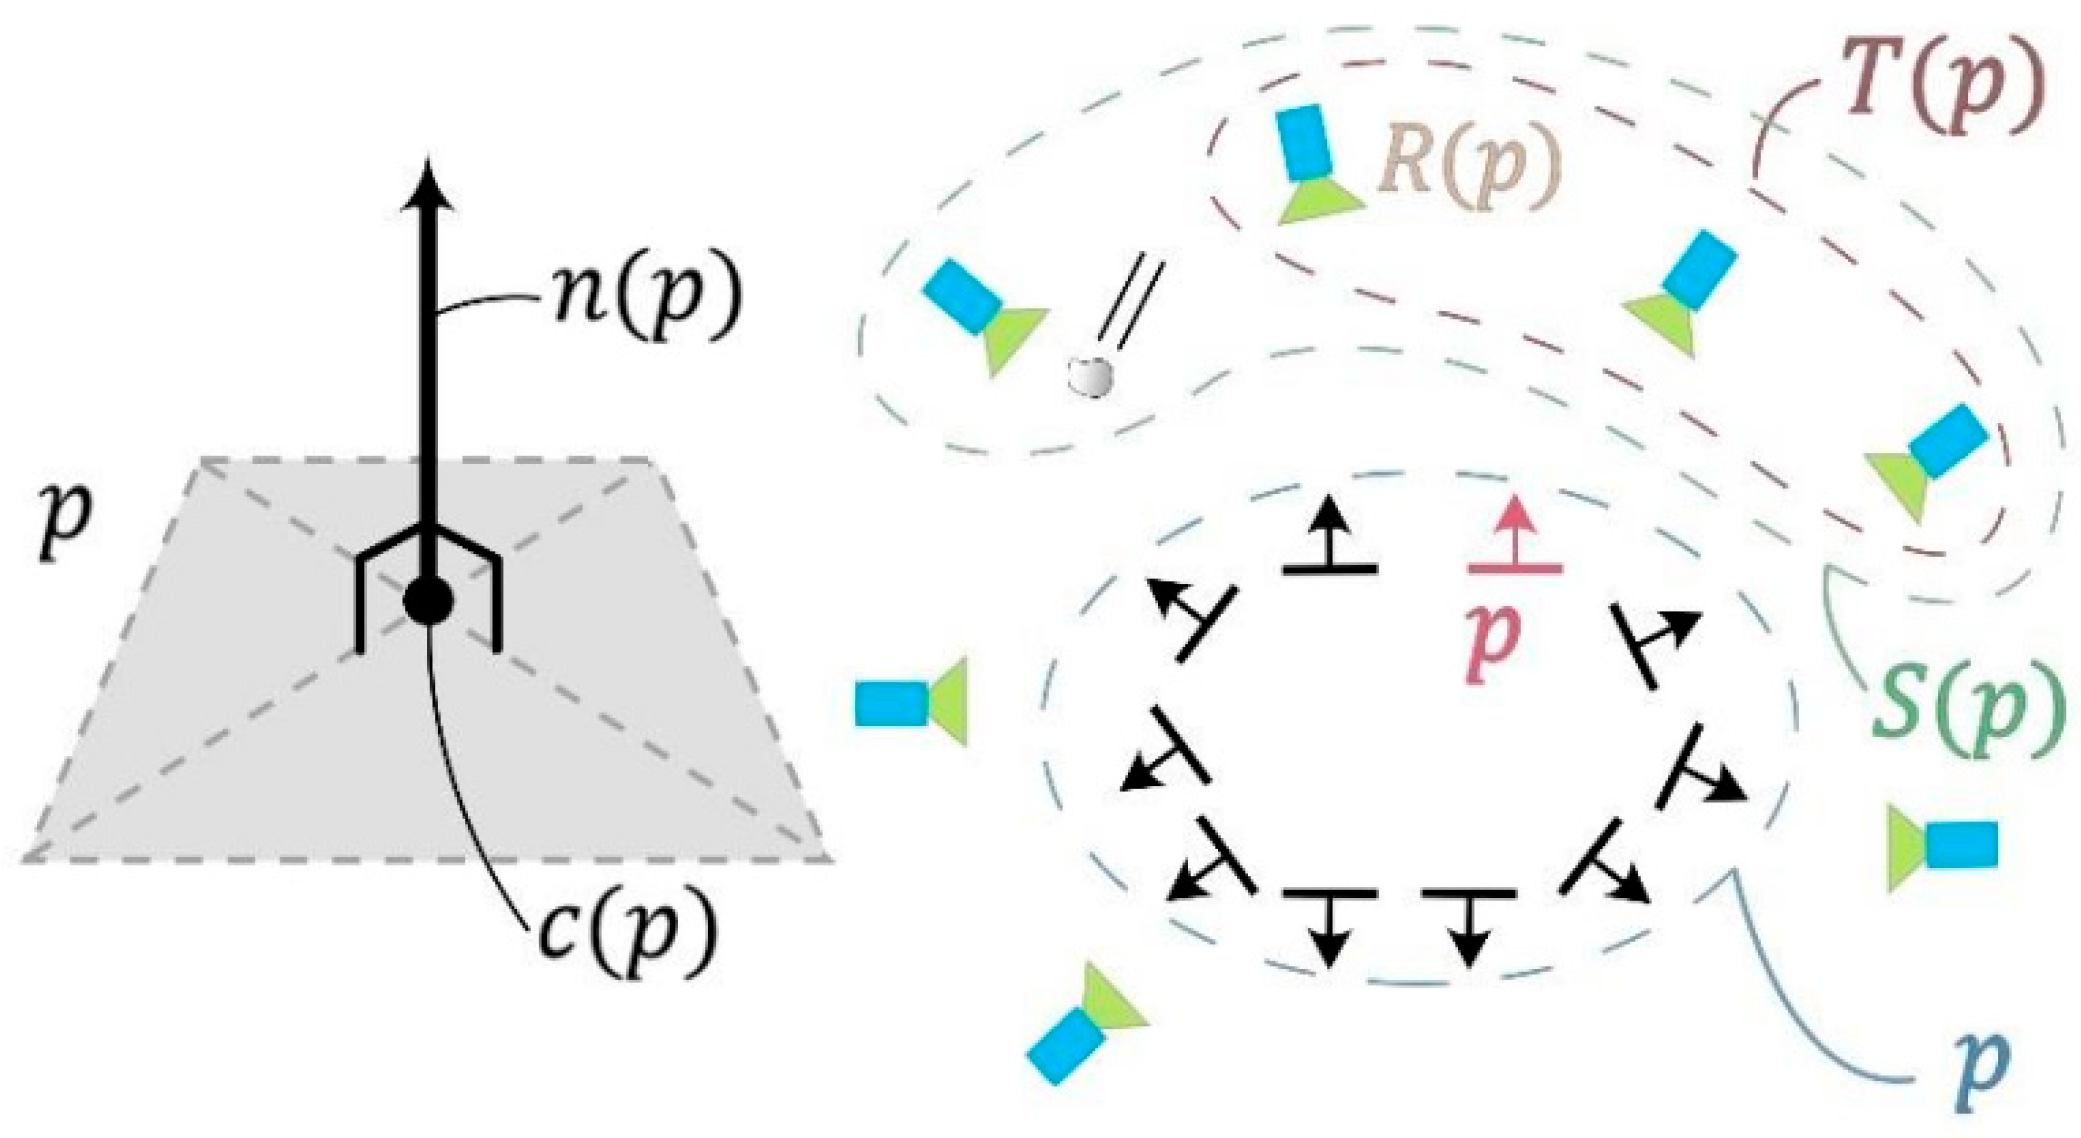
The sparse point clouds generated via SfM exhibit low density, rendering them inadequate for capturing surface texture details of the tunnel face. Consequently, dense matching techniques are required to generate dense 3D point clouds. This paper employs a dense matching framework based on multi-view geometry, utilizing a combination of CMVS/PMVS (Clustering Multi-View Stereo/Patch-Based Multi-View Stereo) algorithms to achieve this objective: CMVS first performs multi-image clustering classification to reduce reconstruction data volume, thereby enhancing computational efficiency and accuracy; subsequently, PMVS, based on a patch model, completes the dense matching process, ultimately generating a dense point cloud. CMVS partitions the image set into overlapping clusters to improve scalability, and PMVS densifies each cluster by expanding photometrically consistent patches to form a dense point cloud. Following CMVS clustering classification, the PMVS algorithm is employed for dense reconstruction. This algorithm utilizes the clustered sparse point cloud as its foundation, fitting an unknown surface in 3D space through local tangent planes (patch models). It further extends information in non-featured regions (such as areas lacking texture) to fill in details. In computer vision, a patch model is defined as a 3D rectangle determined by its center point (coordinates of the diagonal intersection), unit normal (a unit vector from the center point towards the camera center of the reference image), and the reference image itself. One side remains parallel to the camera coordinate axes, with projected dimensions satisfying the condition of being ‘recognizable within the reference image and visibly present in other images’ (the relationship between patch models and the image set is illustrated in
Appendix A Figure A11). This process efficiently generates a dense point cloud with complete coverage and uniform density, laying the foundation for subsequent surface reconstruction and blast effect analysis.
Using the MeshLab 2022.02 platform, sparse point cloud data from the tunnel face was input. The CMVS/PMVS algorithm was applied to perform dense 3D reconstruction of the tunnel face point cloud, with the reconstruction results illustrated in
Appendix A Figure A12.
- (3)
Poisson Surface Reconstruction.
Dense point clouds, while capable of reproducing the geometric contours of target objects in a relatively vivid manner, remain fundamentally collections of numerous isolated 3D points. Their surfaces often exhibit coarse textures due to noise interference, and may even contain local voids [
39]. To address this issue, surface reconstruction techniques are required to generate continuous, smooth 3D models. This paper employs the Poisson surface reconstruction method to achieve this objective. Poisson surface reconstruction is a surface generation algorithm based on implicit functions. Its core principle involves solving the Poisson equation to fit the optimal surface to point cloud data, thereby precisely describing the geometric shape of the target object.
A Poisson surface reconstruction is applied to convert the dense point cloud into a watertight mesh for subsequent geometric analysis. Poisson meshing is controlled primarily by the octree depth and samples-per-node settings, which balance surface detail preservation and noise smoothing; these parameters are selected to generate a stable mesh for curvature computation and trace/plane analysis.
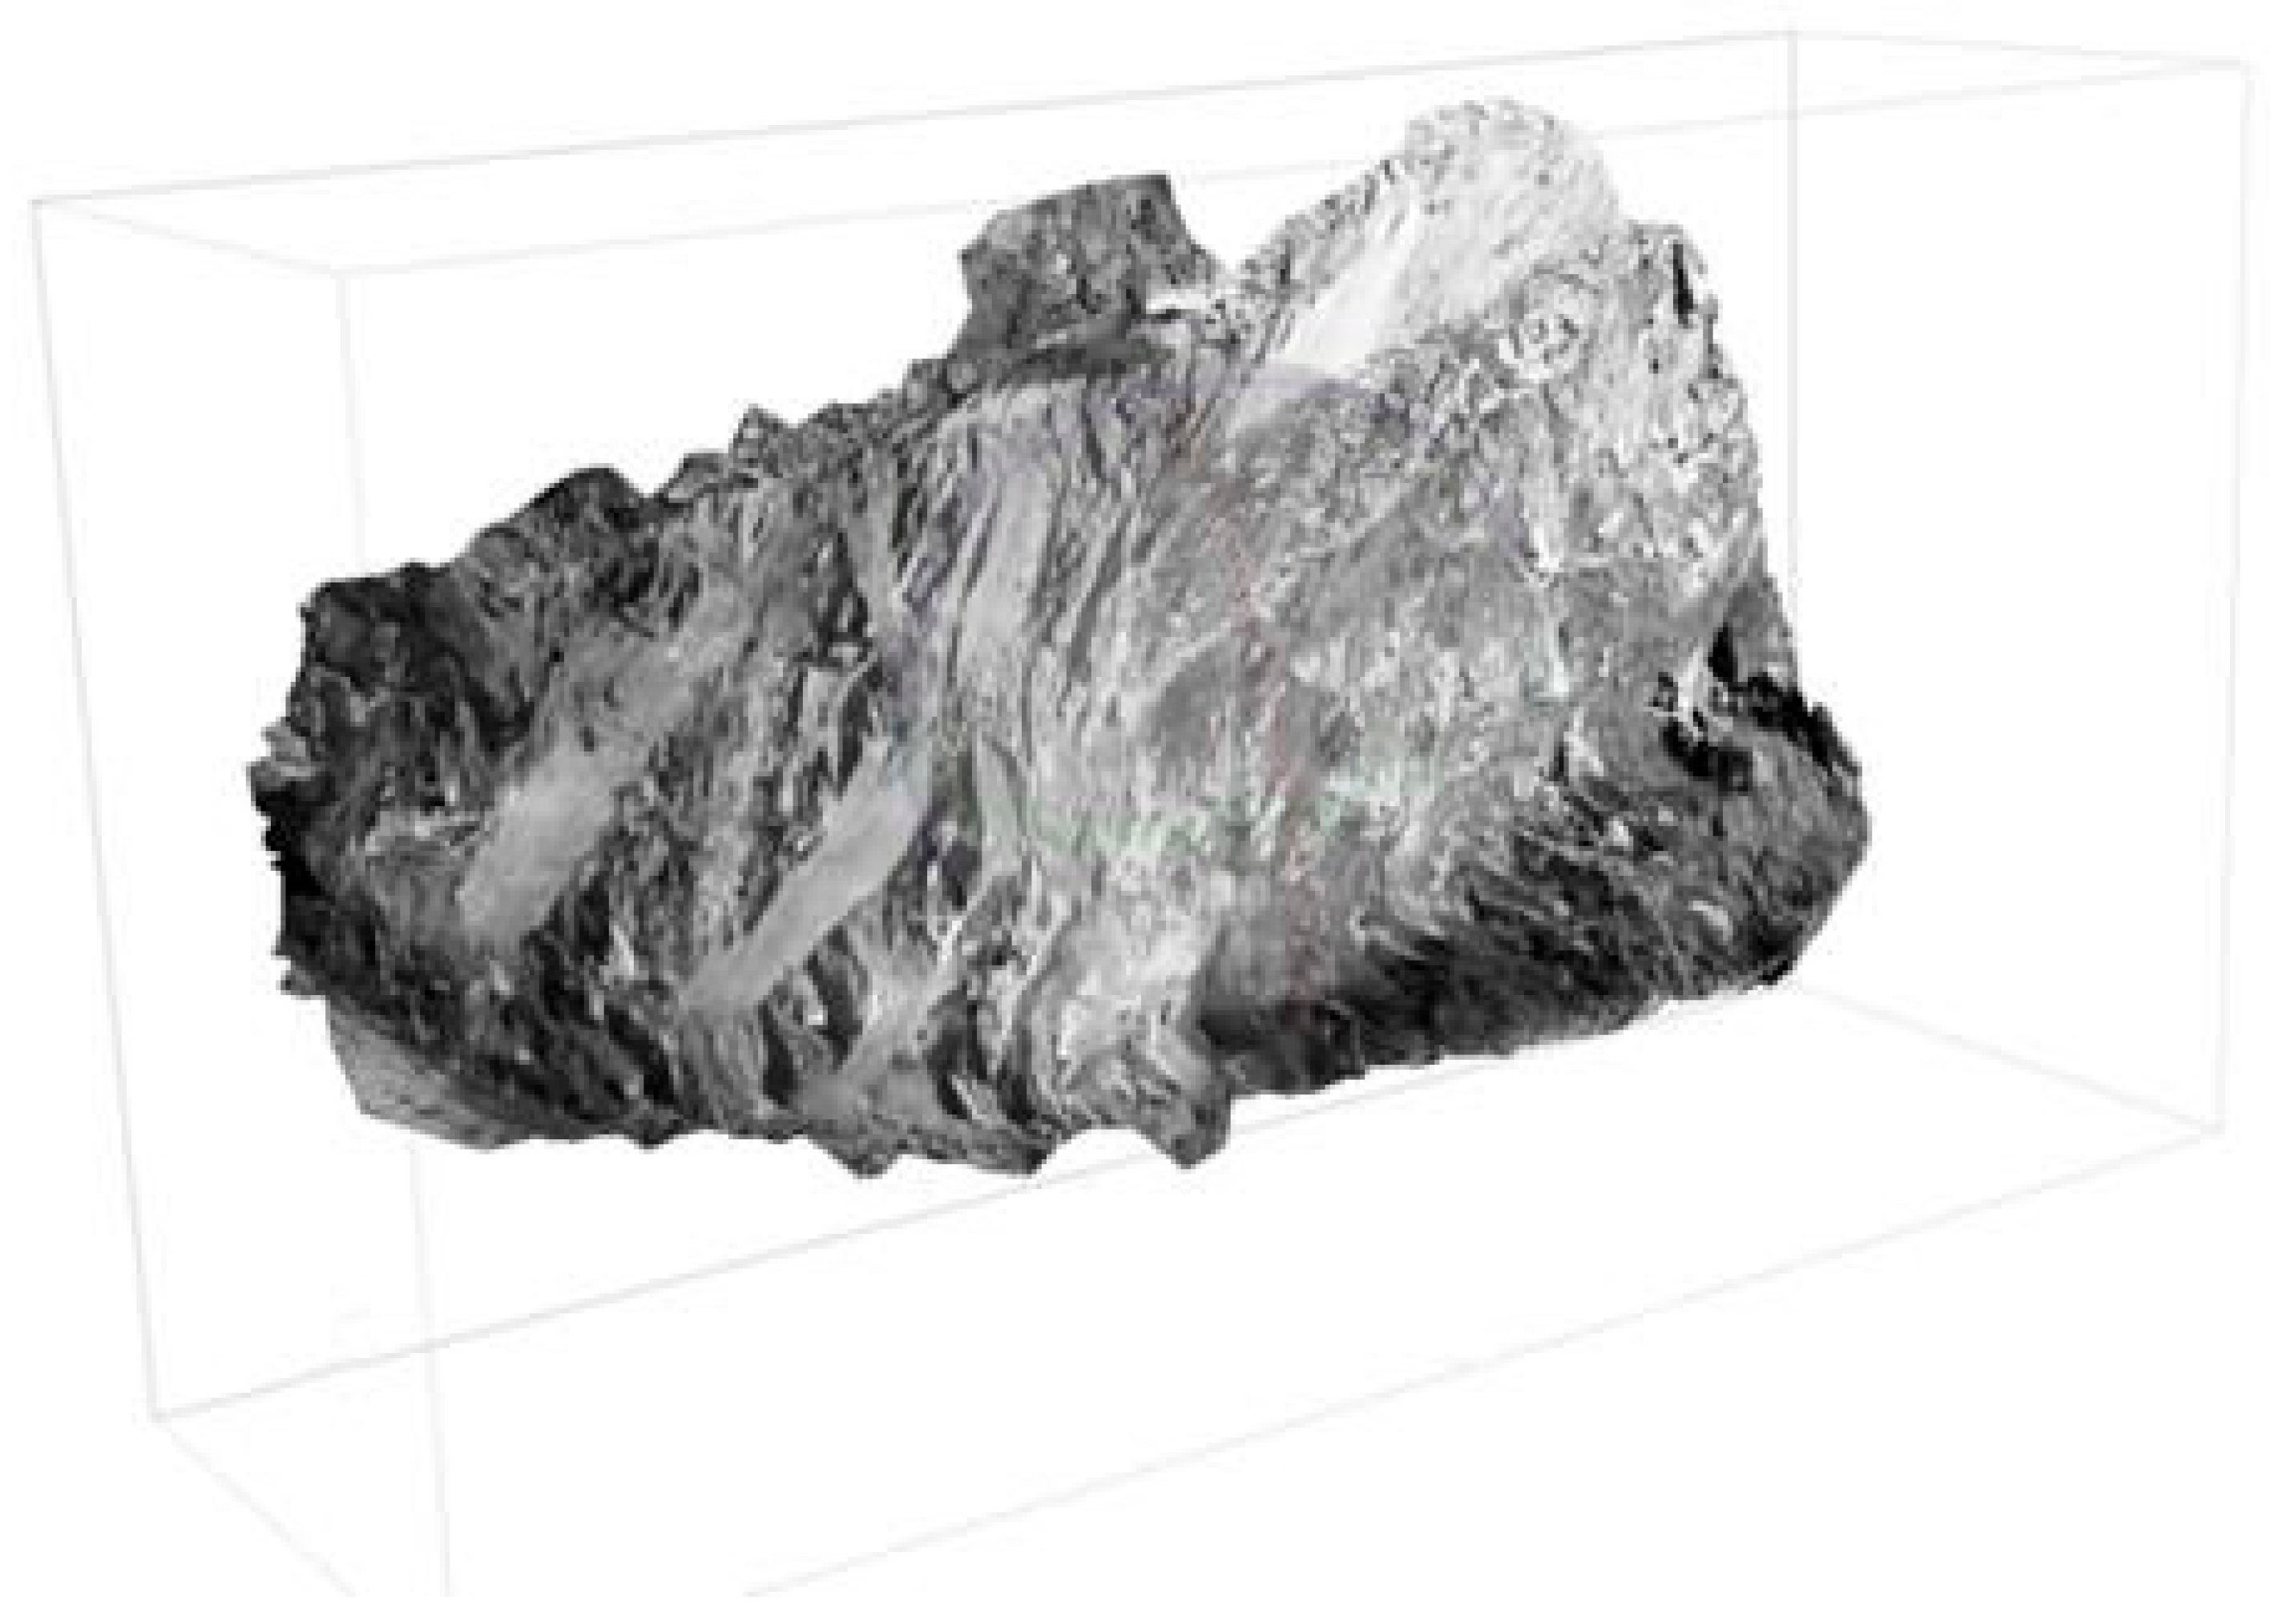
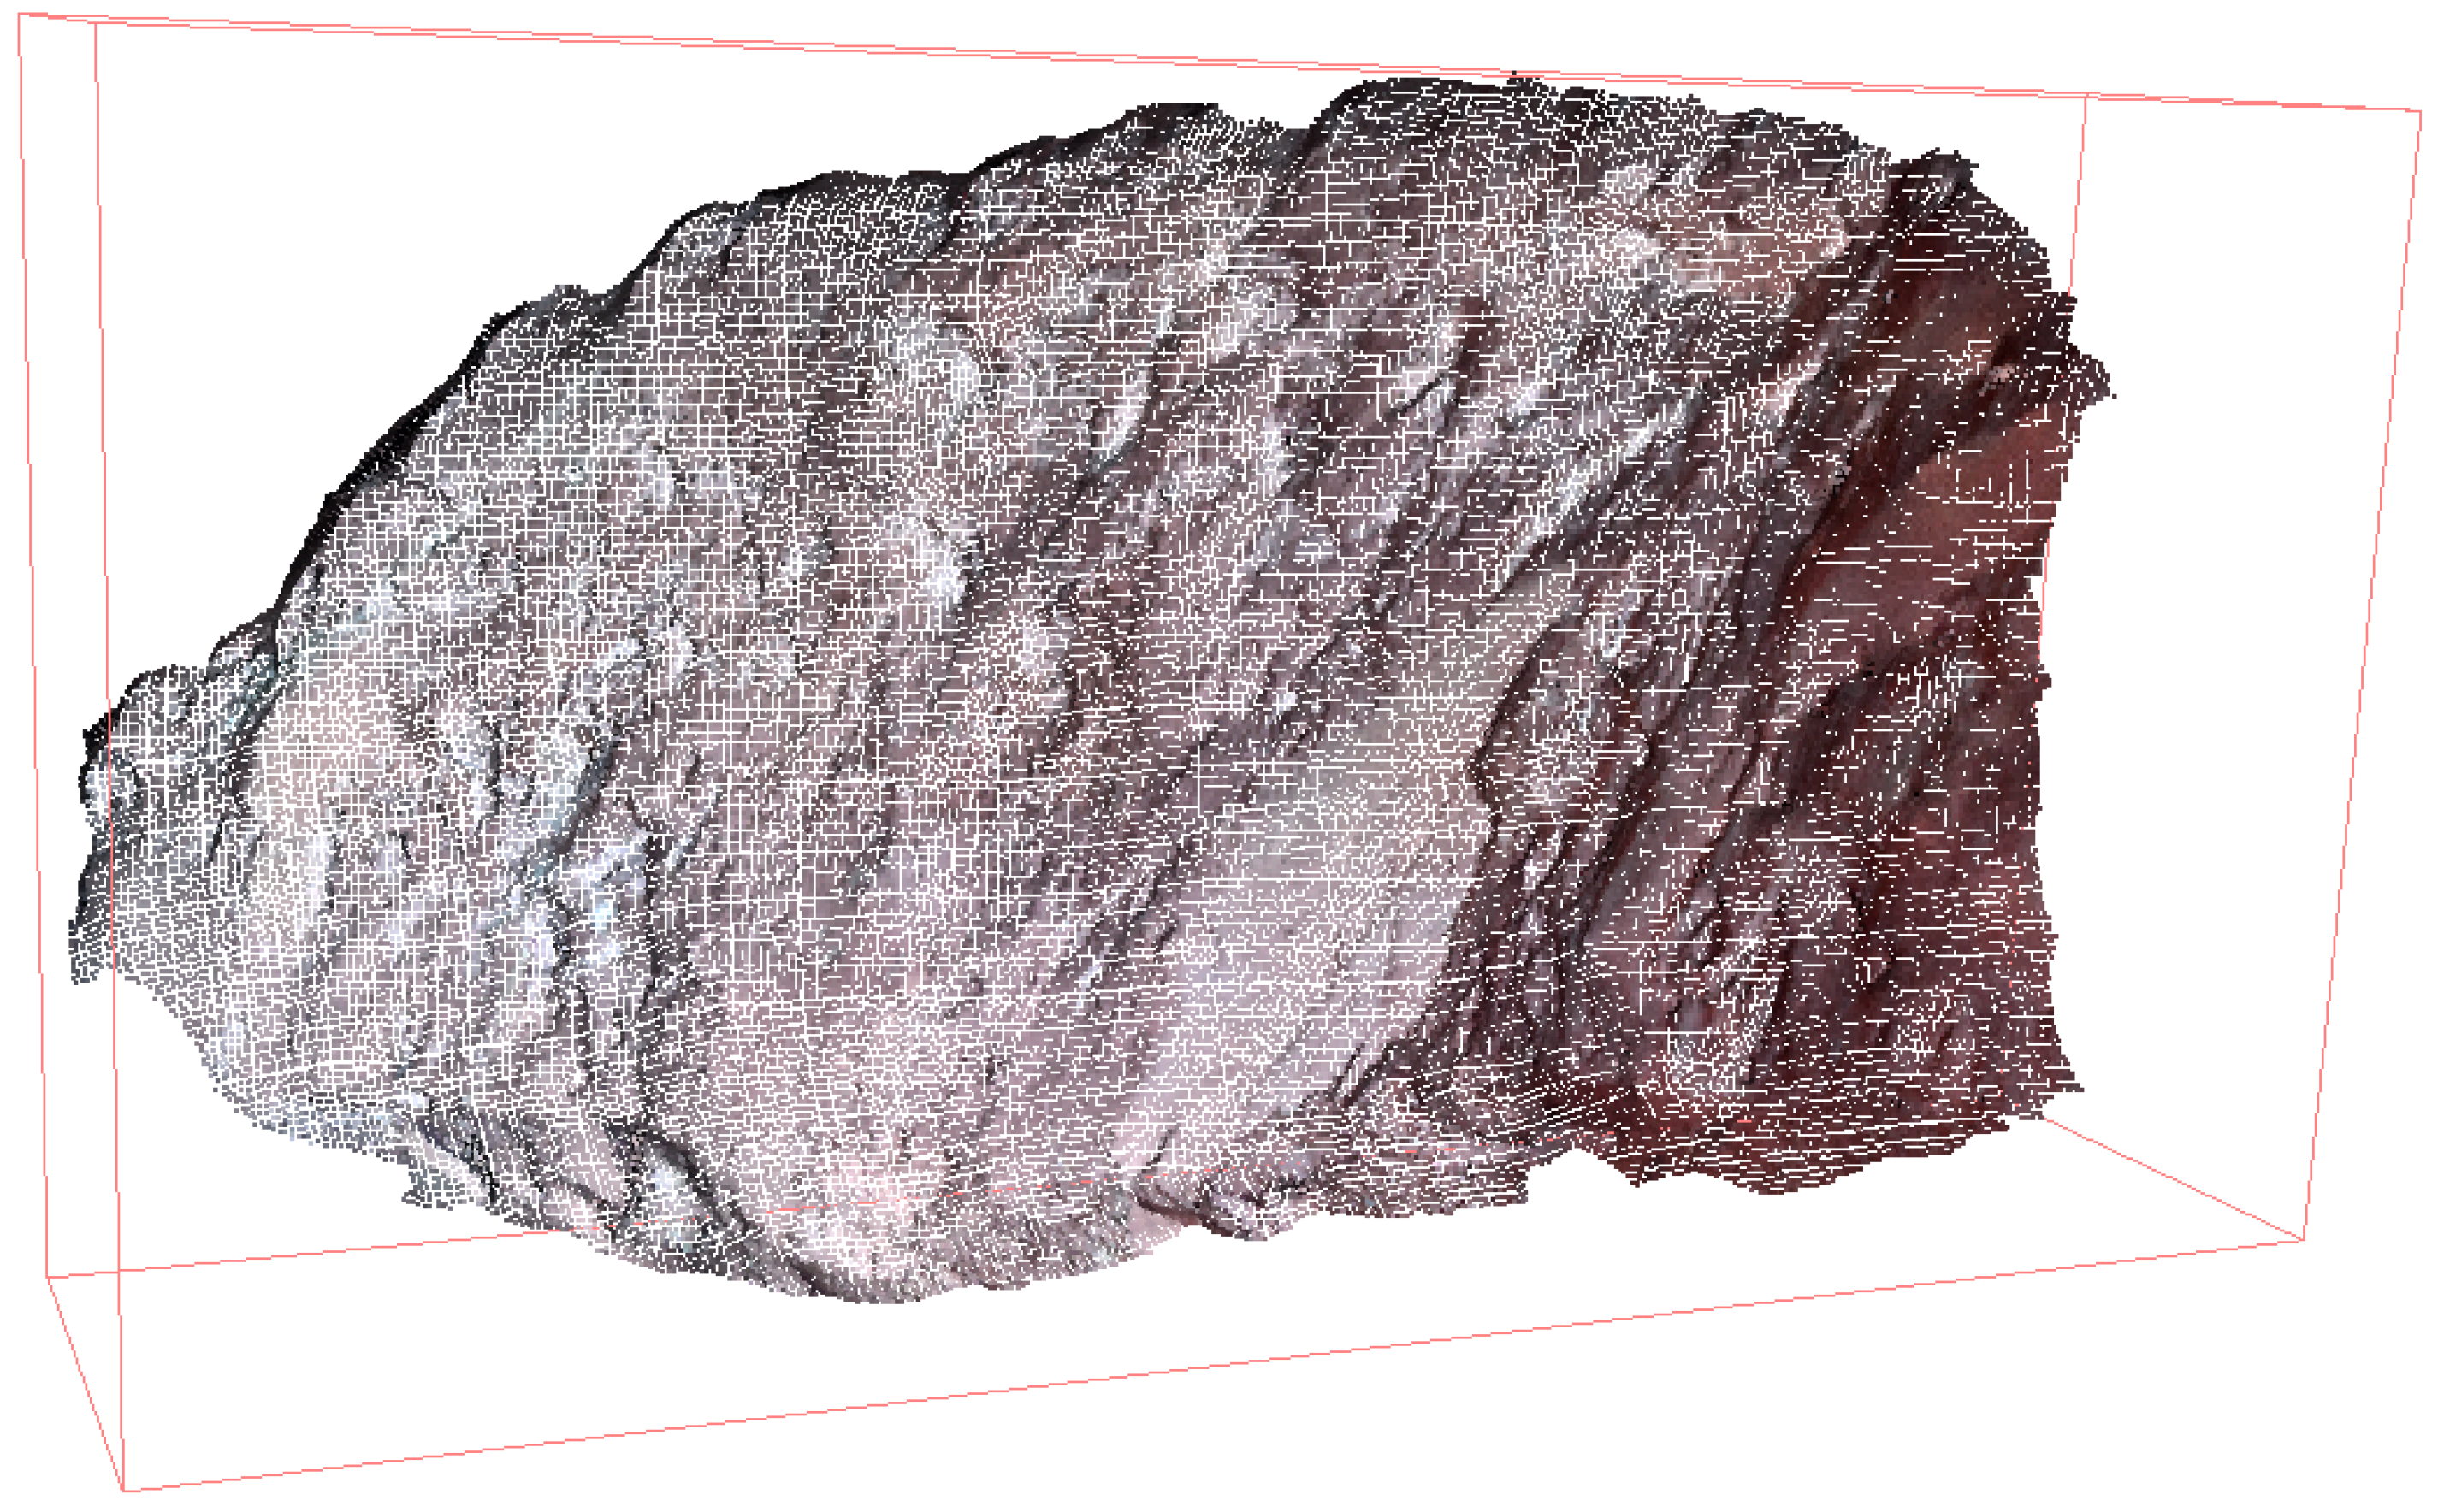
This paper employs Poisson surface reconstruction on dense point clouds of tunnel faces using the MeshLab platform. By setting appropriate octree depth and sampling density parameters, a complete 3D surface model of the tunnel face is ultimately restored (reconstruction results illustrated in
Figure 7). This model not only fills voids within the point cloud but also preserves critical surface details—such as fissures and unevenness—through smoothing processing. It provides a high-precision geometric foundation for subsequent intelligent identification of blasting effects.
3. Intelligent Identification of Blasting Effects at Tunnel Face and Optimization of Blasting Parameters
In conventional tunnel blasting operations, identifying the effectiveness of the tunnel face blasting serves as the pivotal step in guiding subsequent parameter adjustments. Its accuracy directly impacts construction efficiency and rock mass stability. However, manual identification relies heavily on experiential judgment, presenting issues such as strong subjectivity, omission of details (e.g., minute fissures), and insufficient data quantification. To address this, this paper proposes an intelligent solution based on computer vision and 3D reconstruction technology: by reconstructing a high-precision 3D model of the tunnel face through multi-view imaging, it quantitatively analyzes surface irregularities (over-excavation and under-excavation) and structural plane characteristics (fracture distribution and orientation), enabling objective evaluation of blasting outcomes. Subsequently, based on these evaluation results, it optimizes blasting parameters (hole network parameters, charge quantity) in a feedback loop, forming a closed-loop management mechanism of recognition–feedback–optimization. The research, conducted at the Huangtai Tunnel project on National Highway 109, details the implementation process for 3D face reconstruction and intelligent blast effect recognition. The feasibility and practical value of the proposed methodology are validated through engineering case studies.
3.1. Project Overview
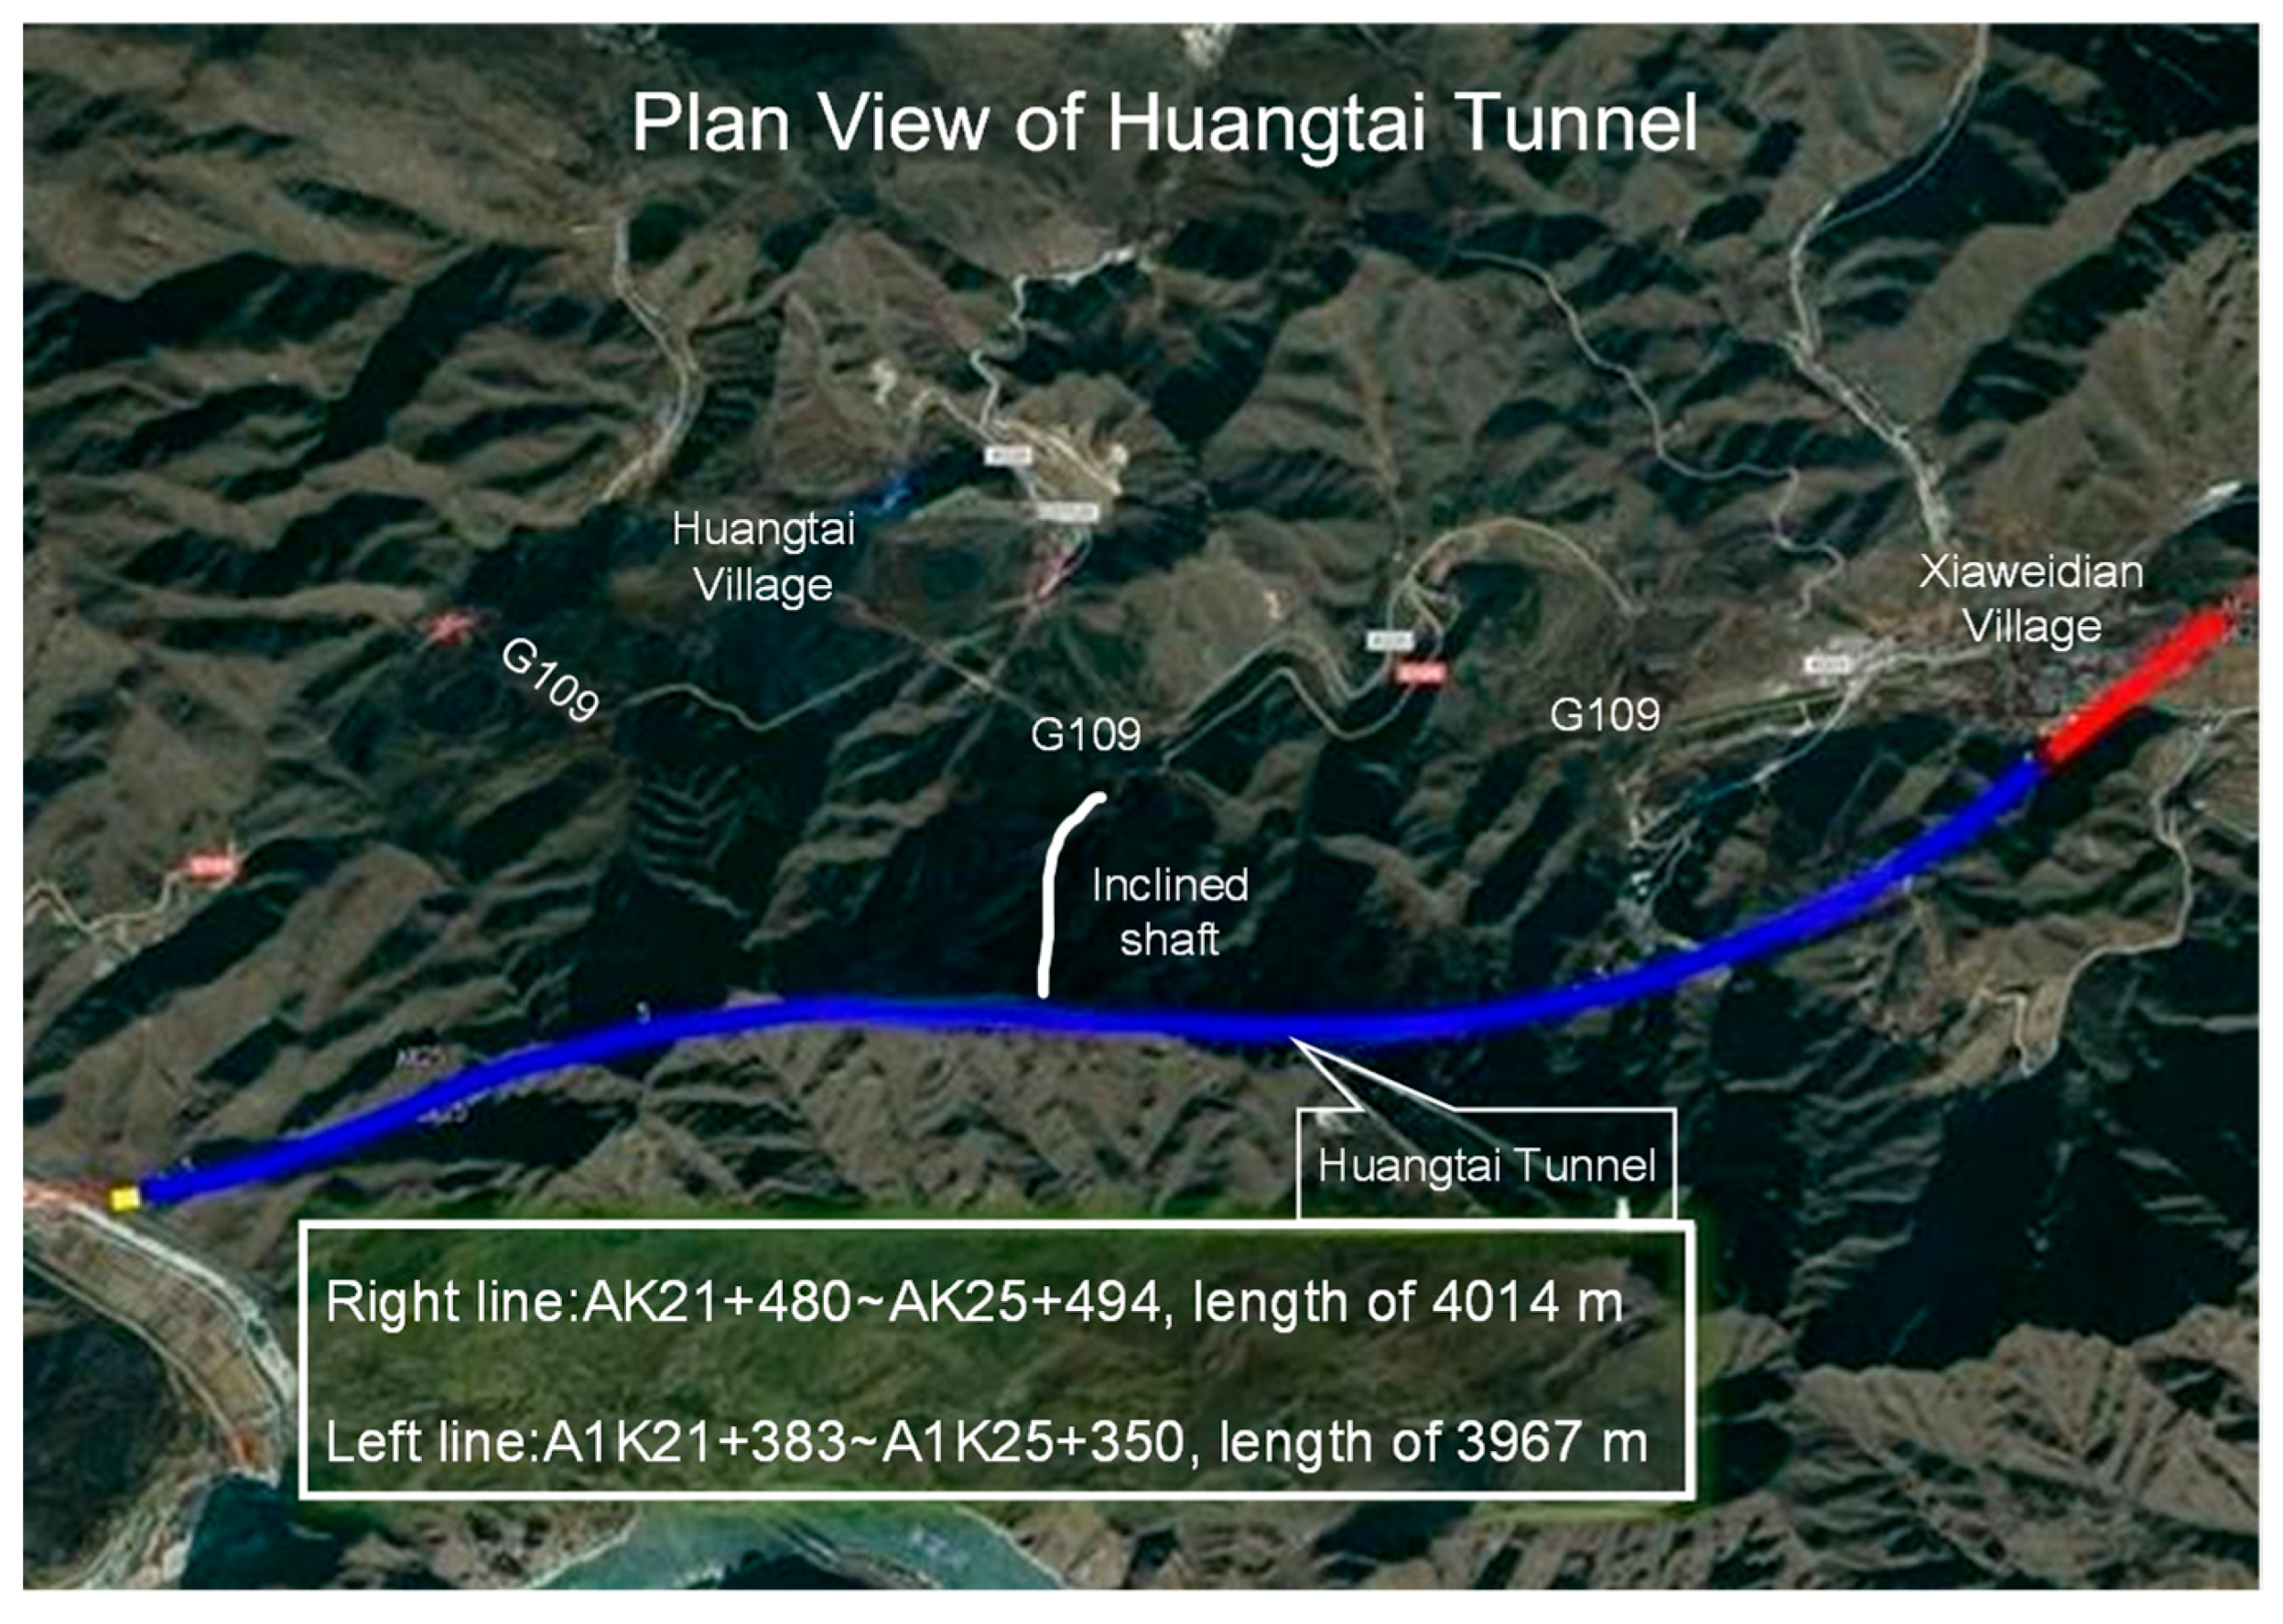
The National Highway 109 New Route Expressway (West Sixth Ring Road–Municipal Boundary Section) project is situated in Mentougou District, Beijing. The Huangtai Tunnel comprises a left-hand tube measuring 3967 m and a right-hand tube measuring 4014 m. The mine tunnel is located near Huangtai Village, Miaofengshan Town, at the route kilometer point AK23 + 635. It is situated 2155 m from the tunnel entrance and 1859 m from the tunnel exit. The mine tunnel has a total length of 462 m with a longitudinal gradient of 6%. The plan location of the Huangtai Tunnel is illustrated in
Figure 8.
The predominant groundwater types in this region comprise unconfined aquifers within loose deposits, bedrock fissure water, and carbonate karst water. The strata along the tunnel alignment consist primarily of limestone, dolomite, and sandstone, with poorly developed groundwater. The surrounding rock is classified as Grade III, IV, and V, comprising 3315 m of Grade III rock, 2952 m of Grade IV rock, and 1714 m of Grade V rock, accounting for 41.6%, 37%, and 21.4% of the total length, respectively. The standard cross-section excavation height ranges from 9.18 to 11.67 m, with a width of 16.54 to 17.06 m, yielding a cross-sectional area of 126 to 163.7 m2. The tunnel’s maximum cover depth is 353 m, while the minimum cover depth is approximately 10 m, located at AK21 + 700. The entire tunnel traverses two faults: F1, 35 m long at AK23 + 370 to +405, and F2, 205 m long at AK24 + 545 to +750. The mine tunnel is situated at AK23 + 635, measuring 467 m (including a 5 m cut-and-cover section), 1859 m from the exit end.
The surrounding rock geology of Huangtai Tunnel exhibits significant variability, featuring adverse geological phenomena such as karst formations and rockfalls. This necessitates high standards in blasting techniques, requiring timely adjustments to blasting parameters in response to rock mass changes. In accordance with Beijing’s regulatory framework, blasting operations are classified under the conditions specified in the Blasting Safety Regulations GB6722 [
40] and the Beijing Municipal Blasting Operations Safety Management Implementation Rules (2016) [
41]. During classification, the highest applicable condition level is adopted. This project is categorized as a Grade B complex environment blasting operation.
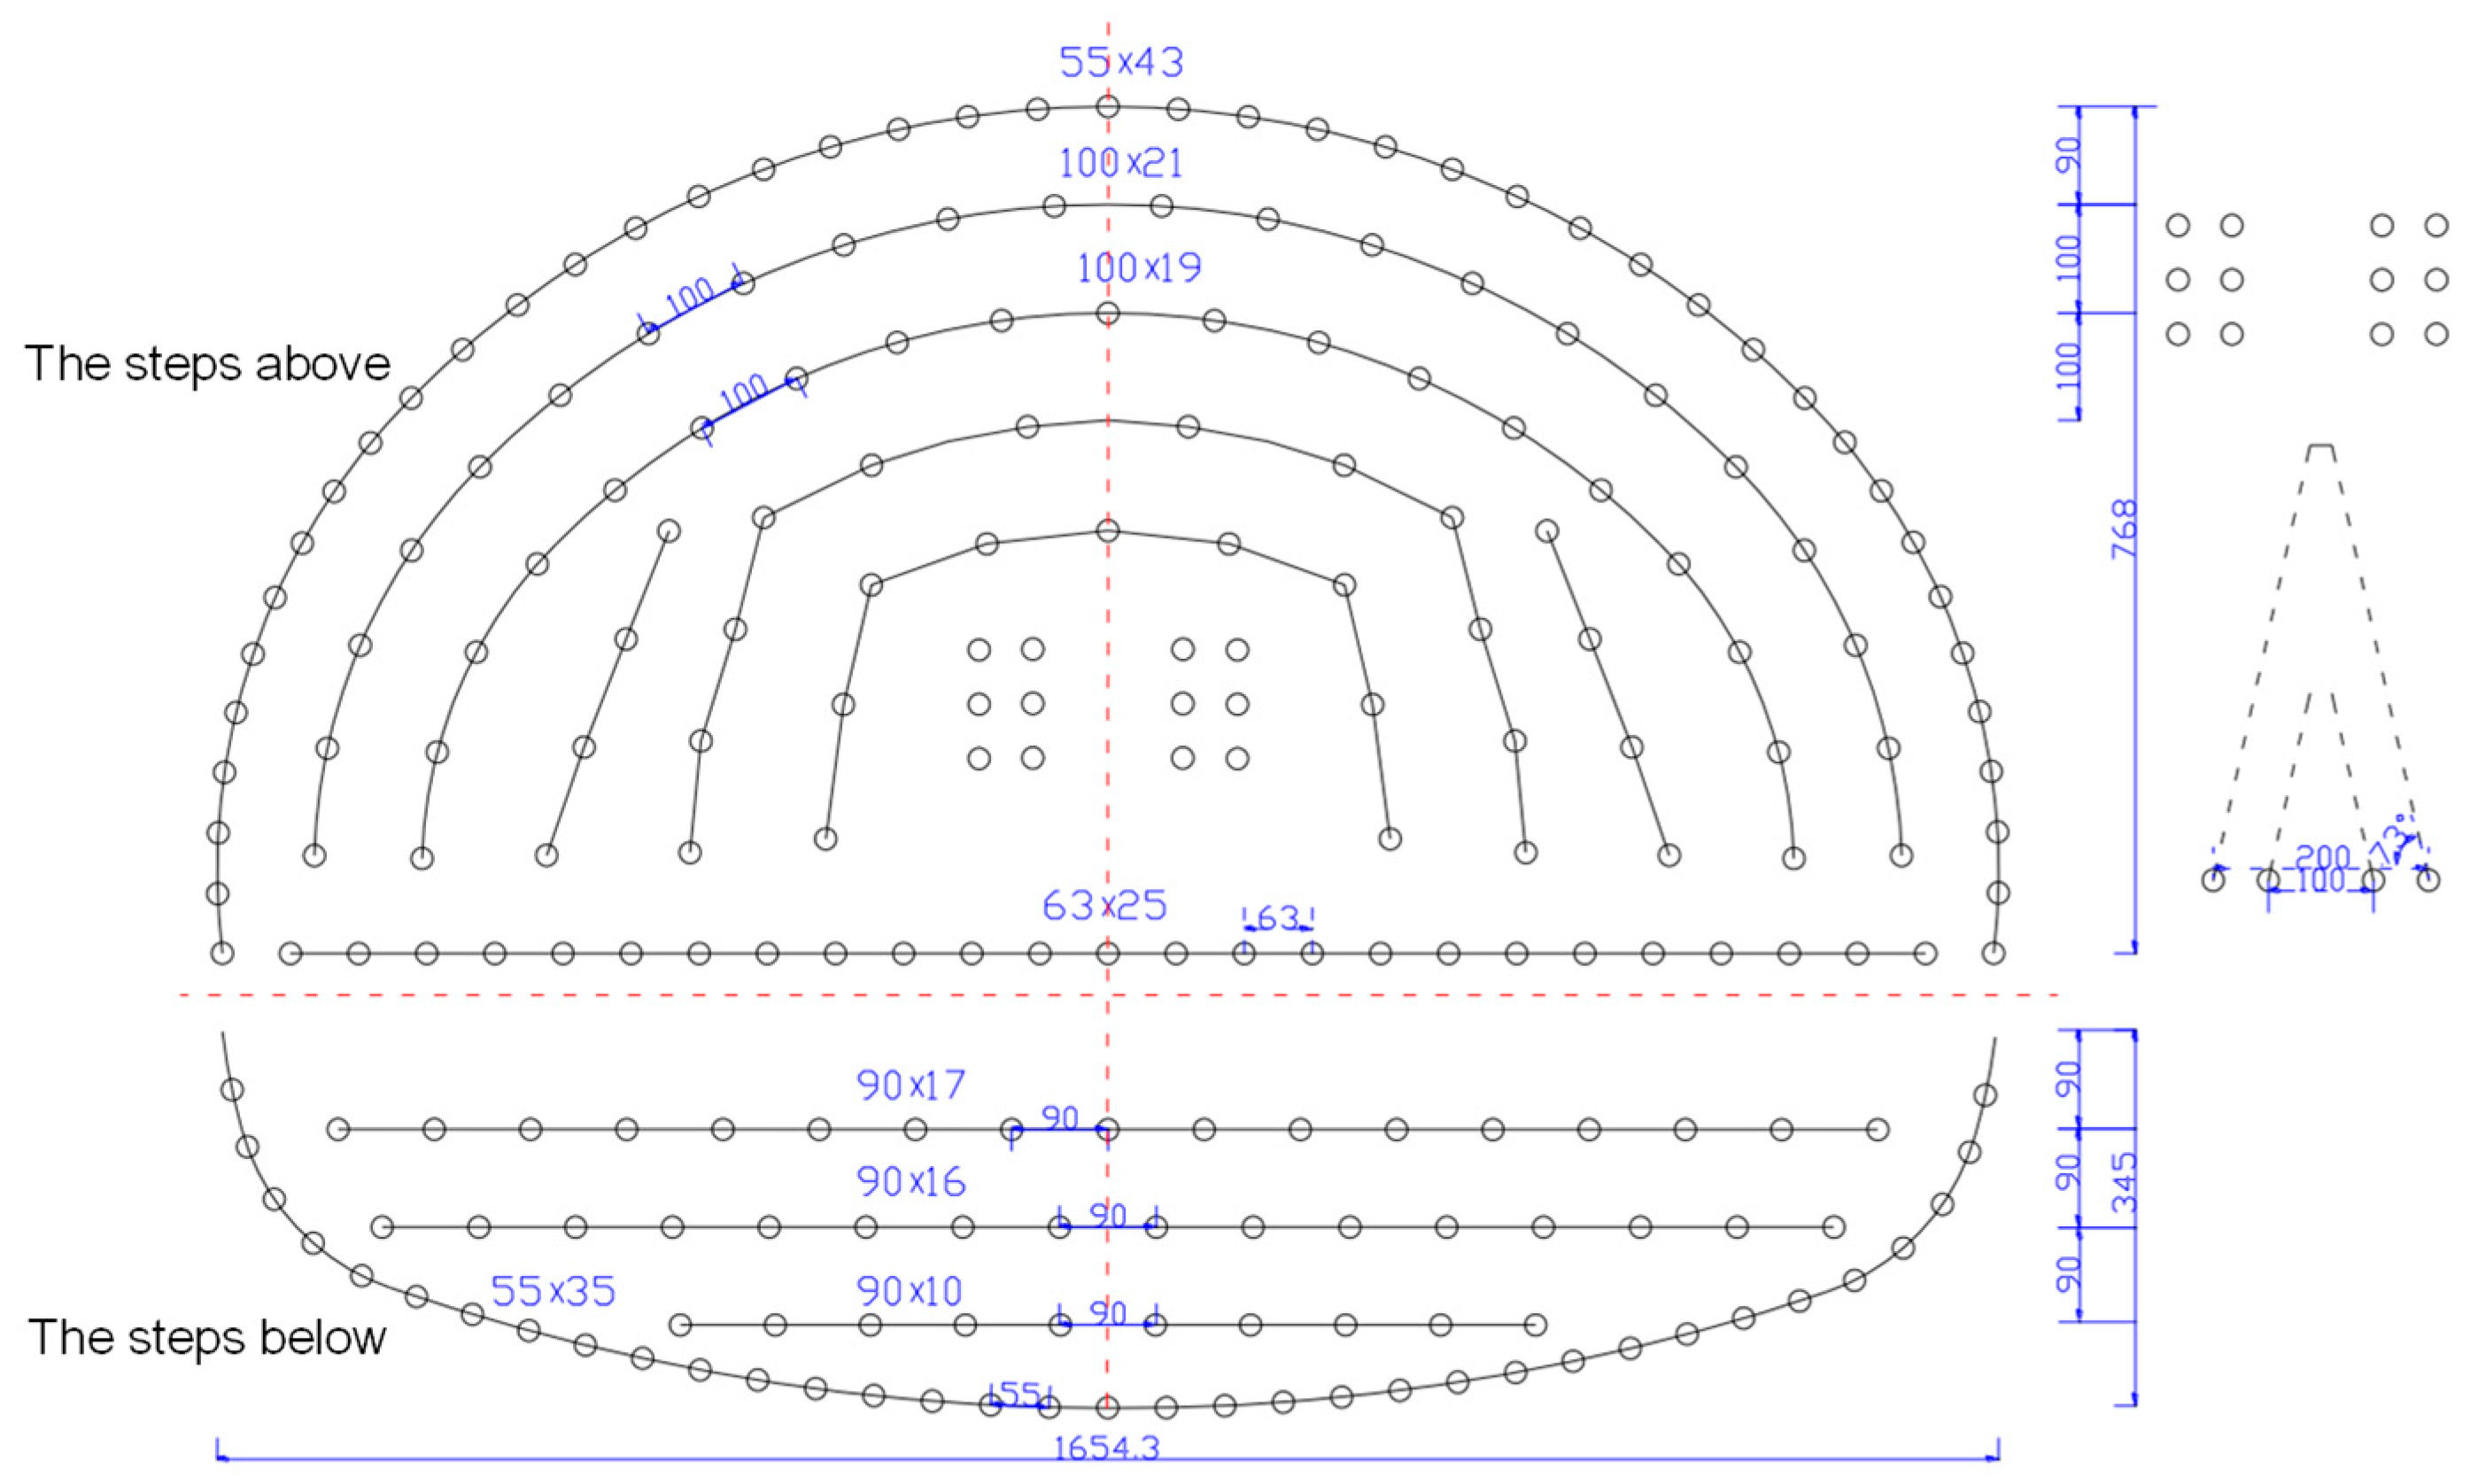
The Grade III rock mass section of the tunnel shall be constructed using the bench-and-bench method, with blasting parameters set as follows:
- (1)
Borehole diameter: Holes shall be drilled using YT-28 pneumatic leg-type rock drills, with a diameter d = 42 mm;
- (2)
Grooving method: A wedge-shaped compound grooving method shall be employed, with a borehole inclination angle α = 73°;
- (3)
Borehole depth: To ensure construction progress, the single-cycle blasting advance for Grade III rock mass in this tunnel design is 2.5 m, with an 80% borehole utilization rate and a borehole depth of 3 m;
- (4)
Hole network parameters:
Cut holes: Hole spacing a = 200 cm, hole base spacing 20 cm; row spacing b = 50 cm;
Main holes: Hole spacing a = 100 cm, bottom hole spacing 20 cm; row spacing b = 50 cm;
Auxiliary holes: Hole spacing a = 80–100 cm;
Peripheral holes: Hole spacing a = 55 cm;
Base holes: Hole spacing a = 55 cm;
Specific hole network parameters and borehole layout are illustrated in
Figure 9.
3.2. Recognition of Blasting Effect at Tunnel Face
The identification of blasting effectiveness at the tunnel face is a critical step in assessing blasting quality and optimizing subsequent construction plans. This can be achieved through quantitative analysis of the rock mass structural planes, structural traces, and the smoothness of the tunnel face.
These three indicators were selected because they capture complementary dimensions of blasting performance that are directly relevant to engineering decision-making. Structural planes characterize the anisotropy of the rock mass and the orientations of potential weakness, which influence breakage patterns as well as the required distribution of explosive energy and blasthole layout. Structural traces describe the surface manifestation of discontinuities on the excavated face, enabling their intensity and scale to be quantified and thereby reflecting fragmentation characteristics and potential failure paths. Curvature-based flatness evaluates the geometric outcome of excavation and provides a direct metric for contour control, which is closely associated with subsequent drilling depth adjustment and cycle efficiency.
The logical relationship among these indicators can be summarized as follows. Structural-plane orientation provides the geometric basis for identifying and grouping discontinuities, whereas structural traces capture their exposed expressions on the tunnel face and quantify them at the trace scale. Accordingly, trace analysis is partly informed by plane identification but is not redundant, because it emphasizes the manifestation intensity and spatial extent of discontinuities rather than their orientation alone. By contrast, curvature-based flatness is largely independent of the discontinuity-related indices and complements them by assessing whether the blasting scheme has achieved the intended excavation profile. Taken together, the proposed intelligent evaluation framework uses the reconstructed 3D model to identify structural planes, extract trace statistics, and compute curvature-based flatness, thereby enabling integrated interpretation of rock mass structure and excavation geometry for targeted parameter adjustment within the closed-loop optimization process.
3.2.1. Identification of the Structural Planes Within the Tunnel Face Rock Mass
In tunnel blasting operations, rock mass properties are primarily governed by the orientation (strike, dip direction, dip angle) and spatial distribution characteristics of internal structural planes, constituting the core determinants of blasting quality. This paper employs the ISODATA dynamic clustering algorithm to intelligently identify and group multiple sets of structural planes based on a 3D reconstruction model of the tunnel face. By quantifying the geometric characteristics of these structural planes, it enables a quantitative assessment of rock mass quality post-blasting. This provides a scientific basis for subsequent optimization of blasting parameters and adjustments to construction plans.
Within the reconstructed 3D mesh model of the tunnel face, each triangular element can be treated as an independent microstructural plane unit. Its spatial orientation is characterized by the three fundamental components of geological occurrence: strike, dip direction, and dip angle. Given the fixed angular relationship between strike and dip direction (differing by 90° or 270°), the dip direction and dip angle are commonly employed as core parameters in engineering practice to characterize the spatial posture of structural planes.
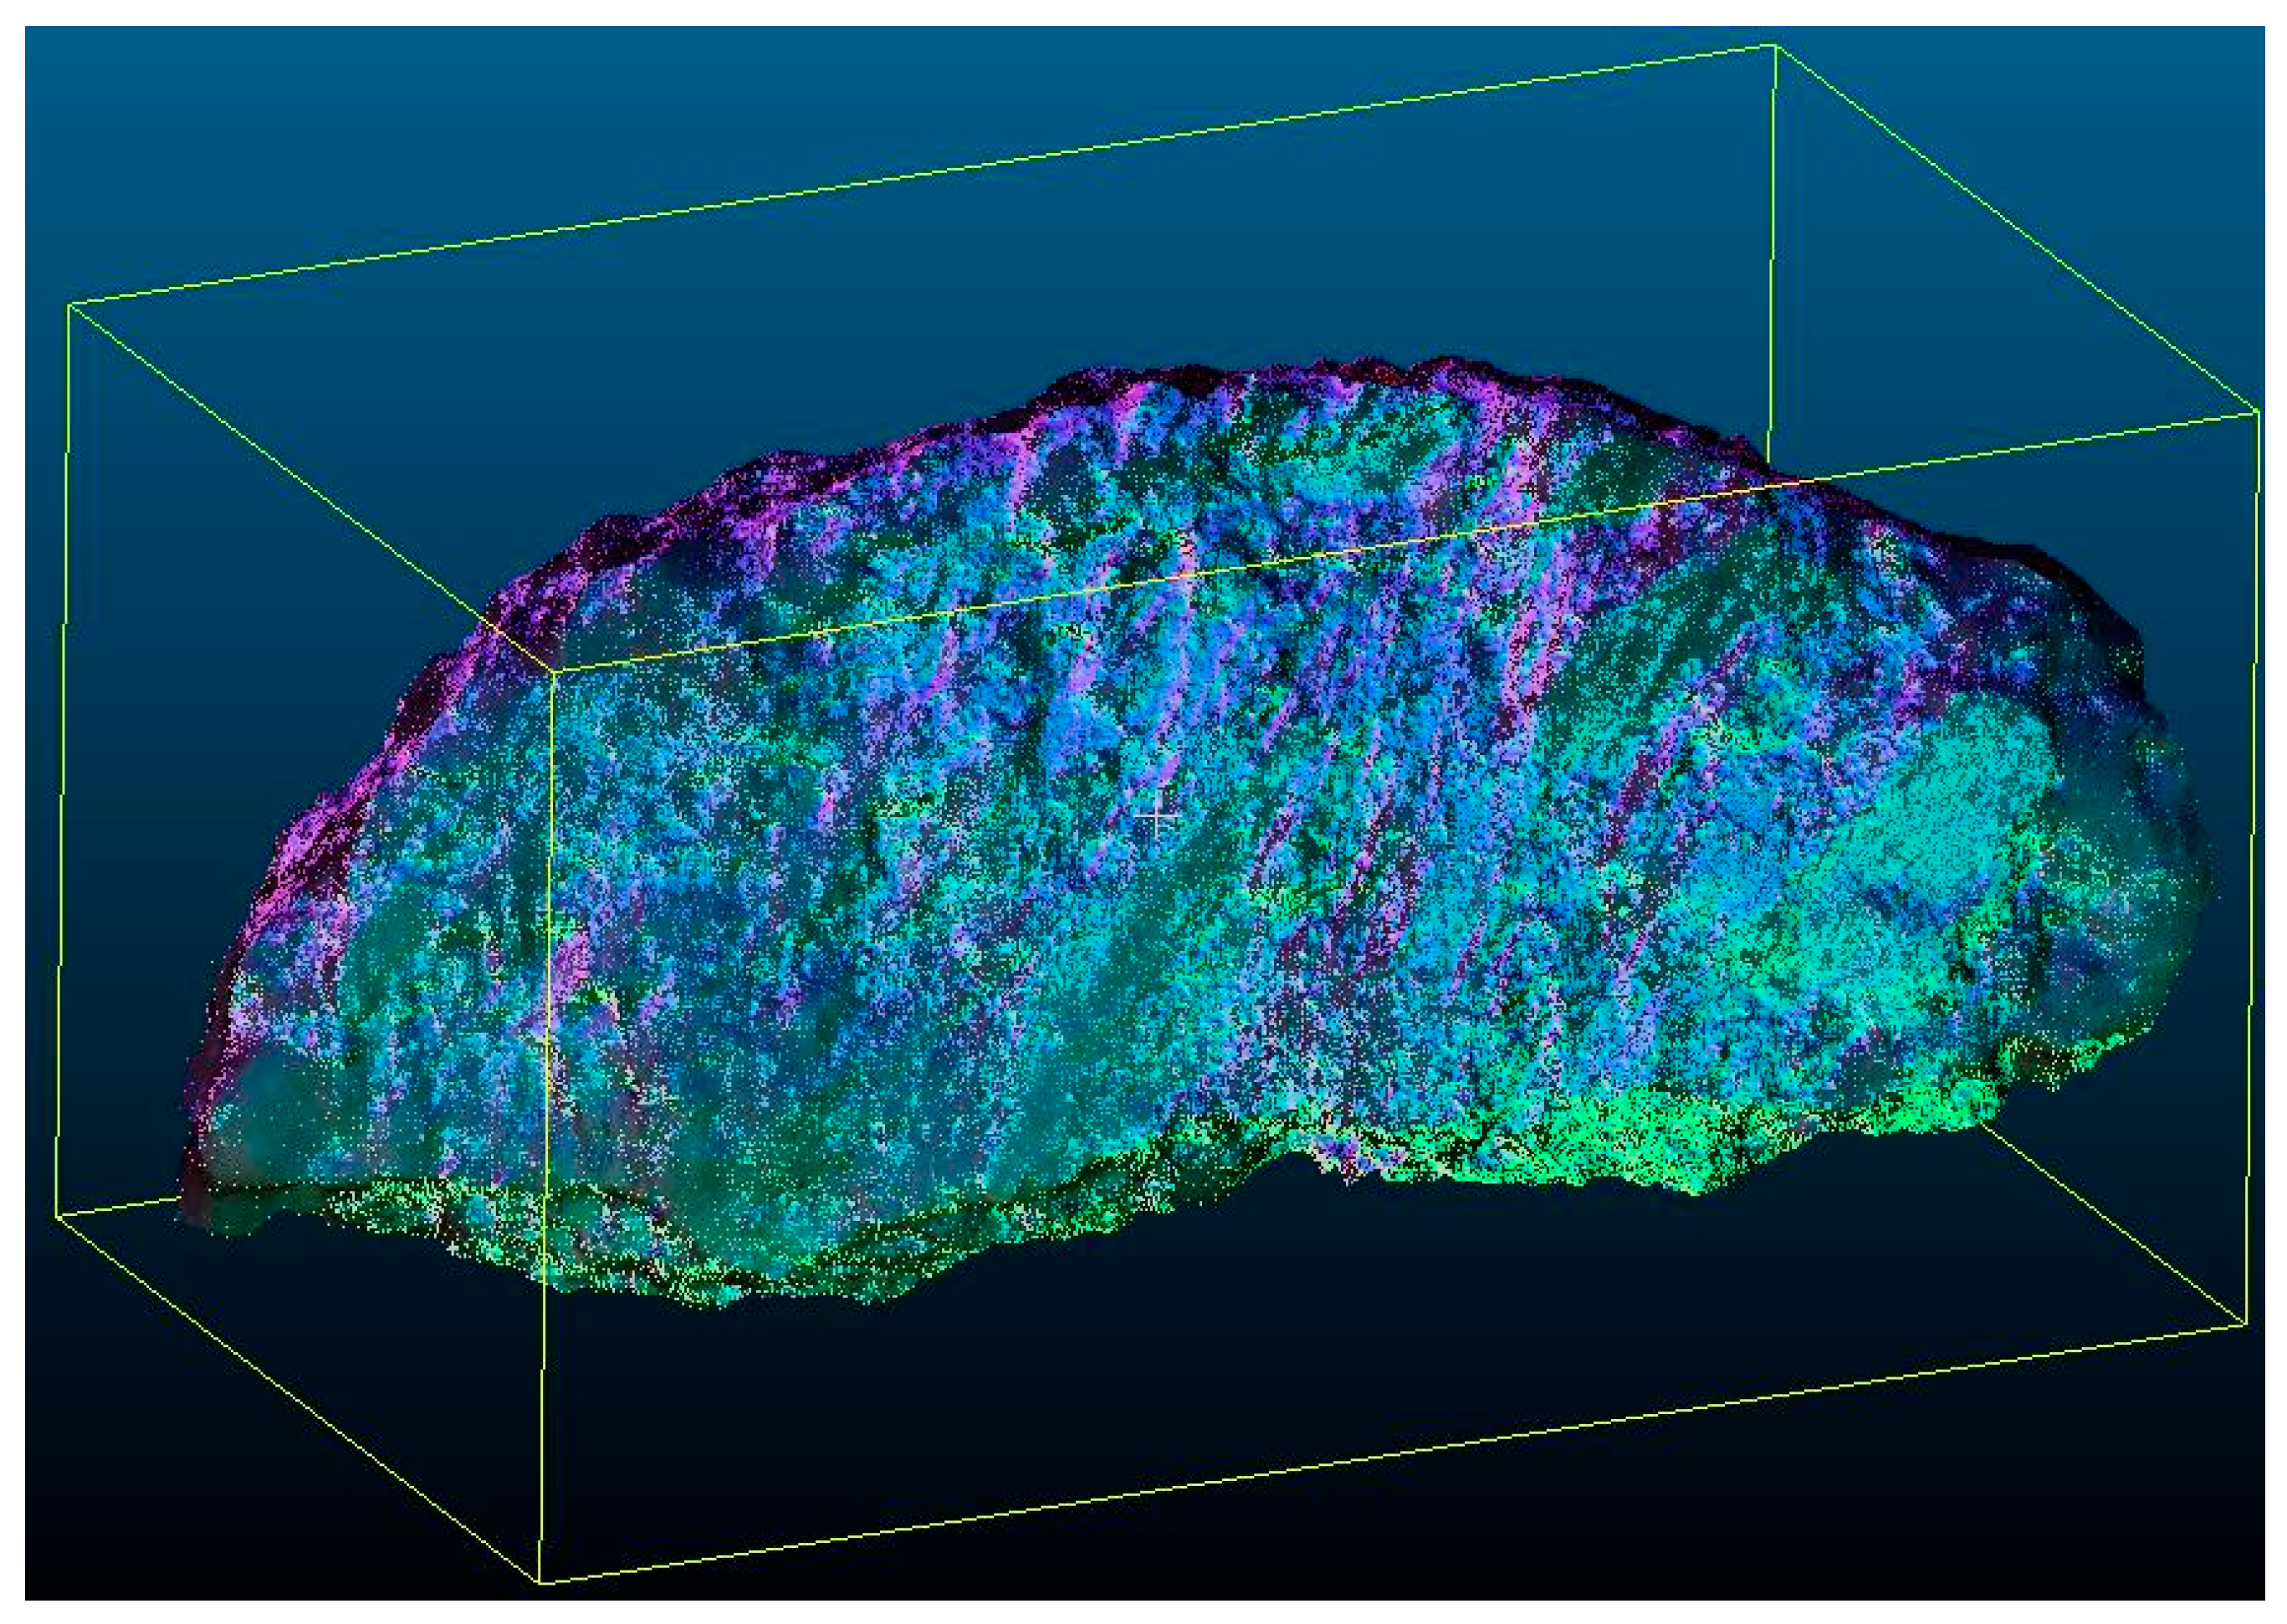
To visually represent the spatial orientation characteristics of structural planes, visualization is achieved through normal vector-HSV color mapping: the normal vector direction is encoded as the H component (representing inclination), the dip angle magnitude is encoded as the S component (representing dip angle), and the V component is fixed at 1. This ultimately generates a visualization model of the tunnel face point cloud normal vectors (
Figure 10), enabling clear differentiation of structural plane distributions across different orientations.
The spatial orientation of a structural plane is jointly defined by its dip angle (
θ) and dip direction (
φ): the dip angle
θ (0–90°) represents the angle between the normal vector of the structural plane and that of the horizontal plane, indicating the degree of inclination and the dip direction
φ (0–360°) denotes the projection direction of the structural plane onto the horizontal plane, characterizing the inclination azimuth. For any triangular facet within the 3D mesh of the tunnel face, given the coordinates of its three vertices (
x1,
y1,
z1), (
x2,
y2,
z2), and (
x3,
y3,
z3), the normal vectors (
A,
B,
C) of the plane containing this facet may be determined via the plane equation
Ax +
By +
Cz +
D = 0. Based on the spatial orientation parameters of these normal vectors, specific calculation formulas for the structural plane’s characteristics (dip angle
θ and dip direction
φ) can be further derived, with the results illustrated in Equation (2).
In Equation (2), Q denotes the quadrant correction value:
When A ≥ 0 and B ≥ 0, Q = 0°;
When A ≥ 0 and B < 0, Q = 360°;
When A < 0 and B < 0, or A < 0 and B ≥ 0, Q = 180°.
Based on the aforementioned structural parameters, the ISODATA dynamic clustering algorithm was employed to group structural planes: dip angle and dip direction data were input alongside an initialized number of clusters. Cluster splitting and merging were achieved by calculating the distance between data points and cluster centers, with the process iterating until convergence to produce the final grouping results. The visualized clustering results (
Figure 11) reveal a dense concentration of structural plane groups in the upper section of the tunnel face, predominantly comprising small-scale, high-angle planes. This indicates a high degree of surface irregularity and localized unevenness within this area. Consequently, adjustments to the blasting design scheme are required to enhance the tunnel face’s flatness and meet the demands of construction operations.
In addition to visualization, the clustering results were converted into quantitative descriptors for subsequent blasting parameter adjustment. For each structural-plane cluster
j, the mesh elements belonging to this cluster were used to calculate its area proportion, mean dip angle, mean dip direction, and spatial concentration zone on the tunnel face. The area proportion of the
j-th cluster was defined as:
In Equation (3),
Aj is the total area of the mesh elements belonging to the
j-th structural-plane cluster, and
A is the total area of the reconstructed tunnel face. To further quantify the spatial correspondence between structural-plane clustering and curvature-based defects, an overlap ratio was introduced:
In Equation (4), Cj denotes the spatial region occupied by the j-th structural-plane cluster, and H denotes the high-curvature region identified from the curvature-based flatness evaluation. A larger Oj indicates a stronger spatial overlap between the structural-plane concentration zone and the blasting-induced unevenness zone. High-angle clusters distributed in the upper and middle–upper parts of the tunnel face were regarded as structure-sensitive zones because these regions were more likely to control crack extension and block detachment. To avoid treating structural-plane grouping as a purely qualitative interpretation, the cluster descriptors were jointly compared with trace density and curvature hot spots. When a clustered structural-plane zone coincided with dense structural traces and high-curvature regions, the corresponding area was diagnosed as a structure-controlled uneven-breakage zone. Accordingly, the adjustment of auxiliary-hole spacing, hole inclination, and local charge distribution was concentrated in this zone rather than uniformly applied to the entire tunnel face.
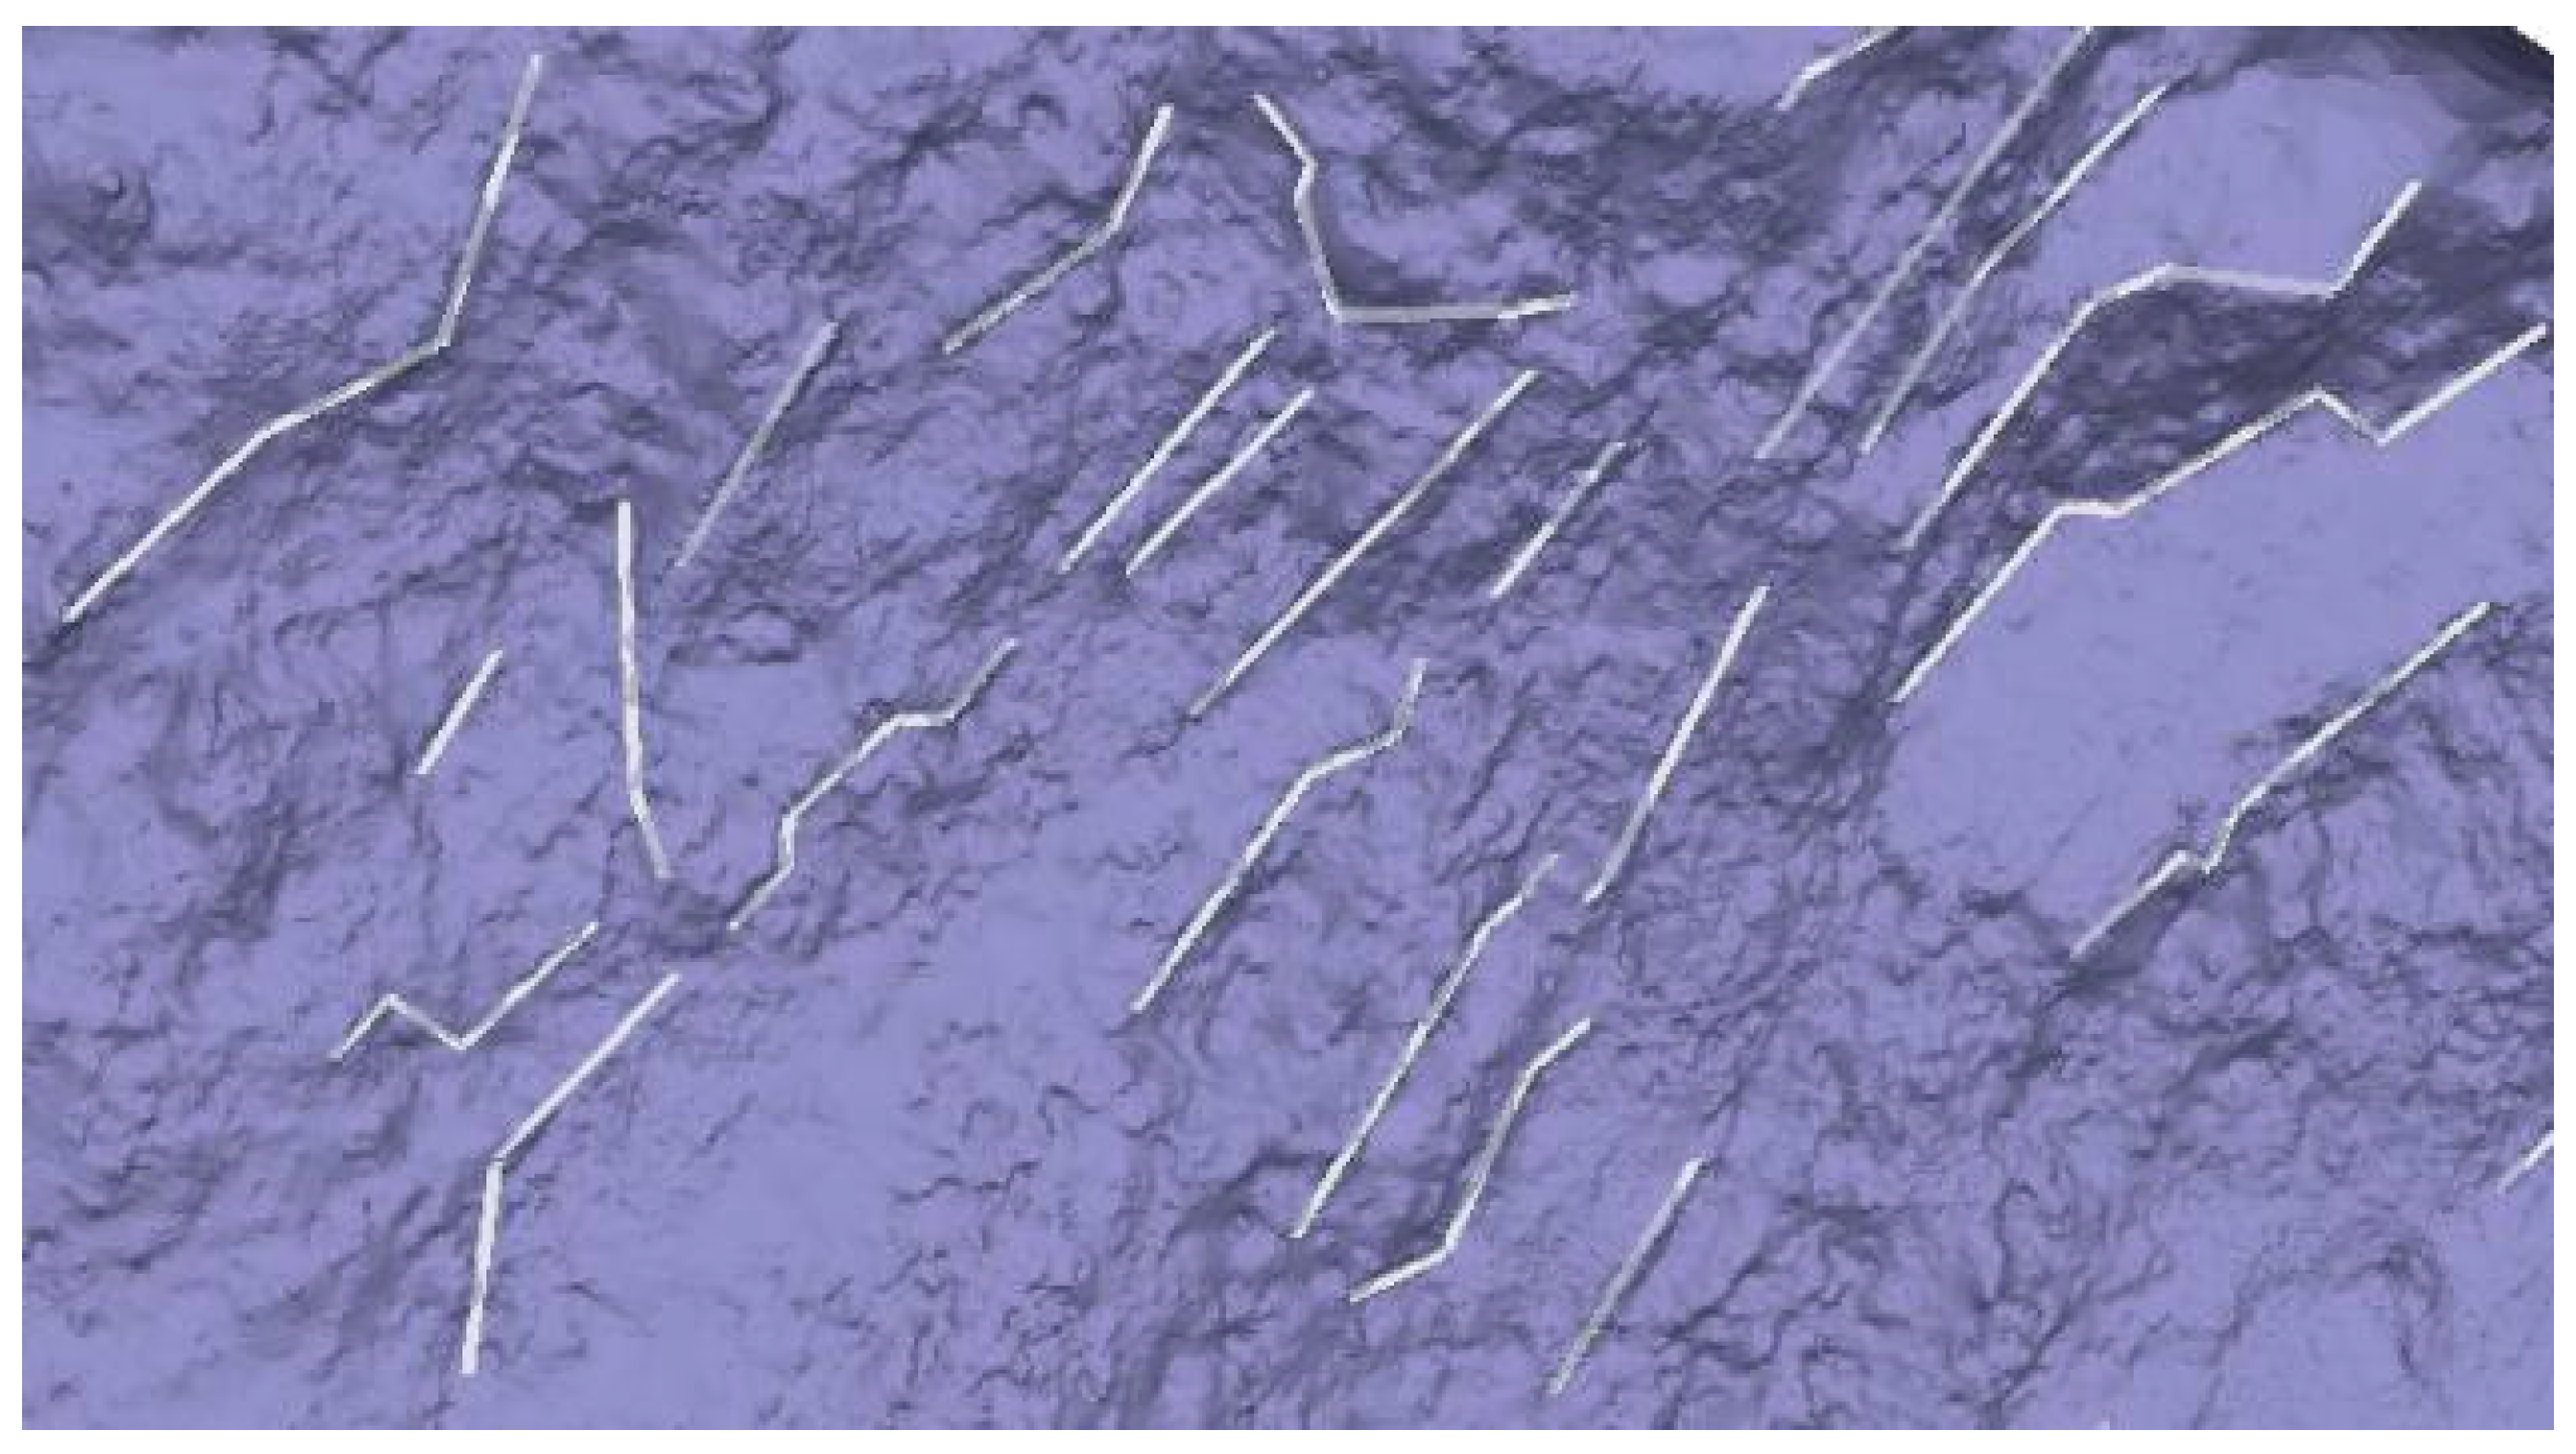
3.2.2. Recognition of the Tunnel Face Structural Trace
The identification of structural traces at the tunnel face requires consideration of rock mass properties, groundwater conditions, and weathering levels. By analyzing the characteristic parameters of detected structural surfaces, a comprehensive evaluation of rock mass quality is achieved. This paper employs a minimum cost path algorithm to couple the 3D model of the tunnel face with a cost function, thereby enabling automated extraction of structural trace characteristics (see
Figure 12 for schematic diagrams of the extraction process). The specific computational workflow is as follows:
- (1)
Cost-function construction and path search
In the minimum-cost-path extraction, the reconstructed tunnel face mesh was first converted into a weighted graph. Mesh vertices were treated as graph nodes, and graph edges were established between adjacent vertices. Because structural traces usually correspond to local geometric discontinuities, the edge cost was defined to favor paths passing through regions with large curvature and abrupt changes in surface orientation.
For two adjacent vertices
i and
j, the edge cost was calculated as:
In Equation (5),
wij is the edge cost,
dij is the Euclidean distance between two adjacent vertices,
is the normalized average curvature of the two vertices,
is the normalized normal-vector angular difference, and
is a small positive constant used to avoid zero-cost edges. The curvature term was calculated as
. The normalized curvature
was obtained by min–max normalization within the current tunnel-face mesh:
In Equation (6), Ki is the original curvature value at vertex i, Kmin and Kmax are the minimum and maximum curvature values of the current tunnel-face mesh, respectively, and δ is a small positive value introduced to avoid division by zero.
The normal-vector angular term was calculated as:
In Equation (7), ni and nj are the unit normal vectors of adjacent vertices. With this definition, mesh edges located in high-curvature regions or across abrupt surface-orientation changes receive lower costs, so the resulting minimum-cost path preferentially follows structural discontinuity traces rather than smooth surface areas.
After the discontinuity-enhanced weighted graph was constructed, candidate trace endpoints were determined from the terminal positions of connected high-response regions identified from the combined curvature-normal discontinuity map. Dijkstra’s algorithm was then used to obtain the minimum-cost path between each pair of endpoints. Short isolated paths and obvious duplicate paths were removed before calculating trace length and density, so that the subsequent statistics were based on continuous structural traces.
- (2)
Trajectory length calculation
The structural trace line extracted by the minimum cost path algorithm is formed by a sequence of ordered vertices (
V1,
V2, …,
Vn), connected as a polygonal line. Its total length equals the cumulative sum of distances between adjacent vertices. Let
li denote the distance between vertices
Vi and
Vi+1; the trace line length is calculated according to Equation (8).
- (3)
Trace density measurement
Trace density is assessed using the unit area density method (surface density), which effectively reflects the degree of fissure development within a specific area. The specific steps are as follows: ① project all extracted traces onto a plane perpendicular to the overall normal direction of the point cloud, and ② calculate the total length and projected area of the traced traces; the density formula is illustrated in Equation (9).
- (4)
Extraction Results and Parameter Statistics
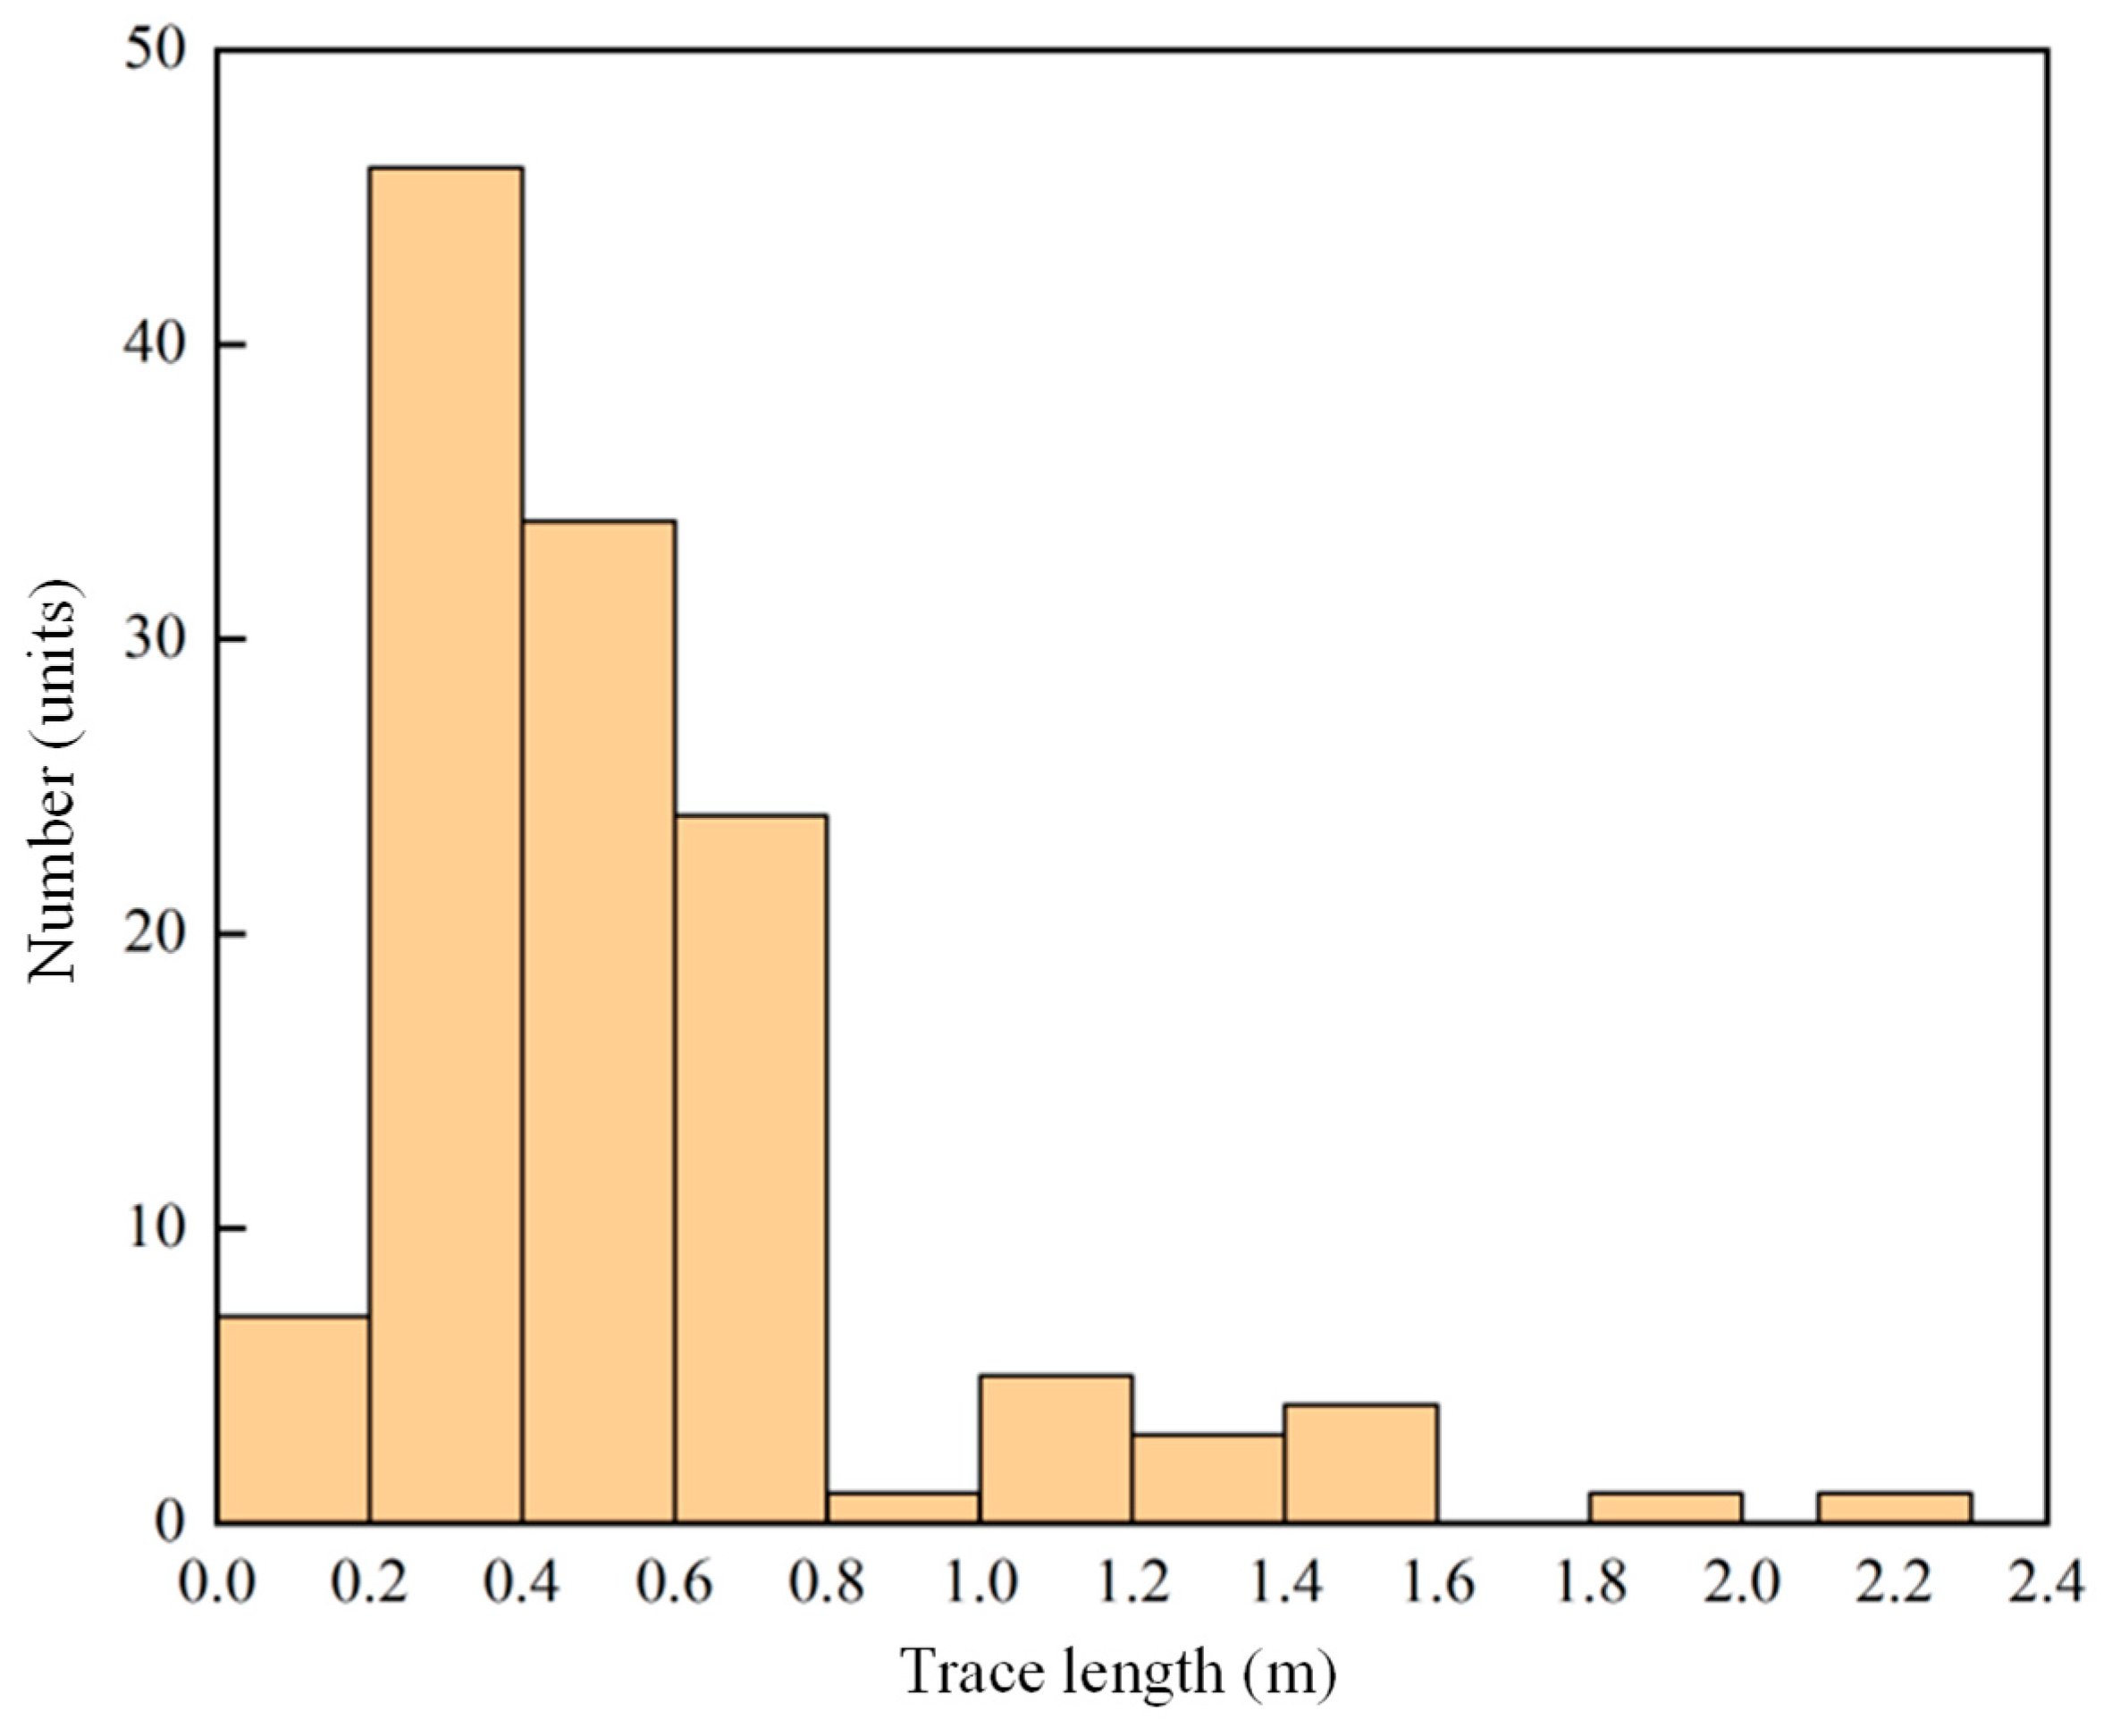
A total of 126 structural trace lines were extracted and statistically analyzed, with the following length distribution characteristics (see
Figure 13 and
Table 3 for details): ① length range: 0.1–2.3 m, with a maximum length of 2.3 m and an average length of 0.61 m, and ② distribution pattern: the majority of traces (approximately 82%) were concentrated within the 0.1–0.9 m range, while traces exceeding 1 m constituted a smaller proportion (approximately 11%).
3.2.3. Face Flatness Recognition
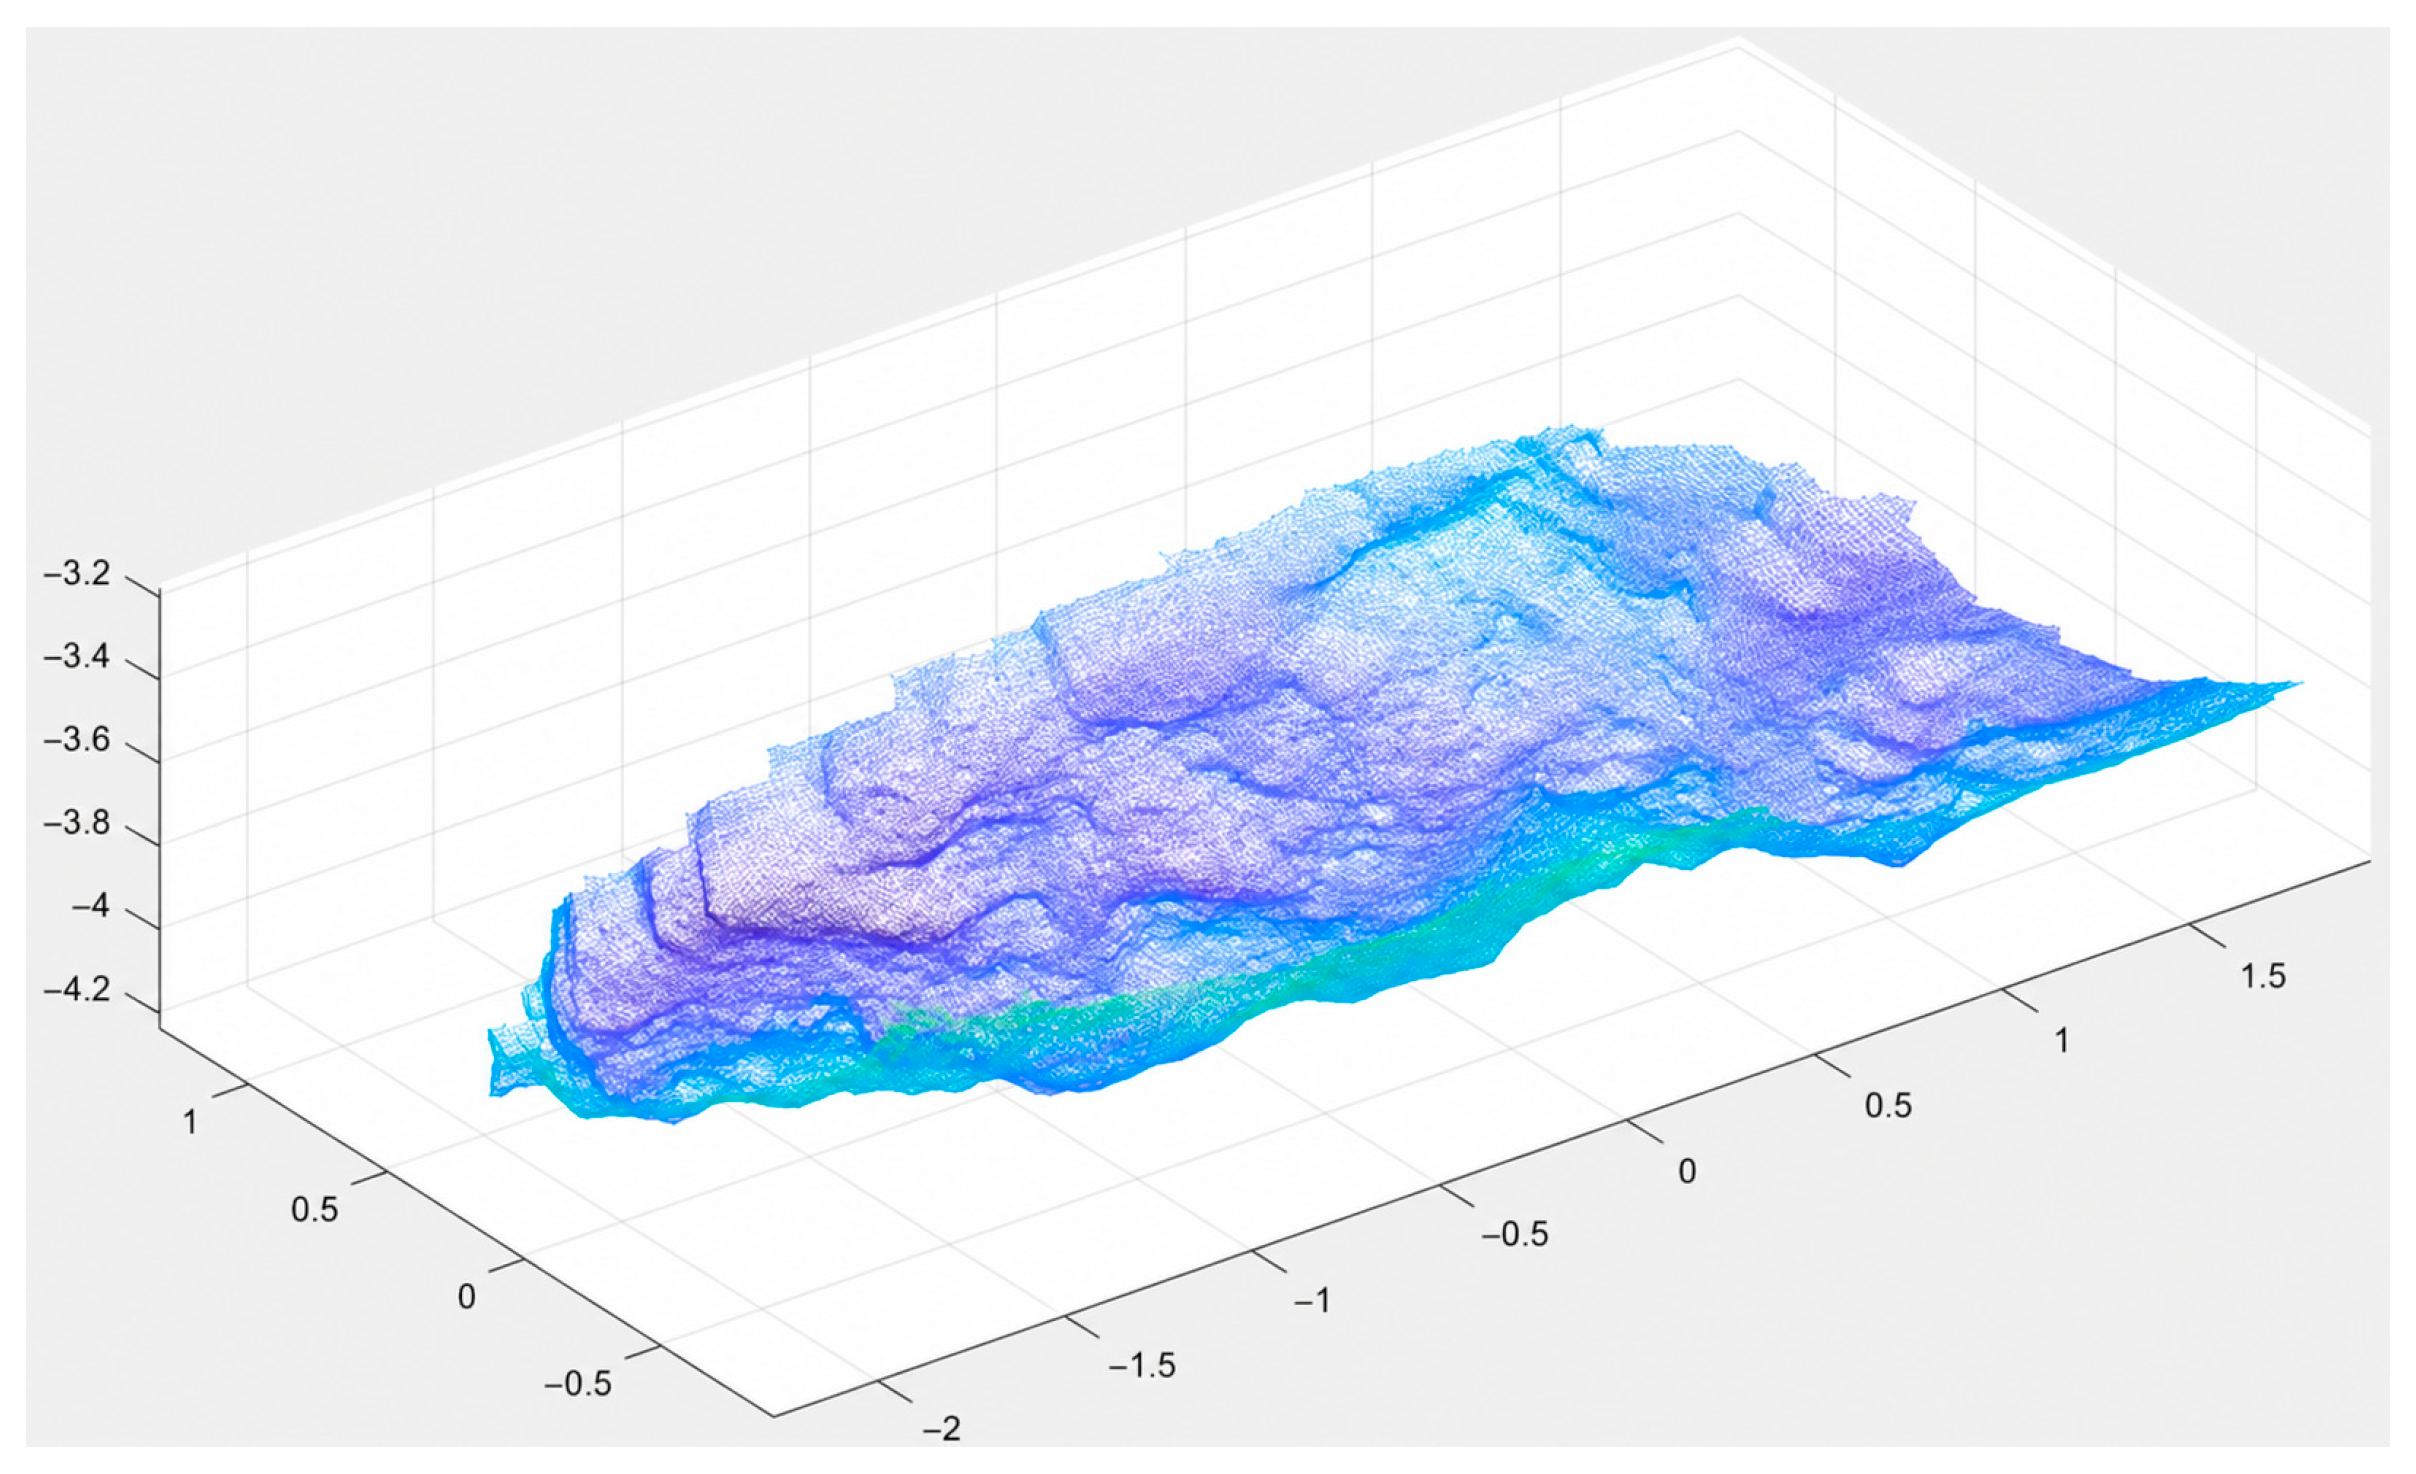
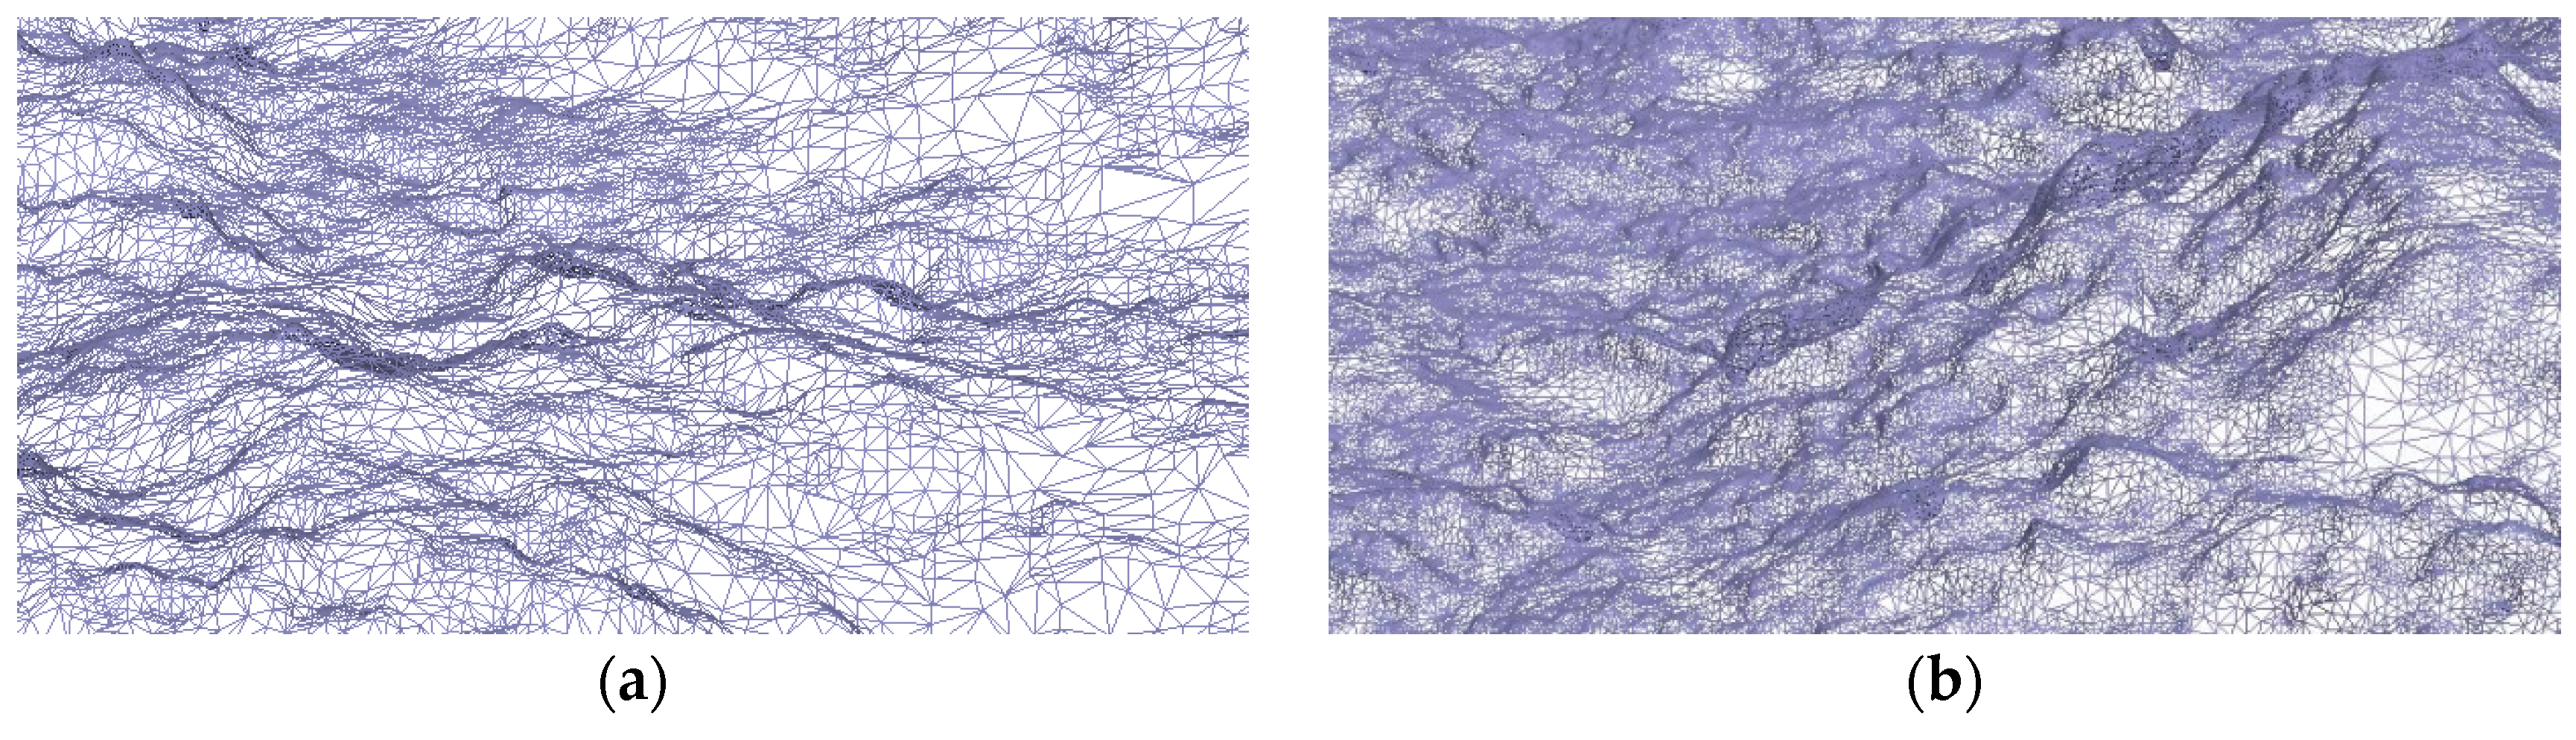
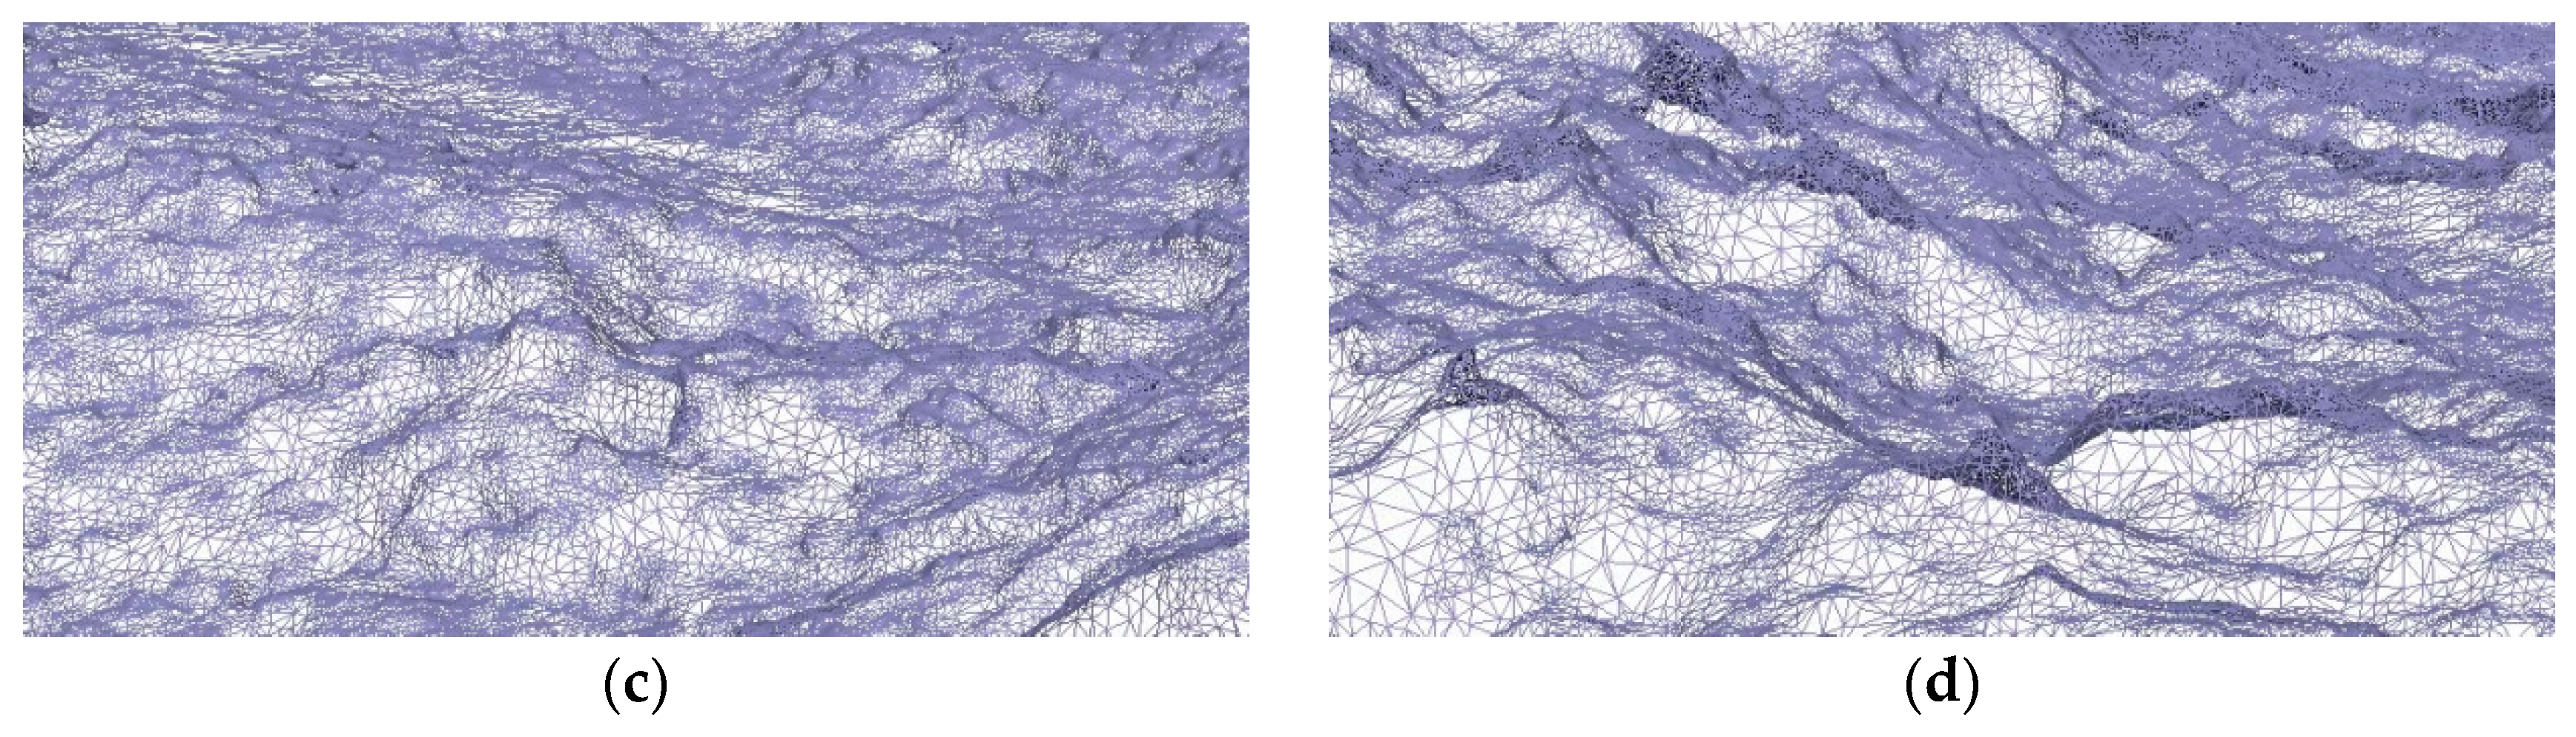
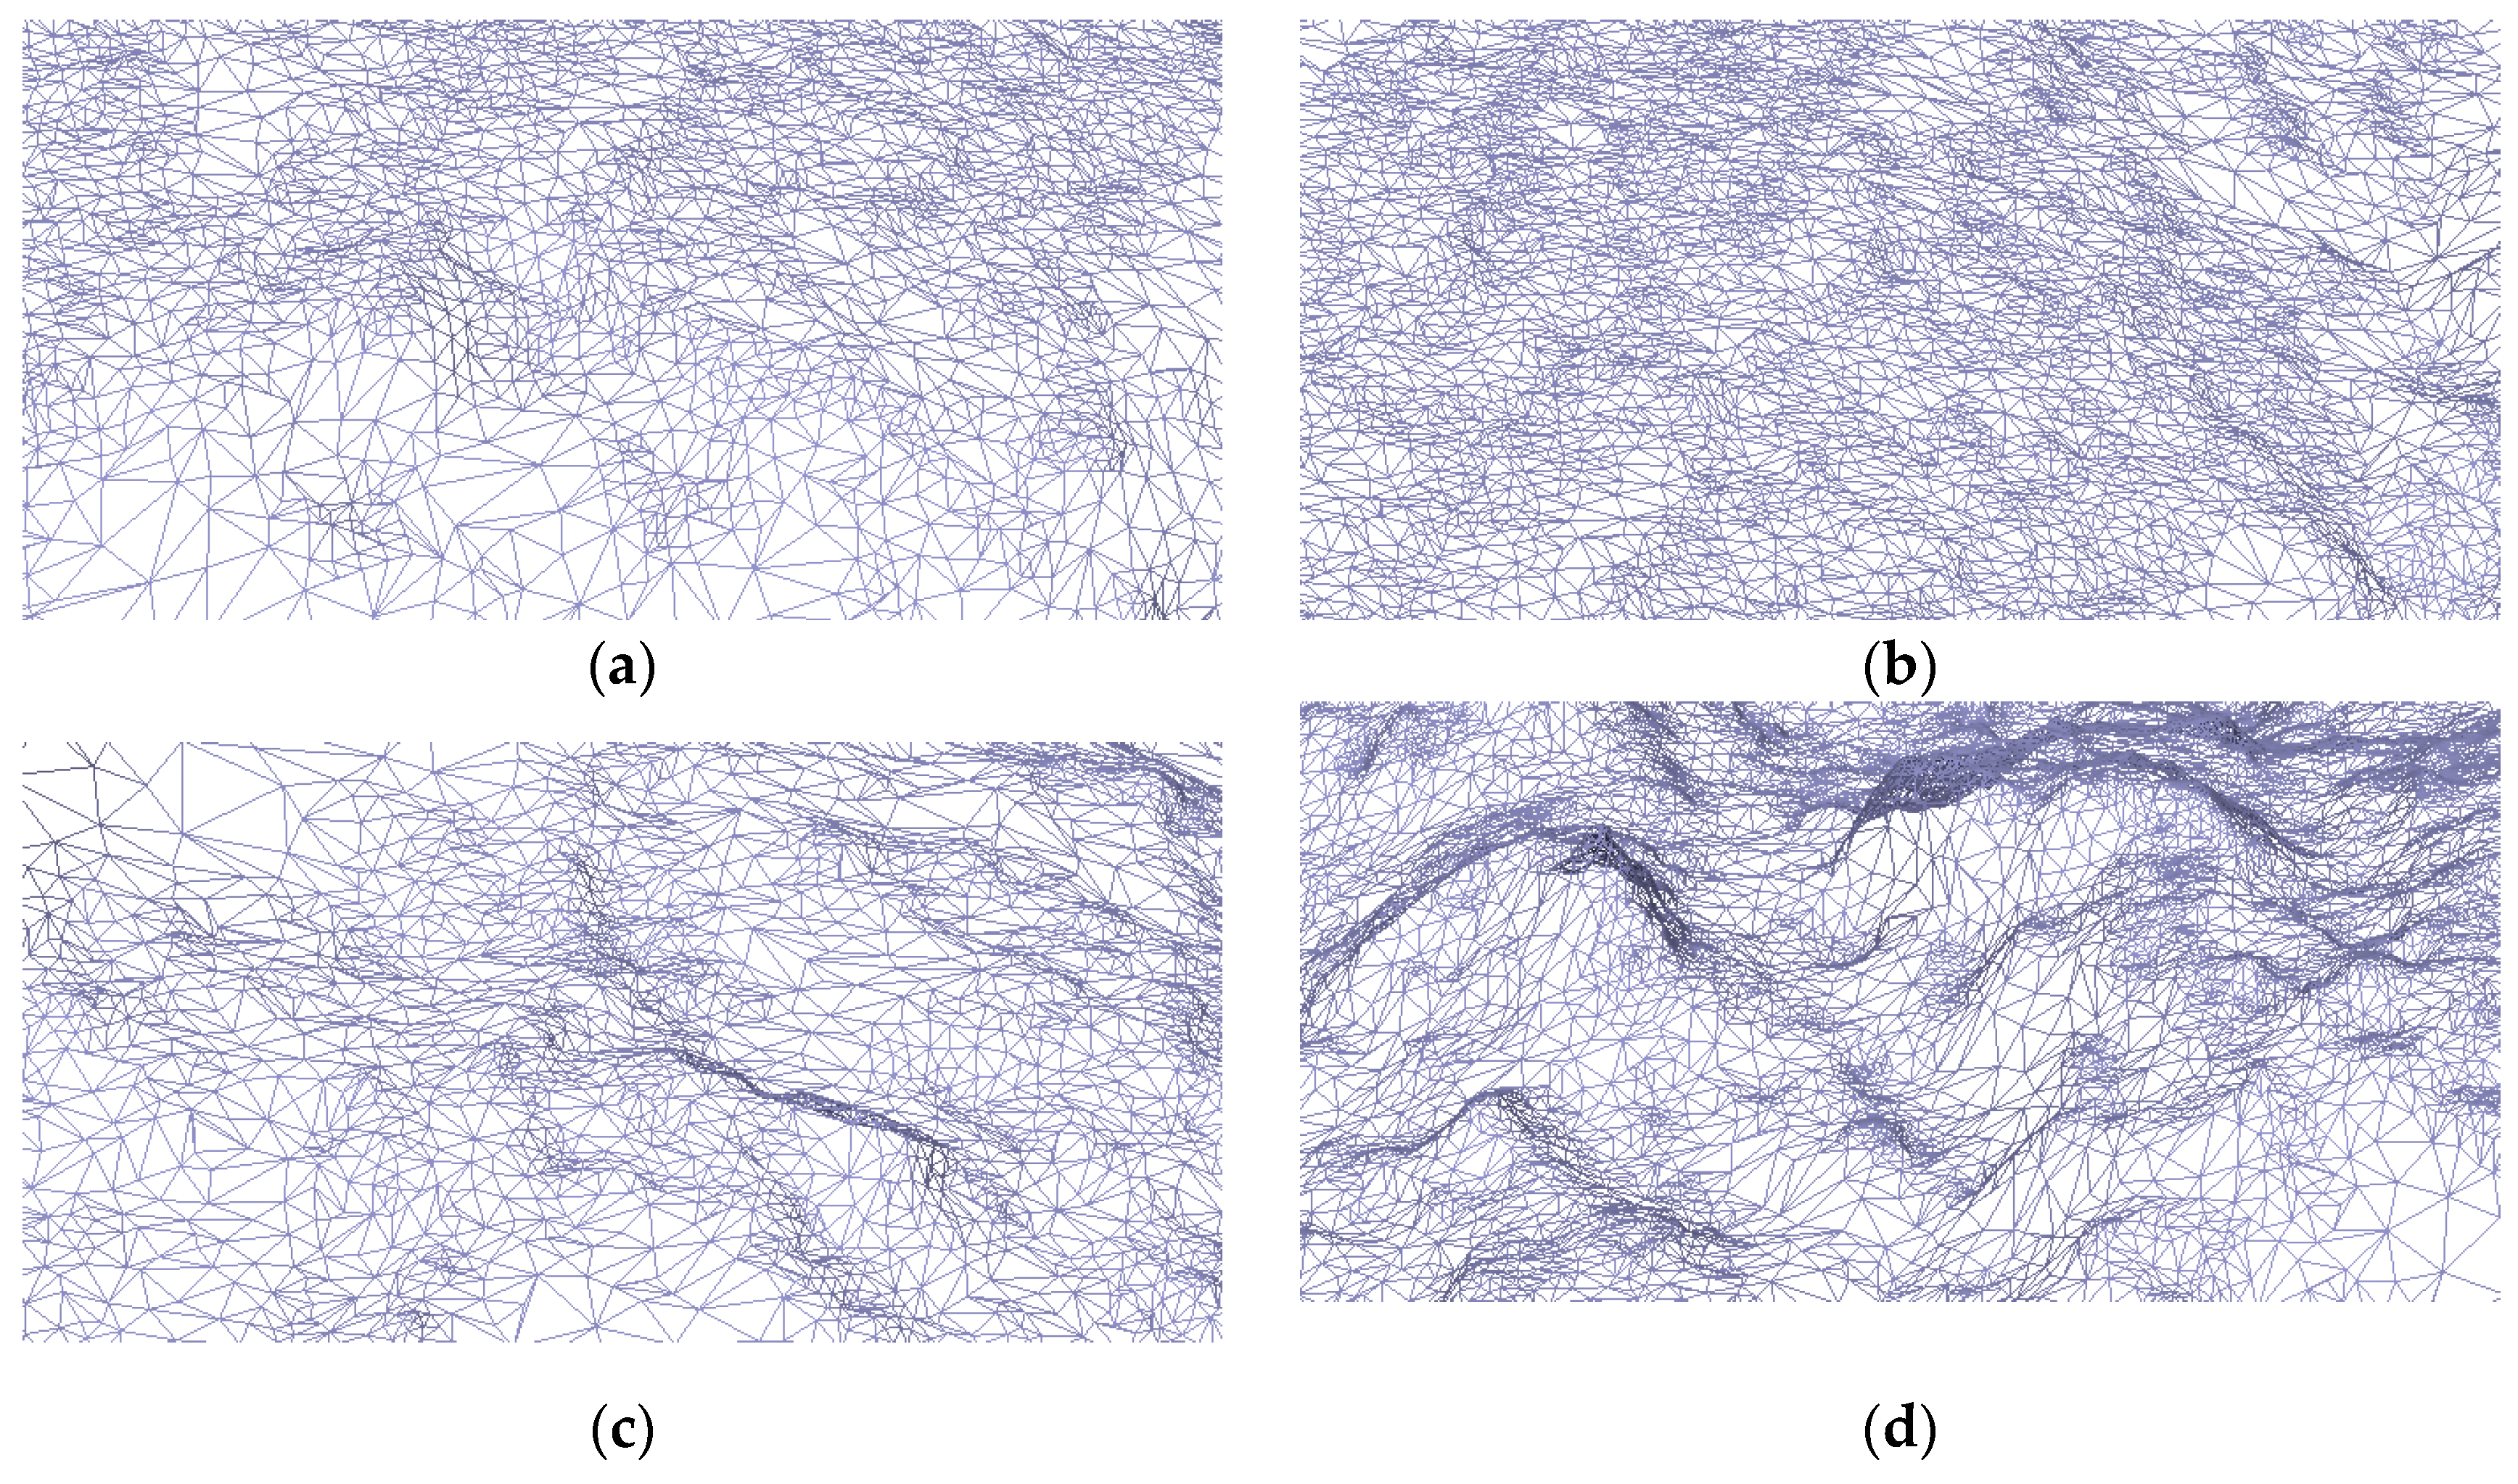
Based on the processed point cloud model, a 3D mesh of the tunnel face was generated (partial meshes illustrated in
Figure 14), enabling visual identification of surface irregularities: following blasting, the upper section of the tunnel face exhibited significant protrusion, while the lower section remained relatively flat. Given the high flatness requirements for the wedge-shaped double-slotted excavation in this project, construction outcomes necessitate improvement through optimized blasting parameters.
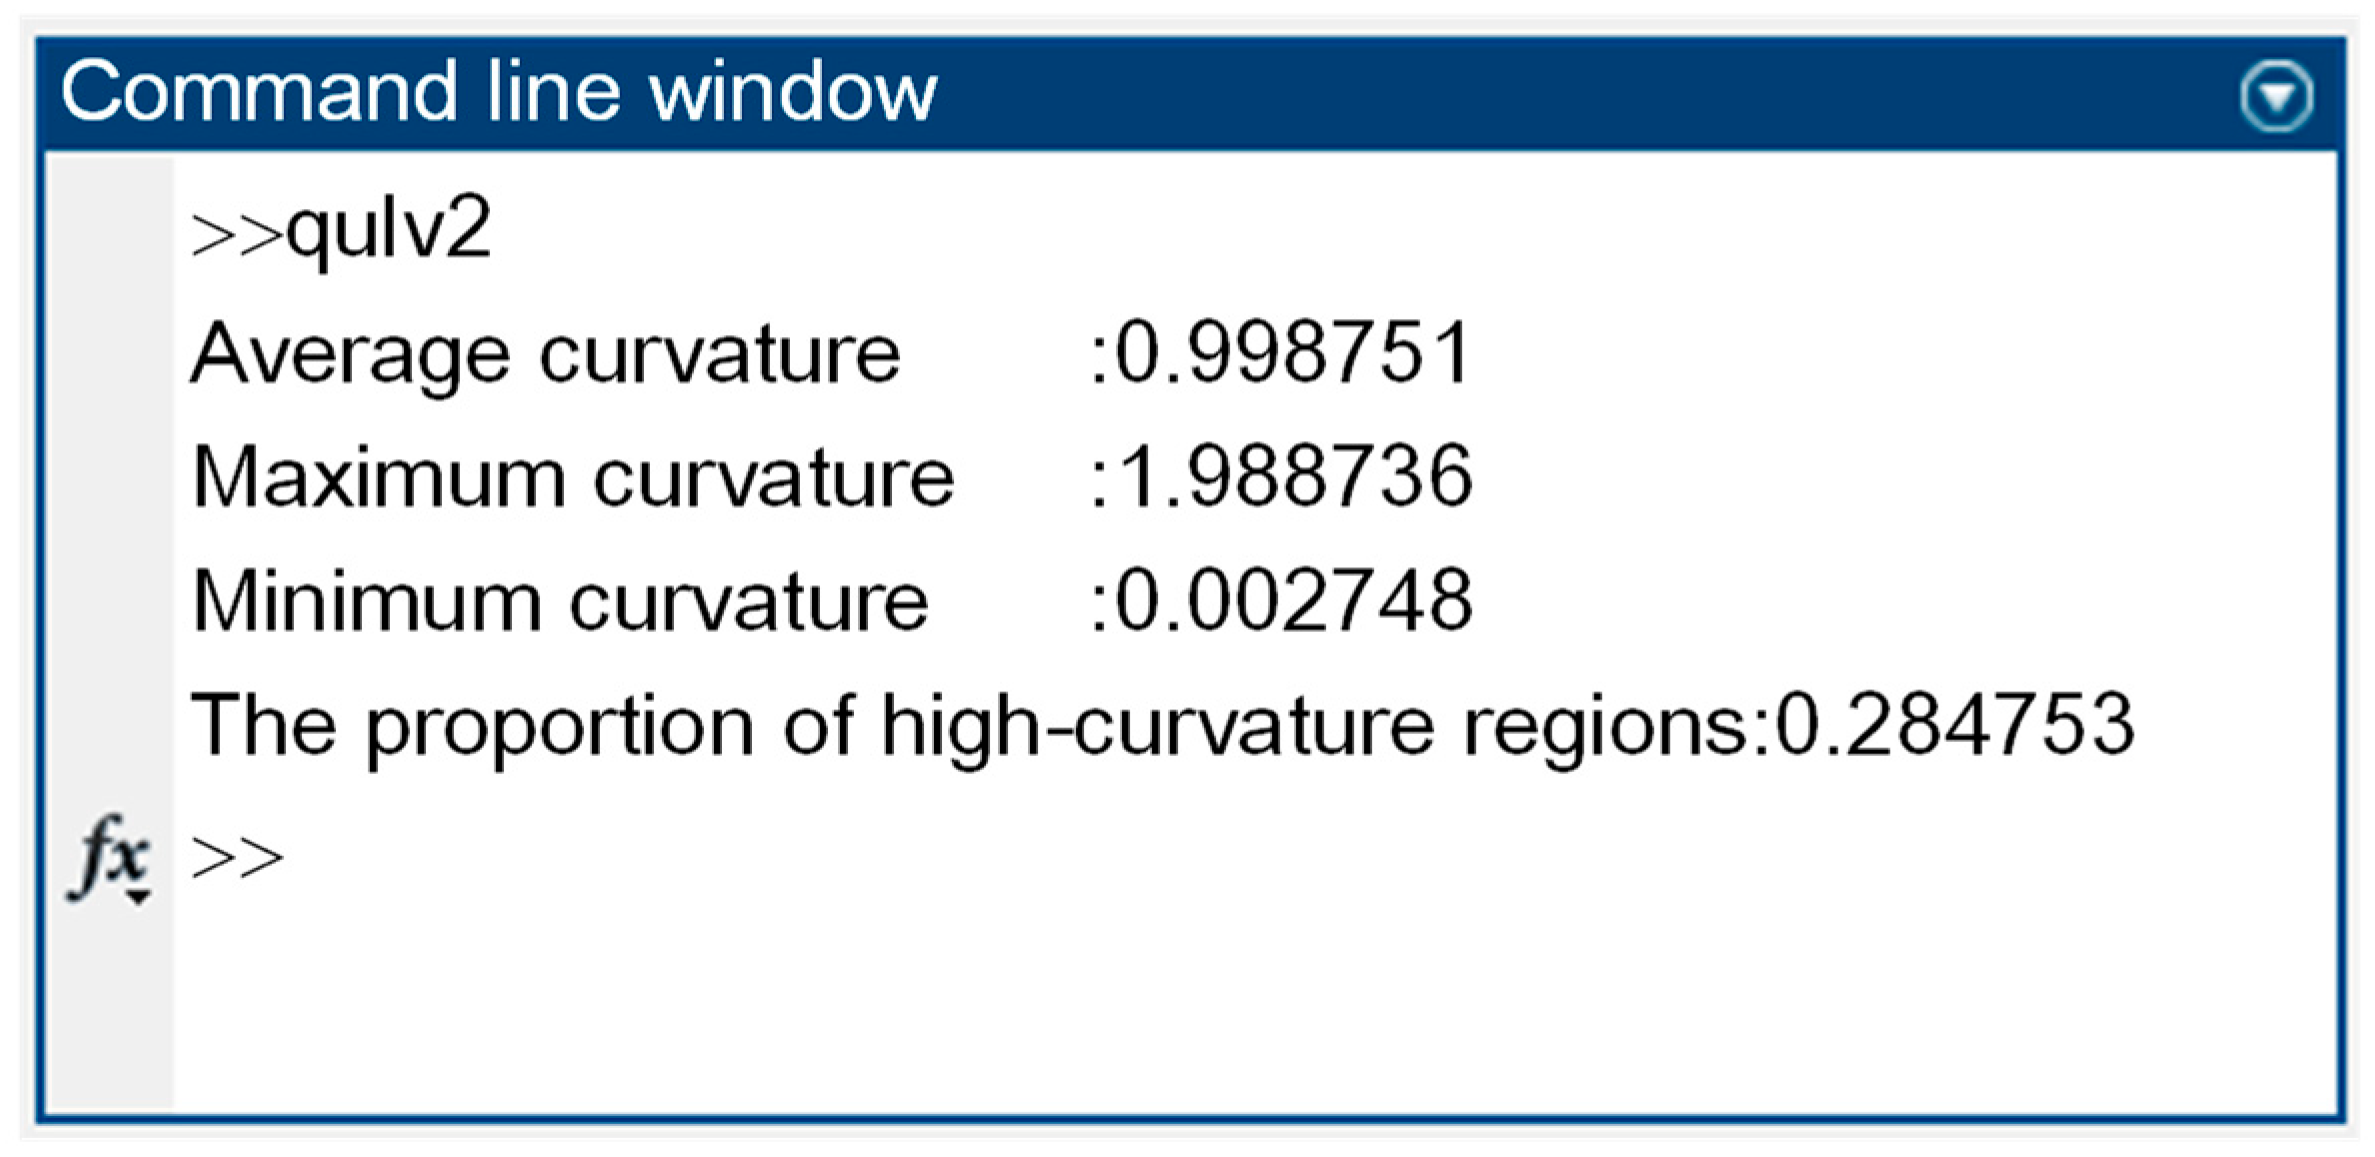
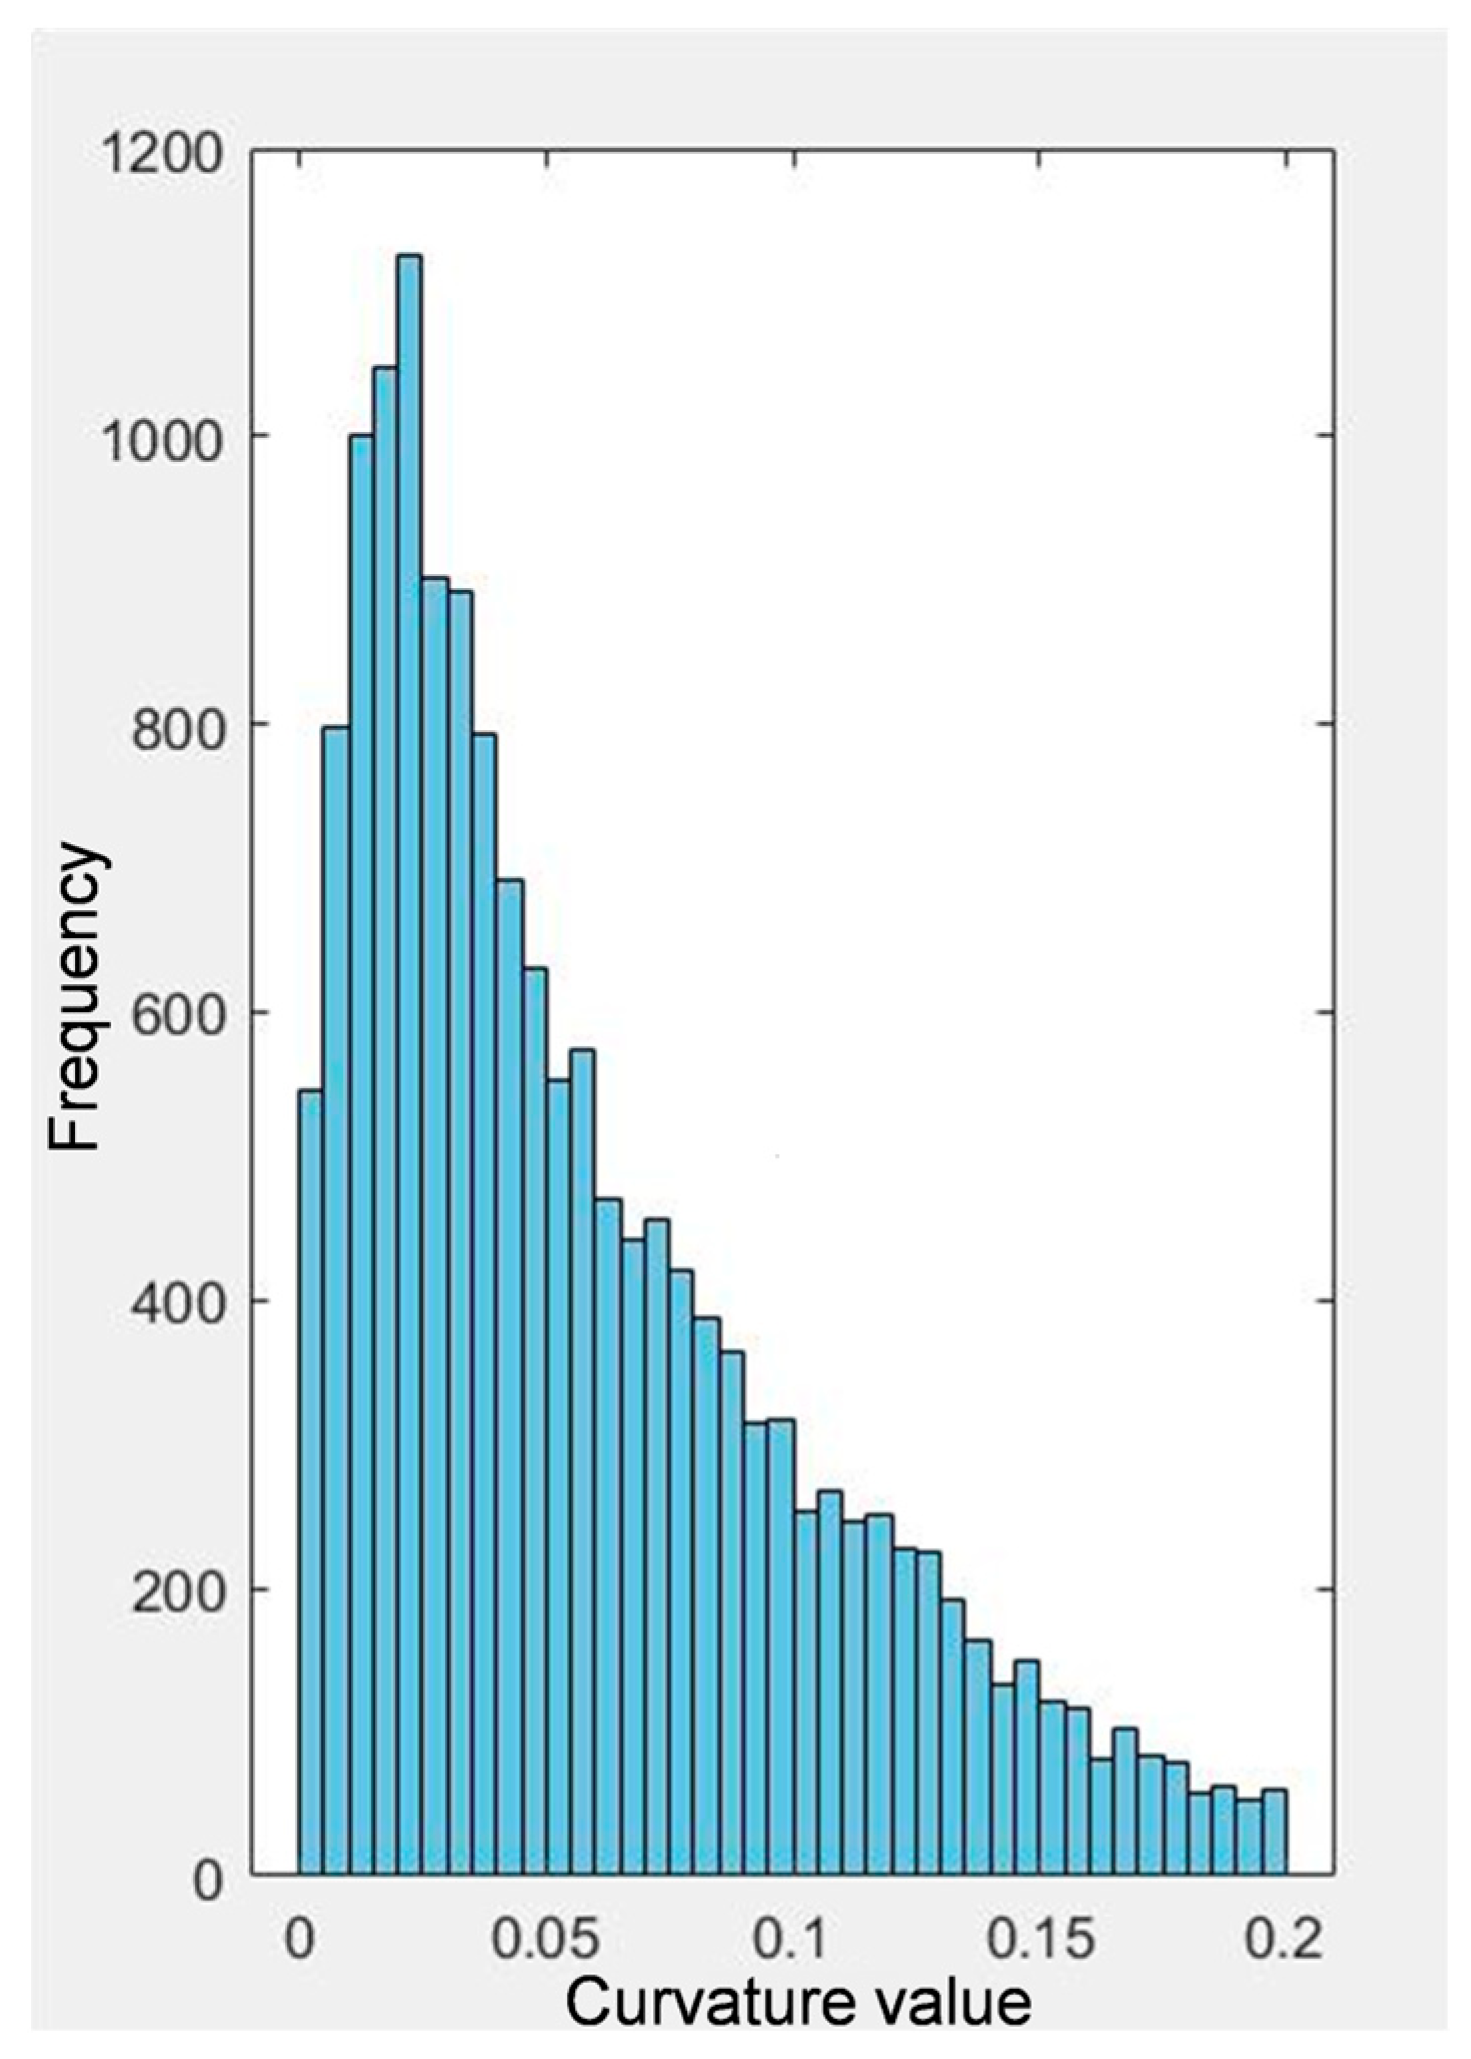
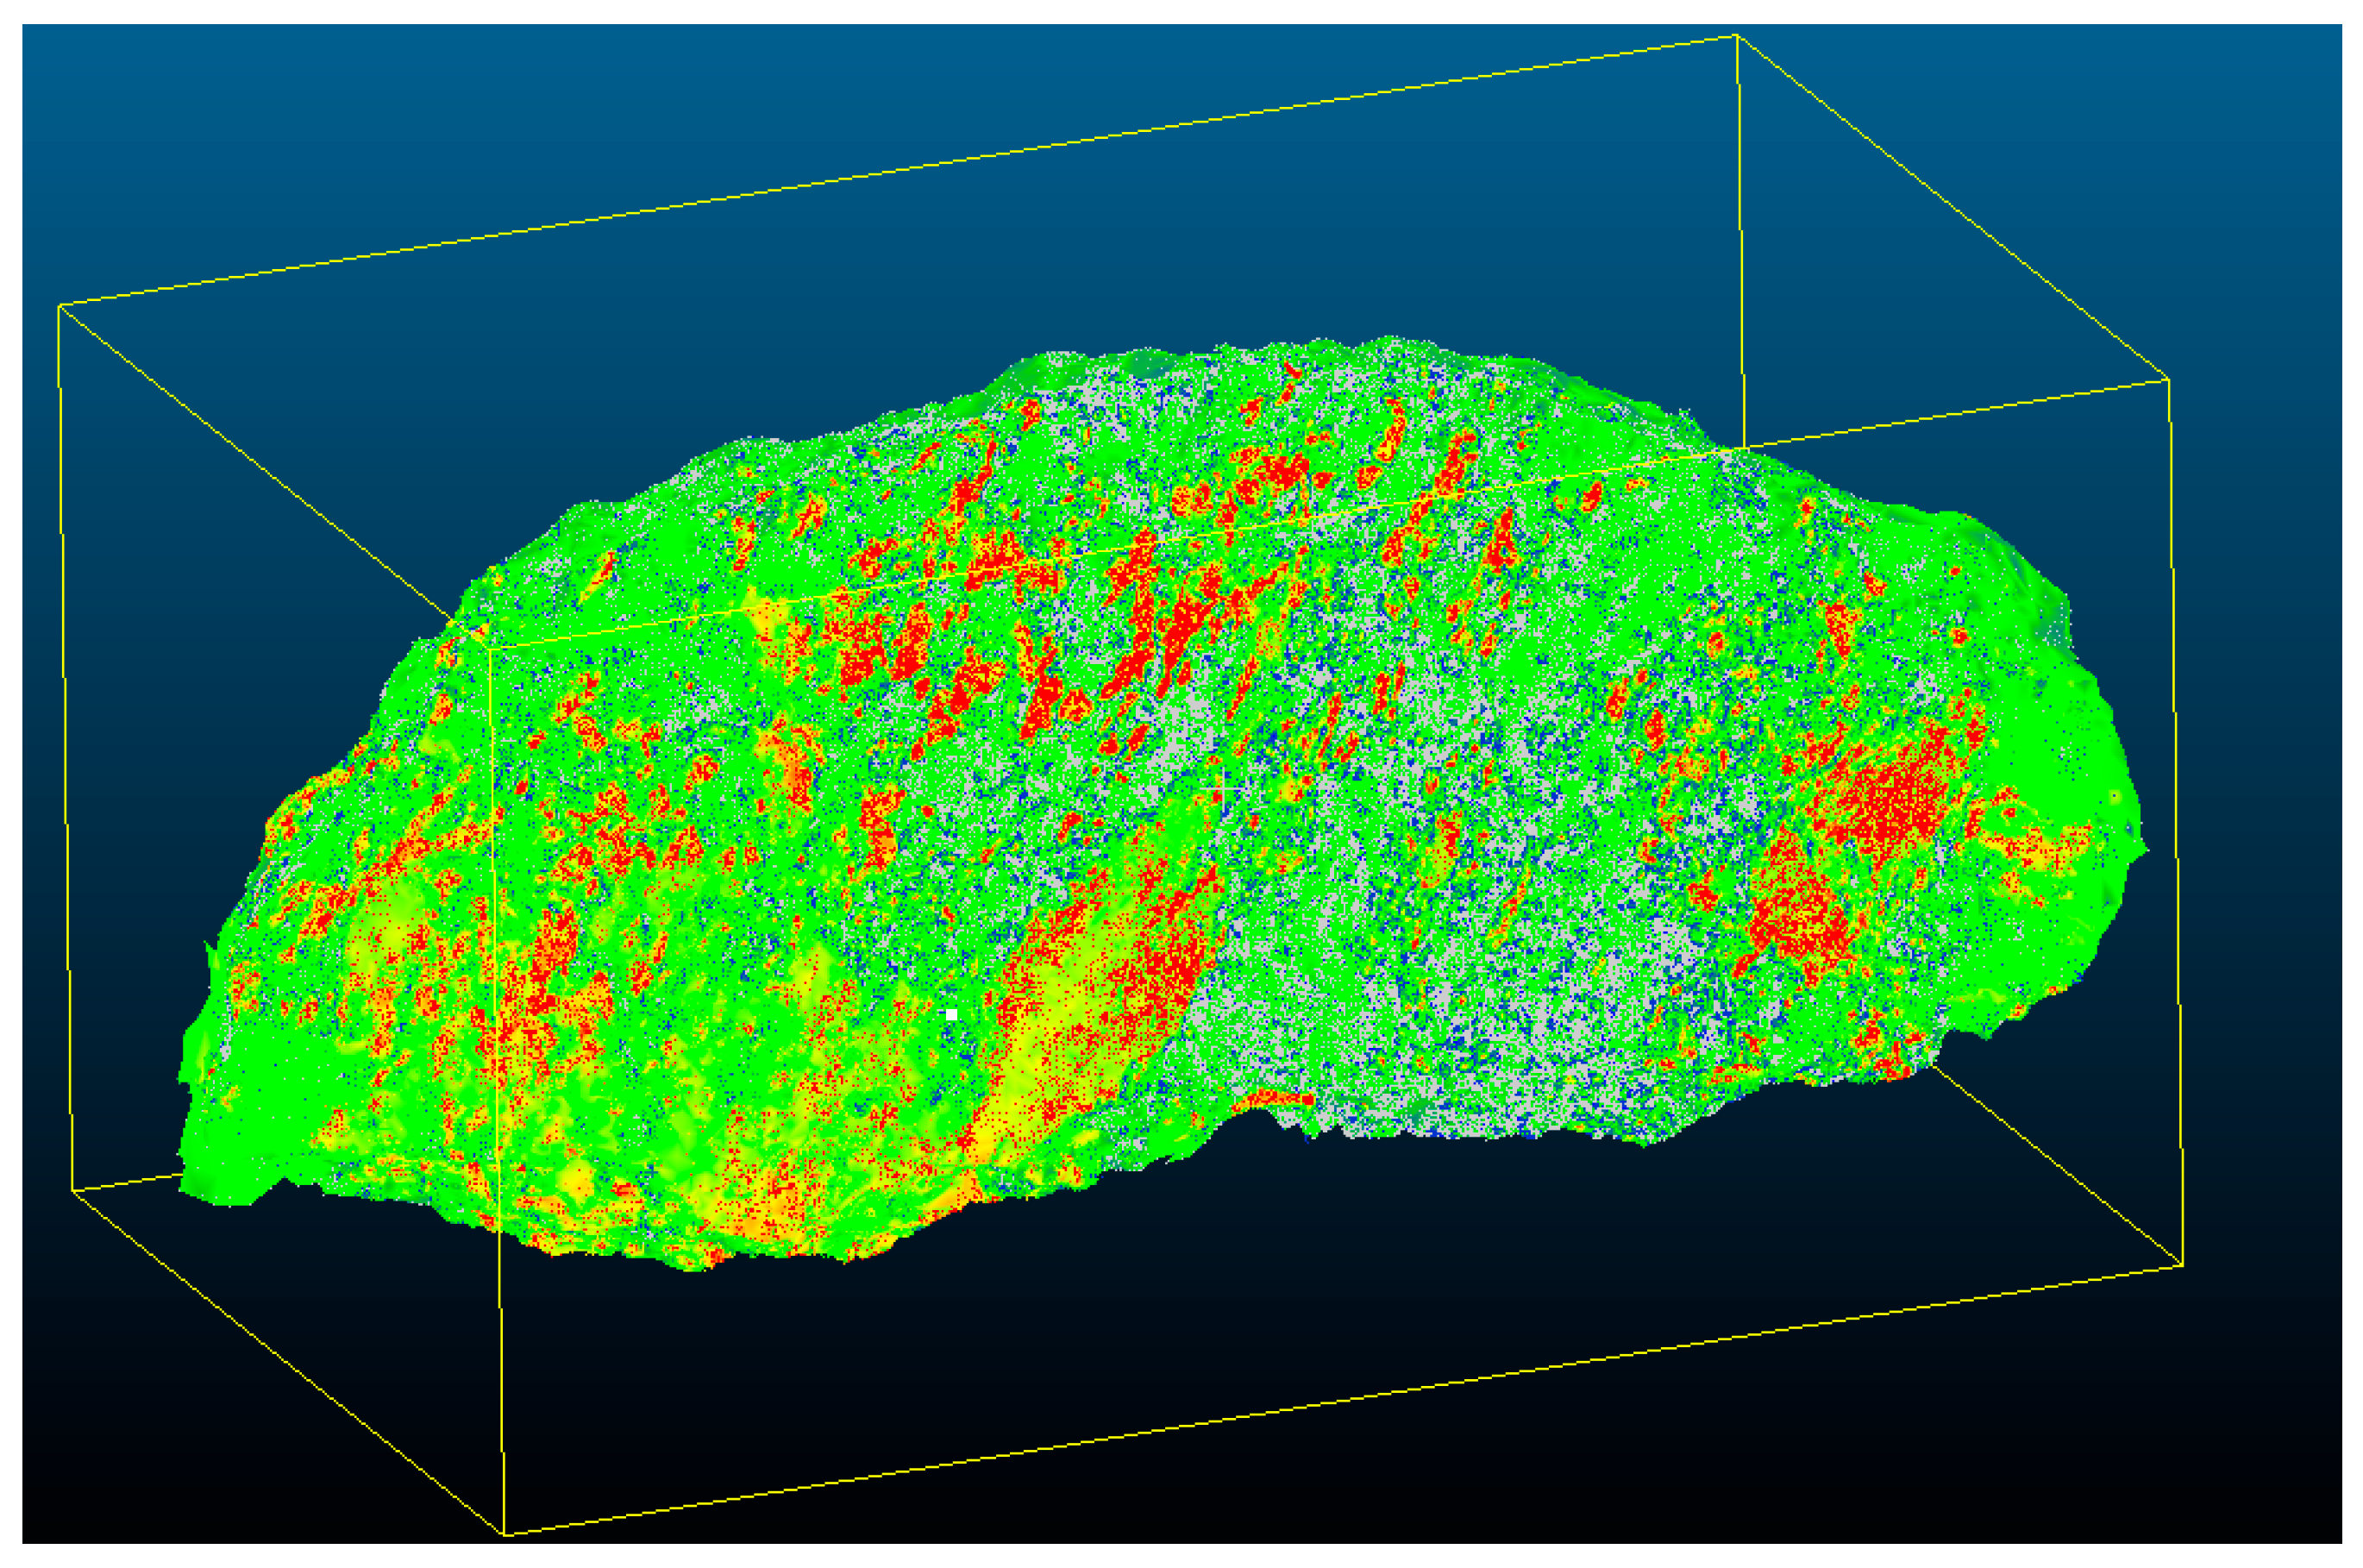
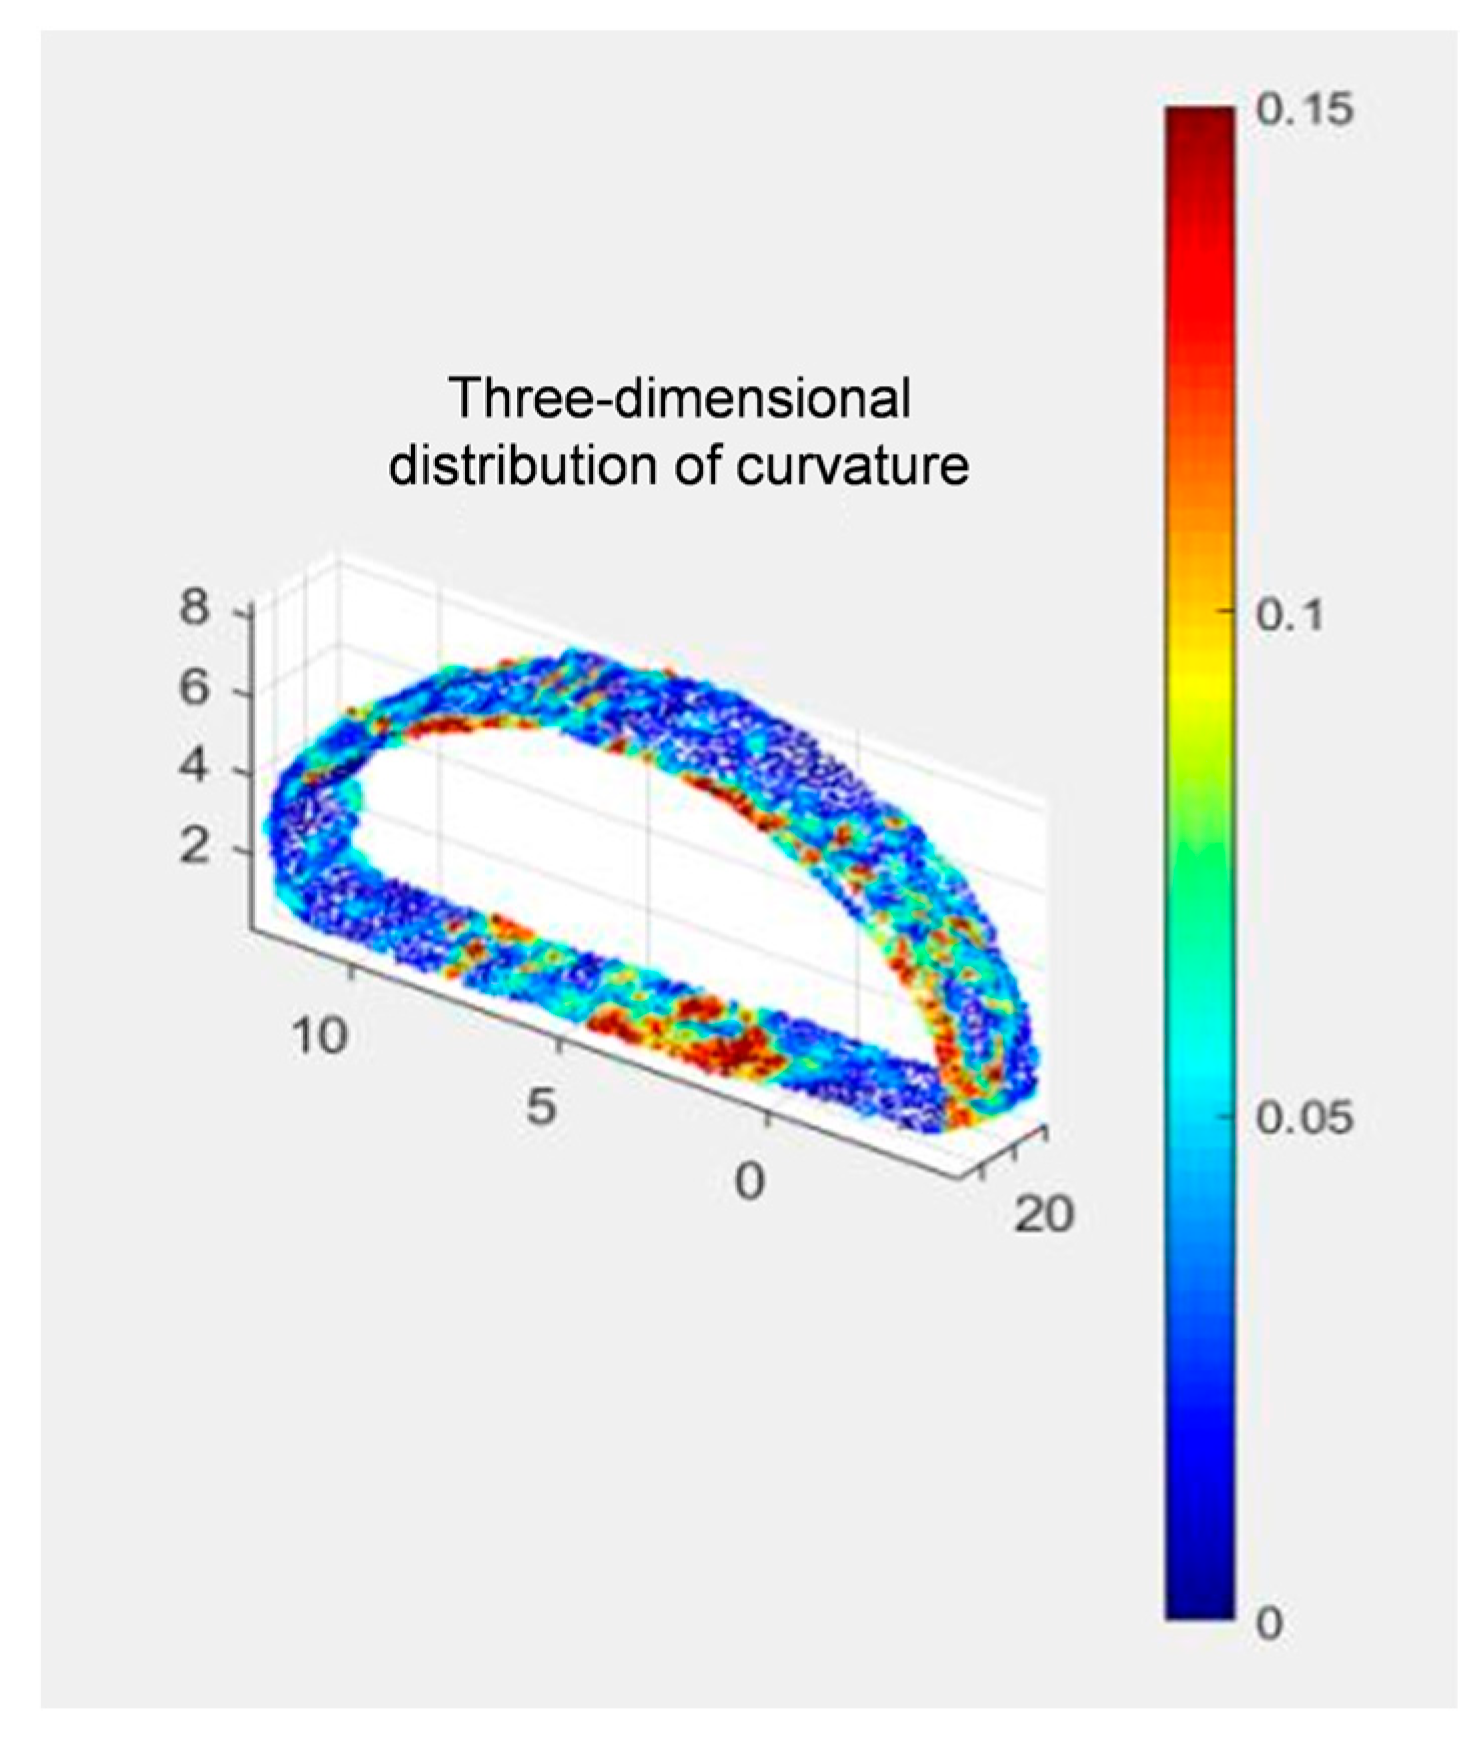
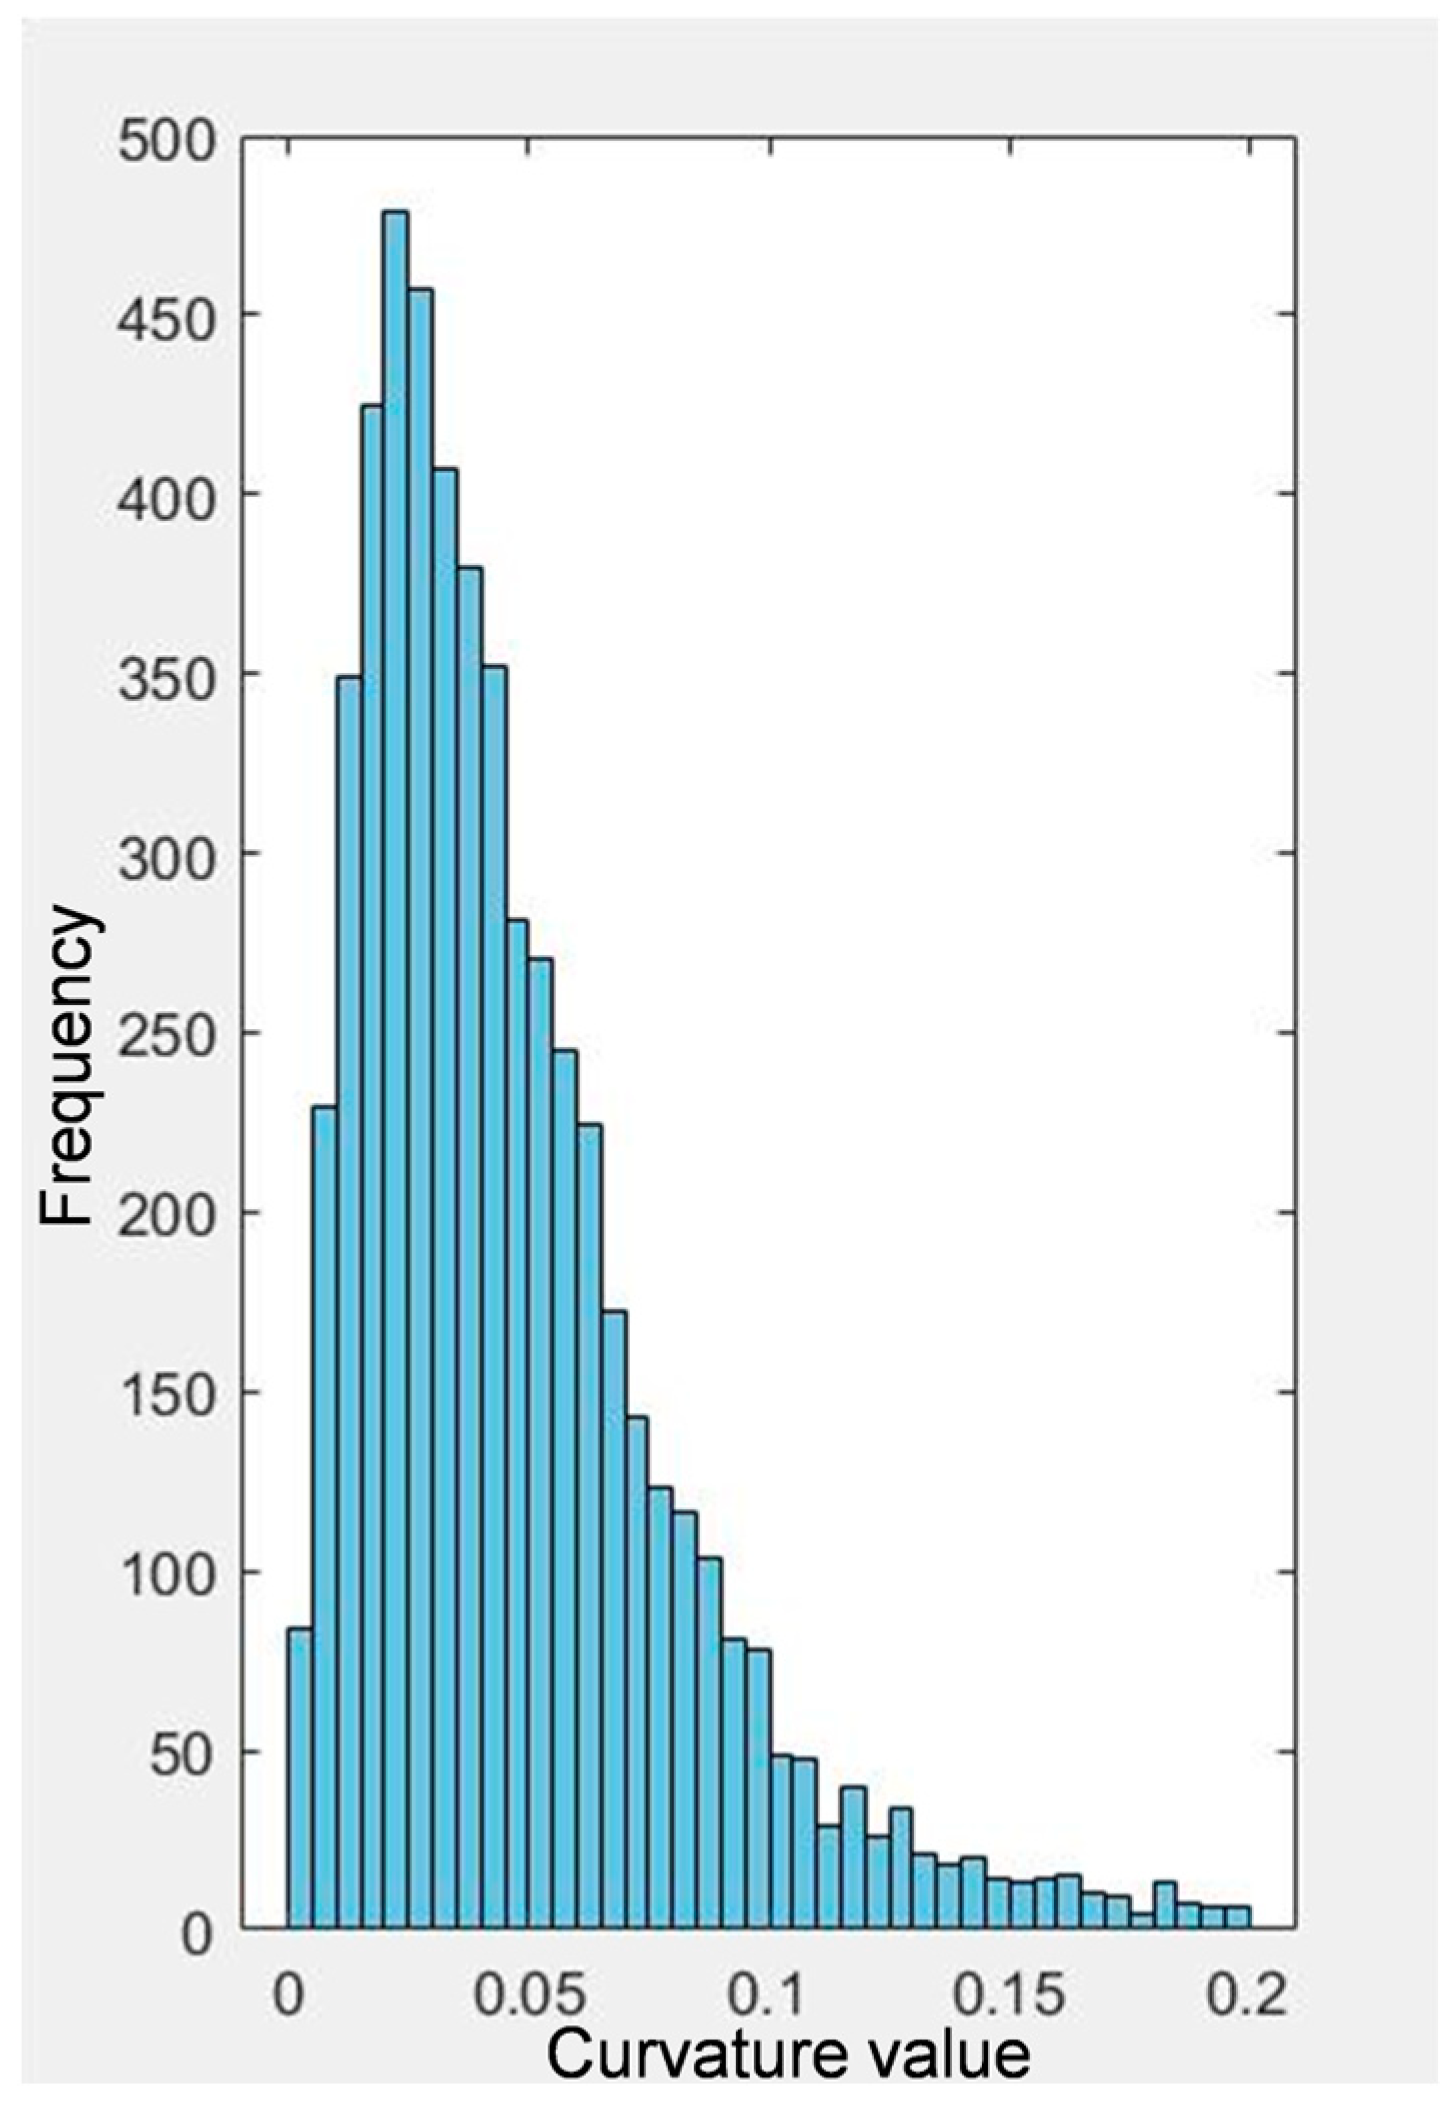
To quantitatively assess flatness, this paper employs curvature value analysis—curvature characterizes the degree of bending at a point on a surface and serves as a common metric for surface curvature analysis. Points with higher curvature values correspond to concave or convex regions, while lower values indicate flat areas. Analyzing curvature distribution enables precise identification of concave and convex features on the tunnel face. Utilizing the MATLAB R2021a platform, point cloud data from the tunnel face was imported. The calculated curvature distribution characteristics are as follows (see
Figure 15 for a schematic of the face point cloud curvature,
Figure 16 for the point cloud curvature distribution map, and
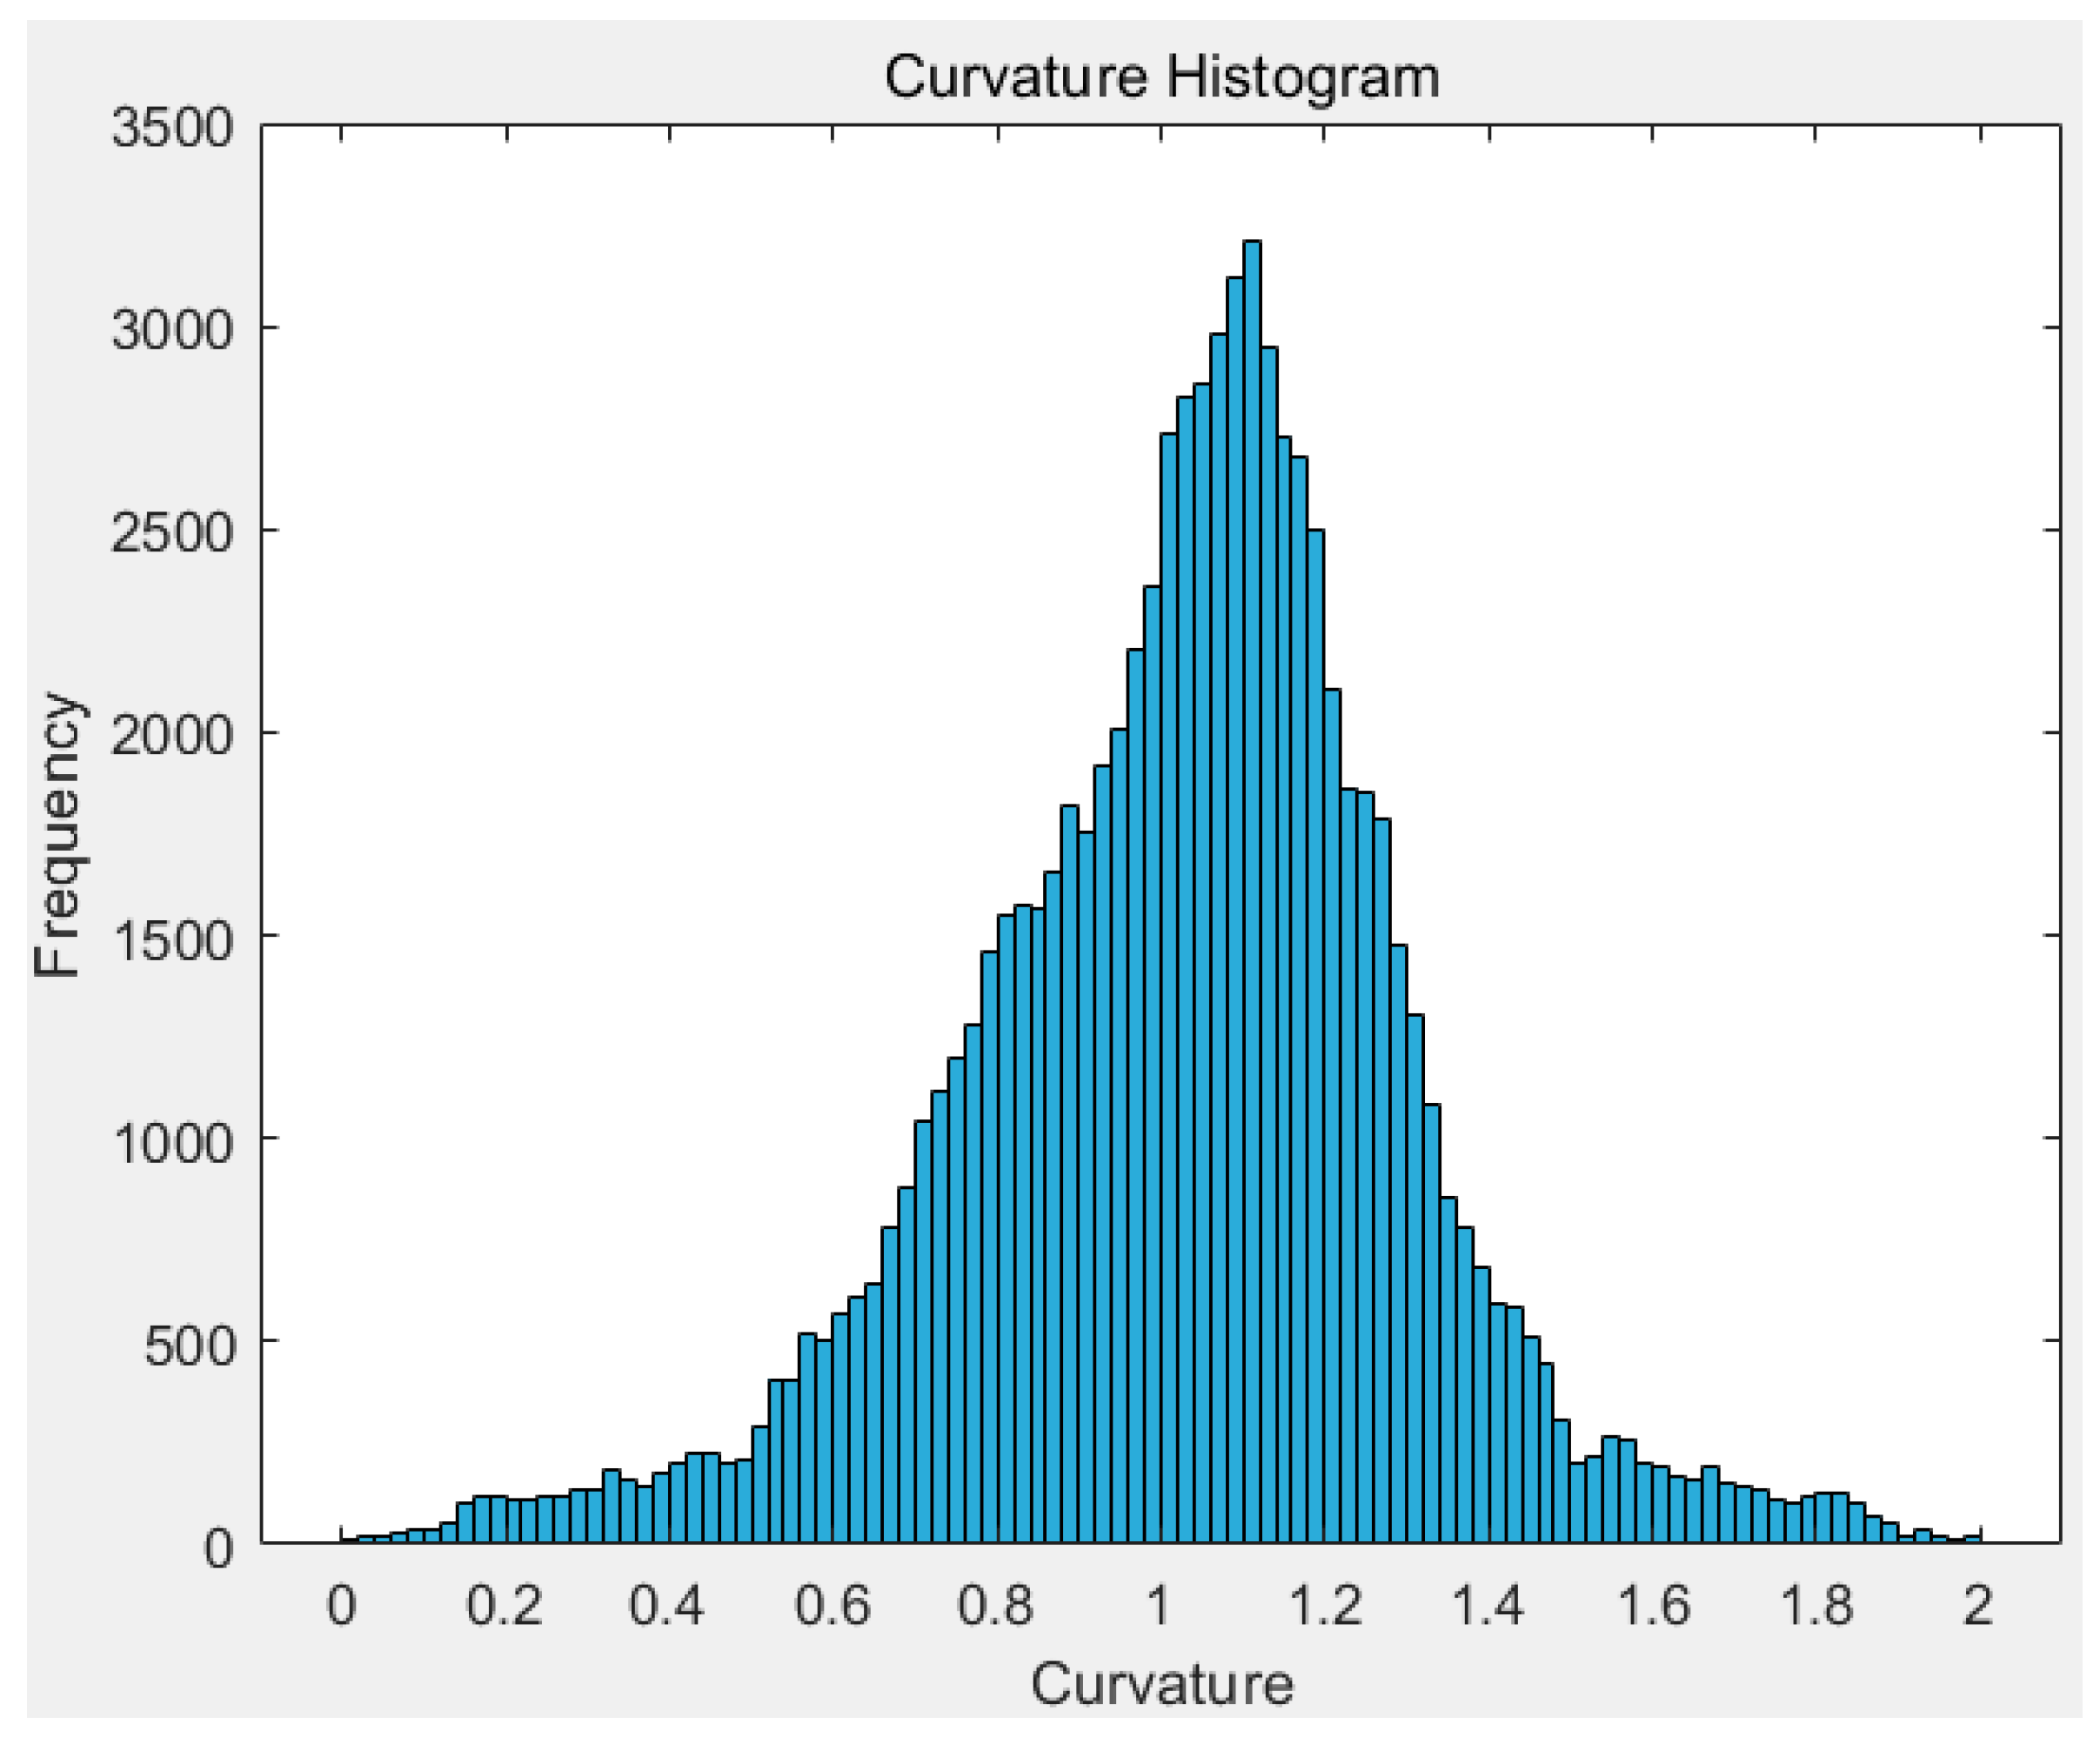
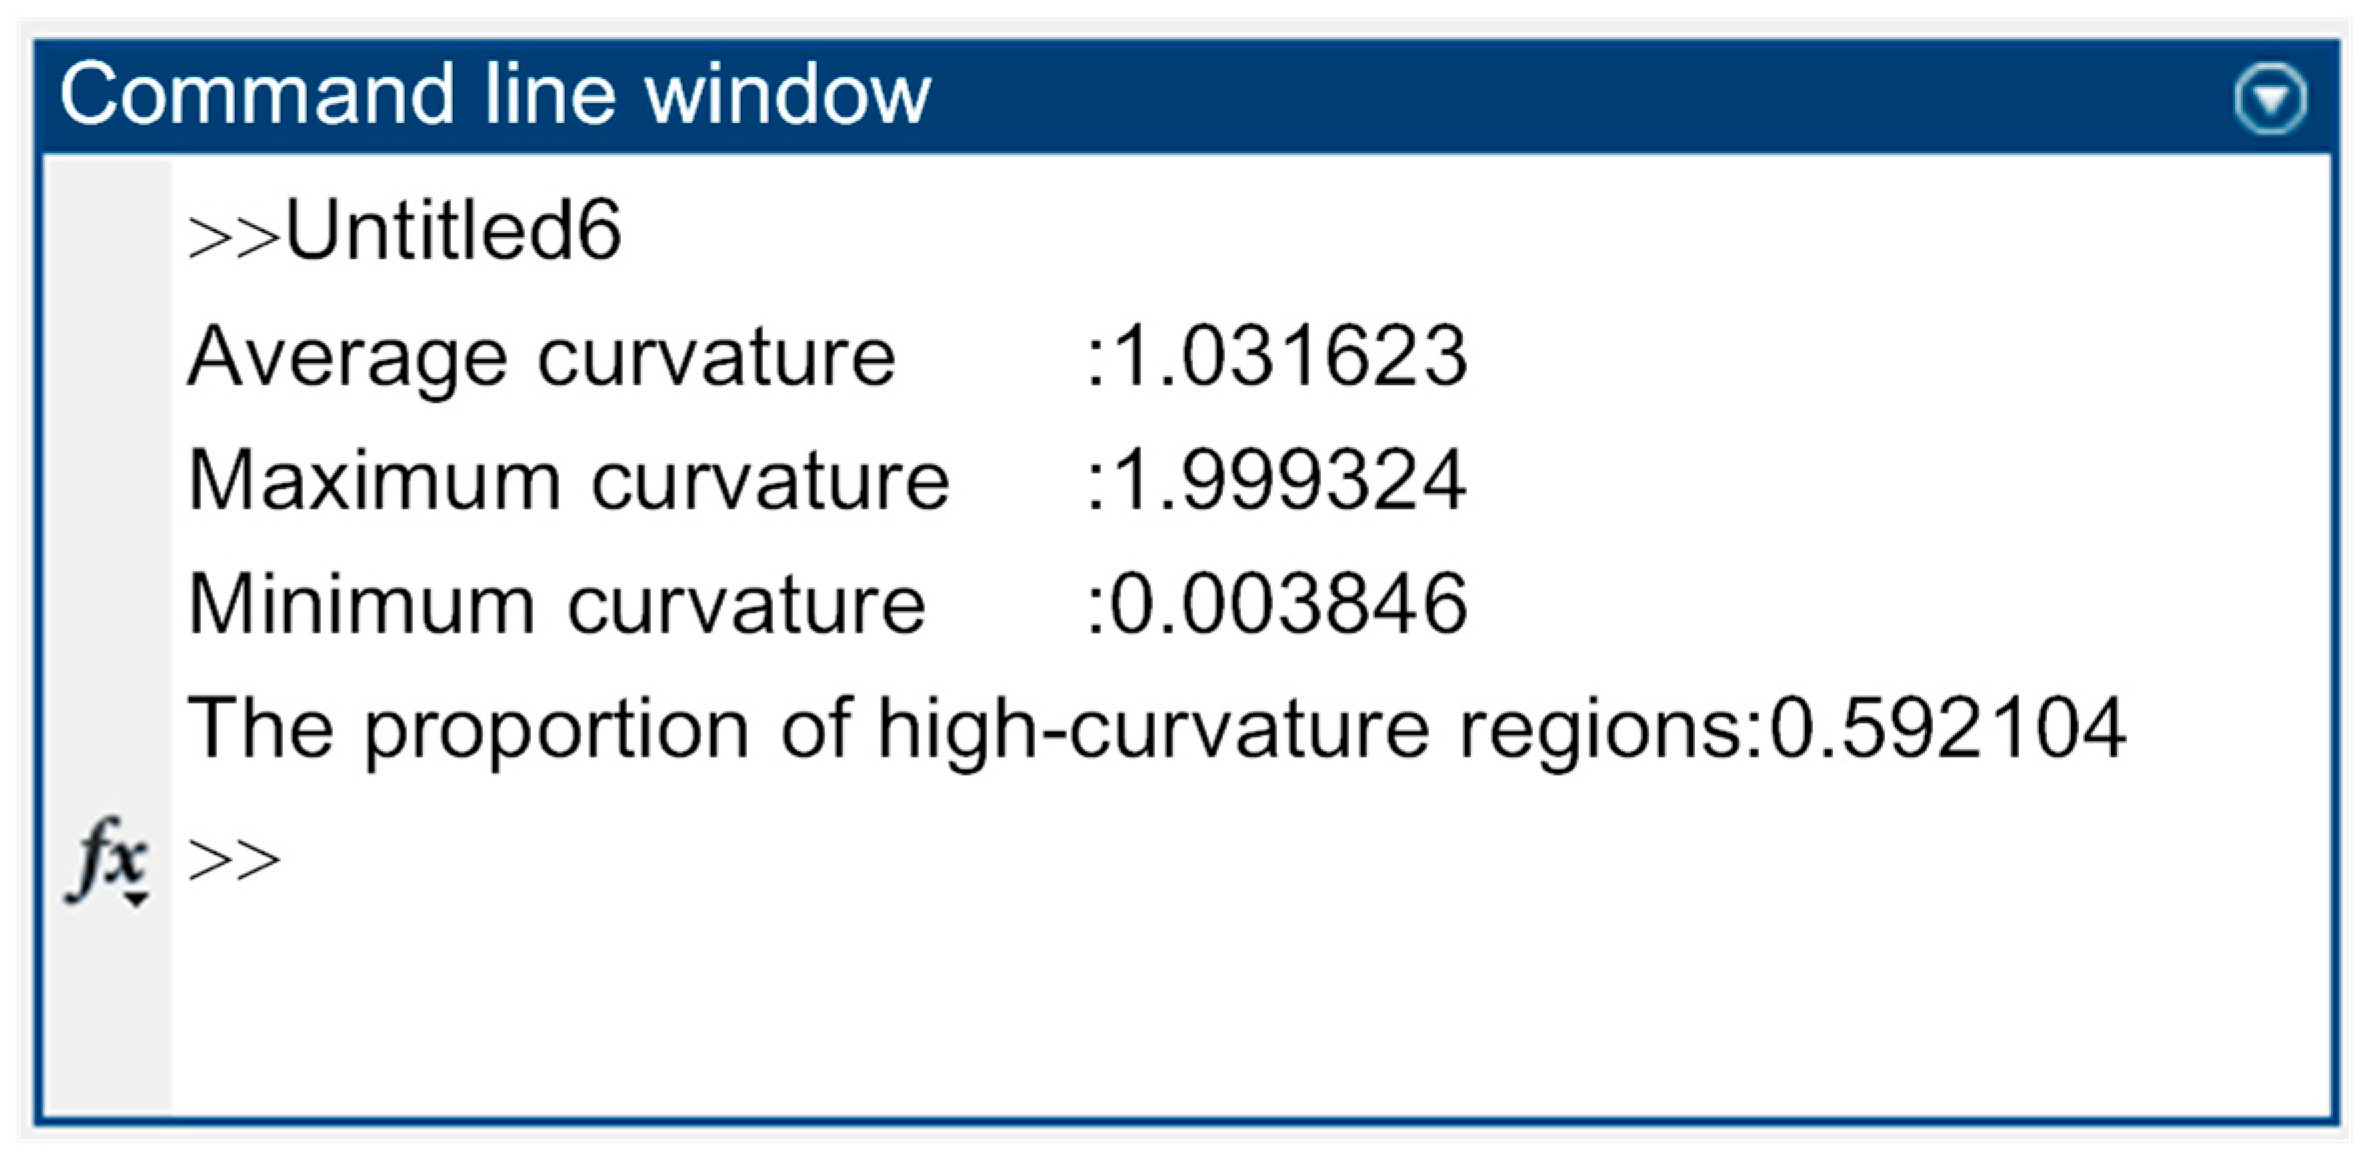
Figure 17 for the curvature calculation results): the curvature values of the tunnel face point cloud cluster between 1 and 2, exhibiting overall high values. The maximum curvature differs from the average curvature by approximately 0.97, with an uneven distribution. This indicates poor overall flatness of the tunnel face, necessitating adjustment of blasting parameters.
In the present analysis, curvature-based region labels were assigned using an area-weighted thresholding scheme. For each triangular mesh element
i, the local curvature
Ki was obtained from the reconstructed surface, and the area ratio of a curvature class
C was calculated as:
In Equation (10), Ai denotes the area of mesh element i, and N is the total number of elements. This area-weighted definition avoids bias caused by non-uniform mesh density. The pre- and post-optimization models of each tunnel were processed using the same image preprocessing workflow, reconstruction procedure, mesh-processing settings, and curvature-computation method. Under this consistent processing condition, the reported changes in curvature-classified area ratios represent relative geometric differences between the two excavation states. Preprocessing parameters may affect the absolute magnitude of local curvature to some extent; however, the optimization interpretation in this study mainly relied on the spatial concentration and relative reduction in high-curvature regions obtained from the same workflow.
The numerical thresholds are treated as case-specific operational thresholds rather than universal engineering-code limits, because curvature magnitude may be affected by point-cloud scale, mesh density, surface smoothing, and the reconstruction or scanning workflow. In the Huangtai Tunnel, the curvature histogram shows a clear transition between the 0–1 and 1–2 intervals. Therefore, K < 1 is used to describe relatively flat or slightly fluctuating regions, whereas K ≥ 1 indicates high-curvature regions associated with obvious local protrusion or depression. The reported high-curvature area ratio therefore denotes the area fraction of mesh elements satisfying K ≥ 1.
Analysis of the rock mass structural planes, structural traces, and face flatness indicates that the double-groove blasting has resulted in inadequate face flatness, with undercutting observed in the middle and upper sections. This impacts subsequent drilling depth and progress, necessitating optimization of the blasting parameters for both cut holes and auxiliary holes.
3.3. Blasting Parameter Optimization
Combining the original blasting parameter design (as illustrated in
Table 4) with the results of 3D model identification, analysis from the perspectives of surrounding rock mechanical properties and hard rock double-grooving blasting design reveals that the core causes of the blasting issues include: the compressive strength of the surrounding rock in the full-face excavation section of the tunnel is approximately 50 MPa, with the rock mass’s high strength and high integrity demanding stringent precision in grooving design; in the original design, excessive spacing between auxiliary holes, insufficient charge quantities in some holes, and shallow grooving depths resulted in inadequate rock fragmentation; the limited number of cut holes and their excessive proximity caused overloading of the grooving cavity borne by the primary cut holes, compromising uniform energy distribution; and large single-cut excavation advances made it difficult to precisely align the bottoms of blast holes within the same mileage cross-section, reducing blasting positioning accuracy.
In drill-and-blast tunneling, the cut holes are designed to create an initial cavity at the face. This cavity provides additional free surfaces and reduces confinement, so the subsequent blast waves and gas expansion can propagate toward the relief and break the rock in a more controlled manner. When the cut is weak, the relief space is small and the rock remains highly confined; energy is then spent on crushing near the boreholes and can lead to uneven breakage, leaving protrusions or causing local overbreak. Increasing the number of cut holes or their depth enlarges the relief space and redistributes the initiation energy, which improves the uniformity of rock breakage across the middle–upper face and therefore enhances face flatness. Similarly, auxiliary-hole spacing governs how uniformly explosive energy is distributed over the face: spacing that is too large produces unbroken ribs and irregular blocks, while moderately reduced spacing increases coverage overlap between neighboring holes, promoting more homogeneous fragmentation and a smoother excavation profile.
The mapping from recognition outputs to blasting parameters was implemented as a semi-quantitative rule-based procedure. Structural-plane clustering first identified the dominant orientation and spatial concentration of discontinuities, while trace statistics quantified the intensity of discontinuity development through trace number, total length, and density. Curvature-based flatness then located the actual geometric response of the excavation surface. Therefore, the parameter-adjustment decision was not based on a single structural-plane class alone, but on the spatial consistency among structural-plane concentration, trace density, and high-curvature regions. When high-angle structural-plane clusters in the upper or middle–upper face overlapped with high-curvature areas, the affected zone was interpreted as a structure-controlled uneven-breakage zone. Under this condition, auxiliary-hole spacing was reduced and local auxiliary-hole coverage was increased to improve energy overlap between adjacent holes. In addition, auxiliary-hole inclination was adjusted according to the spatial development of the affected zone so that the explosive action could better cover the discontinuity-controlled region.
Different recognition indicators were linked to different parameter types. A middle–upper high-curvature concentration associated with undercutting indicated insufficient cavity formation and triggered the adjustment of cut-hole number and depth. In this case, the cut-hole depth was increased to satisfy the requirement that it should exceed the cycle advance by 10–25%, and additional cut holes were added to enlarge the initial relief space and redistribute blasting energy. Dense structural traces together with clustered high-angle planes indicated non-uniform discontinuity-controlled fragmentation and triggered the adjustment of auxiliary-hole spacing and inclination. Charge distribution was not determined solely by the clustering result; instead, the recognition results located the zones requiring energy redistribution, whereas the single-hole charge was calculated using the charge formula and then graded according to free-surface conditions. In this way, the structural-plane clustering results, together with trace density and curvature hot spots, determined where the auxiliary-hole network and charge distribution should be modified, while the charge magnitude was constrained by the empirical calculation and the original blasting-design limits. After adjustment, the curvature distribution was re-evaluated; when the high-curvature area decreased and the curvature values shifted predominantly toward the lower-curvature interval with reduced dispersion, the scheme was regarded as effective for the current rock mass condition.
Following the above mapping, the Huangtai Tunnel scheme was adjusted for the 16.5 m wide and 12 m high tunnel face. The upper and middle–upper concentration of structural-plane groups, the structural-trace statistics, and the high-curvature distribution jointly indicated that the initial cut cavity and auxiliary-hole energy coverage were insufficient in the affected region. Therefore, two additional pairs of cut holes were added outward from the center of the tunnel face, and the cut-hole spacing was adjusted to 0.8 m. According to the requirement that the cut-hole depth should exceed 10–25% of the cycle advance, and considering the 2.5 m cycle advance of this project, the cut-hole depth was adjusted to 2.8 m to meet the cavity-formation requirement for compound cutting. For the discontinuity-controlled uneven-breakage zone, the auxiliary-hole spacing was reduced to 0.8 m, and ten auxiliary holes were added in the 42–91 hole zone. Their inclinations were set to 70°, 75°, and 80° from the center outward, respectively, so that the explosive action could better cover the structure-controlled region and improve fragmentation uniformity.
Adjust the single-hole charge quantity
Q for the cut holes using Equation (11):
In the equation, V denotes the volume of the bench blast; q represents the unit charge consumption of explosives, measured in kilograms per cubic meter; n indicates the number of blast holes; and η signifies the blast hole utilization rate, typically taken as 0.8 to 0.95.
The Huangtai Tunnel hard-rock test section is classified as Grade III rock mass. The unit charge consumption was set to 1.65 kg/m
3, and the blasthole utilization rate was set to 0.92. Based on the above charge calculation, the single-hole charge of the cut holes was determined as 2.67 kg. Because auxiliary holes had more free surfaces than cut holes, their single-hole charge was lower than that of the cut holes. A graded auxiliary-hole charge distribution of 2.2–2.4 kg from the inner zone to the outer zone was therefore adopted to improve energy continuity in the structure-controlled region while avoiding excessive local overbreak. Blasting operations were conducted using optimized tunnel excavation design parameters and control procedures, resulting in well-formed excavation cavities. This is evidenced by a uniformly smooth and level tunnel face with no significant undulations, exhibiting only minor localized variations; the upper and middle sections of the excavation similarly demonstrate excellent flatness, with no apparent undercutting observed (see
Figure 18 for the optimized tunnel face flatness effect).
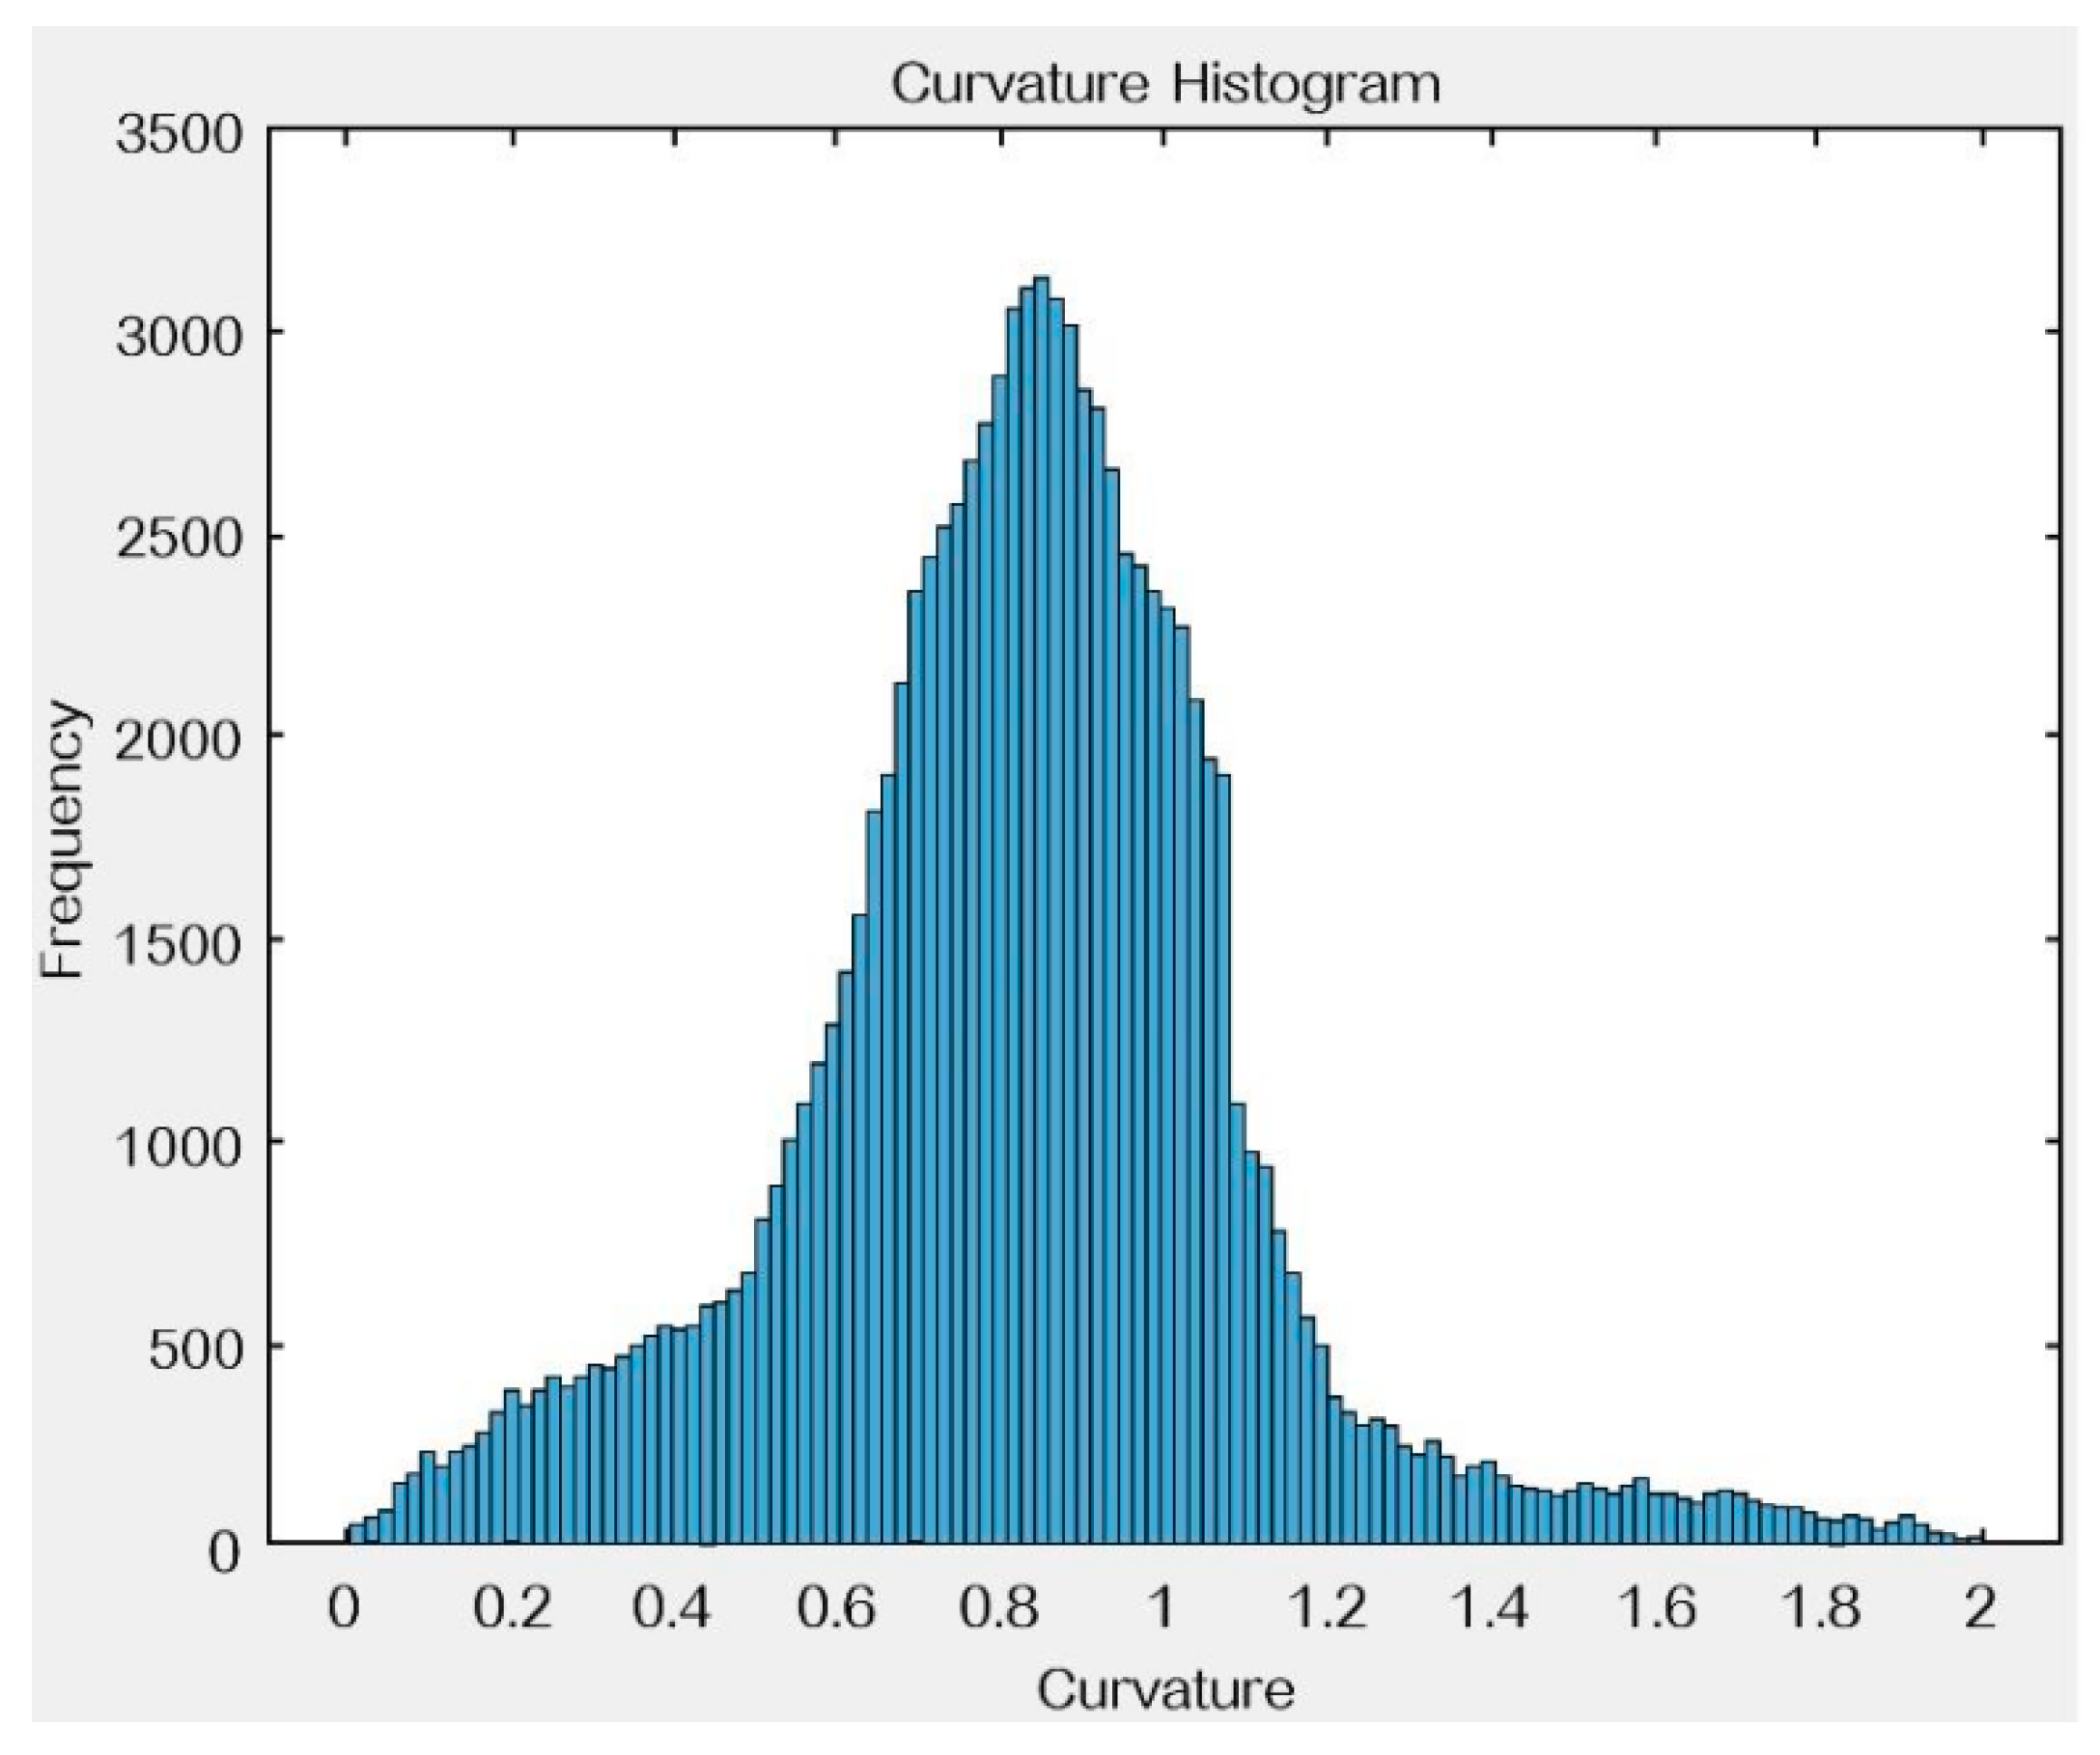
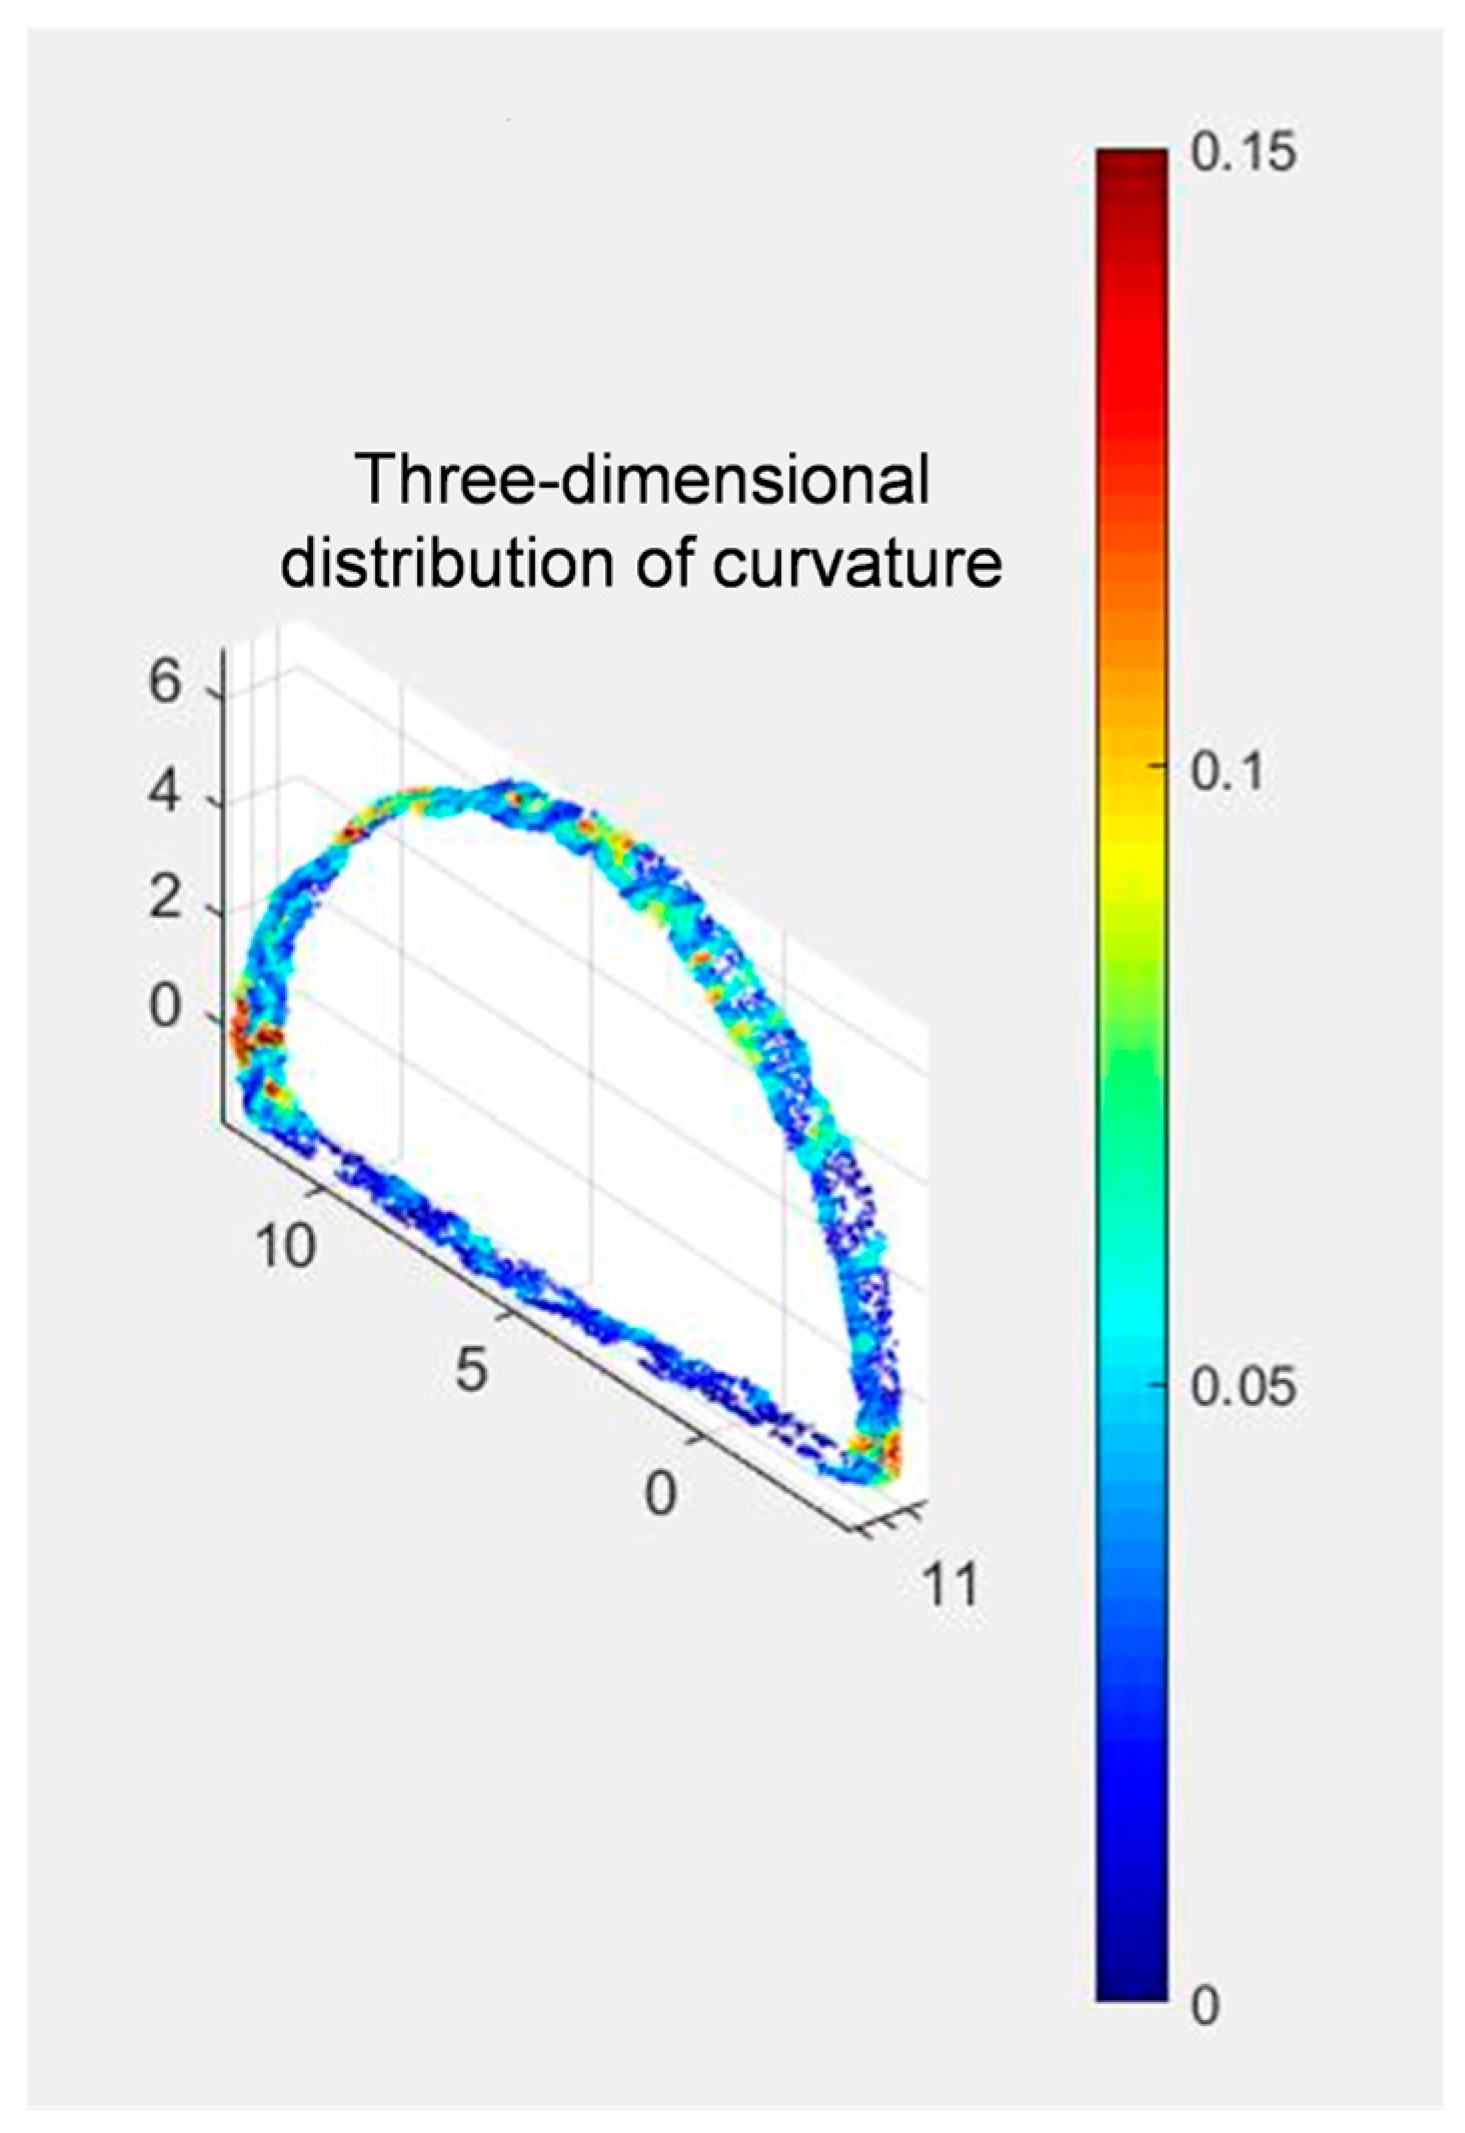
Curvature calculations were performed on the optimized 3D point cloud model of the tunnel face. Results indicate (curvature distribution map illustrated in
Figure 19, curvature statistics in
Figure 20) the overall profile of the face is relatively flat, with curvature values predominantly concentrated between 0 and 1, and only minor localized areas exhibiting slight undulations. Compared to the pre-optimization state, the average curvature value has decreased significantly, indicating a substantial improvement in the flatness of the tunnel face.
Compared with the baseline scheme, the optimized scheme reduced the proportion of locally abrupt regions on the reconstructed face. The high-curvature area ratio decreased from 0.592104 to 0.284753, corresponding to a relative reduction of 51.91%.
3.4. Optimization Results of the Donghongshan Tunnel
To further examine the applicability of the proposed framework under different engineering conditions, an additional case from the Donghongshan Tunnel was analyzed using the same geometry-based evaluation logic. The Donghongshan Tunnel is a deep hard-rock metal-mine roadway excavated under relatively complex blasting and confinement conditions. Under these conditions, the post-blast excavation surface exhibited evident geometric unevenness, including locally concentrated protrusions and depressions.
For this case, the curvature distribution showed distinguishable intervals that corresponded well with the observed surface morphology. Based on this relationship, the excavation surface was divided into four unevenness classes: K < 0.01 for flat regions, 0.01 ≤ K < 0.05 for slight-fluctuation regions, 0.05 ≤ K < 0.10 for pronounced unevenness, and K ≥ 0.10 for sharp-feature regions. Here, “sharp-feature region” denotes the highest-curvature interval in the present classification, rather than a category defined by engineering specifications. The same threshold set was applied to both the pre- and post-optimization models, so the reported area-ratio changes represent relative variations evaluated on a consistent internal scale.
Before optimization, the flat region accounted for only 8.4% of the excavated profile, whereas the sharp-feature region reached 20.3%. This distribution indicates that severe local irregularities occupied a considerable proportion of the excavation surface, suggesting insufficient contour control and non-uniform rock breakage in localized areas. The pre-optimization spatial distribution of excavation-surface irregularity and the corresponding curvature characteristics are presented in
Figure 21 and
Figure 22.
Based on the identified unevenness pattern, the blasting parameters were adjusted following the same closed-loop optimization logic as that used in the Huangtai Tunnel. The parameter adjustment was aimed at alleviating the concentration of severe local irregularities and improving the overall uniformity of the excavation surface while maintaining the same geometry-based evaluation framework.
After optimization, the curvature distribution shifted toward lower-irregularity intervals. The proportion of sharp-feature regions decreased to 7.9%, whereas the slight-fluctuation region increased to 57.7%. Although the proportion of the flat region decreased slightly, this change should not be interpreted in isolation. Rather than being converted directly into completely flat areas, part of the original high-irregularity surface appears to have transitioned into mild-fluctuation zones. This redistribution indicates that severe local protrusions and depressions were markedly suppressed, resulting in a more uniform and geometrically stable excavation profile. Consistently, the post-optimization curvature values became smaller and more concentrated overall, indicating a reduction in both the intensity and dispersion of local geometric irregularities. A similar post-optimization trend was observed in the Huangtai Tunnel, where the high-curvature area ratio also decreased substantially. Taken together, the results from the Huangtai Tunnel and the Donghongshan Tunnel demonstrate a consistent reduction in curvature-related geometric irregularity after optimization. The post-optimization irregularity distribution and the corresponding curvature-characteristic results are shown in
Figure 23 and
Figure 24.
The quantitative changes associated with optimization are summarized in
Table 5 and
Table 6. As shown in
Table 5, the post-optimization curvature statistics became lower overall, while
Table 6 indicates a marked reduction in the sharp-feature region and a shift toward lower-irregularity classes.
4. Discussion
The results indicate that the proposed framework can provide quantitative and geometrically interpretable information for tunnel face blasting evaluation under field conditions. At the image matching stage, the BBF-KD matching results were further refined by RANSAC verification. The reduction in mismatched correspondences suggests that the adopted matching strategy improved the geometric consistency of the retained feature pairs and provided a more reliable basis for subsequent 3D reconstruction. At the blasting evaluation stage, the reconstructed models enabled the quantitative extraction of structural planes, structural traces, and curvature-based surface irregularity, thereby transforming tunnel face assessment from qualitative observation into geometry-based analysis.
The optimization results from the Huangtai Tunnel and Donghongshan Tunnel further demonstrate the engineering usefulness of this geometry-based workflow. In the Huangtai Tunnel, the high-curvature area ratio decreased from 0.592104 to 0.284753 after optimization, corresponding to a relative reduction of 51.91%. In the Donghongshan Tunnel, the proportion of the sharp-feature region decreased from 20.3% to 7.9%, while the mean, median, and standard deviation of curvature also decreased overall. These consistent trends indicate that the identified geometric irregularities were measurable and responsive to blasting parameter adjustment. Therefore, the proposed framework does not merely reconstruct the excavation surface, but also provides a feedback basis for blasting evaluation and optimization in the examined tunnel cases.
The novelty of the proposed framework lies in its engineering-oriented use of reconstructed tunnel face geometry. Although SIFT, SfM, CMVS/PMVS, and Poisson reconstruction are established techniques, this study does not treat 3D reconstruction as the final output. Instead, the reconstructed geometry is converted into blasting-relevant indicators and further linked to parameter adjustment, forming a cycle-level feedback workflow for tunnel face blasting optimization.
From the perspective of field implementation, the proposed framework is more appropriately regarded as a cycle-level feedback tool rather than a strict real-time monitoring system. In practical drilling-and-blasting construction, the reconstructed tunnel face geometry and recognition results are mainly used to support the adjustment of subsequent blasting parameters. The workflow consists of field image acquisition and computer-based processing. Field acquisition is constrained by tunnel face hazard clearance, personnel and equipment removal, lighting arrangement, camera positioning, and image-overlap requirements. Computer-based processing includes image preprocessing, SIFT-BBF-RANSAC matching, SfM reconstruction, CMVS/PMVS dense reconstruction, Poisson surface reconstruction, and geometric indicator extraction. Among these modules, dense reconstruction and surface reconstruction are expected to dominate the computational cost, whereas preprocessing, curvature calculation, and rule-based parameter interpretation are relatively lightweight. However, a complete module-level processing-time benchmark was not included in the present study.
From an economic and operational perspective, the proposed framework requires additional investment mainly in image-acquisition and computing resources rather than specialized surveying equipment. The required field equipment includes a consumer-grade or industrial digital camera, a tripod, auxiliary lighting, calibration targets, and a computer workstation for image processing and 3D reconstruction. Compared with terrestrial laser scanning, the initial hardware investment is expected to be lower because no dedicated laser scanner or professional scanning platform is required. Compared with total-station or manual straightedge inspection, the equipment cost is higher than that of purely manual assessment, but the proposed workflow can provide whole-face dense geometric information and reusable digital records. Compared with learning-based methods, it does not require a large labeled training dataset, so the data-preparation cost is relatively limited. The training requirement is mainly associated with standardized image acquisition, workflow operation, and interpretation of geometric indicators. The time overhead consists of field acquisition, image-quality checking, and computer processing, and a detailed cost-time benchmark under different image volumes, mesh resolutions, and hardware configurations should be established in future applications.
The transferability and robustness of the framework remain influenced by geological and imaging conditions. Differences in lithology, weathering degree, surface reflectance, moisture, discontinuity expression, dust concentration, illumination, and rock-texture heterogeneity may affect feature matching, reconstruction stability, structural-trace completeness, and curvature-based interpretation. In highly fractured or water-rich rock masses, dense discontinuity networks, locally unstable blocks, seepage, water films, mud attachments, and wet-surface reflections may further reduce image-texture contrast and descriptor repeatability, making it more difficult to distinguish blasting-induced geometric irregularities from geology-controlled discontinuity features. Therefore, when the framework is applied to new sites, image-acquisition settings, preprocessing parameters, and robust-matching thresholds should be treated as site-dependent engineering parameters, and the extracted indices should be interpreted together with geological information. Further validation under severe dust, poor lighting, strongly heterogeneous rock surfaces, highly fractured rock masses, and water-rich conditions is still required.
5. Limitations and Future Work
Although the proposed framework demonstrated stable performance in the Huangtai Tunnel and Donghongshan Tunnel, several limitations still remain. First, the current validation is based on two engineering cases under specific excavation and imaging conditions. While the results from both tunnels indicate that the framework can effectively identify geometric irregularities and support blasting parameter adjustment, broader verification under more diverse geological settings, surrounding-rock grades, excavation methods, and blasting schemes is still needed to further assess its general applicability.
Second, the image acquisition and reconstruction quality may still be influenced by practical field factors such as dust, uneven illumination, equipment positioning, local occlusion, and surface reflectance variations. Although the adopted preprocessing and multi-view reconstruction workflow improved data usability in the tunnel environment, these factors may still affect feature matching stability, point-cloud completeness, and the accuracy of local geometric characterization in more challenging conditions. These influences are expected to be more pronounced in highly fractured or water-rich faces, because dense joints, unstable blocks, wet surfaces, seepage paths, and slurry-covered zones may cause local occlusion, specular reflection, reduced descriptor repeatability, and incomplete reconstruction in localized areas. In addition, the current field cases did not include independent stress tests under severe dust concentration, extremely poor lighting, or strongly heterogeneous rock-surface texture conditions. These conditions may further reduce feature detectability, matching reliability, and point-cloud completeness.
Third, the current optimization analysis mainly focuses on geometric indicators extracted from the reconstructed tunnel surface, particularly the spatial distribution of unevenness levels before and after parameter adjustment. These indicators are effective for characterizing excavation-surface morphology and evaluating optimization outcomes, but they do not yet establish a more comprehensive coupling with other blasting-related responses. As a result, the present framework provides a geometry-oriented evaluation and optimization pathway, while a broader multi-indicator assessment system remains to be developed.
Fourth, the current optimization strategy is implemented through engineering-informed rule-based interpretation of geometric indicators. Although this closed-loop strategy proved effective in the presented cases, a more standardized rule set and larger-sample statistical support would further improve the reproducibility and transferability of the optimization procedure across different projects.
Fifth, the present study did not provide a complete economic and time-overhead benchmark for the full workflow. Although the framework relies mainly on consumer-grade imaging equipment and common computing resources, the costs associated with equipment preparation, personnel training, field acquisition, and computer processing were not quantitatively compared with manual inspection, total-station surveying, or TLS-based assessment. Therefore, future work should establish a complete cost-time evaluation under different image volumes, mesh resolutions, hardware configurations, and field operation modes.
Future work will therefore focus on four aspects. First, targeted validation should be expanded to additional tunnel and underground excavation cases, with particular attention to highly fractured and water-rich rock masses; under these conditions, the robustness of image acquisition, reconstruction completeness, structural-trace extraction, and curvature-based evaluation should be examined through controlled and repeated field cycles. Second, the robustness of the reconstruction and recognition workflow under adverse field conditions should be improved through optimized acquisition design, image quality control, and more stable geometric processing strategies. Controlled validation under different dust levels, illumination conditions, and rock-surface texture heterogeneity should also be conducted to quantify the robustness boundary of the proposed workflow in challenging environments. Third, the current geometry-based evaluation should be integrated with additional engineering indicators and data-driven decision rules, so that blasting-quality assessment and parameter optimization can evolve from case-based closed-loop adjustment toward a more general and intelligent support framework for underground excavation. Fourth, a module-level processing-time benchmark should be established, and computational efficiency should be improved through image redundancy reduction, adaptive image selection, parallel reconstruction, GPU acceleration, and lightweight mesh processing.
6. Conclusions
This study proposed a closed-loop framework for tunnel face blasting evaluation and optimization by integrating multi-view 3D reconstruction, geometric indicator extraction, and blasting parameter adjustment. The main conclusions are as follows:
First, a practical tunnel-oriented workflow was established for image acquisition, preprocessing, feature matching, and 3D reconstruction under underground field conditions. The reconstructed tunnel face models provided a reliable basis for non-contact geometric characterization of blasting results.
Second, based on the reconstructed models, structural planes, structural traces, and surface unevenness could be quantitatively identified, enabling tunnel face blasting evaluation to shift from qualitative observation to geometry-based analysis.
Third, in both the Huangtai Tunnel and Donghongshan Tunnel, the extracted geometric indicators supported blasting parameter adjustment and post-optimization re-evaluation, and the optimization results showed clear improvement in excavation-surface quality. These results demonstrate that the proposed framework can provide effective geometric feedback for blasting evaluation and optimization in underground excavation.
Overall, the study demonstrates that reconstructed tunnel face geometry can be effectively translated into quantitative evaluation indices and further into actionable support for blasting parameter adjustment. The proposed framework therefore provides a practical geometry-based approach for tunnel face blasting evaluation and optimization in underground excavation.



 and
and