Article

Marine Geographic Information Systems, Spatial Analysis Tools in the Management Process of Spanish Marine Protected Areas

1
Instituto Español de Oceanografía, Consejo Superior de Investigaciones Científicas (IEO-CSIC), Corazón de María 8, 28002 Madrid, Spain
2
Departamento de Geografía, Universidad de Murcia, Campus de la Merced, 30001 Murcia, Spain
*
Author to whom correspondence should be addressed.
ISPRS Int. J. Geo-Inf. 2026, 15(6), 228; https://doi.org/10.3390/ijgi15060228
Submission received: 26 January 2026 / Revised: 12 May 2026 / Accepted: 18 May 2026 / Published: 22 May 2026

Abstract

Spain’s extensive marine jurisdiction—comprising a continental shelf of approximately 100,000 km2 and an Exclusive Economic Zone approaching one million km2—requires robust geospatial frameworks to support ecosystem assessment and marine policy implementation. This study presents GIS-based methodologies developed by the Spanish Oceanographic Institute (IEO-CSIC) within national initiatives such as LIFE IP INTEMARES project and the implementation of Marine Strategy Framework Directive (European Directive 2008/56/EC). The geospatial workflows developed for these initiatives integrates heterogeneous spatial datasets—such as multibeam bathymetry, acoustic backscatter, Remote Operated Vehicle (ROV) and towed-camera transects, sediment samples, oceanographic profiles, and species-habitat occurrence records—into a unified spatial analysis environment. Applied methods include digital terrain modeling, derivation of geomorphometric indices (e.g., slope, rugosity, curvature), image classification, and spatial statistics to quantify habitat extent, condition, and anthropogenic pressures. An integrated spatial analysis framework combining environmental and anthropogenic data is used to support zoning and management decisions within Marine Protected Areas (MPAs). Additionally, the deployment of WebGIS platforms facilitates data dissemination, iterative review, and stakeholder engagement, thereby enhancing transparency and accessibility. The resulting high-resolution maps, harmonized datasets, and computed spatial indicators—aligned with Marine Strategy Framework Directive (MSFD) descriptors such as habitat distribution (D1C4–C5) and seafloor integrity (D6C2–C3)—demonstrate how GIScience methods provide reproducible, decision-ready information to support the monitoring and management of Spain’s diverse marine ecosystems.

1. Introduction

The Spanish coastline [1] extends to approximately 7900 km [2], including both continental and insular territories. This extensive coastal perimeter encompasses the Iberian Peninsula, the Balearic and Canary Islands, the autonomous cities of Ceuta and Melilla, and other minor island territories. Geographically, the Spanish shoreline is divided into three major marine regions: the North-East Atlantic, Macaronesia, and the Western Mediterranean, each characterized by distinct ecological and geomorphological features.
The Spanish continental shelf, defined as the submerged extension of the landmass up to the continental slope, spans an estimated 100,000 square kilometers. This area is of considerable scientific, ecological, and economic importance [3] due to its high productivity, complex seabed morphology, and potential for the sustainable exploitation of resources such as hydrocarbons, minerals, and fisheries [4]. The Atlantic shelf, particularly along the Galician and Andalusian coasts, is shaped by strong upwelling systems that enhance nutrient availability and support rich fisheries. In contrast, the Mediterranean shelf is narrower and characterized by steep gradients, oligotrophic conditions, and fragmented benthic habitats such as seagrass meadows and coralligenous outcrops [5].
Moreover, the continental shelf, Spain’s Exclusive Economic Zone (EEZ) extends up to 200 nautical miles (approximately 370 km) from the baseline, covering nearly one million square kilometers. Within this zone, Spain exercises sovereign rights over the exploration, exploitation, and conservation of natural resources in the seabed and subsoil [6], while navigation and overflight remain governed by international law [7]. The strategic management of the EEZ [8] is fundamental for sustaining blue economy sectors—including fisheries, marine transport, offshore energy, and mineral extraction—while simultaneously ensuring environmental protection and ecosystem resilience [9].
Growing competition for marine space, coupled with pressures from overfishing, climate change, and coastal urbanization [10], has accelerated the adoption of Maritime Spatial Planning (MSP) as a pivotal governance instrument. In accordance with the European Directive 2014/89/EU [11], MSP provides a cross-sectoral and ecosystem-based framework that organizes human activities in marine and coastal environments to achieve ecological, economic, and social objectives [12]. It promotes integrated decision-making [13], reduces sectoral conflicts, and enhances cross-border cooperation, particularly relevant for Spain’s Atlantic and Mediterranean basins, which share ecological processes and socioeconomic linkages with neighboring states [14,15]. Importantly, MSP supports sustainable development by balancing resource use with environmental conservation, fostering resilience to climate change [16], and optimizing spatial efficiency [17].
In Spain, MSP implementation was formalized through Royal Decree 150/2023 [18], establishing maritime spatial plans for the five marine subregions (North Atlantic, South Atlantic, Strait and Alboran, Levantine–Balearic, and Canary Islands). Previous studies [19,20] emphasize that the effective realization of these plans depends on robust Spatial Data Infrastructures (SDIs) and the systematic use of Geographic Information Systems (GIS) to integrate diverse datasets across environmental, economic, and regulatory dimensions.
This study investigates how integrating heterogeneous marine datasets within a unified GIS/WebGIS framework improves the identification of priority habitats, use-conflict areas, and the generation of indicators required for MSFD and MPA management. Methodologically, it advances reproducible spatial analysis workflows—combining terrain modeling, image classification, pressure mapping, and uncertainty assessment—to deliver measurable [21], decision-ready outputs that support evidence-based marine planning. It is precisely within this context that GIS-based marine spatial analysis assumes a decisive role [22]. GIS enables the synthesis of heterogeneous data—ranging from bathymetric models and seabed morphology to biodiversity indices, anthropogenic uses, and jurisdictional boundaries—into coherent spatial frameworks. The multidisciplinary nature of marine management [23] demands the integration of oceanography, ecology, socioeconomics, and governance, a process only feasible through advanced spatial modeling and geostatistical tools [24,25].
For instance, in the Western Mediterranean, spatial modeling has been applied to delineate areas of ecological connectivity and larval dispersal, supporting the design of coherent networks of MPAs [26]. Recent GIS-based analyses in the Catalonian Sea identified coastal zones where human uses (tourism, fisheries, transport) overlap with high biodiversity values, highlighting critical “use-conflict hotspots” that require spatial prioritization [27]. Similarly, in the Atlantic region, the Gulf of Cádiz serves as a pilot area under the MSP4BIO project, where GIS tools have been used to assess cumulative pressures, map marine habitats, and evaluate socio-ecological interactions to inform spatial zoning decisions [28]. Despite the growing availability of marine geospatial data and the increasing use of GIS-based tools in MSP and MPA designation, significant methodological challenges remain. These include persistent issues of data interoperability [29], heterogeneous metadata standards, limited harmonization across institutional repositories, and the difficulty of integrating ecological and pressure datasets into coherent, decision-ready spatial products. Moreover, existing MSP/MPA GIS studies often rely on centralized governance models or workflows that are not easily transferable to complex socio-ecological contexts such as Spain, where multilevel governance and fragmented data infrastructures require more robust and interoperable geospatial solutions [21]. To address these gaps, this study adopts a GIScience-driven perspective to develop an integrated marine geospatial workflow aligned with FAIR, CARE, and TRUST principles [30,31,32]. The aim is to enhance the analytical robustness, transparency, and reproducibility of marine spatial data handling while improving the decision-support capacity of GIS-based tools for conservation planning [33].
In this context, it is important to clarify the spatial scope and novelty of the study areas addressed in this work. The marine areas analyzed correspond to locations where the Spanish Institute of Oceanography (IEO-CSIC) has carried out specific actions aimed at improving the knowledge of marine habitats and species within the national and European conservation frameworks, specifically as part of the LIFE IP INTEMARES project and Natura 2000 network.
These areas comprise previously designated Sites of Community Importance (SCIs) proposed as Special Areas of Conservation (SACs) together with three additional SCI proposals incorporated and referenced in this study to spatially contextualize the analysis.
The originality of this work therefore does not lie solely in the inclusion of previously unpublished areas, but rather in the integrated geospatial analysis and harmonization of heterogeneous datasets, together with the application of reproducible marine GIS workflows across all study areas.
At the national level, the IEO-CSIC plays a central role in the acquisition, management, and dissemination of marine geospatial data [34]. The institution has developed multiple WebGIS platforms and marine geographic viewers [35] that provide access to large-scale datasets, including bathymetry, sediment types, marine boundaries, fishing grounds or artificial reefs [36]. These infrastructures contribute directly to international programs [37] such as the MSFD [38,39], EMODnet Bathymetry [40], and Copernicus Marine Service, as well as national initiatives such as the Spanish Seagrass Atlas [41] and LIFE IP INTEMARES project [42].
The integration of GIS into marine management thus extends beyond data visualization: it supports ecosystem-based planning, enables temporal and cumulative impact assessments, and facilitates adaptive management by continuously updating spatial information in response to environmental change. Across both the Mediterranean and Atlantic realms, the strategic deployment of spatial tools provides a scientific foundation for reconciling economic development with the conservation of marine biodiversity—a key objective of the European Green Deal [43] and the Biodiversity Strategy 2030 [44].

2. Materials and Methods

2.1. Study Area

The case study is part of the LIFE INTEMARES project [45], one of the most ambitious marine conservation initiatives undertaken in Spain. Running from January 2017 to December 2024, it was coordinated by the Biodiversity Foundation [42] under the Ministry for Ecological Transition and the Demographic Challenge (MITECO).
The project’s activities were guided by a detailed strategic plan, drawn up in accordance with European Union directives [46] and approved at the Sectoral Conference on the Environment, setting out the specific objectives [47], priorities and conservation actions necessary [47] for the effective management of the Natura 2000 Network.
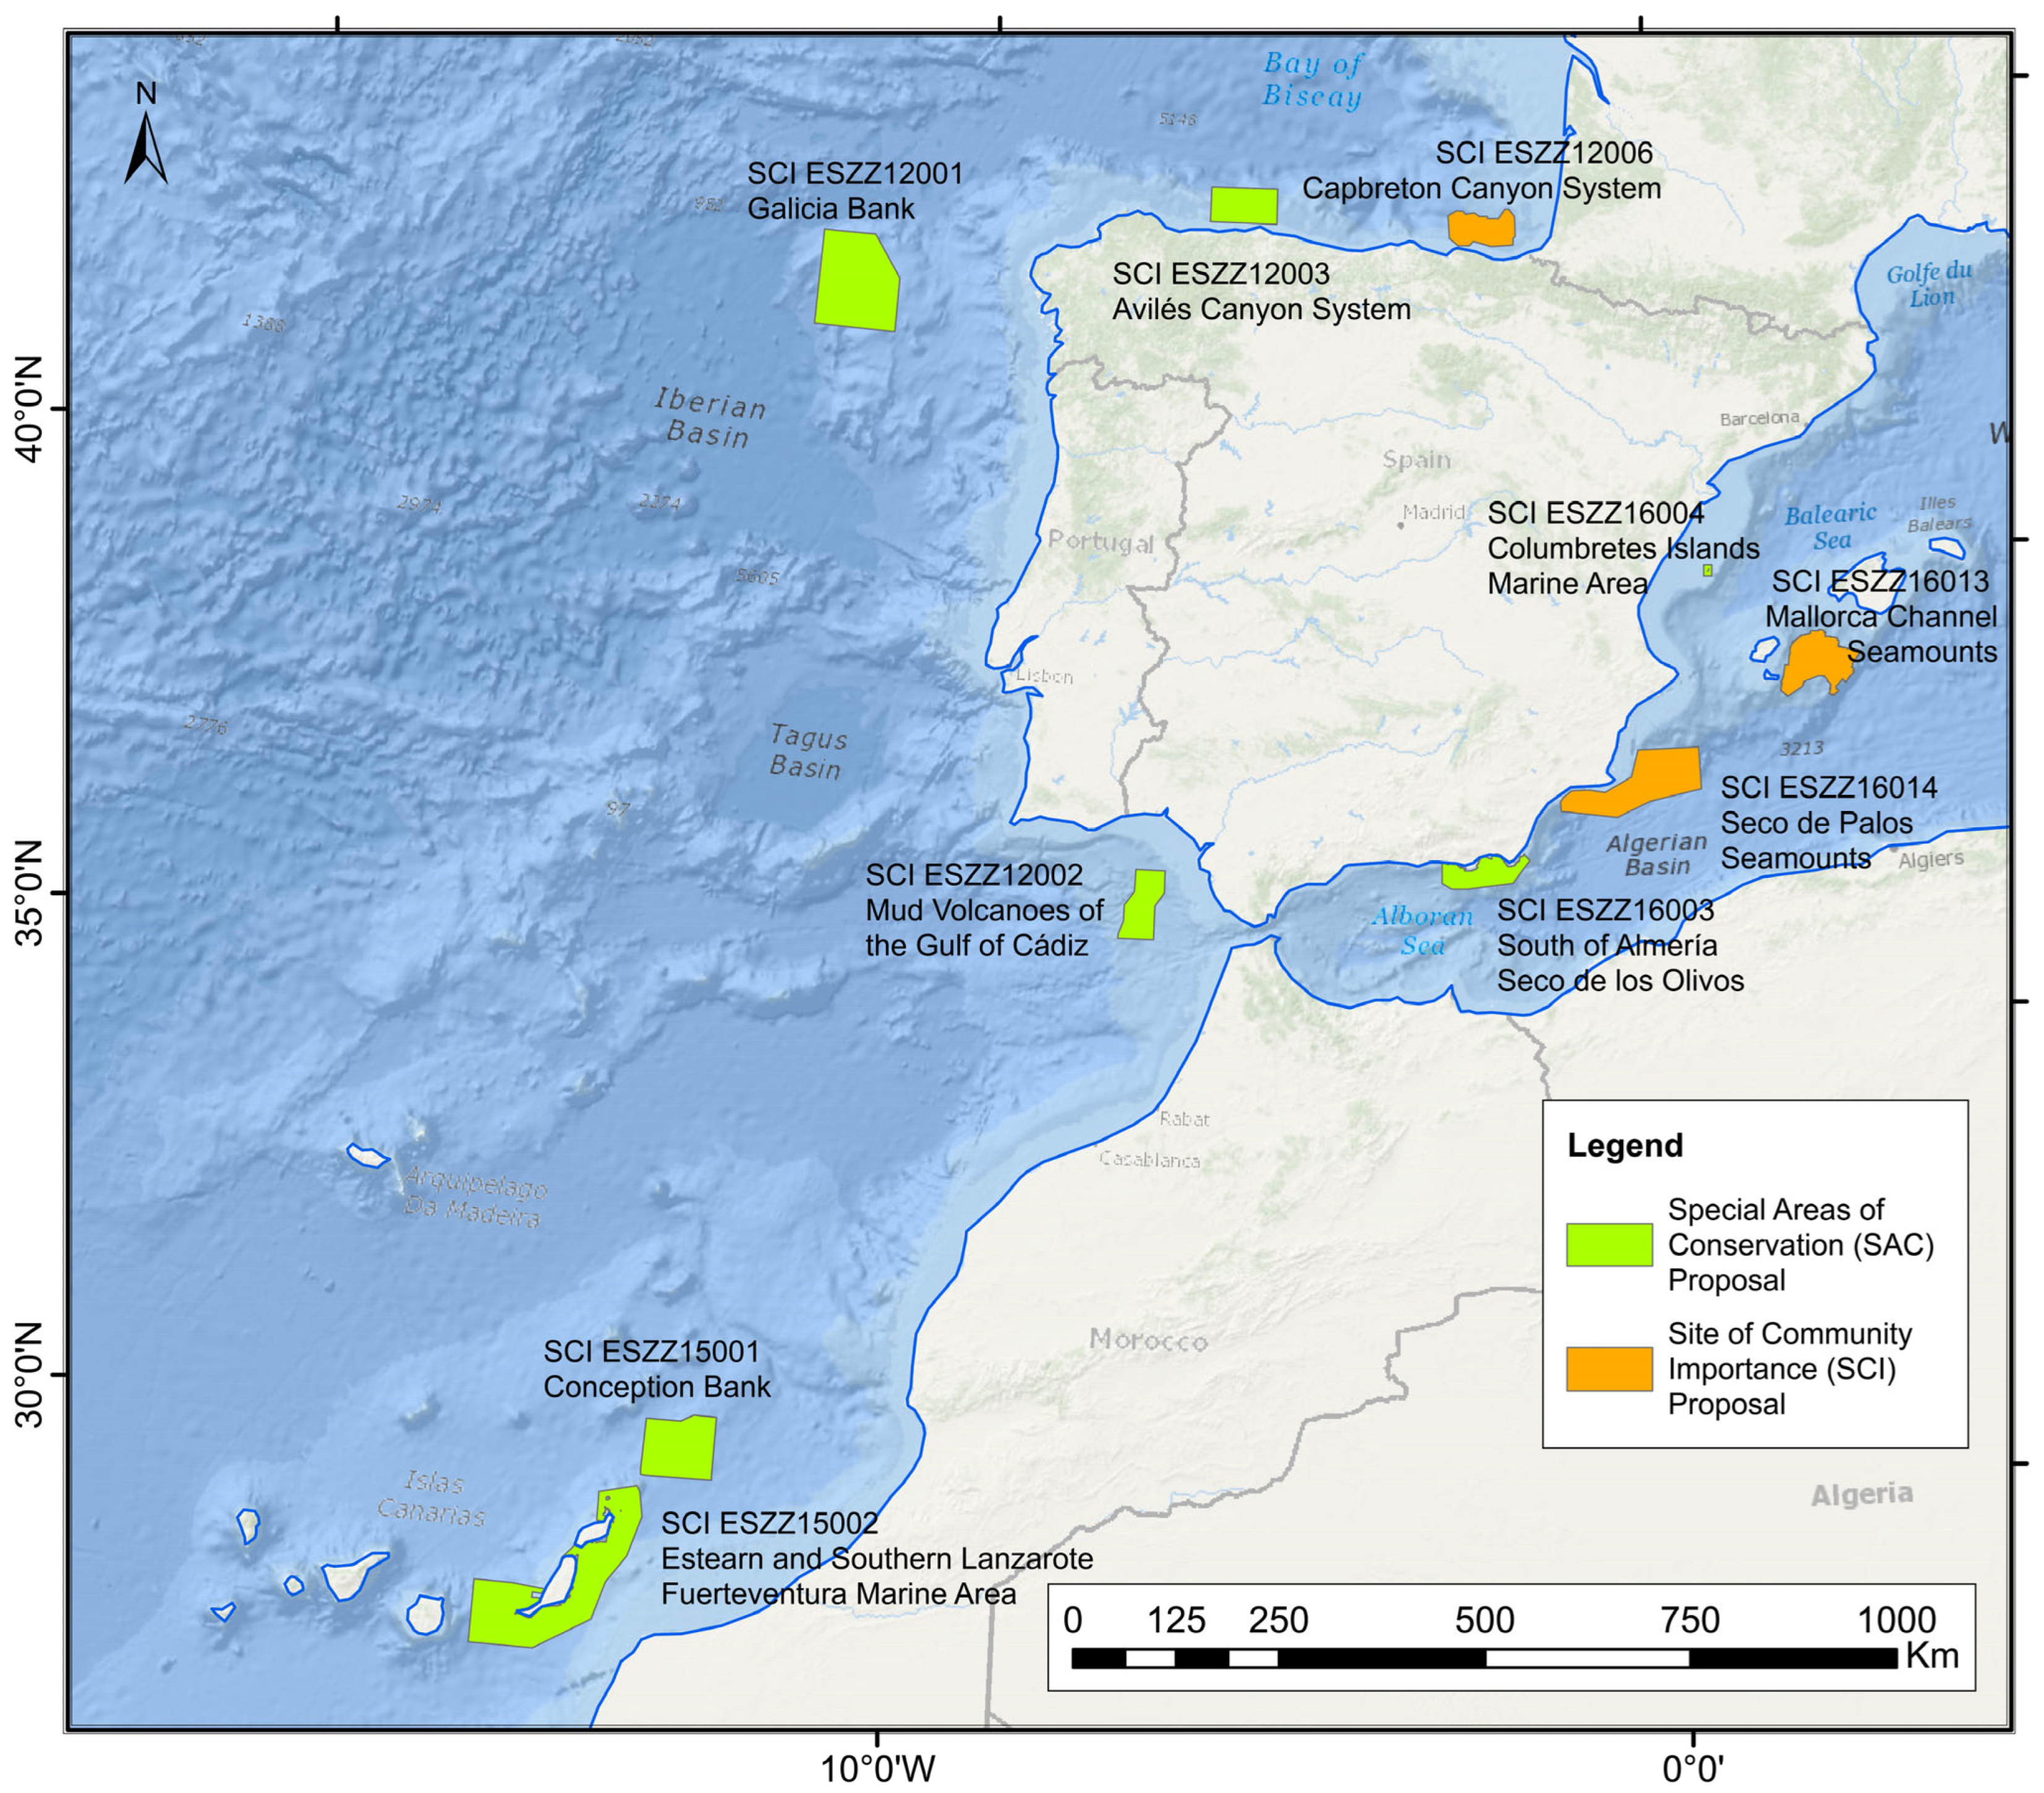
The central objective of LIFE INTEMARES was to enhance scientific knowledge to support the development of management plans [48] for MPAs [49], particularly those designated as SCIs. These sites are identified under the EU Habitats Directive (92/43/EEC) [46] and constitute a preliminary designation stage; they only acquire the legal status of SACs once appropriate management plans and conservation measures have been formally adopted by the competent authorities, ensuring long term protection of marine biodiversity [50]. Within this context, the project has facilitated extensive scientific research and stakeholder engagement, leading to the proposal of several SCIs for SAC designation. As illustrated in Figure 1, the proposed sites include the following:
-
SCI ESZZ12003: Avilés Canyon System.
-
SCI ESZZ12001: Galician Bank.
-
SCI ESZZ12002: Mud Volcanoes of the Gulf of Cádiz.
-
SCI ESZZ16003: South of Almería—Seco de los Olivos.
-
SCI ESZZ16004: Columbretes Islands Marine Area.
-
SCI ESZZ15001: Conception Bank.
-
SCI ESZZ15002: Eastern and Southern Lanzarote-Fuerteventura Marine Area.
These areas were selected based on rigorous scientific assessments conducted by the IEO-CSIC, which played a pivotal role in collecting and analyzing ecological data [51]. For instance, recent surveys have enabled the mapping of benthic habitats and identification of endemic species like Laminaria rodriguezii, contributing to the ecological justification [52] for SAC designation. The integration of scientific research, stakeholder participation, and policy coordination exemplifies the LIFE INTEMARES model. It aligns with broader EU goals under the EU Biodiversity Strategy for 2030 [44], which calls for 30% of marine areas [53] to be protected and well-managed by the end of the decade. The Natura 2000 marine network, supported by the LIFE Program, currently covers over 9% of EU marine territory and is the largest coordinated network of protected areas globally.
Moreover, as a direct outcome of the research and assessments conducted under the INTEMARES project, three additional marine areas have been proposed for designation as SCIs, thereby advancing the completion of the marine component of the Natura 2000 Network. The study areas associated with these new proposals (Figure 1), where targeted investigations were undertaken to strengthen the scientific basis for their SCI designation, are:
-
SCI ESZZ16013 Mallorca Channel Seamounts.
-
SCI ESZZ16014 Seamounts and pockmark field of the Seco de Palos.
-
SCI ESZZ12006 Capbreton Canyon System.

2.2. Materials and Data Obtained

2.2.1. Sampling and Data Collection Aboard Oceanographic Vessels

Oceanographic research in Spain relies heavily on the extensive use of research vessels equipped with state-of-the-art technology that enables the collection of multidisciplinary datasets [54], essential for the monitoring, conservation, and spatial management of marine ecosystems. Among these, the R/V Ramón Margalef and the R/V Ángeles Alvariño, operated by the IEO-CSIC, stand out as true floating laboratories. These vessels are designed for multidisciplinary surveys integrating geological, biological, chemical, and physical oceanography [55].
A significant portion of the scientific work associated with sample collection, in situ analysis, and data interpretation is conducted directly on board these platforms [56]. Geographic Information Systems play a crucial role in these operations [57] by allowing the precise geolocation of all sampling stations, tracking vessel trajectories, and synchronizing environmental datasets in real time.
Each survey typically integrates an array of advanced acquisition systems and oceanographic instruments [58,59], including:
  • High-resolution multibeam echosounders, used for detailed bathymetric mapping and seabed morphology analysis;
  • ROVs [60], capable of reaching great depths to capture high-definition imagery and collect targeted biological and sediment samples;
  • CTD profilers (Conductivity–Temperature–Depth), used to obtain vertical profiles of the water column and collect environmental samples (temperature, salinity, dissolved oxygen, chlorophyll, nutrients);
  • Sediment corers and box corers, which recover surface and subsurface sediment cores for geological, geochemical, and biological analyses;
  • Bongo nets, otter trawls, and epibenthic sleds for the collection of planktonic and benthic organisms, contributing to biodiversity and trophic studies.
The integration of these datasets (Table 1) enables the characterization of biological communities [61], sedimentary dynamics, and environmental gradients, providing the empirical basis for marine spatial planning, ecosystem monitoring, and conservation assessments.

2.2.2. Integration and Data Management

Information obtained through these sampling operations is complemented by existing datasets from previous scientific surveys, IEO time series [62,63,64,65], and international marine databases such as EMODnet [66], Copernicus Marine Environment Monitoring Service (CMEMS), and the MSFD data repositories. These collective datasets establish robust scientific baselines for understanding spatial and temporal variability in marine ecosystems [67] and were used only for contextualization to support interpretation and data harmonization, not for direct calibration or numerical validation of in situ measurements.
All data collected during the surveys are processed and stored within the IEO’s Marine Spatial Data Infrastructure (IDEO) [36] and made accessible through WebGIS platforms that support interactive visualization, download, and interoperability [68]. These digital tools constitute an essential instrument for sustainable marine management, enabling users to:
  • Analyze ecosystem evolution.
  • Define spatial restrictions for extractive or industrial activities.
  • Evaluate the effectiveness of protection measures through continuous monitoring of environmental, geological, and biological variables.
The integration of these multidisciplinary datasets within a geospatial framework allows for real-time spatial analysis, supports adaptive management strategies [69,70], and ensures that research outcomes are directly applicable to MSP and MPA governance.

2.3. Methodology

The spatial analyses presented in this study rely on GIS-based spatial prioritization methodologies directly applied in this work. These methodologies include: (i) GIS-based gap analysis to generate spatially continuous thematic layers, ensuring full topological consistency of polygon datasets (i.e., absence of gaps and overlaps and coincident shared boundaries); and (ii) multi-layer spatial overlays combining ecological sensitivity variables (such as habitat distribution and benthic community typology) with anthropogenic pressure layers (e.g., bottom-trawling intensity) to delineate zones of varying sensitivity and identify areas where benthic habitats may be most vulnerable to long-term disturbance. These analyses were implemented using standardized and reproducible GIS workflows to support the spatial assessment and characterization of MPAs. A consistent methodology was applied across all study areas, encompassing the analysis of geomorphological and sedimentary features, benthic community structure, and fishing pressure exerted on these communities [71].
The enhancement of geological knowledge within the study areas was supported by geophysical datasets obtained through multibeam bathymetry, acoustic backscatter, and seismic profiling [72] conducted during multiple oceanographic surveys. These datasets —primarily in GeoTIFF and XYZ formats—were processed within CARIS HIPS and SIPS 11.3 (CARIS, Fredericton, NB, Canada) and ArcGIS 10.8 (Esri, Redlands, CA, USA) software to produce a morpho-sedimentary characterization based on the interpretation of key environmental variables [73].
The Benthic Terrain Modeler toolbox and the ArcGIS Spatial Analyst extension were used to generate terrain-derived layers. Bathymetric grids were processed to compute hillshade, slope, curvature, aspect, and Bathymetric Position Index (BPI). For BPI calculations, both fine-scale and broad-scale parameters were applied to differentiate local versus regional seafloor structures. Slope classification followed commonly accepted thresholds (0–5°, 5–15°, >15°) to distinguish flat areas, moderate slopes, and steep gradients, while curvature values were reclassified into concave, convex, and planar surfaces based on their statistical distribution. These classes are widely adopted in geomorphological and benthic habitat mapping studies, as they provide a consistent framework for interpreting terrain variability and its ecological implications [74,75].
In parallel, the spatial distribution of sediments and seabed types was mapped using classified backscatter mosaics and ground-truth data, providing the geomorphological and sedimentary basis [76] for each study area. Geological interpretation enabled the differentiation of rocky and sedimentary domains, supporting the delineation of sedimentary shelf and slope habitats, rocky-bottom habitats, and submarine canyon systems. Concurrently, benthic habitat identification and mapping [77,78] continue to be refined through the integration of ROV imagery, grab samples, and acoustic proxies.
Once habitat mapping for each SCI is completed, an inventory is compiled summarizing the characteristics of the biotopes—defined by bathymetric range and substrate types— together with their associated biotic components, represented by the most characteristic species within each community (Table 2). These habitat maps also enable quantification of representativeness and spatial extent for each habitat type [45], in addition to assessing attributes such as the sensitivity of key habitats to physical disturbances of the seabed. This information is essential for informing management decisions and developing protection measures in ecologically vulnerable areas [79]. The resulting cartographic products enhance the interpretation of environmental data and provide significant technical and scientific value, constituting an important tool for marine research.
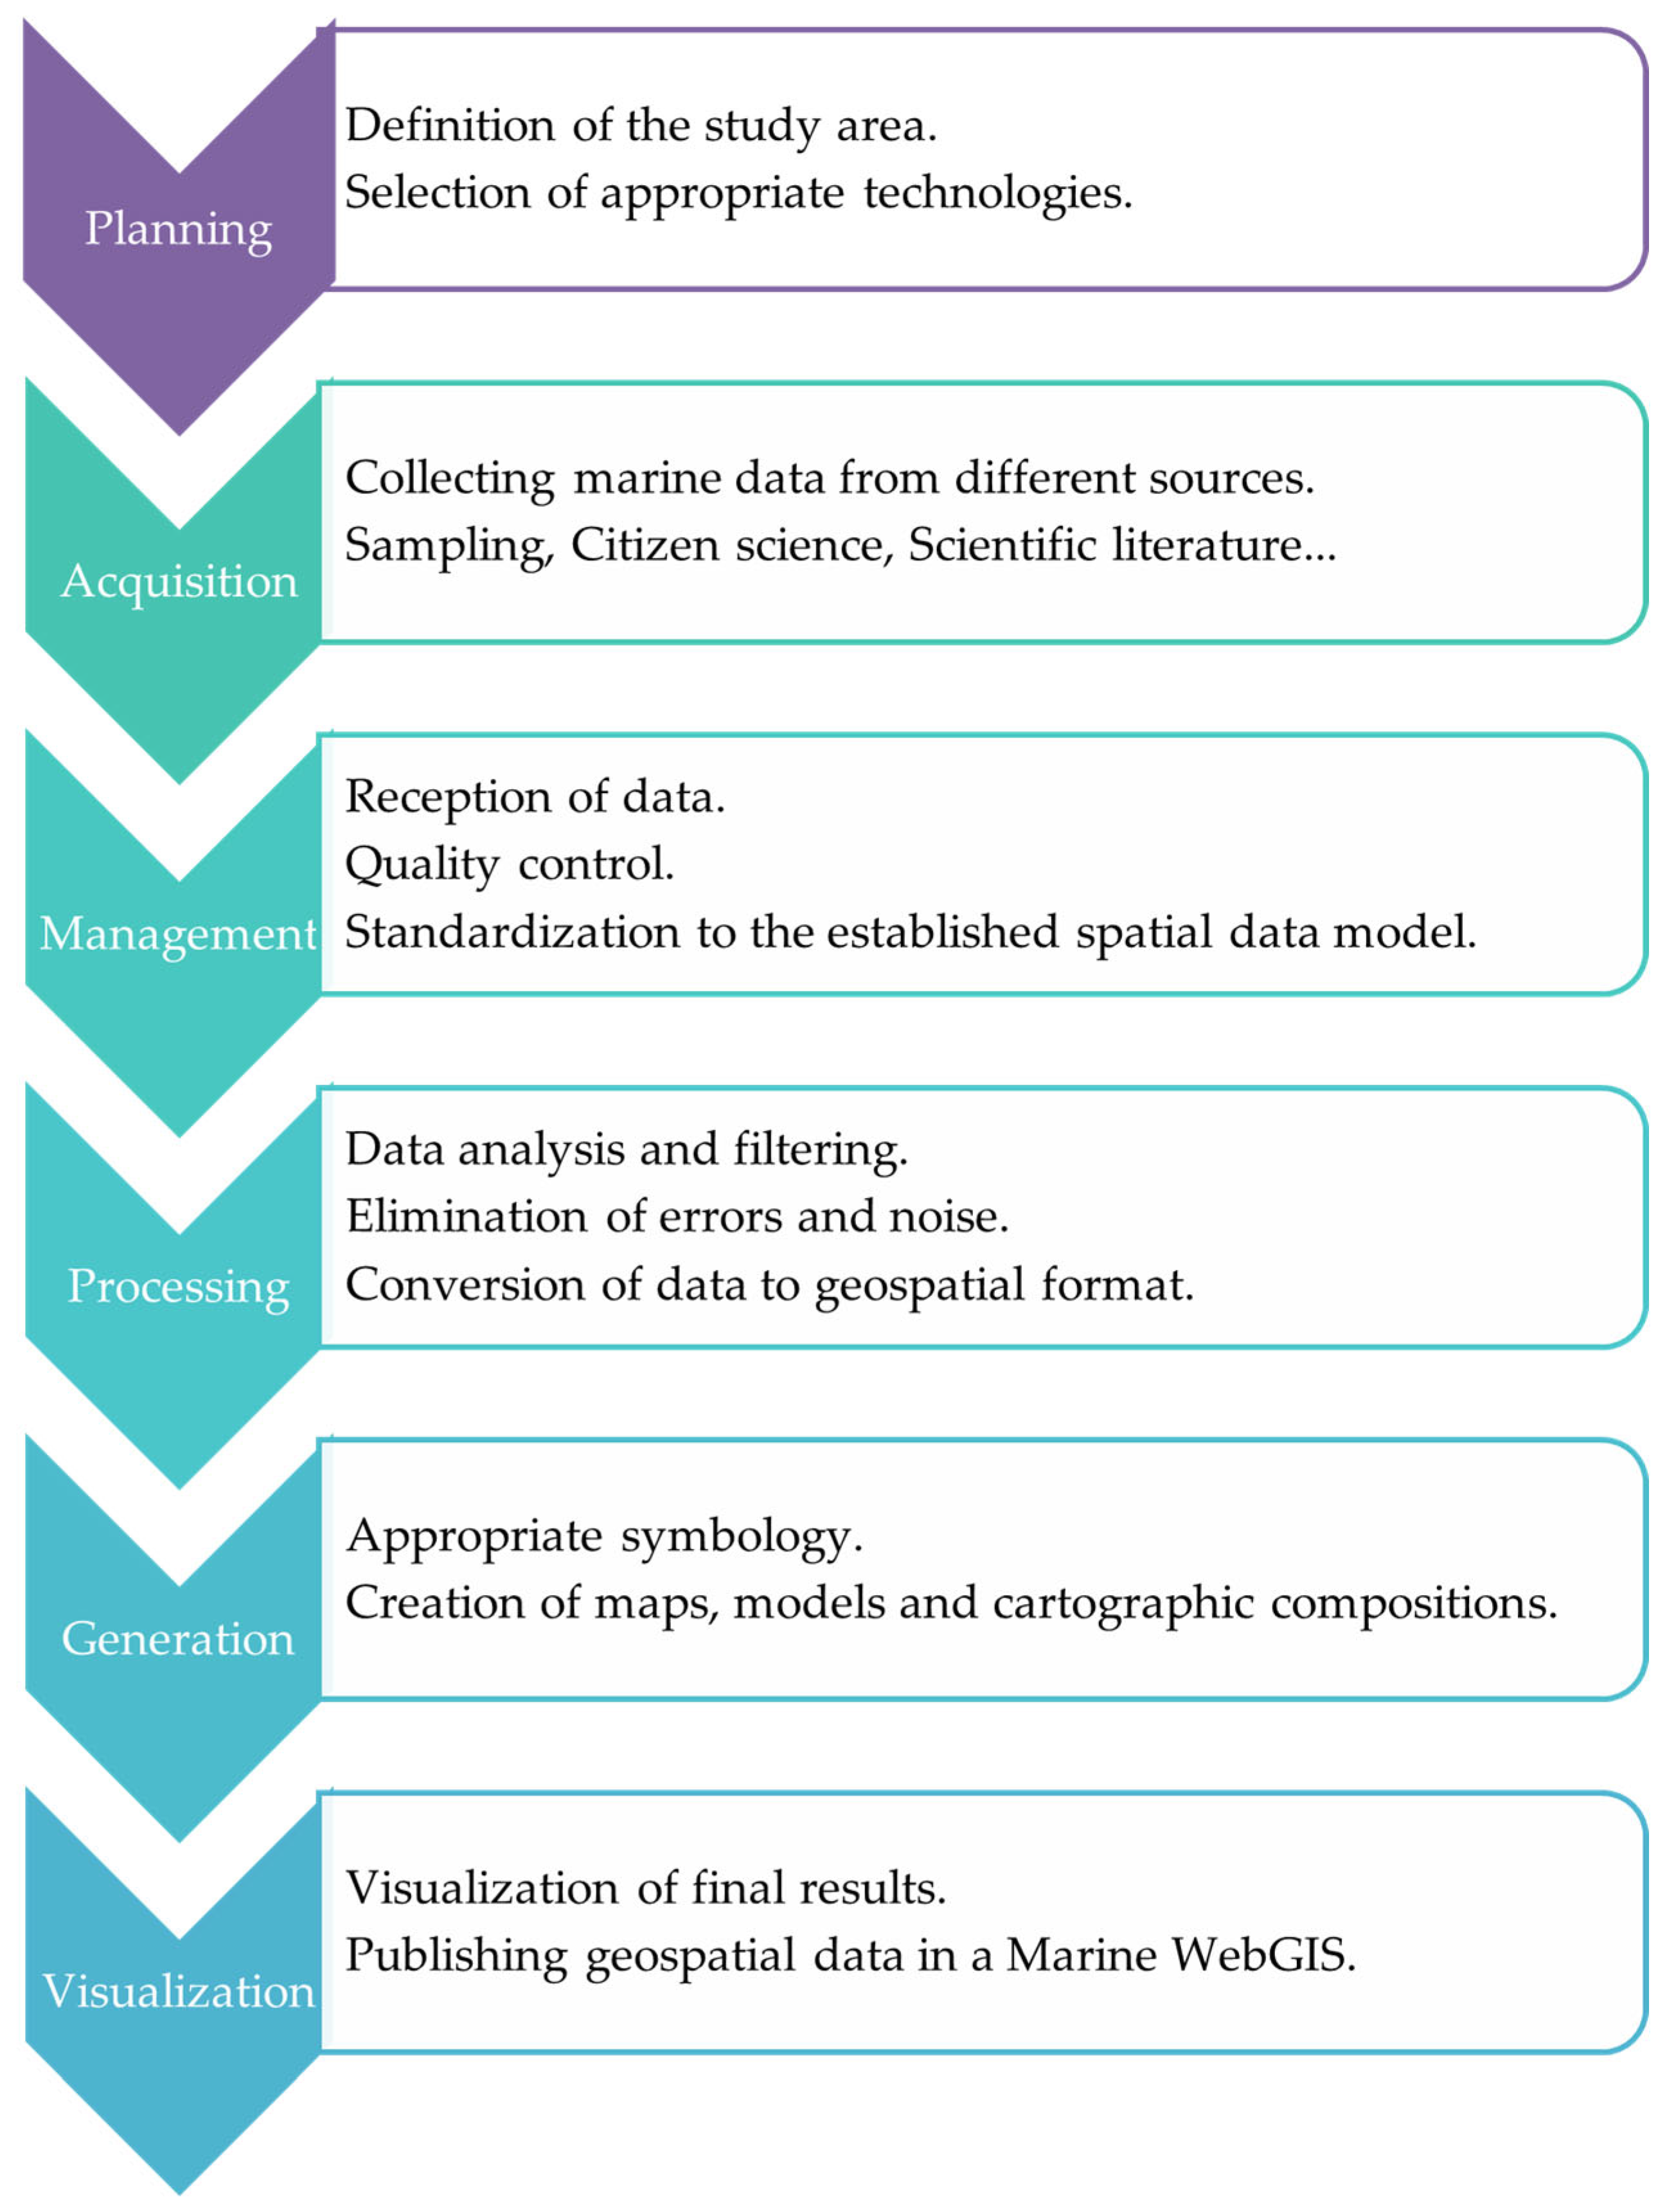
As illustrated in Figure 2, the marine GIS mapping process constitutes a fundamental methodology for the spatial management and protection of marine spaces. It integrates geospatial and oceanographic data through specialized technological tools, such as GIS. The procedure begins with the definition and selection of the study area [80], which is an essential step in correctly delimiting areas of scientific interest. Subsequently, surveys and data collection are planned and executed in the ocean. Multidisciplinary teams collect information through various devices and sensors, adapting to the specific objectives of each study. The workflow to be followed applied to the methodology for marine spatial management begins with data collection in the field, followed by processing and analyzing [81] the data with GIS-based tools. This involves the processing and the subsequent exhaustive quality control to guarantee the reliability of the collected information until it is converted into geospatial information. All in situ datasets underwent internal quality control, including format and coordinate system standardization, and metadata verification. Potential outliers were evaluated case-by-case using acquisition metadata and spatial context and excluded only when attributable to acquisition or processing artifacts, with no corrections based on external reference datasets.
Standardization and adaptation to the established spatial data model [82] are very important, in this phase of the process. The methodological approach adopted in this study is based on the application of a standardized spatial data model developed within the LIFE IP INTEMARES project, designed to ensure consistency, interoperability, and reproducibility across multiple study areas and data sources. This data model defines common structures and attribute schemas for integrating heterogeneous marine datasets, including in situ observations, derived thematic layers, and auxiliary environmental information.
The production and dissemination of marine geospatial information rely on a workflow that continues with the generation of cartographic materials and concludes with their publication through WebGIS platforms [36]. This process involves the integration of diverse spatial datasets, including bathymetric surveys, substrate classifications, water quality measurements, and ecological field observations. These datasets are first preprocessed to ensure spatial consistency, including harmonization of resolution, coordinate systems, and projections.
Effective symbology design plays a crucial role in representing these marine features clearly and accurately. Cartographic principles guide the selection of visual variables—such as color, shape, and size—to differentiate between ecological classes, depth zones, and seafloor types [83]. Sequential or diverging color ramps are applied to continuous variables like depth and temperature, while categorical schemes are used for habitat or substrate types. These visual strategies ensure readability, even for complex or multilayered maps.
Spatial modeling supports the interpolation and transformation of raw data into usable formats. Interpolation techniques, including Inverse Distance Weighting (IDW) [84] [85] and kriging [80,86], allow for the generation of continuous surfaces from point data, such as temperature or grain-size measurements. Hydrodynamic models and terrain analysis (e.g., slope and aspect derived from bathymetric digital elevation models) further support the understanding of underwater topography and ocean dynamics. Point datasets were interpolated using IDW or Kriging depending on data density and spatial structure. IDW was applied to sparsely distributed layers, while Kriging was used where spatial autocorrelation and sampling density allowed geostatistical modeling. The selection was dataset-specific and intended to ensure appropriate spatial representation rather than methodological comparison.
Visualization of final outputs involves both static and interactive formats. High-resolution static maps are suitable for print or publication, while dynamic visualizations support user interaction [87]. Web-based mapping libraries (e.g., Leaflet, Cesium) enable users to explore layers, query data, and view 3D or time-variant visualizations. These tools are especially valuable for representing temporal phenomena such as seasonal changes in water quality or current flow.
Final cartographic products were generated by integrating the resulting model derived layers into coherent map layouts, ensuring appropriate selection of map projection, scale, and graphical elements, including annotations, legends, and inset maps.
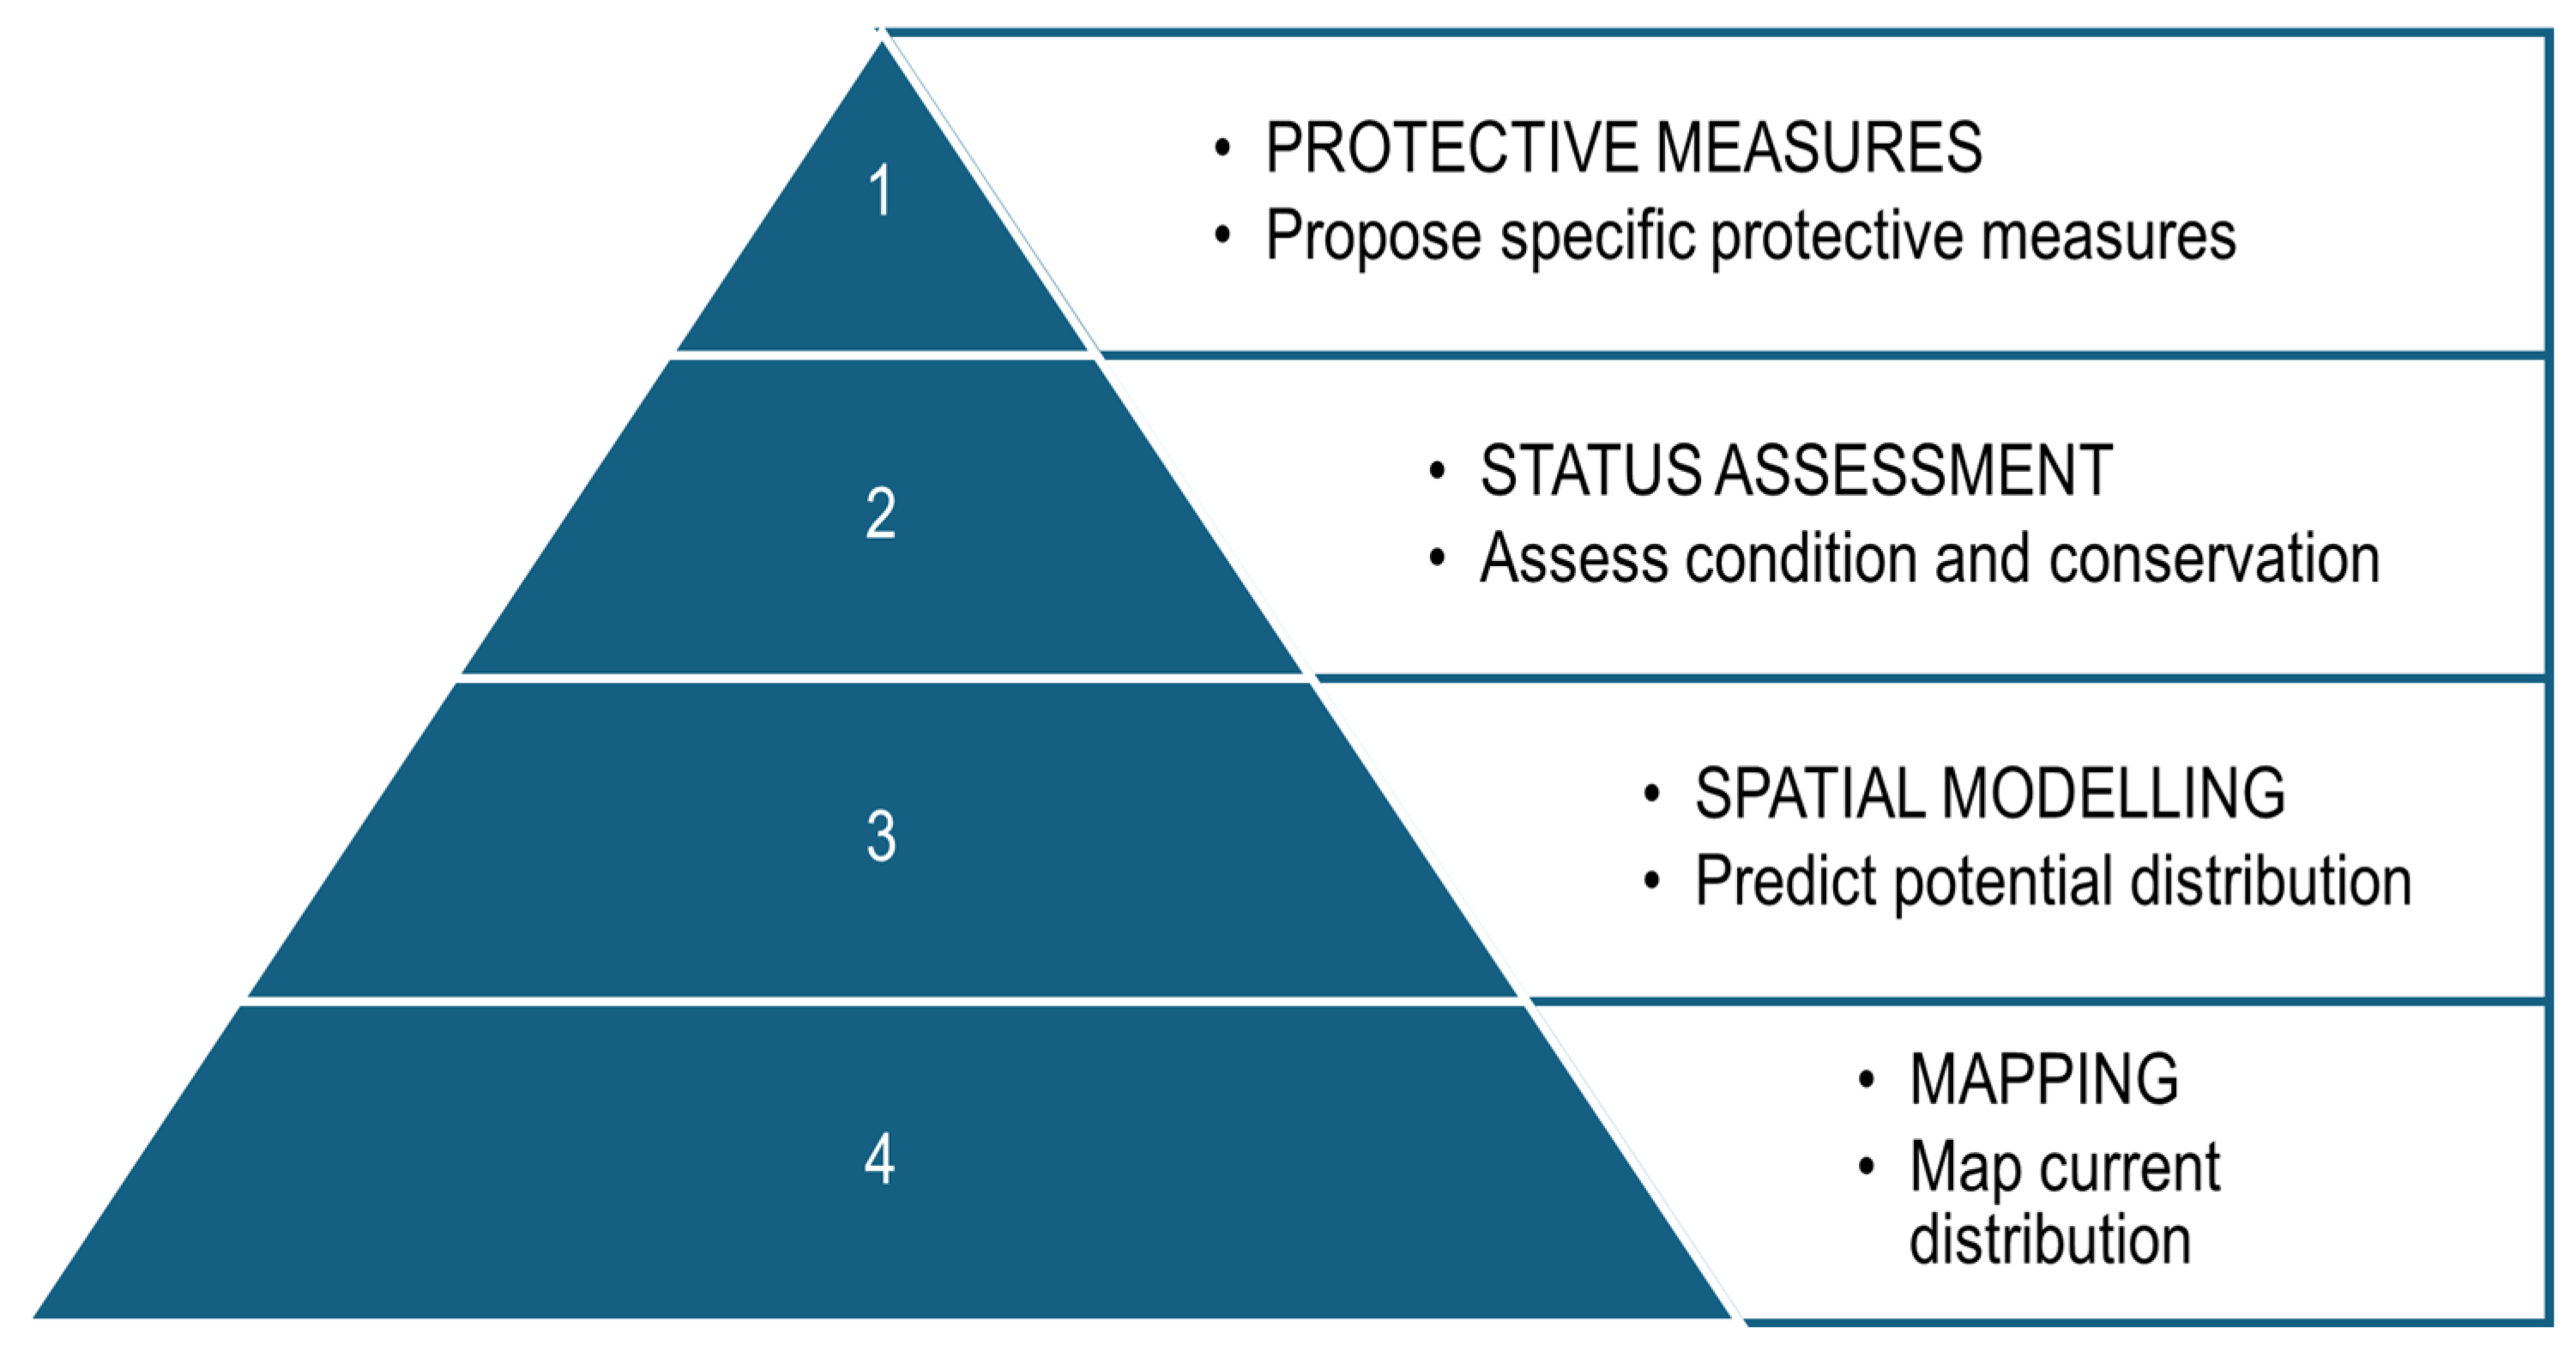
Therefore, cartography plays a central role in the study and management of benthic habitats, serving both a visual synthesis of ecological data and a decision-support tool for conservation planning [88]. Through integrated mapping, it becomes possible to predict the distribution of dominant benthic communities [71] and accurately delineate those identified through field surveys, such as video transects, sediment grabs, and diver observations. As illustrated in Figure 3, this process follows a multi-stage approach that includes mapping, spatial modeling, status assessment of the current situation and protective measures. It makes it possible to predict the distribution of the main benthic communities and to map the communities present in the area by combining data collected in the surveys carried out.
Following modeling, standardized ecological descriptors (Table 3) are identified and extracted to support the calculation of indicators used to assess the conservation status of habitats [56]. These parameters include species composition, habitat extent, spatial continuity, and pressures, and are aligned with national and European monitoring frameworks, such as the MSFD [7] and the Habitats Directive (92/43/EEC) [46]. The definition and use of such indicators are essential to objectively assess ecosystem health and inform the development of site-specific management plans [39].
Based on these assessments, spatially explicit protection and conservation measures can be proposed to maintain or improve the ecological condition of marine habitats of Community interest. These measures must align with existing biodiversity features, ecological thresholds, and legal frameworks, ensuring coherence with national, European, and international environmental legislation [89,90,91].

2.4. Marine WebGIS

The WebGIS infrastructure was implemented using widely adopted open-source geospatial technologies, including PostGIS for spatial database management and GeoServer for data publication and interoperability services. These systems enable efficient storage, processing, and dissemination of large marine datasets through standardized OGC protocols (e.g., WMS and WFS). The IDEO Marine Information Viewer serves as the user interface, supporting data visualization, exploration, and dissemination within the platform. Detailed technical specifications and implementation guidelines are available through the official documentation of these tools [37,92,93] thereby ensuring transparency and reproducibility in the WebGIS architecture.
Publishing geospatial datasets through this infrastructure enhances accessibility and enables interactive exploration of marine spatial information. Within this framework, PostGIS manage georeferenced data, while GeoServer provides cartographic services compliant with OGC standards. The front-end interface supports layer visualization, spatial querying, and measurement tools, facilitating user interaction with complex datasets. All datasets integrated into the study comply with the ISO 19115 metadata standard (International Organization for Standardization) [94] ensuring consistent documentation of dataset identification, lineage, spatial reference, quality, and distribution. This standardization strengthens interoperability, traceability, and data reuse.
A central component of the workflow is the IDEO Marine Information Viewer, which provides access to datasets such as bathymetry, substrate maps, marine boundaries, fishing grounds, and benthic habitat layers. The platform offers openly accessible metadata and geospatial services through an OGC-compliant endpoint (e.g., WMS). Data management and dissemination follow internationally recognized frameworks, including the FAIR, CARE, and TRUST principles, ensuring scientific rigor, ethical governance, and long-term sustainability. In accordance with FAIR [32,95], datasets incorporate persistent identifiers standardized metadata (ISO 19115/INSPIRE) and interoperable format (NetCDF, GeoJSON, CSV), supported by comprehensive documentation to facilitate reuse. The CARE principles [31] guide responsible data governance, ensuring ethical use and consideration of data sensitivity, while TRUST [96] reinforces repository governance, metadata transparency, and long-term preservation through institutional and European infrastructures such as EMODnet and Copernicus Marine Service (CMEMS). Together, these frameworks ensure that the datasets are findable, accessible, interoperable, reusable, and sustainably managed.
Case studies illustrate the effectiveness of these systems in real-world scenarios. For example, WebGIS applications have been used to assess Good Environmental Status in the MSFD for the Spanish seas, where users can interactively explore interpolated data layers and perform basic geostatistical analysis. Other systems have supported the sharing of marine geophysical data or enabled dynamic visualization of environmental parameters. Despite these advances, several challenges remain, including the handling of large spatial datasets, maintaining performance, securing access to sensitive data, and ensuring cross-platform compatibility. Addressing these issues requires thoughtful architecture design, data caching strategies, user interface testing, and engagement with stakeholders during system development.
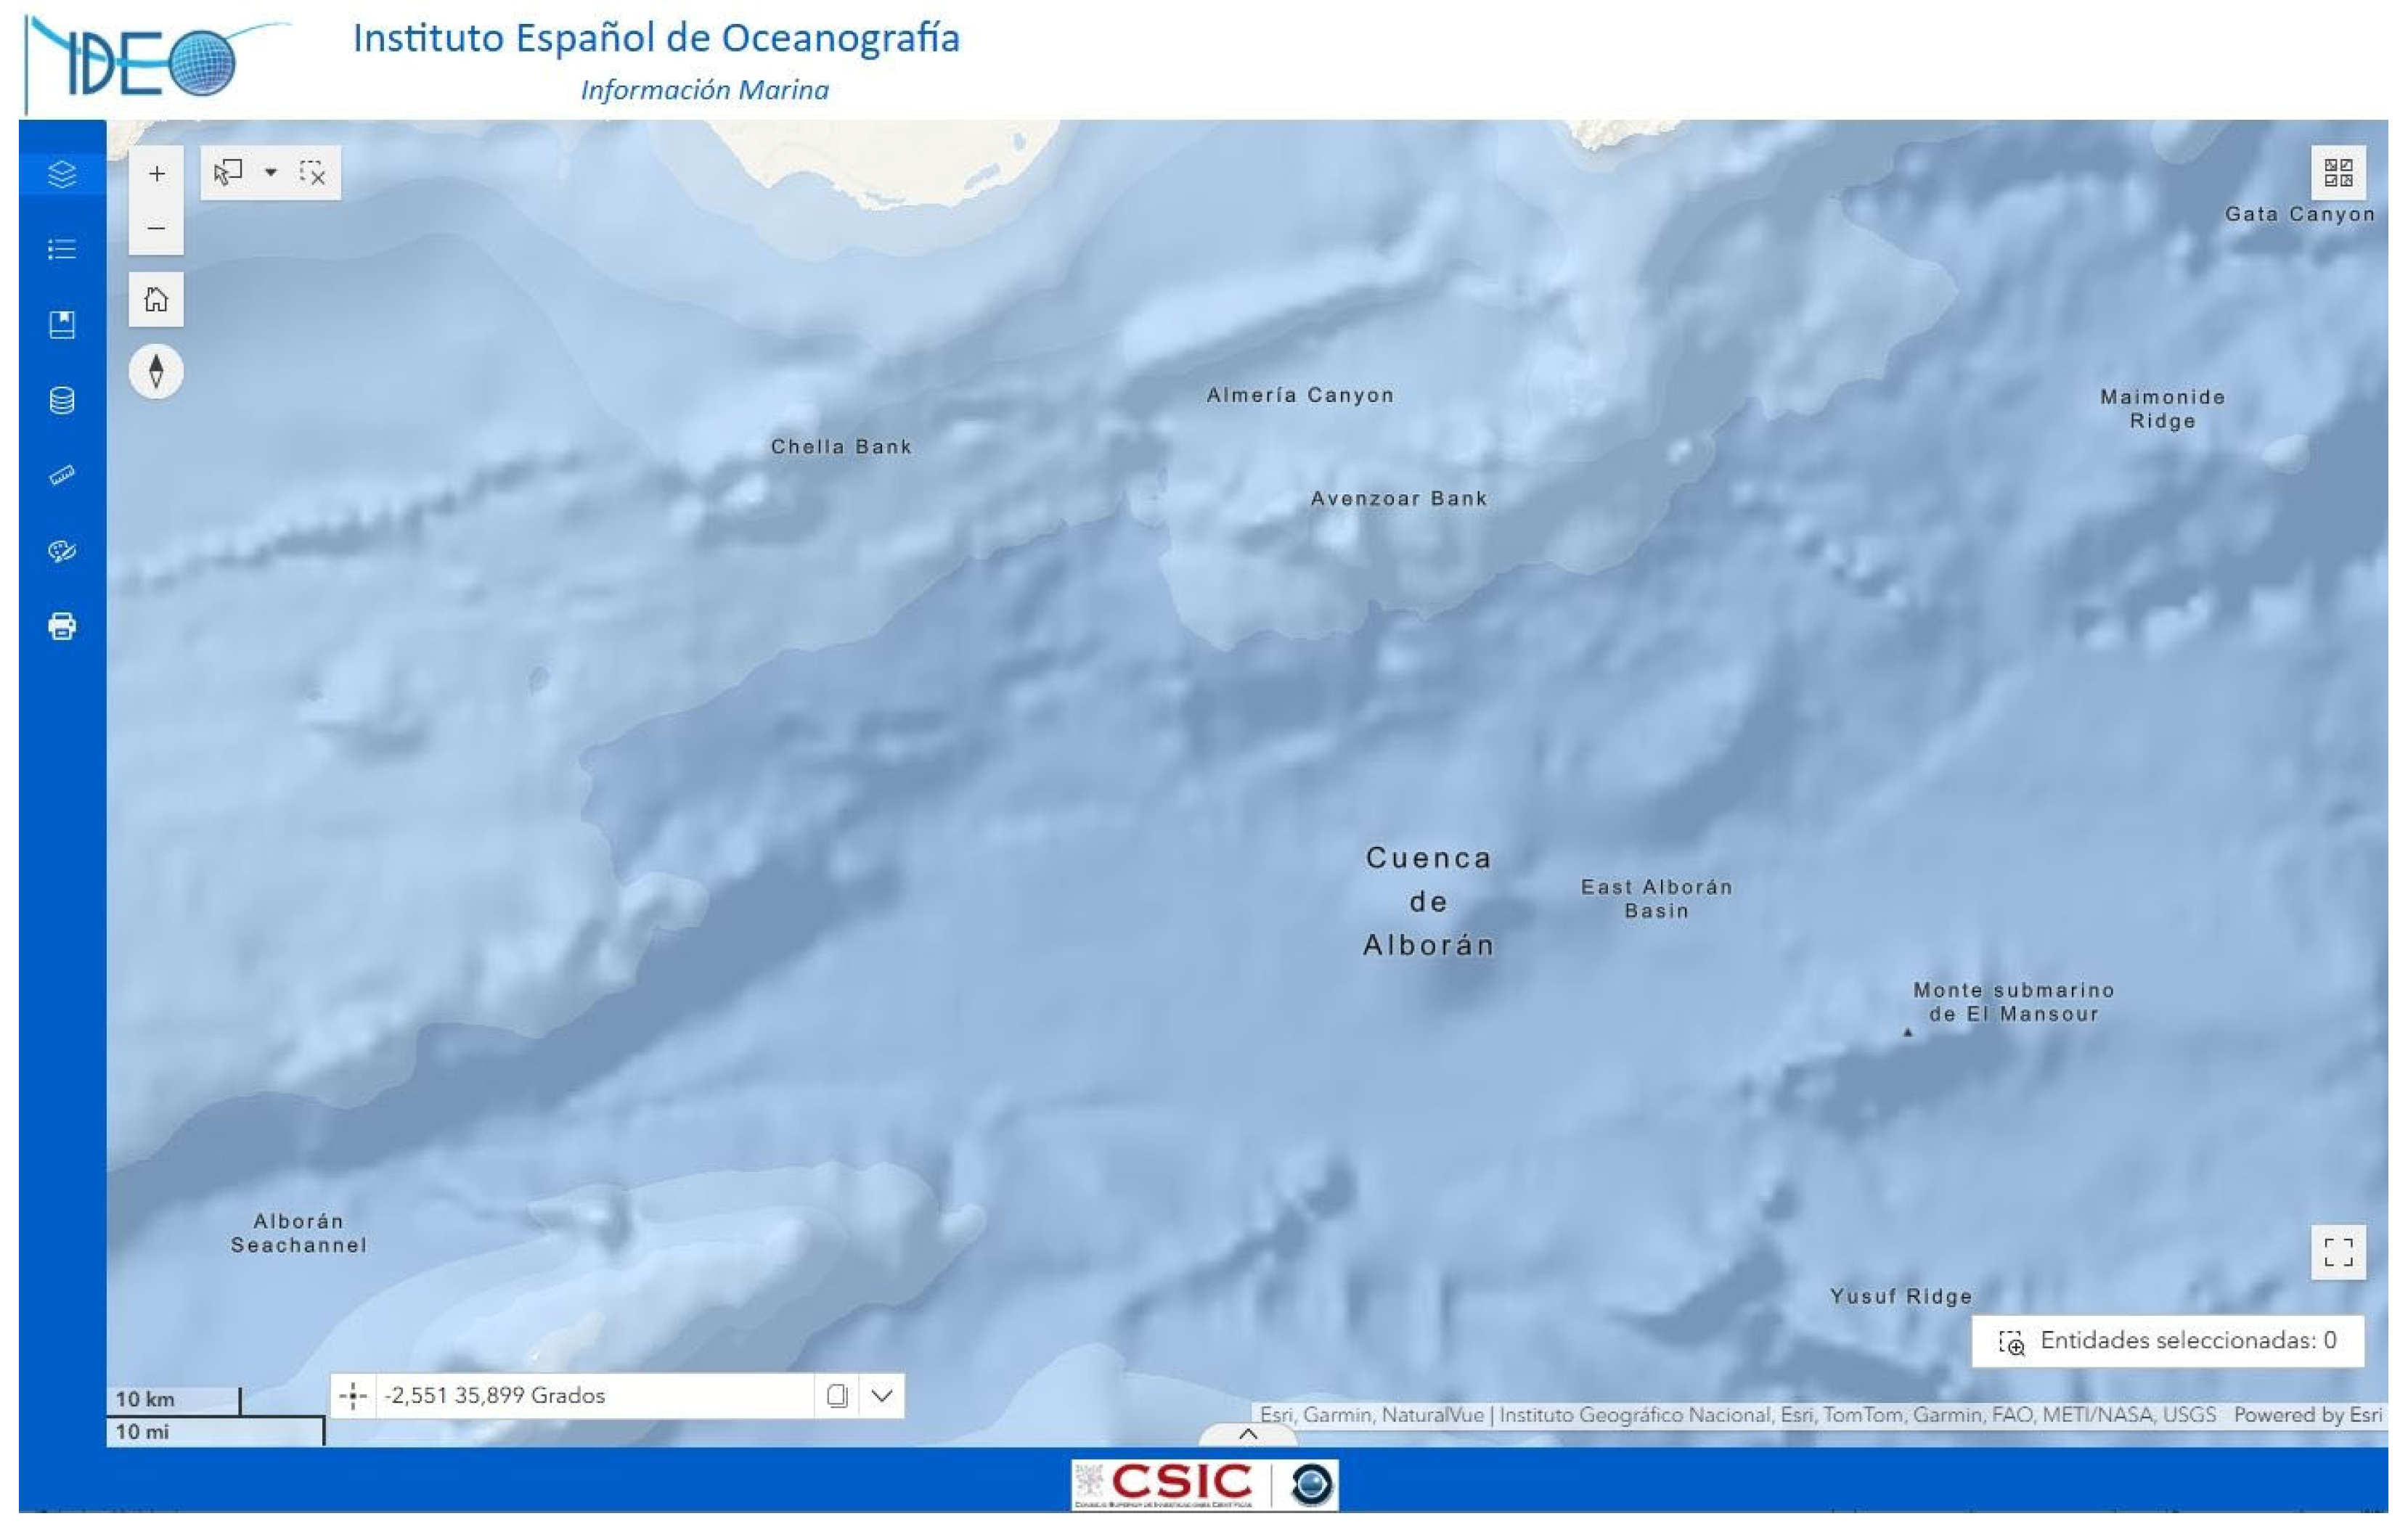
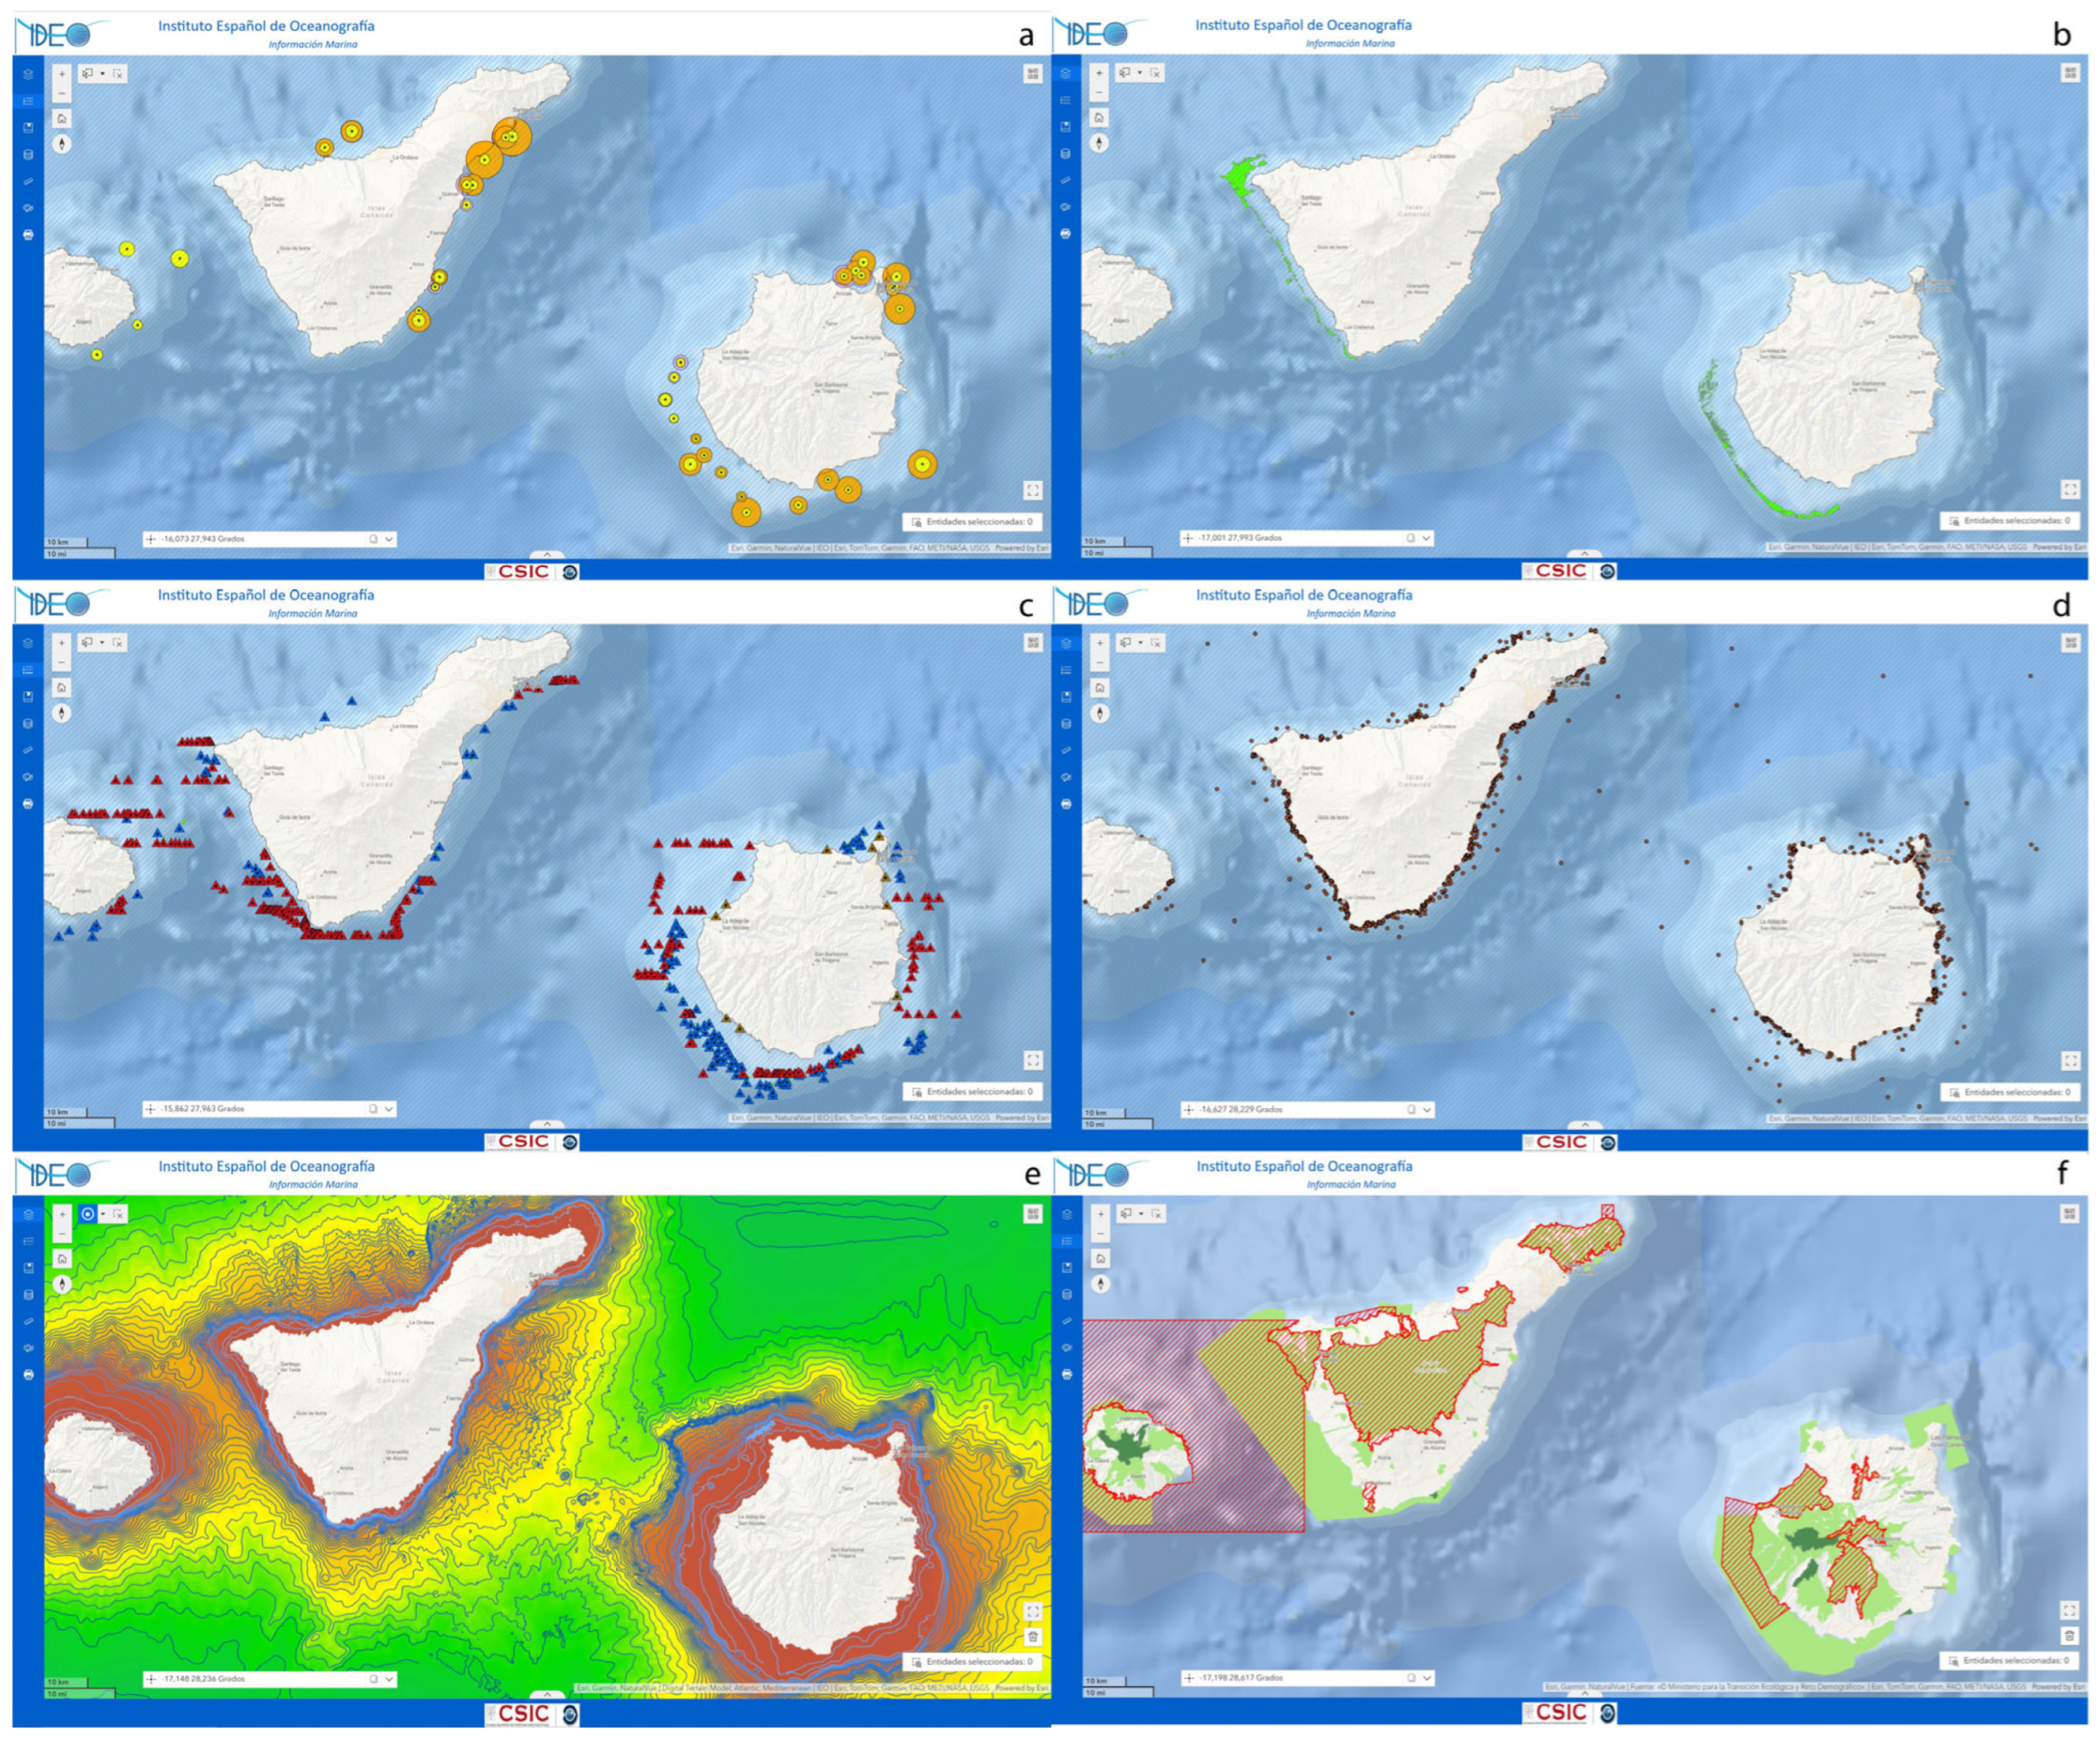
Within the methodological framework applied, the IDEO and the Viewer (Figure 4) [37] constitute an important tool for the integration of data from different sources, through the creation of interoperable web services and interactive viewers, which facilitate updated and accurate access to geospatial data, essential in the evaluation of results and strategic decision-making in research projects, marine environmental management and conservation [70].
For this reason, the resources offered by the Viewer establish an essential instrument for the conservation of marine protected areas, since it allows guaranteeing access and analysis of geospatial information in an accurate and updated way, especially for the final evaluation and analysis of the results, supporting sustainable management and decision-making in marine conservation and environmental management.
Transparent and up-to-date access to this data favors both scientists and technicians as well as the public [97], promoting participation and compliance with objectives related to climate action [98] and oceans [25].
In addition, the IDEO Geospatial Viewer supports the adaptive and sustainable management of marine spaces by transforming complex datasets into clear and interpretable geospatial information through the following core functionalities:
-
Explore information in 4D (longitude, latitude, depth, and time), adding spatial and temporal context to ocean data.
-
Visualize and combine geographical layers such as bathymetry, geomorphology, physical–chemical variables, marine habitats, administrative boundaries and protected reserves.
-
Integrate interoperable services (WMS, WFS) that allow access and updating of data from various national and international sources, promoting oceanographic research and environmental management.
-
To promote decision-making in coastal and marine management through thematic maps [99], risk analysis and environmental monitoring.
-
Facilitate access to up-to-date data for scientists, technicians and managers, as well as for the public, promoting transparency and participation.
-
Access and download spatial datasets in standard formats (GeoJSON, CSV, and JSON), supporting common coordinate reference systems, with data available at their native spatial and temporal resolutions within the defined dataset extents.
In summary, the IDEO Geospatial Viewer is a strategic resource that strengthens oceanographic research, marine conservation and adaptive management towards a sustainable use of marine spaces.

3. Results

A central outcome of this research is the production of standardized, high-resolution cartography of marine habitats across Spanish waters, representing one of the most comprehensive spatial datasets generated to date for national marine management. A particularly significant result is the mapping and incorporation of more than 600,000 hectares of newly identified marine areas, which had not been previously characterized at this spatial or thematic detail. Using integrated bathymetry, backscatter, substrate mapping, and ground-truth imagery, the workflow enabled the identification and spatial delineation of key benthic habitats—including seagrass meadows, coralligenous assemblages, maërl beds, soft-sediment communities, and rocky-bottom systems—across the Atlantic, Mediterranean, and Macaronesian subregions.
The resulting habitat maps capture both broad-scale patterns (shelf and slope morphology, canyon systems) and fine-scale structural variability, supporting the characterization of ecological hotspots and areas of conservation priority. These maps constitute a decision-ready product for MSFD assessments and MSP, providing essential spatial indicators for evaluating habitat extent, condition, and exposure to cumulative pressures. Furthermore, integration into WebGIS platforms ensures that these habitat layers are interoperable, publicly accessible, and continuously updatable, reinforcing their relevance for long-term monitoring and adaptive management in Spain’s marine environment. Spatial indicators derived from GIS analyses play a key role in supporting MSFD and Natura 2000 implementation when they are explicitly aligned with MSFD descriptors and associated criteria. Indicators related to the distribution, extent, and condition of benthic habitats directly support Descriptor 1 (Biodiversity) by enabling the spatial assessment of ecosystem structure and function within and beyond protected areas. Cumulative human pressure and pressure–impact indicators, derived from the spatial overlay and weighting of activities, such as fishing, are particularly relevant for Descriptors 6 (Seafloor Integrity), as they allow the identification of impact hotspots and risk gradients affecting marine ecosystems. The deployment of these indicators through interoperable WebGIS platforms enhances transparency and adaptive marine governance by providing open access to standardized, traceable spatial outputs, facilitating scenario exploration, stakeholder engagement, and iterative feedback between monitoring and management, which are increasingly recognized as essential for achieving Good Environmental Status under the MSFD.
In this context, a comparative analysis shows clear differences between the Spanish marine management workflow and other established systems in Europe and worldwide. Countries such as the United Kingdom, Norway, and the Netherlands rely on highly centralized governance structures supported by advanced digital platforms for spatial data integration. In contrast, the Spanish system operates within a multilevel governance framework that combines national and regional competences, resulting in distinct coordination requirements. The results also indicate that while Australia and Canada have strongly institutionalized participatory processes, the Spanish approach incorporates stakeholder engagement mechanisms adapted to the socio-economic and environmental diversity of the Mediterranean and Atlantic regions. Additionally, the Spanish workflow demonstrates specific methodological advances, particularly in the integration of environmental and socio-economic datasets and in the application of decision-support tools aimed at assessing compatibility among uses.
One of the most significant quantitative outcomes of this case study is the remarkable expansion of MPAs in Spain over the past two decades, reflecting a profound transformation in the country’s approach to marine conservation. In 2004, official records indicated that the marine component of the Natura 2000 Network covered 674,448 hectares, representing the early stages of spatial protection policy and a limited incorporation of offshore ecological values into national conservation planning. By 2014, this figure had nearly doubled, marking the first major wave of designations and signaling a systematic shift toward integrating marine biodiversity into the broader framework of European environmental directives. From 2014 onward, the rate of expansion accelerated dramatically, driven by improved knowledge of deep-sea ecosystems, enhanced national commitments, and the implementation of large-scale EU initiatives. This growth culminated in a total protected surface of 14,460,017.12 hectares, a magnitude of increase that aligns closely with the objectives and actions undertaken below the LIFE IP INTEMARES project, which provided the scientific, technical, and participatory foundation for Spain’s contemporary MPA strategy. The resulting network represents not only a quantitative milestone but also one of the most substantial advances in the history of marine conservation in Spain, fundamentally reshaping the spatial extent, ecological representativeness, and management ambition of its marine protected area system.
Table 4 summarizes the evolution of the marine protected surface in Spain over the last two decades, based on GIS based compilation and standardized area calculations of official MPA and Natura 2000 boundary datasets. This increase reflects a broader, policy driven process associated with the progressive implementation of European conservation frameworks, rather than the direct outcome of a single study. Within this context, the results presented here provide a spatially consistent baseline that documents the magnitude and temporal pattern of MPA expansion using harmonized geospatial data. The contribution of this work lies in the systematic spatial processing, validation, and representation of these boundaries, enabling reproducible comparison across time and supporting subsequent analyses of spatial coherence, representativeness, and management context, rather than in attributing the observed expansion to the analyses conducted in this study.
In parallel, the IEO’s Marine Information Viewer constitutes a foundational component of Spain’s marine governance infrastructure, offering an integrated, multi-layered geospatial platform that consolidates heterogeneous datasets essential for informed decision-making. Beyond simply visualizing the outputs of scientific surveys, the system harmonizes biological, ecological, oceanographic, and geomorphological information with spatial layers on marine protected areas, legal and administrative boundaries, and pressures such as fishing intensity (Figure 5). This integration is particularly relevant in the context of large-scale monitoring programs, where the ability to overlay species distribution models, habitat maps, climate-related indicators, and anthropogenic impacts allows for a comprehensive assessment of ecosystem condition and vulnerability. By facilitating the simultaneous exploration of ecological patterns and regulatory frameworks, the platform enables managers to detect spatial mismatches between conservation priorities and existing designations, identify emerging risk hotspots, and support the evaluation of management actions over time.
Moreover, the Marine Information Viewer significantly enhances data interoperability and transparency, two elements increasingly recognized as prerequisites for adaptive ecosystem-based management. Its architecture enables the incorporation of new datasets as they become available—such as results from ROV transects, benthic habitat assessments, or seabed mapping surveys—providing a dynamic interface that can evolve in step with advances in marine research. This functionality not only improves the timeliness and relevance of the information available to policymakers but also strengthens the scientific basis for meeting national and international commitments, including the MSFD, the EU Biodiversity Strategy for 2030, and the global 30 × 30 conservation target. As a result, the platform functions as more than a visualization tool: it acts as a decision-support system that bridges scientific knowledge and policy implementation, enabling rigorous evaluation of conservation effectiveness and supporting the design of more coherent, targeted, and evidence-based marine management strategies.

4. Conclusions

Spain’s extensive coastline, together with its continental shelf and its Exclusive Economic Zone, place the country as one of the most relevant players in the international maritime area, with significant responsibility for the conservation and sustainable use of marine resources. In addition, advances in geospatial information processing technologies, such as GIS and WebGIS, make it possible to better understand marine spaces, their biological richness and the behavior of their ecosystems, thereby enhancing the scientific basis for informed management.
The international comparison in this study highlights the distinctive characteristics of the Spanish marine management workflow. Unlike more centralized systems such as those in the United Kingdom, Norway, or the Netherlands, the Spanish model operates within a multilevel governance structure that requires tailored coordination mechanisms. Furthermore, compared with countries like Australia and Canada, where participatory processes are highly institutionalized, Spain applies engagement strategies adapted to its diverse socio-ecological contexts. These differences underscore the unique contribution of the Spanish approach to global marine governance.
Overall, the methodological innovations presented—particularly in data integration and the use of decision-support tools—emphasize the added value of the Spanish approach. These features position the Spanish workflow as a relevant contribution to the development of evidence-based and context-sensitive marine management practices at the international level. This is essential for identifying areas in need of protection and for establishing Marine Protected Areas supported by ecologically justified measures. The application of cartographic outputs in this context facilitates the implementation of MPAs and habitat restoration actions grounded in robust spatial evidence.
In this sense, GIS address the challenges arising from the large volume of data [100], and the complexity of analyses required for integrating the information generated in the scientific field. They also enable remarkable results in the analysis, homogenization and validation of marine data, demonstrating its potential as a research tool [16] for climate action (Sustainable Development Goals, SDG 13) [95], and highlighting their importance in the current context of the Ocean Decade (2021–2030).
Meanwhile, the integration of modeling, visualization, and WebGIS publishing provides a comprehensive pathway from raw marine data to decision-ready spatial products that support science, management, and policy in coastal and oceanic environments. In summary, all stages of data handling—from field acquisition aboard the R/V Ramón Margalef and Ángeles Alvariño to post-cruise archiving and publication—are conducted in accordance with the FAIR, CARE, and TRUST frameworks. This ensures that marine data are technically interoperable, ethically grounded, and institutionally sustainable, providing a robust and transparent foundation for Marine Spatial Planning, conservation policy, and future scientific reuse.
Ultimately, the success of marine geospatial systems depends not only on technical implementation but also on the clarity of cartographic communication and the accessibility of published outputs. This accessibility and structuring of information enable the development of adaptive conservation strategies and informed environmental management, in line with international criteria for the assessment and protection of marine biodiversity.
Despite the substantial progress achieved in Marine Spatial Planning in Spain, several technical and institutional constraints remain. A major limitation concerns interoperability among institutional data repositories, as differences in metadata completeness, coordinate reference systems, and classification standards continue to hinder seamless integration of datasets produced by national, regional, and sectoral agencies. Likewise, the update frequency of geospatial layers—particularly those related to habitat condition or fishing pressure—varies considerably across institutions, limiting the capacity for near-real-time assessments. The incorporation of temporal monitoring data also remains challenging, as many long-term ecological series are not yet harmonized for direct use in dynamic spatial models.
In the presence of these constraints, GIS-derived products generated through the INTEMARES project—such as high-resolution habitat maps, sensitivity indices, cumulative-pressure layers, and geomorphological classifications— have contributed to laying the scientific basis for integrated management of marine ecosystems in the Natura 2000 Network in Spain, in accordance with current national and international guidelines on marine conservation. These efforts reflect Spain’s commitment to international and national policies to guarantee the sustainability of marine resources and the protection of ocean ecosystems, which according to the percentages achieved by the end of 2025, had reached 22.45% of marine protected area. With the expansions approved in 2025, Spain’s effective marine protection increased to 22.45–22.5%, although this value reflects newly designated areas that remain under review for formal validation by the European Commission.
For the future, the European Union has committed to protecting at least 30% of marine areas by 2030, in line with the Kunming-Montreal Global Biodiversity Framework. To support the effective implementation of this target, the project applied GIS-based spatial prioritization integrating: (i) gap analysis to produce spatially continuous map with full topological integrity; (ii) multi-layer overlays of ecological sensitivity (e.g., habitat distribution) and pressure layers (e.g., trawling intensity) to identify high/low-sensitive zones, in order to identify the most sensitive areas whose benthic communities could be altered in the long term as a consequence of this activity; and (iii) suitability modeling to rank candidate planning units for protection or management upgrades.
The results directly informed boundary adjustments of MPAs, prioritization of monitoring sites in high-leverage areas, and periodic assessments of conservation effectiveness (e.g., change in protected habitat extent and pressure exposure). By linking protection targets to explicit spatial evidence and measurable gaps, the framework strengthened the policy relevance of the conclusions and provided a clear pathway for tracking progress toward 30% coverage, ensuring alignment with legislative commitments and international conservation goals.

5. Discussion

The results of this study confirm that the operational integration of heterogeneous marine datasets within reproducible GIS workflows remains a key methodological bottleneck for effective MPA management. Differences in data formats, spatial and temporal resolutions, thematic structures, and associated uncertainties continue to limit the direct use of multi-source marine data in management-oriented analyses. Our findings are consistent with recent literature indicating that these challenges can be systematically addressed through the adoption of interoperable Marine Spatial Data Infrastructures (MSDIs) based on open geospatial standards promoted by OGC, ISO (International Organization for Standardization) [94], and IHO, which support data harmonization via common data models, standardized coordinate reference systems, and FAIR-compliant metadata frameworks. In this context, the increasing maturity of federated MSDI architectures and catalog-based data services emerge as a critical enabler of cross-institutional interoperability, facilitating scalable data discovery, access, and reuse across multidisciplinary and administrative boundaries.
One of the most significant quantitative outcomes of this case study is the documented expansion of MPAs in Spain over the past two decades, as derived from GIS-based boundary compilation and spatial area calculations. Using harmonized Natura 2000 and national MPA polygons, GIS overlay and geoprocessing analyses show that in 2004 the marine component of the Natura 2000 Network covered 674,448 ha, reflecting an early stage of marine spatial protection largely confined to coastal and near-shore areas. By 2014, GIS-derived area measurements reveal that the protected surface had nearly doubled, corresponding to the first systematic incorporation of offshore habitats identified through spatial habitat mapping and ecological assessments. From 2014 onwards, the acceleration in MPA expansion is directly linked to spatial analyses of deep-sea habitats, pressure layers, and representativeness gaps, which informed large-scale designation proposals under EU initiatives. This process culminated in a total marine protected surface of 14,460,017.12 ha, as calculated from updated MPA boundaries generated within the LIFE IP INTEMARES project. These GIS outputs not only quantify the magnitude of expansion but also reflect a qualitative shift toward improved spatial coherence, ecological representativeness, and management ambition, demonstrating how GIS-based analysis translated scientific evidence into concrete policy outcomes for Spain’s MPA network.
Furthermore, the results highlight that reproducibility is not only a technical requirement but a prerequisite for adaptive MPA management, particularly in dynamic marine environments where datasets are periodically updated. The use of scripted and modular GIS workflows allows preprocessing, analysis, and indicator generation steps to be formalized and documented, thereby enhancing transparency, repeatability, and long-term update capacity without altering the overall analytical framework. Collectively, these developments demonstrate that interoperable and reproducible GIS workflows play a central role in transforming heterogeneous marine data into consistent and actionable spatial indicators, strengthening scenario analysis, monitoring, and evidence-based decision-making in contemporary MPA management.

Author Contributions

Conceptualization, Dulce Mata; methodology, Dulce Mata; software, Dulce Mata; validation, Dulce Mata and Olvido Tello; formal analysis, Dulce Mata; investigation, Dulce Mata; resources, Dulce Mata, Olvido Tello; data curation, Paula Gil and Ángela Bellido; writing—original draft preparation, Dulce Mata; writing—review and editing, Paula Gil and Ángela Bellido; visualization, Paula Gil and Ángela Bellido; supervision, Dulce Mata. All authors have read and agreed to the published version of the manuscript.

Funding

This research was funded by the project LIFE IP PAF INTEMARES, coordinated by the Biodiversity Foundation of the Ministry for the Ecological Transition and the Demographic Challenge, with financial support from the European Union’s LIFE programme (LIFE15/IPE/ES/012). Open access publication benefited from support by CSIC through the CSIC–MDPI Open Access Publishing Agreement.

Data Availability Statement

The datasets used and analyzed in the current study are available from the corresponding author upon reasonable request, subject to the data-sharing policies and limitations of the projects.

Acknowledgments

This research has been performed in the scope of the INTEMARES project. INTEMARES was partially funded by the European Commission LIFE + “Nature and Biodiversity” call (LIFE15/IPE/ES/012).

Conflicts of Interest

The authors declare no conflicts of interest.

Abbreviations

The following abbreviations are used in this manuscript:
CARECollective Benefit, Authority to Control, Responsibility, Ethics
CMEMSCopernicus Marine Environment Monitoring Service
EEZExclusive Economic Zone
EUEuropean Union
FAIRFindable, Accessible, Interoperable, Reusable
GISGeographic Information Systems
IDWInverse Distance Weighting
IEO-CSICSpanish Oceanographic Institute
MITECOMinistry for Ecological Transition and the Demographic Challenge
MPAsMarine Protected Areas
MSFDMarine Strategy Framework Directive
ROVRemote Operated Vehicle
SACsSpecial Areas of Conservation
SCISites of Community Importance
SDGsSustainable Development Goals
SDIsSpatial Data Infrastructures
TRUSTTransparency, Responsibility, User Focus, Sustainability, Technology

References

  1. Corral, J. The Spanish Seas. In The Seas of Spain; Ministerio de Medio Ambiente y Medio Rural y Marino: Madrid, Spain, 2008; pp. 18–25. [Google Scholar]
  2. Ministerio de Fomento. Los Mapas Del Fondo Del Mar. Rev. Minist. Fom. 2019, 672, 34–41. [Google Scholar]
  3. United Nations. Continental Shelf of Spain; United Nations: New York, NY, USA, 2024. [Google Scholar]
  4. International Council for the Exploration of the Sea. Report of the ICES Advisory Committee on Fishery Management and Advisory Committee on Ecosystems, 2004; International Council for the Exploration of the Sea: Copenhagen, Denmark, 2004; Volume 1. [Google Scholar]
  5. Mata, D.; Úbeda, J.; Fernández, A. Modelling of the Reef Benthic Habitat Distribution within the Cabrera National Park (Western Mediterranean Sea). Ann. GIS 2021, 27, 285–298. [Google Scholar] [CrossRef]
  6. Division for Ocean Affairs and the Law of the Sea of the Office of Legal Affairs. The Law of the Sea; Division for Ocean Affairs and the Law of the Sea of the Office of Legal Affairs: New York, NY, USA, 1995. [Google Scholar]
  7. Basconi, L.; Rova, S.; Stocco, A.; Pranovi, F. Ecosystem Services for Supporting Coastal and Marine Resources Management, an Example from the Adriatic Sea (Central Mediterranean Sea). Ocean Coast. Manag. 2023, 235, 106486. [Google Scholar] [CrossRef]
  8. United Nations Treaty Series. United Nations Convention on the Law of the Sea; United Nations: Montego Bay, Jamaica, 1982. [Google Scholar]
  9. Adamo, A.M.; Santos, A.C.; Carvalho, N.; Guillén, J.; Magagna, D.; Neehus, S.; Baptista, A.P.; Quatrini, S.; Romeu, Y.S. The 2021 EU Blue Economy Report, 2nd ed.; Publications Office of the European Union: Luxembourg, 2021. [Google Scholar]
  10. Laranjeiro, M.I.; Navarro, J.; Bertolero, A.; Cerveira, L.R.; Pereira, E.; dos Santos, I.; Ramos, J.A.; Coelho, J.P.; Pereira, J.M.; Seco, J.; et al. Spatial and Interspecific Differences of Trace Element Concentrations in the Feathers of Pelagic and Coastal Seabirds from the Northeast Atlantic Ocean and the Western Mediterranean Sea. Mar. Pollut. Bull. 2025, 220, 118351. [Google Scholar] [CrossRef]
  11. European Union. Directive 2014/89/EU of the European Parliament and of the Council of 23 July 2014 Establishing a Framework for Maritime Spatial Planning. Off. J. Eur. Union 2014, 57, 135–145. [Google Scholar]
  12. Tishkov, A.A. Geography Is a Science of the Future. Her. Russ. Acad. Sci. 2022, 92, 277–284. [Google Scholar] [CrossRef]
  13. Patera, A.; Pataki, Z.; Kitsiou, D. Development of a WebGIS Application to Assess Conflicting Activities in the Framework of Marine Spatial Planning. J. Mar. Sci. Eng. 2022, 10, 389. [Google Scholar] [CrossRef]
  14. Córdoba-Donado, F.J.; Negro-Valdecantos, V.; Gómez-Pina, G.; Muñoz-Pérez, J.J. Integration of Marine Spatial Planning and Terrestrial Spatial Planning and Its Implementation in Spain. JSM Environ. Sci. Ecol. 2024, 12, 1096. [Google Scholar]
  15. Martín-Betancor, M.; Osorio, J.; Ruiz-García, A.; Nuez, I. Evaluation of Maritime Spatial Planning for Offshore Wind Energy in the Canary Islands: A Comparative Analysis. Mar. Policy 2024, 161, 106046. [Google Scholar] [CrossRef]
  16. Trégarot, E.; D’Olivo, J.P.; Botelho, A.Z.; Cabrito, A.; Cardoso, G.O.; Casal, G.; Cornet, C.C.; Cragg, S.M.; Degia, A.K.; Fredriksen, S.; et al. Effects of Climate Change on Marine Coastal Ecosystems—A Review to Guide Research and Management. Biol. Conserv. 2024, 289, 110394. [Google Scholar] [CrossRef]
  17. Pegorelli, C.; De Andres, M.; García-Onetti, J.; Rayo, S.; García-Sanabria, J. Marine Protected Areas as Socio-Economic Systems: A Method for Defining Socio-Economic Criteria in Marine Planning. Front. Mar. Sci. 2024, 11, 1358950. [Google Scholar] [CrossRef]
  18. BOE. Real Decreto 150/2023, de 28 de Febrero, Por El Que Se Aprueban Los Planes de Ordenación Del Espacio Marítimo de Las Cinco Demarcaciones Marinas Españolas; BOE: Madrid, Spain, 2023; Volume 113, pp. 32350–32578. [Google Scholar]
  19. Nieto, C.E.; Martínez-Graña, A.M.; Merchán, L. A GIS-Based Approach for Use Recommendations and Limitations in Sustainable Coastal Planning in the Southeastern Margin of the Ría de Arosa (Pontevedra, Spain). Appl. Sci. 2025, 15, 4582. [Google Scholar] [CrossRef]
  20. Menegon, S.; Depellegrin, D.; Farella, G.; Sarretta, A.; Venier, C.; Barbanti, A. Addressing Cumulative Effects, Maritime Conflicts and Ecosystem Services Threats through MSP-Oriented Geospatial Webtools. Ocean Coast. Manag. 2018, 163, 417–436. [Google Scholar] [CrossRef]
  21. Halpern, B.S.; Frazier, M.; Potapenko, J.; Casey, K.S.; Koenig, K.; Longo, C.; Lowndes, J.S.; Rockwood, R.C.; Selig, E.R.; Selkoe, K.A.; et al. Spatial and Temporal Changes in Cumulative Human Impacts on the World’s Ocean. Nat. Commun. 2015, 6, 7615. [Google Scholar] [CrossRef]
  22. Schwartz-Belkin, I.; Portman, M.E. Exploring Barriers to the Implementation of Geospatial Technologies in Marine Spatial Planning: Reports from Practitioners. Mar. Policy 2024, 159, 105891. [Google Scholar] [CrossRef]
  23. Esri. GIS for the Oceans; Esri: Redlands, CA, USA, 2011; p. 94. [Google Scholar]
  24. Vieira da Silva, C.; Ortigão, M.; Willaert, T.; Rosa, R.; Nunes, L.C.; Cunha-e-Sá, M.A. Participatory Geographic Information Systems (PGIS): Alternative Approaches to Identify Potential Conflicts and Positional Accuracy in Marine and Coastal Ecosystem Services. Mar. Policy 2021, 131, 104650. [Google Scholar] [CrossRef]
  25. Haupt, S.; Sibolla, B.; Molapo, R.; Mdakane, L.; Fourie, N. Exploring the Use of Data in a Digital Twin for the Marine and Coastal Environment. ISPRS Int. J. Geo-Inf. 2025, 14, 140. [Google Scholar] [CrossRef]
  26. Andrello, M.; Jacobi, M.N.; Manel, S.; Thuiller, W.; Mouillot, D. Extending Networks of Protected Areas to Optimize Connectivity and Population Growth Rate. Ecography 2014, 38, 273–282. [Google Scholar] [CrossRef]
  27. Depellegrin, D.; Menegon, S.; Abramic, A.; Hernandez, S.A.; Larosa, F.; Salvador, S.; Llambrich, C.M. Addressing Ocean Planning Challenges in a Highly Crowded Sea Space: A Case Study for the Regional Sea of Catalonia (Western Mediterranean). Open Res. Eur. 2024, 4, 46. [Google Scholar] [CrossRef] [PubMed]
  28. MSP4BIO Atlantic 1—Gulf of Cádiz (Spain) Pilot Project. Available online: https://msp4bio.eu (accessed on 15 December 2025).
  29. Smith, M.; Goodchild, M.; Longley, P. Geospatial Analysis, 7th ed.; Winchelsea Press: East Sussex, UK, 2025. [Google Scholar]
  30. Foglini, F.; Grande, V. A Marine Spatial Data Infrastructure to Manage Multidisciplinary, Inhomogeneous and Fragmented Geodata in a FAIR Perspective the Adriatic Sea Experience. Oceanologia 2023, 65, 260–277. [Google Scholar] [CrossRef]
  31. Carroll, S.R.; Garba, I.; Figueroa-rodríguez, O.L.; Holbrook, J.; Lovett, R.; Materechera, S.; Parsons, M.; Raseroka, K.; Rodriguez-lonebear, D.; Rowe, R.; et al. The CARE Principles for Indigenous Data Governance. Data Sci. J. 2020, 19, 43. [Google Scholar] [CrossRef]
  32. Wilkinson, M.D. The FAIR Guiding Principles for Scientific Data Management and Stewardship. Sci. Data 2016, 3, 160018. [Google Scholar] [CrossRef]
  33. Katsanevakis, S.; Stelzenmüller, V.; South, A.; Sørensen, T.K.; Jones, P.J.S.; Kerr, S.; Badalamenti, F.; Anagnostou, C.; Breen, P.; Chust, G.; et al. Ecosystem-Based Marine Spatial Management: Review of Concepts, Policies, Tools, and Critical Issues. Ocean Coast. Manag. 2011, 54, 807–820. [Google Scholar] [CrossRef]
  34. Bruque, G.; Tello, O. Managing Oceanographic Data for the Marine Strategy Framework Directive in Spain Supported by the Spatial Data Infrastructure of the Spanish Institute of Oceanography (IEO) and the INSPIRE Directive. In Proceedings of the EGU General Assembly Conference Abstracts; European Geosciences Union: Munich, Germany, 2020; p. 21975. [Google Scholar]
  35. Spanish Institute of Oceanography (IEO-CSIC) Marine Geospatial Information Viewer (IDEO). Available online: https://www.ieo.es/es/ideo (accessed on 15 February 2026).
  36. Tello Antón, M.O.; Bruque Carmona, G.; Agudo Bravo, L.M.; Mata Chacón, D.; Gil Cuenca, P. Discovery, Visualization and Dissemination of Marine Spatial Data Products from the Spanish Institute of Oceanography. In Proceedings of the Istituto Nazionale di Geofisica e Vulcanologia; National Institute of Geophysics and Volcanology: Rome, Italy, 2024. [Google Scholar]
  37. Spanish Institute of Oceanography (IEO-CSIC) IEO Marine Geoportal. Available online: https://ideo-base.ieo.es/ (accessed on 15 February 2026).
  38. Bosso, L.; Saviano, S.; Abagnale, M.; Bellardini, D.; Bolinesi, F.; Botte, V.; Buondonno, A.; Carotenuto, Y.; Casotti, R.; Chiusano, M.L.; et al. GIS-Based Integration of Marine Data for Assessment and Management of a Highly Anthropized Coastal Area. Sci. Rep. 2025, 15, 16200. [Google Scholar] [CrossRef]
  39. Mamede, R.; Freitas, R.; Rodrigues, A.M.; Quintino, V. Habitat Mapping of Portugal’s North-Western Continental Shelf and Its Application to Implement the European Marine Strategy Framework Directive. Mar. Policy 2023, 155, 105765. [Google Scholar] [CrossRef]
  40. EMODnet Bathymetry. European Marine Observation and Data Network (EMODnet). Available online: https://emodnet.ec.europa.eu/en/bathymetry (accessed on 28 June 2024).
  41. Ruiz, J.M.; Guillén, J.E.; Ramos Segurao, A.; Otero, M.M. Atlas de Las Praderas Marinas de España; Instituto Español de Oceanografía: Madrid, Spain, 2015; Volume 1. [Google Scholar]
  42. Fundación Biodiversidad LIFE IP INTEMARES: Integrated, Innovative and Participatory Management for the Natura 2000 Network in the Marine Environment. Available online: https://fundacion-biodiversidad.es/life/life-ip-paf-intemares-2/ (accessed on 26 June 2024).
  43. European Commission. The European Green Deal. COM(2019) 640 Final; European Commission: Brussels, Belgium, 2019. [Google Scholar]
  44. European Commission. EU Biodiversity Strategy for 2030: Bringing Nature Back into Our Lives. COM(2020) 380 Final; European Commission: Brussels, Belgium, 2021. [Google Scholar]
  45. INTEMARES Research—Intemares. Available online: https://intemares.es/en/research/ (accessed on 15 October 2025).
  46. European Community Council Directive 92/43/EEC of 21 May 1992 on the Conservation of Natural Habitats and of Wild Fauna and Flora. In Documents in European Community Environmental Law; Cambridge University Press: Cambridge, UK, 2010; pp. 568–583. [CrossRef]
  47. European Environment Agency. Marine Messages II. Navigating the Course Towards Clean, Healthy and Productive Seas Through Implementation of an Ecosystem-Based Approach; European Environment Agency: Luxembourg, 2019. [Google Scholar]
  48. European Commission. Directorate-General for Research and Innovation. In Portfolio Analysis EU Mission “Restore Our Ocean and Waters by 2030”; European Commission: Brussels, Belgium, 2023. [Google Scholar]
  49. European Environment Agency. Spatial Analysis of Marine Protected Area Networks in Europe’s Seas; European Environment Agency: Luxembourg, 2015. [Google Scholar]
  50. EMODnet Map of the Week—Marine Natura 2000 Sites (EMODnet). Available online: https://emodnet.ec.europa.eu/en/map-week-marine-natura-2000-sites-5 (accessed on 2 December 2024).
  51. Vargas Yánez, M.; García Martínez, M.C.; Moya Ruiz, F.; López-Jurado Marqués, J.L.; Serra Tur, M.; Santiago Domenech, R.; Balbín Chamorro, R. The Present State of Marine Ecosystems in the Spanish Mediterranean in a Climate Change Context; Tuimagina Editorial—Grupo Mediterráneo de Cambio Climático, Ed.; Instituto Español de Oceanografía: Madrid, Spain, 2020. [Google Scholar]
  52. BOE. Real Decreto 531/2025, de 24 de Junio, Por El Que Se Declaran Diez Zonas Especiales de Conservación, Se Aprueban Sus Medidas de Conservación y Las de Siete Zonas de Especial Protección Para Las Aves, y Se Propone La Modificación de Los Límites Geográficos; BOE: Madrid, Spain, 2025; pp. 99518–100227. [Google Scholar]
  53. Fundación Biodiversidad Marine Protected Area Increases to 21% with 7 New Sites. Available online: https://fundacion-biodiversidad.es/en/ (accessed on 28 June 2024).
  54. Qiao, X.; Lecours, V.; Braswell, A.E.; Hazell, J.E. Identifying Community Practices in Marine Benthic Data Usage in Florida. Ocean Coast. Manag. 2024, 259, 107429. [Google Scholar] [CrossRef]
  55. Walbridge, S.; Slocum, N.; Pobuda, M.; Wright, D.J. Unified Geomorphological Analysis Workflows with Benthic Terrain Modeler. Geosciences 2018, 8, 94. [Google Scholar] [CrossRef]
  56. Prampolini, M.; Blondel, P.; Foglini, F.; Madricardo, F. Habitat Mapping of the Maltese Continental Shelf Using Acoustic Textures and Bathymetric Analyses. Estuar. Coast. Shelf Sci. 2018, 207, 483–498. [Google Scholar] [CrossRef]
  57. Navarro, J.; Coll, M.; Cardador, L.; Fernández, Á.M.; Bellido, J.M. The Relative Roles of the Environment, Human Activities and Spatial Factors in the Spatial Distribution of Marine Biodiversity in the Western Mediterranean Sea. Prog. Oceanogr. 2015, 131, 126–137. [Google Scholar] [CrossRef]
  58. Laugié, M.; Michel, J.; Pohl, A.; Poli, E.; Borgomano, J. Global Distribution of Modern Shallow-Water Marine Carbonate Factories: A Spatial Model Based on Environmental Parameters. Sci. Rep. 2019, 9, 29–31. [Google Scholar] [CrossRef] [PubMed]
  59. Hart, T.E.; Neckles, H.A.; Kopp, B.S. Priority Data on Marine and Estuarine Resources within Northeastern National Parks: Inventory and Acquisition Needs; Natural Resource Report NPS/NETN/NRR—2013/612; National Park Service: Fort Collins, CO, USA, 2013. [Google Scholar]
  60. Palummo, V.; Milisenda, G.; Pica, D.; Canese, S.; Salvati, E.; De Vincenzis, L.; Battaglia, P.; Spanò, N.; Romeo, T.; Greco, S. Ecological Role of Benthic Vulnerable Marine Ecosystems (VMEs) Indicator Taxa on Soft Bottoms. Sci. Rep. 2025, 15, 26654. [Google Scholar] [CrossRef]
  61. D’Urban Jackson, T.; Williams, G.J.; Walker-Springett, G.; Davies, A.J. Three-Dimensional Digital Mapping of Ecosystems: A New Era in Spatial Ecology. Proc. R. Soc. B Biol. Sci. 2020, 287, 20192383. [Google Scholar] [CrossRef] [PubMed]
  62. Vargas-Yáñez, M.; Ouradou, M.; Moya, F.; Ballesteros, E.; Alonso, C.; Serra, M.; Piñeiro, S.; Moltó, V.; Santiago, R.; Balbín, R.; et al. A Time Series of Water Mass Transports through the Balearic Channels Using an Ocean Circulation Inverse Method: 1996–2022. Prog. Oceanogr. 2025, 237, 103525. [Google Scholar] [CrossRef]
  63. Coma, R.; Ribes, M.; Serrano, E.; Jiménez, E.; Salat, J.; Pascual, J. Global Warming-Enhanced Stratification and Mass Mortality Events in the Mediterranean. Proc. Natl. Acad. Sci. USA 2009, 106, 6176–6181. [Google Scholar] [CrossRef] [PubMed]
  64. Roche, M.; Degrendele, K.; Vrignaud, C.; Loyer, S.; Le Bas, T.; Augustin, J.M.; Lurton, X. Control of the Repeatability of High Frequency Multibeam Echosounder Backscatter by Using Natural Reference Areas. Mar. Geophys. Res. 2018, 39, 89–104. [Google Scholar] [CrossRef]
  65. Pinot, J.M.; López-Jurado, J.L.; Riera, M. The CANALES Experiment (1996–1998). Interannual, Seasonal, and Mesoscale Variability of the Circulation in the Balearic Channels. Prog. Oceanogr. 2002, 55, 335–370. [Google Scholar] [CrossRef]
  66. EMODnet EMODnet Central Portal. European Atlas of the Seas. Available online: https://emodnet.eu/en/what-emodnet (accessed on 2 January 2020).
  67. Bischof, B.G. Introduction: Reframing Geography for Oceans. In Marine Geography; Elsevier: Amsterdam, The Netherlands, 2025; pp. 1–7. [Google Scholar]
  68. Weatherall, P.; Marks, K.M.; Jakobsson, M.; Schmitt, T.; Tani, S.; Arndt, J.E.; Rovere, M.; Chayes, D.; Ferrini, V.; Wigley, R. A New Digital Bathymetric Model of the World’s Oceans. Geogr. Res. Lett. 2015, 2, 331–345. [Google Scholar] [CrossRef]
  69. European Commission. Report on the Blue Growth Strategy: Towards More Sustainable Growth and Jobs in the Blue Economy; SWD(2017) 128 final; European Commission: Brussels, Belgium, 2017. [Google Scholar]
  70. Bargain, A.; Foglini, F.; Pairaud, I.; Bonaldo, D.; Carniel, S.; Angeletti, L.; Taviani, M.; Rochette, S.; Fabri, M.C. Predictive Habitat Modeling in Two Mediterranean Canyons Including Hydrodynamic Variables. Prog. Oceanogr. 2018, 169, 151–168. [Google Scholar] [CrossRef]
  71. De la Torriente, A.; González-Irusta, J.M.; Aguilar, R.; Fernández-Salas, L.M.; Punzón, A.; Serrano, A. Benthic Habitat Modelling and Mapping as a Conservation Tool for Marine Protected Areas: A Seamount in the Western Mediterranean. Aquat. Conserv. Mar. Freshw. Ecosyst. 2019, 29, 732–750. [Google Scholar] [CrossRef]
  72. Pillay, T.; Cawthra, H.C.; Lombard, A.T. Characterisation of Seafloor Substrate Using Advanced Processing of Multibeam Bathymetry, Backscatter, and Sidescan Sonar in Table Bay, South Africa. Mar. Geol. 2020, 429, 106332. [Google Scholar] [CrossRef]
  73. Lucatelli, D.; Goes, E.R.; Brown, C.J.; Souza-Filho, J.F.; Guedes-Silva, E.; Araújo, T.C.M. Geodiversity as an Indicator to Benthic Habitat Distribution: An Integrative Approach in a Tropical Continental Shelf. Geo-Mar. Lett. 2019, 40, 911–923. [Google Scholar] [CrossRef]
  74. Lundblad, E.R.; Wright, D.J.; Miller, J.; Larkin, E.M.; Rinehart, R.; Naar, D.F.; Donahue, B.T.; Anderson, S.M.; Battista, T. A Benthic Terrain Classification Scheme for American Samoa. Mar. Geod. 2006, 29, 89–111. [Google Scholar] [CrossRef]
  75. Weiss, A. Topographic Position and Landforms Analysis. In Proceedings of the Poster Presentation, ESRI User Conference; Esri: New York, NY, USA, 2001; Volume 64, pp. 227–245. [Google Scholar]
  76. De Oliveira, N.; Bastos, A.C.; da Silva Quaresma, V.; Vieira, F.V. The Use of Benthic Terrain Modeler (BTM) in the Characterization of Continental Shelf Habitats. Geo-Mar. Lett. 2020, 40, 1087–1097. [Google Scholar] [CrossRef]
  77. Diesing, M.; Thorsnes, T. Mapping of Cold-Water Coral Carbonate Mounds Based on Geomorphometric Features: An Object-Based Approach. Geosciences 2018, 8, 34. [Google Scholar] [CrossRef]
  78. Rengstorf, A.M.; Yesson, C.; Brown, C.; Grehan, A.J. High-Resolution Habitat Suitability Modelling Can Improve Conservation of Vulnerable Marine Ecosystems in the Deep Sea. J. Biogeogr. 2013, 40, 1702–1714. [Google Scholar] [CrossRef]
  79. Fakiris, E.; Blondel, P.; Papatheodorou, G.; Christodoulou, D.; Dimas, X.; Georgiou, N.; Kordella, S.; Dimitriadis, C.; Rzhanov, Y.; Geraga, M.; et al. Multi-Frequency, Multi-Sonar Mapping of Shallow Habitats-Efficacy and Management Implications in the National Marine Park of Zakynthos, Greece. Remote Sens. 2019, 11, 461. [Google Scholar] [CrossRef]
  80. Valavanis, V. Geographic Information Systems in Oceanography and Fisheries; Taylor & Francis: London, UK; New York, NY, USA, 2005. [Google Scholar]
  81. Ozkiper, O.; Allegri, E.; Bianconi, A.; Pham, H.V.; Furlan, E.; Simide, R.; van der Geest, M.; Critto, A. A GIS-MCDA Approach to Map Environmental Suitability of Posidonia Oceanica Meadows as Blue Nature-Based Solutions in the Mediterranean Eco-Region. Sci. Total Environ. 2024, 955, 176803. [Google Scholar] [CrossRef]
  82. Wilson, J.P.; Fotheringham, A.S. The Handbook of Geographic Information Science; Wilson, J.P., Fotheringham, A.S., Eds.; Blackwell Companions to Geography: Hoboken, NJ, USA, 2008. [Google Scholar]
  83. Goodchild, M.F. Challenges in Geographical Information Science. Proc. R. Soc. A Math. Phys. Eng. Sci. 2011, 467, 2431–2443. [Google Scholar] [CrossRef]
  84. Li, J.; Heap, A.D. A Review of Spatial Interpolation Methods for Environmental Scientists; Record 2008; Geoscience Australia: Canberra, Australia, 2008. [Google Scholar]
  85. Ikechukwu, M.N.; Ebinne, E.; Idorenyin, U.; Raphael, N.I. Accuracy Assessment and Comparative Analysis of IDW, Spline and Kriging in Spatial Interpolation of Landform (Topography): An Experimental Study. J. Geogr. Inf. Syst. 2017, 9, 354–371. [Google Scholar] [CrossRef]
  86. Lecours, V.; Dolan, M.F.J.; Micallef, A.; Lucieer, V.L. A Review of Marine Geomorphometry, the Quantitative Study of the Seafloor. Hydrol. Earth Syst. Sci. 2016, 20, 3207–3244. [Google Scholar] [CrossRef]
  87. Tian, T.; Chang, H. Marine Information Sharing and Publishing System: A WebGIS Approach. J. Coast. Res. 2019, 94, 169–172. [Google Scholar] [CrossRef]
  88. Nelson, K.; Burnside, N.G. Identification of Marine Management Priority Areas Using a GIS-Based Multi-Criteria Approach. Ocean Coast. Manag. 2019, 172, 82–92. [Google Scholar] [CrossRef]
  89. Harris, P.T.; Whiteway, T. High Seas Marine Protected Areas: Benthic Environmental Conservation Priorities from a GIS Analysis of Global Ocean Biophysical Data. Ocean Coast. Manag. 2009, 52, 22–38. [Google Scholar] [CrossRef]
  90. Henriques, V.; Guerra, M.T.; Mendes, B.; Gaudêncio, M.J.; Fonseca, P. Benthic Habitat Mapping in a Portuguese Marine Protected Area Using EUNIS: An Integrated Approach. J. Sea Res. 2015, 100, 77–90. [Google Scholar] [CrossRef]
  91. Carr, M.H.; Woodson, C.B.; Cheriton, O.M.; Malone, D.; McManus, M.A.; Raimondi, P.T. Knowledge through Partnerships: Integrating Marine Protected Area Monitoring and Ocean Observing Systems. Front. Ecol. Environ. 2011, 9, 342–350. [Google Scholar] [CrossRef]
  92. PostGIS. PostGIS Documentation. Available online: https://postgis.net/documentation/ (accessed on 10 October 2025).
  93. GeoServer. GeoServer User Manual. Available online: https://docs.geoserver.org/main/en/user/ (accessed on 12 October 2025).
  94. International Organization for Standardization (ISO). ISO 19115:2014 Geographic Information—Metadata; ISO: Geneva, Switzerland, 2014. [Google Scholar]
  95. Tanhua, T.; Lauvset, S.K.; Lange, N.; Olsen, A.; Álvarez, M.; Diggs, S.; Bittig, H.C.; Brown, P.J.; Carter, B.R.; Cotrim, L.; et al. A Vision for FAIR Ocean Data Products. Commun. Earth Environ. 2021, 2, 136. [Google Scholar] [CrossRef]
  96. Lin, D.; Crabtree, J.; Dillo, I.; Downs, R.R.; Edmunds, R.; Giaretta, D.; De Giusti, M.; Hours, H.L.; Hugo, W.; Jenkyns, R.; et al. The TRUST Principles for Digital Repositories. Sci. Data 2020, 7, 144. [Google Scholar] [CrossRef]
  97. Wang, B.; Zhao, Q.; Zeng, D.; Yao, Y.; Hu, C.; Luo, N. Design and Development of a Local-First Collaborative 3D WebGIS Application for Mapping. ISPRS Int. J. Geo-Inf. 2025, 14, 166. [Google Scholar] [CrossRef]
  98. Hoegh-Guldberg, O.; Jacob, D.; Taylor, M.; Bindi, M.; Brown, S.; Camilloni, I.; Diedhiou, A.; Djalante, R.; Ebi, K.; Engelbrecht, F.; et al. Impacts of 1.5 °C Global Warming on Natural and Human Systems. In Global Warming of 1.5 °C. An IPCC Special Report on the Impacts of Global Warming of 1.5 °C Above Preindustrial Levels and Related Global Greenhouse Gas Emission Pathways; Cambridge University Press: Cambridge, UK; New York, NY, USA, 2018. [Google Scholar]
  99. Xu, Q.; Yordanov, V.; Bruzzone, L.; Brovelli, M.A. High-Resolution Global Land Cover Maps and Their Assessment Strategies. ISPRS Int. J. Geo-Inf. 2025, 14, 235. [Google Scholar] [CrossRef]
  100. Sartor, S.M.; Rosa, M.R.; Pires, J.T.; Oller Nascimento, C.A. Web Atlas Como Herramienta Para La Gestión Integrada Costera: De Los Datos Al Conocimiento Práctico. Rev. Costas 2021, 6, 427–454. [Google Scholar] [CrossRef]
Figure 1. Location and spatial context of the study areas where the Spanish Institute of Oceanography (IEO-CSIC) has carried out actions to improve knowledge of marine habitats and species. Green areas correspond to SCIs proposed as SCA, while orange areas represent three additional SCI proposals included to spatially contextualize the study. Source: Authors’ elaboration based on INTEMARES project.
Ijgi 15 00228 g001
Figure 2. Marine GIS mapping process.
Ijgi 15 00228 g002
Figure 3. Objectives and utilities of the marine mapping process.
Ijgi 15 00228 g003
Figure 4. Marine WebGIS. IDEO Geospatial Viewer.
Ijgi 15 00228 g004
Figure 5. IDEO Marine Information Viewer showing datasets for monitoring Marine Protected Areas: (a) human pressures—sediment pollution, (b) benthic habitats—1170 Reefs, (c) scientific surveys, (d) threats to marine habitats—fishing footprint (e) ecological variables—depth, (f) Natura2000 Network.
Ijgi 15 00228 g005
Table 1. Summary of Sampling Types and Techniques aboard R/V Oceanographic Vessels.
Sampling TypeInstrument/TechniqueMain Variables Representative Species/Parameters
Geological SamplingMultibeam echosounder
Sediment corer
Sub-bottom profiler
Bathymetry, Seabed morphology, Sediment composition, Grain size
Acoustic backscatter
Surface and subsurface sediment layers, carbonate content
Biological SamplingBottom trawl, Bongo nets
ROV
Biodiversity, biomass, species distributionSperm whale (Physeter macrocephalus), sponges Axinella polypoides, bamboo coral Isidella elongata
Water ColumnCTD Temperature, SalinityWater column profiles across depth strata
ROV-Assisted Visual SamplingHigh-definition cameras
Manipulator arms
Habitat structure
Species distribution
Benthic communities (corals, sponges, Posidonia oceanica)
Table 2. Main characteristics of the biotopes and main habitats analyzed.
ParameterTechniqueTypes
BathymetryBathymetric zoneInfralittoral
Circalittoral
Bathyal
SedimentsSedimentary typeMuddy
Sandy
Coarse sediment
Water columnBottom water temperatureLow
High
GeomorphologySeabed morphology typeDepression
Canyon
Ridge
Substrate typeBottom typeSoft bottom
Hard bottom
Benthic habitatsHabitat typeHCI 1110 (Sandbanks which are slightly covered by seawater all the time)
HCI 1170 (Reefs)
HCI 1180 (Submarine structures made by leaking gases)
Table 3. Ecological descriptors and indicators for Marine Habitats.
Ecological DescriptorDefinitionIndicators for Marine Habitats
Habitat extentPhysical and spatial arrangement of benthic substrate, biogenic structures.Seabed type (sand, mud, rock, biogenic substrate)
Percentage cover of key biogenic structures (e.g., Posidonia oceanica, coralligenous)
Species compositionIdentity and abundance of typical, sensitive, or keystone species.Abundance of characteristic benthic species (sponges, gorgonians, seagrass)
Biodiversity indices (Shannon)
Non-native marine species
Presence of indicator species sensitive to disturbance (e.g., Paramuricea clavata, Cystoseira spp.)
Pressures, impacts and threatsHuman or natural stressors affecting marine habitats.Trawling intensity (VMS data)
Invasive species abundance (Caulerpa cylindracea)
Overall conservation statusIntegrated assessment of extent, composition and pressures. EU Habitats Directive categories (Favorable, Unfavorable-Inadequate, Unfavorable-Bad)
MSFD Good Environmental Status indicators
Table 4. Marine areas protected by SCI and SAC protection figures, of the Natura Marine 2000 Network. Source: Ministry of the Environment, 2004. Ministry of Agriculture, Food and the Environment, 2014. Natura 2000 Network: update to December 2024, based on information on the Natura 2000 Network sites sent by the Ministry for the Ecological Transition and the Demographic Challenge to the European Commission.
YearNatura 2000 Network Protection FigureMarine Protected Area (Ha)
2004SCI/SAC674,448
2014SCI/SAC1,101,172
2024SCI/SAC14,460,017.12
Disclaimer/Publisher’s Note: The statements, opinions and data contained in all publications are solely those of the individual author(s) and contributor(s) and not of MDPI and/or the editor(s). MDPI and/or the editor(s) disclaim responsibility for any injury to people or property resulting from any ideas, methods, instructions or products referred to in the content.