Author Contributions
Conceptualization, Péter Czomba, Klára Czimre, Károly Teperics, Gyöngyi Bujdosó, Ernő Molnár, Gábor Négyesi and Bálint Bence Juhász; methodology, Péter Czomba, Klára Czimre and Károly Teperics; software, Péter Czomba, Gyöngyi Bujdosó and Bálint Bence Juhász; validation, Péter Czomba, Károly Teperics and Bálint Bence Juhász; formal analysis, Péter Czomba and Bálint Bence Juhász; investigation, Péter Czomba, Ernő Molnár, Gábor Négyesi and Bálint Bence Juhász; resources, Péter Czomba, Károly Teperics, Ernő Molnár, Gábor Négyesi and Bálint Bence Juhász; data curation, Péter Czomba and Bálint Bence Juhász; writing—original draft preparation, Péter Czomba and Klára Czimre; writing—review and editing, Péter Czomba, Klára Czimre, Károly Teperics and Ernő Molnár; visualization, Péter Czomba; supervision, Klára Czimre, Károly Teperics and Gyöngyi Bujdosó; project administration, Károly Teperics. All authors have read and agreed to the published version of the manuscript.
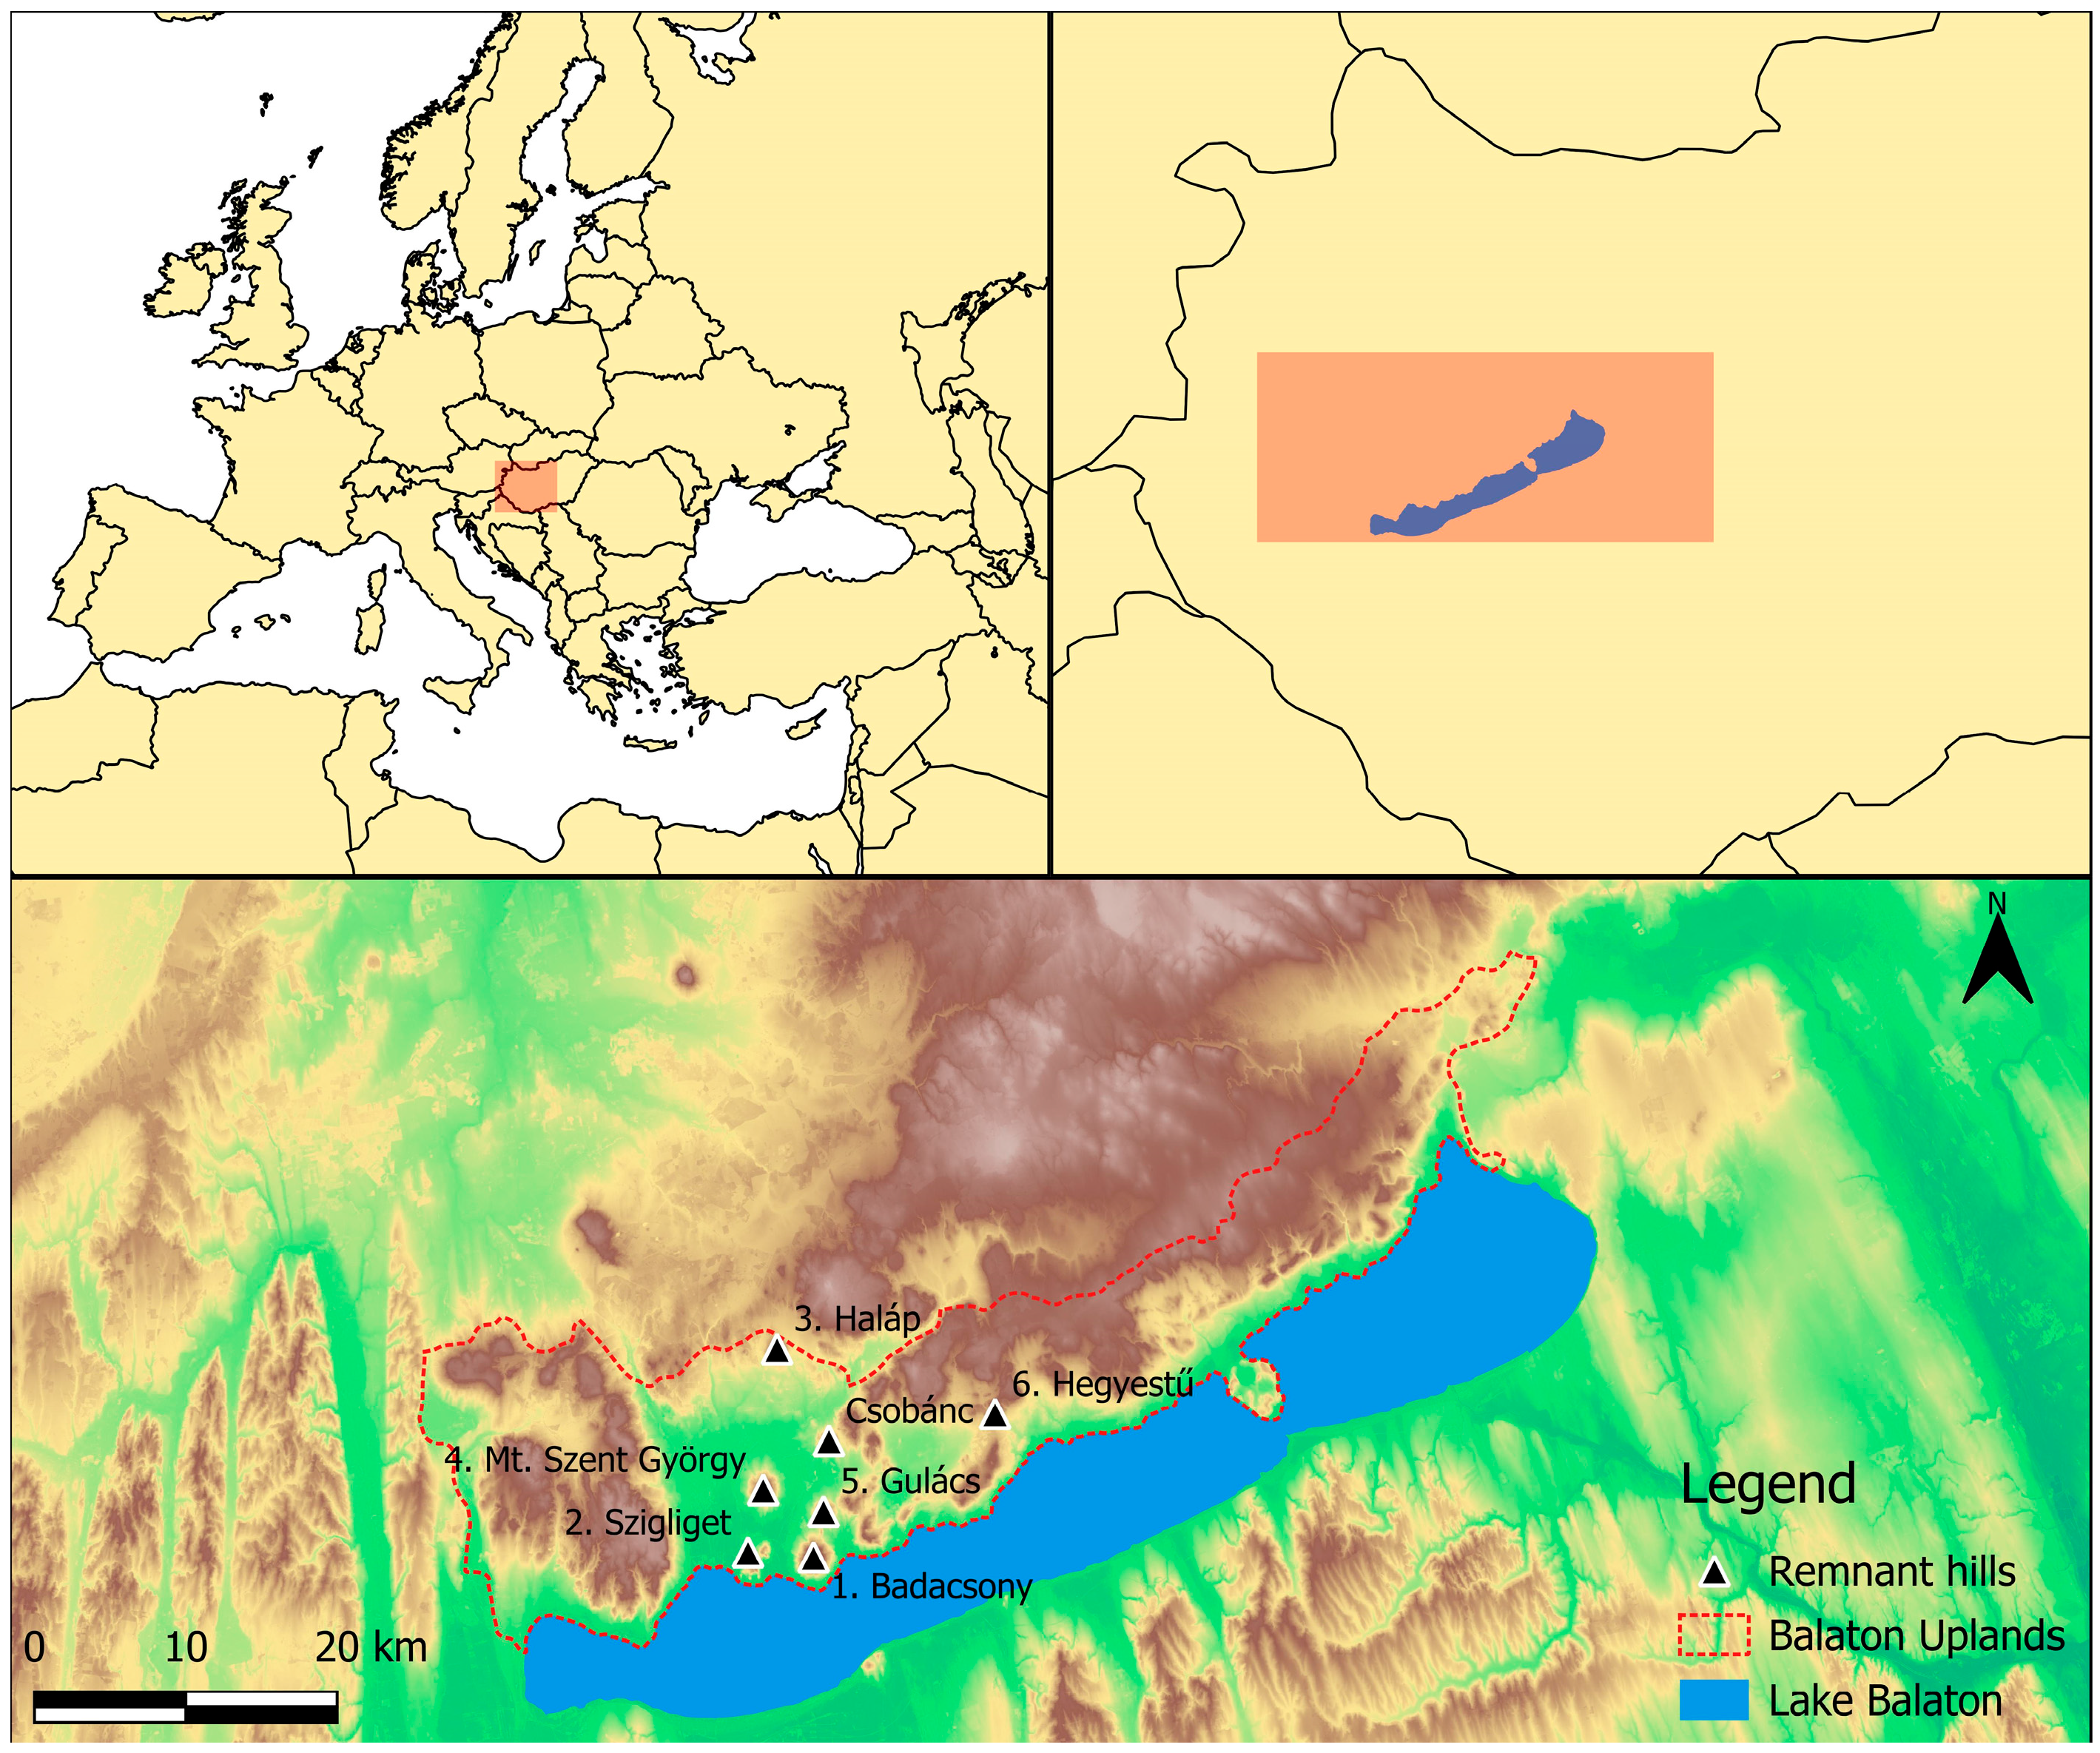
Figure 1.
Study area used for spatial orientation task.
Figure 1.
Study area used for spatial orientation task.
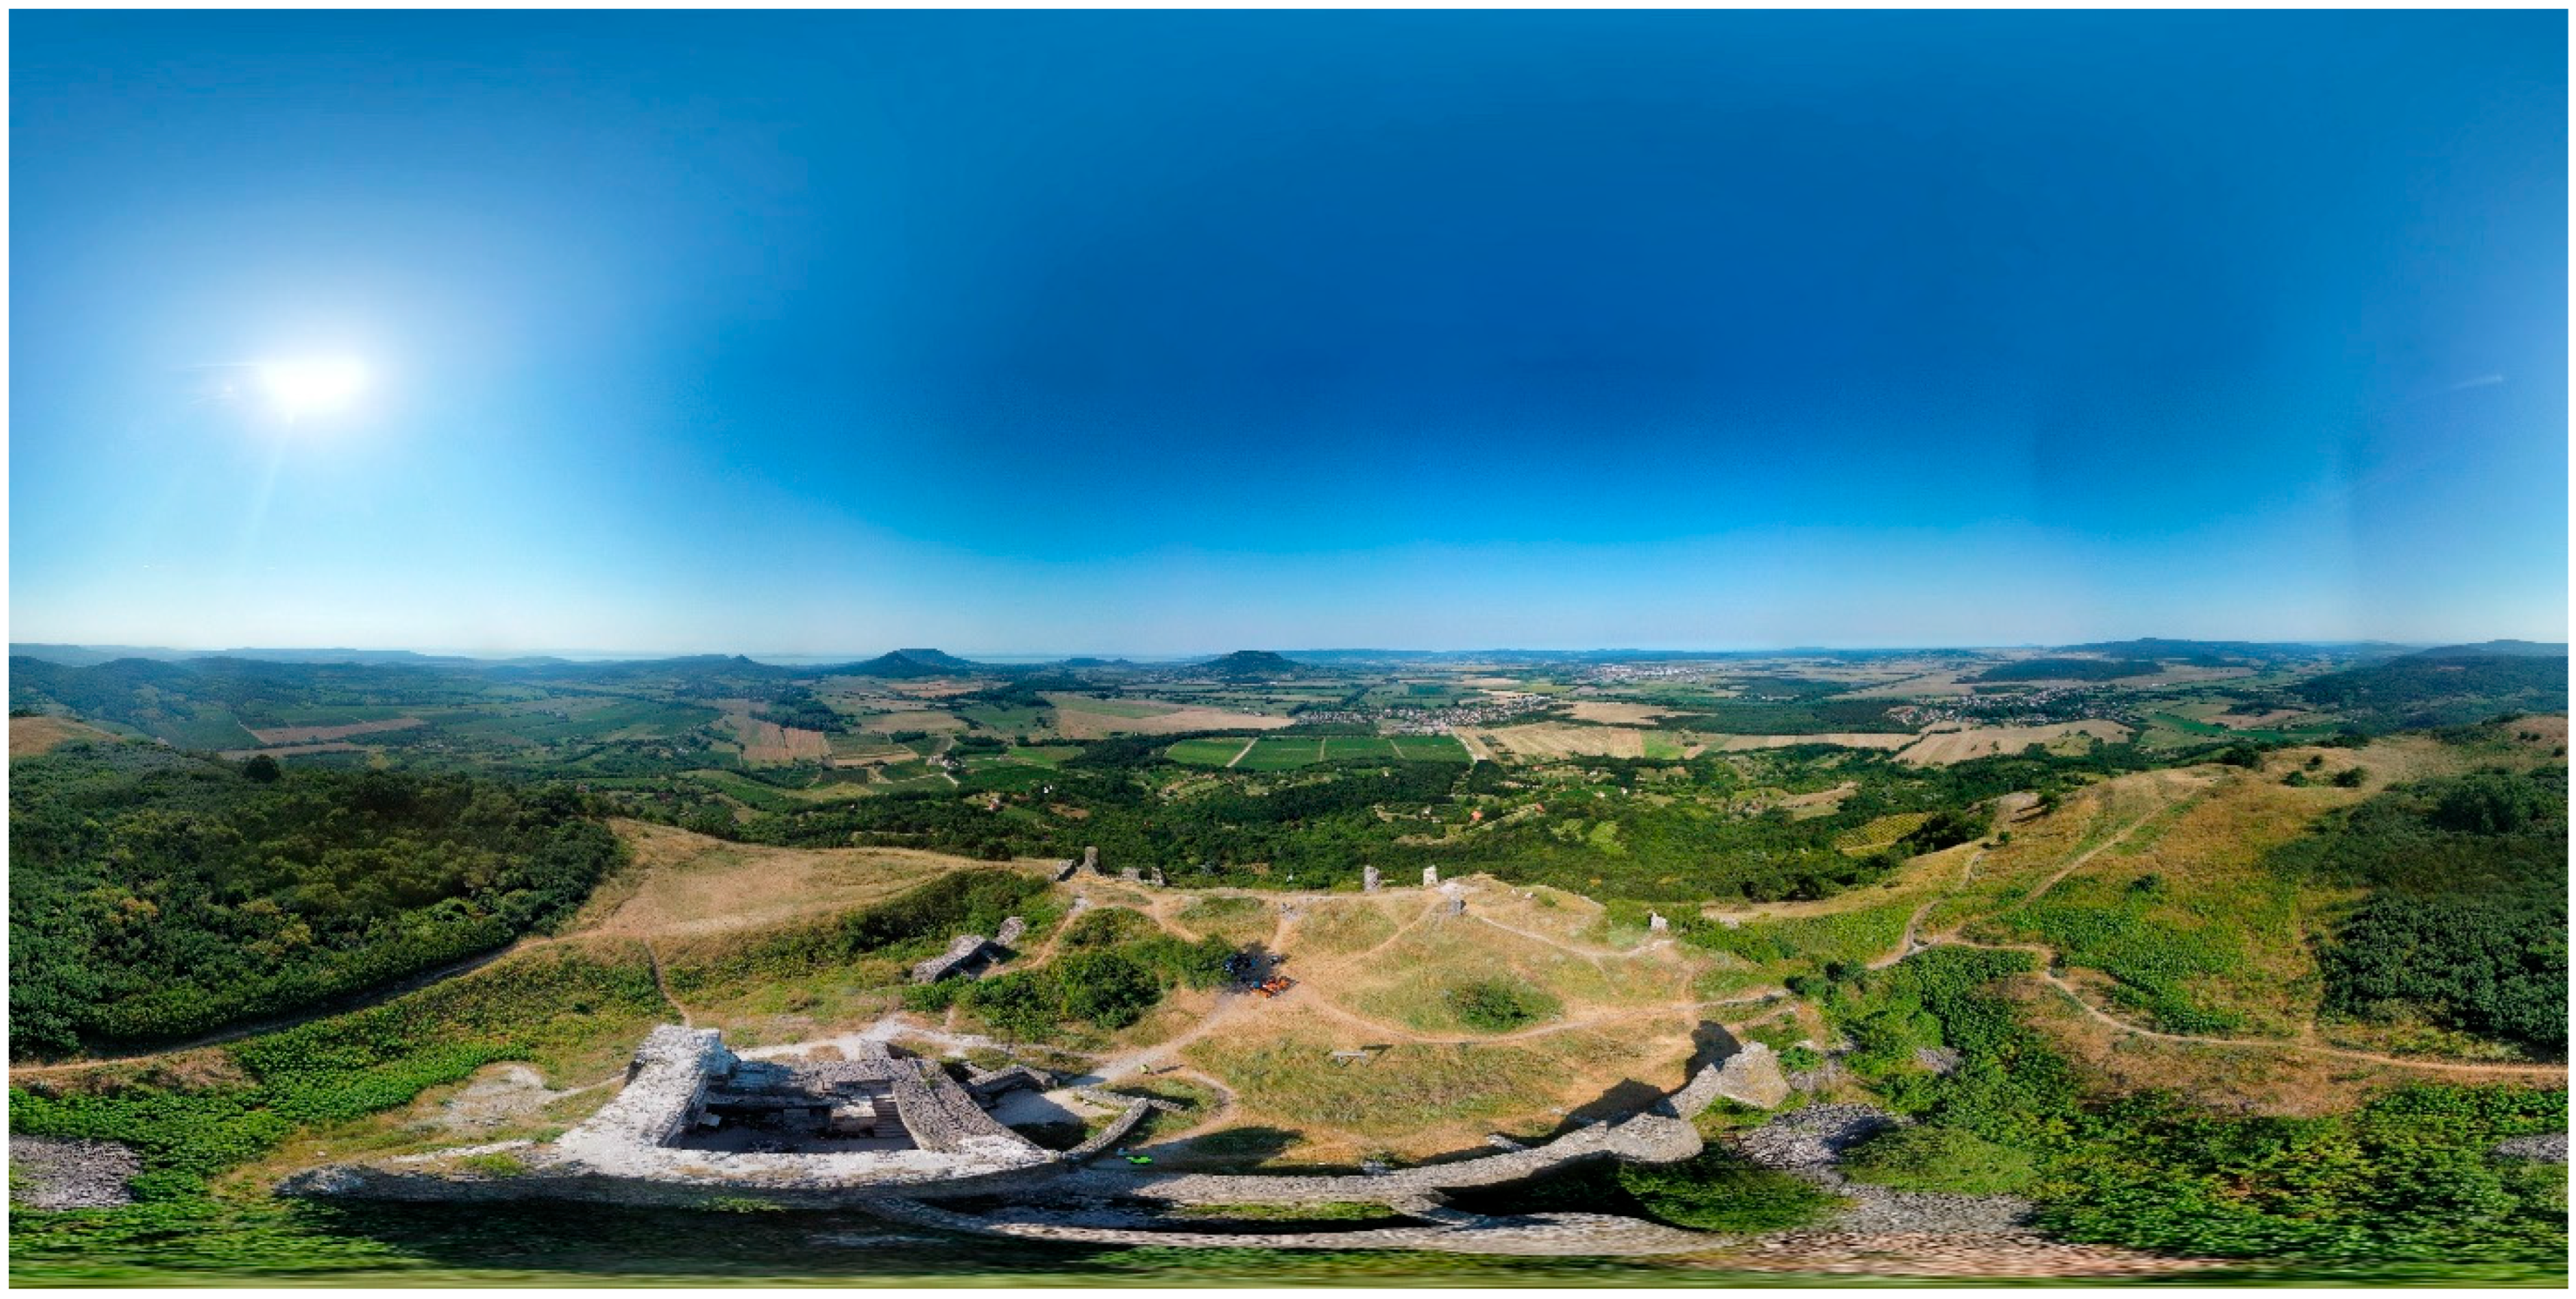
Figure 2.
Panoramic image taken with a DJI Mini 2 drone in Csobánc, used for spatial orientation tasks.
Figure 2.
Panoramic image taken with a DJI Mini 2 drone in Csobánc, used for spatial orientation tasks.
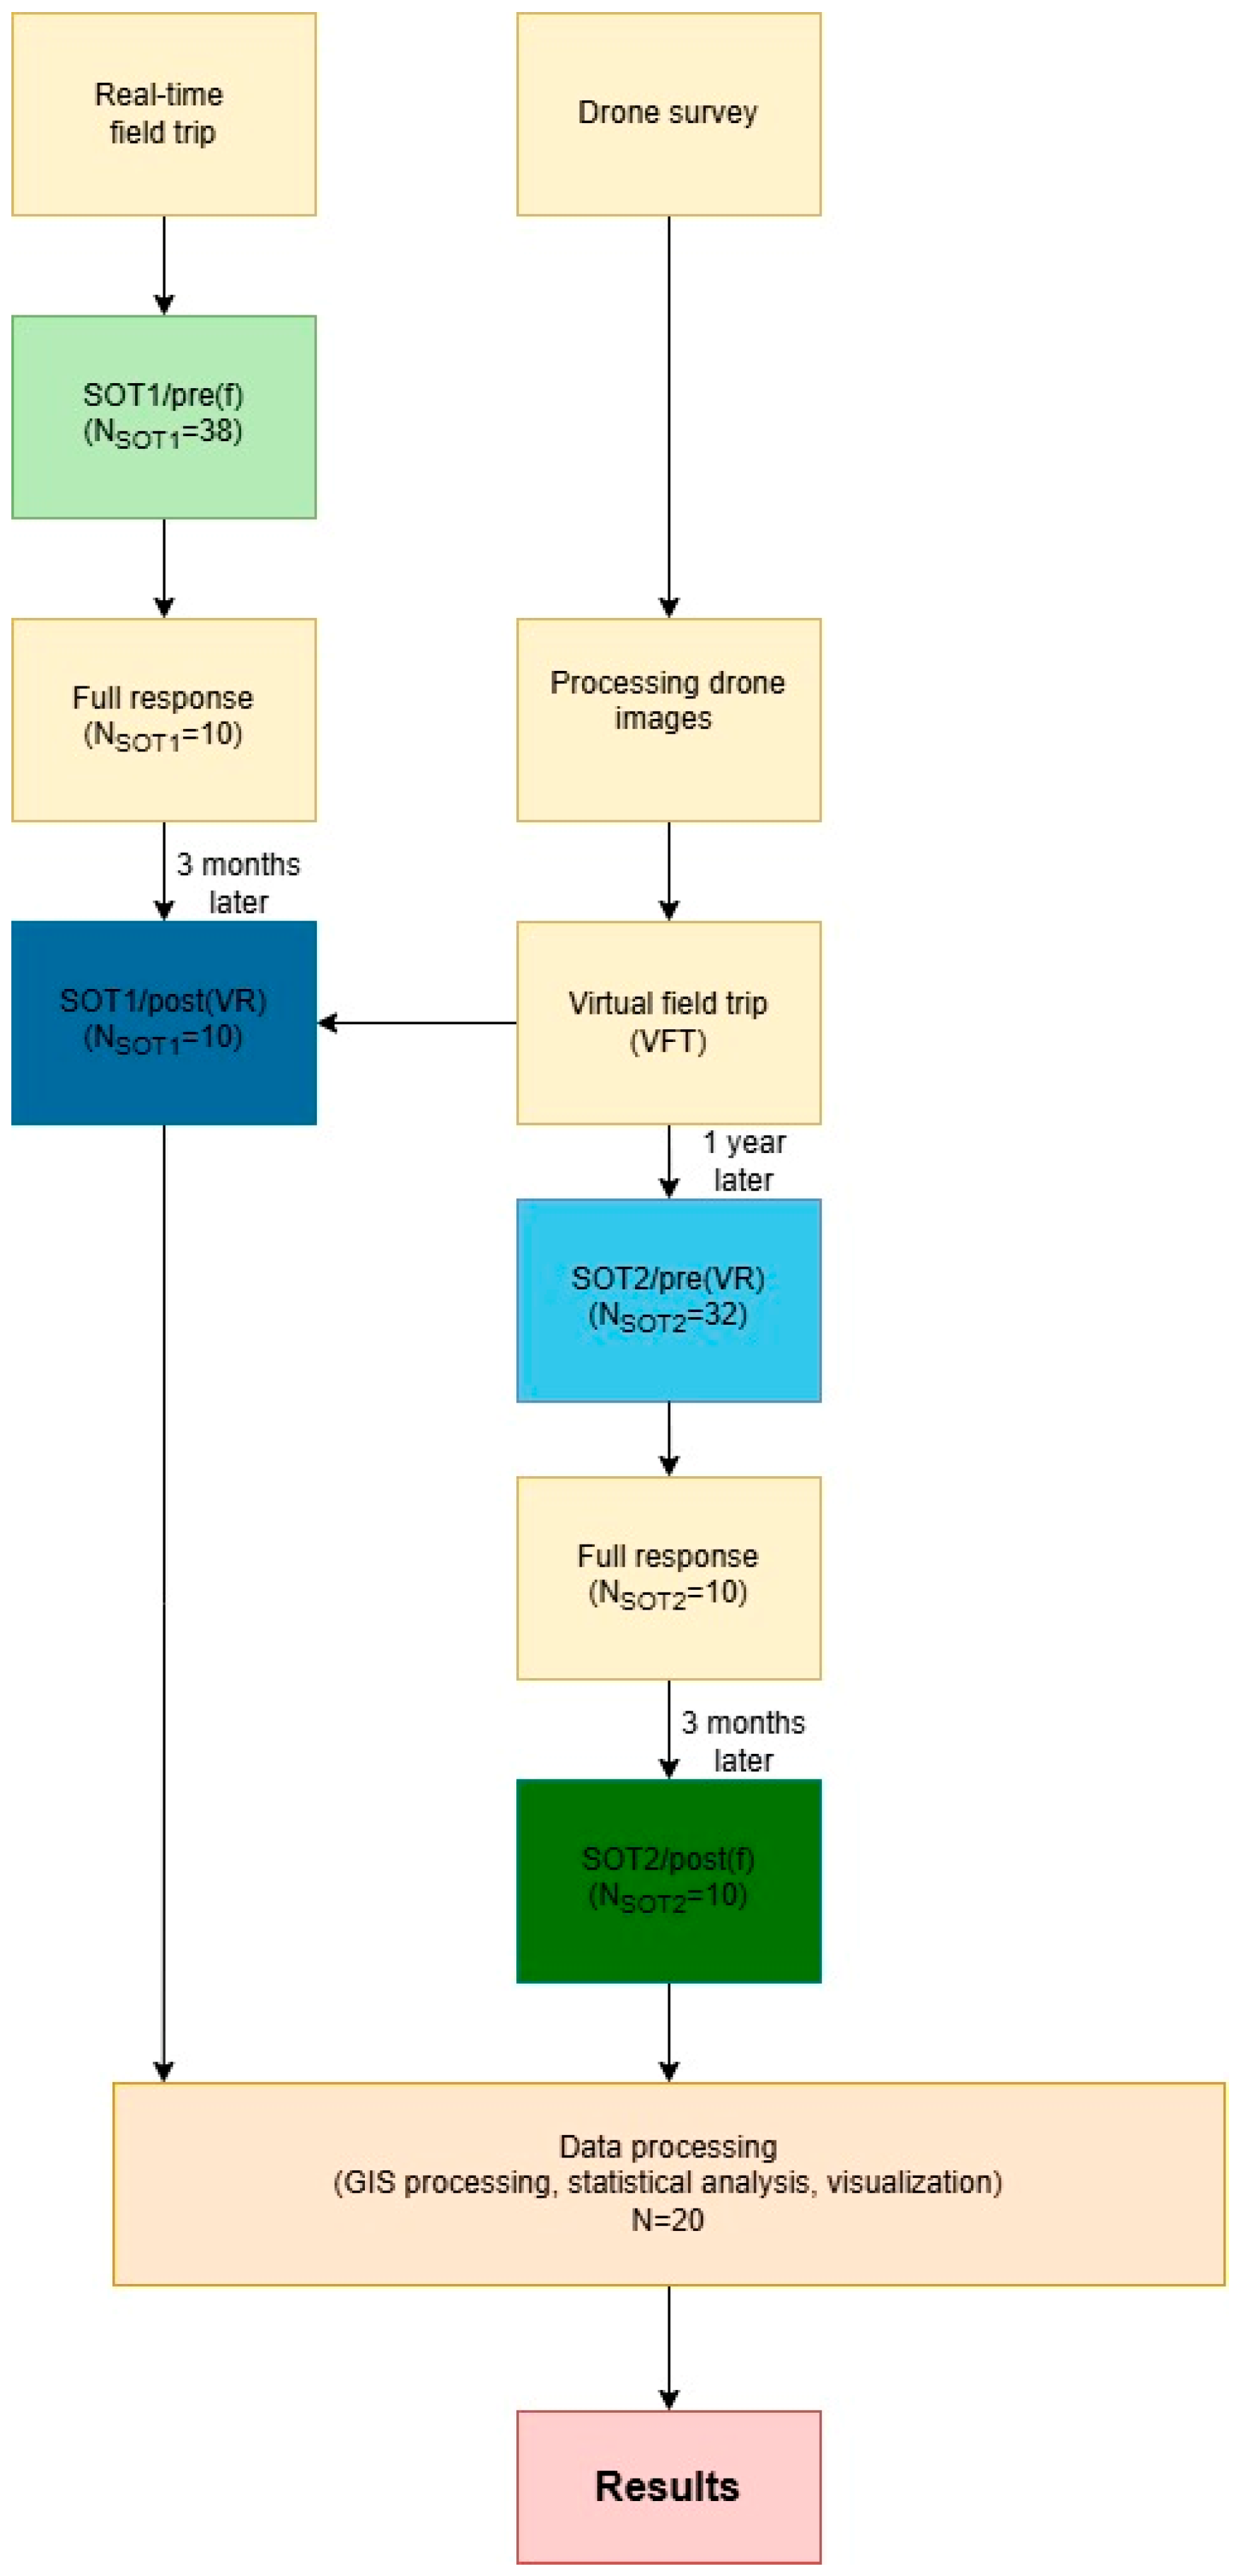
Figure 3.
Flowchart of the experimental design and pedagogical sequence, illustrating the longitudinal crossover methodology between real-time and virtual field trips.
Figure 3.
Flowchart of the experimental design and pedagogical sequence, illustrating the longitudinal crossover methodology between real-time and virtual field trips.
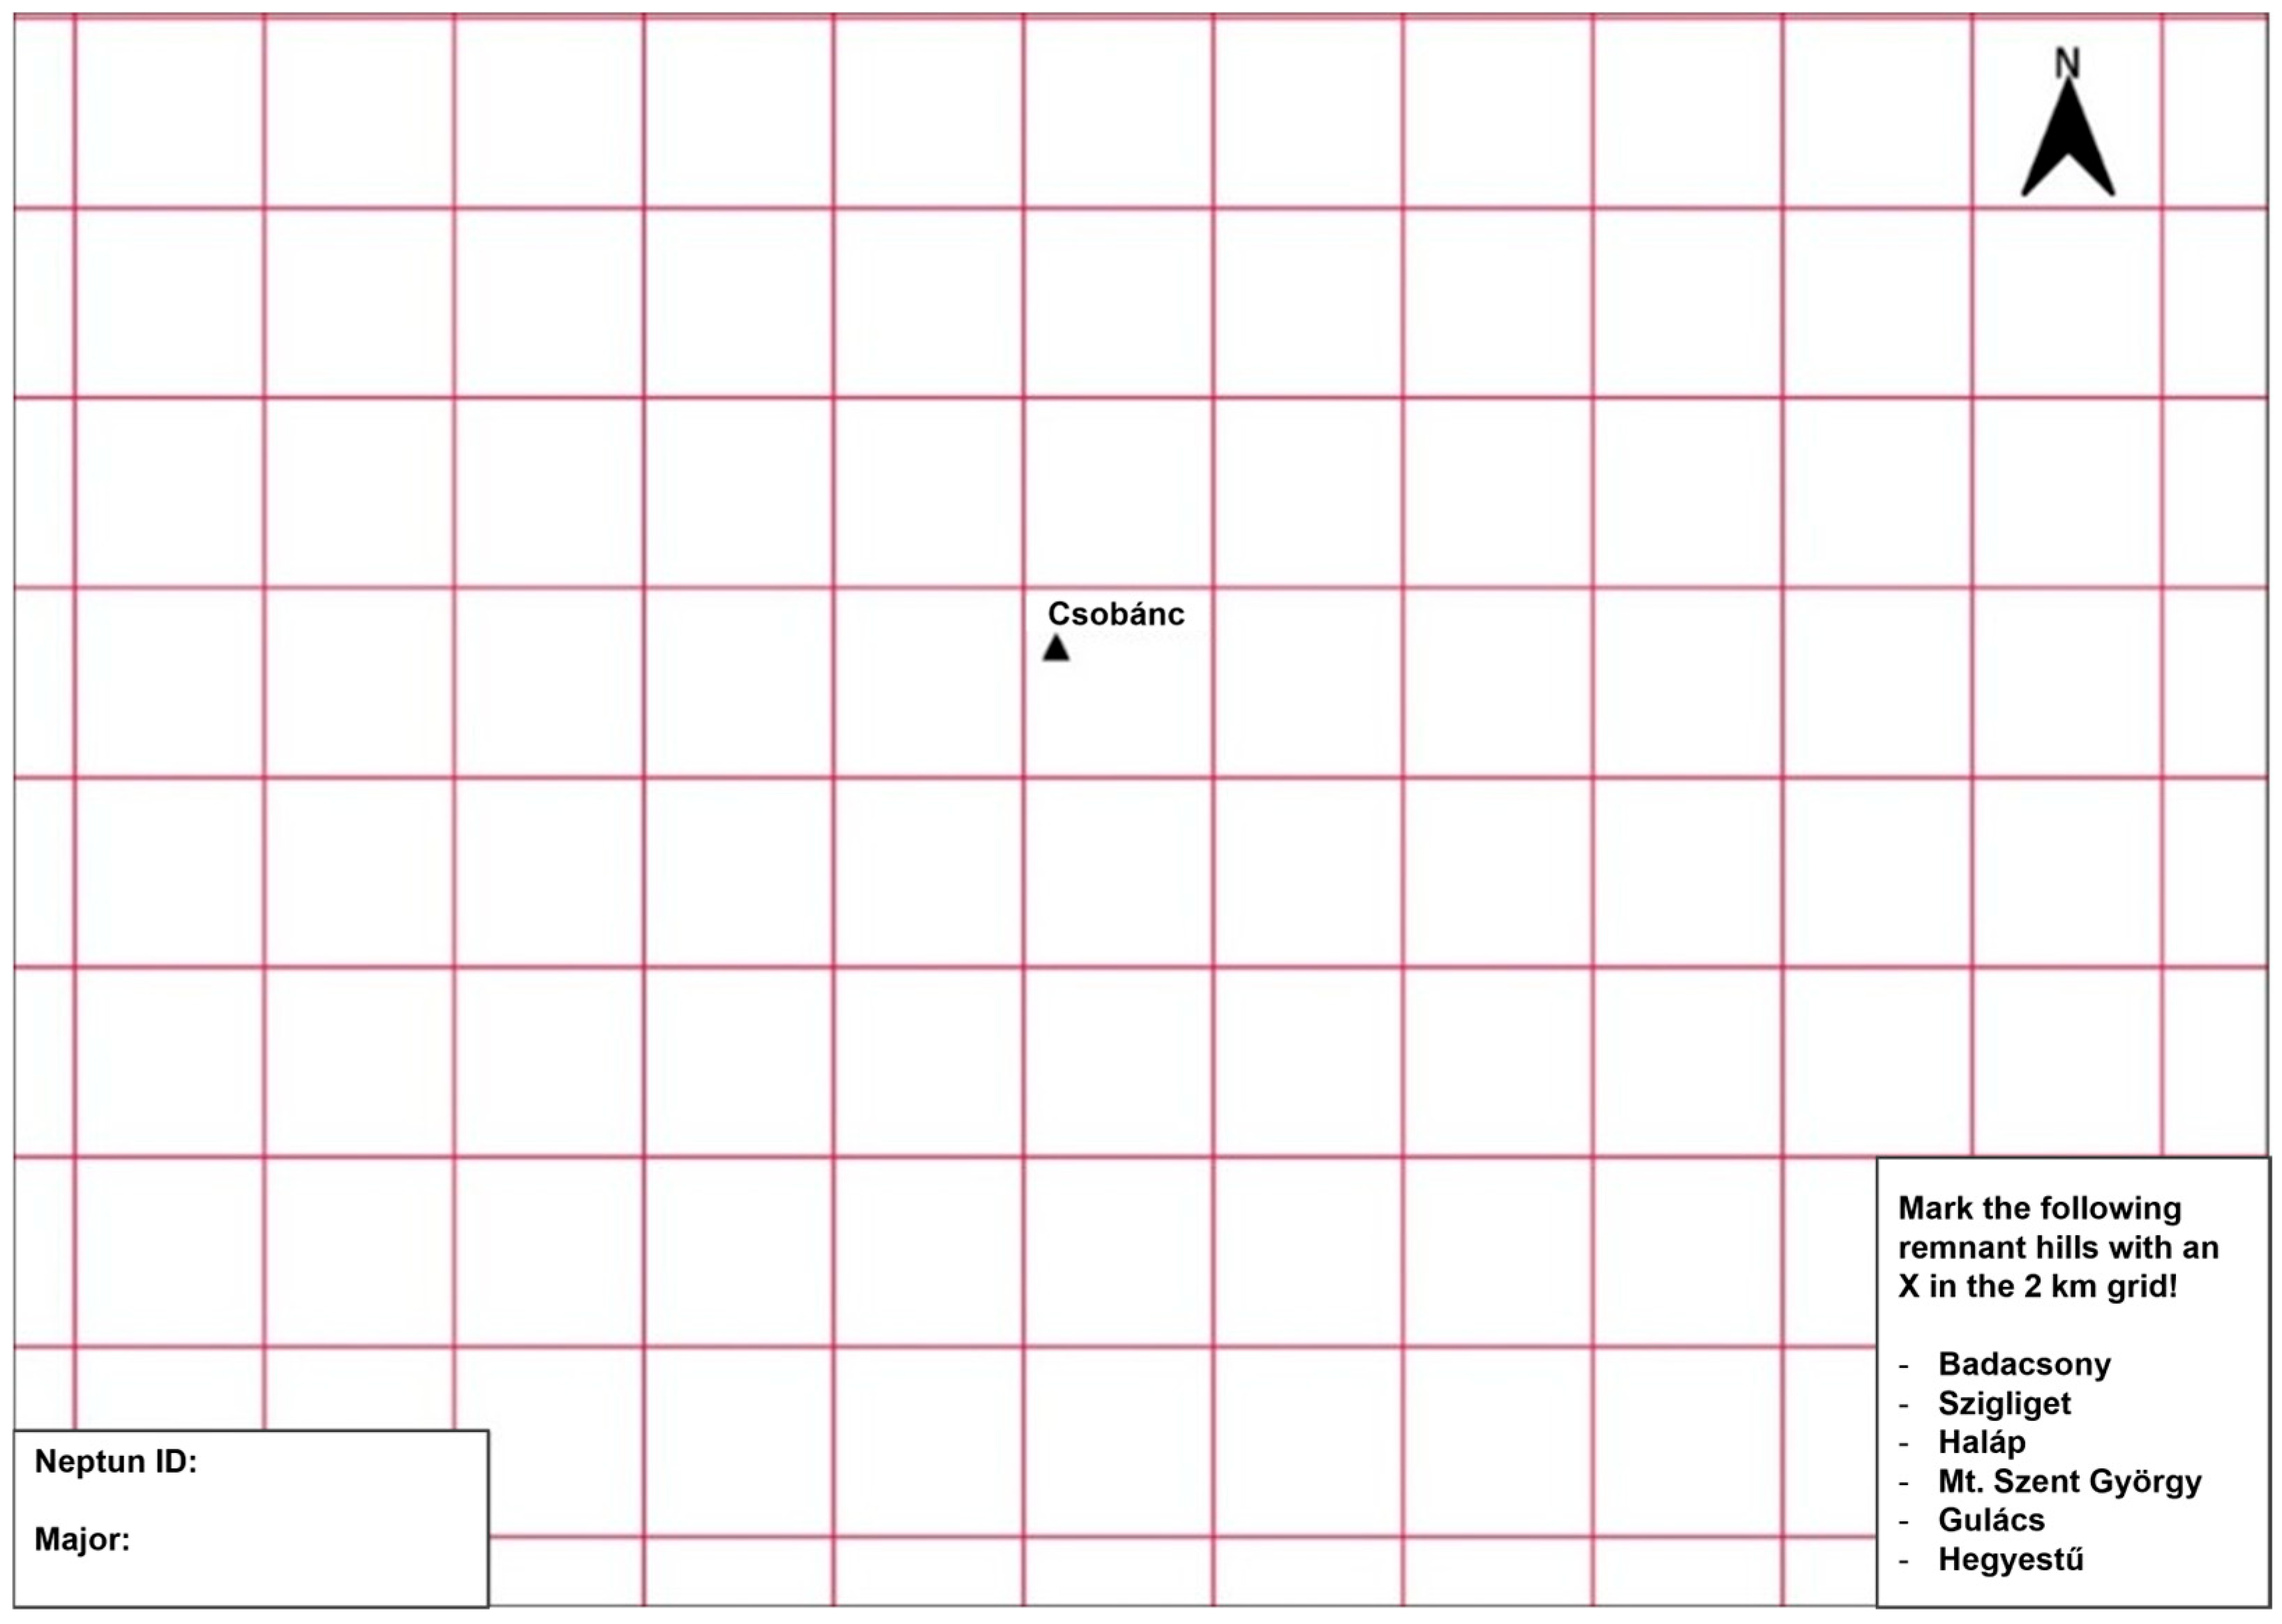
Figure 4.
Blank map divided into 2 × 2 km grid with Csobánc marked as the viewpoint.
Figure 4.
Blank map divided into 2 × 2 km grid with Csobánc marked as the viewpoint.
Figure 5.
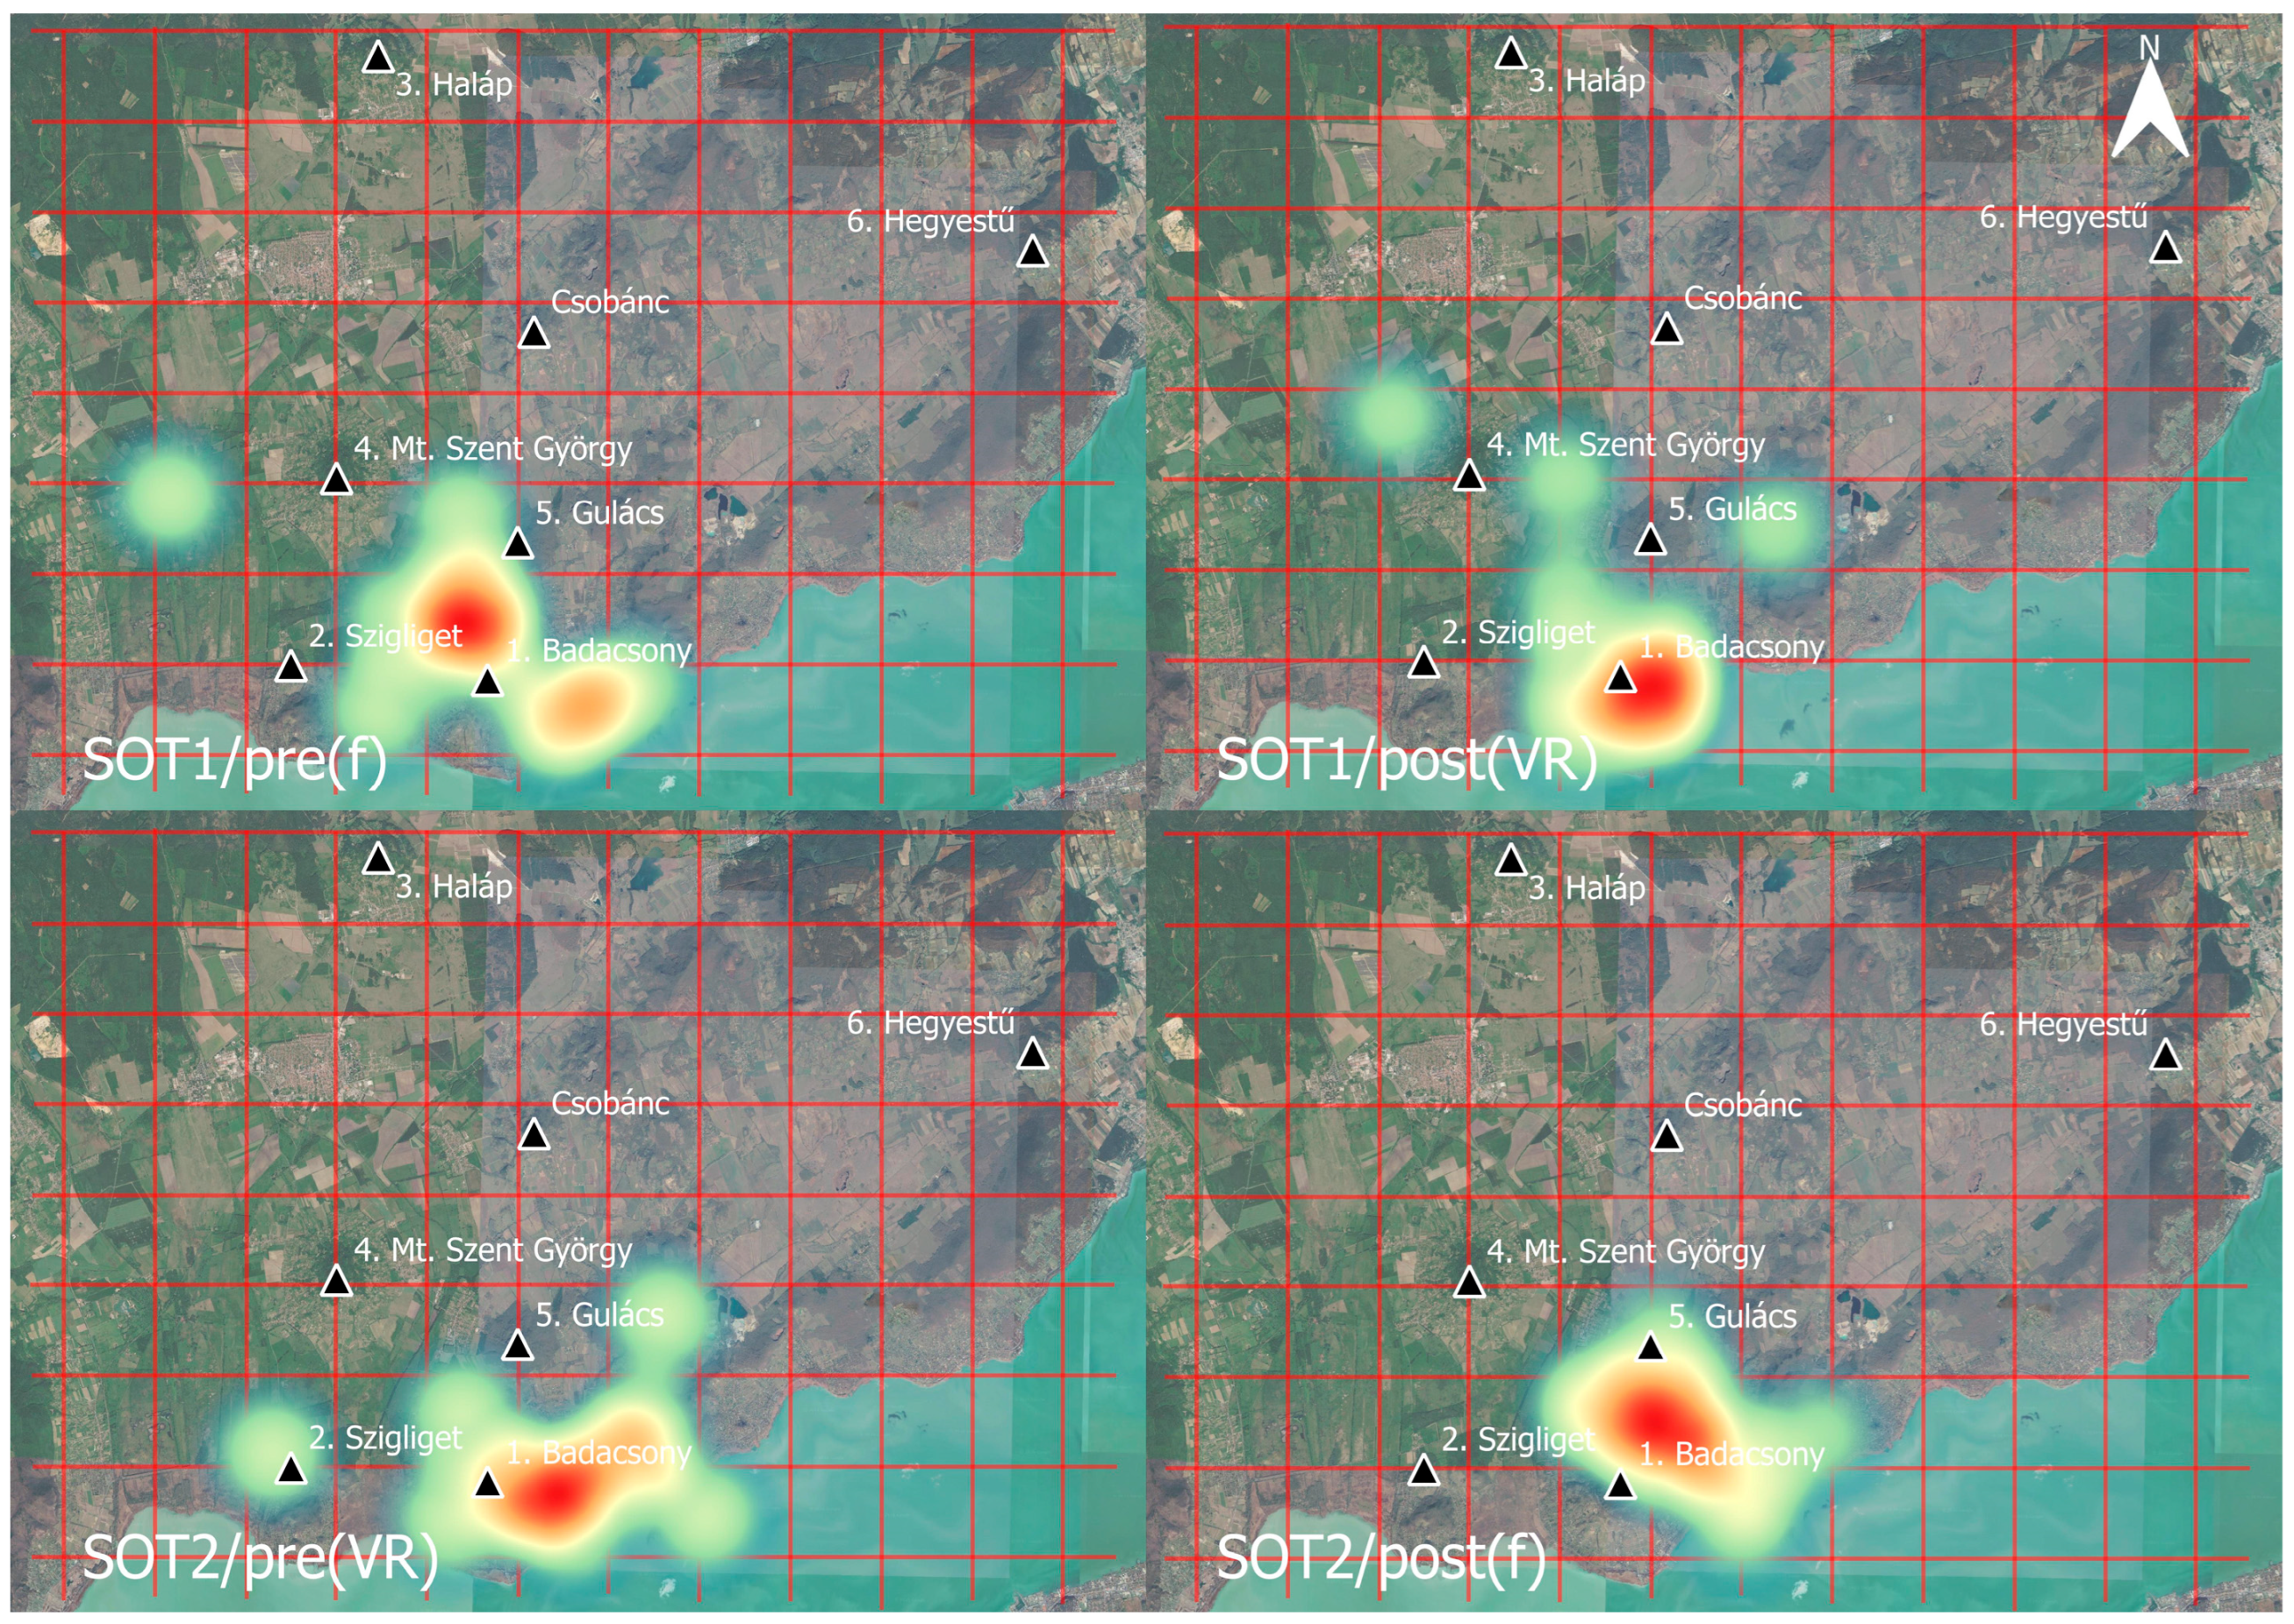
Comparative heatmaps of student-marked locations for Badacsony. The maps illustrate the spatial distribution and point density across the two experimental sequences: SOT1 (field pre-test vs. VR post-test) and SOT2 (VR pre-test vs. field post-test). Brighter (red) areas indicate higher point density, reflecting the most common student estimations relative to the actual landmarks (black triangles). (SOT: spatial orientation task, f: field; VR: virtual reality).
Figure 5.
Comparative heatmaps of student-marked locations for Badacsony. The maps illustrate the spatial distribution and point density across the two experimental sequences: SOT1 (field pre-test vs. VR post-test) and SOT2 (VR pre-test vs. field post-test). Brighter (red) areas indicate higher point density, reflecting the most common student estimations relative to the actual landmarks (black triangles). (SOT: spatial orientation task, f: field; VR: virtual reality).
Figure 6.
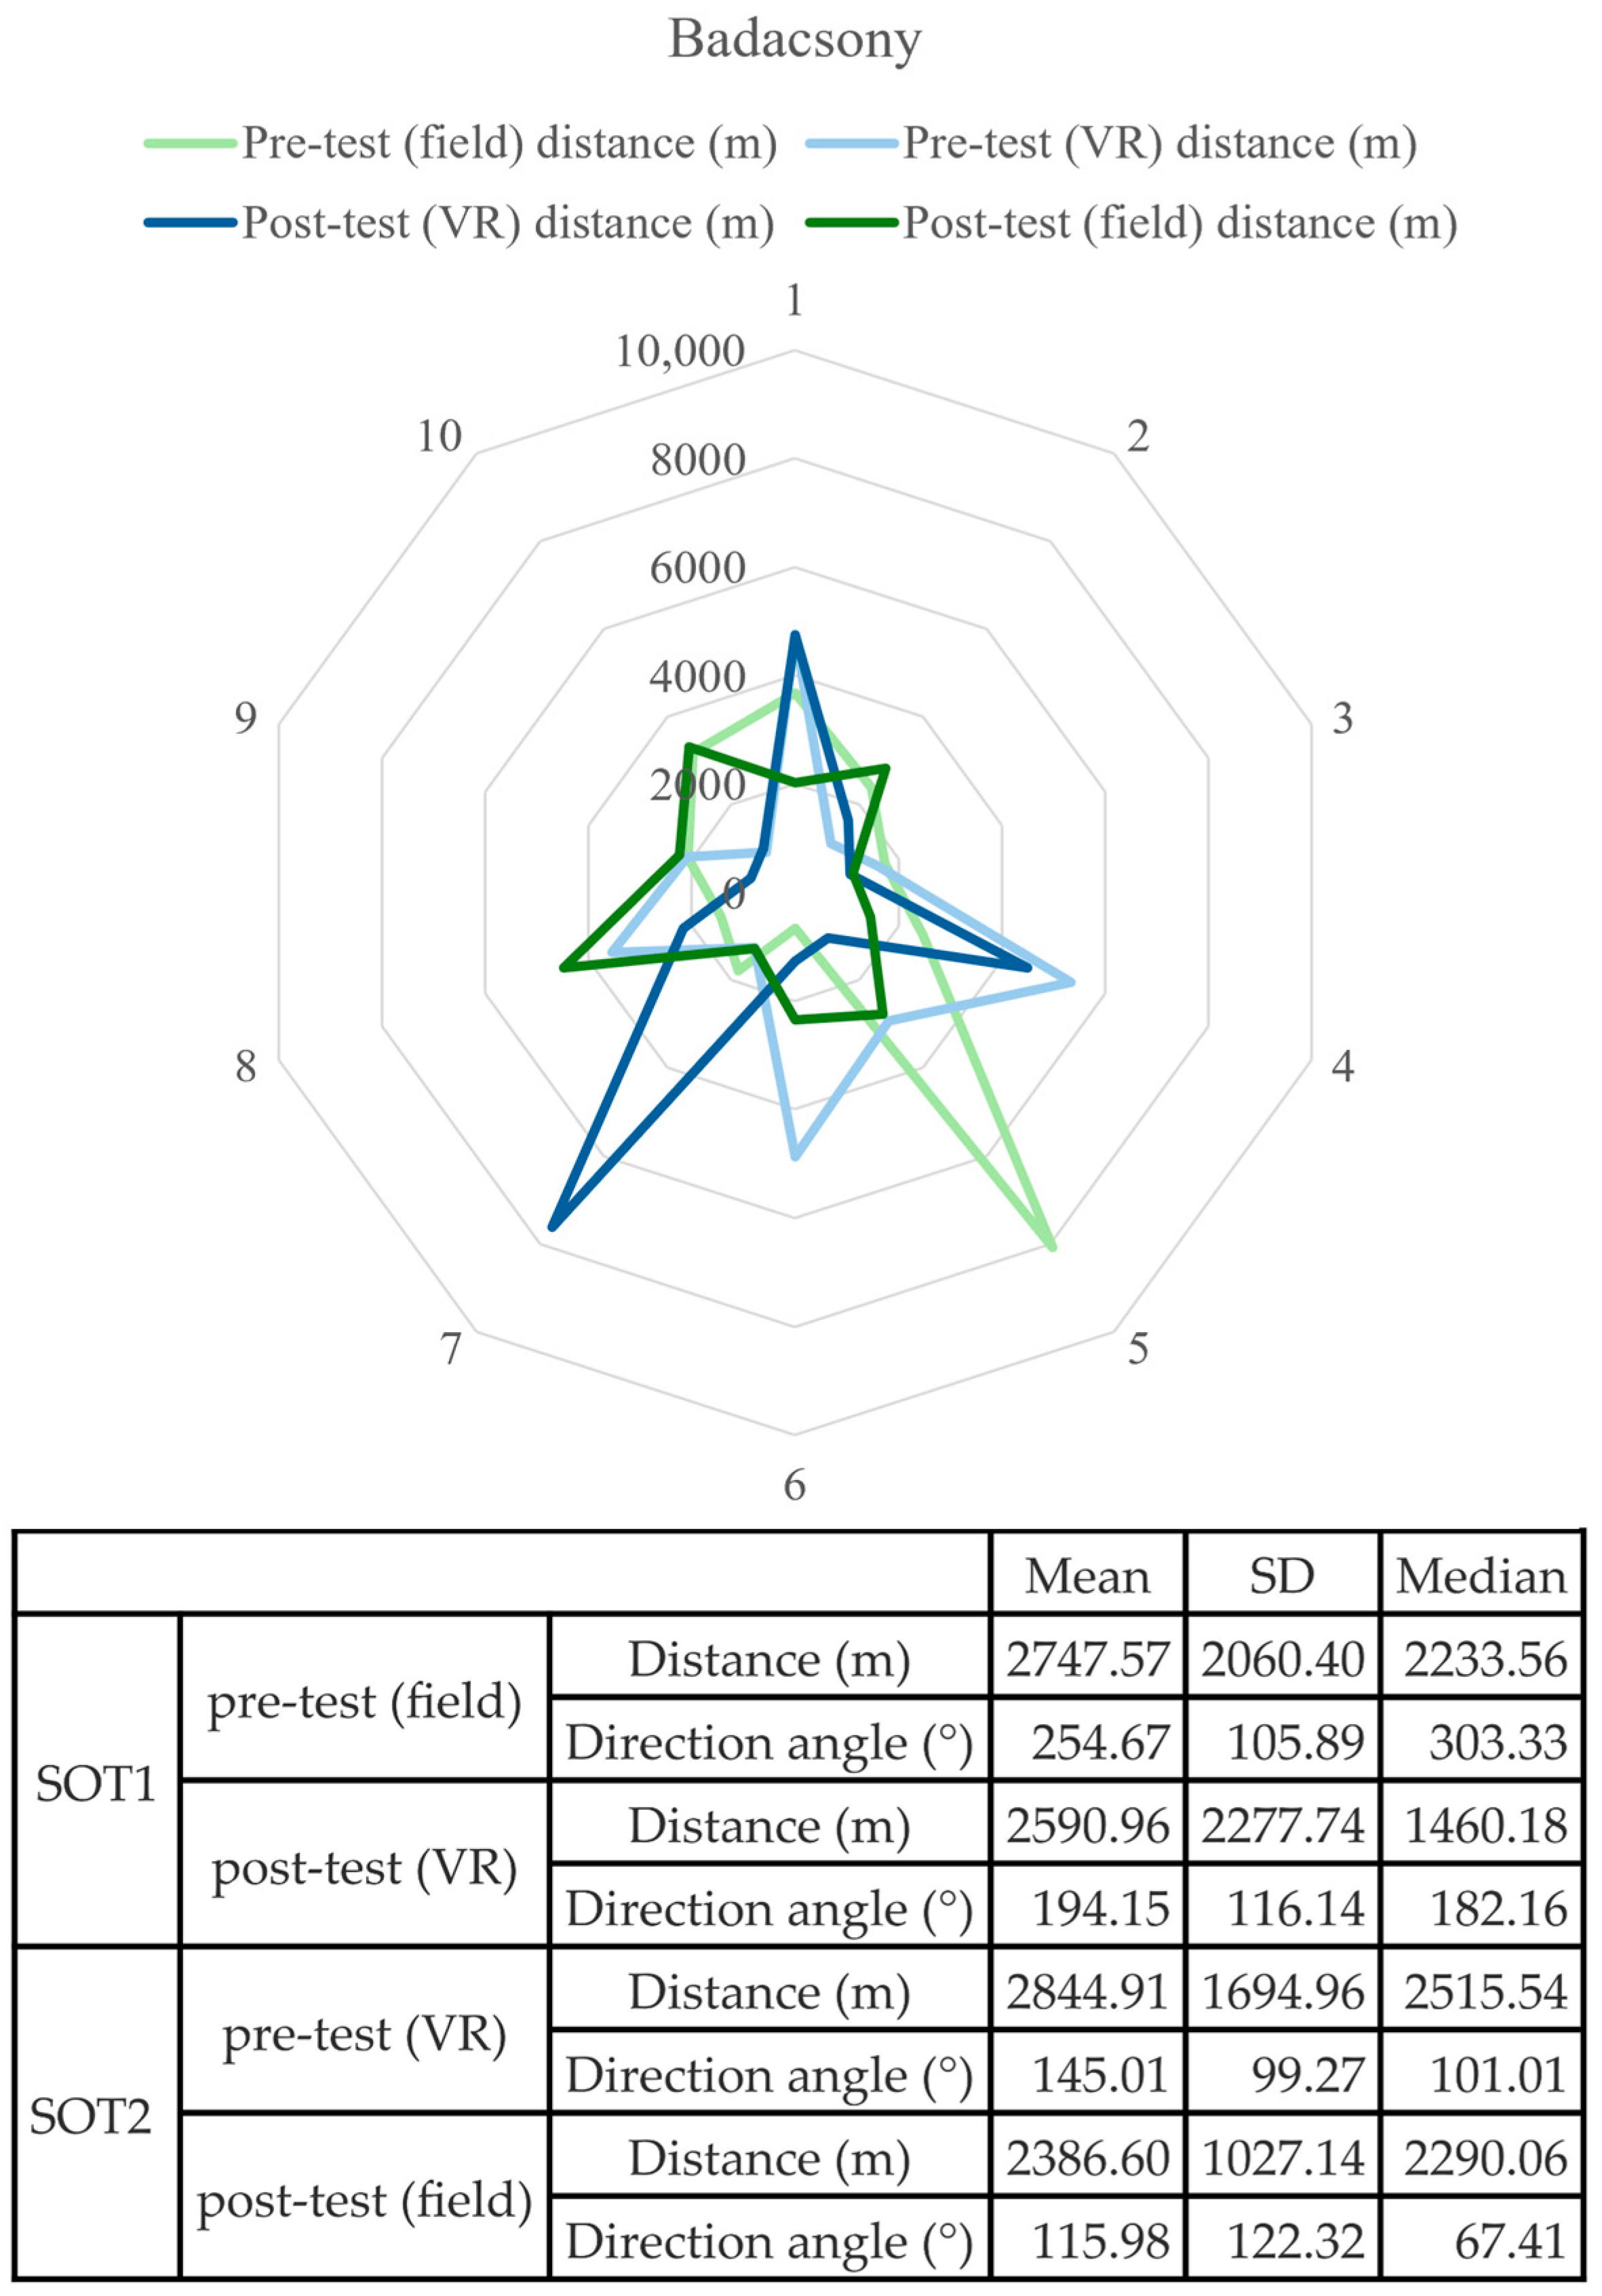
Spatial distribution of individual student responses (radar chart) and corresponding descriptive statistics for distance and direction angle estimations regarding Badacsony (SOT1: Group 1, Field–VR; SOT2: Group 2, VR–Field).
Figure 6.
Spatial distribution of individual student responses (radar chart) and corresponding descriptive statistics for distance and direction angle estimations regarding Badacsony (SOT1: Group 1, Field–VR; SOT2: Group 2, VR–Field).
Figure 7.
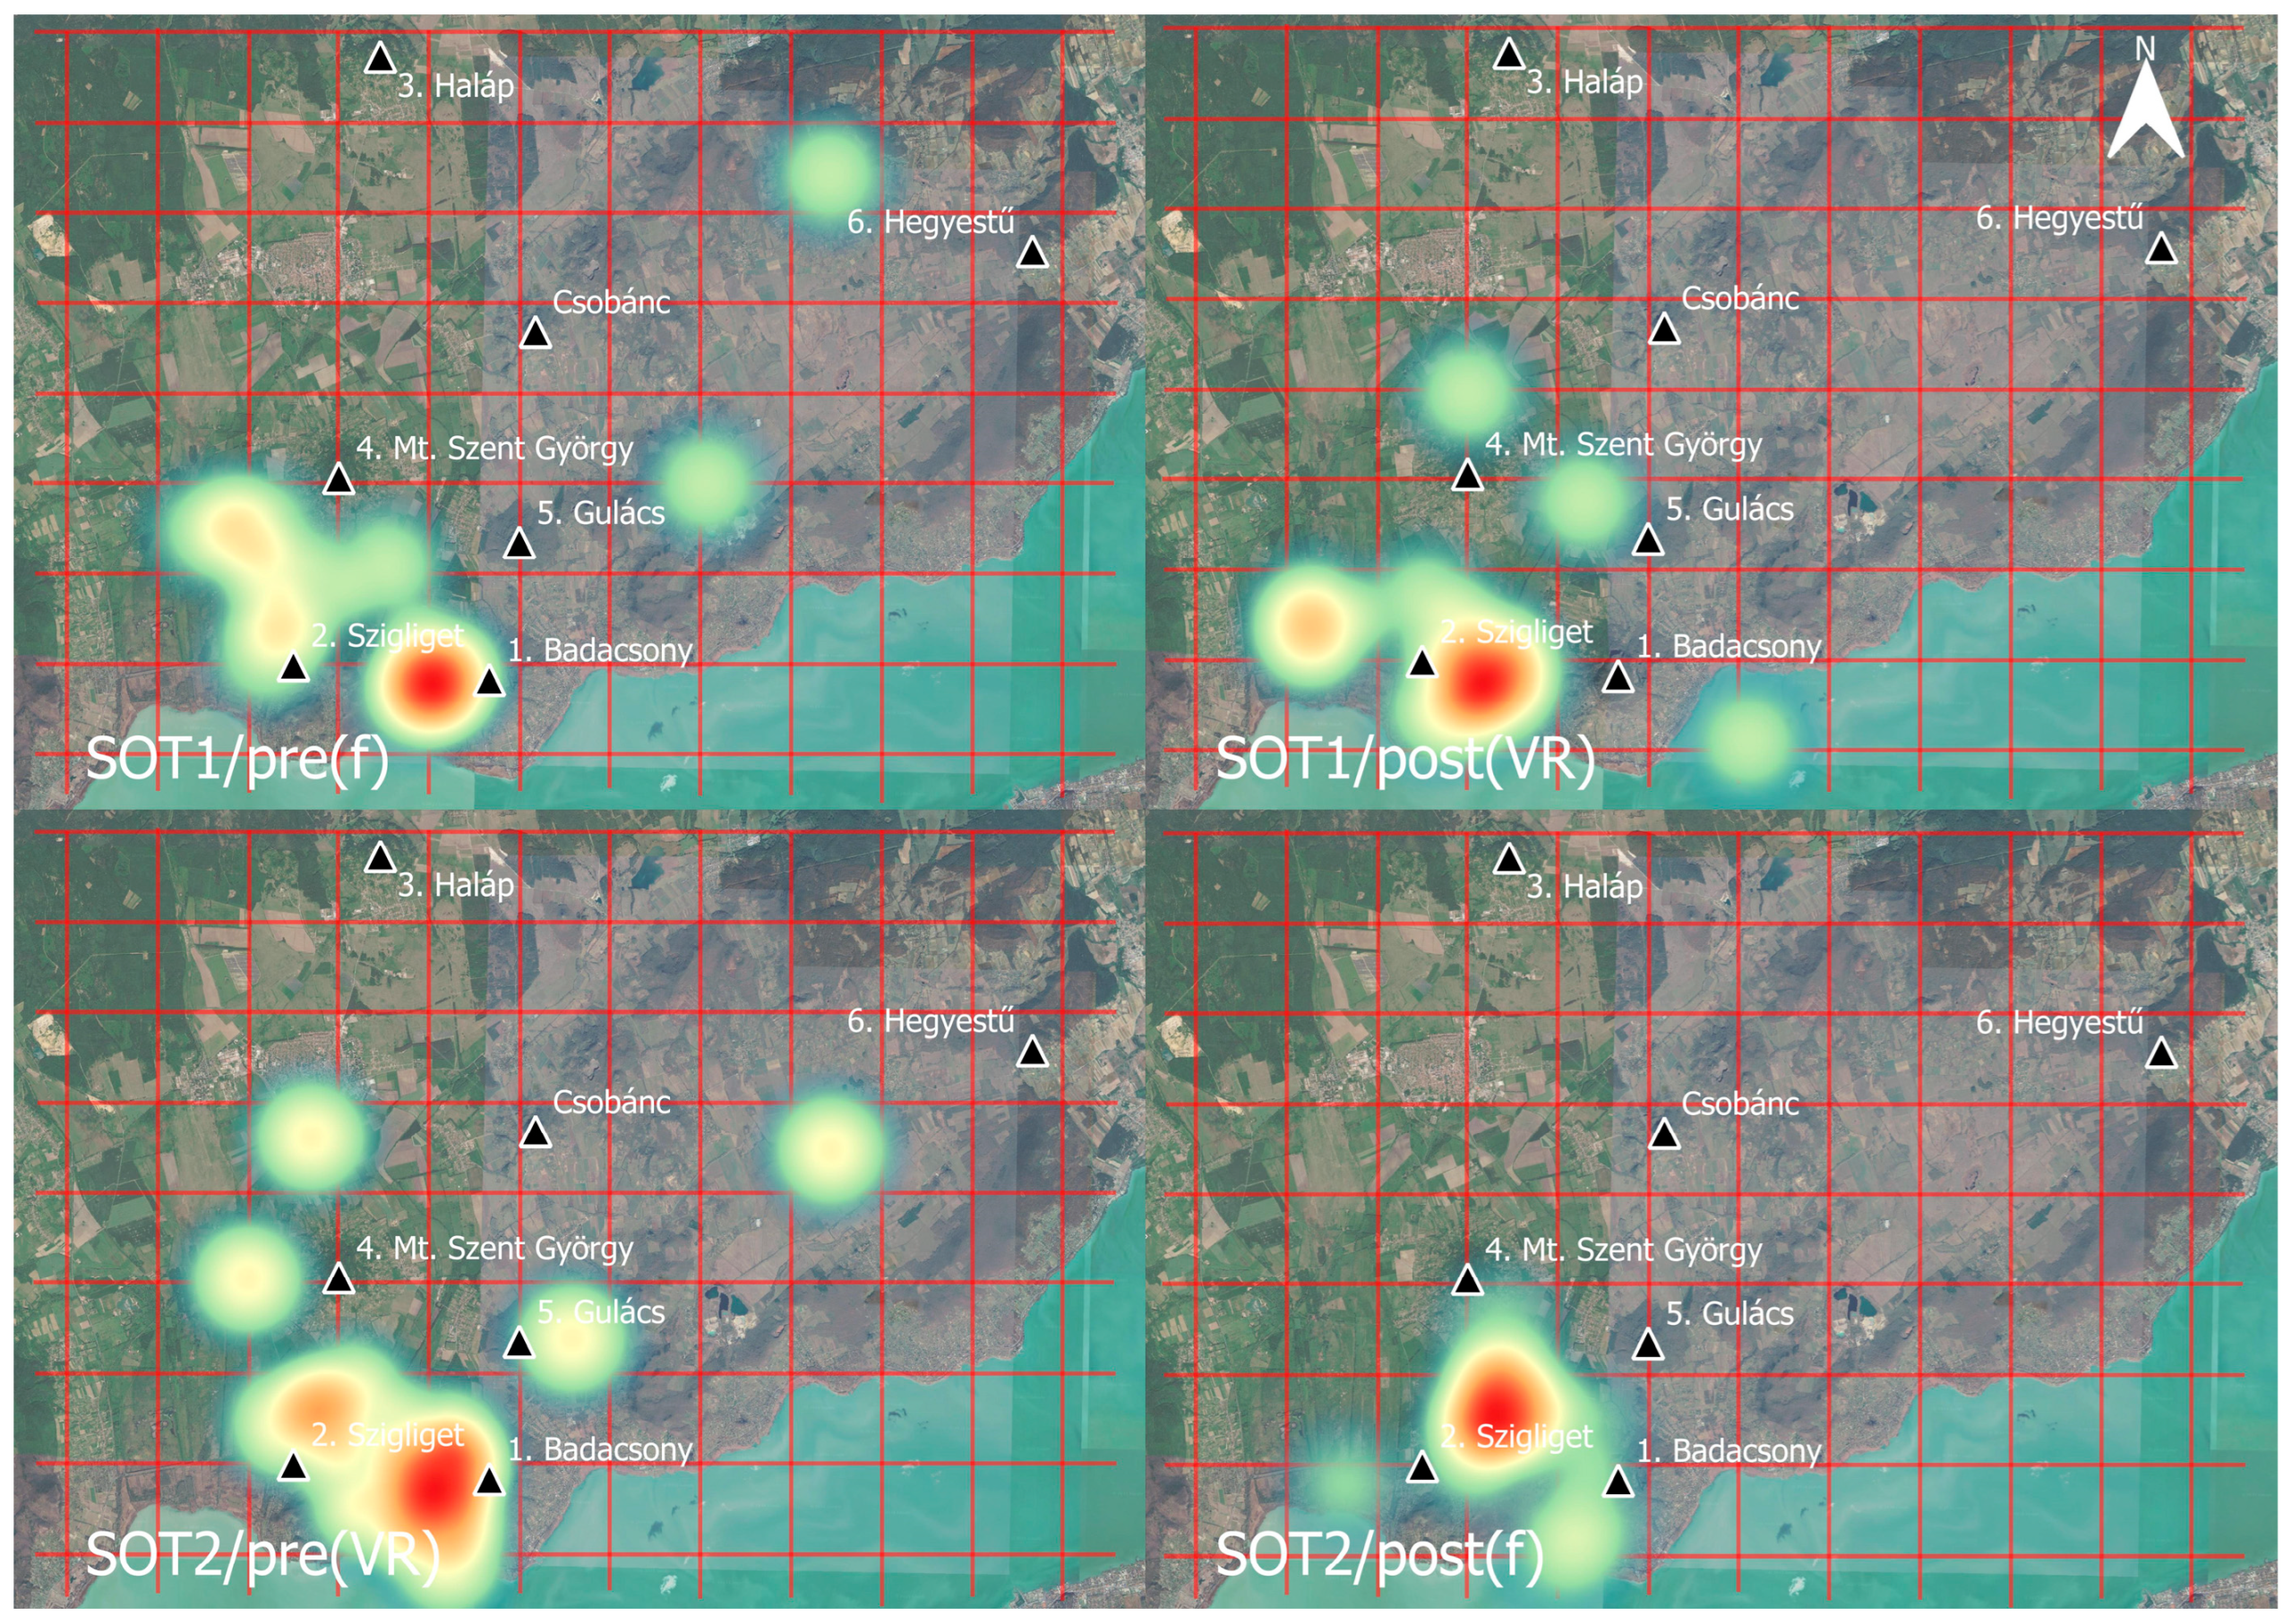
Comparative heatmaps of student-marked locations for Szigliget. The maps illustrate the spatial distribution and point density across the two experimental sequences: SOT1 (field pre-test vs. VR post-test) and SOT2 (VR pre-test vs. field post-test). Brighter (red) areas indicate higher point density, reflecting the most common student estimations relative to the actual landmarks (black triangles). (SOT: spatial orientation task, f: field; VR: virtual reality).
Figure 7.
Comparative heatmaps of student-marked locations for Szigliget. The maps illustrate the spatial distribution and point density across the two experimental sequences: SOT1 (field pre-test vs. VR post-test) and SOT2 (VR pre-test vs. field post-test). Brighter (red) areas indicate higher point density, reflecting the most common student estimations relative to the actual landmarks (black triangles). (SOT: spatial orientation task, f: field; VR: virtual reality).
Figure 8.
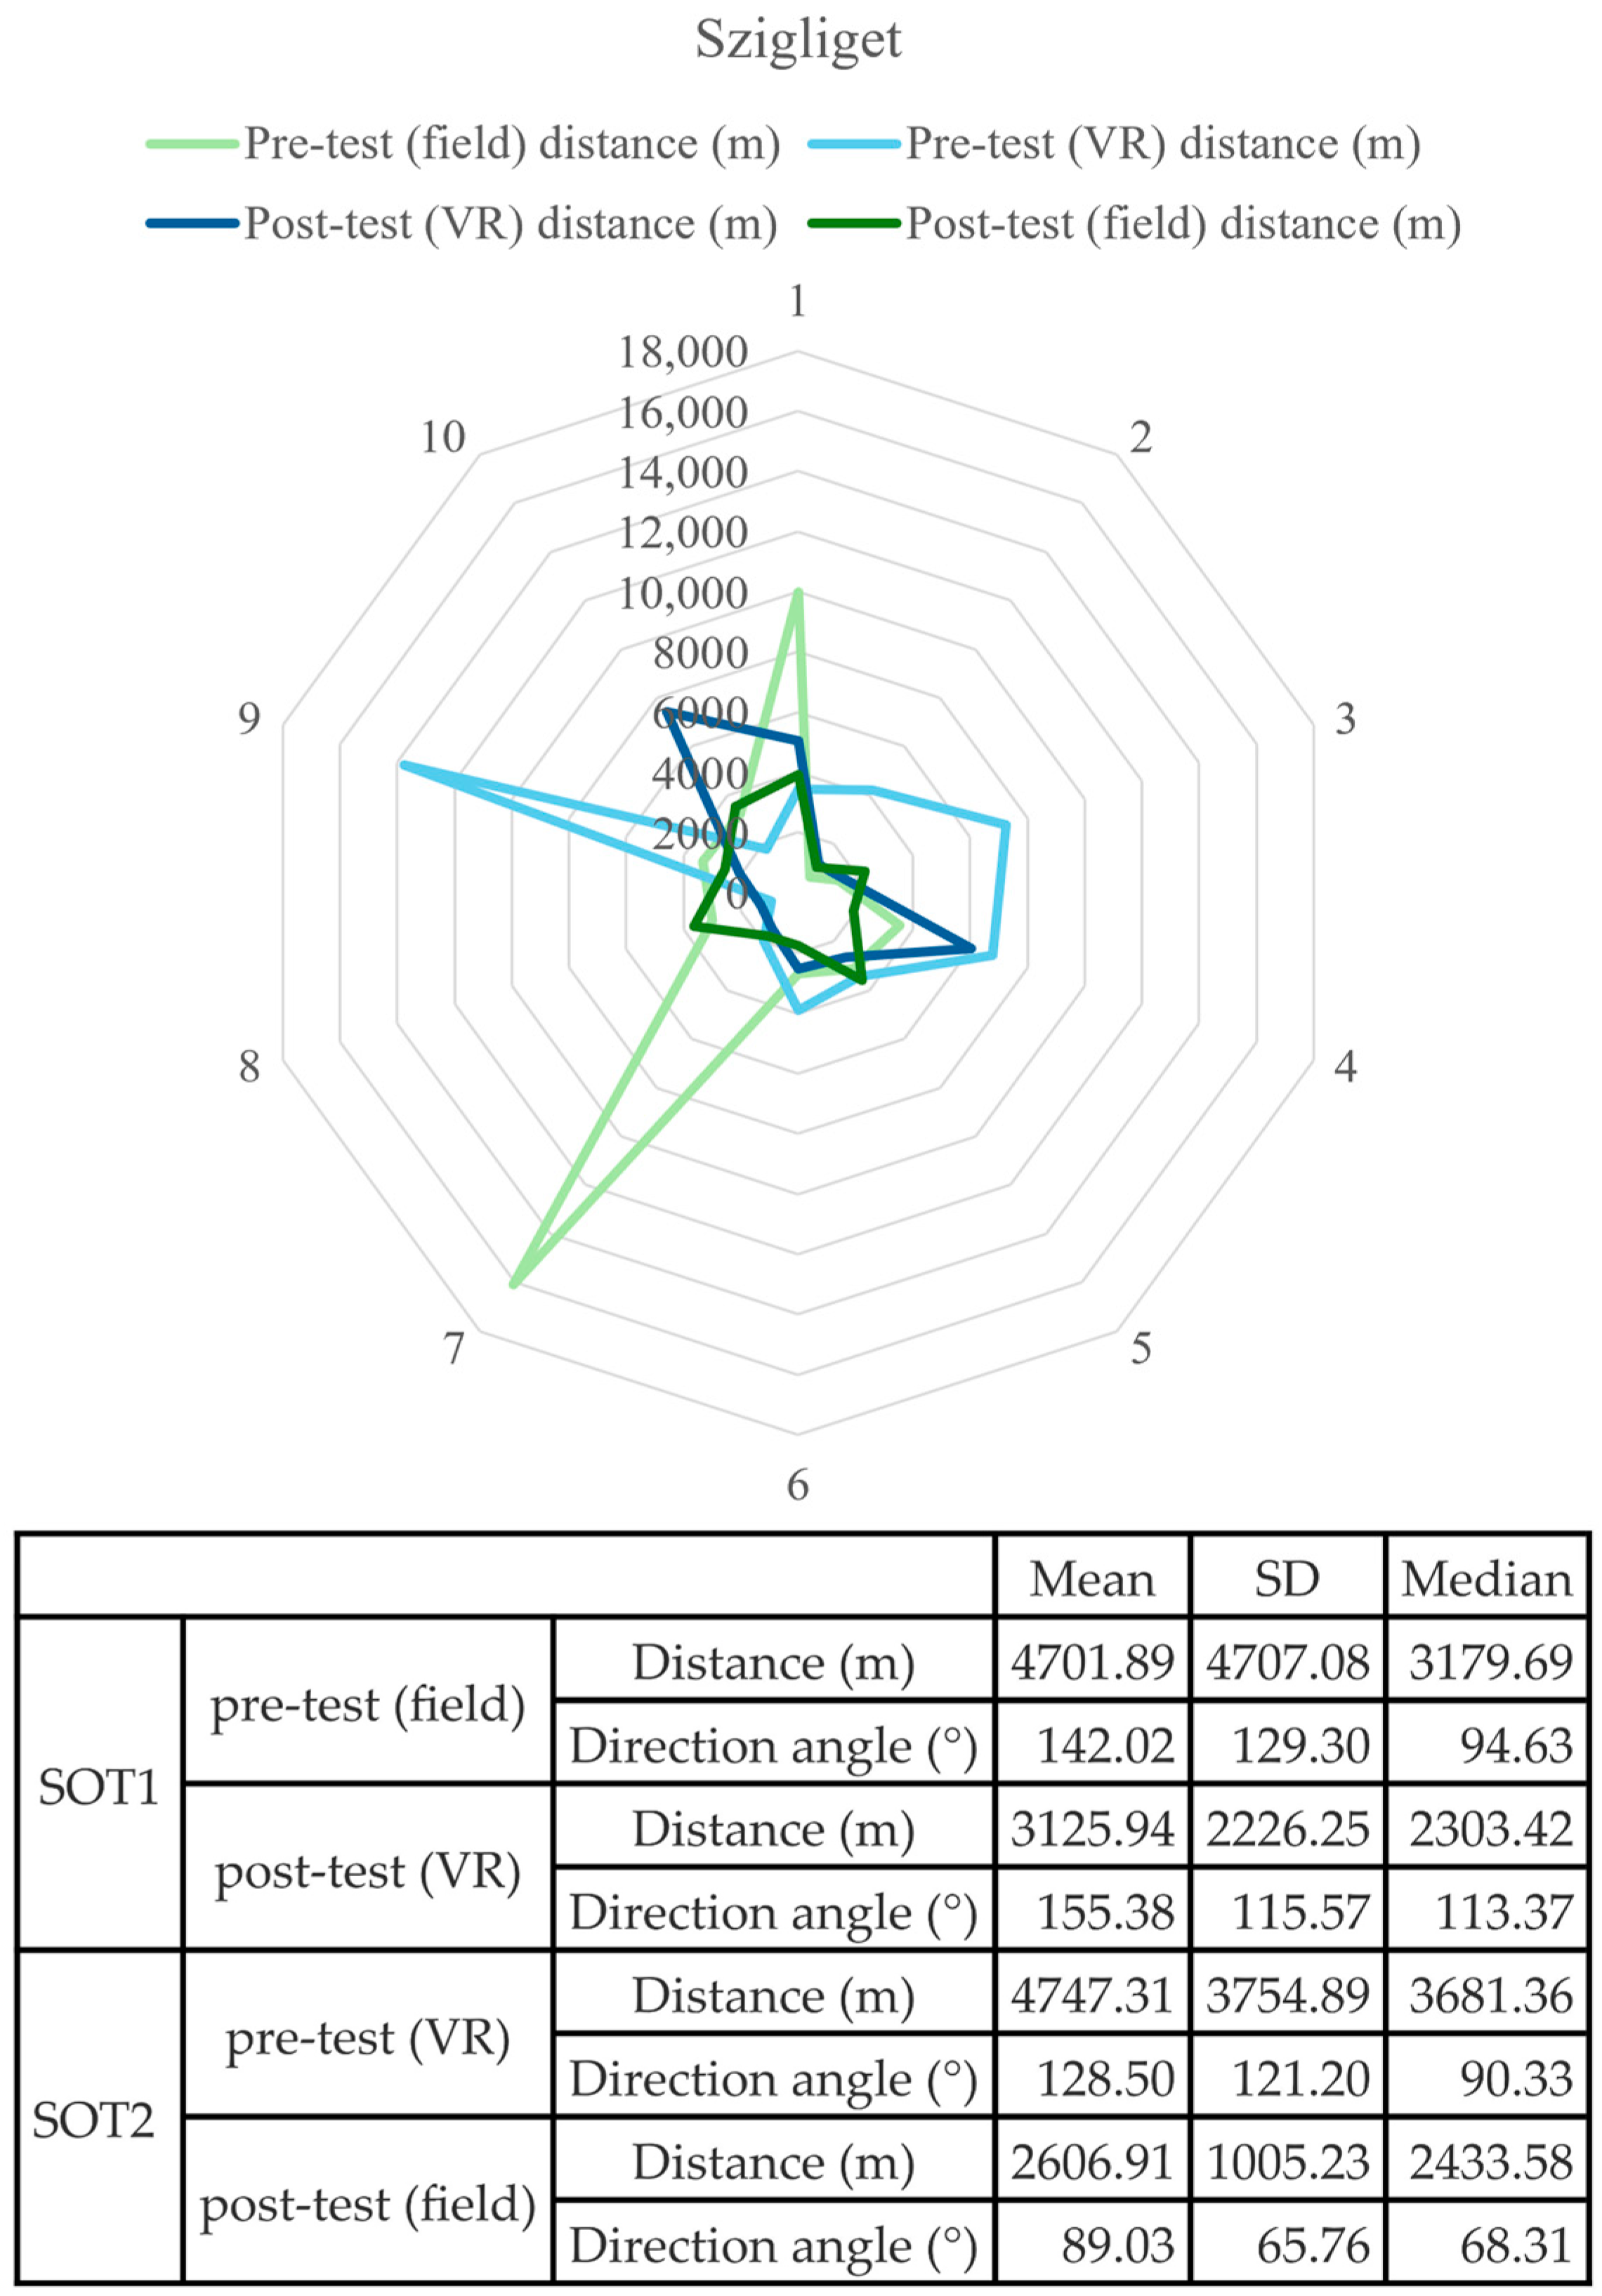
Spatial distribution of individual student responses (radar chart) and corresponding descriptive statistics for distance and direction angle estimations regarding Szigliget (SOT1: Group 1, Field–VR; SOT2: Group 2, VR–Field).
Figure 8.
Spatial distribution of individual student responses (radar chart) and corresponding descriptive statistics for distance and direction angle estimations regarding Szigliget (SOT1: Group 1, Field–VR; SOT2: Group 2, VR–Field).
Figure 9.
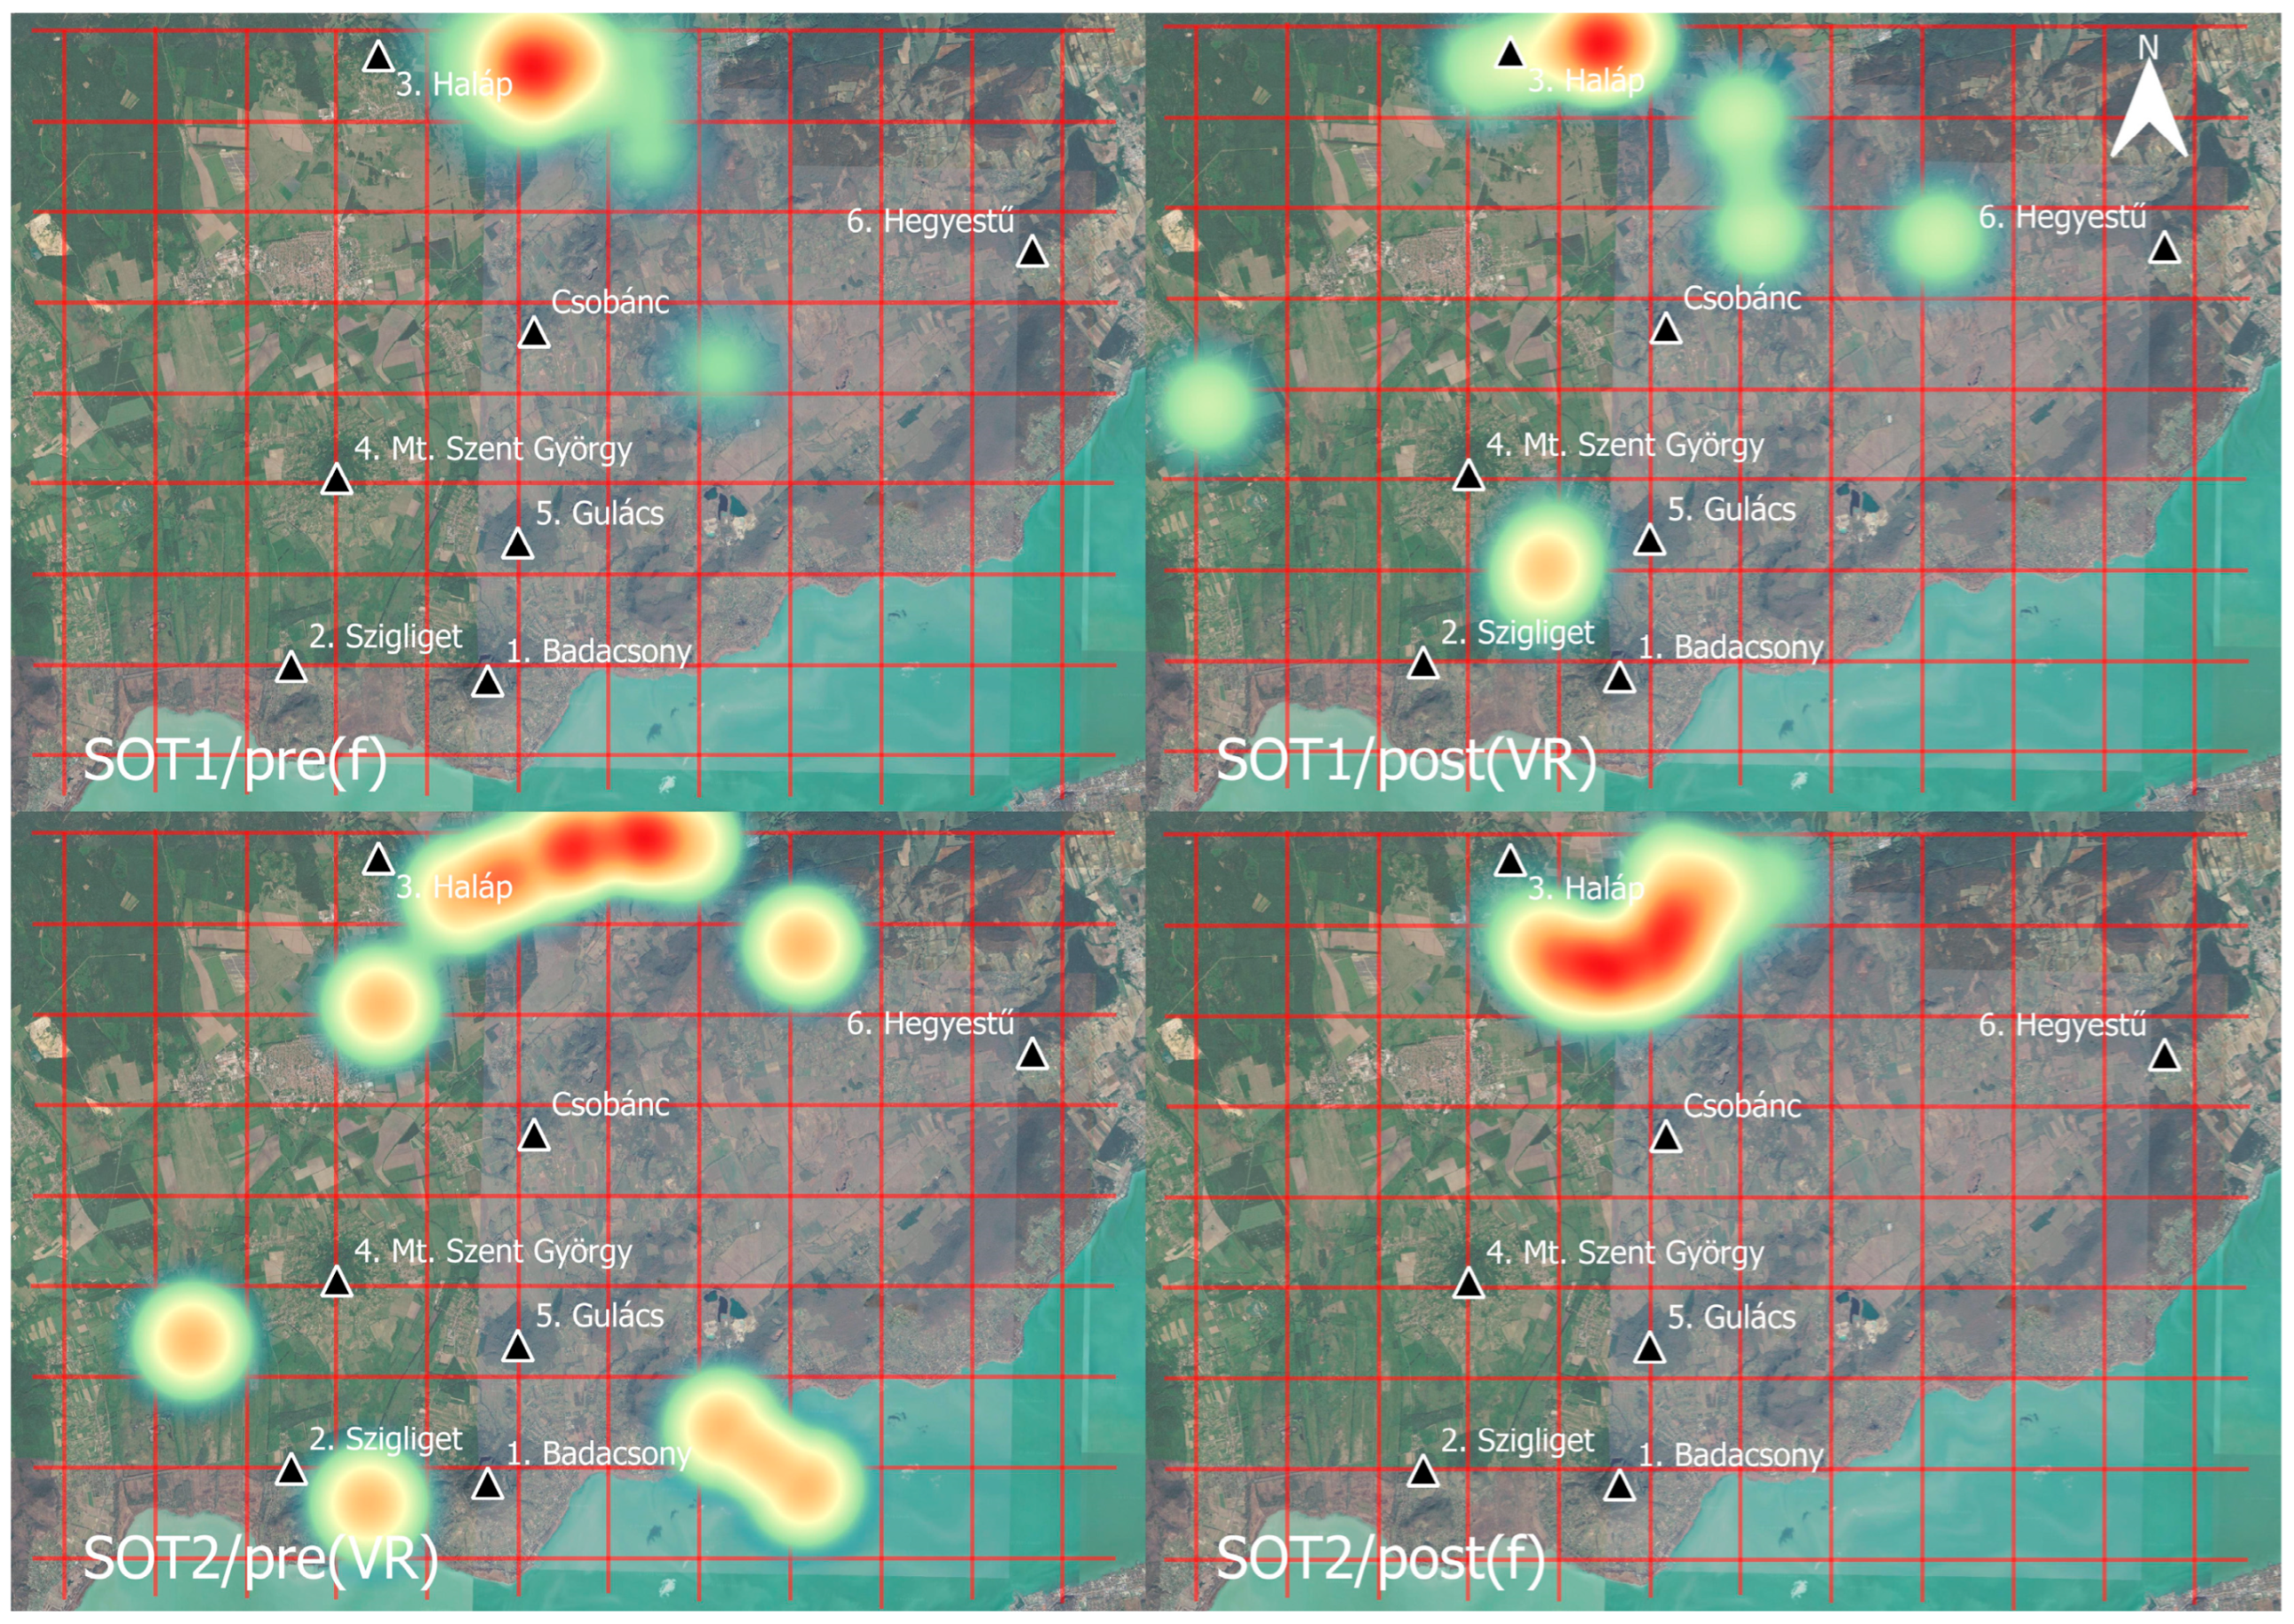
Comparative heatmaps of student-marked locations for Haláp. The maps illustrate the spatial distribution and point density across the two experimental sequences: SOT1 (field pre-test vs. VR post-test) and SOT2 (VR pre-test vs. field post-test). Brighter (red) areas indicate higher point density, reflecting the most common student estimations relative to the actual landmarks (black triangles). (SOT: spatial orientation task, f: field; VR: virtual reality).
Figure 9.
Comparative heatmaps of student-marked locations for Haláp. The maps illustrate the spatial distribution and point density across the two experimental sequences: SOT1 (field pre-test vs. VR post-test) and SOT2 (VR pre-test vs. field post-test). Brighter (red) areas indicate higher point density, reflecting the most common student estimations relative to the actual landmarks (black triangles). (SOT: spatial orientation task, f: field; VR: virtual reality).
Figure 10.
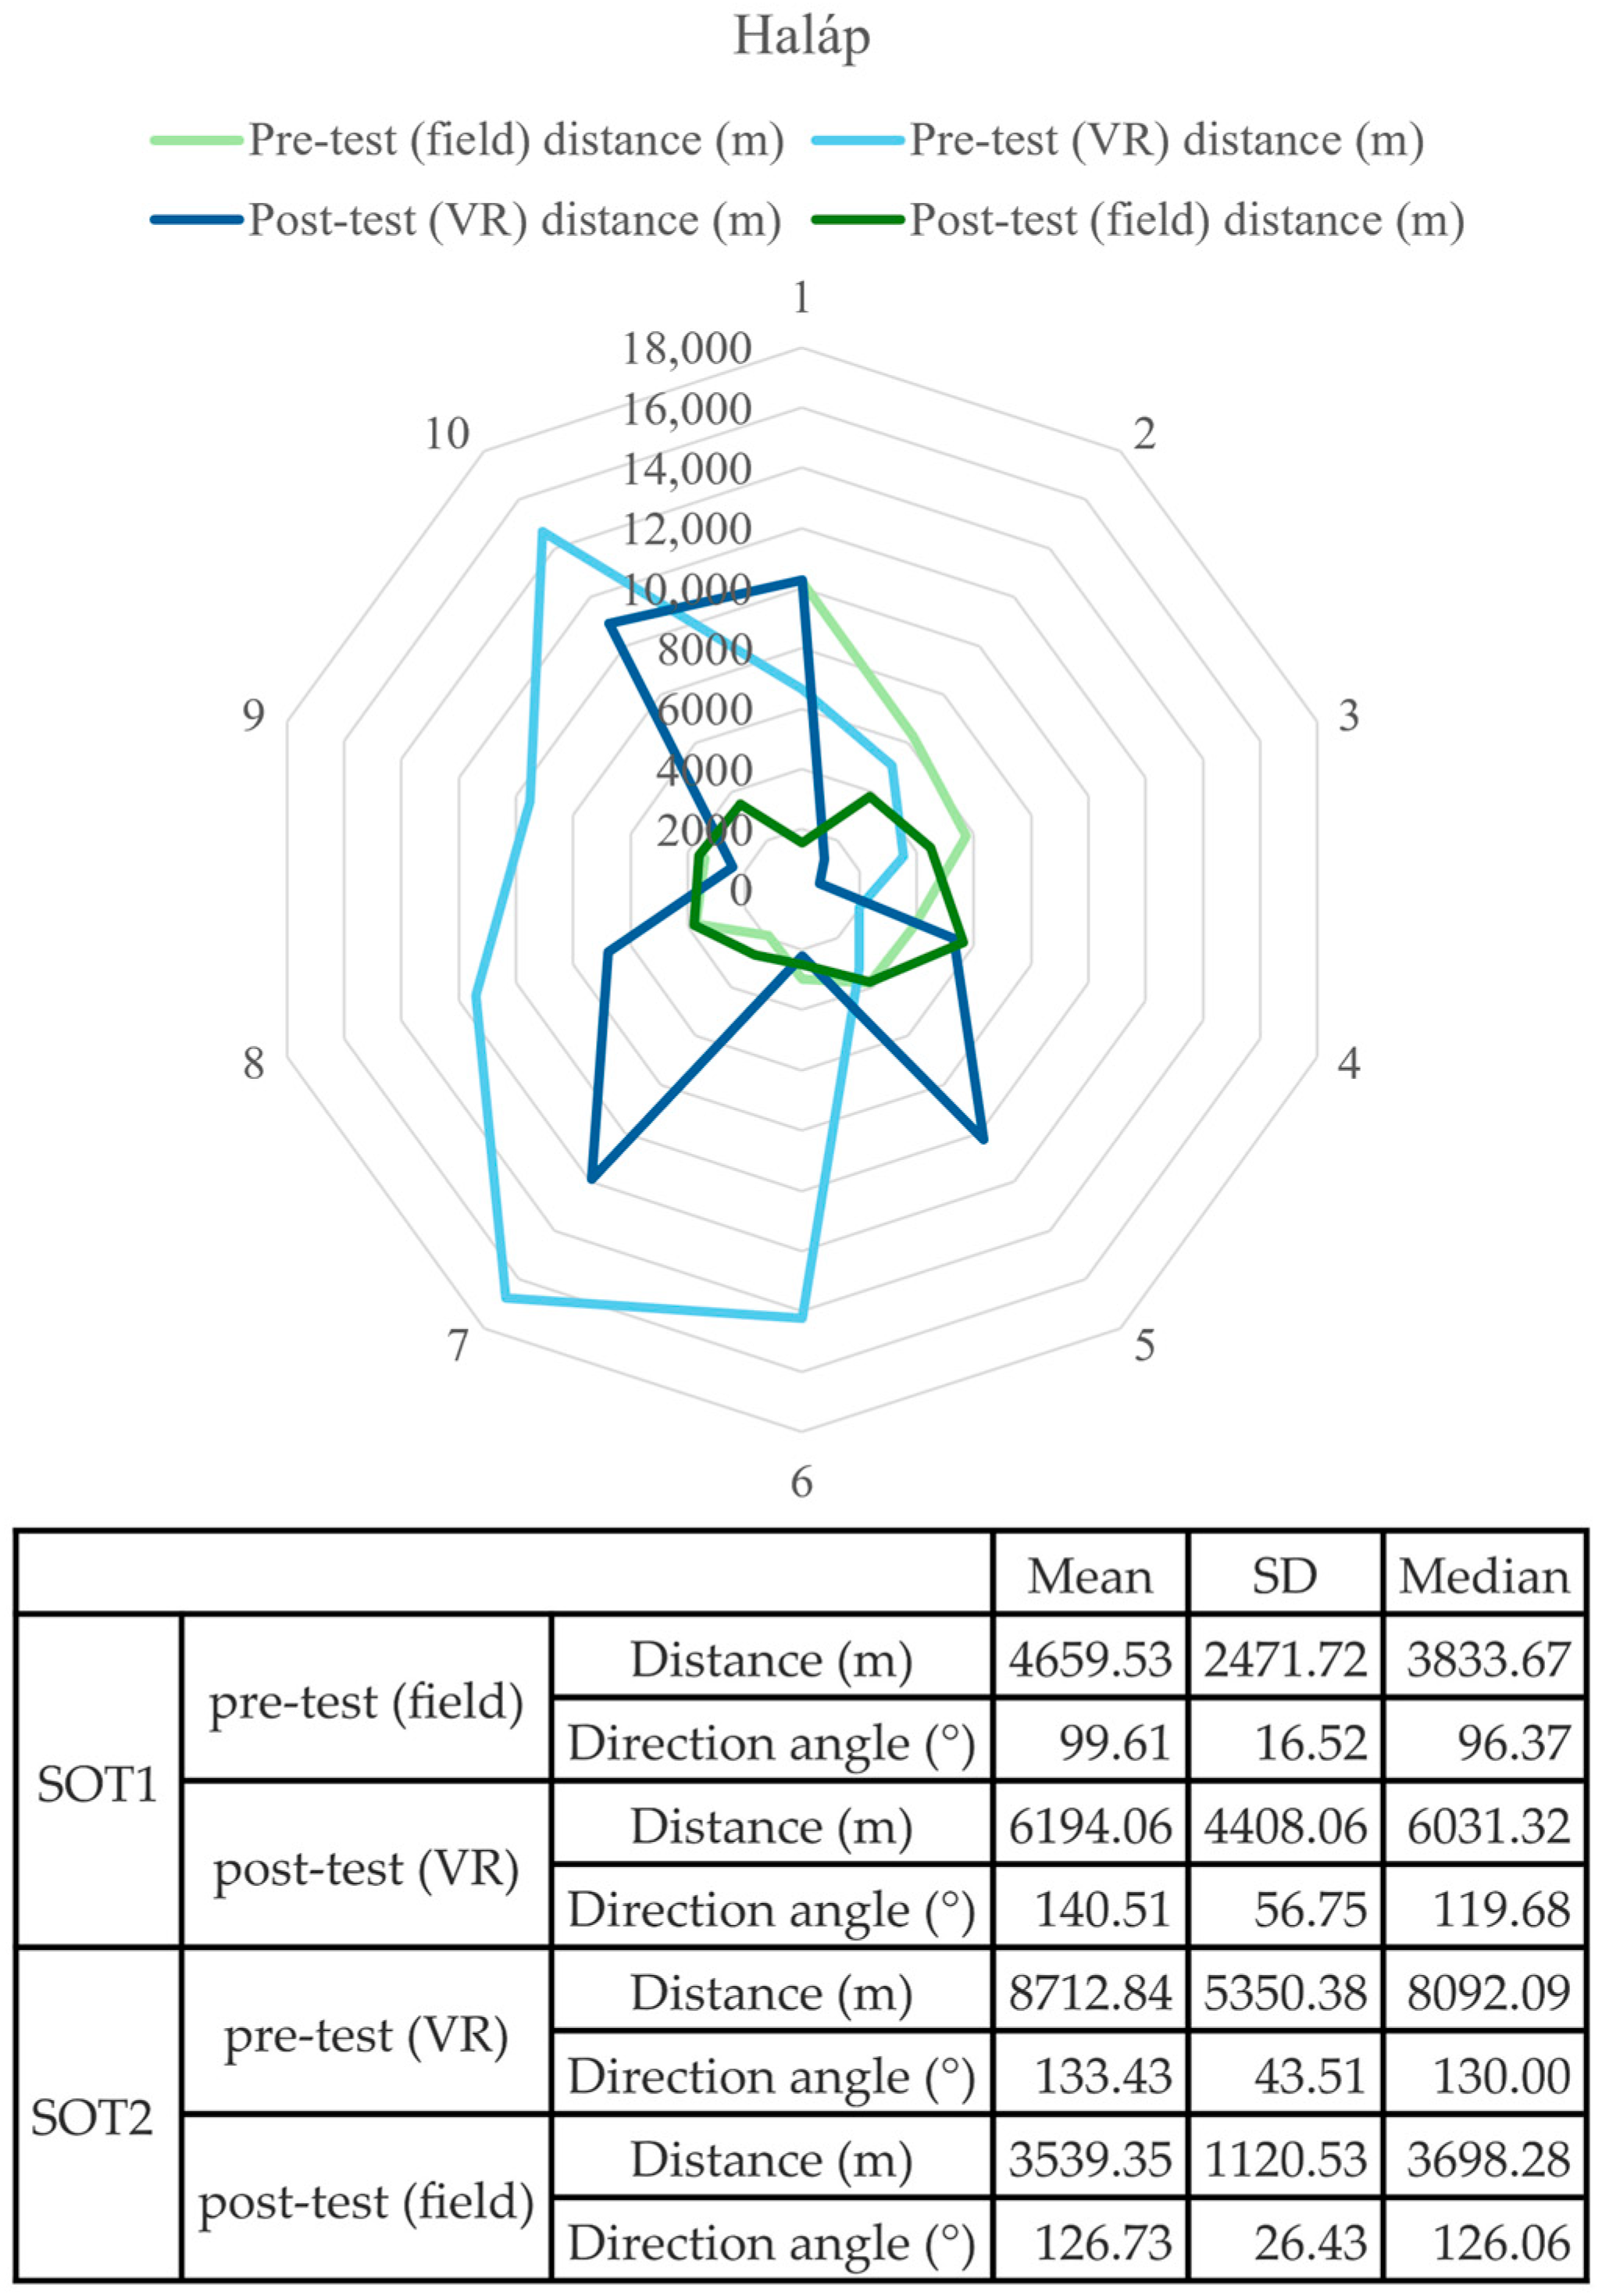
Spatial distribution of individual student responses (radar chart) and corresponding descriptive statistics for distance and direction angle estimations regarding Haláp (SOT1: Group 1, Field–VR; SOT2: Group 2, VR–Field).
Figure 10.
Spatial distribution of individual student responses (radar chart) and corresponding descriptive statistics for distance and direction angle estimations regarding Haláp (SOT1: Group 1, Field–VR; SOT2: Group 2, VR–Field).
Figure 11.
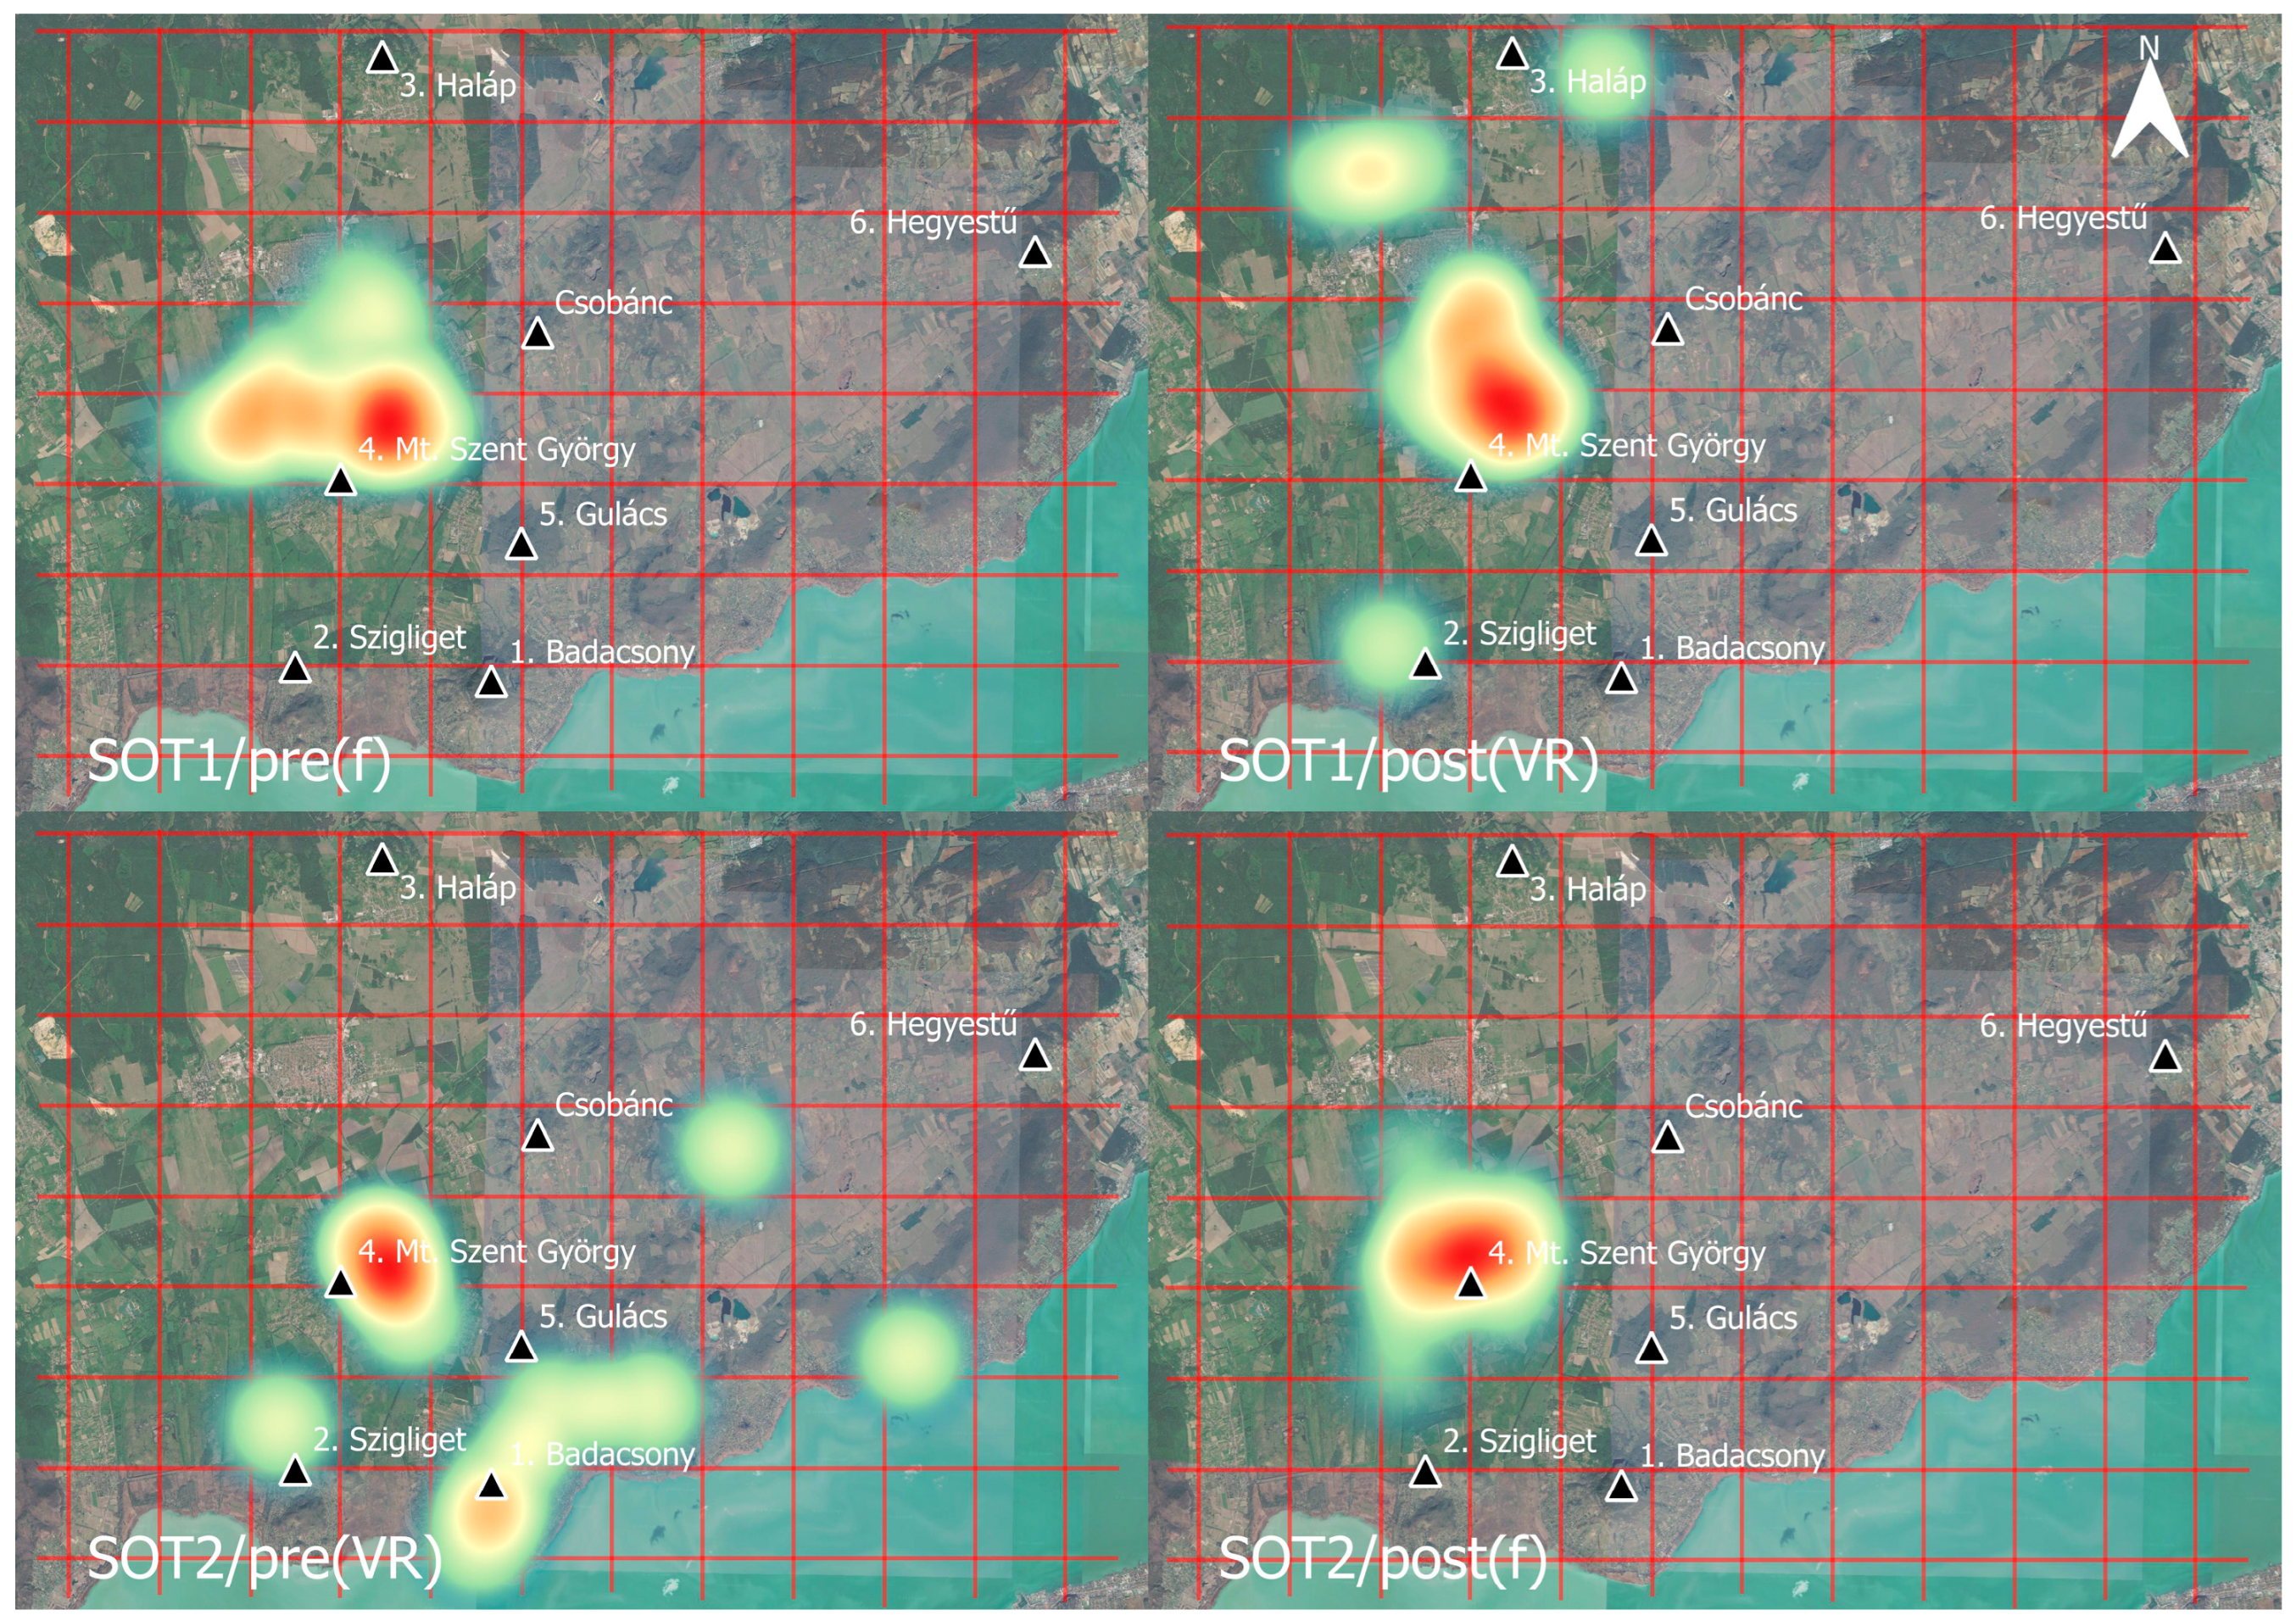
Comparative heatmaps of student-marked locations for Mt. Szent György. The maps illustrate the spatial distribution and point density across the two experimental sequences: SOT1 (field pre-test vs. VR post-test) and SOT2 (VR pre-test vs. field post-test). Brighter (red) areas indicate higher point density, reflecting the most common student estimations relative to the actual landmarks (black triangles). (SOT: spatial orientation task, f: field; VR: virtual reality).
Figure 11.
Comparative heatmaps of student-marked locations for Mt. Szent György. The maps illustrate the spatial distribution and point density across the two experimental sequences: SOT1 (field pre-test vs. VR post-test) and SOT2 (VR pre-test vs. field post-test). Brighter (red) areas indicate higher point density, reflecting the most common student estimations relative to the actual landmarks (black triangles). (SOT: spatial orientation task, f: field; VR: virtual reality).
Figure 12.
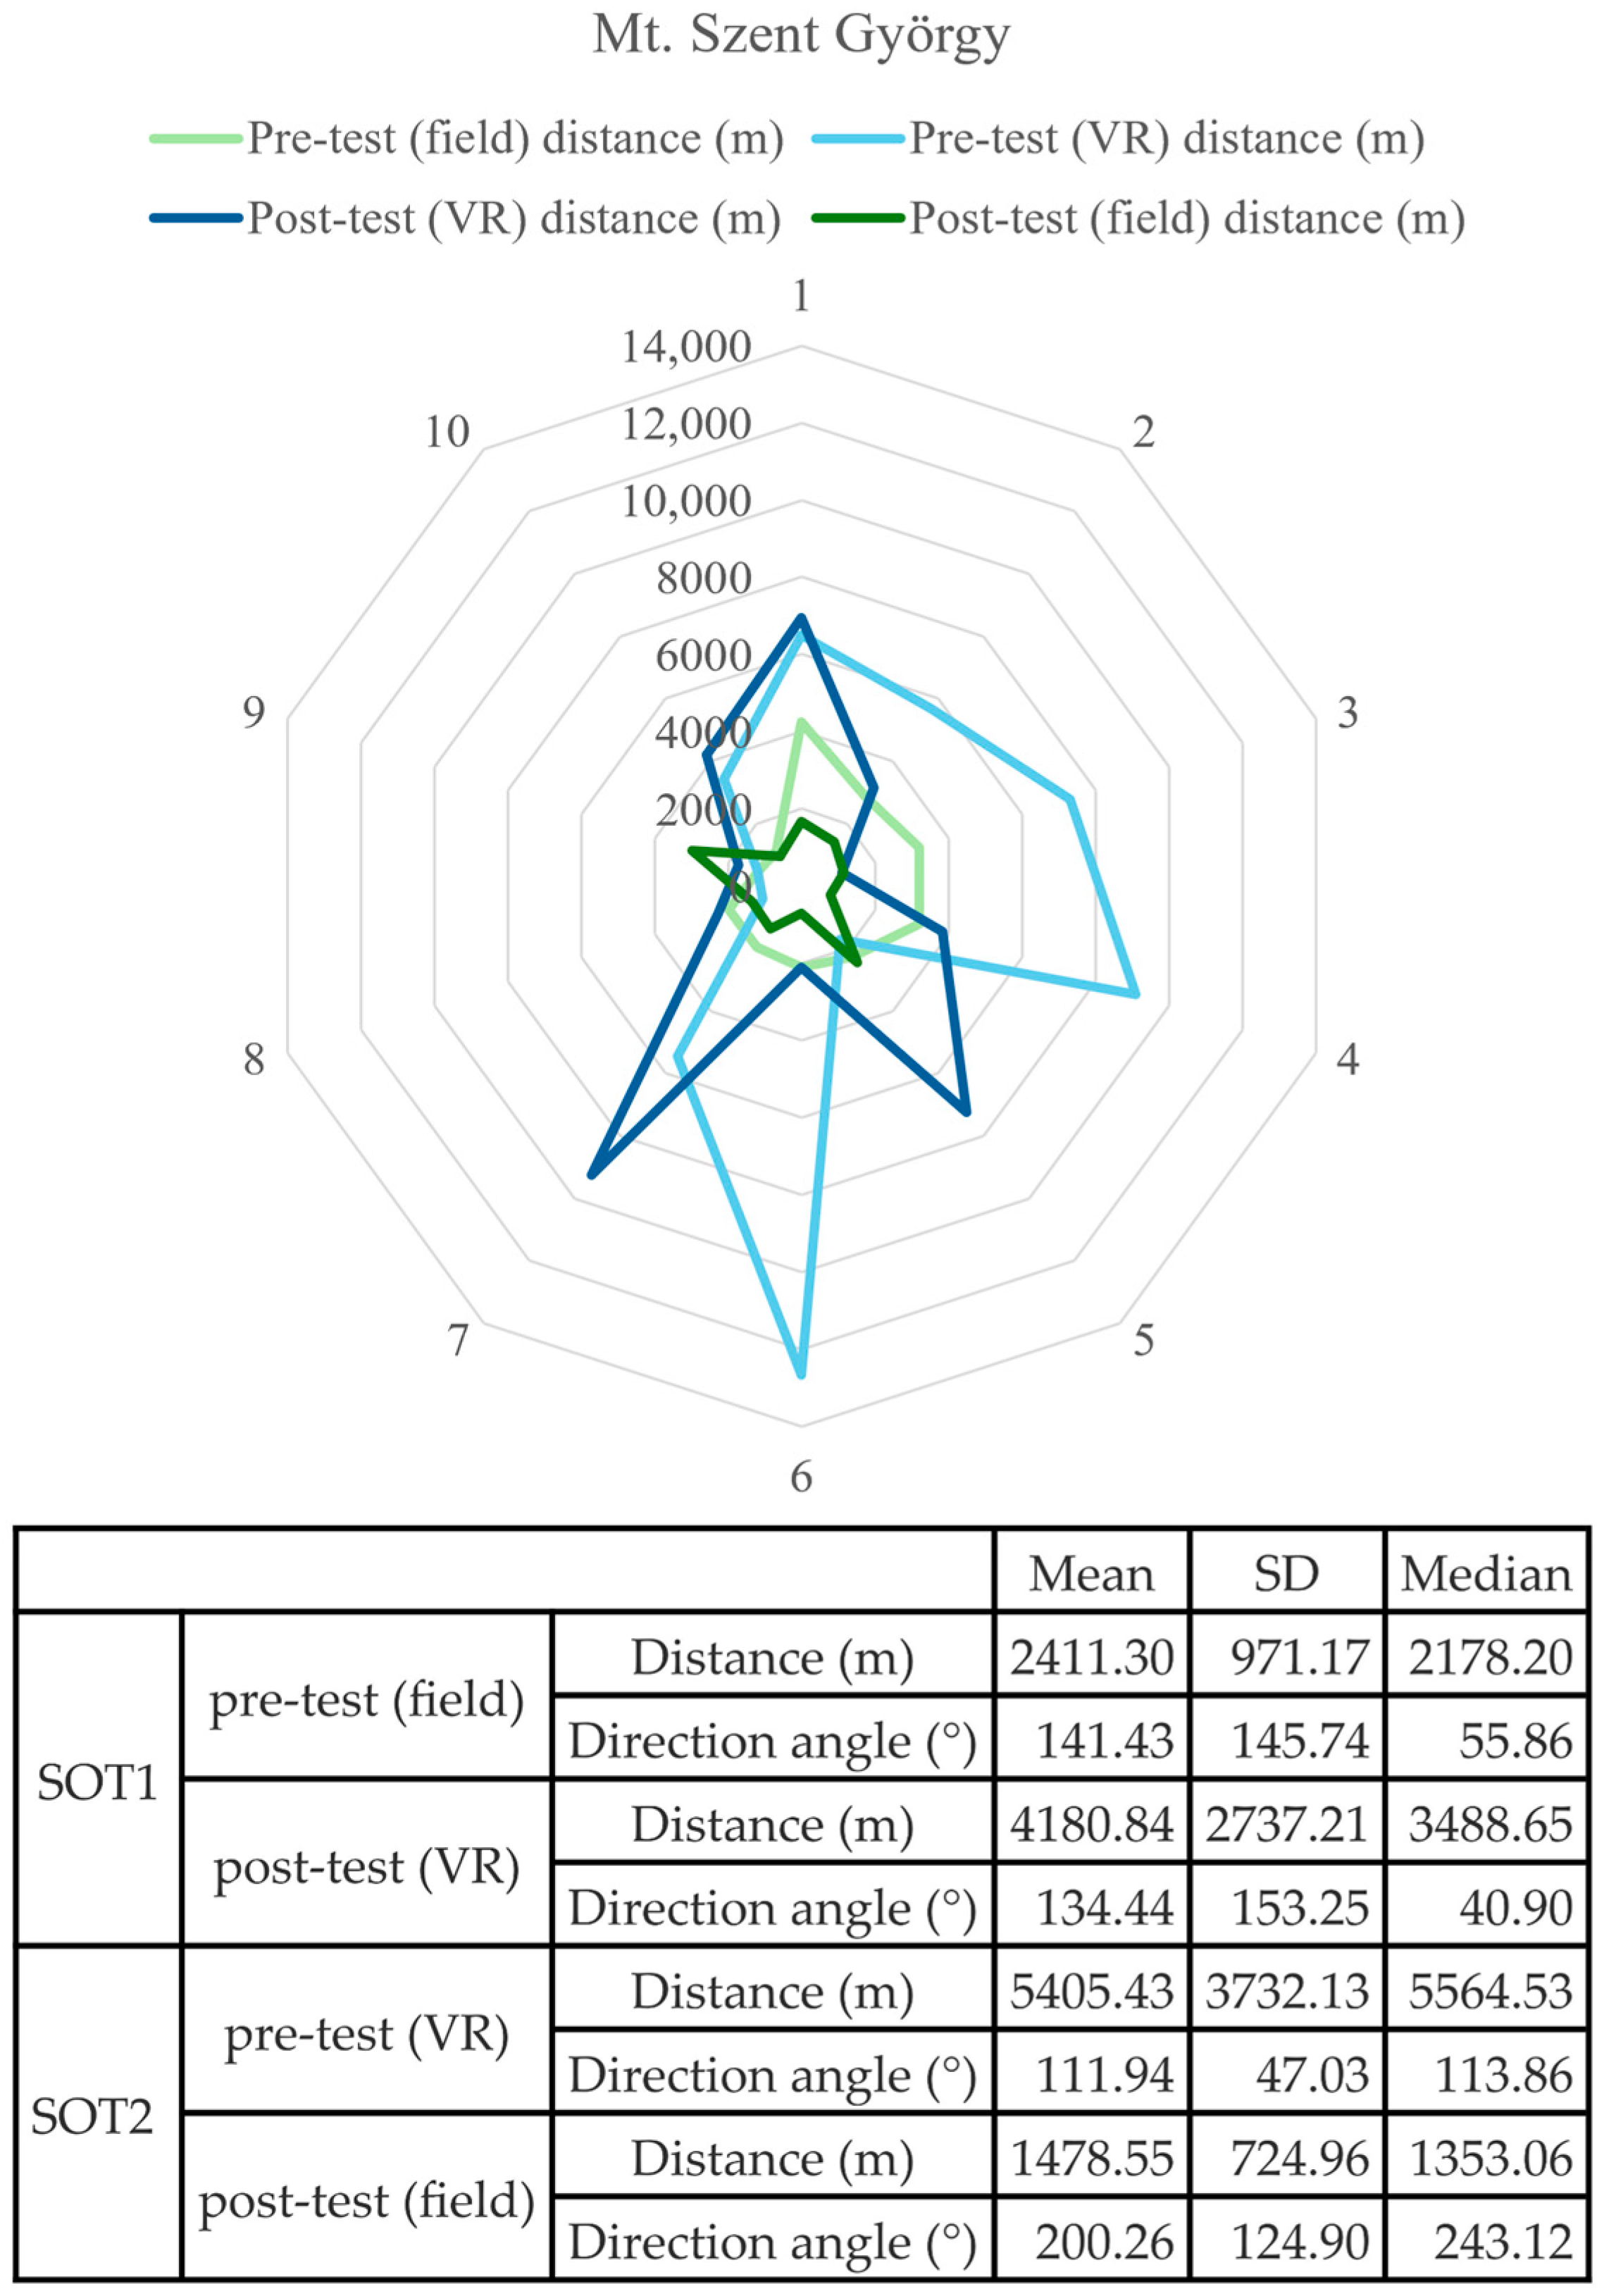
Spatial distribution of individual student responses (radar chart) and corresponding descriptive statistics for distance and direction angle estimations regarding Mt. Szent György (SOT1: Group 1, Field–VR; SOT2: Group 2, VR–Field).
Figure 12.
Spatial distribution of individual student responses (radar chart) and corresponding descriptive statistics for distance and direction angle estimations regarding Mt. Szent György (SOT1: Group 1, Field–VR; SOT2: Group 2, VR–Field).
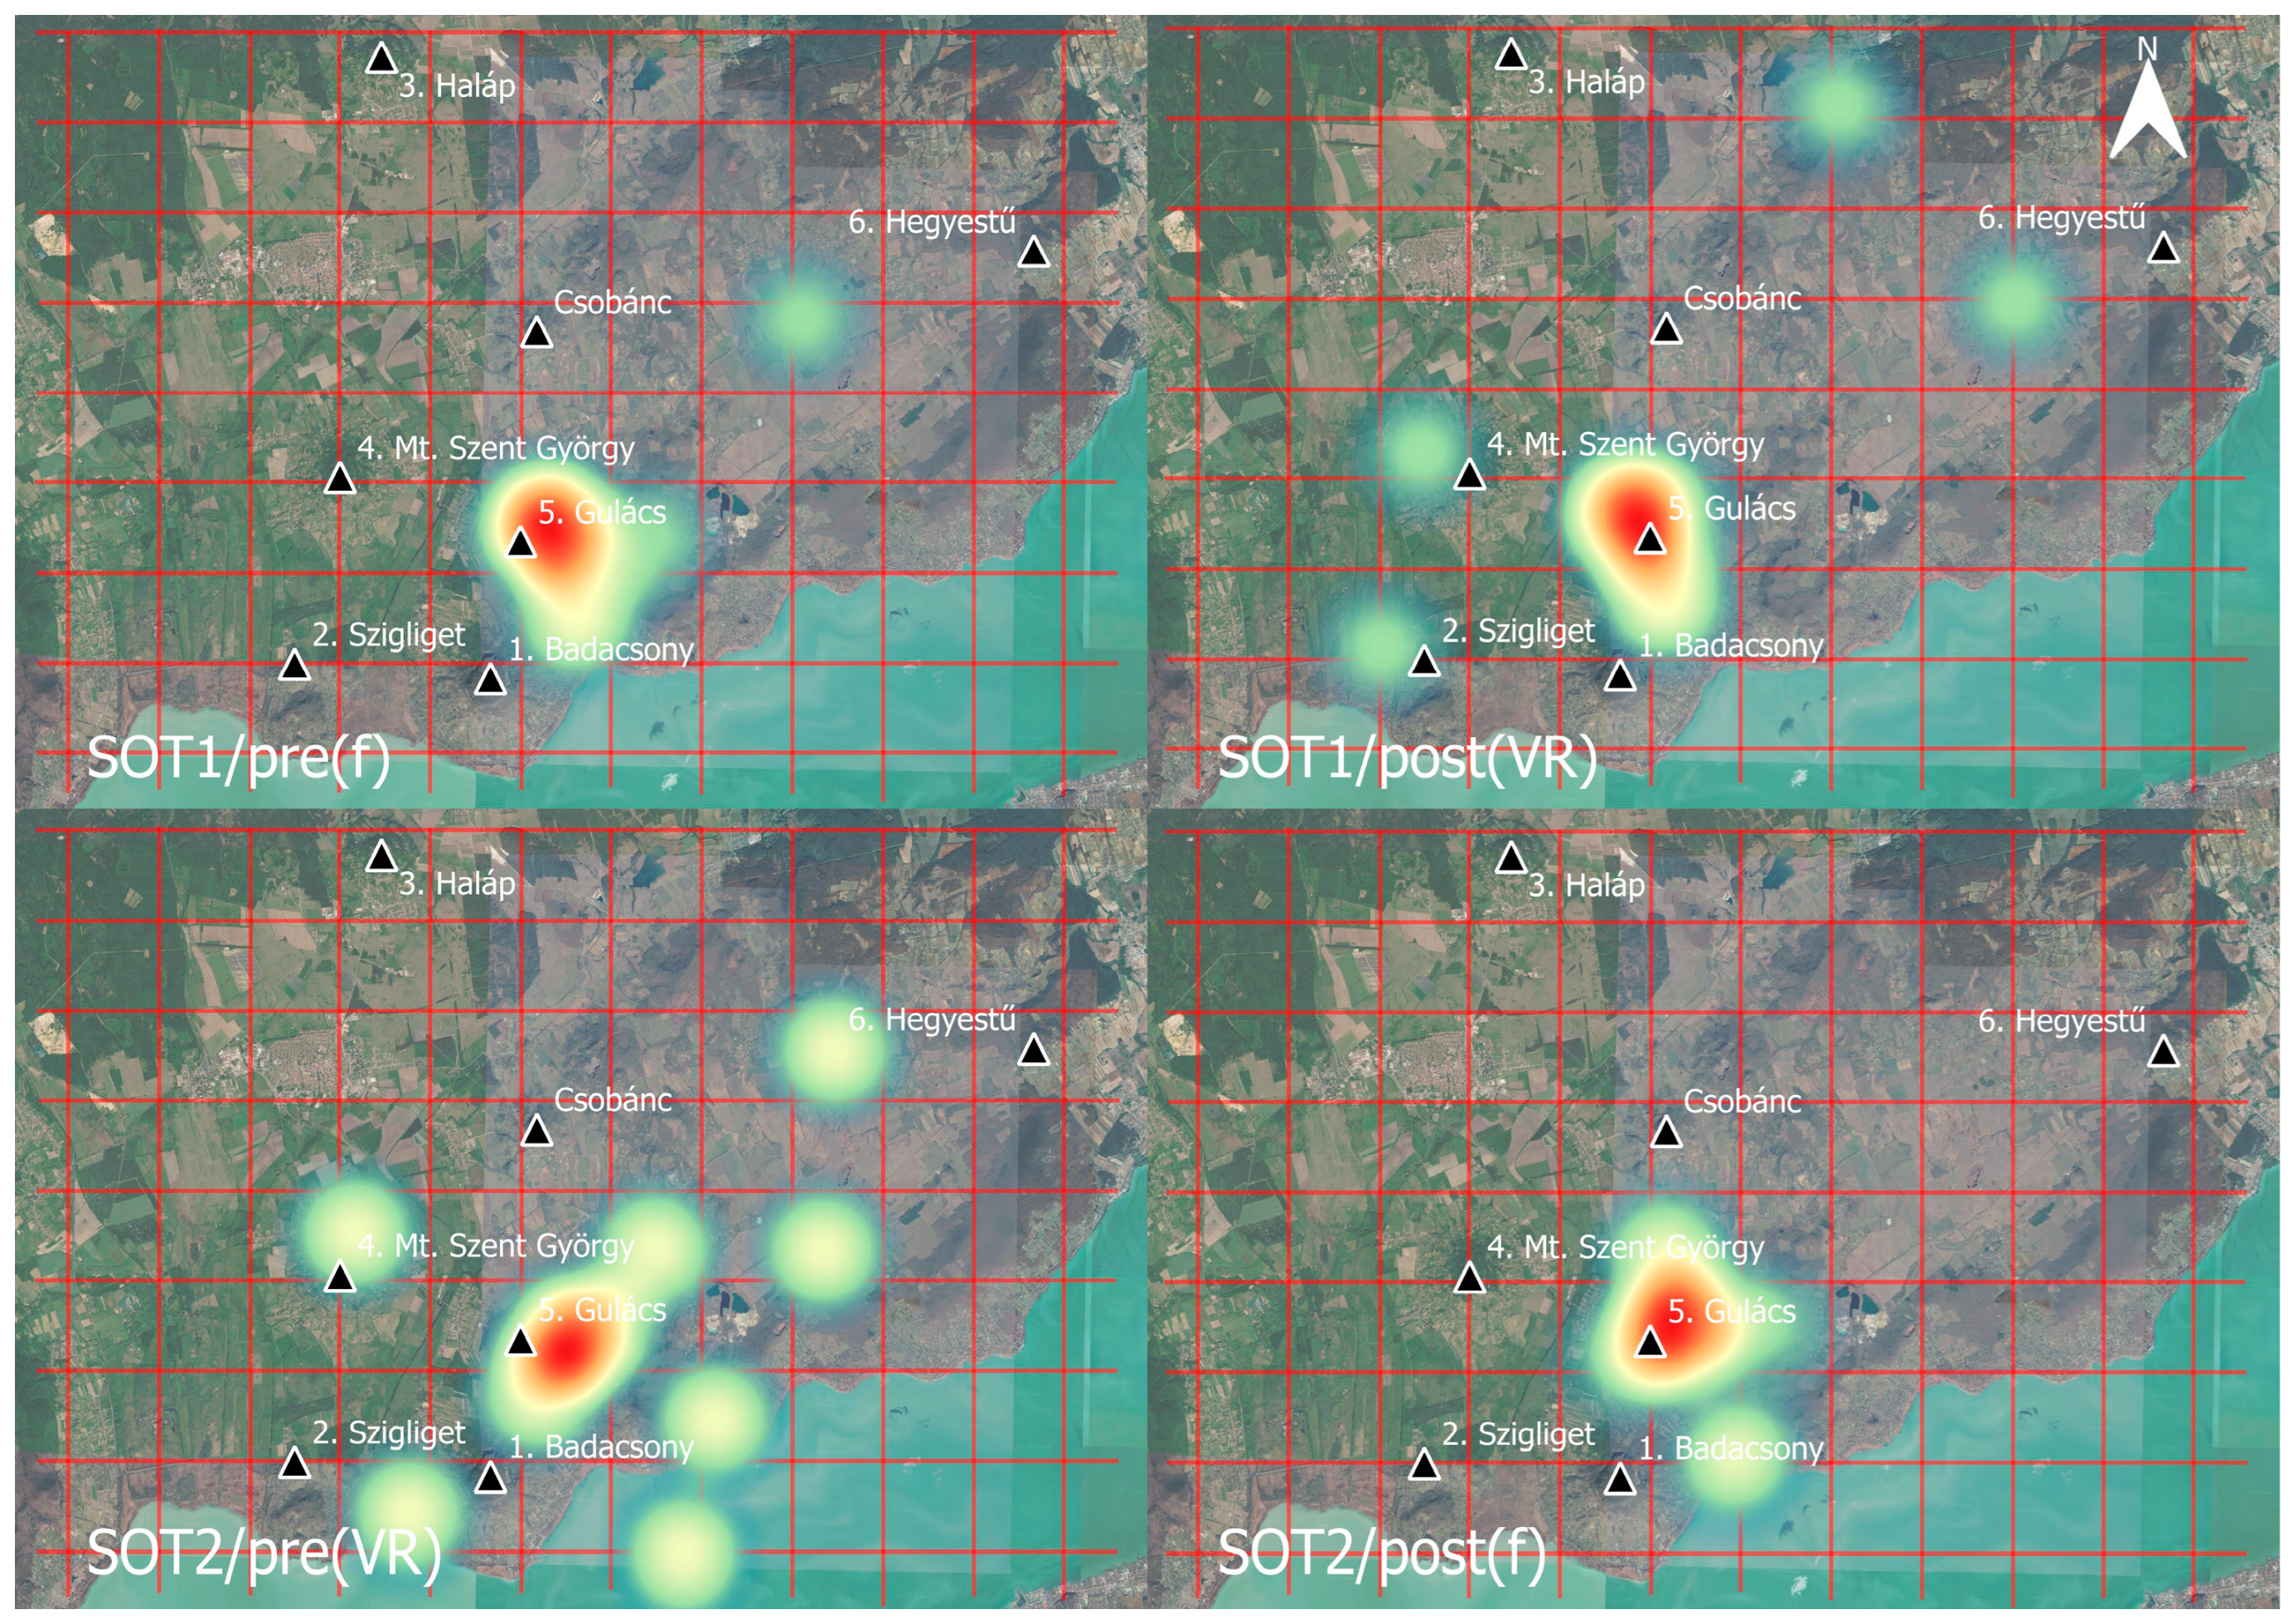
Figure 13.
Comparative heatmaps of student-marked locations for Gulács. The maps illustrate the spatial distribution and point density across the two experimental sequences: SOT1 (field pre-test vs. VR post-test) and SOT2 (VR pre-test vs. field post-test). Brighter (red) areas indicate higher point density, reflecting the most common student estimations relative to the actual landmarks (black triangles). (SOT: spatial orientation task, f: field; VR: virtual reality).
Figure 13.
Comparative heatmaps of student-marked locations for Gulács. The maps illustrate the spatial distribution and point density across the two experimental sequences: SOT1 (field pre-test vs. VR post-test) and SOT2 (VR pre-test vs. field post-test). Brighter (red) areas indicate higher point density, reflecting the most common student estimations relative to the actual landmarks (black triangles). (SOT: spatial orientation task, f: field; VR: virtual reality).
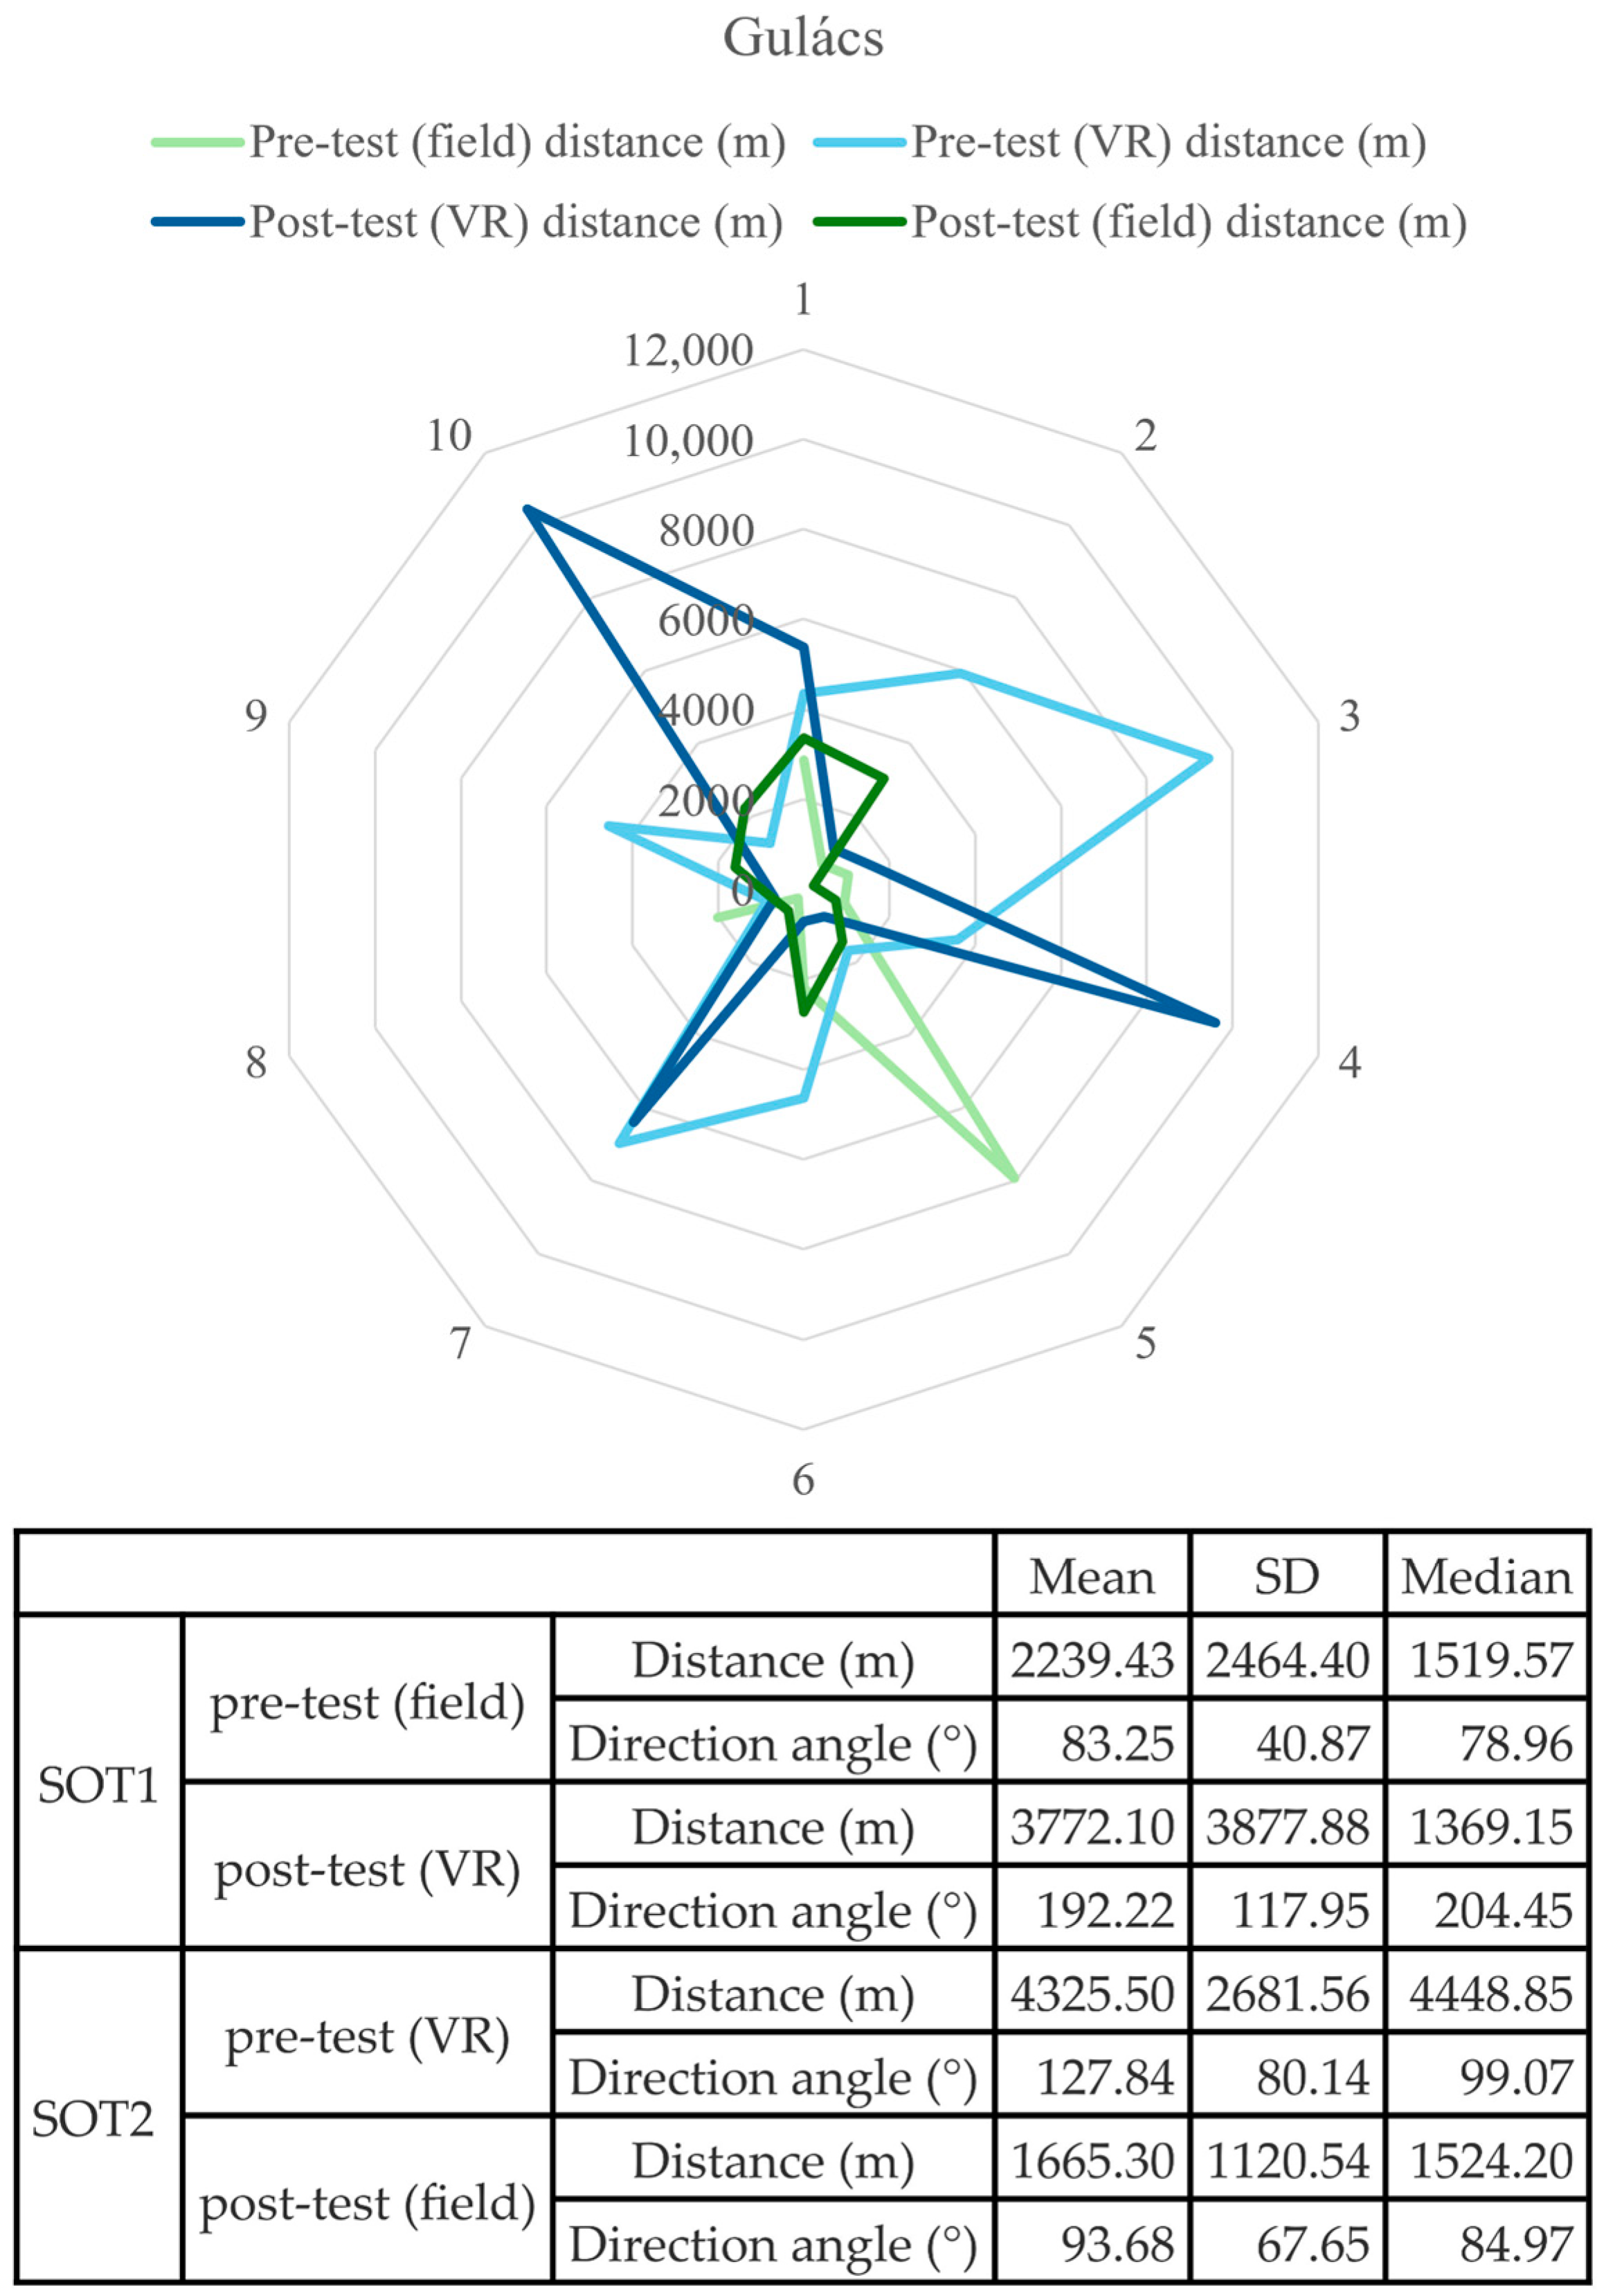
Figure 14.
Spatial distribution of individual student responses (radar chart) and corresponding descriptive statistics for distance and direction angle estimations regarding Gulács (SOT1: Group 1, Field–VR; SOT2: Group 2, VR–Field).
Figure 14.
Spatial distribution of individual student responses (radar chart) and corresponding descriptive statistics for distance and direction angle estimations regarding Gulács (SOT1: Group 1, Field–VR; SOT2: Group 2, VR–Field).
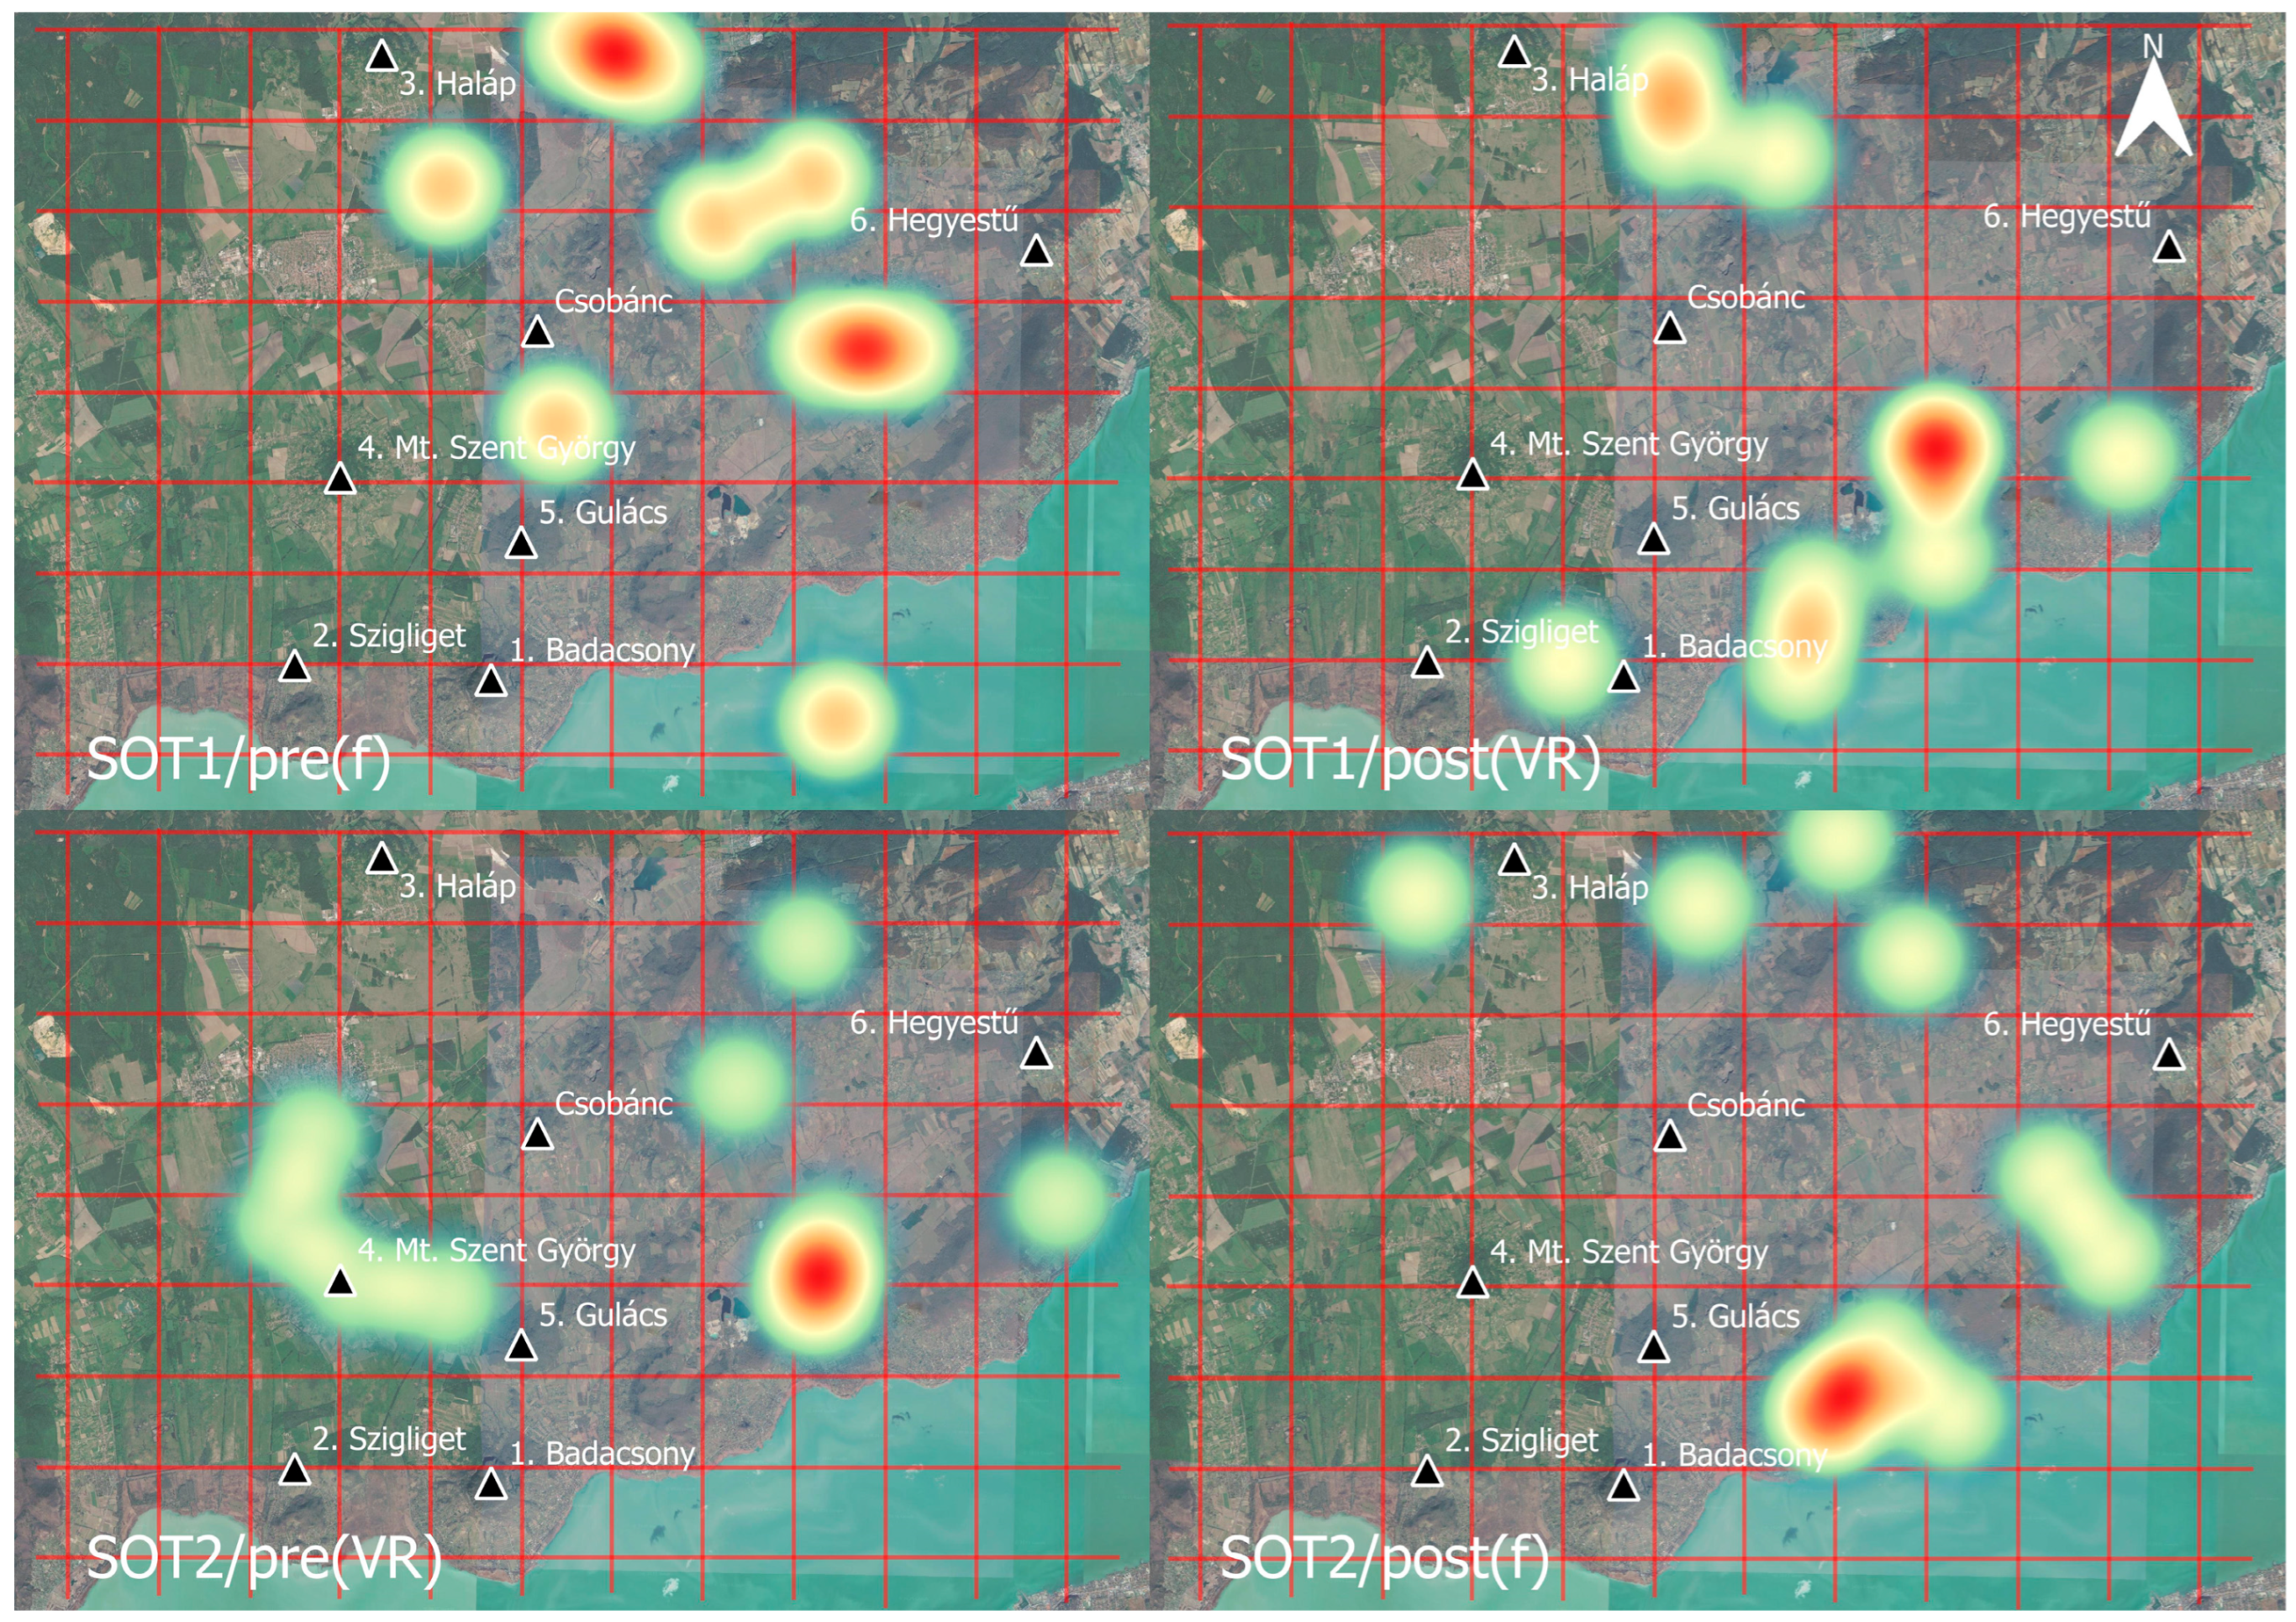
Figure 15.
Comparative heatmaps of student-marked locations for Hegyestű. The maps illustrate the spatial distribution and point density across the two experimental sequences: SOT1 (field pre-test vs. VR post-test) and SOT2 (VR pre-test vs. field post-test). Brighter (red) areas indicate higher point density, reflecting the most common student estimations relative to the actual landmarks (black triangles). (SOT: spatial orientation task, f: field; VR: virtual reality).
Figure 15.
Comparative heatmaps of student-marked locations for Hegyestű. The maps illustrate the spatial distribution and point density across the two experimental sequences: SOT1 (field pre-test vs. VR post-test) and SOT2 (VR pre-test vs. field post-test). Brighter (red) areas indicate higher point density, reflecting the most common student estimations relative to the actual landmarks (black triangles). (SOT: spatial orientation task, f: field; VR: virtual reality).
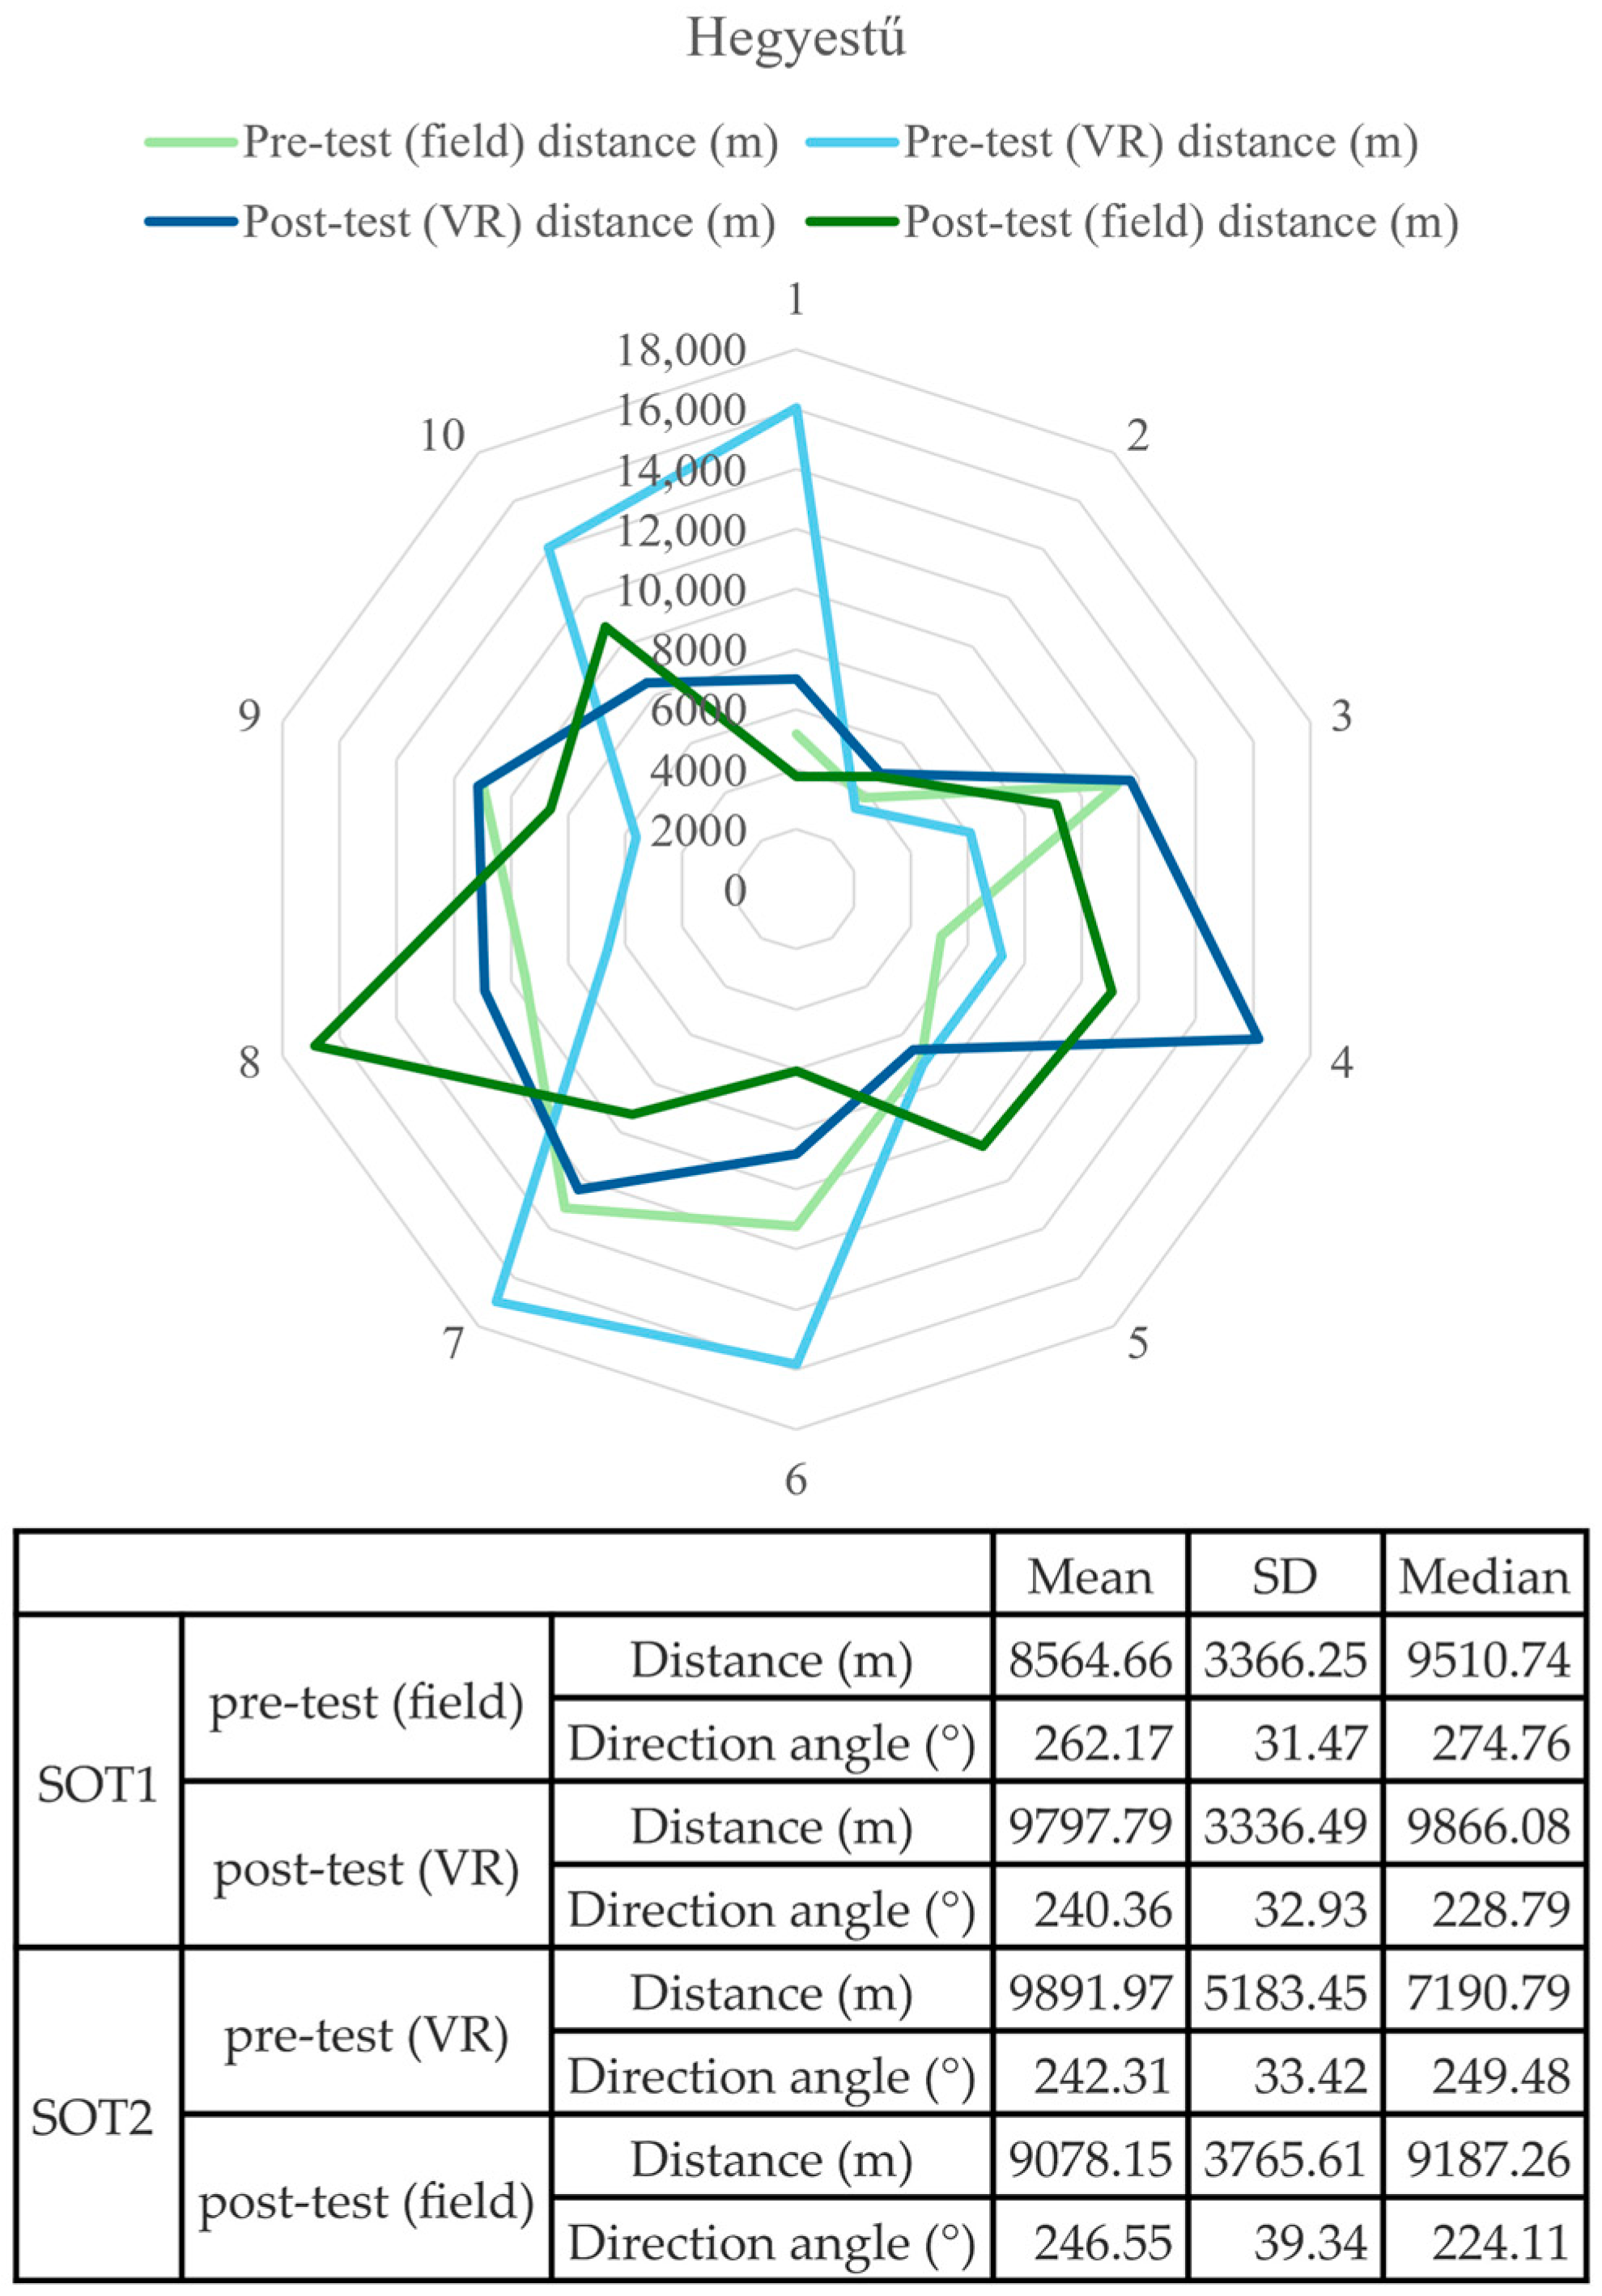
Figure 16.
Spatial distribution of individual student responses (radar chart) and corresponding descriptive statistics for distance and direction angle estimations regarding Hegyestű (SOT1: Group 1, Field–VR; SOT2: Group 2, VR–Field).
Figure 16.
Spatial distribution of individual student responses (radar chart) and corresponding descriptive statistics for distance and direction angle estimations regarding Hegyestű (SOT1: Group 1, Field–VR; SOT2: Group 2, VR–Field).
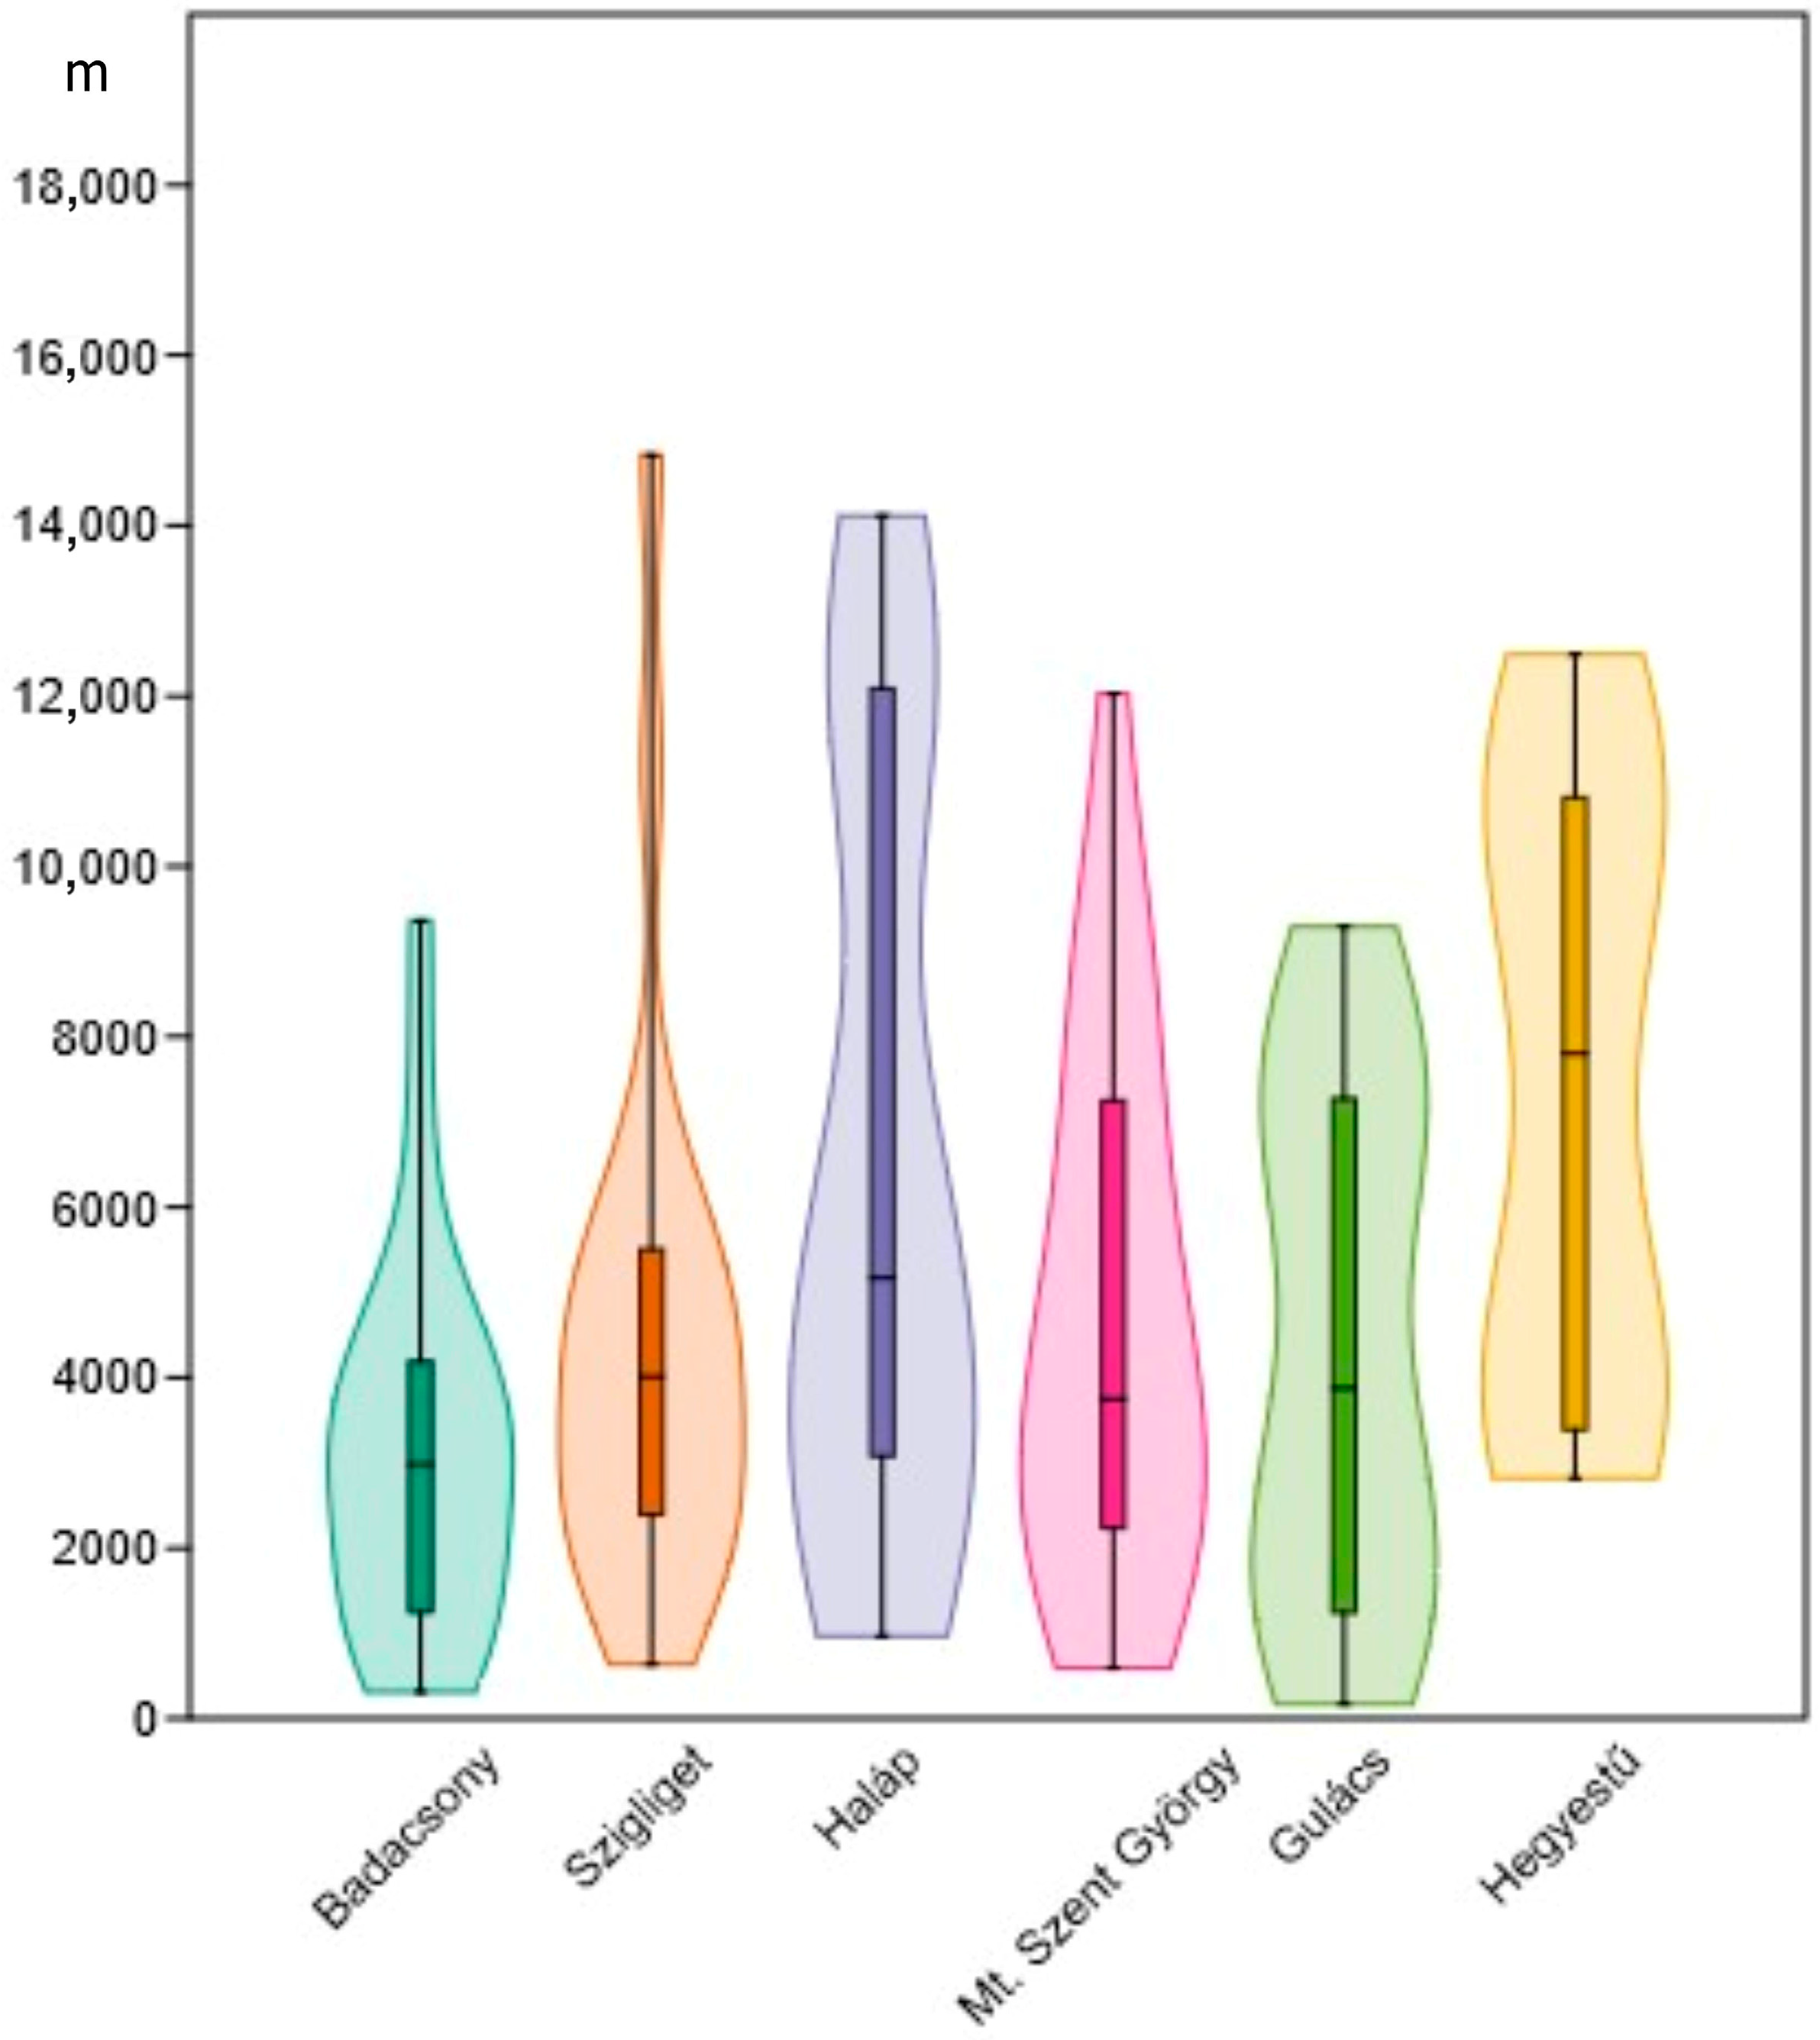
Figure 17.
Violin plots illustrating the spatial distribution and density of point-to-point distance deviations for the six examined remnant hills (m).
Figure 17.
Violin plots illustrating the spatial distribution and density of point-to-point distance deviations for the six examined remnant hills (m).
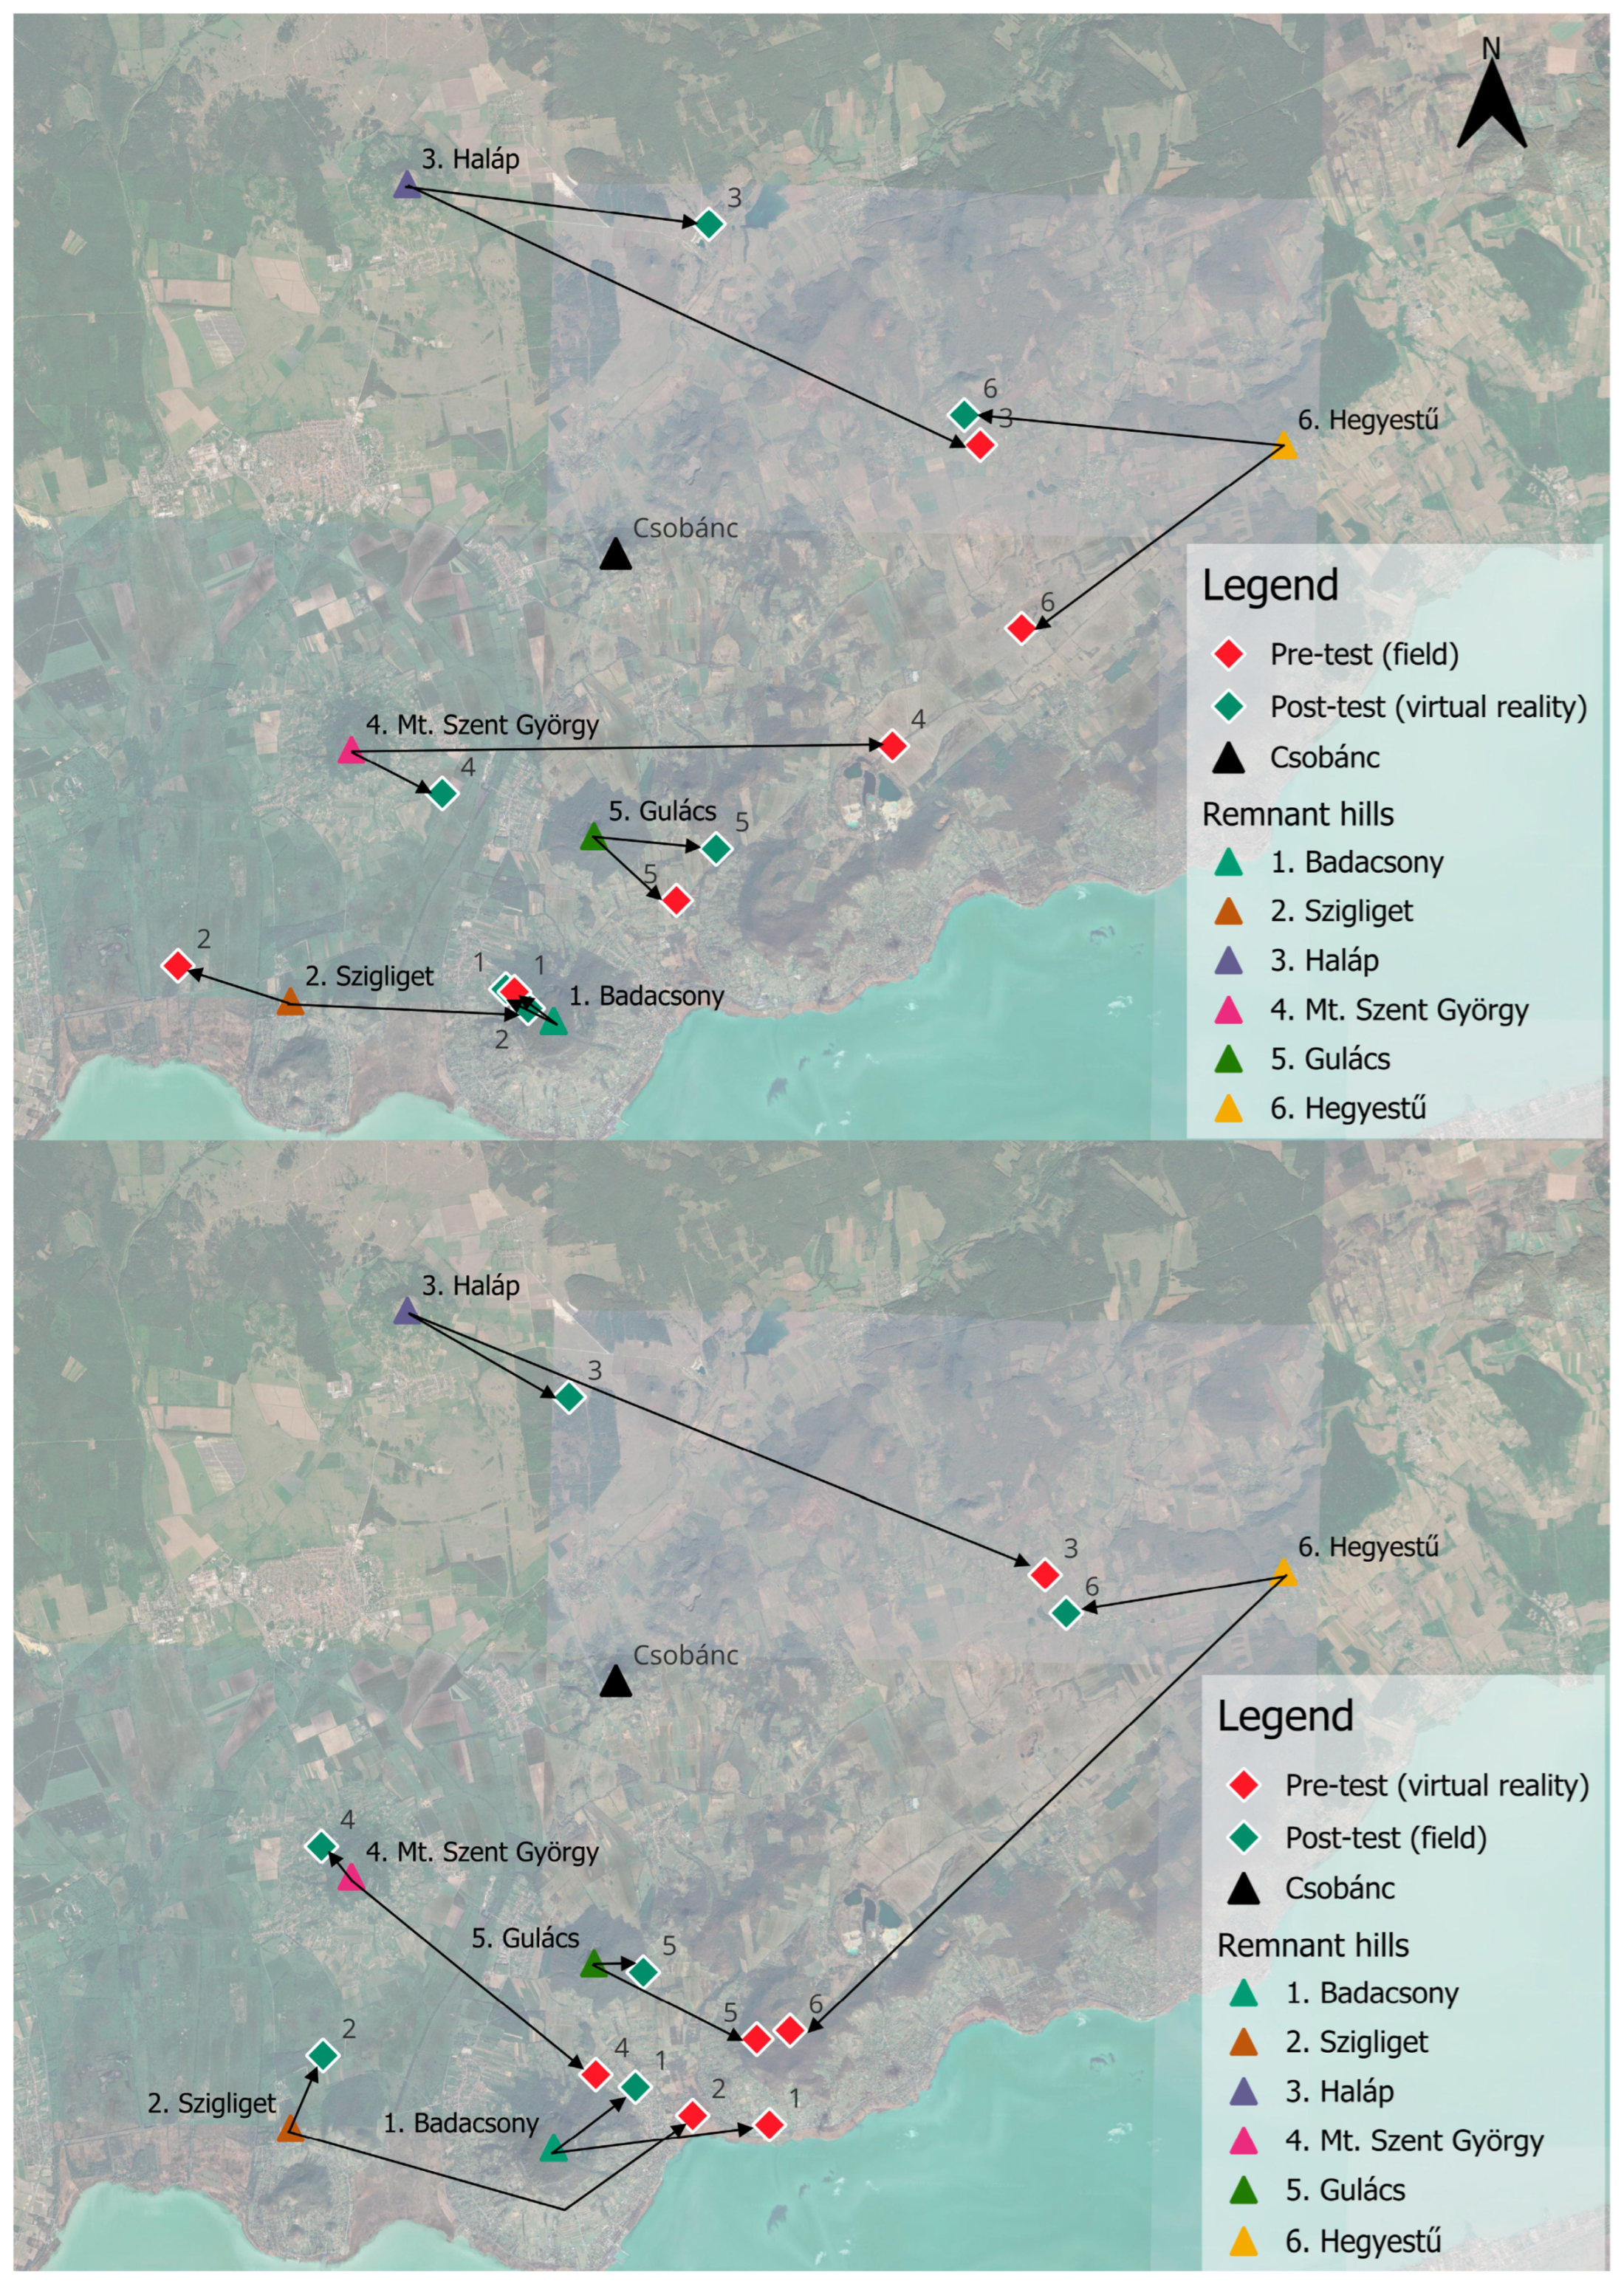
Figure 18.
Reconstructed cognitive map of the remnant hills. The diagram illustrates the spatial shift between the actual geographical locations and the students’ perceptions. Displacement vectors indicate the direction and magnitude of the systematic spatial distortions. Color coding of the remnant hills is consistent with
Figure 17.
Figure 18.
Reconstructed cognitive map of the remnant hills. The diagram illustrates the spatial shift between the actual geographical locations and the students’ perceptions. Displacement vectors indicate the direction and magnitude of the systematic spatial distortions. Color coding of the remnant hills is consistent with
Figure 17.
Table 1.
Distances and direction angles of the remnant hills from Csobánc.
Table 1.
Distances and direction angles of the remnant hills from Csobánc.
| | Distance (m) | Direction Angle (°) |
|---|
| Badacsony | 7765.46 | 192.30 |
| Szigliget | 9111.57 | 215.95 |
| Haláp | 6985.45 | 330.61 |
| Mt. Szent György | 5417.10 | 233.35 |
| Gulács | 4671.81 | 184.42 |
| Hegyestű | 11,120.75 | 80.73 |
Table 2.
Descriptive statistics of distance and direction angle estimations for Badacsony across the test sequences (SOT1: Group 1, Field–VR; SOT2: Group 2, VR–Field).
Table 2.
Descriptive statistics of distance and direction angle estimations for Badacsony across the test sequences (SOT1: Group 1, Field–VR; SOT2: Group 2, VR–Field).
| Badacsony |
|---|
| | | | Mean | SD | Median |
|---|
| SOT1 | pre-test (Field) | Distance (m) | 7396.74 | 1475.55 | 7661.24 |
| Direction angle (°) | 194.29 | 22.40 | 191.81 |
| post-test (VR) | Distance (m) | 7039.45 | 1637.29 | 7372.24 |
| Direction angle (°) | 193.12 | 26.34 | 187.88 |
| SOT2 | pre-test (VR) | Distance (m) | 7710.56 | 1347.21 | 7799.27 |
| Direction angle (°) | 161.46 | 55.88 | 176.35 |
| post-test (Field) | Distance (m) | 6700.43 | 1180.71 | 6703.23 |
| Direction angle (°) | 177.35 | 12.59 | 179.61 |
Table 3.
Descriptive statistics of distance and direction angle estimations for Szigliget across the test sequences (SOT1: Group 1, Field–VR; SOT2: Group 2, VR–Field).
Table 3.
Descriptive statistics of distance and direction angle estimations for Szigliget across the test sequences (SOT1: Group 1, Field–VR; SOT2: Group 2, VR–Field).
| Szigliget |
|---|
| | | | Mean | SD | Median |
|---|
| SOT1 | pre-test (field) | Distance (m) | 7605.89 | 1213.232 | 7915.77 |
| Direction angle (°) | 190.956 | 54.46647 | 205.64 |
| post-test (VR) | Distance (m) | 8209.17 | 2175.653 | 8776.21 |
| Direction angle (°) | 213.48 | 21.96453 | 209.755 |
| SOT2 | pre-test (VR) | Distance (m) | 7280.31 | 1606.855 | 7188.2 |
| Direction angle (°) | 170.075 | 55.03445 | 177.935 |
| post-test (field) | Distance (m) | 7811.08 | 1492.864 | 7371.19 |
| Direction angle (°) | 217.172 | 27.38674 | 210.885 |
Table 4.
Descriptive statistics of distance and direction angle estimations for Haláp across the test sequences (SOT1: Group 1, Field–VR; SOT2: Group 2, VR–Field).
Table 4.
Descriptive statistics of distance and direction angle estimations for Haláp across the test sequences (SOT1: Group 1, Field–VR; SOT2: Group 2, VR–Field).
| Haláp |
|---|
| | | | Mean | SD | Median |
|---|
| SOT1 | pre-test (field) | Distance (m) | 5636.25 | 876.891 | 5674.36 |
| Direction angle (°) | 135.691 | 165.2751 | 31.91 |
| post-test (VR) | Distance (m) | 6254.08 | 1822.756 | 6384.62 |
| Direction angle (°) | 217.487 | 131.0067 | 233.7 |
| SOT2 | pre-test (VR) | Distance (m) | 7238.24 | 1655.805 | 7199.7 |
| Direction angle (°) | 148.25 | 124.1228 | 144.935 |
| post-test (field) | Distance (m) | 4739.81 | 899.2236 | 4479.5 |
| Direction angle (°) | 206.902 | 170.7719 | 327.36 |
Table 5.
Descriptive statistics of distance and direction angle estimations for Mt. Szent György across the test sequences (SOT1: Group 1, Field–VR; SOT2: Group 2, VR–Field).
Table 5.
Descriptive statistics of distance and direction angle estimations for Mt. Szent György across the test sequences (SOT1: Group 1, Field–VR; SOT2: Group 2, VR–Field).
| Mt. Szent György |
|---|
| | | | Mean | SD | Median |
|---|
| SOT1 | pre-test (field) | Distance (m) | 4893.95 | 1532.711 | 4499.55 |
| Direction angle (°) | 251.667 | 16.3904 | 251.14 |
| post-test (VR) | Distance (m) | 5554.01 | 1972.753 | 5031.37 |
| Direction angle (°) | 268.876 | 37.13321 | 263.02 |
| SOT2 | pre-test (VR) | Distance (m) | 6509.71 | 2083.055 | 6229.38 |
| Direction angle (°) | 182.778 | 47.32579 | 187.125 |
| post-test (field) | Distance (m) | 5514.37 | 1182.83 | 5548.41 |
| Direction angle (°) | 240.365 | 10.79157 | 240.655 |
Table 6.
Descriptive statistics of distance and direction angle estimations for Gulács across the test sequences (SOT1: Group 1, Field–VR; SOT2: Group 2, VR–Field).
Table 6.
Descriptive statistics of distance and direction angle estimations for Gulács across the test sequences (SOT1: Group 1, Field–VR; SOT2: Group 2, VR–Field).
| Gulács |
|---|
| | | | Mean | SD | Median |
|---|
| SOT1 | pre-test (field) | Distance (m) | 5137.19 | 970.0271 | 4916.66 |
| Direction angle (°) | 161.215 | 31.24795 | 173.07 |
| post-test (VR) | Distance (m) | 5807.94 | 1777.213 | 5854.52 |
| Direction angle (°) | 170.518 | 61.7691 | 186.78 |
| SOT2 | pre-test (VR) | Distance (m) | 6356.4 | 2031.452 | 6336.56 |
| Direction angle (°) | 158.913 | 45.50392 | 162.47 |
| post-test (field) | Distance (m) | 4828.23 | 1588.983 | 4662.03 |
| Direction angle (°) | 174.24 | 11.04576 | 176.88 |
Table 7.
Descriptive statistics of distance and direction angle estimations for Hegyestű across the test sequences (SOT1: Group 1, Field–VR; SOT2: Group 2, VR–Field).
Table 7.
Descriptive statistics of distance and direction angle estimations for Hegyestű across the test sequences (SOT1: Group 1, Field–VR; SOT2: Group 2, VR–Field).
| Hegyestű |
|---|
| | | | Mean | SD | Median |
|---|
| SOT1 | pre-test (field) | Distance (m) | 6152.14 | 2498.367 | 6418.55 |
| Direction angle (°) | 108.391 | 96.71759 | 93.2 |
| post-test (VR) | Distance (m) | 6787.43 | 1816.49 | 6617.89 |
| Direction angle (°) | 136.672 | 97.37922 | 123.275 |
| SOT2 | pre-test (VR) | Distance (m) | 6440.65 | 2136.144 | 6369.39 |
| Direction angle (°) | 153.814 | 78.22432 | 119.78 |
| post-test (field) | Distance (m) | 7471.49 | 1348.579 | 7293.47 |
| Direction angle (°) | 117.593 | 85.35053 | 120.08 |
Table 8.
Summary of descriptive statistics for distance estimation errors across all examined landmarks.
Table 8.
Summary of descriptive statistics for distance estimation errors across all examined landmarks.
| | | Mean | SD | Median | Min | Max |
|---|
| Badacsony | Distance (m) | 3186.47 | 2257.72 | 2984.51 | 310.98 | 9363.09 |
| Szigliget | 4563.28 | 3396.97 | 4010.20 | 632.38 | 14,831.37 |
| Haláp | 6453.91 | 4532.04 | 5171.19 | 963.55 | 14,112.41 |
| Mt. Szent György | 4753.77 | 3210.20 | 3746.95 | 589.15 | 12,030.22 |
| Gulács | 4431.85 | 3105.03 | 3872.80 | 168.06 | 9294.36 |
| Hegyestű | 7433.80 | 3621.91 | 7797.67 | 2820.55 | 12,491.82 |




 ,
,