Article

Measuring Spatial–Semantic Coupling in Historic Districts Using Space Syntax and the CLIP Model: A Case Study of the South Central Axis Core Area in Beijing

1
School of Architecture and Urban Planning, Beijing University of Civil Engineering and Architecture, Beijing 100044, China
2
School of Urban Economics and Management, Beijing University of Civil Engineering and Architecture, Beijing 100044, China
3
School of Educational Science, Shaanxi Xueqian Normal University, Xi’an 710061, China
4
School of Physical Education, Xi’an University of Architecture and Technology, Xi’an 710055, China
*
Author to whom correspondence should be addressed.
ISPRS Int. J. Geo-Inf. 2026, 15(5), 203; https://doi.org/10.3390/ijgi15050203
Submission received: 20 March 2026 / Revised: 22 April 2026 / Accepted: 5 May 2026 / Published: 7 May 2026

Abstract

The 2024 World Heritage inscription of the Beijing Central Axis shifts the focus of historic district governance to quality-oriented urban regeneration. However, evaluating the precise alignment between infrastructural topology and cultural meaning remains a methodological challenge. To move beyond macro-level assumptions, this study constructs a novel “spatial–semantic coupling” diagnostic framework. Integrating multi-source street-view data, Space Syntax, and the zero-shot semantic extraction capabilities of the CLIP model, we performed high-resolution visual semantic identification across 550 fine-grained sampling points in the 6.6 km2 South Central Axis Core Area. Rather than merely observing a general “decoupling,” our diagnostic tool successfully mapped the complex spectrum of spatial alignments. While it accurately diagnosed areas with “idle spatial potential”—where high Global Integration (Mean = 0.924) fails to translate into Visual Attraction (r = −0.03) or Historical Perception (r = 0.01)—it also precisely identified “Synergistic” heritage cores and “hidden gems” within capillary hutongs. Furthermore, the framework diagnosed a severe “green island” effect (Mean = 0.26) and a structural contradiction between Spaciousness and Historical Perception (r = −0.33). By utilizing Bivariate LISA to geographically pinpoint these varying coupling characteristics (e.g., severe “High–Low” spatial frictions at gateway transportation hubs), this study establishes a highly scalable, data-driven analytical paradigm for targeted micro-renewal, ensuring the precise alignment of physical centrality and cultural perception in complex historic districts globally.

1. Introduction

Against the global backdrop of urbanization shifting from large-scale expansion to quality-oriented regeneration, Space Syntax has emerged as a core tool for understanding urban morphology and social logic, providing fresh theoretical insights for revitalizing the pedestrian environment in historic districts [1,2]. To precisely quantify urban structures within grid-like road networks, scholars have refined algorithmic methods for axial map segmentation [3] and further explored the topological logic of historical street systems during old city grid reconstruction [4]. Such categorical control of urban physical form has been widely applied in studies of spatial evolution in cities like Nanning [5]. Particularly in high-density old urban areas, coupling multi-source data to analyze park accessibility [5], waterfront spaces [6], and the spatial equity of urban parks [7], has become a vital pathway for enhancing human settlement quality. Visual perception and street quality are increasingly recognized as core drivers of this urban vitality [8,9,10]. In 2024, the Beijing Central Axis was officially inscribed on the World Heritage List, marking the entry of post-inscription governance into a phase of refinement. However, as the primary arena for the transition from imperial ritual to folk life, the South Central Axis Core Area (totaling approximately 6.6 km2) carries an extremely complex cultural narrative. Although relevant plans proposed a “Cultural Visit Route” strategy as a skeleton, actual construction faces severe challenges of imbalance between “structural potential” and “perceived quality” due to fragmented historical resources, poor pedestrian connectivity, and inconsistent landscape perception.
To effectively address these complex urban realities, academic evaluation of walking environments is undergoing a critical transition from macro-topology to micro-perception. Contemporary research is leveraging technologies like deep learning to explore visual perception experiences in walking spaces [11], achieving spatial distribution mapping of perception scores in historic districts [12]. By integrating street-view imagery, machine learning, and Space Syntax, researchers can more effectively enhance urban walkability [13]. Utilizing building density and syntactic indicators to sense urban stress [14], and revealing the correlation between dynamic behaviors like cycling or running and the urban environment [15,16], proves the multi-dimensional nature of environmental perception. Moreover, advanced machine learning and visual enclosure metrics provide robust quantitative support for evaluating spatial quality [17,18]. In recent heritage protection practices, the planning of historical and cultural walking paths has gained prominence [19]. Strategies for stitching historical narratives in the Beijing old city and regenerating vitality through heritage routes have been widely discussed [20,21,22]. The thematic integration of architectural heritage [23] and the construction of route networks [24] have become frontier hotspots.
Exploring spatial narratives and interpretation strategies for cultural heritage routes has become a critical evaluation dimension [25,26,27,28,29,30,31]. Consequently, evaluating landscape characteristics, acoustic comfort, and spatial differentiation along cultural routes has been broadly applied globally [32,33,34,35,36,37,38,39]. Furthermore, measuring the walkability, restorative effects, and pedestrian comfort in specific historic districts provides essential data for micro-regeneration [40,41,42,43,44,45,46,47,48]. From Jane Jacobs’ classic “Street Ballet” theory [49] to Allan Jacobs’ definition of Great Streets [50], and the subsequent measurable urban design qualities [51,52], the human scale has always been central. Recent studies further prove this by examining the sustainable configuration of historic districts [53], emotional responses via social media data [54], nonlinear perceptual thresholds [55], and the complex interactions between soundscapes, tree patterns, and host-guest shared perspectives [56,57,58].
Despite these methodological advancements, a critical conceptual gap remains. In general urban planning, it is widely acknowledged that major mobility corridors often prioritize vehicular throughput at the expense of human-scale cultural perception. However, for a globally significant heritage site like the Beijing Central Axis, which is explicitly designated as a “Cultural Visit Route,” any such divergence represents a critical spatial friction rather than a natural urban consequence. Currently, urban planners lack a high-throughput, quantitative diagnostic tool to precisely localize these frictions across complex, non-linear historic districts.
Therefore, this study shifts the analytical paradigm from merely “observing urban phenomena” to “developing a precision diagnostic framework.” We reframe our core research question as: How can we mathematically define, quantitatively measure, and geographically categorize the complex coupling relationships between objective infrastructural topology and subjective cultural perception at a micro-street level?
To answer this, this study takes the 6.6 km2 South Central Axis Core Area as an empirical testbed. We aim to: (1) construct a novel “Structure-Perception” coupling diagnostic tool by integrating Space Syntax with the zero-shot semantic extraction capabilities of the CLIP model; (2) transition from global statistical assumptions to local spatial interventions by mapping the entire spectrum of spatial alignments—not only identifying severe “mismatches” but also uncovering “synergies” and “hidden gems” across 550 fine-grained nodes; and (3) provide a highly scalable, data-driven methodology for organic urban renewal and heritage governance.
To ground these objectives, it is essential to explicitly clarify the theoretical boundaries of the core concept proposed in this study: “spatial–semantic coupling”.
(1)
Theoretical Connotation: This refers to the intrinsic interactive relationship between the objective physical configuration of urban street networks (the “spatial” dimension, representing structural potential and physical accessibility) and the subjective human-scale understanding of the built environment (the “semantic” dimension, representing visual aesthetics, cultural meaning, and psychological perception).
(2)
Denotation: Beyond traditional landscape evaluation, the denotation of this concept extends to complex urban phenomena, encompassing issues such as the spatial (mis)match between infrastructural centrality and cultural perception. It serves as a theoretical lens for explaining the efficiency of heritage value spillover and spatial equity in urban regeneration contexts.
Consequently, the innovations of this study include: (1) Scale Advancement: expanding the research perspective from a single heritage corridor to a complete 6.6 km2 functional urban district; (2) Methodological Foresight: utilizing the Zero-shot inference capability of the CLIP model to significantly enhance the quantitative precision of qualitative indicators like Central Axis cultural imagery; and (3) Decision-Driven Approach: providing data-driven empirical support for cultural heritage protection and organic district renewal.
The remainder of this paper is organized as follows. Section 2 describes the methodological framework, including the specific algorithms of Space Syntax and the CLIP model, and the mathematical definition of spatial–semantic coupling. Section 3 introduces the case study area of the South Central Axis and details the multi-source data acquisition process. Section 4 presents the results of the spatial configuration measurement, visual perception semantics, and the subsequent spatial association diagnosis. Section 5 discusses the planning implications and proposes differentiated urban renewal strategies based on the coupling findings. Finally, Section 6 concludes the study, summarizing its academic value, limitations, and future research directions.

2. Methodology

This study constructs an integrated “configuration–perception” coupling diagnostic framework combining Space Syntax and multi-modal deep learning. The objective is to quantitatively analyze the spatial heterogeneity of the South Central Axis Core Area and its surrounding neighborhoods. The research focuses not only on the physical connectivity of the closed Central Axis skeleton but also utilizes deep learning to simulate multi-dimensional visual perception within the 6.6 km2 composite urban environment. Finally, spatial autocorrelation models are employed to identify the spatial correspondence between physical configuration potential and perceptual quality (see Figure 1).

2.1. Operational Definition of “Spatial–Semantic Coupling”

Before detailing the specific technical models, we must establish the operational definition of “spatial–semantic coupling” for this empirical study. Operationally, it is defined as the quantifiable statistical correlation and geographical synergy between the mathematical indices of road network topology and multidimensional visual perception scores.
Specifically, the “spatial” variables are parameterized as Global Integration and Choice values derived from the Space Syntax model. The “semantic” variables are parameterized as normalized feature scores (0–1) across four dimensions: Historical Perception, Visual Attraction, Spaciousness, and Nature Perception, extracted using the CLIP deep learning model. In this paper, a “coupled” (synergistic) state indicates that high structural centrality geographically aligns with high perceptual quality, whereas a “decoupled” (mismatch) state reveals “idle spatial potential”—where structural importance fails to translate into positive visual semantics. This definition is mathematically executed and verified through bivariate quadrant analysis and Bivariate Local Moran’s I (LISA) clustering.

2.2. Physical Spatial Configuration Measurement: Quantitative Analysis Based on Space Syntax

2.2.1. Road Network Model Construction and Advanced Preprocessing

Utilizing the fundamental road network database established earlier, a high-precision segment map model was constructed using depthmapX software version 0.8.0. To accurately restore the radiation effect of the “Cultural Heritage Route” skeleton on surrounding blocks, the study not only performed fine-grained line breaking on the main axis roads but also fully preserved the topological relationships of connected neighborhood alleys. This approach ensures the model can precisely measure spatial permeability both within the closed route and between the route and high-density residential areas, providing a topological foundation for analyzing how cultural dividends are released through physical spatial configurations.

2.2.2. Definition and Selection of Spatial Configuration Indicators

Integration was selected as the core parameter for measuring spatial structural value. Integration represents the topological centrality of a unit within the system; higher scores indicate a greater potential to attract pedestrian and vehicular flows. This study utilizes Global Integration to assess the importance of sampling points within the macro-urban context. Additionally, Choice was incorporated to reflect the frequency with which a segment is traversed as a “shortcut,” effectively supplementing the description of spatial throughput characteristics.

2.3. Street Visual Perception Semantic Quantization Based on the CLIP Model

To objectively evaluate 550 panoramic photographs on a large scale, we introduced the Contrastive Language-Image Pre-training (CLIP) multimodal deep learning model developed by OpenAI, replacing traditional high-cost and subjective manual evaluation methods.

2.3.1. Evaluation Dimension Design and Prompt Matrix

Tailored to the composite attributes of “heritage protection zones” and “high-density residential neighborhoods,” the study designed four core visual perception dimensions and a corresponding semantic prompt matrix (see Table 1). The Historical Perception dimension focuses on detecting the visibility of heritage symbols; Street Life Vitality aims to capture social interaction features in neighborhoods; Spatial Enclosure/Spaciousness evaluates the contrast between the axis’s macro-scale and the alleys’ compact scale; and Nature Perception Quality measures the contribution of vegetation to street attraction. By comparing positive and negative prompts, complex urban visual imagery is converted into standardized semantic feature values.

2.3.2. Cross-Modal Feature Extraction and Perception Scoring

The CLIP model utilizes an image encoder and a text encoder to map the 550 panoramic sampling photos and their corresponding semantic prompts into the same high-dimensional continuous feature space. The research quantitatively characterizes the perceptual intensity of each street view image across specific dimensions by calculating the Cosine Similarity between image and text feature vectors. The calculated raw scores undergo 0-1 normalization to obtain the final perception scores for the 550 points across four dimensions, providing data support for analyzing the divergence or synergy between the heritage route skeleton and its neighborhoods.

2.4. “Configuration–Perception” Coupling Diagnosis and Spatial Association

2.4.1. Coupling Classification Logic: Quadrant Analysis

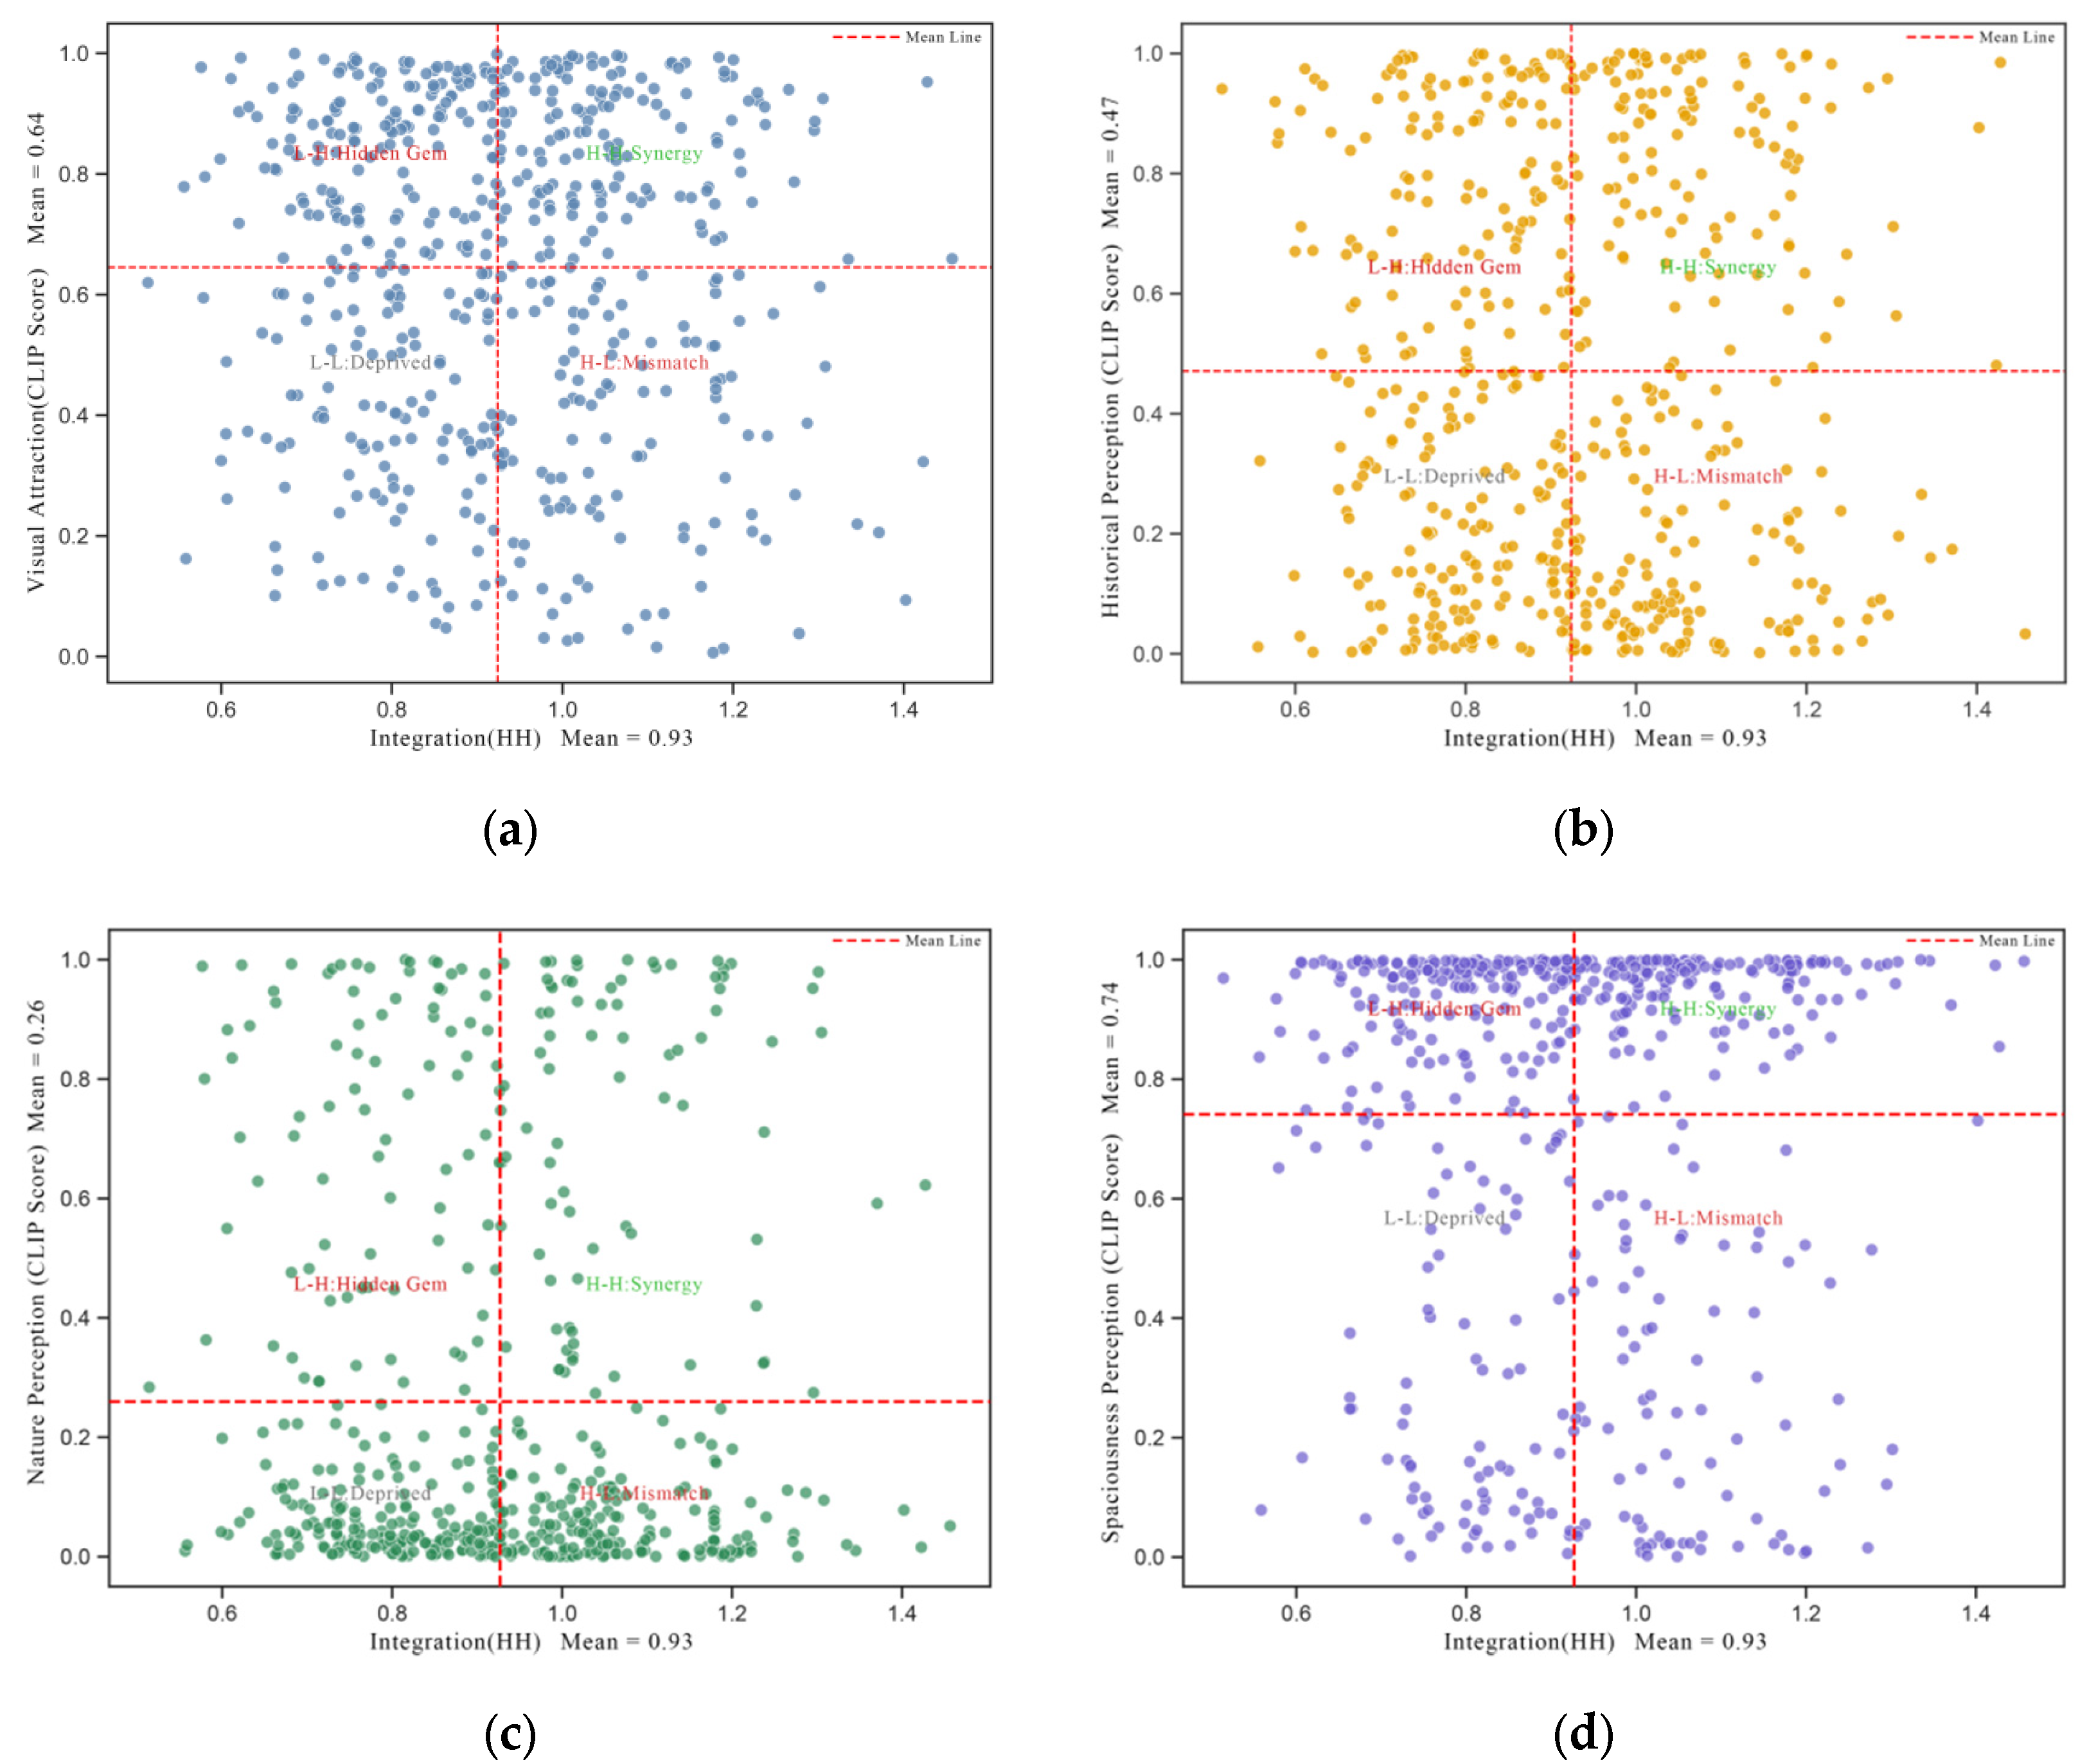
The study employs a bivariate quadrant analysis method. With spatial integration as the x-axis and visual perception scores as the y-axis, sampling points are classified into four typical coupling modes based on the Mean Line of each indicator:
Synergistic Mode (HH): Represents exemplary spaces with both high structural importance and high perceptual quality.
Mismatch Mode (HL): Reveals areas with high structural potential but significantly lagging visual quality; these are core targets for precision renewal.
Potential Mode (LH): Denotes potential points with secluded locations but unique cultural or aesthetic value.
Passive Mode (LL): Refers to spaces where both physical configuration and perceptual quality urgently require improvement.

2.4.2. Spatial Association Analysis: Bivariate LISA

To further verify whether the aforementioned coupling patterns exhibit statistically significant clustering in geographical space, this study introduces the Bivariate Local Moran’s I for spatial significance testing. The calculation formula is as follows:
I i = z i j ω i j z j
where z i represents the standardized value of spatial integration at point i , and z j represents the standardized score of the perceptual dimension within the neighborhood. By calculating the local spatial weight matrix, the model can identify significant synergistic clusters (High–High) and mismatch clusters (High–Low/Low–High), generating Local Indicators of Spatial Association (LISA) cluster maps. To ensure the statistical reliability of these spatial clusters, the empirical pseudo-significance was robustly assessed using 999 Monte Carlo permutations, and the significance level threshold for filtering the clusters was strictly set at p < 0.05. This method enables the precise localization of significant patches along the South Central Axis where “spatial dividends have not been fully released” or “landscape quality is severely lacking,” providing empirical evidence for differentiated precision renewal strategies based on the “configuration–perception” logic.

3. Case Study and Data Source

3.1. Study Area Overview and Spatial Definition

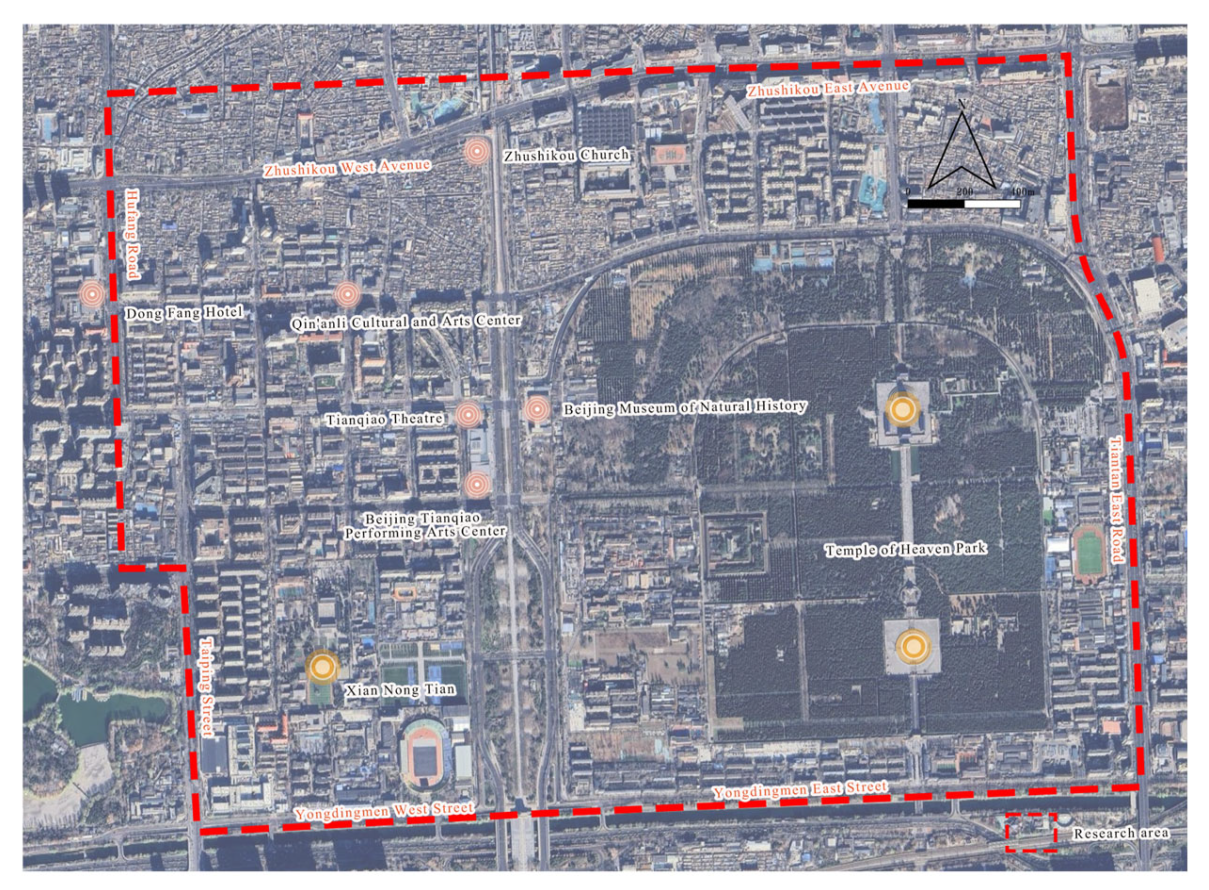
This study focuses on the core area in the southern part of old Beijing, defined as the “South Central Axis Core Area” (see Figure 2). The area is bounded by Zhushikou East and West Avenues to the north, Yongdingmen East and West Streets to the south, Taiping Street and Hufang Road to the west, and Tiantan East Road to the east, with a total research area of approximately 6.6 km2.
As the most complex intersection of the relationship between the “Capital” (ritual center) and the “City” (civilian life) in old Beijing, the area deeply integrates the grand ritual spaces centered on the Temple of Heaven (Tiantan), the folk performance district represented by Tianqiao, and the modern commercial hub of Zhushikou. The coexistence of these multi-dimensional spatial attributes provides an extremely profound and representative research sample for exploring the coupling relationship between physical spatial configuration and human visual perception.

3.2. Rationale for Research Sample Selection and Academic Value

The selection of the South Central Axis Core Area as the research object is primarily based on its profound cultural complexity and representativeness for urban stock regeneration. First, the highly heterogeneous spatial attributes within the district provide a complex semantic context for multi-dimensional visual perception measurement using the CLIP model. Second, compared to the North Central Axis, this area possesses high road network centrality but faces realistic shortcomings such as poor pedestrian connectivity, insufficient penetration of ecological dividends, and a lack of visual landscape harmony. In the context of “no more demolition” in the old city, expanding the research scale from a single linear path to a complete 6.6 km2 closed area (see Figure 3) allows for a more systematic measurement of how cultural dividends radiate into deep neighborhood alleys through the road network skeleton. This provides a scientific diagnostic basis for the precision governance of historical and cultural districts.

3.3. Road Network Data Acquisition and Model Preprocessing

Fundamental road network data for the study area was extracted from the OpenStreetMap (OSM) platform and underwent precise geometric calibration against Amap (Gaode Maps). To address topological errors in the raw vector data, the road network covering the entire area was imported into the AutoCAD 2021 environment for rigorous topological cleaning. During this process, dead-end roads were manually corrected, and line-breaking operations were executed at complex intersections to ensure the model accurately restores the actual connection logic of urban streets. The final Segment Map fully restores the topological relationships from the north–south main roads of the Central Axis to the intricate neighborhood alleys, providing a high-precision base map for subsequent calculation of spatial configuration indicators and analysis of value penetration patterns.

3.4. Street View Imagery Sampling and Perception Database Construction

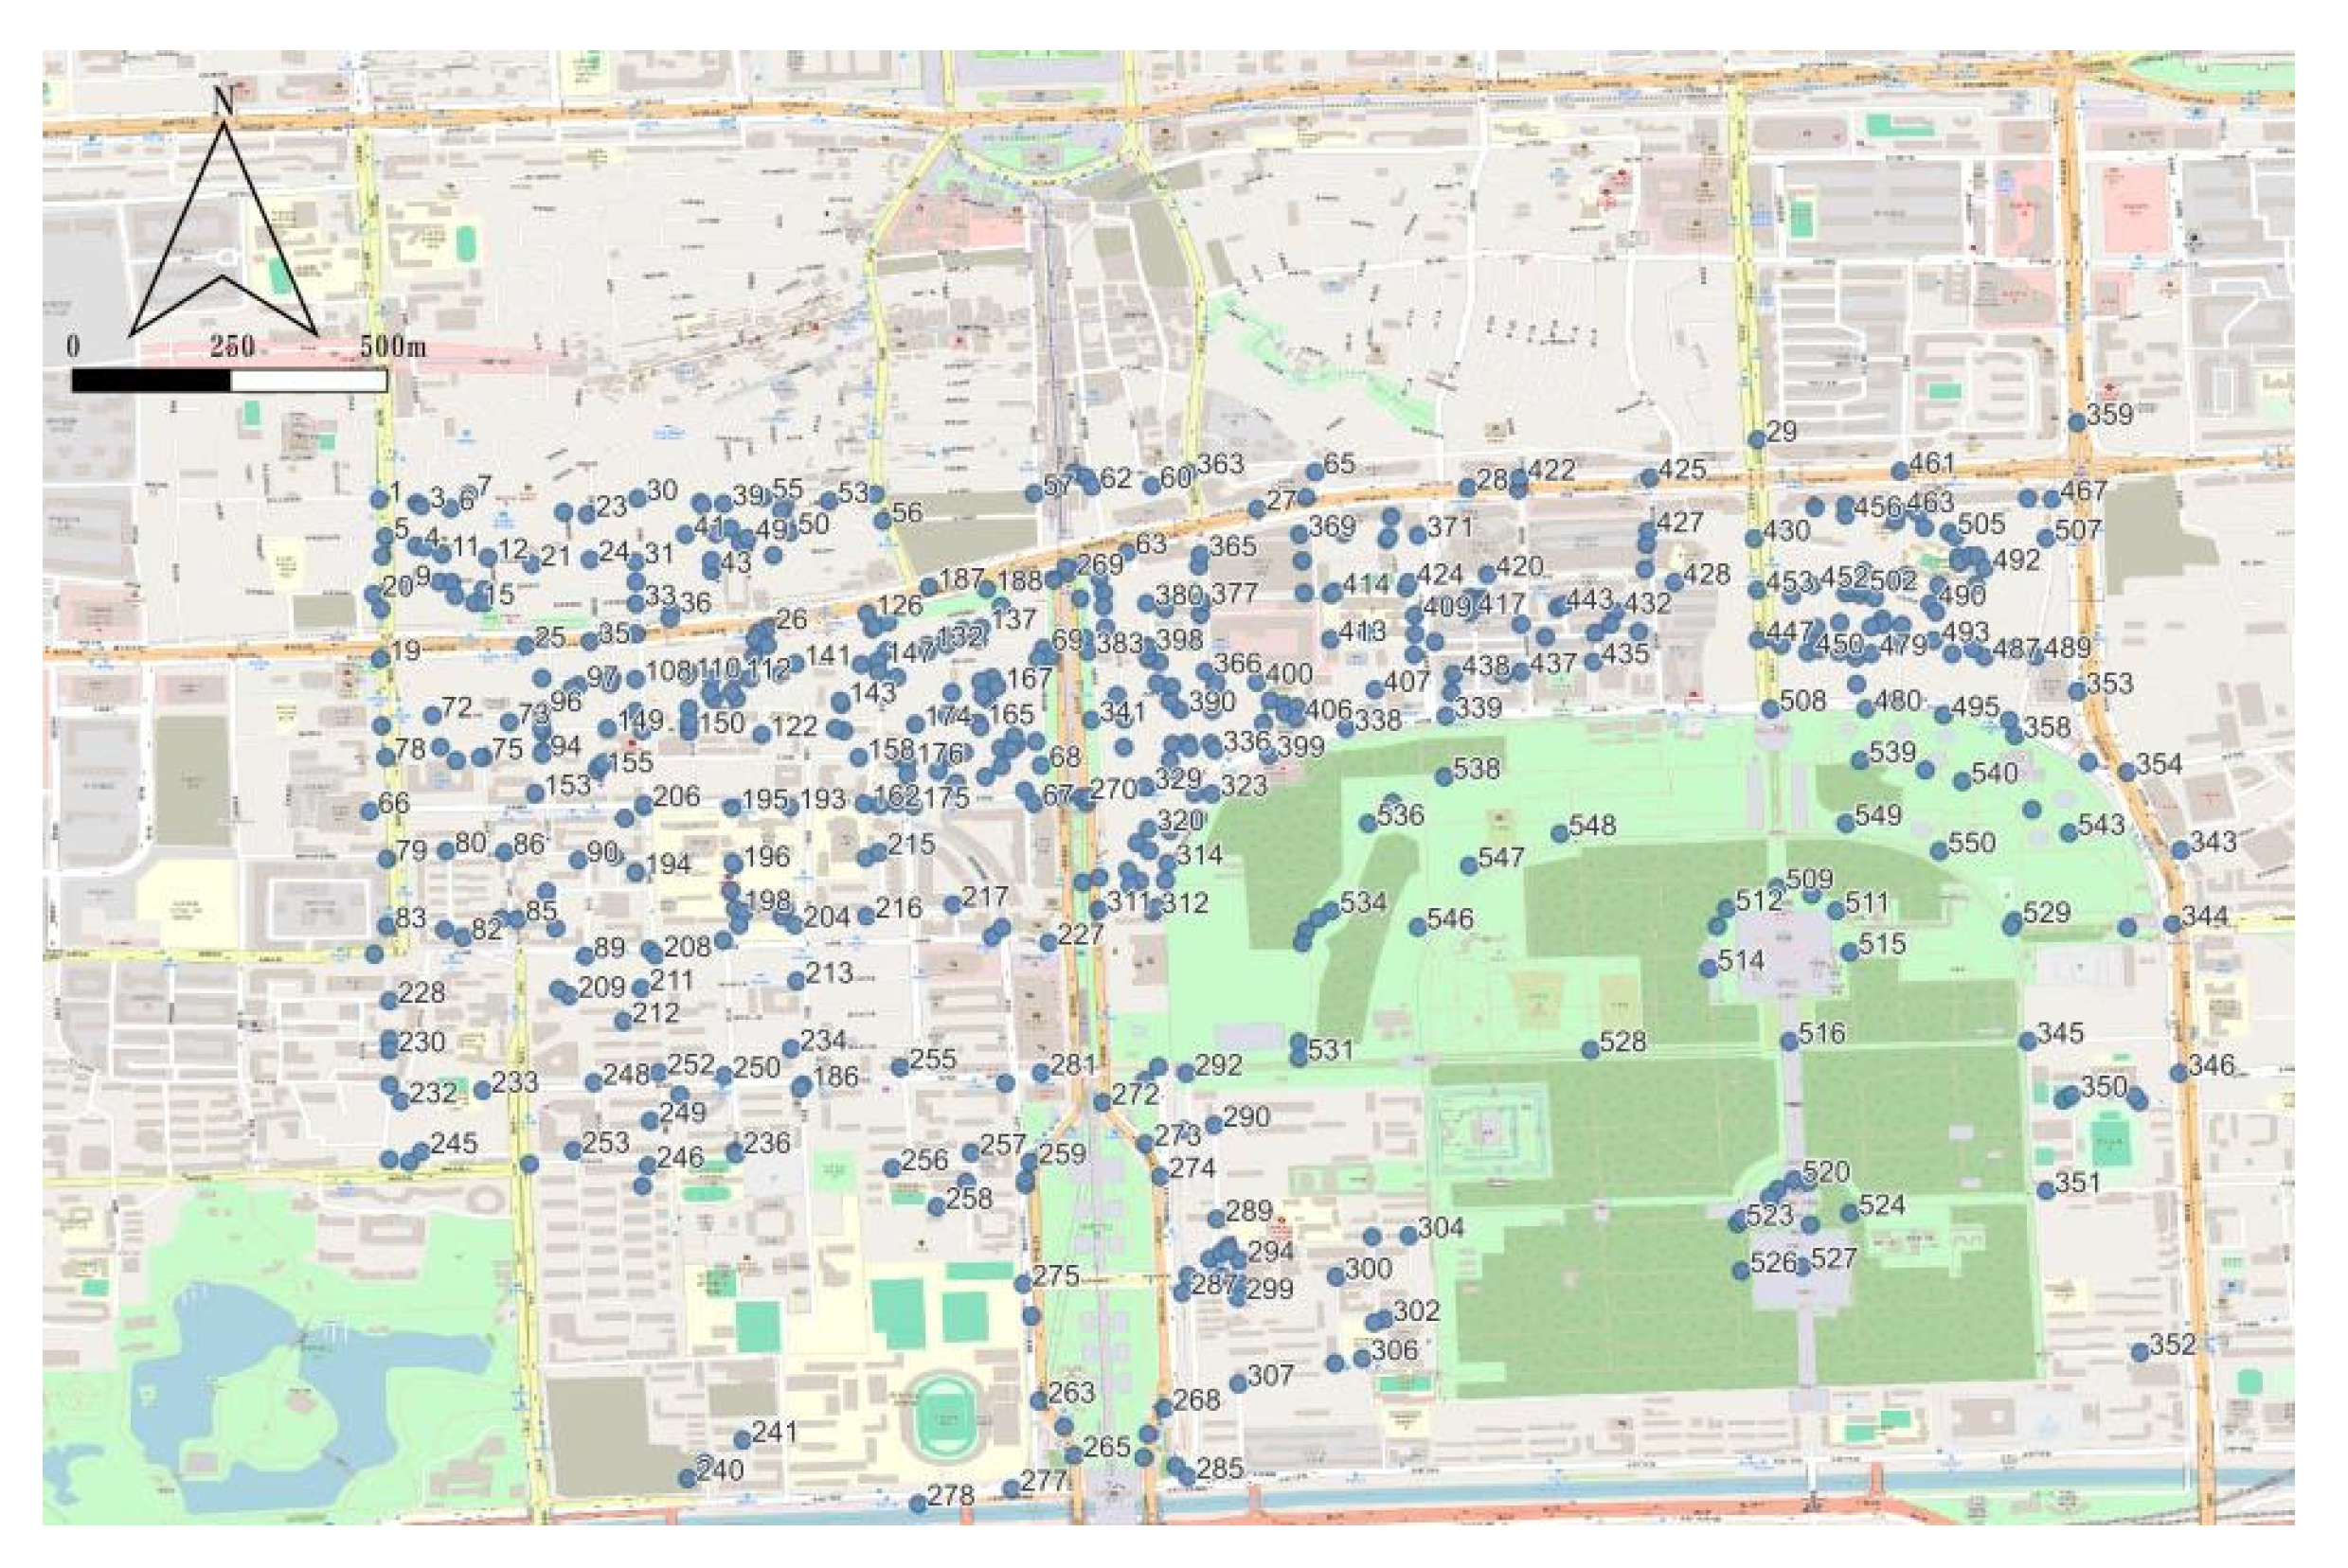
To achieve a refined representation of visual characteristics, a street view image database was constructed via the Baidu Maps Panorama API. The sampling strategy employed equidistant sampling at 50 m intervals, capturing 550 points across the primary road network and neighborhood alleys (see Figure 4).
The rationale for selecting a 50 m equidistant interval lies in its suitability for micro-scale walkability and visual perception measurement. According to existing urban morphology studies, a 50 m distance corresponds to roughly a one-minute walking experience, which is sensitive enough to capture continuous shifts in visual scenes (such as changes in building facades, street trees, and hutong intersections) without causing severe image redundancy from overlapping horizontal Fields of View (FOVs). Furthermore, the sample size of 550 points naturally derives from applying this 50 m interval strictly along the cleaned topological road network. Regarding spatial representativeness, these 550 points span the complete spatial hierarchy of the 6.6 km2 study area. Rather than being confined to the macro-narrative arterial roads (e.g., the Central Axis and Zhushikou Avenues), a significant proportion of the points deeply penetrates the capillary-like residential hutongs. This balanced distribution comprehensively represents the dual spatial attributes of the district—the grand ritual center and the folk life neighborhoods—ensuring that the subsequent “spatial–semantic” coupling analysis is built upon a highly representative and unbiased empirical foundation.
During image capture, a Python (version 3.13) script was used to set a horizontal Field of View (FOV) of 90°, simulating the actual visual field of a pedestrian walking in the street. Given the coordinate system differences between OSM and Baidu Maps, a non-linear calibration algorithm ensured precise mapping of sampling locations. All images were selected from recent summer, sunny-day samples and underwent manual cleaning to remove lens obstructions and invalid data, resulting in a high-quality visual database supporting multi-dimensional perception measurement.

4. Results and Analysis

This study conducted a deep mining of the quantitative data from 550 sampling points to systematically analyze the configuration patterns of spatial structures in the South Central Axis Core Area and their spatial associations with multi-dimensional visual perception. The study aims to identify synergistic or divergent areas between physical spatial potential and landscape perceptual quality, providing a scientific basis for precision urban regeneration in the capital’s core functional zone.

4.1. Descriptive Statistics and Spatial Distribution of Visual Perception

4.1.1. Statistical Measurement Characteristics of Visual Perception Dimensions

Statistical analysis reveals significant non-equilibrium across different dimensions of visual perception in the South Central Axis Core Area (see Table 2). Spaciousness exhibits the highest Mean value (0.741), validating the scale characteristics of the Central Axis as a macro-narrative urban space, particularly showing strong visual transparency at nodes like Yongdingmen Square. Conversely, Nature Perception shows the lowest Mean (0.260), reflecting a pervasive lack of ecological perception at the street level; green landscapes are primarily confined within enclosed large parks rather than continuous street interfaces. Notably, the Std of Historical Perception is the highest (0.351), indicating a strong “fragmented” characteristic where the transmission of cultural heritage between northern and southern segments suffers from significant discontinuities.

4.1.2. Spatial Heterogeneity of Visual Perception

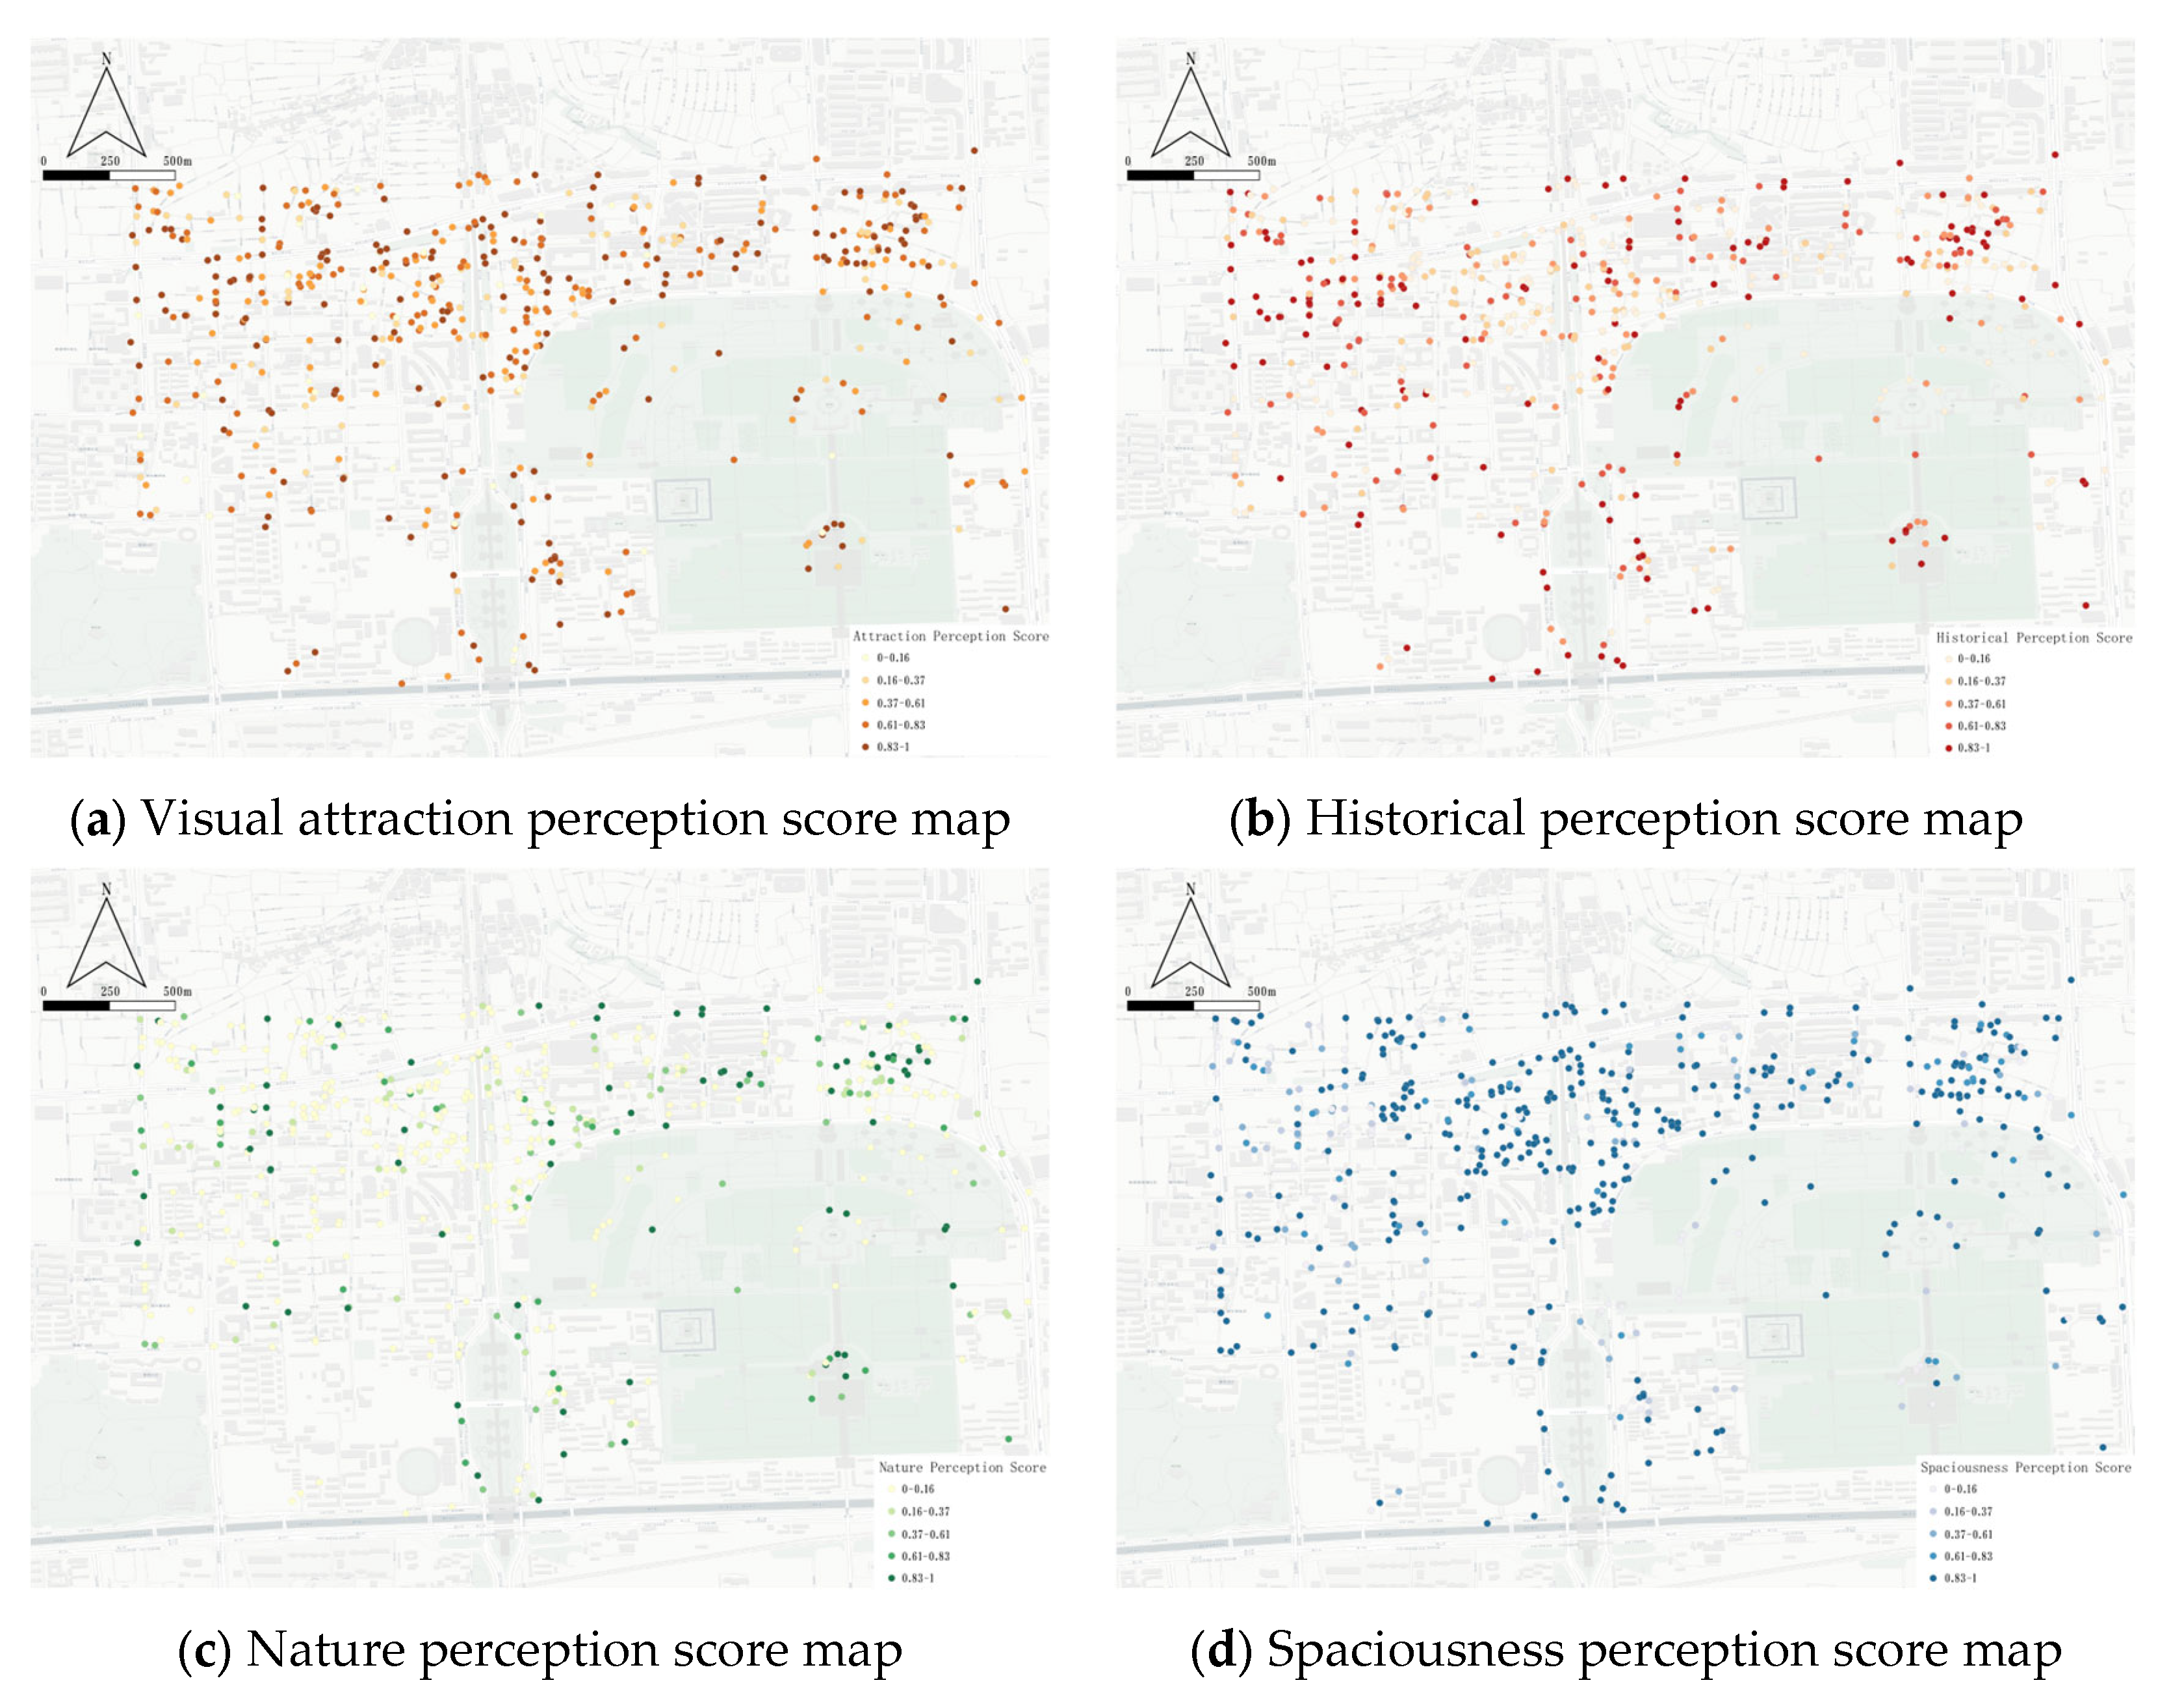
Visual perception evaluations in the South Central Axis Core Area exhibit distinct “polar-core aggregation” and “peripheral decay” patterns (see Figure 5). High-value clusters of Historical Perception and Visual Attraction show high spatial isomorphism, primarily concentrated within core protection zones centered on Temple of Heaven Park and Xiannongtan, reflecting the strong support of deep cultural heritage for street visual quality. However, outside these zones—particularly moving north toward the Zhushikou commercial area or south toward the Yongdingmen Bridge hub—both indicators show significant stepwise declines, revealing a severe cultural perception gap between the core protection zones and surrounding areas.
The Nature Perception dimension reveals an extreme “strong inside, weak outside” imbalance, with high-score points almost entirely restricted within large heritage parks, creating a distinct “green island” phenomenon. In street spaces immediately adjacent to parks, limited by dense hard pavement and a lack of continuous shade trees, scores remain low, indicating that the ecological dividends of green landscapes have not yet effectively penetrated into street micro-spaces. In contrast, Spaciousness shows the most continuous spatial performance, with peaks distributed at the plaza in front of Yongdingmen Gate and major intersections, forming a visual support for the overall skeleton of the Central Axis.

4.2. Coupling Analysis of Physical Structure and Visual Perception

4.2.1. Correlation Between Physical Centrality and Perceptual Semantics

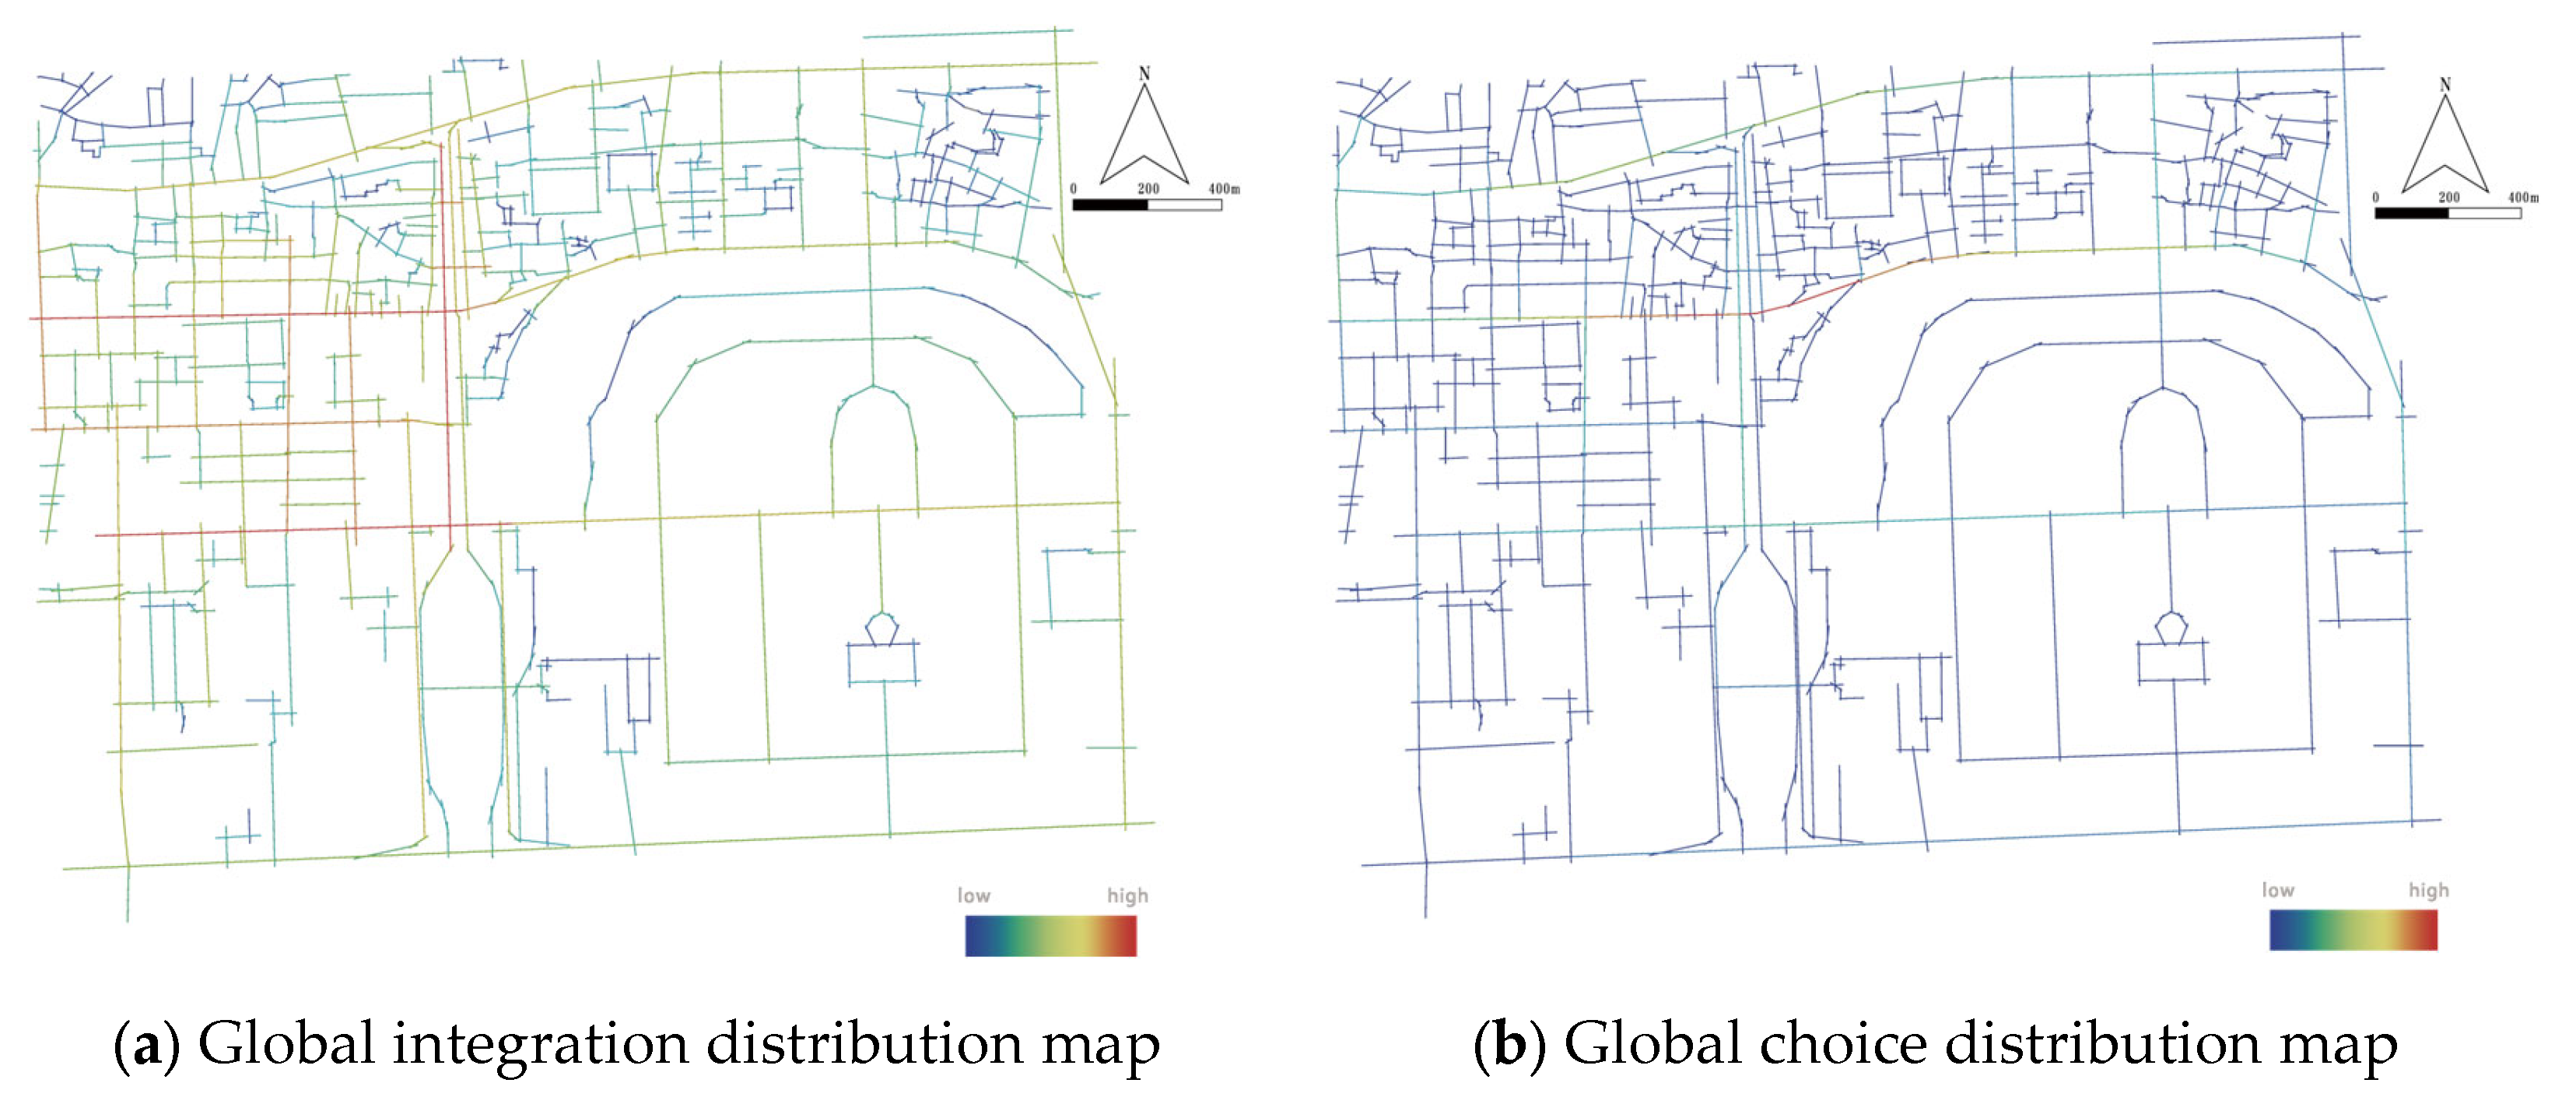
(1) Global Integration Analysis: Figure 6a displays the Global Integration (Integration) distribution of the study area. The results show extremely high topological centrality, with a Mean Integration of 0.924. The South Central Axis Core Area exhibits a prominent “axial-driven” morphology, where high-integration segments (red and orange zones) precisely cover the Tiantan West Road–Tianqiao segment, forming a north–south spatial energy highland. This indicates that the Central Axis skeleton possesses immense destination attraction potential for large-scale pedestrian flows.
(2) Global Choice Analysis: Figure 6b reveals the potential of the road network to be traversed as “shortcuts”. Unlike the axial concentration of integration, high Choice (Choice) values are distributed across secondary trunk roads and neighborhood alleys that carry transit functions. Tiantan West Road and Zhushikou East/West Avenues show significant throughput capacity, reflecting their roles as both cultural narrative carriers and vital nodes in the regional traffic micro-circulation.
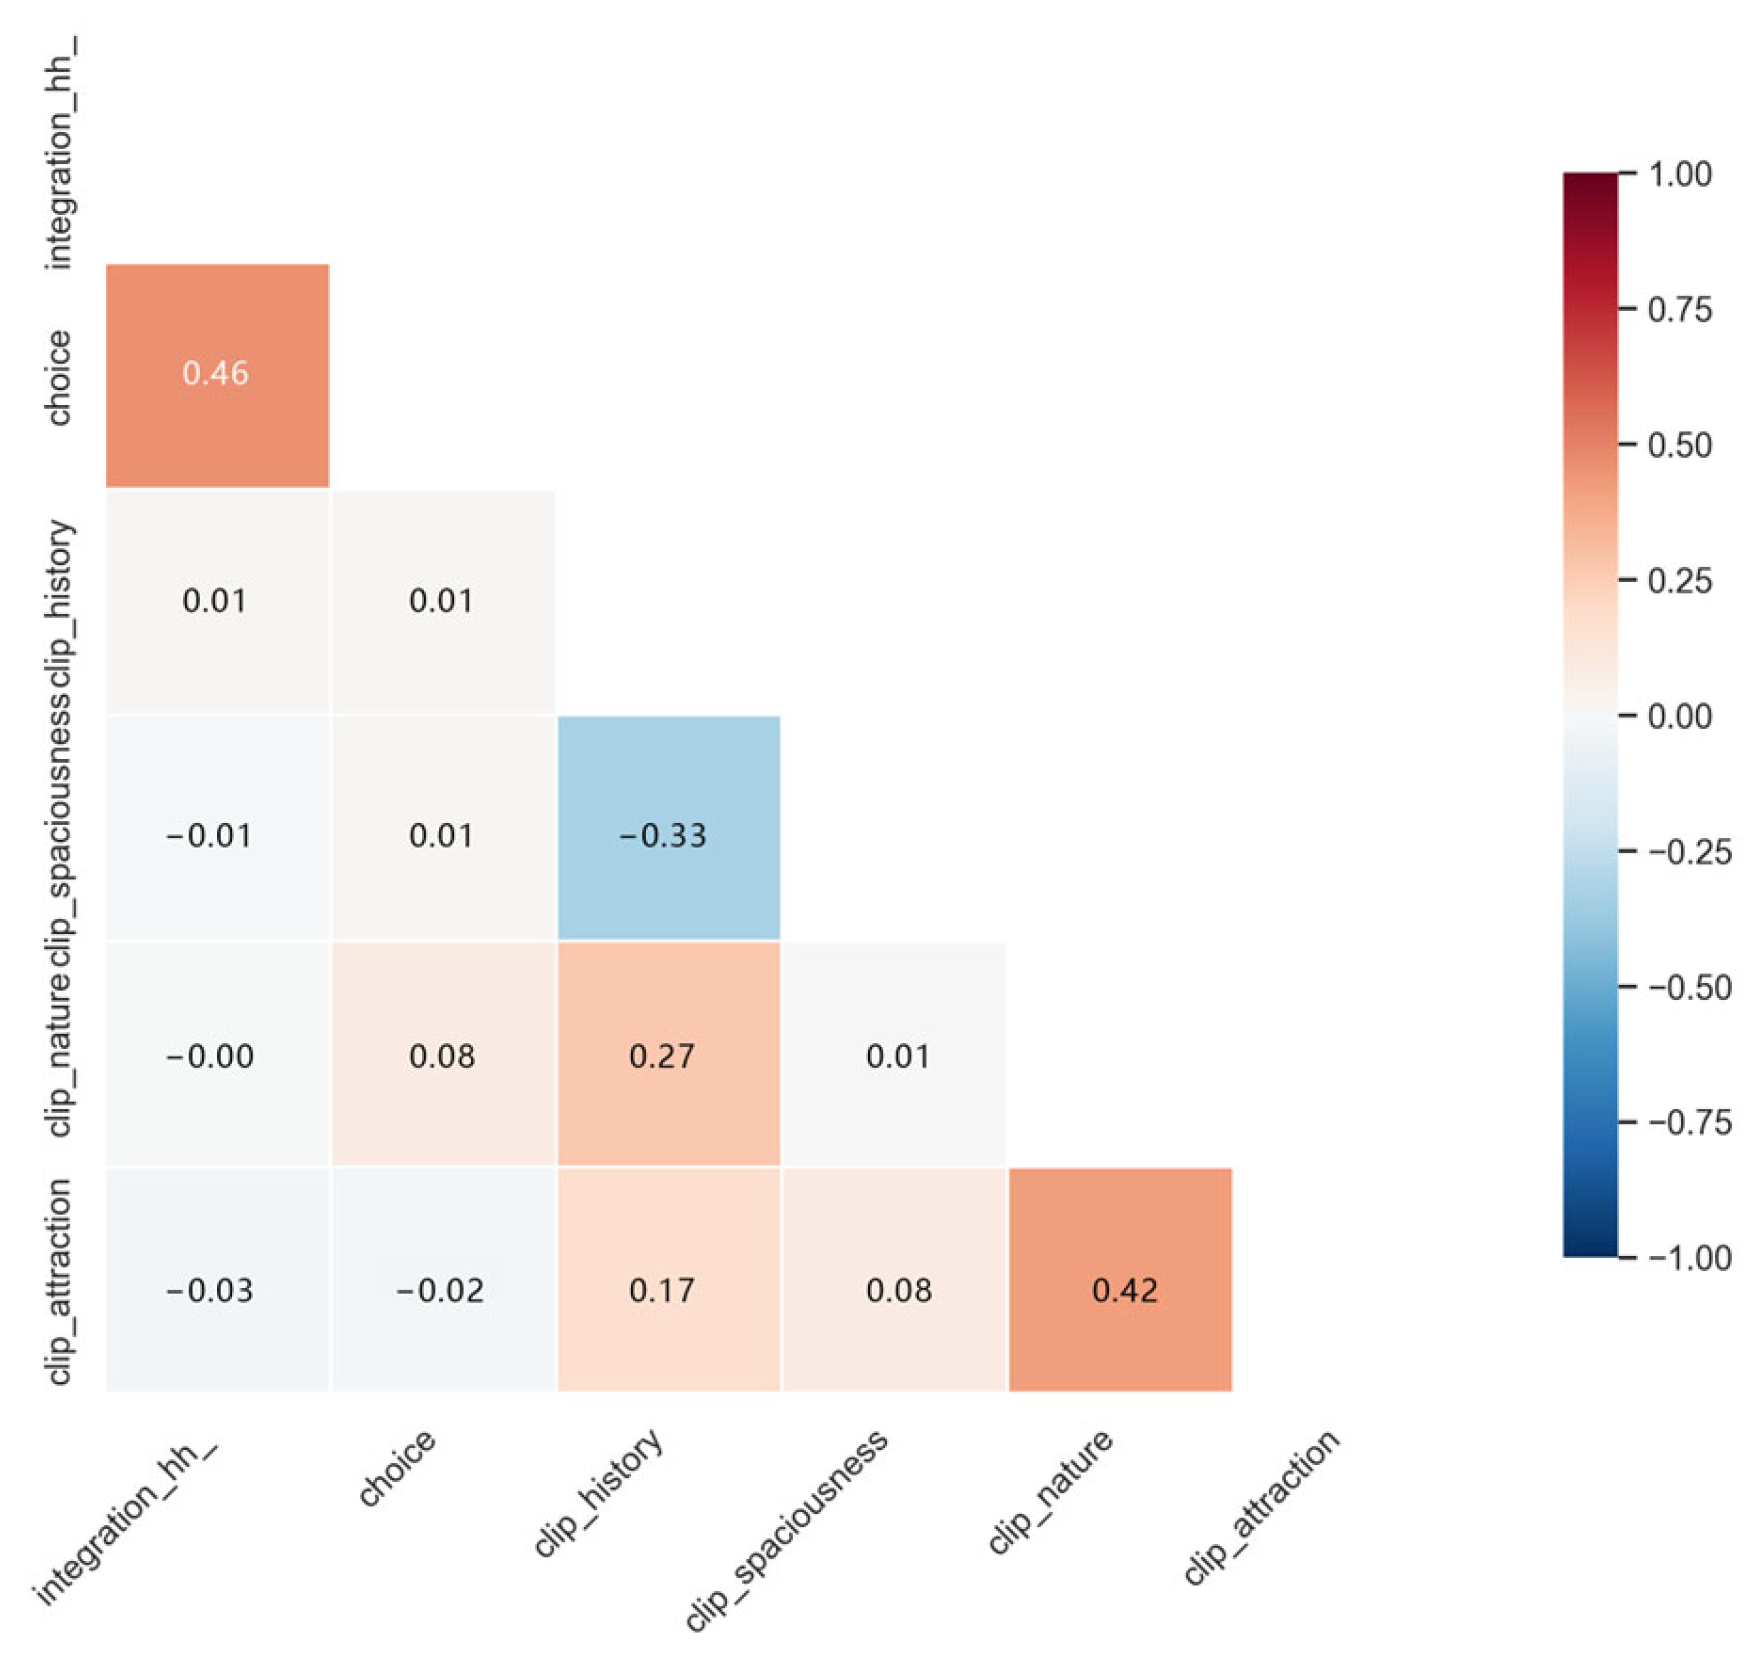
To quantitatively explore the inherent association between spatial configuration and visual perception, Pearson correlation analysis was conducted (see Figure 7). Data confirms a significant “decoupling” characteristic: Global Integration shows near-zero correlation with Attraction (r = −0.03), Historical Perception (r = 0.01), and Nature (r = −0.00).
This divergence reveals a “Function–Quality Mismatch” within the study area: the topological centrality of the road network brings potential “spatial dividends” in terms of traffic, but these have not spontaneously translated into equivalent landscape visual experiences. In the context of urban regeneration, configuration efficiency determines potential crowd distribution, while visual perception quality determines the stay value of a space. The northern Zhushikou commercial area and southern Yongdingmen Bridge hub, despite having high integration (Mean = 0.924), show historical and attraction scores significantly below average. This is attributed to these segments being overburdened with transit functions, where modern infrastructure and disordered commercial interfaces have physically and visually fragmented the historical axis narrative.
Furthermore, internal correlations between perceptual dimensions reveal inherent contradictions in spatial quality. A significant negative correlation between Spaciousness and Historical Perception (r = −0.33) reflects the conflict between “macro-scale spaces” and “micro-cultural perception”—modernized nodes with open views often lack historical detail, while areas with deep historical imagery are often restricted by compact spatial scales. Conversely, the strong positive correlation between Attraction and Nature (r = 0.42) proves that green ecological elements are core drivers of axial visual charm.

4.2.2. Coupling Feature Recognition Based on Quadrant Classification

Utilizing bivariate quadrant analysis, 550 points were classified into four typical coupling modes (see Figure 8):
Synergy (H–H): Mainly distributed in segments like Tiantan West Gate and Qianmen Street. These areas achieve high integration and high attraction (Mean = 0.645), unifying spatial potential with aesthetic quality.
Mismatch (H–L/L–H): This represents the core contradiction identified by the study. A large number of points fall into the mismatch quadrant (High Integration–Low Perception), reflecting that although these segments have high spatial weight, their dividends remain “idle” due to interface clutter or incongruent modern architectural styles.

4.3. Geographic Identification of Spatial Coupling and Conflict Diagnosis

4.3.1. Spatial Coupling Pattern Identification Based on Bivariate LISA

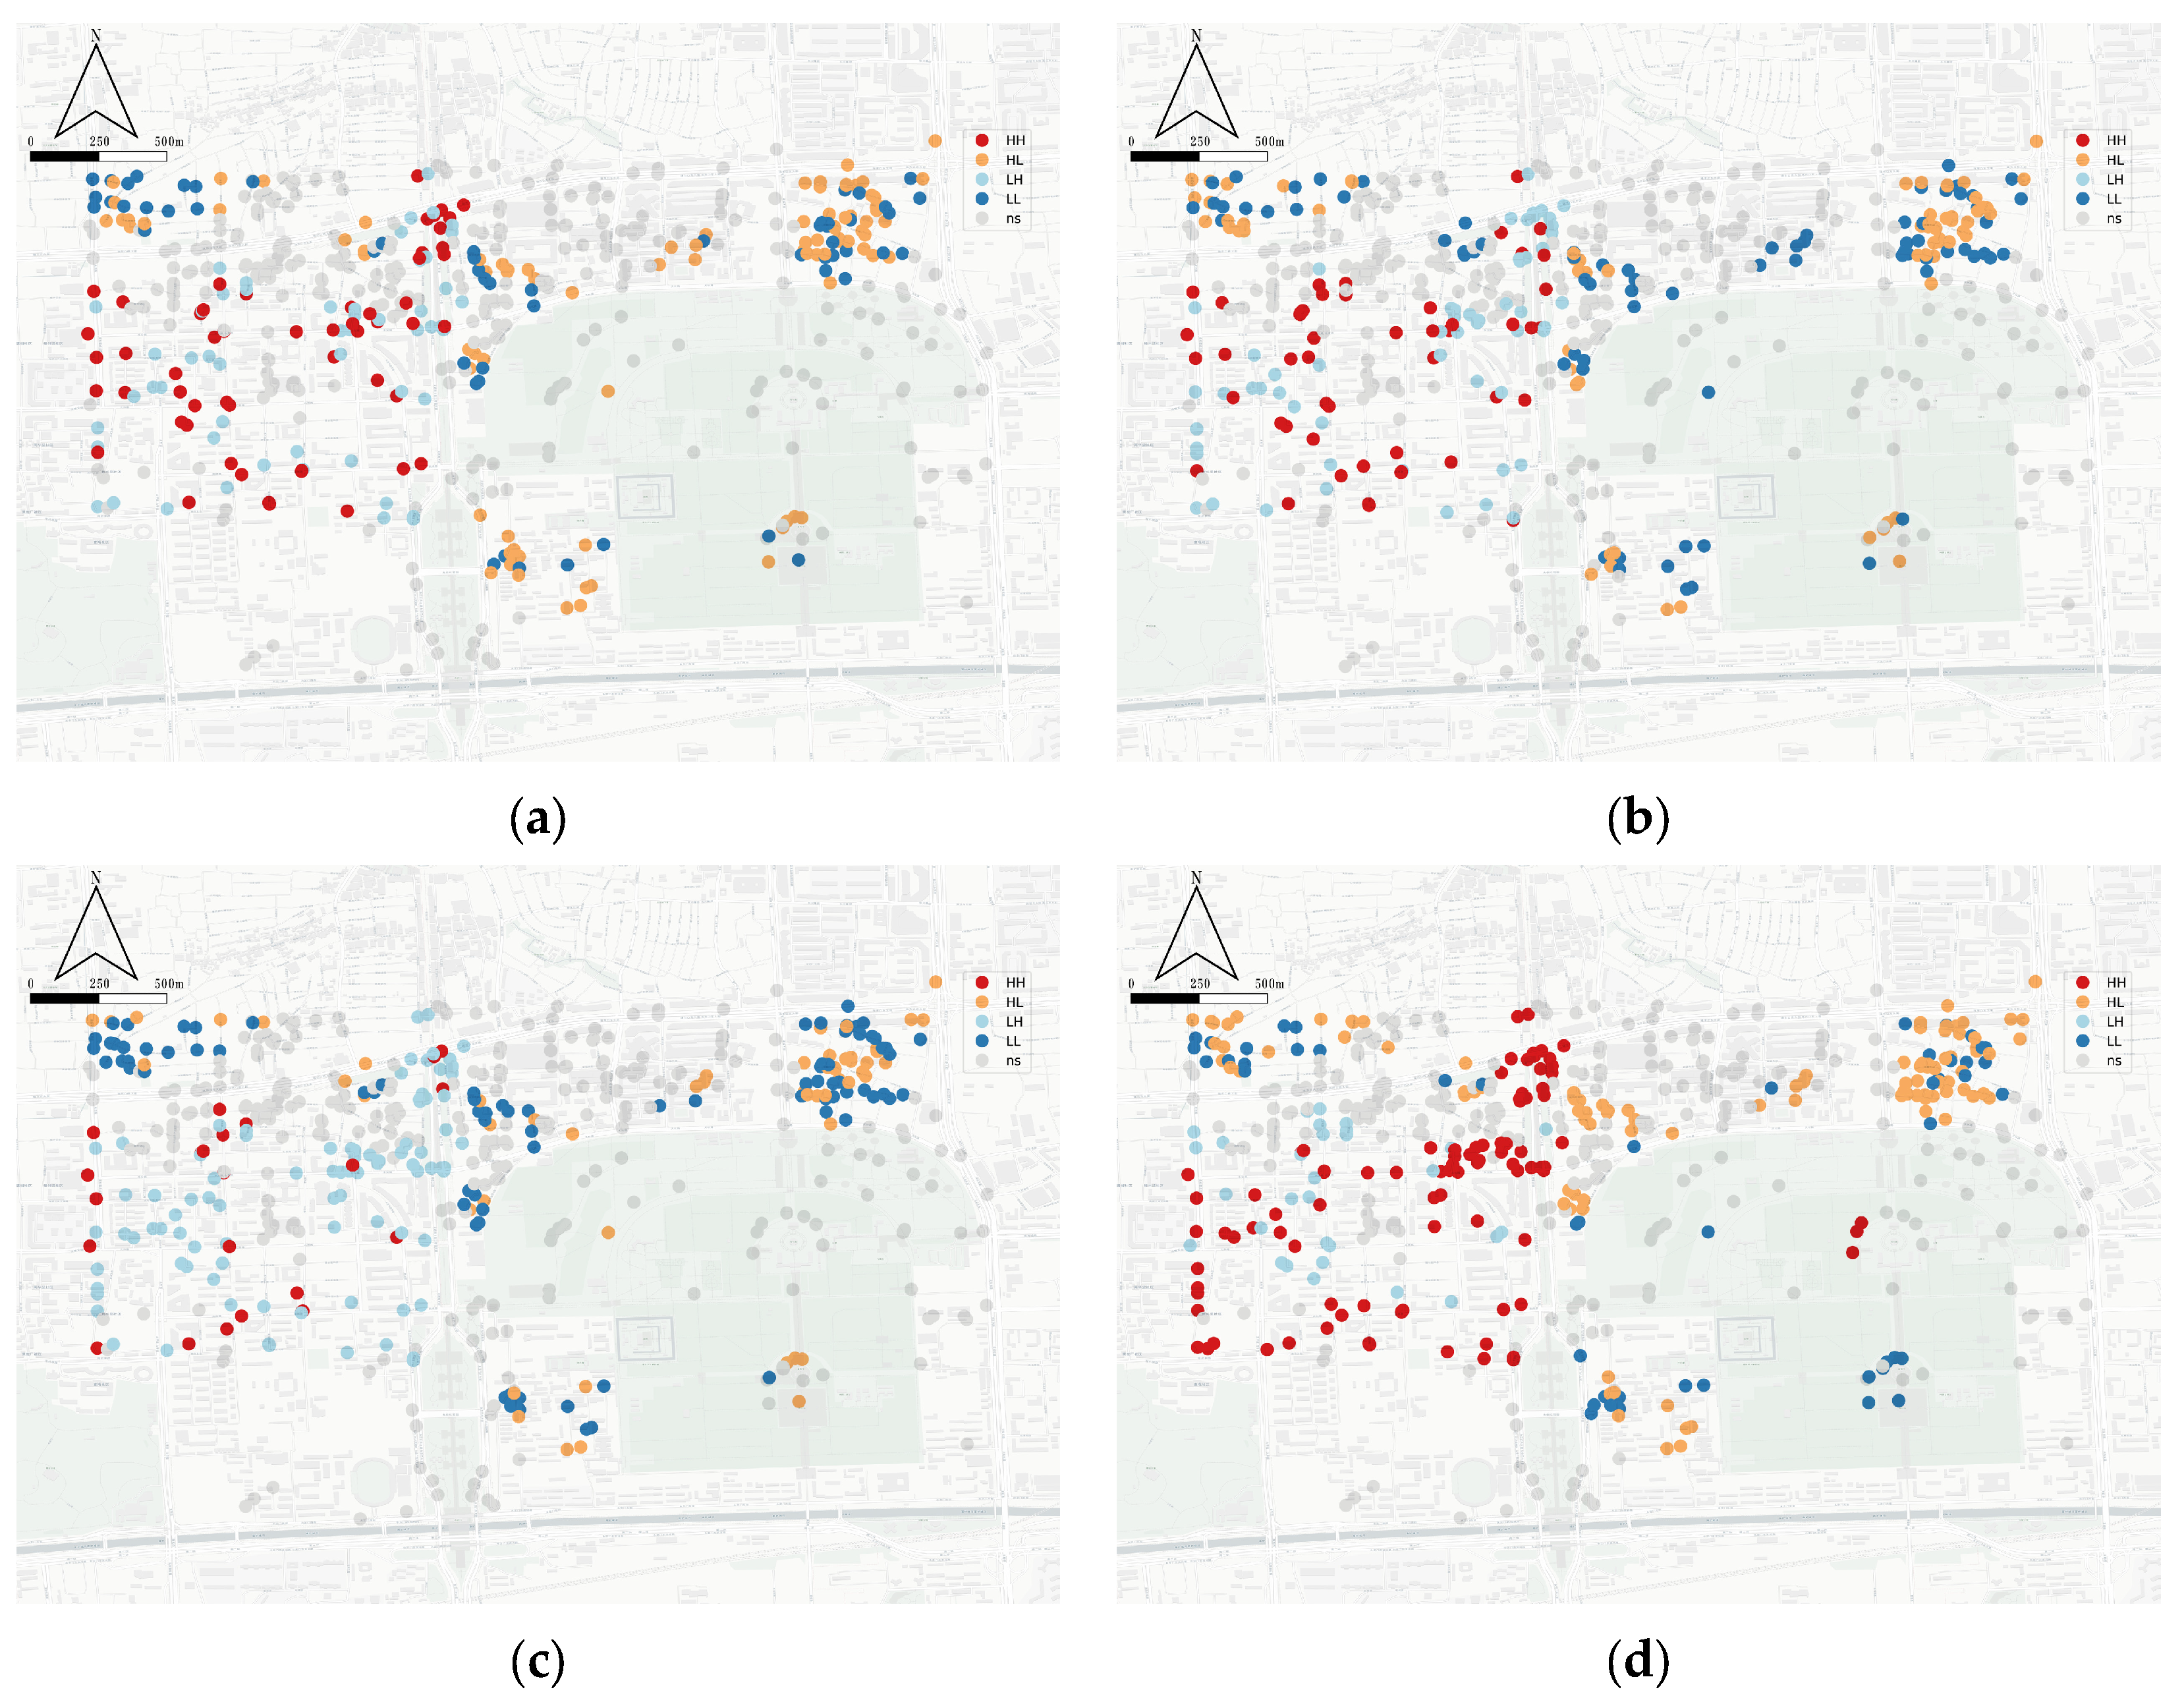
Significance detection using the Bivariate Local Moran’s I precisely localizes the “configuration–perception” coupling contradictions of the core section in geographical space (Figure 9). The clustering results reveal three typical geographical clusters of the South Central Axis within the processes of cultural heritage protection and urban regeneration:
Significant Synergistic Clusters—Heritage Core Exhibition Zone: Red HH (High–High) clusters are primarily concentrated in the central Tiantan West Road–Tianqiao segment of the study area. This pattern is particularly prominent in the “Integration–Attraction” and “Integration–Historical Perception” cluster maps. This zone possesses the highest Global Integration along the entire axis; benefiting from deep cultural heritage and superior landscape quality, it achieves a high degree of unity between physical spatial potential and visual beauty, serving as the most successful “configuration–quality” synergistic model for the South Central Axis.
Significant Mismatch Clusters—Peripheral Quality Lagging Zone: Yellow HL (High–Low) mismatch clusters exhibit a distinct “north–south pincer” layout. The southern end is mainly distributed north of Yongdingmen Bridge and the southern section of Tiantan East Road, while the northern end is concentrated along Zhushikou East and West Avenues. Despite their locations along core urban traffic or commercial arteries and their extremely high spatial configuration centrality, these areas represent significant “perceptual depressions” in the dimensions of Nature Perception and Historical Perception. This is due to chaotic interface styles and the obstruction of historical–cultural symbols by modern advertisements or elevated transport hubs. This “idle spatial potential” phenomenon reveals a structural contradiction where road network centrality has not spontaneously translated into landscape value.
Recluse Clusters—Neighborhood Potential Discovery Zone: Light blue LH (Low–High) clusters are mainly distributed north of Temple of Heaven Park and along the neighboring residential alleys. Although these areas occupy peripheral levels of low integration within the topological network, their perception scores transcend structural limitations due to high-quality greenery or a unique sense of community tranquility. Especially in the “Integration–Nature Perception” cluster map, these “recluse spaces” demonstrate immense visual potential, serving as key nodes for the future penetration of slow-traffic systems into neighborhoods.

4.3.2. Comprehensive Diagnosis of “Configuration–Perception” Heterogeneity

Combining the Pearson correlation analysis and LISA cluster results, the South Central Axis Core Area exhibits an overall morphology of “strong configuration, weak perception”.
(1)
Roots of Coupling Divergence: The study finds that high-integration areas (e.g., the Yongdingmen Bridge hub) often carry excessive traffic functions, resulting in a macro-scale environment that lacks micro-level details. This leads to a significant negative correlation between spaciousness and historical perception (r = −0.33).
(2)
Obstruction of Ecological Dividends: Nature perception scores are generally low across the entire line (Mean = 0.26) and exhibit fragmented characteristics in the LISA maps, confirming the existence of “green islands”.
(3)
Identification of Renewal Directions: The identified HL significant mismatch clusters are the “bottleneck” areas hindering the spillover of heritage value along the South Central Axis. Future renewal focus should shift from simple path skeleton optimization to the precise repair of “visual weaknesses” within HL clusters. This approach aims to achieve a synergistic improvement from “spatial configuration” to “visual experience”.

4.3.3. Ground-Truth Validation with Real-World Observations

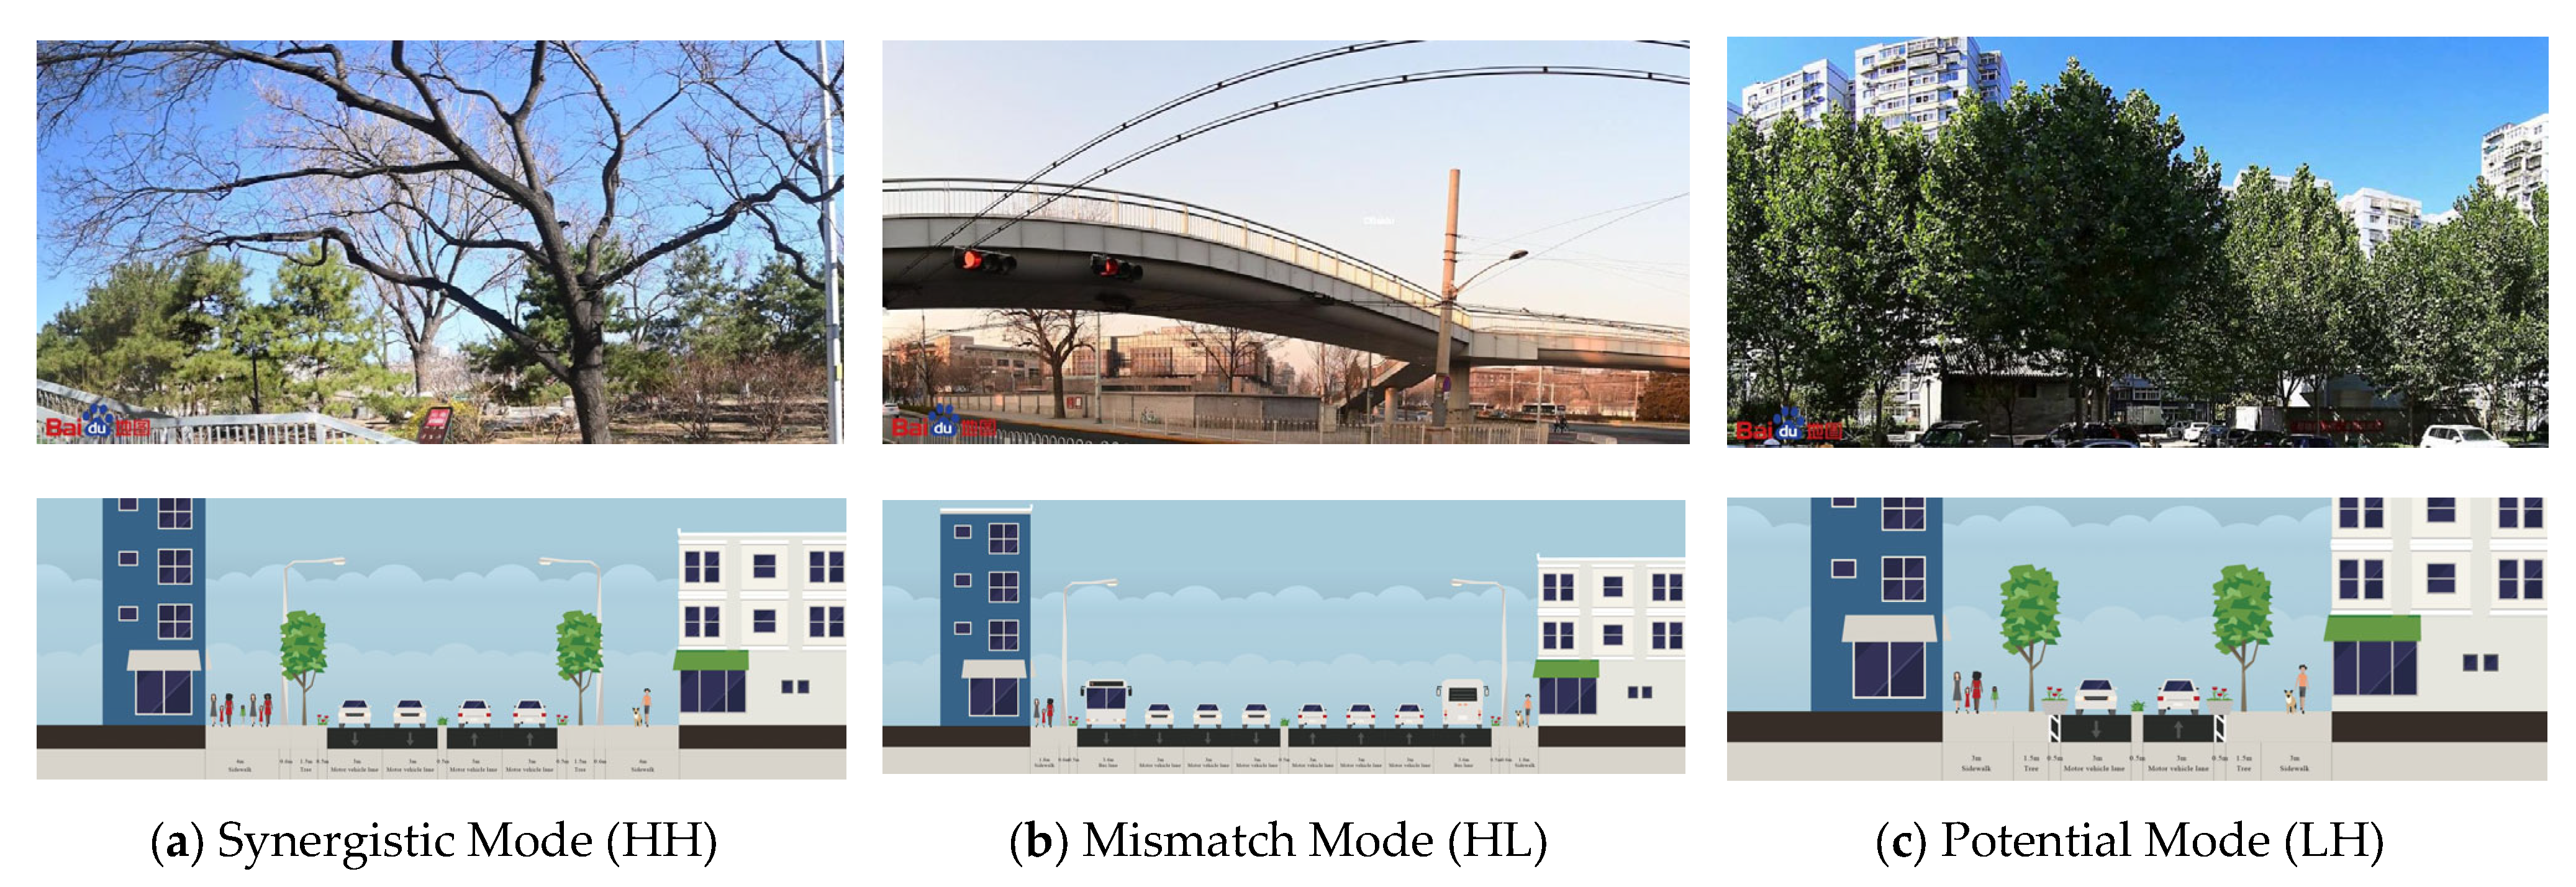
To verify the reliability of the quantitative diagnosis, typical samples from the LISA clusters were selected for comparative analysis combined with multi-source street-view imagery and field investigations (see Figure 10).
(1)
Synergistic Mode (HH) and Continuity of Historical Narrative: Taking the sampling point on Tiantan West Road as an example (Figure 10a), its Global Integration and Historical Perception scores are both at high levels. Real-world observations show that this segment features well-preserved traditional gray-brick walls and a highly uniform sequence of street trees. The physical spatial continuity reaches high synergy with the cultural attributes of the visual imagery, explaining why HH clusters serve as the optimal model for the exhibition of Central Axis heritage value.
(2)
Mismatch Mode (HL) and Causes of Visual Perception “Depressions”: In the typical HL mismatch zone—the Yongdingmen Bridge node (Figure 10b)—real-world imagery and the corresponding cross-sectional diagram expose an acute “configuration–perception” contradiction. Despite its role as the “South Gate” with extremely high centrality (Mean = 0.924), its Attraction and Historical Perception scores are significantly low. The schematic cross-section reveals that the street space is dominated by expansive Motor vehicle lane, with the pedestrian right-of-way compressed to less than 2 m and nearly devoid of green buffers. This car-centric morphology results in a macro-scale space that lacks a human scale, where the visual obstruction of historical view corridors by modern transportation infrastructure directly supports the quantitative finding of a negative correlation between Spaciousness and Historical Perception (r = −0.33). Meanwhile, in the Zhushikou commercial area, chaotic commercial signage and disordered facade obstructions are the material roots causing idle spatial dividends and fragmented cultural narratives.
(3)
Potential Mode (LH) and Limitations of Neighborhood Ecological Dividends: Observations of neighborhood alleys east of Temple of Heaven Park (Figure 10c) reveal that while these LH areas are at the “periphery” of traffic, they possess high canopy cover and tranquility, allowing perception scores to transcend structural constraints. However, this superior perception is confined to specific neighborhoods. The pervasive “wall effect” observed in the field explains the current state where the regional Nature Perception Mean is only 0.26 and distributed as “green islands,” confirming the structural bottleneck preventing ecological dividends from effectively penetrating high-density neighborhoods.

5. Discussion

5.1. Added Value and Comparison with Existing Literature

The core added value of this study lies in transitioning the analytical paradigm of historic districts from “single-dimensional measurement” to “multidimensional spatial–semantic diagnosis.” By comparing our framework with the existing literature, several distinct theoretical and methodological contributions emerge.
First, theoretically, compared to traditional morphological studies relying solely on Space Syntax (which primarily explain movement potentials based on physical topology), our study reveals that high structural integration does not automatically translate into high cultural perception. For instance, the “Mismatch” clusters identified along the South Central Axis demonstrate that modern infrastructural intrusions can sever the historical narrative of highly accessible spaces. This empirical finding addresses a critical gap in traditional syntactic research by introducing subjective human perception as a necessary calibrator for spatial configuration.
Second, while contemporary urban informatics has widely adopted computer vision to assess streetscapes, most studies remain confined to calculating physical proportions like the Green View Index or Sky View Factor. These pixel-level metrics struggle to capture the cultural essence of heritage sites. By utilizing the zero-shot capabilities of the CLIP model, this study successfully quantified abstract semantics such as “historical atmosphere” and “street vitality.” Compared to conventional manual audits or survey-based Scenic Beauty Estimation (SBE) methods—which are limited by small sample sizes and evaluator bias—our framework proved capable of high-throughput, objective evaluation across 550 fine-grained spatial nodes.
Methodologically, the “Quadrant Analysis + Bivariate LISA” approach utilized in this study presents significant advantages over conventional spatial statistics. In existing research, the Coupling Coordination Degree Model (CCDM) is frequently used to evaluate system interactions [37]; however, CCDM excels primarily in macro-level statistical evaluation and often falls short in precisely localizing micro-spatial mismatches at the street level. Similarly, spatial regression models like Geographically Weighted Regression (GWR) assume strict linear causal relationships, which may oversimplify the complex and sometimes contradictory nature of physical configuration and subjective perception. Quadrant analysis successfully translates abstract statistical divergence into intuitive urban typologies (Synergy, Mismatch, etc.), while Bivariate LISA provides rigorous spatial significance testing to geographically pinpoint these clusters. This realizes a critical paradigm shift from “global statistical evaluation” to “local spatial intervention.”

5.2. Planning Implications and Differentiated Strategies

Through the quantitative diagnosis of the South Central Axis Core Area, this study establishes a spatial management logic of “classified diagnosis and differentiated intervention,” moving beyond monolithic planning approaches.
Spatial Categorized Management Logic: The results indicate that the 6.6 km2 area exhibits significant characteristic variations. For Synergistic Spaces (HH) such as the Tiantan West Gate and Tianqiao segments, future management should focus on fine-grained maintenance and the continuous injection of cultural vitality to maintain their leading roles. Conversely, for Significant Mismatch Areas (HL) like Zhushikou and Yongdingmen Bridge, where spatial positions are prime but perceptual quality lags, these must be prioritized as core targets in the district’s urban regeneration. Furthermore, a step-by-step strategy should be adopted for Potential Activation Zones (LH) and Foundational Completion Zones (LL), ensuring the precision of resource allocation.
Landscape Remediation for Gateway Nodes: Specific renewal strategies centered on “cultural restoration” should be implemented for the precisely identified “high-potential, low-perception” (HL) nodes. The Yongdingmen Bridge node possesses high spatial integration but is constrained by complex transportation infrastructure and hard pavement, leading to an extremely high spaciousness score (Mean = 0.741) alongside low attraction. It is recommended to use vertical greening and micro-renovations of landscape lighting to soften the industrial feel, enhancing its cultural identity as the “South Gate.” For the northern Zhushikou commercial area, disordered commercial advertisements should be cleared, and the tones of shop signboards standardized to guide modern spaces back toward the cultural tone of the Central Axis.
Strategic Pathways for Enhancing Environmental Attraction: Based on the correlation patterns revealed, two elevation schemes are proposed. First, addressing the pervasive “lack of nature perception” (Mean = 0.260), efforts should be made to break the “wall effect” of large parks by planting street trees and adding pocket parks, allowing ecological dividends to permeate into high-density residential alleys. Second, addressing the negative correlation between Spaciousness and Historical Perception (r = −0.33), future renovations of wide arteries should avoid purely macro-scale hard pavements. Cultural narrative elements and sculptures should be embedded within open spaces to compensate for the lack of cultural information.
Establishing a Long-term Monitoring System: To ensure the durability of urban regeneration, the evaluation framework of this study should be transformed into a long-term dynamic monitoring mechanism. Street-view big data can be combined with the constructed CLIP evaluation matrix to conduct regular “urban physical examinations.” By monitoring changes in perception scores, management departments can promptly identify areas with abnormal declines. Additionally, this model can be integrated into the planning approval process to simulate the impact of new construction projects on visual quality, achieving the scientific protection and orderly renewal of heritage value.

6. Conclusions

6.1. Principal Research Findings

By integrating Space Syntax models and the CLIP deep learning algorithm, this study systematically diagnosed the “configuration–perception” coupling characteristics of the South Central Axis Core Area (Zhushikou to Yongdingmen, totaling ~6.6 km2), reaching the following conclusions:
First, the physical spatial configuration and visual perception quality exhibit a significant “decoupling” divergence. Quantitative measurements show that Global Integration (Mean = 0.924) has a near-zero correlation with key perceptual dimensions such as Historical Perception and Attraction, confirming that the spatial dividends of the core area have not spontaneously translated into equivalent visual experiences. Particularly at the Zhushikou and Yongdingmen Bridge gateway nodes, a significant “high potential, low quality” mismatch persists, where chaotic modern infrastructure and commercial interfaces cause a spatial fracture in the cultural narrative.
Second, visual perception evaluation decays from the heritage core toward the periphery, with deep internal contradictions between dimensions. The pervasive lack of Nature Perception (Mean = 0.260) and the “green island” phenomenon reflect insufficient ecological connectivity. Crucially, the significant negative correlation between Spaciousness and Historical Perception (r = −0.33) objectively reflects the current difficulty in reconciling macro-narrative scales with refined cultural perception, providing direct empirical evidence for future “micro-regeneration” and “view corridor compensation”.

6.2. Research Innovations and Academic Value

The “configuration–perception” coupling evaluation framework developed in this study provides high-precision quantitative support for the refined governance of historical–cultural axes. The study demonstrates the robustness of cross-modal large language models in capturing micro-cultural imagery, offering a technical paradigm for monitoring similar heritage spaces globally. This research breaks through the limitations of traditional urban design evaluation—which relies heavily on qualitative surveys—by establishing a quantitative analysis framework of “Configuration Measurement–AI Perception–Coupling Diagnosis”. By combining the topological logic of Space Syntax with the cross-modal semantic understanding of the CLIP model, this study achieves precise measurement of the correlation between urban physical and perceptual attributes, offering a replicable technical path for the scientific protection of cultural heritage corridors.
Furthermore, compared to existing studies on the perception assessment of historical districts, the academic value of this framework lies in its methodological breakthrough. Traditional perception assessments predominantly rely on manual audits, questionnaire surveys, or the Scenic Beauty Estimation (SBE) method, which are often limited by small sample sizes, high time costs, and subjective evaluator biases. In contrast, this study leverages the CLIP model to achieve high-throughput, objective evaluation across 550 spatial nodes. Moreover, while contemporary urban informatics has widely adopted AI-based semantic segmentation (e.g., SegNet, DeepLab) to calculate physical metrics like the Green View Index or Sky View Factor, those pixel-level methods struggle to capture the cultural essence of a space. The zero-shot, cross-modal capability of the CLIP model deployed in this study successfully translates complex, abstract cultural semantics—such as “historical atmosphere” and “street vitality”—into quantifiable metrics. By coupling these advanced semantic measurements with macro-topological data (Space Syntax), this research transitions the paradigm from “single-dimensional physical measurement” to “multidimensional spatial–semantic diagnosis,” offering a highly scalable analytical tool for historic urban landscapes globally.

6.3. Limitations and Future Prospects

Despite the progress made in the coupling diagnosis of the South Central Axis, certain limitations remain. First, the static limitation of the data source: this study primarily utilizes static street-view imagery, which cannot capture perceptual changes brought by different time periods (e.g., nighttime, seasonal changes) or dynamic human activities. Future research could incorporate multi-source social media imagery and dynamic pedestrian trajectories for more effective dynamic evaluation. Second, the expansion of perceptual dimensions: the current evaluation matrix focuses on four dimensions; perceptions of non-visual elements like sound and smell remain unexplored. Subsequent studies could explore the construction of multi-sensory coupling models to more comprehensively restore the complex emotional connection between humans and the Central Axis heritage space. Third, the inherent bias of the CLIP model in multimodal semantic understanding must be acknowledged. While CLIP demonstrates strong zero-shot capabilities, its pre-training relies on massive, generalized global internet datasets, which may contain cultural and contextual biases. For instance, abstract semantics such as “historical atmosphere” are highly culturally specific; the model might implicitly exhibit higher sensitivity to Western architectural aesthetics compared to the subtle, localized nuances of traditional Chinese grey-brick alleys. Similarly, concepts like “vitality” can be context-dependent, where a quiet but socially cohesive neighborhood might be undervalued compared to a bustling commercial street. Therefore, while this study utilized meticulously designed prompt matrices to mitigate these issues, future research should consider fine-tuning the foundational model using a localized, expert-annotated dataset specific to Chinese historical districts to further calibrate and de-bias these abstract semantic measurements.

Author Contributions

Conceptualization, Qin Li and Zhenze Yang; Methodology, Qin Li and Zhenze Yang; Software, Zhenze Yang and Xingping Wu; Investigation, Zhenze Yang; Resources, Zhenze Yang, Xingping Wu and Wenlong Li; Data curation, Zhenze Yang; Writing—original draft, Qin Li, Zhenze Yang and Xingping Wu; Writing—review & editing, Qin Li, Zhenze Yang, Wenlong Li, Yijun Liu and Lixin Jia; Visualization, Zhenze Yang and Xingping Wu; Supervision, Qin Li, Wenlong Li, Yijun Liu and Lixin Jia. All authors have read and agreed to the published version of the manuscript.

Funding

This research was funded Beijing Social Science Foundation Project grant number 24JCC077, the Subject of Beijing Association of Higher Education grant number MS2022276, the Research Project of Beijing University of Civil Engineering and Architecture grant number ZF16047, the Graduate Education and Teaching Quality Improvement Project of BUCEA grant number J2024004 and the Graduate Innovation Project of BUCEA grant number PG2025018.

Data Availability Statement

The original contributions presented in this study are included in the article. Further inquiries can be directed to the corresponding author.

Conflicts of Interest

The authors declare no conflict of interest.

References

  1. Hillier, B.; Zhao, B. Space Syntax—New Perspectives on Cities. New Archit. 1985, 1, 62–72. [Google Scholar]
  2. Shao, R. Improvement of Spatial Unit Segmentation Method of Space Syntax Axial Map in the Application of Grid Road Network Cities. Int. Urban Plan. 2010, 25, 62–67. [Google Scholar]
  3. Liu, J. Spatial Logic in Grid Reconstruction—Topological Analysis of Street Systems in the Ming City Area of Xi’an. J. Archit. Sci. Eng. 2025, 42, 220–228. [Google Scholar]
  4. Wei, H.; Shao, Y.; Chen, J.; Liu, M.; Zhang, R.; Wang, L.; Zhao, K.; Sun, X.; Zhou, Y.; Huang, T. Research on Spatial Morphological Evolution and Classification-guided Control of “Three Streets and Two Alleys” in Nanning. South Archit. 2025, 9, 36–45. [Google Scholar]
  5. Li, Y.; Zhang, S.; Yan, H.; Wu, R.; Zhao, T.; Chen, L.; Liu, Y.; Wang, M.; Sun, J.; Gao, X. Research on Park Accessibility and Vitality in Hohhot Based on Multi-source Data. J. Inn. Mong. Agric. Univ. 2026, 47, 1–14. [Google Scholar]
  6. Cao, D.; Yang, X.; Shen, Z. Accessibility of Waterfront Space in the Old City of Nanjing Based on Multi-method Coupling Analysis. Chin. J. Appl. Ecol. 2025, 36, 2836–2844. [Google Scholar]
  7. Zhang, L.; Wang, Y.; Yong, Y.; Chen, J.; Liu, H.; Zhao, X.; Sun, R.; Wu, Q.; Ma, T.; Liang, S. Research on Spatial Equity of Urban Parks Based on Space Syntax—A Case Study of Longgang District, Shenzhen. Acta Ecol. Sin. 2025, 45, 4656–4666. [Google Scholar]
  8. Xu, C.; Wang, X.; Yang, X.; Hu, Y. Analysis of Visual Perception Driving Mechanism of Street Vitality from a Geographically Weighted Perspective. Landsc. Archit. 2026, 33, 1–20. [Google Scholar] [CrossRef]
  9. Zhang, X.; Shan, Z.; Lin, H.; Liu, Y.; Chen, W.; Wang, S.; Huang, J.; Xu, L.; Zhao, M.; Yang, Q. Research on Spatial Differentiation of Crowd Perception Street Space Based on Street View Images—A Case Study of Central Wuhan. In Proceedings of the 2025 China Annual National Planning Conference, Shenyang, China, 30 August–1 September 2025; pp. 651–660. [Google Scholar]
  10. Gu, K.; Yang, M.; Jing, Y.; Zhou, B.; Wu, L.; Cheng, H.; Fang, S.; Liang, T.; Feng, X.; Dong, Z. Research on the Impact of Urban Street Quality Characteristics on Residential Prices Based on Street View Images—A Case Study of Central Hefei. Reg. Res. Dev. 2025, 44, 86–92. [Google Scholar]
  11. Li, Y.; Zhang, J.; Xie, Y. Research on Visual Perception Experience of Campus Street Pedestrian Space Based on Grad-CAM. New Archit. 2024, 6, 18–23. [Google Scholar]
  12. Zhao, X.; Deng, C. Research on Perceptual Measurement and Spatial Distribution Characteristics of Guilin Historic Districts Based on Street View Images. Guangdong Landsc. Archit. 2025, 47, 53–60. [Google Scholar]
  13. Huang, Z.; Wang, B.; Luo, S.; Wang, M.; Miao, J.; Jia, Q. Integrating Streetscape Images, Machine Learning, and Space Syntax to Enhance Walkability: A Case Study of Seongbuk District, Seoul. Land 2024, 13, 1591. [Google Scholar] [CrossRef]
  14. Le, H.Q.; Kwon, N.; Nguyen, H.T.; Kim, B.; Ahn, Y. Sensing perceived urban stress using space syntactical and urban building density data: A machine learning-based approach. Build. Environ. 2024, 266, 112054. [Google Scholar] [CrossRef]
  15. Gao, M.; Fang, C. Pedaling through the cityscape: Unveiling the association of urban environment and cycling volume through street view imagery analysis. Cities 2025, 156, 105573. [Google Scholar] [CrossRef]
  16. Dong, L.; Jiang, H.; Li, W.; Qiu, B.; Wang, H.; Qiu, W. Assessing impacts of objective features and subjective perceptions of street environment on running amount: A case study of Boston. Landsc. Urban Plan. 2023, 235, 104746. [Google Scholar] [CrossRef]
  17. Yao, T.; Xu, Y.; Sun, L.; Liao, P.; Wang, J. Application of Machine Learning and Multi-Dimensional Perception in Urban Spatial Quality Evaluation: A Case Study of Shanghai Underground Pedestrian Street. Land 2024, 13, 1354. [Google Scholar] [CrossRef]
  18. Yin, L.; Wang, Z. Measuring visual enclosure for street walkability: Using machine learning algorithms and Google Street View imagery. Appl. Geogr. 2016, 76, 147–153. [Google Scholar] [CrossRef]
  19. Zhu, Z. Tokyo’s Historical and Cultural Walking Path System Planning. Int. Urban Plan. 1987, 1, 1–10. [Google Scholar]
  20. Zhao, X. Stitching History and Leading Culture—The Construction of Historical and Cultural Heritage Routes in Beijing Old City. In Proceedings of the 2011 China Annual National Planning Conference, Nanjing, China, 17–19 June 2011; pp. 8243–8254. [Google Scholar]
  21. Bian, L.; Yu, T. Vitality Regeneration of Beijing Old City Based on Historical and Cultural Heritage Route Planning. In Proceedings of the 2012 China Annual National Planning Conference, Kunming, China, 17–19 October 2012; pp. 1022–1034. [Google Scholar]
  22. Qu, A.; Zhang, Q. Reflections on Renewal Strategies for Single-story Courtyard Areas Along the Central Axis in the Post-inscription Era. Beijing Plan. Constr. 2024, 06, 196–200. [Google Scholar]
  23. Qin, H.; Wang, H. Discussion on “Thematic Integration” Protection Pathway of Architectural Heritage in Beijing Old City. Huazhong Archit. 2019, 37, 116–120. [Google Scholar]
  24. Fei, F. Research on Construction Planning and Design of Historical and Cultural Heritage Route Network. Master’s Thesis, North China University of Technology, Beijing, China, 2023. [Google Scholar]
  25. Gong, R.; Chen, D.; Yang, L.; Zhang, H.; Liu, W.; Sun, Q.; Zhao, B.; Li, M.; Wang, J.; Xu, Y. Research on Renewal Strategy of Xisi North Historic District in Beijing from the Perspective of Spatial Narrative. In Proceedings of the 14th Annual Meeting of Chinese Society of Landscape Architecture, Shenzhen, China, 8–11 November 2024; pp. 377–387. [Google Scholar]
  26. Zhu, H. Research on the Interpretation and Exhibition of Historic and Cultural Districts. Master’s Thesis, Beijing University of Civil Engineering and Architecture, Beijing, China, 2022. [Google Scholar]
  27. Li, Q.; Zhang, J.; Lyu, S. Research on Slow-traffic Quality Perception of Beijing Cultural Heritage Routes Based on SEM. Anc. Landsc. Archit. Technol. 2024, 6, 108–112. [Google Scholar]
  28. Bi, B.; Zhang, Z.; Ye, Y. Research on the Optimization of Built Environment of Beijing Historical and Cultural Heritage Routes Based on IPA. Contemp. Archit. 2023, 1, 126–129. [Google Scholar]
  29. Zhang, Q.; Li, F.; Wang, J. Research on Cultural Heritage Route System Based on Space Syntax—A Case Study of Shichahai Historic District. In Proceedings of the 2024 China Annual National Planning Conference, Hefei, China, 7–9 September 2024; pp. 1597–1613. [Google Scholar]
  30. Wang, S.; Li, S.; Qu, M. Research on Soundscape Protection and Renewal Pathways for Beijing Yonghe Temple Area. In Proceedings of the 2024 China Annual National Planning Conference, Hefei, China, 7–9 September 2024; pp. 832–843. [Google Scholar]
  31. Li, X.; Wu, Q.; Cui, C. Telling the Beijing Story of Cultural Heritage Protection—A Case Study of Tongzhou Grand Canal Route. In Proceedings of the 2024 China Annual National Planning Conference, Hefei, China, 7–9 September 2024; pp. 77–87. [Google Scholar]
  32. Fabos, G.J. Planning and landscape evaluation. Landsc. Res. 2007, 4, 4–10. [Google Scholar] [CrossRef]
  33. Kawakami, H. Trends of Central Business Districts in Tokyo and Multi-center Urban Structure Theory. J. City Plan. Inst. Jpn. 1986, 21, 13–18. [Google Scholar]
  34. Huang, L.; Xiao, W.H.; Xu, F.J. Urban Cultural Route: New Idea for Urban Community Renewal—Case Study on Yuzhong District in Chongqing. Appl. Mech. Mater. 2011, 1366, 1749–1755. [Google Scholar] [CrossRef]
  35. Zhao, W.; Xiao, D.; Li, J.; Xu, Z.; Tao, J. Research on Traditional Village Spatial Differentiation from the Perspective of Cultural Routes: A Case Study of 338 Villages in the Miao Frontier Corridor. Sustainability 2024, 16, 5298. [Google Scholar] [CrossRef]
  36. Garau, C.; Annunziata, A.; Yamu, C. The Multi-Method Tool ‘PAST’ for Evaluating Cultural Routes in Historical Cities: Evidence from Cagliari, Italy. Sustainability 2020, 12, 5513. [Google Scholar] [CrossRef]
  37. Cai, Y.; Zhou, M.; Wu, Q. Research on the Construction Method of Cultural Visiting Routes Based on the CCDM: A Case Study of Xiamen. Buildings 2024, 14, 4069. [Google Scholar] [CrossRef]
  38. Rebeca, R.D.M. Connecting the Archaeological Site of Italica (Spain) to its Landscape through the Design of Cultural Routes. Landscapes 2021, 22, 123–146. [Google Scholar] [CrossRef]
  39. Sheng, N.; Tang, W.U. Spatial Techniques to Visualize Acoustic Comfort along Cultural and Heritage Routes for a World Heritage City. Sustainability 2015, 7, 10264–10280. [Google Scholar] [CrossRef]
  40. Liu, B. Research on Street Walkability in Beijing Historic Districts Based on Multi-source Data. Master’s Thesis, Beijing University of Technology, Beijing, China, 2020. [Google Scholar]
  41. Zhang, Z. Beijing Historic District Walkability Evaluation and Optimization Design Research. Master’s Thesis, Harbin Institute of Technology, Harbin, China, 2022. [Google Scholar]
  42. Liu, C. Research on Walkability Evaluation and Improvement Strategy of Historic Districts in Qingdao. Master’s Thesis, Qingdao University of Technology, Qingdao, China, 2024. [Google Scholar]
  43. Gao, X.; Wang, H.; Li, C.; Zhang, L.; Chen, Y.; Liu, J.; Zhao, S.; Sun, M.; Zhou, X.; Huang, Q. Pedestrian Comfort Evaluation in Historic Districts Based on Semantic Segmentation and AHP Coupling. New Archit. 2025, 2, 116–121. [Google Scholar]
  44. Zhang, M. Perceptual Measurement and Optimization of Street Space in Qingdao Historic Districts Based on SVI. Master’s Thesis, Qingdao University of Technology, Qingdao, China, 2023. [Google Scholar]
  45. Zhang, Z.; Xu, G.; Li, W.; Yang, T.; Liu, M.; Chen, H.; Wang, J.; Zhao, R.; Sun, Y.; Zhou, L. Impact of Micro-built Environment of Historical Streets on Tourists’ Pedestrian Dwell Behavior. Archit. J. 2019, 3, 96–102. [Google Scholar]
  46. Deng, T. Evaluation of Pedestrian Environment in Historic Districts Based on Restorative Environment Theory. Master’s Thesis, Tianjin University, Tianjin, China, 2020. [Google Scholar]
  47. Wang, Y. Research on Restorative Effect of Pedestrian Environment in Shenyang Zhongshan Road Historic District. Master’s Thesis, Shenyang Jianzhu University, Shenyang, China, 2025. [Google Scholar]
  48. Ji, X.; Cao, Y. Evaluation of Summer Street Comfort Based on Thermal Comfort and Visual Perception. In Proceedings of the 2025 China Annual National Planning Conference, Shenyang, China, 30 August–1 September 2025; pp. 674–686. [Google Scholar]
  49. Jacobs, J. The Death and Life of Great American Cities; Jin, H., Translator; Yilin Press: Beijing, China, 2005. [Google Scholar]
  50. Jacobs, A.B. Great Streets; Yan, W.; Jiayuan, W.; Jian, Z., Translators; China Architecture & Building Press: Beijing, China, 2009. [Google Scholar]
  51. Southworth, M. Designing the Walkable City. J. Urban Plan. Dev. 2005, 131, 246–257. [Google Scholar] [CrossRef]
  52. Ewing, R.; Handy, S. Measuring the Unmeasurable: Urban Design Qualities Related to Walkability. J. Urban Des. 2009, 14, 65–84. [Google Scholar] [CrossRef]
  53. Ibrahim, I.; Soussi, I.; Al Qaysi, H. A space syntax comparative study on sustainable historic districts: Al-Fahidi, UAE and Al-Darb Al-Ahmar, Egypt. City Territ. Arch. 2025, 12, 24. [Google Scholar] [CrossRef]
  54. Yang, X.; Shen, J. Examining streetscape visuals and emotional responses through social media and street view image analysis. Int. J. Heal. Geogr. 2025, 25, 15. [Google Scholar] [CrossRef]
  55. Wang, Z.; Zhang, W.; Huang, Y. Nonlinear Perceptual Thresholds in Historic Districts. Sustainability 2025, 17, 11075. [Google Scholar] [CrossRef]
  56. Lin, J.; Zhang, M.; Wang, Y.; Hong, X.C.; Liu, J. Natural and Cultural Soundscape Interactions. Buildings 2025, 15, 4103. [Google Scholar] [CrossRef]
  57. Dominika, A.B.; Katarzyna, K. Effectiveness of Tree Pattern in Street Canyons on Thermal Conditions and Human Comfort. Atmosphere 2021, 12, 751. [Google Scholar] [CrossRef]
  58. Zhang, L.; Zhang, D.; Tang, Z.; Wang, M.; Zhao, Y.; Liu, X.; Fan, J.; Guo, H.; Li, T.; Chen, S. A Study on the Perceptual Differences in Street Space from the Host–Guest Shared Perspective. Buildings 2025, 15, 4517. [Google Scholar] [CrossRef]
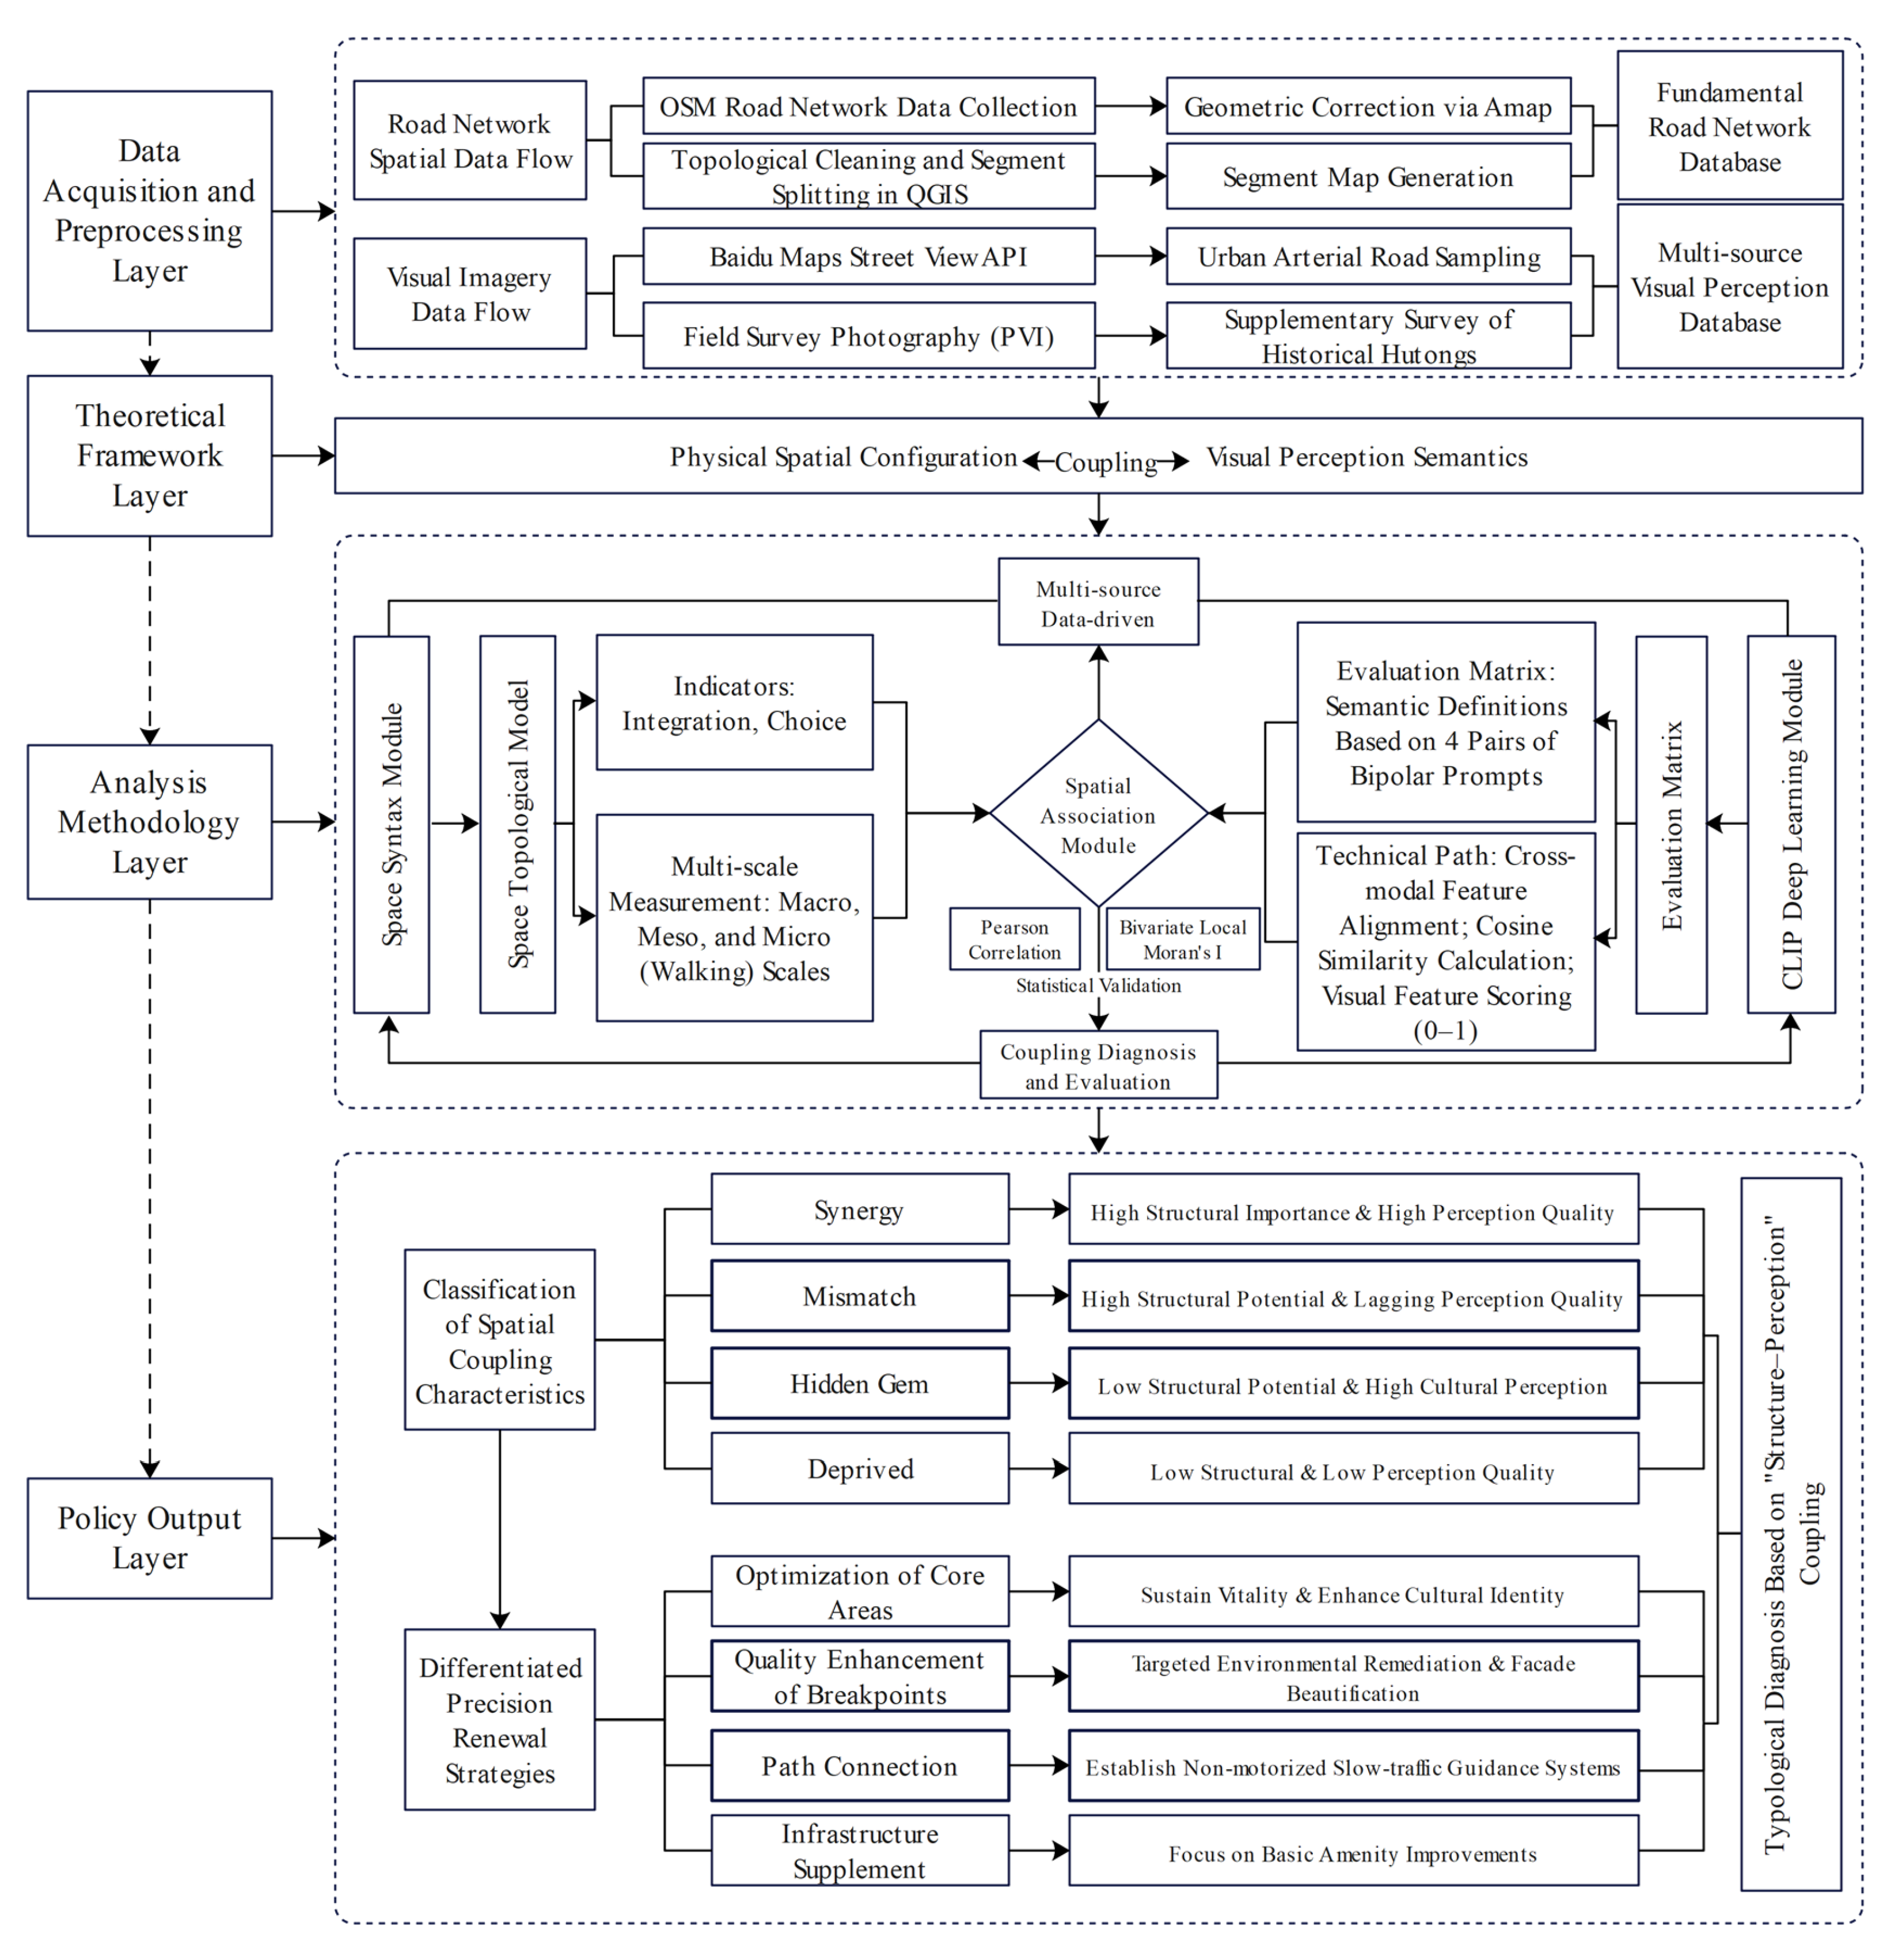
Figure 1. Research Technical Route.
Ijgi 15 00203 g001
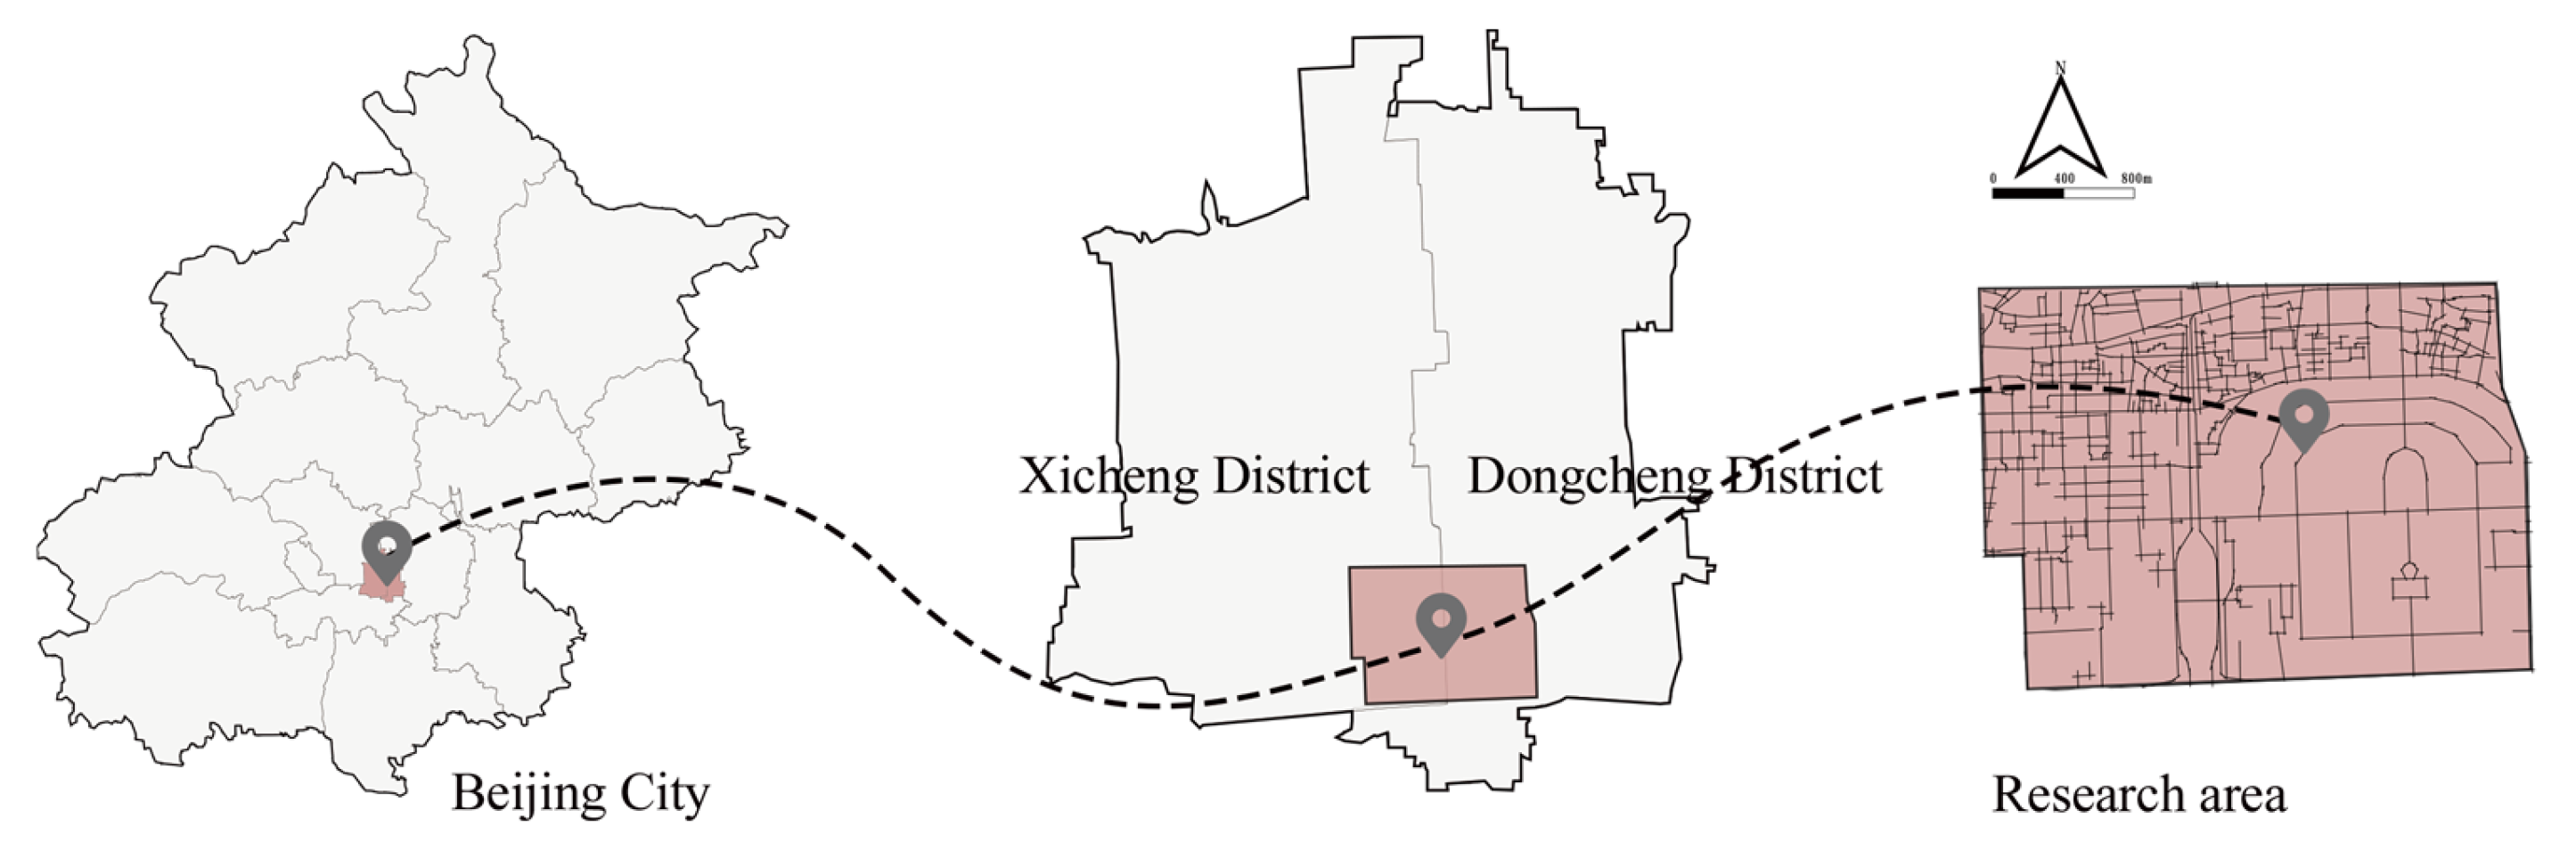
Figure 2. Location of the study area within Beijing.
Ijgi 15 00203 g002
Figure 3. Map of the South Central Axis Core Area.
Ijgi 15 00203 g003
Figure 4. Distribution of the 550 Sampling Points.
Ijgi 15 00203 g004
Figure 5. Spatial distribution of perception scores across multiple dimensions.
Ijgi 15 00203 g005
Figure 6. Analysis of road network topological characteristics in the study area.
Ijgi 15 00203 g006
Figure 7. Correlation coefficients between spatial integration and visual perception dimensions.
Ijgi 15 00203 g007
Figure 8. Bivariate quadrant analysis of spatial integration and visual perception dimensions. (a) Integration–Visual Attraction quadrant map. (b) Integration–Historical Perception quadrant map. (c) Integration–Nature Perception quadrant map. (d) Integration–Spaciousness Perception quadrant map.
Ijgi 15 00203 g008
Figure 9. Bivariate LISA cluster maps of “Spatial Configuration–Visual Perception” in the study area (Significance level: p < 0.05, Permutations: 999). (a) Bivariate LISA map of Integration–Visual Attraction. (b) Bivariate LISA map of Integration–Historical Perception. (c) Bivariate LISA map of Integration–Nature Perception. (d) Bivariate LISA map of Integration–Spaciousness Perception.
Ijgi 15 00203 g009
Figure 10. Real-world street-view images and typical cross-sectional diagrams (Imagery sourced from Baidu Maps).
Ijgi 15 00203 g010
Table 1. Visual feature evaluation matrix for the South Central Axis Core Area based on the CLIP model.
Evaluation DimensionVariablePositive PromptsNegative Prompts
Historical Perceptionclip_history“A historic Beijing street with traditional grey brick walls, antique architectural textures, and heritage atmosphere.”“A modern urban street with contemporary glass buildings, steel structures, and new materials.”
Visual Attractionclip_attraction“A vibrant urban space with many pedestrians, active social interaction, and diverse street activities.”“A desolate and empty street with no people, quiet and lacking social vitality.”
Spaciousnessclip_spaciousness“A wide street with an open view of the sky and a clear sense of spatial depth.”“A narrow, cramped street with overwhelming building heights and a strong sense of visual enclosure.”
Nature Perceptionclip_nature“A green urban corridor with lush street trees, dense tree canopies, and vibrant vegetation.”“A grey urban landscape dominated by hard pavement, concrete, and no greenery.”
Table 2. Descriptive statistics of indicators and variables.
VariableCount (N)MeanStd. Dev.MinMax
integration_hh_5500.9240.191−11.457
choice5504944.23611,715.817−187,874
clip_history5500.4710.3510.0021
clip_spaciousness5500.7410.340.0011
clip_nature5500.260.33501
clip_attraction5500.6450.2750.0061
Disclaimer/Publisher’s Note: The statements, opinions and data contained in all publications are solely those of the individual author(s) and contributor(s) and not of MDPI and/or the editor(s). MDPI and/or the editor(s) disclaim responsibility for any injury to people or property resulting from any ideas, methods, instructions or products referred to in the content.