Article

GeoPPO—A Location-Allocation Method of Superstores Based on Deep Reinforcement Learning—A Case Study of Xi’an


1
School of Remote Sensing and Information Engineering, Wuhan University, Wuhan 430079, China
2
State Key Laboratory of Remote Sensing Science, Aerospace Information Research Institute, Chinese Academy of Sciences, Beijing 100101, China
*
Author to whom correspondence should be addressed.
ISPRS Int. J. Geo-Inf. 2026, 15(3), 114; https://doi.org/10.3390/ijgi15030114
Submission received: 15 January 2026 / Revised: 27 February 2026 / Accepted: 2 March 2026 / Published: 9 March 2026

Abstract

Urban commercial restructuring, driven by the closure of traditional supermarkets and the expansion of new-format superstores, creates a large-scale spatial reallocation challenge requiring scientific location-allocation methods. Traditional heuristic algorithms such as Genetic Algorithm (GA) struggle with discrete spatial optimization under 400+ candidate sites and complex geographic mask constraints: they converge slowly and easily fall into local optima. This study proposes a Deep Reinforcement Learning (DRL) framework named GeoPPO (Geospatial Proximal Policy Optimization) to address this gap. Using Xi’an’s retail restructuring as a case setting—427 candidate locations and multidimensional geographic features—the approach models spatial constraints via a gridded environment encoded as a five-channel state tensor. Key innovations include a dynamic action-constraint mechanism that masks invalid actions based on boundary rules and competition avoidance, and a curriculum learning strategy that enables stable convergence. The framework fills the need for methods that handle hard spatial constraints in large-scale location-allocation. Tests demonstrate rapid convergence within 1,000 epochs, achieving 75% average demand coverage—2.7% and 5.5% higher than GA and Particle Swarm Optimization (PSO), respectively. Ablation experiments confirm that Vanilla PPO without dynamic action masking fails to produce feasible solutions. The framework offers a feasible technical path for handling highly dynamic urban facility spatial configuration with geographic mask constraints.

1. Introduction

The main urban area of Xi’an is undergoing a transition to a multi-center development pattern, as outlined in the Xi’an Territorial Spatial Master Plan (2021–2035) approved by the State Council in 2025 [1]. In this process, the traditional city center commercial planning has tended to be saturated. At the same time, the traditional supermarket retail industry is undergoing significant restructuring: e-commerce giants have scaled back physical retail investments, and leading hypermarket chains in China have experienced substantial store closures and operational adjustments [2]. Industry reports document, for instance, Lotus Supercenter withdrawing from the Xi’an market in January 2025 and Yonghui Supermarket closing multiple stores in Xi’an between 2024 and 2025. The remaining hypermarkets face operational pressure and restructuring, indicating that the traditional hypermarket industry in Xi’an is in a period of contraction and adjustment.
Change breeds opportunity. At a time when the retail industry in Xi’an is undergoing a profound restructuring, new-format stores such as “Freshippo”, “Sam’s Club”, and “Chengshan Farm” have achieved rapid expansion in both market share and store count, while traditional supermarkets have contracted. This industry transition implies a large-scale spatial reallocation of commercial facilities [3].
We introduce Xi’an’s old–new retail transition as the case background because the rapid restructuring of the supermarket industry in Xi’an provides a challenging complex spatial-constraint scenario for algorithm validation: 427 candidate locations and multidimensional geographic features (population, transportation, POIs, administrative boundaries, and existing facility distribution). In this context, scientific spatial optimization methods are important for improving the efficiency of urban facility configuration [4,5].
DRL has demonstrated significant advantages in the field of spatial optimization [6,7,8], the core of which lies in its end-to-end efficient solving capability and strong adaptability to dynamic environments. The method models the location selection problems such as p-median and Maximum Covering Location Problem (MCLP) by Markov Decision Process (MDP) [9], and combines the Encoder-Decoder architecture with the dynamic coverage information gating mechanism [10], which is able to learn the complex spatial dependencies and constraints during the training process synchronously, and thus significantly improves the quality and stability of the solutions. Compared with traditional heuristic algorithms such as GA [11], its solution is closer to the optimal value and achieves faster convergence; and it can flexibly adapt to the complex interactions of multiple sources of geographic data, such as population density [12] and transportation network [13], to provide real-time, high-precision decision support for urban planning [14].
The core objective of this study is to explore the feasibility and effectiveness of DRL (GeoPPO) for large-scale geospatial optimization under complex constraints, rather than to precisely model the commercial impact of new-format supermarkets. The main contributions are as follows:
  • Contribution One: Proposed a new DW-MCLP spatial optimization model by integrating multi-source data, including population, point-of-interest distribution [15], and urban transportation networks, to characterize spatial demand and constraints.
  • Contribution Two: Provided a feasible technical path for handling highly dynamic urban facility spatial configuration with geographic mask constraints [16]. The application in Xi’an demonstrates that the framework can identify location plans aligned with the city’s evolving multi-center spatial structure under the given constraints.
  • Contribution Three: Developed a novel deep reinforcement learning-based solving framework named GeoPPO [17]. This framework, integrating an encoder-decoder architecture [18] with a dynamic coverage information gating mechanism, demonstrates superior solving speed and solution quality compared to Vanilla PPO, GA, and PSO, offering efficient and adaptive decision support for complex, large-scale urban spatial optimization problems.

2. Related Work

In recent years, the research on spatial optimization of urban commercial facilities is gradually transforming from static location theory to dynamic intelligent decision-making paradigm.
Early research methods mainly focused on multi-criteria decision-making frameworks. Baviera-Puig et al. [12] proposed that supermarket location selection needs to comprehensively consider the three major elements of population distribution, transportation accessibility and competition intensity, and quantitatively assessed the suitability of the location by using Analytic Hierarchy Process (AHP), while Alnahhal and Noche [19] took the lead in introducing the Genetic Algorithm (GA) to solve the MCLP. However, such models are difficult to adapt to high-dimensional spatial constraints effectively, and their convergence speed decreases exponentially with the problem size.
With the breakthrough of DRL in combinatorial optimization, the application of this technique to the location problem has shown significant potential. Guo et al. [20] designed a DRL framework based on the action exchange mechanism for solving the network facility location problem, and verified the advantages of DRL in solving the spatial exploration. However, the study did not consider the real geographic boundary constraints, which led to the lack of feasibility of some of the solutions in practical application scenarios.
Recent research trends have focused on technology integration and practical applications, and Lin et al. [16] revealed that there is a structural imbalance in the layout of traditional supermarkets based on the analysis of retail data in Taipei City, which is characterized by “over-saturation in the core area and lack of services in the peripheral area”, and pointed out that it is necessary to optimize the allocation of resources through the introduction of spatial fairness indexes. Wei et al. [21] introduced constraints for the location of network facilities and further proposed a constrained reinforcement learning algorithm named Triple-Q. This algorithm achieves zero constraint violation while ensuring sub-linear regret, thereby providing a solid theoretical foundation for addressing facility location problems in complex urban environments. Notably, Su et al. [22] first incorporated a knowledge enhancement mechanism into the DRL framework, which significantly improved the efficiency of large-scale urban facility location selection by pre-training a spatial feature extractor. However, their reward function fails to adequately model dynamic business competition, limiting the model’s ability to support the differentiated layout needs of new business superstores.
At the level of algorithmic innovation, Proximal Policy Optimization (PPO) has become a hotspot in spatial decision-making research due to the stability of its policy update. Engstrom et al. [17] verified the robustness of PPO in continuous action spatial tasks through systematic experiments. However, the convolutional encoder adopted by Engstrom et al. [17] has limitations in heterogeneous feature fusion of multi-source geographic data. Wang et al. [23] achieved success in applying DRL to convenience store location, but their gridded environment modeling fails to explicitly integrate the topological weights of the road network with the intensity of the demand of Point Of Interests(POIs), which weakened the accuracy of the model’s response to the regional business vitality.
The research in this paper aims to propose innovative solutions to address these shortcomings. We construct a GeoPPO-driven DW-MCLP model: a five-channel input tensor is constructed by integrating multi-dimensional features such as population heat, traffic weights, and commercial POIs; a dynamic masking mechanism is innovatively designed to avoid geographic boundaries and competitive constraints in real time; and a curriculum learning strategy is adopted to optimize the coverage radius asymptotically. Empirical studies in Xi’an’s main urban area show that the framework significantly improves the population coverage compared with the traditional GA and PSO and effectively balances service efficiency and spatial fairness through the well-designed triple incentive function. The work provides a scalable technical path for handling highly dynamic urban facility spatial configuration with geographic mask constraints. Urban network theory [24] and supermarket competition dynamics [25] inform our competition penalty design; 15-min city concepts [26] and POI-based mixed-use analysis [27] align with our coverage-radius framing; and GIS-based spatial analysis [28,29] supports the gridded environment modelling adopted in this study.

3. Materials and Methods

Table 1 summarizes the core notation used in this paper.
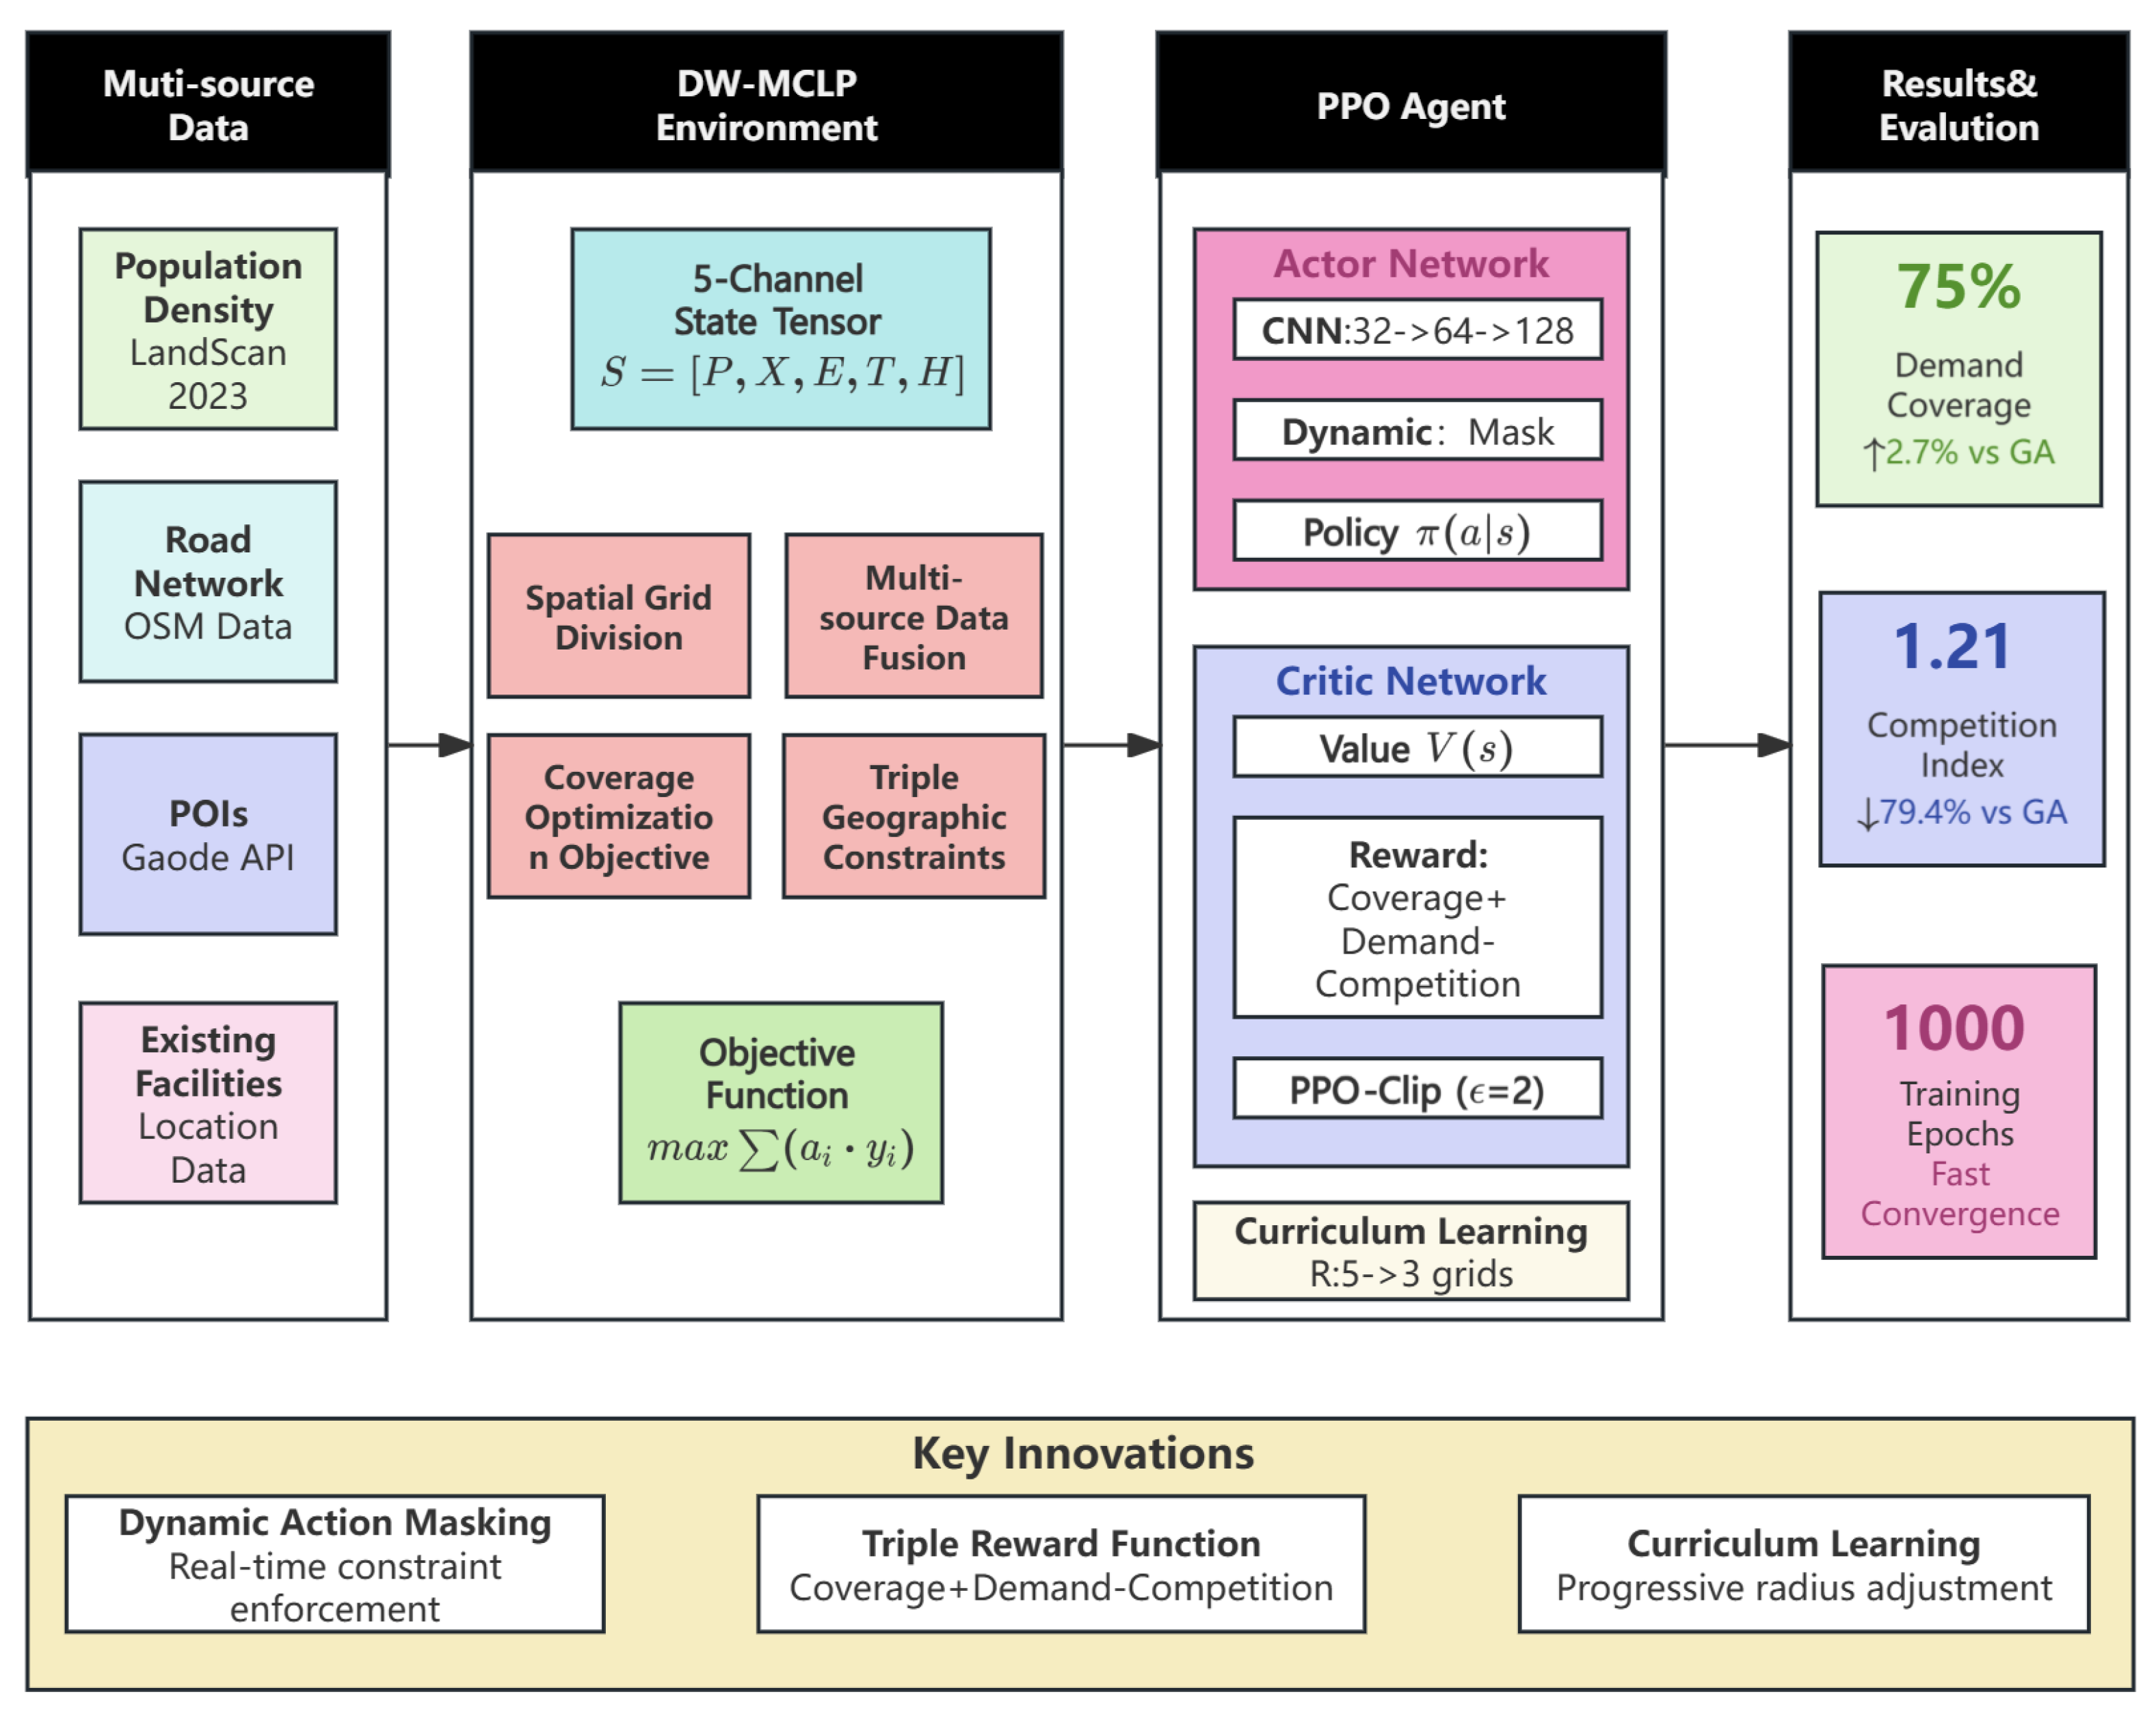
The workflow of the proposed spatial optimization framework is illustrated in Figure 1. It comprises four main components: Multi-source Data, the DW-MCLP environment, the GeoPPO agent, and the Results & Evaluation module.

3.1. Data Sources

The sources of multi-source geospatial data used in this study are as follows:
  • Population density data: obtained from the LandScan Global 2023 30-arcsecond population distribution dataset released by Oak Ridge National Laboratory, Oak Ridge, TN, USA [30].
  • Administrative division data: obtained from Tianditu Open Platform (National Platform for Common Geospatial Information Services, Beijing, China).
  • Road traffic network data: obtained from the OpenStreetMap (OSM) national road network dataset [31], containing the spatial location and topological information of all levels of roads in Xi’an.
  • Commercial POI data: retrieved and collected through the Gaode Map API (Alibaba Group, Hangzhou, China) in June 2025, covering 10 types of commercial facility points such as shopping centers, communities, and transportation hubs in the study area. All POI data were spatially located based on the coordinate information provided by Gaode Map.
All spatial datasets were uniformly converted to the WGS84 geographic coordinate system (EPSG:4326), and the administrative boundaries of Xi’an’s main urban areas were used to perform spatial clipping to ensure that the analysis scope was consistent with the study area. The spatial gridding and subsequent calculations were carried out under a unified geo-reference framework [32].

3.2. Study Area

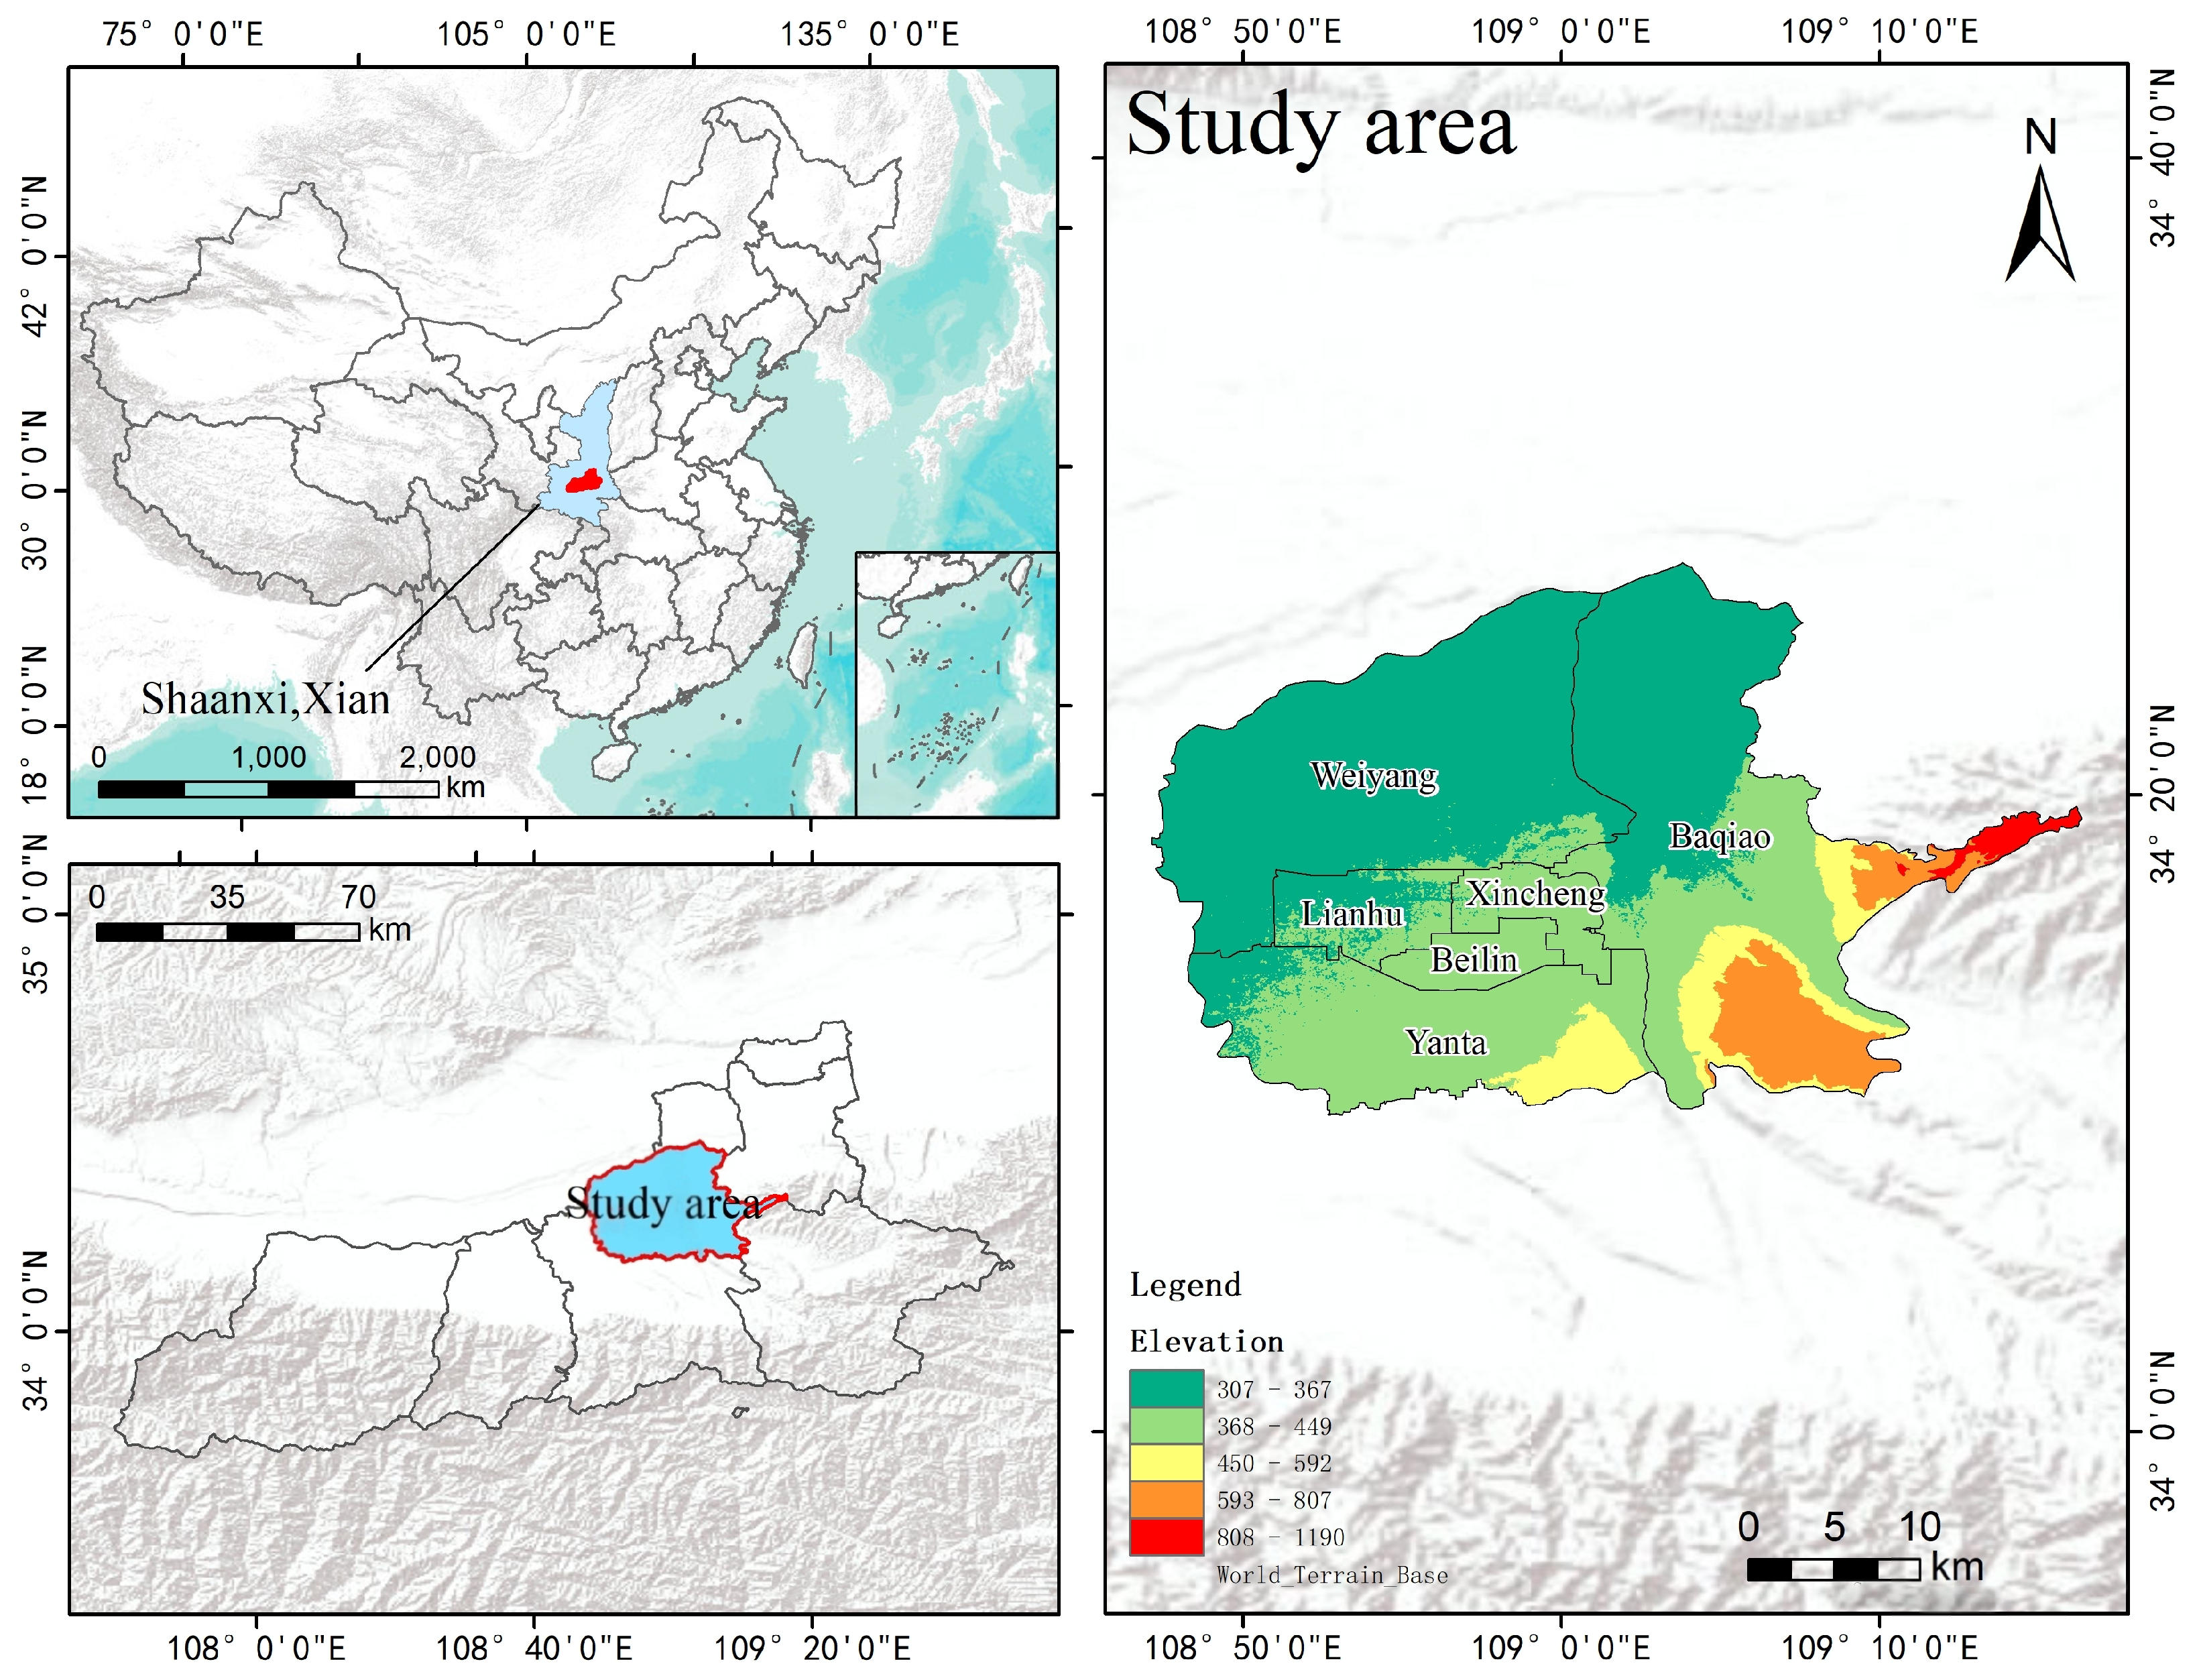
The main urban area of Xi’an China was selected as the core study area, covering six districts: Xincheng District, Beilin District, Lianhu District, Weiyang District, Yanta District, and Baqiao District, hereinafter referred to as the “six districts of the main city”. The selection of this area for in-depth analysis is based on the following three key considerations:
1.
Stable and large-scale customer traffic base
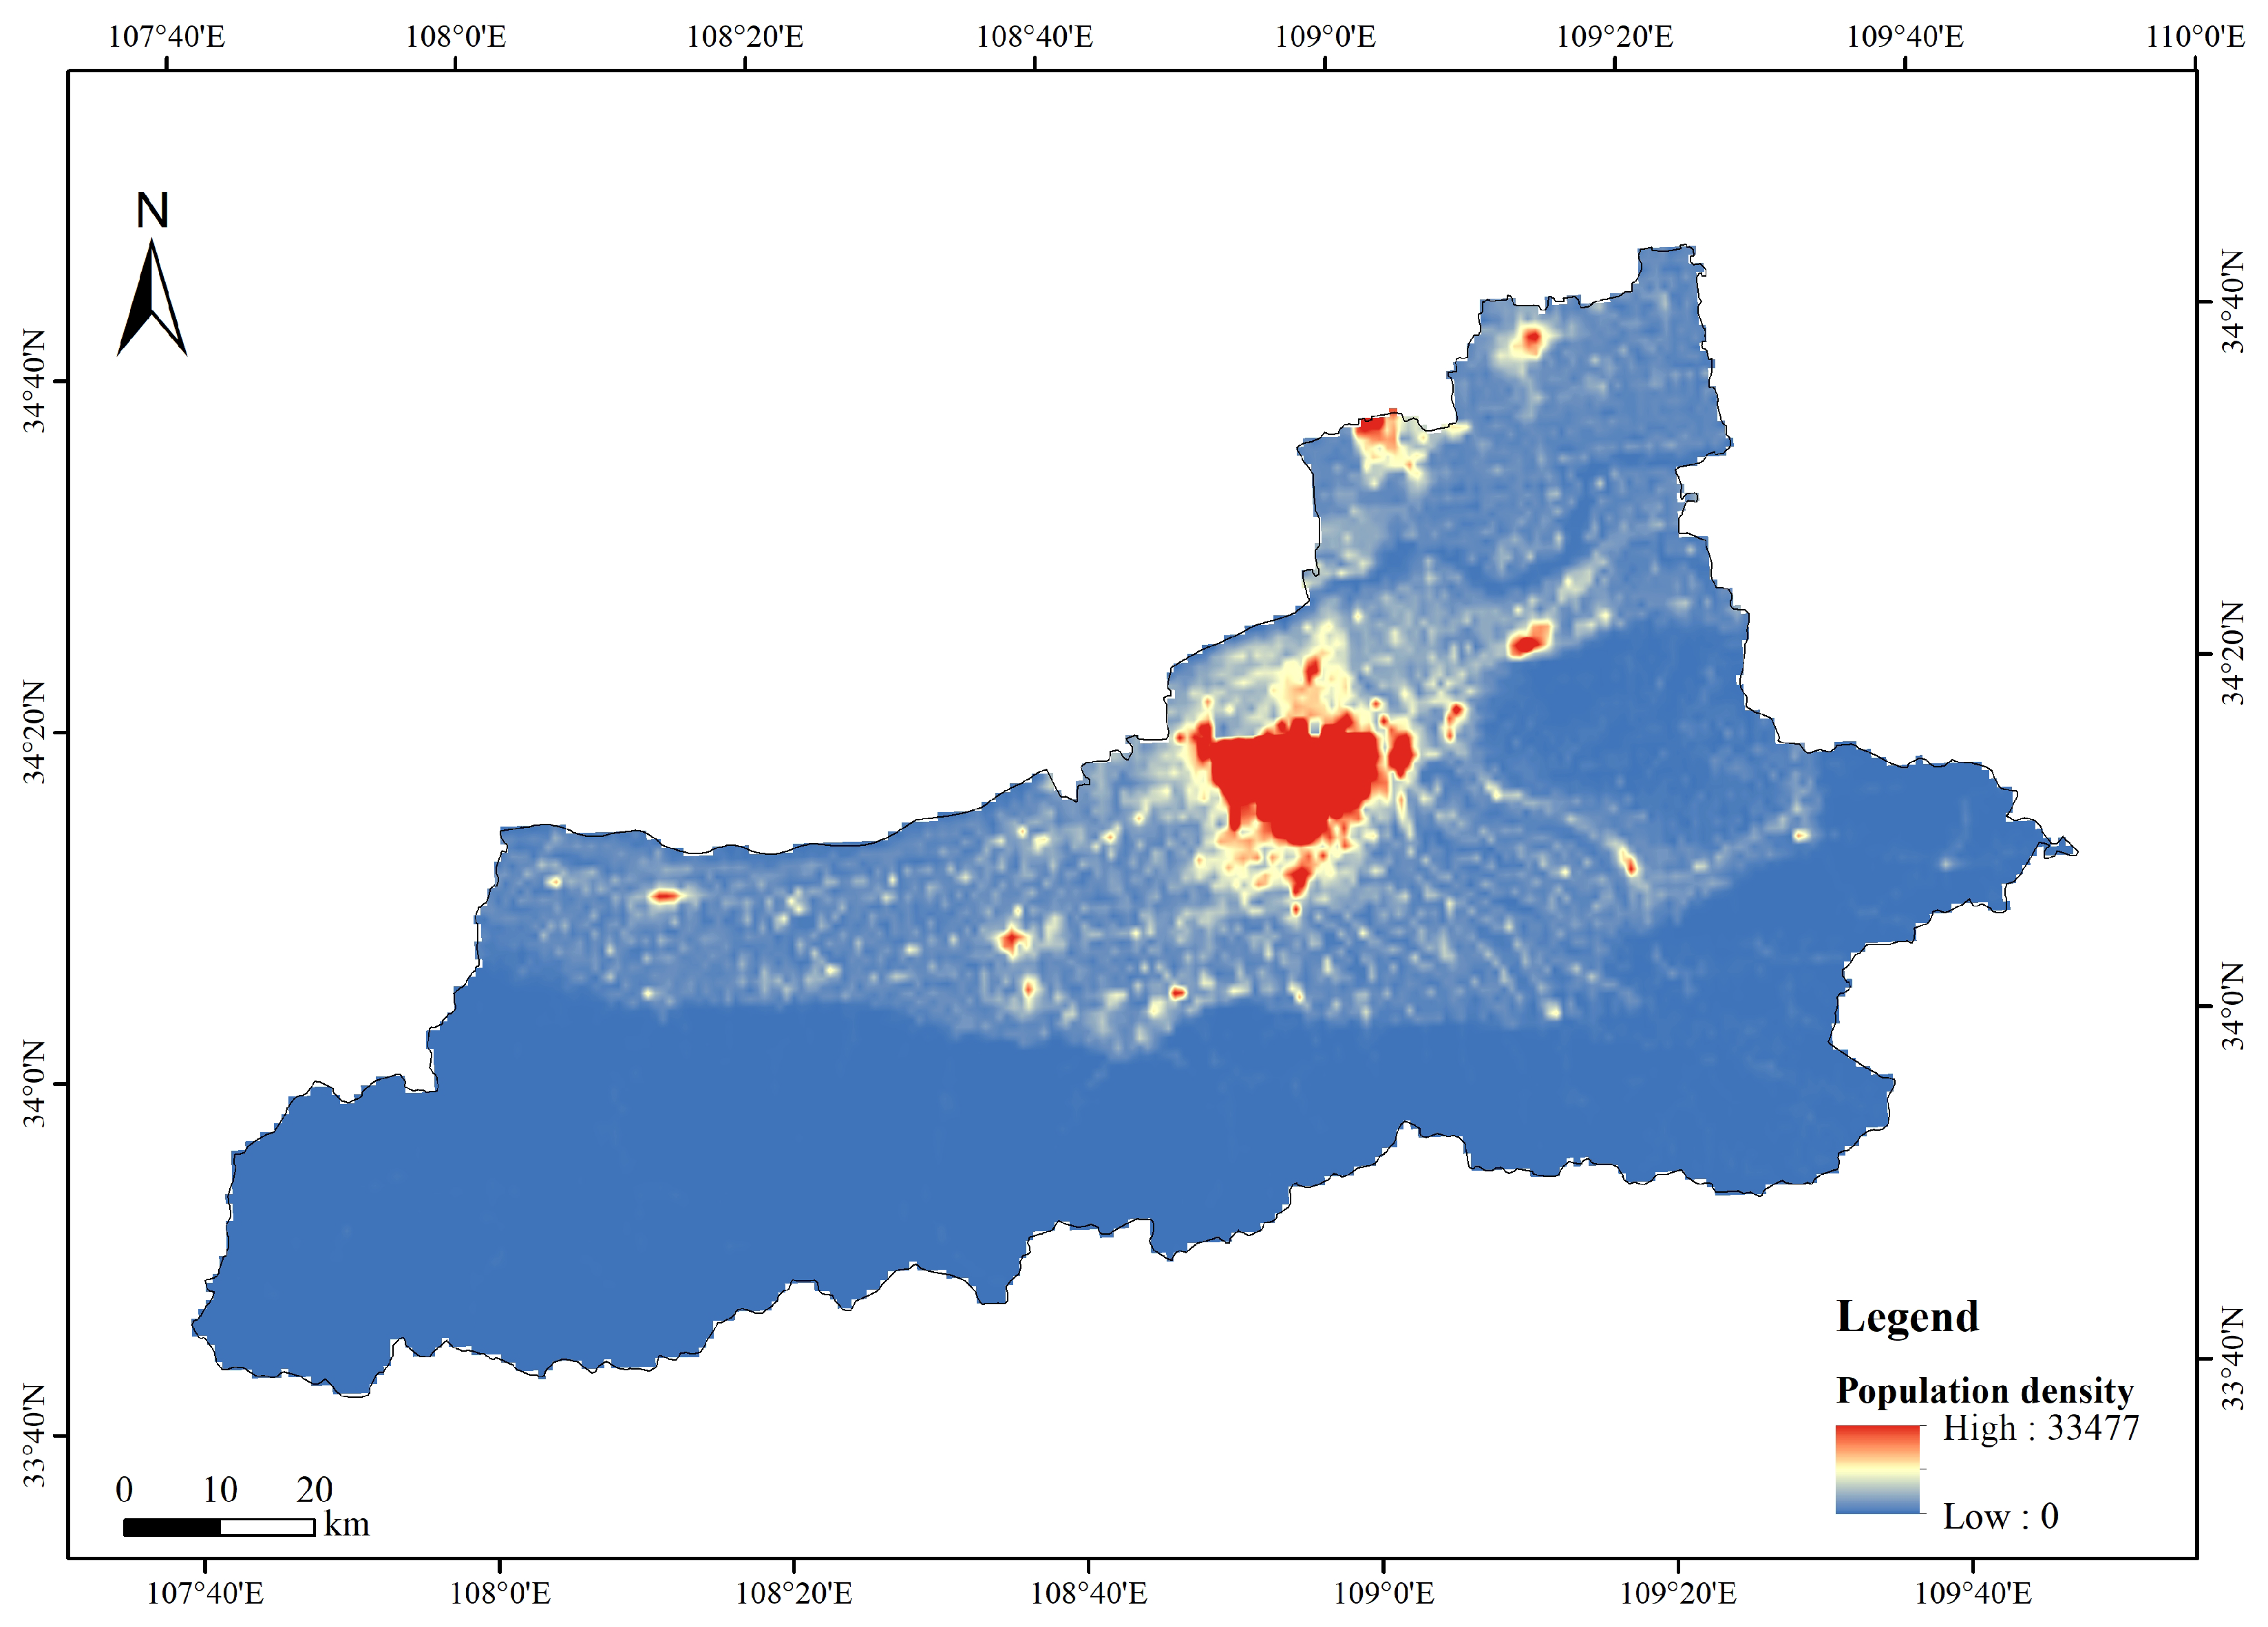
The six main city districts are the most densely populated areas in Xi’an. According to LandScan 2023 population density data [30] shown in Figure 2, Beilin District has a population density of approximately 33,000 people per square kilometer, ranking among the most densely populated urban districts in China, Lianhu District has 27,000 people per square kilometer, and Xincheng District has 21,000 people per square kilometer. In contrast, the population distribution of areas outside the main urban areas is relatively sparse, while the population density of most areas in the southern Qinling Mountainous Region is close to zero.
High-density population distribution provides a stable and sufficient source of potential customers for hypermarkets, so the location decision of hypermarkets is highly dependent on such high-density areas.
2.
Young Consumers
According to the Seventh National Population Census, the percentage of population aged 15–59 in Xi’an is 68.33% [33]. Among them, Yanta District and the six districts of the main city are the main gathering areas for young people. This group constitutes the mainstream consumption force of the offline retail industry in the superstore category, and shows higher acceptance and preference for the emerging business model represented by the new superstore.
3.
Mature transportation system
The successful operation of hypermarkets depends on a high level of transportation convenience and accessibility. The main city of Xi’an has built a highly developed transportation network, including dense subway lines, bus systems and urban road networks as shown in Figure 3, forming a mature and stable comprehensive transportation system, which can effectively guarantee the convenient travel of customers.

3.3. Environmental Modeling

This subsection provides a detailed specification of the environmental modeling process, including the spatial grid, population density, demand analysis, competition intensity, and feasible point selection.

3.3.1. Spatial Grid

The study area (six districts of the main city of Xi’an) is systematically divided into regularized 1 km × 1 km grid cells. The center point of each grid is defined as the Demand Point, which serves as the basic spatial unit for the subsequent population, demand, and other elements allocation and coverage analysis. This standardized grid processing method effectively unifies the spatial resolution of data from different sources, providing a stable and consistent spatial framework for demand intensity calculation and spatial analysis.

3.3.2. Population Density

LandScan global population density raster data (2023 version) is loaded, and the raster population value with 1 km accuracy within the main urban area of Xi’an is extracted and mapped to the constructed urban grid system. Resample the cropped raster data P raw to the target network G:
P G ( k , l ) = 1 N i , j Cell ( k , l ) P raw ( i , j )
where Cell ( k , l ) is the set of pixels covered by the target grid ( k , l ) , and N is the number of covered pixels. If resolution is not consistent, an area-weighted average is applied.
The grid population density is normalized to generate the environmental state input channel:
ρ ( k , l ) = P G ( k , l ) min ( P G ) max ( P G ) min ( P G )
where ρ ( k , l ) [ 0 , 1 ] is the normalized population density. The normalized matrix serves as the core input channel for the reward calculation and state characterization.

3.3.3. Demand Analysis

Total demand is decomposed into purchase demand and convenience demand. Purchase demand is computed via commercial POI density and multidimensional attribute weighting [34]. POI data from the Gaode API are filtered by the main urban boundary, and multi-dimensional weights (category, score, status, keywords) are applied per grid. The weighted sum is
H base = i = 1 N ( W c , i · R s , i · S s , i · K w , i )
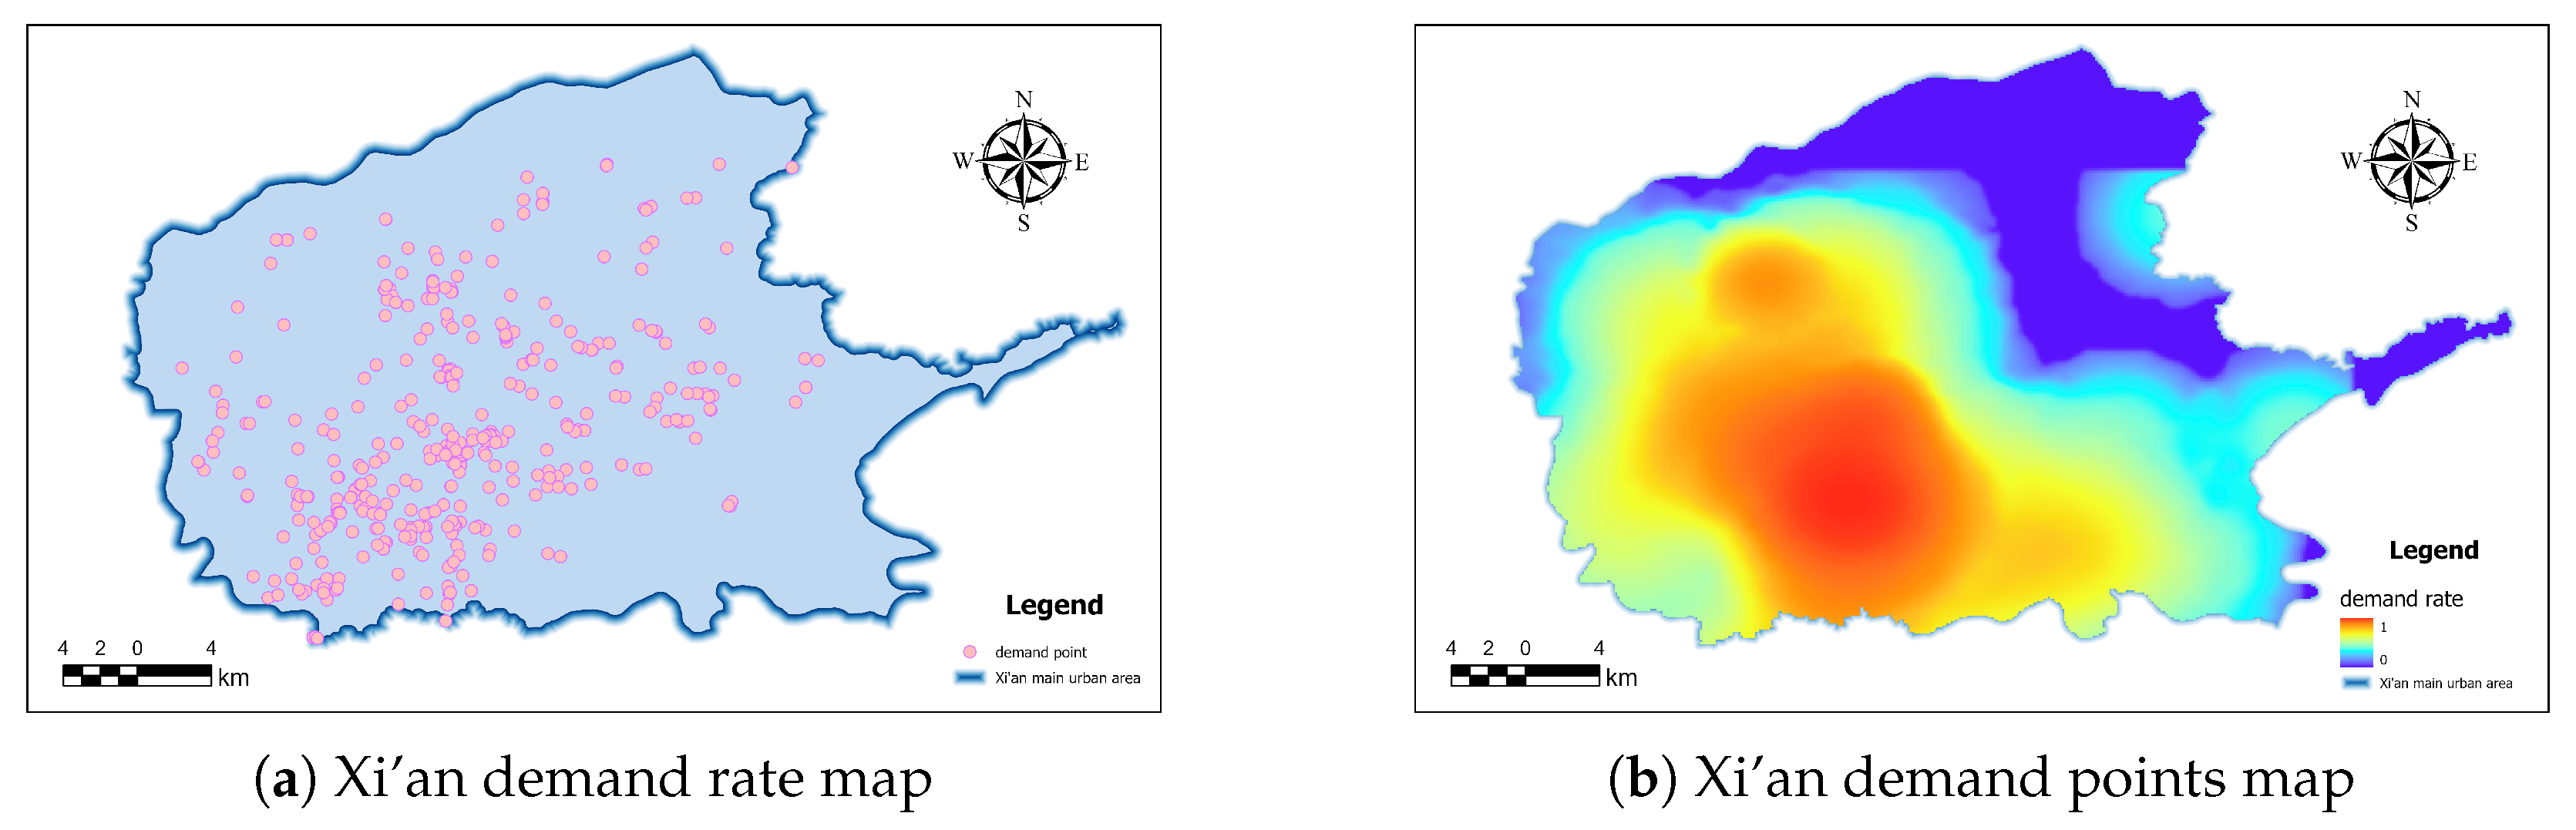
Spatial smoothing is applied with Gaussian filtering ( σ = 2.0 ) and the result is normalized to a 0–10 demand index:
H = 10 · H smooth min ( H smooth ) max ( H smooth ) min ( H smooth )
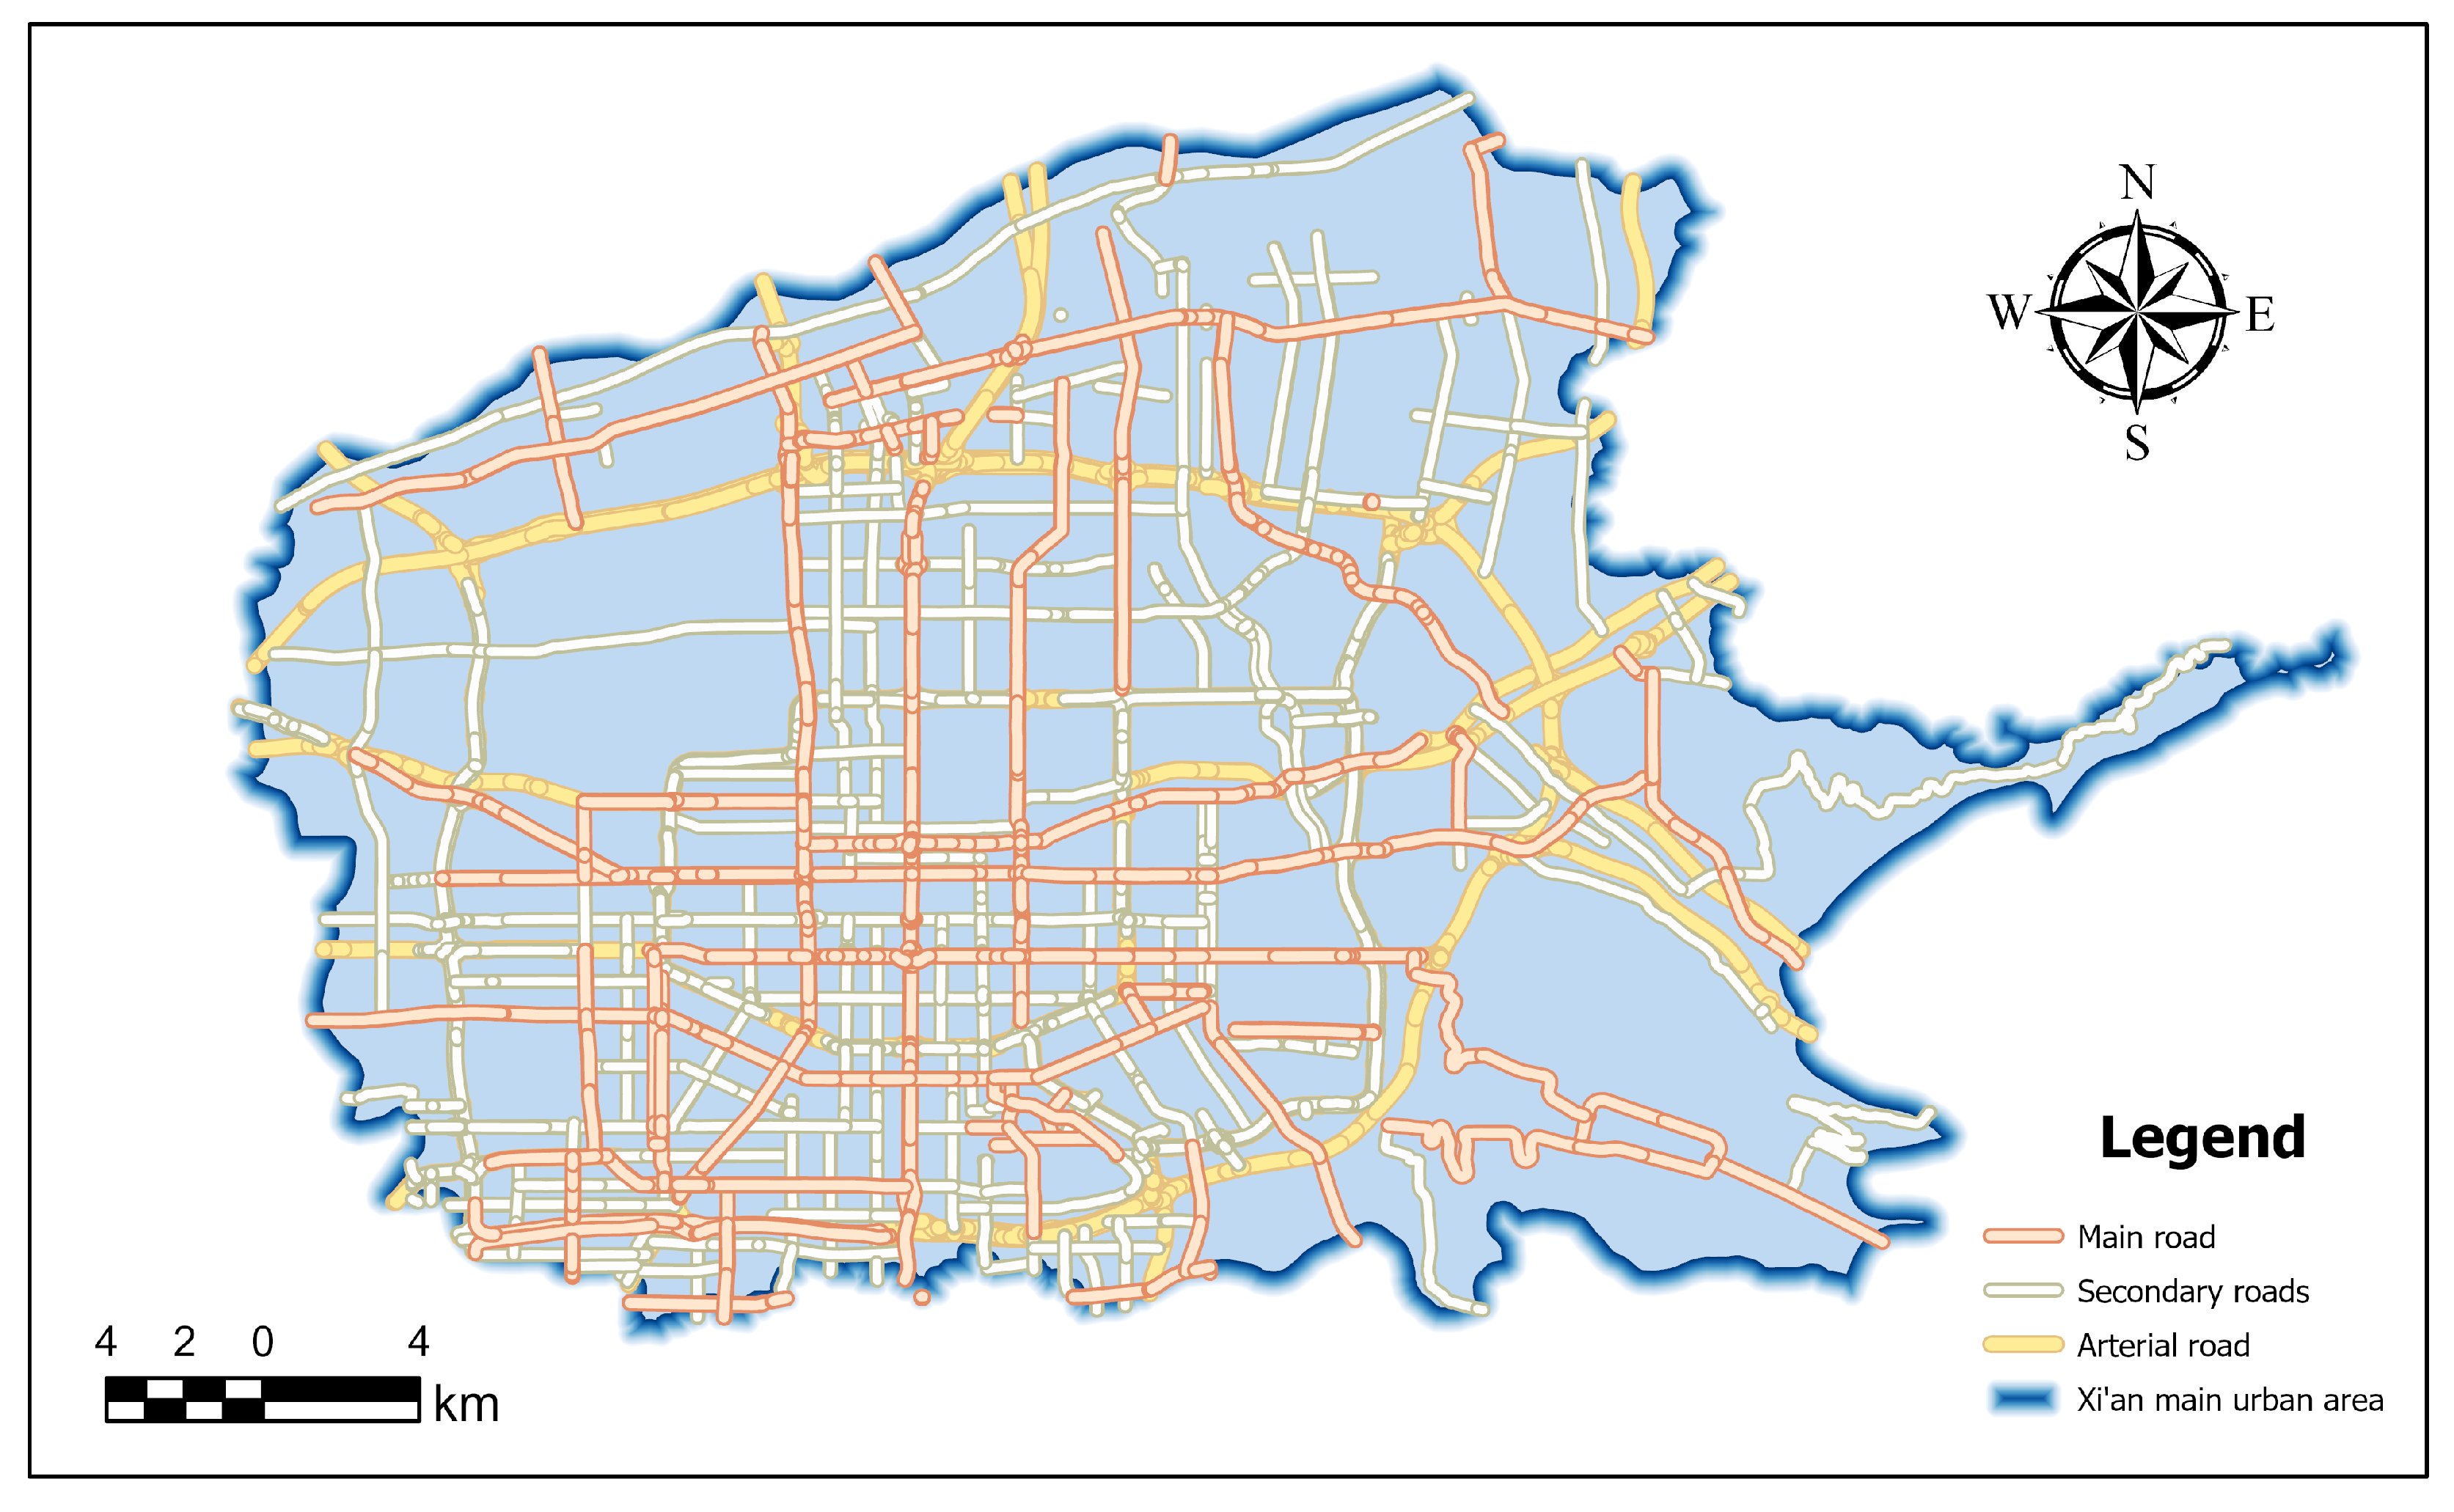
Convenience demand is derived from OpenStreetMap road network data [35]. The graded road network hierarchy in the study area is illustrated in Figure 4. Roads are assigned weights by hierarchy: motorway/trunk: 0.9, primary: 0.8, secondary: 0.7, tertiary/residential: 0.6. These values follow the principle that “accessibility level determines commercial attractiveness”: arterial roads attract higher traffic and are more favorable for superstores; minor and branch roads serve local communities with lower throughput. The traffic accessibility weight v i j of grid ( i , j ) is the maximum weight among roads covering the cell, and normalized to [ 0 , 1 ] to form the traffic channel T i . The POI table used is given in Table 2.

3.3.4. Competition Intensity and Service Pressure

Competition intensity is expressed through the stock facility mask and distance-based penalties. Stock competitor identification: existing supermarket locations are obtained via the Gaode API and filtered to generate a binary mask. Explicit distance penalty: when the Euclidean distance between the newly selected location and an existing supermarket or already selected point is less than 2 grid units, a negative incentive is imposed. Implicit competition penalty: the Service Pressure (SP) at candidate location j from existing superstores is defined as
SP j = k E e d j k
where E is the set of existing superstore locations and d j k is the Euclidean distance between candidate j and existing store k. The implicit competition penalty in the reward function (Equation (11)) is γ · SP j , i.e., γ k E e d j k , which penalizes proximity to existing facilities and guides the agent to avoid high Service Pressure areas.

3.3.5. Feasible Point Selection

Based on the typical distribution of new-format superstores (e.g., Freshippo, Sam’s Club, Chengshan Farm) in urban commercial complexes, characteristic neighbourhoods, or Grade A/B office buildings, feasible candidate locations are defined by retrieving such facilities from the Gaode Map API and mapping them to the 1 km grid. A total of 427 potential candidate locations are obtained; these represent all sites in Xi’an’s main urban area with occupancy potential. Choosing office buildings and their commercial podiums as candidate anchors reflects the reality of new retail expansion: in city cores, constructing new standalone commercial complexes is hardly feasible, while “micro-fill” layout within existing Grade A/B office buildings and their attached commercial spaces has become the mainstream approach. New-format superstores are typically smaller with precise service radius; their core customers overlap with the high-value office workers in such buildings. In Xi’an and similar cities, Grade A/B office buildings are often developed with integrated commercial facilities; selecting office coordinates as candidates effectively identifies the highest-traffic, best-infrastructure “commercial–office” nodes.
Although Freshippo alone has approximately 24 stores in Xi’an, this study targets the broader “new-format superstores” category. Considering collective expansion of multiple brands, 20 sites for single-stage optimization is conservative and realistic. The framework supports flexible adjustment of the number of facilities a from 1 to 158 (Section 5.3); we set a = 20 in the experiment as a representative intermediate value that effectively demonstrates GeoPPO’s superiority in handling competitive spatial constraints while ensuring high-quality visualization. This scale also allows DRL to fully exploit its advantages in complex, large-scale spatial optimization while maintaining stable convergence. The algorithm selects 20 optimal sites from the 427 candidates, simulating the spatial replacement of traditional superstores by an equal number of new-format stores during urban commercial restructuring. Their spatial distribution is shown in Figure 5b.

3.4. Methods

This study constructs a geospatial location selection optimization framework based on DRL. Its core process comprises four key components.
1.
Data fusion and environment modeling.
Multi-source geospatial data including population distribution, transportation network, business demand distribution, location of existing facilities, and administrative boundaries are integrated to construct a grid-based environmental state representation system. The fusion logic and weight determination are specified as follows.
Fusion logic: All spatial channels are Min–Max normalized to [ 0 , 1 ] before being fed into the network. For each channel c, the raw value v c ( i , j ) at grid ( i , j ) is transformed as v c norm ( i , j ) = ( v c ( i , j ) min c ) / ( max c min c ) , where min c and max c are the minimum and maximum over the study area. This ensures that population density (Section 3.3.2), traffic accessibility (Section 3.3.3), POI-based demand (Section 3.3.3), and the binary masks (selected facilities, existing supermarkets) are brought to a common scale, avoiding dominance of any single channel by magnitude.
Weight sources: Weights arise from two dimensions. First, expert-defined preprocessing weights apply domain knowledge before the network: road hierarchy weights (motorway/trunk 0.9, primary 0.8, secondary 0.7, tertiary/residential 0.6) reflect accessibility; POI category weights (e.g., shopping 1.0, residential 0.8) reflect commercial relevance. Second, implicit weights are learned by the convolutional and fully connected layers through backpropagation: the CNN learns how to combine the five channels to extract spatial patterns (e.g., high population plus high traffic), and the decision head learns the relative importance of these patterns for location selection. The five-channel state tensor S is thus not a fixed linear combination but a learned fusion that adapts to the task.
Based on the MCLP framework, three core constraints are set: duplicate location constraints prohibit new construction on existing superstore facilities; geographic boundary constraints limit the location to the effective administrative area; and service coverage constraints ensure that demand points within a certain distance threshold are effectively served. The optimization objective is to maximize the total demand coverage.
2.
Reinforcement learning decision mechanism.
The GeoPPO algorithm drives the location selection decision process [17]. A Convolutional Neural Network extracts the spatial environment features [36] and a fully connected layer generates the probability distribution of the location selection policy. The dynamic action space constraint mechanism identifies and screens out invalid candidate locations that violate geographic boundaries or competition avoidance rules in real time at each decision step, which significantly improves the decision-making efficiency of the agent.
3.
Layered training and balanced optimization.
The Curriculum Learning training strategy sets a large coverage radius in the early stage to encourage exploration of the solution space and gradually tightens the radius in the late stage to guide fine layout adjustments. A Compound Reward Function synergistically optimizes multiple objectives. The base coverage reward correlates positively with the demand density of the area covered. The spatial dispersion reward encourages spacing of 4–10 grid units between facility points. The competitive distance penalty discourages excessive aggregation between new and existing facilities. The design ensures that the final program combines high coverage efficiency with good spatial equity.
4.
Decision support and empirical verification.
Static heat maps and interactive spatial maps visualize the spatial coupling between population distribution and the optimized location plan and support real-time adjustment of key parameters such as service radius and number of facilities. Performance comparisons with baseline methods are presented and justified in Section 4 (Results).

3.5. Problem Model Elaboration

The core of the superstore location problem is not only to maximize the population coverage, but also to maximize the profitability by placing the facilities in the area with the highest demand. In order to accurately portray the goal of “Maximum Coverage Need”, this paper proposes a kind of improved mathematical model—DW-MCLP—Dynamic Weighted Maximum Coverage Location Problem, which introduces multi-dimensional demand intensity indicators into the classical MCLP framework, thus realizing the quantitative characterization of location demand.
(i)
Geospatial Optimization Location Selection Model
This model takes maximizing demand coverage as the primary goal, and its objective function is defined as follows:
Objective function:
max i I a i · y i
where I is the set of all demand points; a i denotes the demand intensity of cell i, which is jointly determined by population density, consumption level and transportation convenience:
a i = ρ i · H i · ( 1 + γ · T i )
where ρ i is the population density of grid cell i, H i is the consumption level of grid cell i, and T i is the transportation convenience; y i { 0 , 1 } is a binary variable identifying whether the cell is covered or not. Here, N i = { j | d i j R } is the set of candidate facilities that can cover cell i, d i j is the grid distance, R is the coverage radius, and x j { 0 , 1 } indicates whether the facility is built at j or not.
The constraints include the following three categories:
(1) Coverage constraints: ensure that each demand point is covered by at least one facility:
y i j N i x j i I
where N i = { j | d i j R } is the set of candidate facilities that can cover cell i, d i j is the grid distance, R is the coverage radius, and x j { 0 , 1 } denotes whether to build the facility at j or not.
(2) Geographic feasibility constraint: the facility must be located within the main urban area of the city:
x j = 0 if j F =
where F is the feasible area determined by the geographic boundary mask.
(3) Avoidance constraint: avoid overlapping with existing superstores:
x j = 0 if j E
where E is the set of existing superstore locations.
The model provides the basis for the subsequent reinforcement learning reward mechanism: the demand intensity a i is directly embedded in the reward function, and the coverage constraint and avoidance constraint are implemented in the decision through the action space mask.
(ii)
Reward function design
In order to guide the intelligent body to make a reasonable location decision in a complex geographic environment, we design the following composite reward function:
r t = α · Δ C + β · tanh ( a j ) γ k e d j k
where Δ C is the population coverage gain from the new facility; a j is the demand intensity at location j; d j k denotes the Euclidean distance between the new facility j and the existing superstore k; α , β , and γ are hyperparameters (default: α = 10 , β = 0.8 , γ = 0.02 ). The scaling factor α aligns the reward magnitudes across dimensions: Δ C is typically small per step, while β · tanh ( a j ) [ 0 , 0.8 ] . Without α , the model may over-weight demand intensity and under-weight global coverage. Setting α = 10 balances the terms and stabilizes gradient updates. The function evaluates the action from the three dimensions of coverage gain, demand intensity, and degree of dispersion.

3.6. Introduction to DRL Methods

3.6.1. Overall Architecture: Actor-Critic Spatial Decision System

In this study, the Actor-Critic framework [37] is used to construct a spatial decision-making system for dealing with the sequential decision-making problem in superstore location selection. The architecture can effectively integrate geospatial information and multi-source constraints, generate the location selection strategy through Actor network, and value assessment of the state by Critic network, so as to jointly guide the intelligences to maximize the long-term revenue in the complex spatial environment. The spatial transformer networks [38] further enhance the model’s capability to process geospatial data with varying scales and orientations, improving the accuracy of location predictions [13].
(i)
Input Representation
The system input is a multi-channel geographic data tensor, defined as follows:
S = { P density of population , X selected facilities , E existing supermarkets , T traffic weight , H purchasing power }
The tensor integrates five types of spatial features, in which the traffic weight channel T is generated from the road network data, which is assigned different weights based on the road class—main road: 0.9, major road: 0.7, minor road: 0.8, and branch road: 0.6—and is normalized to reflect the level of accessibility of each location.
(ii)
Output representation
Actor network output is the probability distribution of actions on all candidate locations, indicating the preference level for building facilities at that location; Critic network output is the state value function V ( s ) , which is used to evaluate the long-term benefit expectation of the current global state.
(iii)
Objective function
Strategy optimization adopts the GeoPPO algorithm, and its objective function is defined as:
L CLIP ( θ ) = E t min r t ( θ ) A t , clip ( r t ( θ ) , 1 ϵ , 1 + ϵ ) A t + c 1 L V F c 2 S [ π ]
where r t ( θ ) = π θ ( a t | s t ) π θ old ( a t | s t ) is the strategy ratio, which is used to compare the difference between the old and new strategies; A t is the dominance function; ϵ is the hyperparameter, which is used to limit the magnitude of strategy update; L V F is the loss term of the value function; and S [ π ] is the strategy entropy, which is used to promote exploration. The objective function controls the update step size through the truncation mechanism, which improves the efficiency of strategy convergence while ensuring the training stability.

3.6.2. Decision-Making Process

Step 1:
Spatial feature extraction—convolutional coding
The operation flow of this spatial decision-making system contains the following key steps.
The system first performs feature extraction on the input state tensor S through a three-layer convolution operation to capture spatial patterns such as population agglomerations, transportation hubs, and high-demand areas. The process is denoted as:
FeatureMap = f ( W S + b )
where W is a 3 × 3 convolution kernel, S is a five-channel input tensor, b is a bias term, and f is a nonlinear activation function.
Step 2:
State Action Space Generation
In the action selection process, the system introduces two layers of constraints to guarantee the rationality and feasibility of location selection:
Boundary constraints
Exclude areas outside the main urban area through geographic masks, defined as:
mask ( i , j ) = 0 beyond borders 1 within the main urban area
Conflict avoidance constraint
  • where areas overlapping with the existing supermarket location ( x k , y k ) are excluded from the candidate actions to avoid duplicate construction.
Step 3:
Strategy Sampling and Reward Calculation
Actor network gets the location action according to the current strategy sampling, and the reward function of the environmental feedback comprehensively considers the factors of covering population, demand intensity and distance from the existing superstores. The reward function is designed as follows:
r t = α · Δ C + β · tanh ( a j ) γ k e d j k
where Δ C is the coverage population gain, a j is the demand intensity at location j, d j k is the Euclidean distance between the new facility j and the existing superstore k, and α = 10 , β = 0.8 , γ = 0.02 are the weight hyperparameters.
Step 4:
GeoPPO-Clip strategy update
Strategy optimization adopts the GeoPPO-Clip method, which enhances training stability by limiting the magnitude of strategy update. Its core mechanism is:
A t > 0 for good action , constrain r i ( θ ) 1 + ϵ
A i < 0 for bad action , constrain r i ( θ ) 1 ϵ
ϵ = 0.2 control maximum policy offset
GeoPPO-Clip introduces a dynamic constraint mechanism in the strategy update phase—when the action advantage value A t > 0 , indicating that the current strategy is better than the old one, the increase of the importance sampling ratio r i ( θ ) is strictly limited by the upper limit 1 + ϵ ; on the contrary, when A t < 0 and strategy performance decreases, then r i ( θ ) is forced to not fall below a lower bound of 1 ϵ . Where ϵ = 0.2 is used as the key hyperparameter, the strategy update amplitude is controlled within a reasonable interval of ± 20 % through the two-way truncation operation, which effectively avoids the performance oscillation due to the overly large step size in the process of strategy optimization, and thus achieves the gradual strategy enhancement under the premise of maintaining the learning stability.
Step 5:
Curriculum Learning Optimization
To balance exploration and utilization, the coverage radius R is dynamically adjusted with the number of training steps:
Radius = R max t t max ( R max R min )
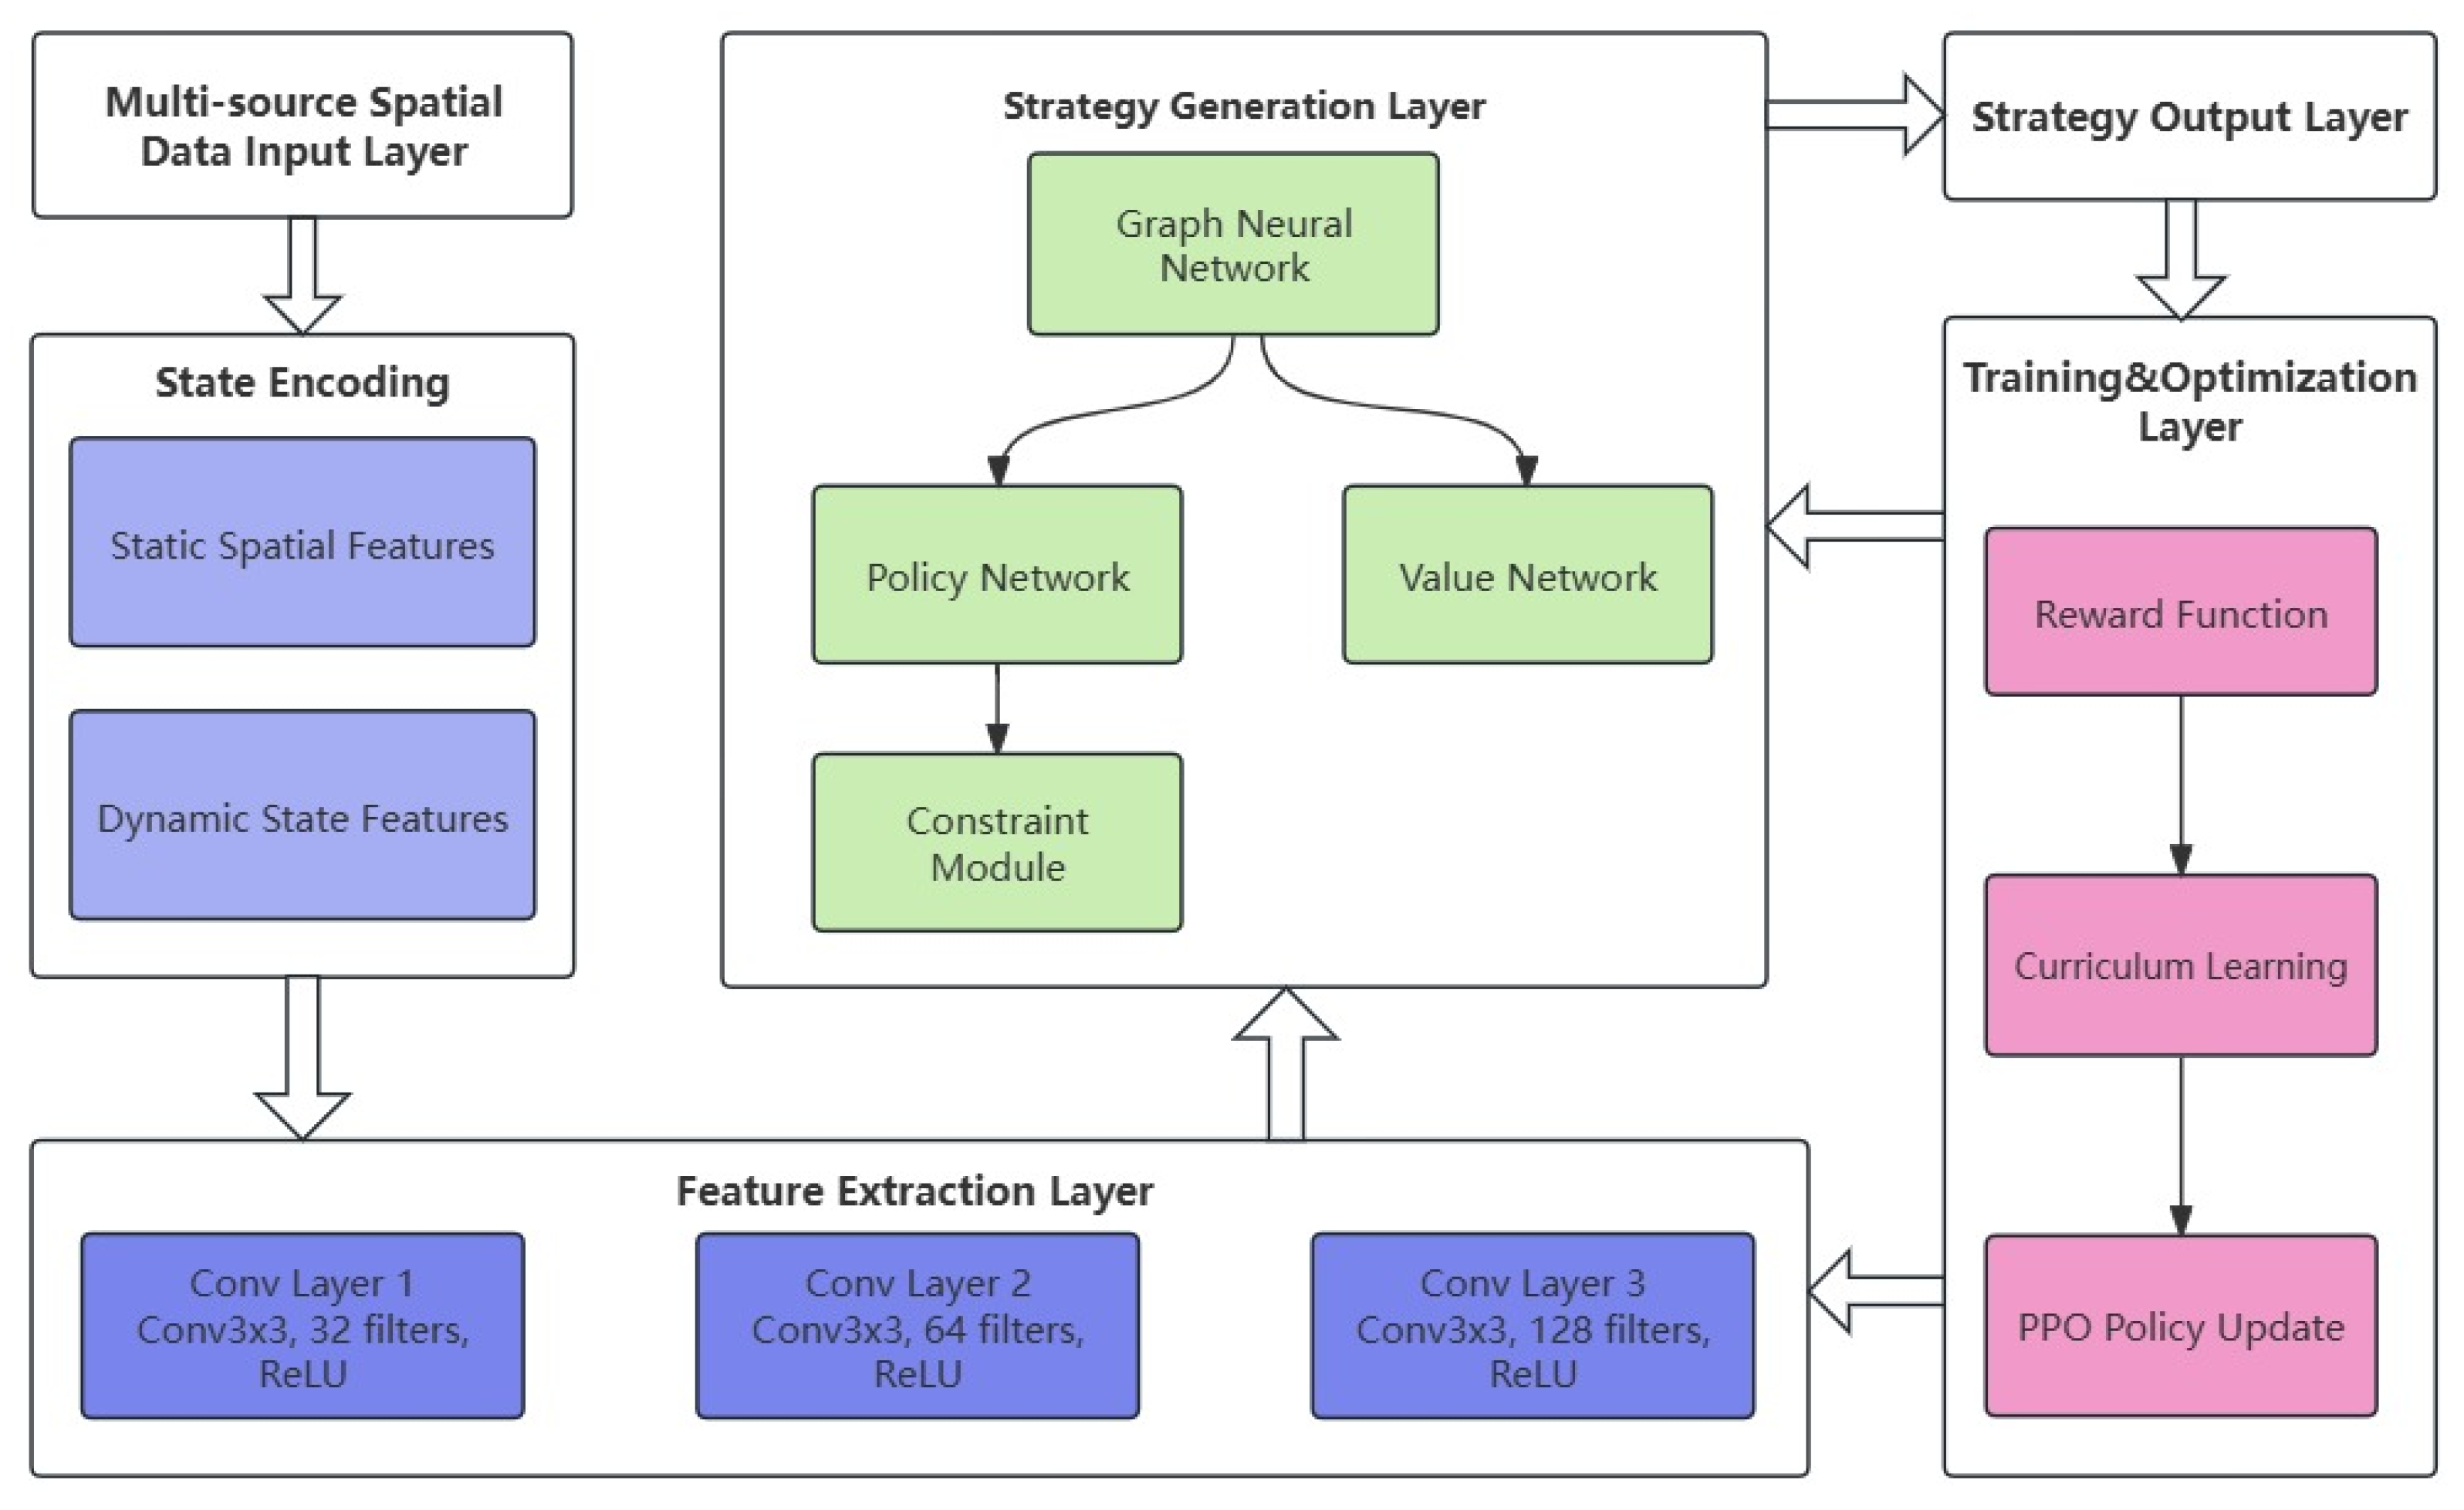
where R max and R min are the maximum and minimum coverage radius respectively, t is the current number of training steps, and t max is the total number of steps. As the number of training steps t increases, the radius will gradually and linearly decay from the initial maximum value R max to the set minimum value R min . This mechanism cleverly guides the learning process from the early extensive exploration and wide coverage of the search space to the later focusing on the optimal solution region to achieve accurate development, which effectively improves the efficiency of the optimization process and the stability of the final solution. Figure 6 summarizes the complete architecture of the GeoPPO decision-making process.

4. Results

4.1. Analysis of Spatial Distribution Pattern

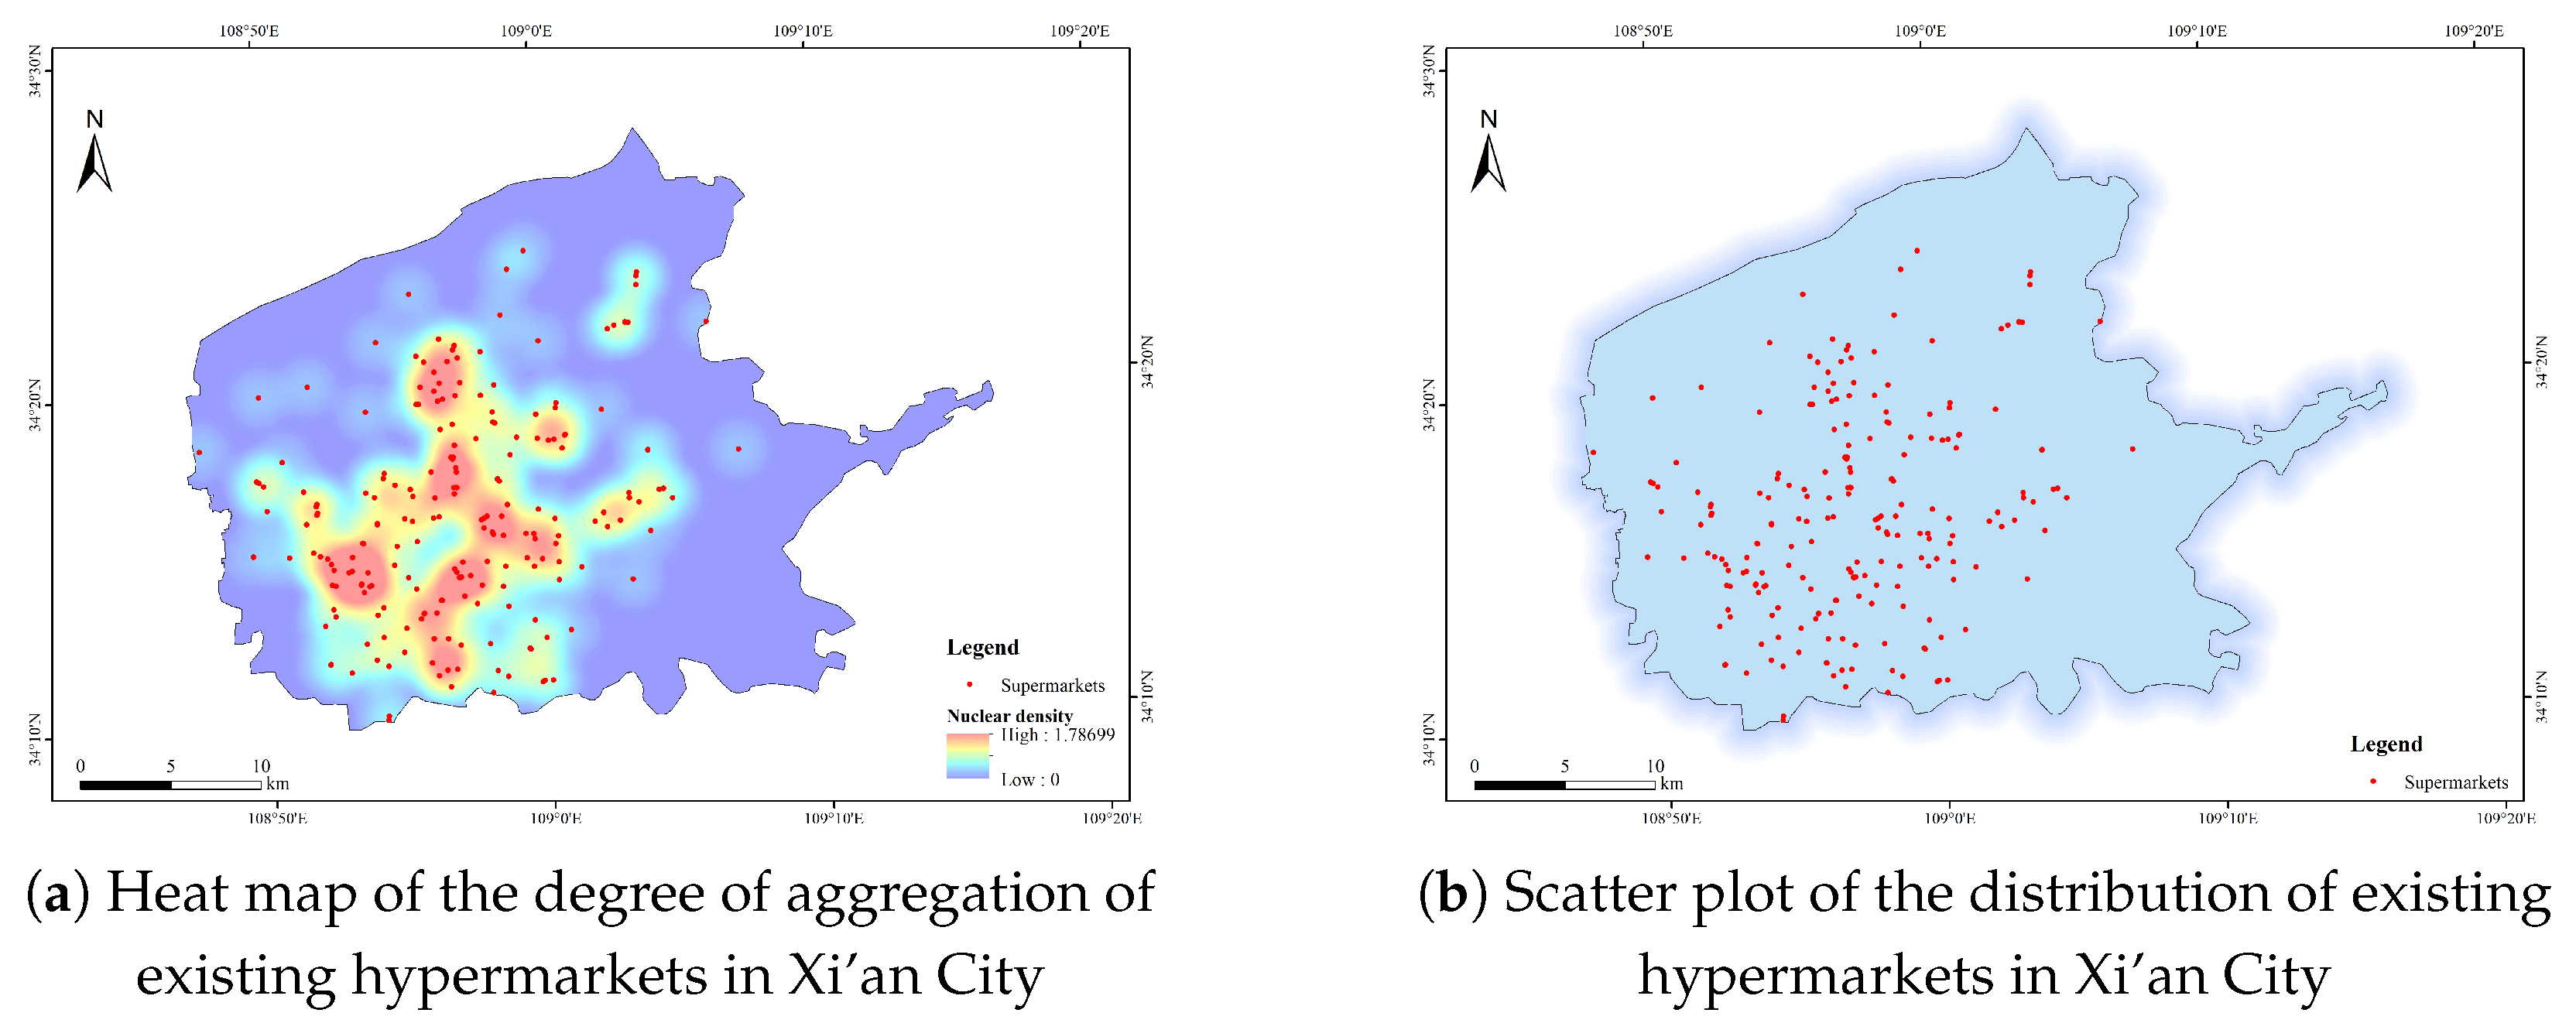
To deeply understand the spatial layout characteristics of the existing large-scale superstores in the main city of Xi’an, this study crawled and obtained the geographic location data of all large-scale superstores in Xi’an through the Gaode Map API. Using the geographic boundaries of the main urban area of Xi’an for spatial alignment and screening, we finally identified all the large-scale superstore locations located in the study area. Based on this dataset, Kernel Density Estimation (KDE) heat maps and spatial distribution scatter plots shown in Figure 7a,b were generated to visualize the degree of spatial aggregation and discrete distribution.
The analysis results show that the spatial distribution of existing hypermarkets in the main urban area of Xi’an presents a dichotomous pattern of “highly aggregated at the core and sparsely distributed at the edges”. It should be noted that core-area concentration is partly a reflection of market dynamics and high population density, rather than planning failure per se. The model does not aim to criticise agglomeration, but to optimize the allocation of existing resources through competition distance penalties and to improve accessibility in peripheral areas.
The core area is highly agglomerated, with traditional urban commercial centers such as Zhonglou, Dananmen, and Xiaozhai as the core, and the hypermarket spots are highly dense with intense spatial competition. The heat map shown in Figure 7a clearly shows the high-intensity aggregation hotspots—red areas—in these areas. The lack of services in peripheral areas. In peripheral or emerging areas such as the northern part of Weiyang District, the eastern part of Baqiao District, and part of the border zone between Lianhu and Yanta Districts, the distribution of hypermarkets is significantly sparse, and in some areas there is even a gap in services, which makes it a challenge for residents to access convenient commercial services. The scatter plot shown in Figure 7b visualizes the sparseness and spatial imbalance of points.
This distribution pattern suggests a significant negative correlation between competition intensity and spatial equity: the high concentration in the core area exacerbates the pressure of homogenized competition, while the sparse distribution in the peripheral areas leads to spatial imbalance in the accessibility of commercial services. Against the background of the current large-scale restructuring of the retail industry in Xi’an, manifested by the closure of traditional supermarkets and the accelerated expansion of new superstores, the current round of industry “reshuffling” will inevitably be accompanied by the withdrawal of some superstores and the reconstruction of new facilities. This is not only an urgent need for the government to optimize the layout of the commercial service network and enhance spatial equity, but also provides an important opportunity for enterprises to seize market opportunities and implement strategic location selection. In this critical transition period, it is particularly important to provide scientific guidance on the redevelopment and location layout of superstores. The optimization strategy should focus on guiding the transfer of commercial resources to the northern and eastern service gaps in order to fill the service gap in the marginal areas; at the same time, in the core areas of fierce competition, we need to reduce the pressure of homogeneous competition through the strategy of differentiation of business forms, so as to achieve the optimal allocation of resources and enhance the overall effectiveness of services.

4.2. Location Selection Experiment

Based on the realistic scenario of the coexistence of traditional superstore closure and new superstore expansion in the context of retail restructuring in Xi’an, this study abstracts the key scientific question: how to maximize the overall demand coverage in the main urban area through spatial optimization when a traditional superstore closes and is replaced by an equal number of new superstores in the area with coverage radius R = 2 km. In order to verify the effectiveness of the proposed GeoPPO framework for solving DW-MCLP, a = 20 is set for empirical analysis. Table 3 summarizes the experimental configuration. We compare GeoPPO with three baselines: (i) Vanilla PPO (ablation) —the original PPO without dynamic action masking; (ii) Genetic Algorithm (GA); and (iii) Particle Swarm Optimization (PSO). The evaluation metrics focus on three dimensions: computational efficiency measured by response time, optimization effect measured by demand coverage, and spatial rationality measured by competitive intensity index with benchmark value 10.00.
Ablation experiment (GeoPPO vs. Vanilla PPO): GeoPPO is a PPO algorithm customized for geospatial location-allocation tasks. Vanilla PPO, which lacks both the dynamic action mask and the curriculum learning mechanism, suffers from an oversized action space (427 candidate locations) and struggles to learn effective policies, making convergence extremely difficult. Without the dynamic action mask, Vanilla PPO frequently selects invalid locations (e.g., outside administrative boundaries or at existing supermarket sites), which yields negligible learning signal and wastes a large proportion of exploration steps. The absence of curriculum learning further exacerbates the problem: the agent must optimize over the full coverage radius from the outset, increasing the difficulty of credit assignment. Consequently, Vanilla PPO exhibits a response time exceeding 45 min with no convergence and fails to produce feasible solutions within the experimental budget, as shown in Table 4.
Heuristic algorithm comparison (PSO): For this discrete optimization problem with 427 candidate locations and complex geospatial constraints, PSO tends to fall into local optima and incurs significantly higher computational cost as the problem scale increases. The results in Table 4 indicate that PSO (69.5% coverage, 6.24 competitive intensity, 15.2 min) underperforms GeoPPO and GA in coverage, competition suppression, and runtime.
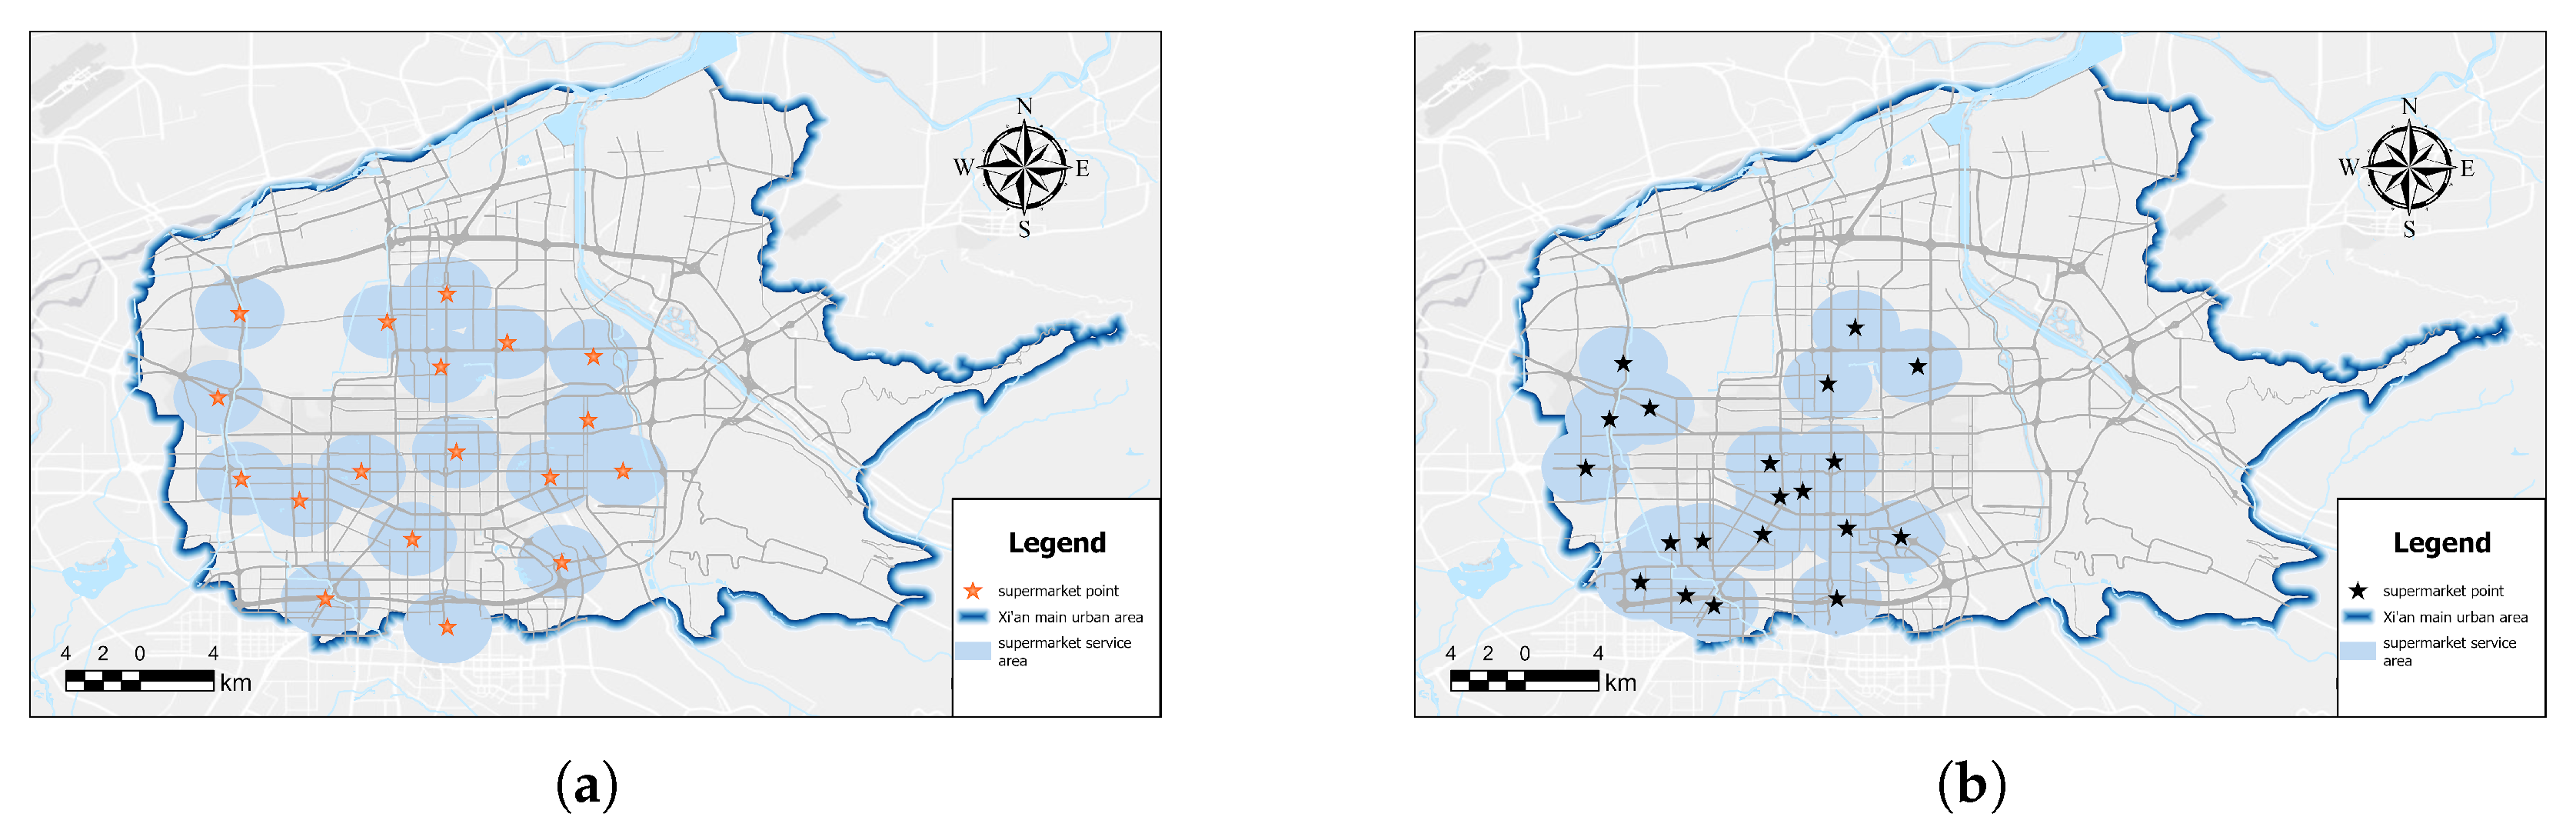
The experimental results shown in Figure 8a,b demonstrate that the GeoPPO framework achieves stable convergence of the loss function after 1000 rounds of training; coverage performance: the final average demand coverage of 75.0% is achieved, which is an improvement of 2.7 and 5.5 percentage points compared to GA (72.3%) and PSO (69.5%), respectively; competition suppression: the competitive intensity index of the GeoPPO scheme is significantly reduced to 1.21, compared to 5.88 for GA and 6.24 for PSO. A comprehensive comparison of all four methods is presented in Table 4.
This finding suggests that the GeoPPO framework achieves an efficient equilibrium in the dual-objective optimization of demand coverage maximization and competition minimization for the DW-MCLP problem. The ablation experiment validates the necessity of the dynamic action mask: without it, Vanilla PPO fails to produce feasible solutions. Compared with heuristic baselines (GA, PSO), GeoPPO attains higher coverage, lower competitive intensity, and faster convergence. Especially importantly, the method reveals that demand coverage and competition intensity are not simply mutually exclusive, and there may be a deep synergistic mechanism—the high coverage area can reduce the competition intensity through scientific layout [39], which is an important insight for the future optimization of commercial networks [40].
The model solving results are expressed visually:
Figure 8. (a) GeoPPO solution results, (b) GA solution results.
Ijgi 15 00114 g008

5. Discussion

This section interprets the empirical findings in light of the technical framework and existing literature, identifies agreements and divergences, and reflects on limitations. Technical details are summarised briefly; full specification is given in Section 3.

5.1. Technical Context

The GeoPPO framework integrates a five-channel gridded state (population, selected mask, existing supermarkets, traffic, POI demand) [14,41], an implicit competition penalty via Service Pressure [25,39], and a dynamic action mask with curriculum learning. The output system supports interactive adjustment of the number of facilities ( a = 1 –158) and parameter sensitivity analysis. See Section 3 for full methodological specification.

5.2. Interpretation of Empirical Findings

The empirical results yield several interpretable insights. First, the 75.0% demand coverage achieved by GeoPPO, compared with 72.3% (GA) and 69.5% (PSO), indicates that the combination of coverage reward, dispersion incentive, and competition penalty in the reward function effectively guides the agent toward layouts that balance service reach and spatial equity. The low competition intensity index (1.21 vs. 5.88 for GA and 6.24 for PSO) suggests that the implicit Service Pressure term successfully discourages excessive clustering in high-demand cores.
This finding aligns with the spatial imbalance documented by Lin et al. for Taipei’s retail layout—“over-saturation in the core area and lack of services in the peripheral area” [16]. The alleviation of oversaturation in zones such as Dananmen and Zhonglou, while maintaining high overall coverage, suggests that GeoPPO addresses a similar core–periphery imbalance in Xi’an. The competition penalty design is consistent with supermarket competition dynamics in spatial equilibrium [25]. A notable divergence from purely coverage-driven heuristics is that GeoPPO achieves higher coverage and lower competition simultaneously, implying that demand coverage and competition intensity are not simply trade-offs but can be jointly improved through appropriate reward design.
The ablation experiment underscores the necessity of the dynamic action mask: without it, Vanilla PPO fails to produce feasible solutions. This supports the view that hard spatial constraints in large-scale location-allocation require explicit constraint handling rather than post hoc filtering.

5.3. Output Results

The output system integrates static heat maps and interactive maps via the Folium library, supporting real-time adjustment of service radius and number of facilities for policy derivation.

5.4. Limitations

Several limitations should be acknowledged. First, the study relies on LandScan 2023 and Gaode POI data as static snapshots; population flow and demand vary temporally (e.g., hourly or weekly), and the model does not capture such dynamics. Second, the case is confined to Xi’an’s main urban area; generalisation to other cities or larger regions requires validation. Third, the 427-candidate, a = 20 scale, while representative for the current experiment, may need recalibration for cities with different retail structures or candidate densities. Future work should incorporate temporal data streams and multi-city validation to strengthen generalisability.

6. Conclusions

6.1. Summary of Contributions

This study proposes a DRL-based GeoPPO framework for solving the DW-MCLP location selection optimization problem under complex geospatial constraints. The main contributions are: (i) a five-channel grid environment integrating population, traffic network, and commercial POIs to characterize spatial demand and constraints; (ii) a dynamic action spatial constraint mechanism and triple reward function that achieve synergistic optimization of demand coverage and spatial competition; and (iii) a feasible technical path for handling highly dynamic urban facility spatial configuration with geographic mask constraints. Detailed empirical results and spatial analysis are presented in the Section 5.

6.2. Outlook and Future Directions

The proposed GeoPPO framework demonstrates significant potential for urban commercial planning in solving DW-MCLP problems. Future research can be advanced in the following two key directions to enhance its applicability and intelligence.
1.
Advancing Predictive Modeling with Dynamic Urban Data
Future work should evolve from static snapshots to dynamic, predictive modeling [42]. This involves integrating temporal data streams such as mobile phone data to capture hourly/weekly population flow variations and incorporating urban development plans to forecast long-term demand shifts. Such capability would transform the model into a proactive tool for strategic planning, allowing stakeholders to anticipate market changes rather than merely responding to current conditions.
2.
Extending Applications to Larger Regions and Different Facility Types
Beyond the current application in Xi’an’s main urban area, the GeoPPO framework can be extended to larger regional scales and diverse facility location problems. The framework’s adaptability enables its application to various facility types such as hospitals, schools, logistics centers, and emergency service facilities. When applied to larger regions, the model can handle multi-city or metropolitan area planning scenarios, where spatial heterogeneity and inter-city competition dynamics become more complex [43]. For different facility types, the demand characterization and constraint formulation can be customized—e.g., hospitals require emergency accessibility constraints, while logistics centers emphasize transportation network connectivity. The multi-channel tensor representation and dynamic masking mechanism of GeoPPO provide the flexibility to incorporate facility-specific spatial constraints and demand patterns, making it a versatile tool for diverse location-allocation problems across various spatial scales and facility categories.
By focusing on these directions—predictive dynamics and extended applications —the DRL-based paradigm can evolve into a more powerful and versatile tool for building smarter urban commercial ecosystems.

Author Contributions

Conceptualization, Yuxuan Hu and Kun Qin; methodology, Yuxuan Hu, Kun Qin and Shaohua Wang; software, Yuxuan Hu; validation, Yuxuan Hu and Kun Qin; formal analysis, Yuxuan Hu; investigation, Yuxuan Hu and Kun Qin; resources, Kun Qin and Shaohua Wang; data curation, Yuxuan Hu; writing—original draft preparation, Yuxuan Hu; writing—review and editing, Kun Qin and Shaohua Wang; visualization, Yuxuan Hu; supervision, Kun Qin; project administration, Kun Qin; funding acquisition, Kun Qin. All authors have read and agreed to the published version of the manuscript.

Funding

This research received no external funding.

Data Availability Statement

The core code of the GeoPPO framework and the desensitized Xi’an spatial grid dataset will be made publicly available on the GitHub platform upon the formal acceptance of this paper.

Conflicts of Interest

The authors declare no conflict of interest. The funders had no role in the design of the study; in the collection, analyses, or interpretation of data; in the writing of the manuscript; or in the decision to publish the results.

References

  1. State Council of the People’s Republic of China. Approval of Xi’an Territorial Spatial Master Plan (2021–2035). State Council Document No. 13. 2025. Available online: https://www.gov.cn/zhengce/zhengceku/202501/content_7000441.htm (accessed on 1 February 2025).
  2. Caixin Global. In Depth: E-Commerce Giants Shun Supermarkets as Sales Slump. 16 January 2025. Available online: https://www.caixinglobal.com/2025-01-16/in-depth-e-commerce-giants-shun-supermarkets-as-sales-slump-102279780.html (accessed on 1 February 2025).
  3. Larson, J.S.; Bradlow, E.T.; Fader, P.S. An exploratory look at supermarket shopping paths. Int. J. Res. Mark. 2005, 22, 395–414. [Google Scholar] [CrossRef]
  4. Harris, B.; Batty, M. Locational models, geographic information and planning support systems. J. Plan. Educ. Res. 1993, 12, 184–198. [Google Scholar] [CrossRef]
  5. Oliveira, V.; Pinho, P. Evaluation in urban planning: Advances and prospects. J. Plan. Lit. 2010, 24, 343–361. [Google Scholar] [CrossRef]
  6. Arulkumaran, K.; Deisenroth, M.P.; Brundage, M.; Bharath, A.A. Deep reinforcement learning: A brief survey. IEEE Signal Process. Mag. 2017, 34, 26–38. [Google Scholar] [CrossRef]
  7. Liang, H.; Wang, S.; Li, H.; Zhou, L.; Chen, H.; Zhang, X.; Chen, X. Sponet: Solve spatial optimization problem using deep reinforcement learning for urban spatial decision analysis. Int. J. Digit. Earth 2024, 17, 2299211. [Google Scholar] [CrossRef]
  8. Liang, H.; Wang, S.; Li, H.; Pan, J.; Li, X.; Su, C.; Liu, B. AIAM: Adaptive interactive attention model for solving p-Median problem via deep reinforcement learning. Int. J. Appl. Earth Obs. Geoinf. 2025, 138, 104454. [Google Scholar] [CrossRef]
  9. Panait, L.; Luke, S. Cooperative multi-agent learning: The state of the art. Auton. Agents Multi-Agent Syst. 2005, 11, 387–434. [Google Scholar] [CrossRef]
  10. Vaswani, A.; Shazeer, N.; Parmar, N.; Uszkoreit, J.; Jones, L.; Gomez, A.N.; Kaiser, Ł; Polosukhin, I. Attention is all you need. In Advances in Neural Information Processing Systems; Curran Associates, Inc.: Red Hook, NY, USA, 2017; Volume 30, pp. 5998–6008. [Google Scholar]
  11. Beheshti, Z.; Shamsuddin, S.M.H. A review of population-based meta-heuristic algorithms. Int. J. Adv. Soft Comput. Appl. 2013, 5, 1–35. [Google Scholar]
  12. Baviera-Puig, A.; Buitrago-Vera, J.; Escriba-Perez, C. Geomarketing models in supermarket location strategies. J. Bus. Econ. Manag. 2016, 17, 1205–1221. [Google Scholar] [CrossRef]
  13. Cui, Y.; Yu, Y.; Cai, Z.; Wang, D. Optimizing road network density considering automobile traffic efficiency: Theoretical approach. J. Urban Plan. Dev. 2022, 148, 04021062. [Google Scholar] [CrossRef]
  14. Liu, K.; Yin, L.; Lu, F.; Mou, N. Visualizing and exploring POI configurations of urban regions on POI-type semantic space. Cities 2020, 99, 102610. [Google Scholar] [CrossRef]
  15. Psyllidis, A.; Gao, S.; Hu, Y.; Kim, E.K.; McKenzie, G.; Purves, R.; Yuan, M.; Andris, C. Points of Interest (POI): A commentary on the state of the art, challenges, and prospects for the future. Comput. Urban Sci. 2022, 2, 20. [Google Scholar] [CrossRef]
  16. Lin, P.C.; Cheng, T.C.E.; Hsu, C.H. Retail location modeling of supermarket chains in Taipei city. Appl. Geogr. 2023, 161, 103126. [Google Scholar] [CrossRef]
  17. Engstrom, L.; Ilyas, A.; Santurkar, S.; Tsipras, D.; Janoos, F.; Rudolph, L.; Madry, A. Implementation matters in deep policy gradients: A case study on ppo and trpo. arXiv 2020, arXiv:2005.12729. [Google Scholar] [CrossRef]
  18. Jaderberg, M.; Simonyan, K.; Zisserman, A.; Kavukcuoglu, K. Spatial transformer networks. In Advances in Neural Information Processing Systems; Curran Associates, Inc.: Red Hook, NY, USA, 2015; Volume 28, pp. 2017–2025. [Google Scholar] [CrossRef]
  19. Alnahhal, M.; Noche, B. A genetic algorithm for supermarket location problem. Assem. Autom. 2015, 35, 122–127. [Google Scholar] [CrossRef]
  20. Guo, W.; Xu, Y.; Jin, Y. Swap-based deep reinforcement learning for facility location problems in networks. arXiv 2023, arXiv:2312.15658. [Google Scholar] [CrossRef]
  21. Wei, H.; Liu, X.; Ying, L. Triple-q: A model-free algorithm for constrained reinforcement learning with sublinear regret and zero constraint violation. In International Conference on Artificial Intelligence and Statistics (AISTATS 2022); PMLR: New York, NY, USA, 2022; Volume 151, pp. 3274–3307. [Google Scholar]
  22. Su, H.; Zheng, Y.; Ding, J.; Jin, D.; Li, Y. Large-scale Urban Facility Location Selection with Knowledge-informed Reinforcement Learning. In Proceedings of the 32nd ACM International Conference on Advances in Geographic Information Systems (ACM SIGSPATIAL 2024), 29 October–1 November 2024; ACM: New York, NY, USA, 2024; pp. 553–556. [Google Scholar]
  23. Wang, S.; Xu, D.; Zhou, J.; Su, C.; Li, X.; Liang, X.; Cao, C.; Liu, C.; Zhong, Y. Convenience stores geospatial location optimization analytics using deep reinforcement learning. In Proceedings of the 3rd ACM SIGSPATIAL International Workshop on Spatial Big Data and AI for Industrial Applications; ACM: New York, NY, USA, 2024; pp. 16–23. [Google Scholar]
  24. Pflieger, G.; Rozenblat, C. Introduction. Urban networks and network theory: The city as the connector of multiple networks. Urban Stud. 2010, 47, 2723–2735. [Google Scholar] [CrossRef]
  25. Smith, H. Supermarket choice and supermarket competition in market equilibrium. Rev. Econ. Stud. 2004, 71, 235–263. [Google Scholar] [CrossRef]
  26. Noworól, A.; Kopyciński, P.; Hałat, P.; Salamon, J.; Hołuj, A. The 15-minute city—The geographical proximity of services in Krakow. Sustainability 2022, 14, 7103. [Google Scholar] [CrossRef]
  27. Yue, Y.; Zhuang, Y.; Yeh, A.G.; Xie, J.Y.; Ma, C.L.; Li, Q.Q. Measurements of POI-based mixed use and their relationships with neighbourhood vibrancy. Int. J. Geogr. Inf. Sci. 2017, 31, 658–675. [Google Scholar] [CrossRef]
  28. Unwin, D.J. GIS, spatial analysis and spatial statistics. Prog. Hum. Geogr. 1996, 20, 540–551. [Google Scholar] [CrossRef]
  29. Turk, T.; Kitapci, O.; Dortyol, I.T. The usage of Geographical Information Systems (GIS) in the marketing decision making process: A case study for determining supermarket locations. Procedia-Soc. Behav. Sci. 2014, 148, 227–235. [Google Scholar] [CrossRef]
  30. Oak Ridge National Laboratory. LandScan Global 2023: Silver Edition [Data Set]. 2024. Available online: https://landscan.ornl.gov/ (accessed on 1 February 2025).
  31. Haklay, M.; Weber, P. OpenStreetMap: User-generated street maps. IEEE Pervasive Comput. 2008, 7, 12–18. [Google Scholar] [CrossRef]
  32. Weng, Y.; Xu, M.; Chen, X.; Peng, C.; Xiang, H.; Xie, P.; Yin, H. An Efficient Algorithm for Extracting Railway Tracks Based on Spatial-Channel Graph Convolutional Network and Deep Neural Residual Network. ISPRS Int. J. Geo-Inf. 2024, 13, 309. [Google Scholar] [CrossRef]
  33. Xi’an Municipal Bureau of Statistics. Communiqué on Major Data of the Seventh National Population Census of Xi’an City. 31 May 2021. Available online: https://tjj.xa.gov.cn/ (accessed on 1 February 2025).
  34. Zhao, P.; Luo, A.; Liu, Y.; Xu, J.; Li, Z.; Zhuang, F.; Sheng, V.S.; Zhou, X. Where to go next: A spatio-temporal gated network for next poi recommendation. IEEE Trans. Knowl. Data Eng. 2020, 34, 2512–2524. [Google Scholar] [CrossRef]
  35. Xue, J.; Jiang, N.; Liang, S.; Pang, Q.; Yabe, T.; Ukkusuri, S.V.; Ma, J. Quantifying the spatial homogeneity of urban road networks via graph neural networks. Nat. Mach. Intell. 2022, 4, 246–257. [Google Scholar] [CrossRef]
  36. LeCun, Y.; Bengio, Y.; Hinton, G. Deep learning. Nature 2015, 521, 436–444. [Google Scholar] [CrossRef] [PubMed]
  37. Zhao, L.; Fan, J.; Zhang, C.; Shen, W.; Zhuang, J. A DRL-based reactive scheduling policy for flexible job shops with random job arrivals. IEEE Trans. Autom. Sci. Eng. 2023, 21, 2912–2923. [Google Scholar] [CrossRef]
  38. Lin, C.H.; Yumer, E.; Wang, O.; Shechtman, E.; Lucey, S. St-gan: Spatial transformer generative adversarial networks for image compolocation selection. In Proceedings of the IEEE Conference on Computer Vision and Pattern Recognition; IEEE: New York, NY, USA, 2018; pp. 9455–9464. [Google Scholar]
  39. Fotheringham, A.S.; Brunsdon, C. Local forms of spatial analysis. Geogr. Anal. 1999, 31, 340–358. [Google Scholar] [CrossRef]
  40. Glaeser, E.L.; Ponzetto, G.A.M.; Zou, Y. Urban networks: Connecting markets, people, and ideas. Pap. Reg. Sci. 2016, 95, 17–60. [Google Scholar] [CrossRef]
  41. Zheng, Y.; Lin, Y.; Zhao, L.; Wu, T.; Jin, D.; Li, Y. Spatial planning of urban communities via deep reinforcement learning. Nat. Comput. Sci. 2023, 3, 748–762. [Google Scholar] [CrossRef] [PubMed]
  42. Yin, H.; Wang, W.; Wang, H.; Chen, L.; Zhou, X. Spatial-aware hierarchical collaborative deep learning for POI recommendation. IEEE Trans. Knowl. Data Eng. 2017, 29, 2537–2551. [Google Scholar] [CrossRef]
  43. Ellickson, P.B.; Misra, S. Supermarket pricing strategies. Mark. Sci. 2008, 27, 811–828. [Google Scholar] [CrossRef]
Figure 1. Workflow of the Overall Spatial Optimization Framework. Arrows indicate the direction of data flow; boxes of different colors represent distinct functional modules (Multi-source Data, DW-MCLP Environment, GeoPPO Agent, Results & Evaluation).
Ijgi 15 00114 g001
Figure 2. Population density distribution of Xi’an main urban area revealing high concentration in Beilin, Lianhu, and Xincheng districts. Values of 10,000 or greater use thousand separators (e.g., 33,000).
Ijgi 15 00114 g002
Figure 3. Definition of the main urban area of Xi’an City. Distinct colors indicate administrative districts; see legend in figure for district names.
Ijgi 15 00114 g003
Figure 4. Graded road network of main roads in Xi’an main urban area.
Ijgi 15 00114 g004
Figure 5. (a) Spatial demand intensity fused from POI and traffic accessibility, (b) Distribution of 427 feasible candidate locations in the study area.
Ijgi 15 00114 g005
Figure 6. Architecture diagram of GeoPPO decision-making model. Color-coded blocks represent input channels (e.g., population, traffic, POI), convolutional layers, and Actor/Critic heads; arrows indicate data flow.
Ijgi 15 00114 g006
Figure 7. (a) Spatial pattern of high core-area concentration and insufficient peripheral coverage of existing supermarkets in Xi’an, (b) Scatter distribution revealing core–periphery imbalance.
Ijgi 15 00114 g007
Table 1. Core Symbols and Notation.
SymbolDescription
ISet of all demand points (grid cells)
x j Binary decision variable: whether to build a facility at location j
y i Binary decision variable: whether demand point i is covered
a i Demand intensity of cell i: a i = ρ i · H i · ( 1 + γ · T i )
d i j Grid distance between demand point i and facility j
RCoverage radius
r t Reward function at time step t: r t = α · Δ C + β · tanh ( a j ) γ k e d j k
α Scaling factor for coverage gain (default: 10); aligns reward magnitudes for stable gradient updates
ρ i Population density of grid cell i
H i Consumption level (purchasing power) of grid cell i
N i Set of candidate facilities that can cover cell i: N i = { j | d i j R }
β , γ Weight hyperparameters for demand intensity and competition penalty (default: 0.8, 0.02)
SP j Service Pressure at candidate j: SP j = k E e d j k
Table 2. POI Table for Purchasing Needs Analysis.
POI Name (EN)POI Type (EN)CountPOI Name (EN)POI Type (EN)Count
Cake ShopShopping Service511Post OfficeLife Service472
BankLife Service436Bubble Tea ShopShopping Service410
Fruit ShopShopping Service399Fast Food RestaurantFood & Beverage Service396
Vegetable MarketEssential Shopping Service390RestaurantFood & Beverage Service383
SupermarketEssential Shopping Service381Courier PointLife Service367
PlazaLife Service364Hot Pot RestaurantFood & Beverage Service364
Coffee ShopFood & Beverage Service354Convenience StoreEssential Shopping Service353
Snack ShopShopping Service342Grain & Oil StoreEssential Shopping Service339
Tobacco & Alcohol StoreShopping Service333Butcher ShopEssential Shopping Service321
Department StoreShopping Service319Retail StoreShopping Service315
ApartmentResidential Area315Small Grocery StoreShopping Service294
BuildingComprehensive Service258Residential CompoundResidential Area253
Fresh Food StoreShopping Service249Food StoreShopping Service242
CommunityResidential Area207Grocery StoreShopping Service182
GardenLife Service175Office BuildingComprehensive Service157
Villa AreaResidential Area85Shopping MallShopping Service79
Urban VillageResidential Area67Commercial BuildingComprehensive Service55
Table 3. Experimental Configuration.
Configuration ParameterValue
HardwareGPU: NVIDIA GeForce RTX 4060 (NVIDIA Corporation, Santa Clara, CA, USA); CPU: Intel Core i5-13th Gen, RAM: 16 GB (Intel Corporation, Santa Clara, CA, USA)
SoftwarePython 3.10 (Python Software Foundation, Wilmington, DE, USA); PyTorch 2.0 (Meta Platforms, Menlo Park, CA, USA); Folium (open source)
Problem Scale427 candidate locations, 487 demand points
Coverage radius: R = 2 km, Number of facilities: a = 20
Table 4. Performance Comparison of GeoPPO with Vanilla PPO, GA, and PSO.
MetricGeoPPOVanilla PPOGAPSO
Demand Coverage (%)75.0N/A (infeasible)72.369.5
Competitive Intensity Index1.21N/A5.886.24
Average Response Time8.5 min>45 min10.6 min15.2 min
Training/Convergence1000 epochsNo convergence1700+ iter.2400+ iter.
Solution QualityHighInfeasibleMediumMedium–Low
Disclaimer/Publisher’s Note: The statements, opinions and data contained in all publications are solely those of the individual author(s) and contributor(s) and not of MDPI and/or the editor(s). MDPI and/or the editor(s) disclaim responsibility for any injury to people or property resulting from any ideas, methods, instructions or products referred to in the content.