Article

Land Use, Street Design, and Older Adults’ Active Travel: Uncovering Nonlinear Effects in Multi-Scale Convenient Living Circles

1
Wuhan Institute of Technology, School of Civil Engineering and Architecture, Wuhan 430074, China
2
School of Architecture and Urban Planning, Huazhong University of Science and Technology, Wuhan 430074, China
3
Department of Geography, Ghent University, De Sterre Krijgslaan 297, S8, 9000 Ghent, Belgium
4
Wuhan Planning and Design Institute, Wuhan 430074, China
*
Author to whom correspondence should be addressed.
ISPRS Int. J. Geo-Inf. 2026, 15(3), 109; https://doi.org/10.3390/ijgi15030109
Submission received: 24 November 2025 / Revised: 3 February 2026 / Accepted: 13 February 2026 / Published: 4 March 2026

Abstract

Promoting older adults’ active travel (AT) is important for healthy ageing, yet the optimal spatial units and scales for built environment (BE) interventions remain unclear. Existing studies often ignore the Modifiable Areal Unit Problem and fail to distinguish macro-scale land-use patterns from micro-scale street design under potentially nonlinear behavior–environment relationships. This study aims to clarify how multi-scale BE influences older adults’ AT and to identify the most effective intervention scale. Using survey data from 2494 older adults in Wuhan, China, we construct six behaviorally meaningful sliding units (5, 10, and 15 min walking network buffers and distance-equivalent Euclidean buffers), derive macro- and micro-scale indicators from GIS, census data, and street view images, and build separate Extreme Gradient Boosting (XGBoost) models with Accumulated Local Effects plots for interpretation. A model comparison reveals pronounced scale effects: network-based buffers systematically outperform circular buffers, and the 15 min walking network buffer emerges as the optimal intervention unit. Across all scales, BE variables contribute more to model performance than socio-demographic factors, and macro-scale attributes (e.g., land-use mix, facility density, and transit access) consistently outweigh micro-scale street features. Nonlinear effects and thresholds are identified for key density, accessibility, and streetscape indicators. These findings underscore the necessity of multi-scale analysis and support planning “15 min life circles” for older adults that prioritize macro-scale land-use and facility optimization, complemented by targeted, context-specific street-level improvements to create safe, age-friendly walking environments.

1. Introduction

The world is facing an acute challenge of rapid population aging, which is placing unprecedented pressure on urban public health systems and social welfare systems [1]. Increasing physical activity levels is considered a critical and cost-effective method to achieve healthy aging [2]. Characterized by human-powered movement like walking and cycling, active travel (AT) is widely regarded as the most seamless form of physical activity to embed within daily life, especially for older adults [3]. Research shows that regular AT helps meet World Health Organization physical activity recommendations, reducing chronic disease risk [4]. However, older adults often have activity ranges concentrated around their homes and exhibit greater sensitivity to, and dependence on, the quality of the built environment (BE) [5,6,7]. Therefore, identifying key BE indicators affecting older adults’ AT and understanding their mechanisms is crucial for formulating effective age-friendly interventions.
This trend is especially pronounced in China. Data from the 7th National Population Census revealed that 18.7% of China’s population was aged 60 or older, a figure projected to grow substantially. Older adults in China also face a high prevalence of chronic noncommunicable diseases, such as hypertension and diabetes, which are linked to sedentary lifestyles [8]. By March 2025, Wuhan’s elderly population reached 2.19 million (23.05% of the total), signaling a rapid transition into a deeply aging society. As a major urban center simultaneously experiencing this severe demographic shift and rapid urbanization, Wuhan serves as an analytically meaningful case study for examining BE-AT relationships among older adults.
Existing research indicates that multi-scale BE interventions can effectively encourage AT among older adults. For instance, the literature widely documents macro-level land-use strategies, such as promoting polycentric urban structures, increasing land-use density and diversity, and improving public transit accessibility [9]. It also highlights micro-level street-design measures such as enhancing street greenery and strengthening sidewalk connectivity as effective approaches [10,11,12].
Recent research also emphasizes the intricate and nonlinear nature of the association between the BE and travel behavior, so traditional linear models often fail to capture key patterns [11]. This has motivated a gradual shift toward nonlinear methods with stronger predictive and explanatory power. However, two critical limitations remain. The first concerns spatial scale: at what spatial unit should we measure and intervene in the BE? The Modifiable Areal Unit Problem (MAUP) remains a persistent challenge in research linking the BE to travel behavior, as statistical outcomes are sensitive to the scale and configuration of the spatial units employed. Yet many studies still rely on preset units such as 800 m circular buffers or census tracts without testing whether these units are behaviorally meaningful [13], which can bias estimates of BE effects, especially when nonlinear responses to the environment are present.
The second limitation concerns intervention focus: at which scale should BE interventions be prioritized, macro or micro? Given that the BE is a multi-scale, complex system, previous work often treats it as a single construct and does not clearly separate macro-scale features (for example, land use, population density, and facility accessibility) from micro-scale features (for example, street greenery, sidewalk quality, and perceived safety). In practice, questions of nonlinearity, spatial scale, and intervention focus are nested. The choice of spatial unit and the selection of macro- or micro-scale attributes jointly shape how nonlinear effects emerge and which attributes matter most in practice. This study, therefore, reformulates them as a joint question: within which spatial units should planners prioritize which macro- and micro-scale built-environment attributes, in order to most effectively support older adults’ travel behavior under potentially nonlinear BE–behavior relationships?
Therefore, this study aims to contribute by addressing these gaps through a systematic multi-scale comparative framework. Using survey data from 2494 older adults in Wuhan and the Extreme Gradient Boosting (XGBoost) machine learning technique, it examines: (1) whether the relationship between the BE and seniors’ AT varies across spatial unit scales; (2) which scale most effectively explains older adults’ AT; and (3) within the optimal unit, how macro- versus micro-scale BE factors compare in relative importance, and what their nonlinear thresholds are.
This paper proceeds as follows: In Section 2, we synthesize prior evidence on the correlation between the BE and older adults’ AT, explicitly discussing the MAUP issue. Section 3 outlines the methodology and data specifications. The findings generated from the modeling process are analyzed in Section 4. The study ends with a concluding section that highlights significant outcomes and outlines potential avenues for further investigation.

2. Literature Review

2.1. BE and Older Adults’ AT

BE is a key external factor influencing older adults’ AT decisions and capabilities. Driven by age-related reductions in physical and cognitive health, older adults demonstrate a unique vulnerability to their residential BE that is not observed in other age groups. Understanding this relationship requires examining BE at multiple scales and recognizing the methodological evolution in how these relationships have been studied.

2.1.1. Macro-Scale BE Factors

The literature has widely adopted the “5D” framework (density, diversity, design, destination accessibility, and distance to public transit) established by Ewing and Cervero [14] as an organizing structure for examining macro-scale BE effects on travel behavior. This framework has been extensively applied to study AT among various population groups, including older adults.
Regarding density, older adults generally show a higher propensity for AT in denser, more mixed-use environments [15]. Higher population density is associated with shorter travel distances and greater accessibility to daily destinations, which can facilitate walking and cycling. However, studies have also found that within certain ranges, further increases in population density significantly suppress active travel among older adults [16].
Destination accessibility has repeatedly been identified as a key driver of older adults’ AT [17,18]. The proximity to key destinations such as shops, healthcare facilities, parks, and social venues reduces travel barriers and provides motivation for active travel. Zhang et al. (2019) found that accessibility to community-based service resources significantly influences walking activity among Chinese older adults, with different facility types showing varying importance [19].
Convenient public transport promotes walking by serving as a “first/last mile” feeder mode [20]. Transit access expands the range of destinations reachable within older adults’ limited mobility budgets, potentially increasing their overall activity participation. However, the relationship between transit access and AT is complex and may vary by spatial scale and individual characteristics.
While the “5D” framework provides a useful organizing structure, studies applying it to older adults often overlook the age-specific modifications needed. For example, older adults typically have shorter acceptable walking distances than younger adults, greater sensitivity to physical barriers, and heightened concerns about traffic safety [5,6,7]. Furthermore, most studies examining macro-scale BE factors have relied on linear modeling approaches that may not capture complex nonlinear relationships and threshold effects [21,22,23].

2.1.2. Micro-Scale BE Factors

Research has increasingly focused on pedestrian-scale street design and quality, which plays a pivotal role in modulating how older adults experience travel and perceive their personal safety [24]. Micro-scale elements are particularly important for older adults because age-related physical and cognitive changes make them more sensitive to street-level environmental conditions.
Street greenery has been consistently associated with higher AT rates among older adults. Previous studies have found that greener residential environments, good access to gardens and shops, and well-maintained footpaths are conducive to more frequent AT among older adults [25,26]. Yang et al. (2019) found a positive association between street greenery and walking behavior among older adults in Hong Kong, suggesting that green environments enhance the walking experience and provide psychological benefits [27].
Recent advances in street-view image analysis have enabled more objective and scalable measurement of micro-scale BE characteristics [11,28]. Street-view image analysis offers several advantages for large-scale studies [29]: it captures objective visual conditions rather than subjective perceptions; it enables consistent measurement across extensive geographic areas, and semantic segmentation techniques allow automated extraction of fine-grained streetscape elements.
More importantly, for older adults with mobility, balance, or vision impairments, micro-scale elements such as pavement smoothness, accessible curb ramps, street lighting, and the availability of public seating are often basic preconditions for whether they feel able or willing to travel [24]. Liu et al. (2024) used the hierarchy of active travel needs to examine associations between streetscape environments and older adults’ AT in China, finding that safety-related elements are foundational prerequisites for walking behavior [11].
While street design research has grown substantially, most studies examine these factors in isolation rather than comparing their relative importance against macro-scale factors [11,28]. This creates a practical dilemma for planners: should they prioritize large-scale land-use changes or fine-grained improvements in street quality? Existing research has not provided a clear answer to this question.

2.1.3. Methodological Evolution

In parallel with this substantive evolution, research methods have also changed. Traditional studies relied heavily on models based on linear assumptions (e.g., logit and linear regression) [6,27,30]. These approaches are often constrained by their linear specifications. Specifically, they fail to adequately capture the complex nonlinear patterns and threshold effects identified in the recent literature (e.g., a “saturation point” for the proportion of green space) [21].
Consequently, to address these problems, contemporary scholarship has increasingly turned to nonlinear machine learning models such as Random Forest (RF) and Gradient Boosting Machines (GBMs) [22,23,31,32,33,34]. While these methods improve predictive accuracy and can model complex variable interactions, they frequently function as “black boxes,” offering limited interpretability for planning practice [22,23]. Previous applications of RF and GBMs within our research group [22,28] and others [23] have demonstrated the existence of nonlinear BE-AT relationships. For example, Guo et al. (2023) used Random Forest to examine nonlinear BE effects on short-distance AT, but focused specifically on trips under 2 km [22]. Wu et al. (2021) employed GBDT to examine nonlinear BE-walking relationships in Zhongshan, China, and used an 800 m buffer [23]. However, these studies primarily focused on predictive performance for general populations or specific transport modes without systematically quantifying the relative importance (RI) between macro- and micro-scale factors specifically for older adults, nor did they extract actionable, interpretable guidance for prioritizing interventions across spatial scales.
Despite these substantive and methodological advances, an important gap remains. Planners face a practical dilemma: should they prioritize large-scale land-use changes (macro-scale BE) or fine-grained improvements in street quality (micro-scale BE) [28]? Existing research on older adults, whether constrained by linear assumptions (which limit the treatment of interactions) or focused mainly on the predictive accuracy of newer ML models that often function as “black boxes,” has not provided a clear answer. There is therefore an urgent need to use interpretable nonlinear models to systematically quantify the RI between macro- and micro-scale BE factors while explicitly addressing the methodological limitations of previous measurement approaches.

2.2. The MAUP in BE Study

Parallel to the substantive challenges of studying BE is the difficulty of selecting appropriate spatial units. Research on BE behavior association has long been plagued by the MAUP [35]. The MAUP indicates that the results of spatial analysis (including variable significance, direction of influence, and even model goodness-of-fit) can change significantly as the spatial resolution and boundary configurations of the observational units vary. In health geography, this issue is also more broadly known as the Uncertain Geographic Context Problem (UGCoP), highlighting our uncertainty about the “true” environment to which individuals are exposed.

2.2.1. Approaches to Delineating BE Measurement Units

The existing literature typically employs two main approaches to delineating BE measurement units: first, artificially defined, non-overlapping adjacent units (e.g., TAZs, census tracts); and second, specific distance buffers centered on the respondent’s residence (e.g., 400 m, 800 m). Both methods have methodological limitations when attempting to quantify the travel environment of seniors.
Administrative units (e.g., TAZs, census tracts) are drawn for administrative convenience rather than behavioral relevance. Their boundaries often poorly align with actual activity spaces, and their varying sizes and shapes create comparability problems across samples [36,37]. Distance buffers (Euclidean or network-based) offer more individual-centered measurement but vary in their behavioral validity. Euclidean buffers ignore street network connectivity and physical barriers, potentially overestimating walkable catchment ranges [37].
Scholars have long documented the analytical uncertainty caused by such simplified unit choices through empirical research [36]. For example, by examining six distinct spatial units, Mitra et al. (2012) revealed that the correlation between the BE and travel patterns is highly sensitive to changes in scale and zoning systems [38]. Zhang et al. (2005) noted that correlation coefficients decreased as the zoning scale increased [39]. Clark et al. (2014) also revealed that the same variable exhibited different coefficients and significance levels in different units [40].

2.2.2. MAUP in Nonlinear Models

In recent years, with the introduction of ML methods, scholars have found that the MAUP still persists in nonlinear models and is perhaps even more complex. According to Liu et al. (2023), the choice of buffer radius is a critical determinant that exerts a profound influence on model outputs, specifically altering the estimated weights, rankings, and complex nonlinear relationships within the BE [41]. Laviolette et al. (2022) similarly found that some BE factors were exceptionally sensitive to changes in unit scale [42].
Although the MAUP has received some attention in travel studies of the general population, MAUP research specifically targeting older adults (especially with regard to AT) remains limited [43]. Because older adults have relatively constrained activity ranges, their activity spaces are neither circular buffers nor administrative units, but more likely functional areas composed of key destinations (e.g., markets, parks, and bus stops) and paths that connect them. It is therefore unknown whether spatial units found to be effective for the general population (e.g., 1 km buffer) are applicable to older adults. Against the current policy background in China, which actively promotes a “community-home” elderly care service system based on “5 min, 10 min, 15 min life circles,” empirical research is urgently needed to answer which scale (e.g., 5 min vs. 15 min) and which shape (e.g., circular buffer vs. network-based life circle) of unit is the most behaviorally relevant intervention unit.

2.3. Research Gaps and Study Contributions

Drawing from the preceding literature review, this study addresses two critical research gaps regarding older adults’ AT. First, existing studies have not systematically compared the relative importance of macro-scale factors versus micro-scale street design, leaving planners uncertain about how to prioritize limited intervention resources. Second, prior research often relies on preset spatial units (e.g., 800 m buffers) that lack behavioral relevance, ignoring the unique activity patterns and physical limitations of older adults. To bridge these gaps, this work offers three key contributions. It is the first to apply a nonparametric machine learning approach to test and mitigate the MAUP in older adults’ travel research. Through this method, the study identifies the most behaviorally relevant built environment (BE) intervention scale and jointly quantifies the effects and thresholds of both macro- and micro-scale variables, providing a robust empirical foundation for targeted planning strategies.

3. Methods and Data

3.1. Study Design

This study develops a multi-scale comparative framework to explicitly address the MAUP in BE research and to reveal the nonlinear impacts of macro- (e.g., land use) and micro-scale (e.g., street design) BE characteristics on older adults’ AT. In travel behavior and BE research, approaches to defining statistical units can be divided into two main categories: fixed geographic units and sliding geographic units [36]. Fixed units (e.g., administrative communities) often vary greatly in size and shape, leading to poor comparability of BE exposure measures across samples. Sliding geographic units, by contrast, are flexible spatial units constructed to center on each individual’s specific geographic location (e.g., residential address), with their boundaries defined by distance or travel time and adjusted dynamically to match the study’s spatial scale design, making them far more aligned with individual-level travel behavior analysis. For this reason, this study adopts sliding geographic units, which are more individually relevant, as the analytical basis to examine the operation of the MAUP in the context of older adults’ AT and BE research.
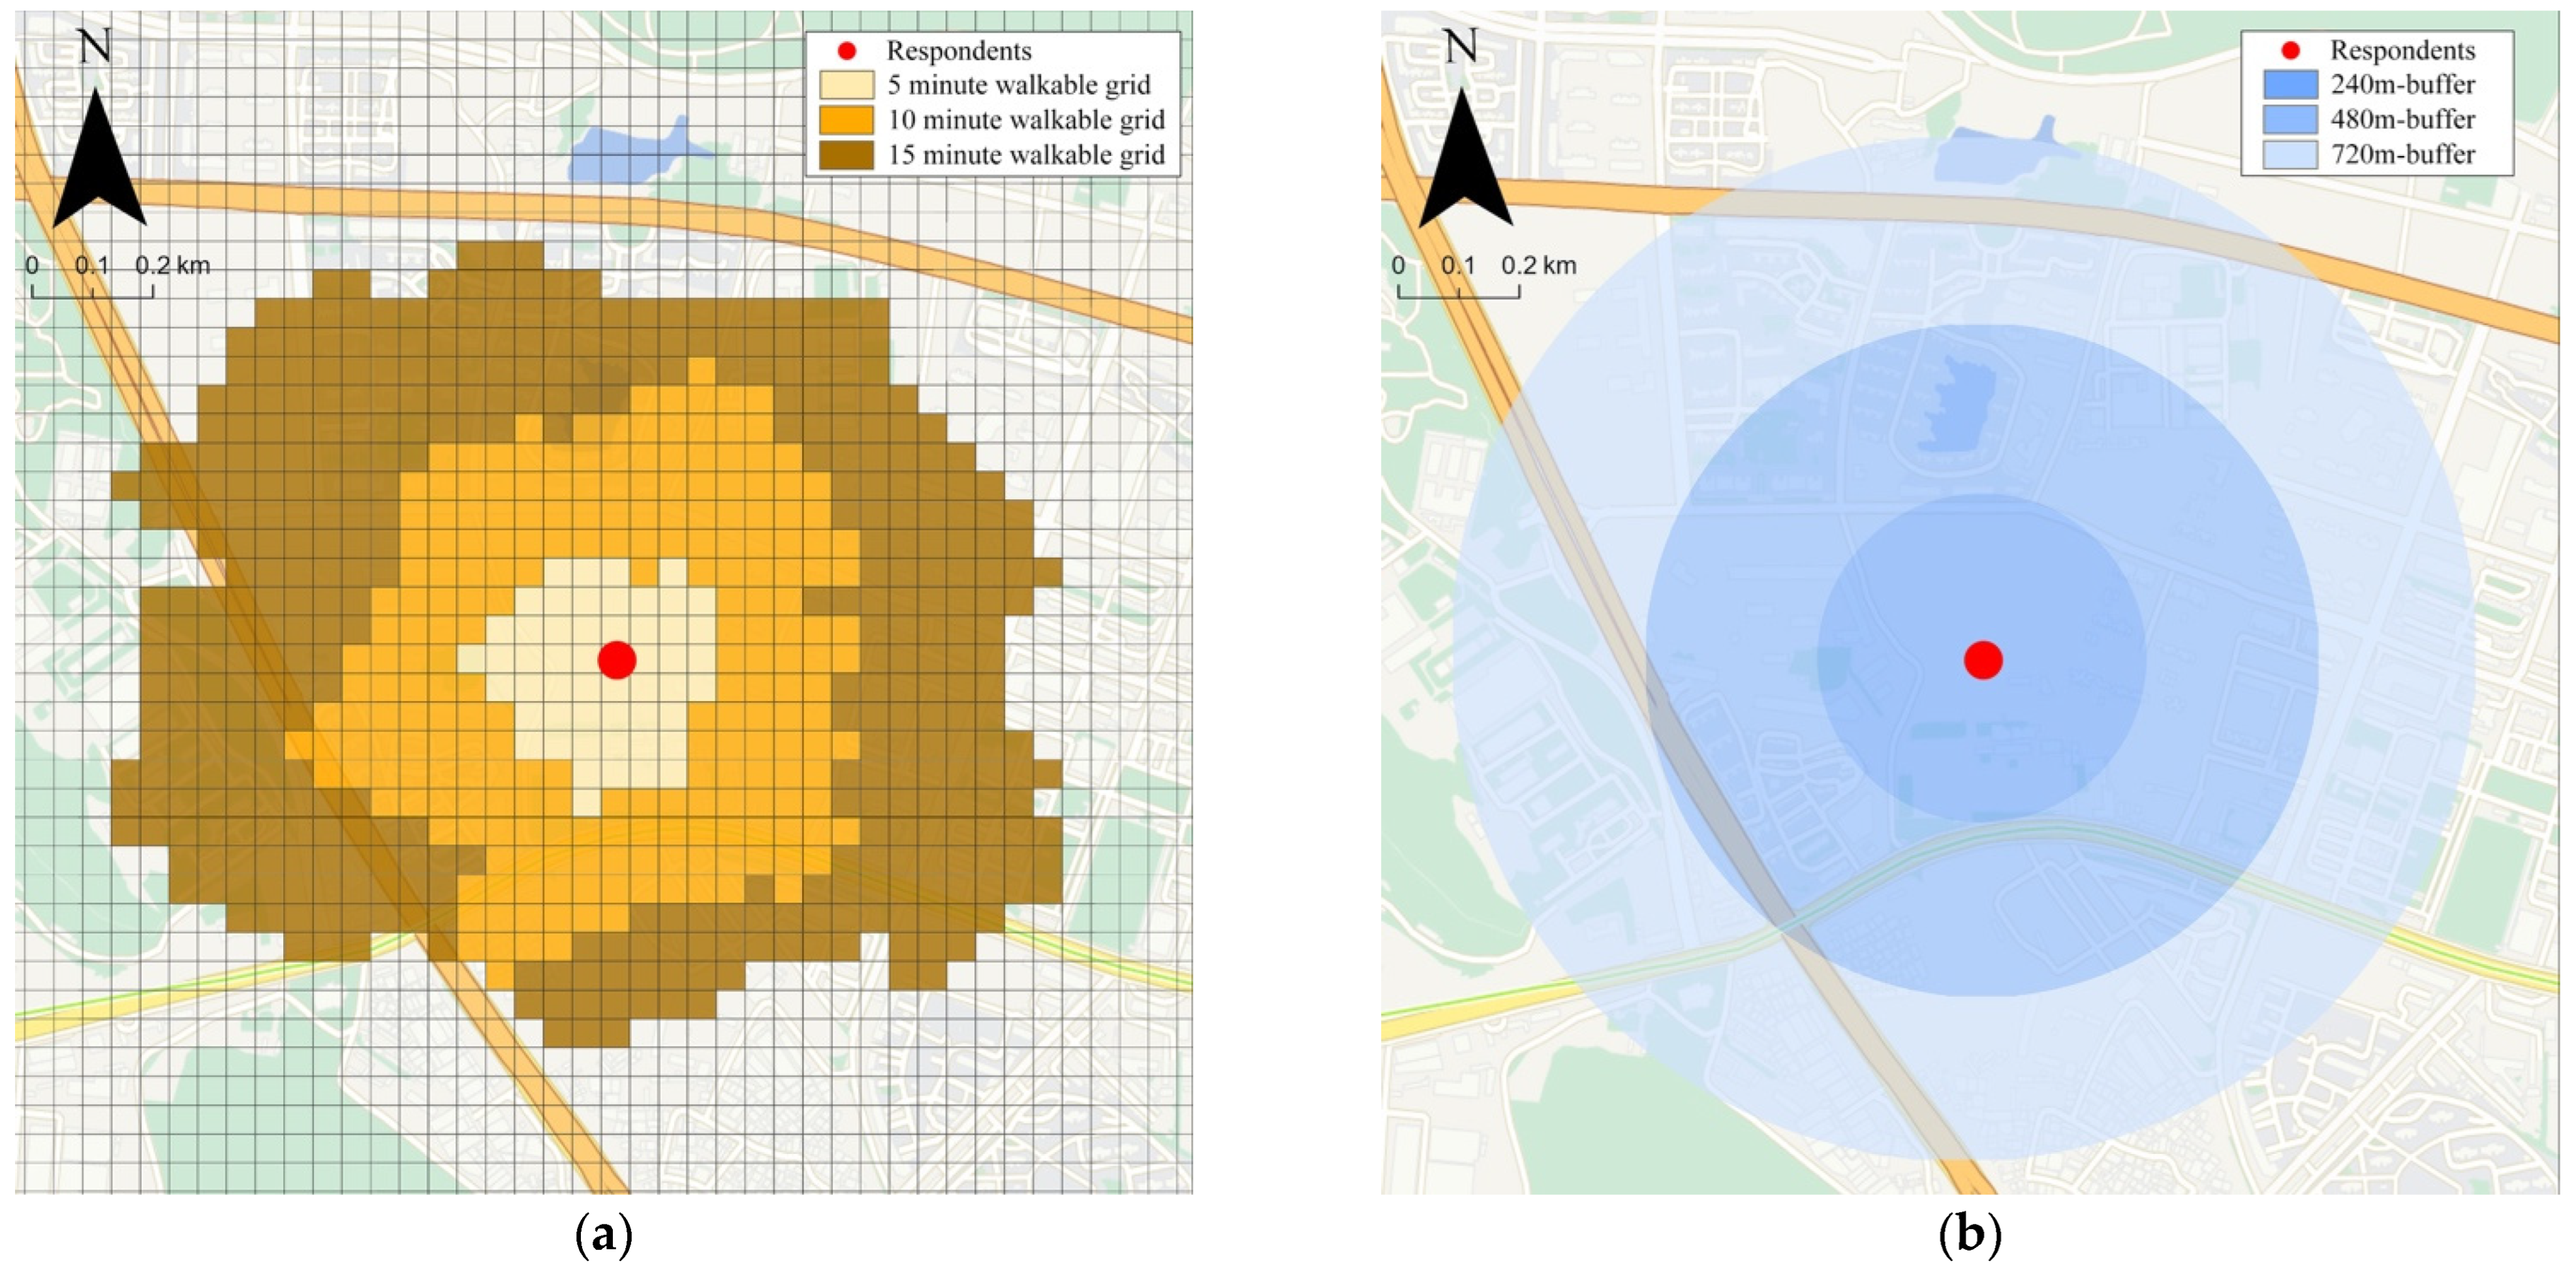
When constructing sliding units for travel behavior analysis, two spatial representation methods have emerged in the existing literature: network-based grid buffers (grounded in actual pedestrian path connectivity) and Euclidean circular buffers (based on straight-line distance assumptions). While Euclidean circular buffers are often considered an approximate representation method—relying on the “universal network assumption,” which is not fully consistent with built environments—and have inherent limitations in reflecting real travel paths, they remain the de facto baseline method extensively employed in empirical BE-AT research due to their computational efficiency and operational ease, particularly in large-scale regional studies. Proposed by Guo et al. (2007), network-based grid buffers are theoretically superior as they align with pedestrians’ actual travel paths [37]. However, empirical evidence validating their explanatory power for older adults specifically—a group with unique physical constraints and travel characteristics—remains scarce, and there is no quantitative comparison of the extent to which this method outperforms the traditional Euclidean approach in capturing the actual BE exposure of elderly pedestrians. This critical research gap constitutes the core rationale for simultaneously adopting both representation methods in this study: rather than using Euclidean buffers as an independent analytical tool, we treat them as a comparative baseline to conduct a rigorous, head-to-head empirical comparison with network-based grid buffers in the context of older adults’ AT research, to verify whether the theoretically superior network-based grid buffers indeed better capture the actual BE exposure of elderly pedestrians. To facilitate this systematic comparison, we constructed two major categories comprising six types of sliding geographic units (Figure 1a,b) with distinct geometries: network-based grid cells and Euclidean circular buffers.
A key premise for constructing these units was to establish a behaviorally meaningful measurement baseline for the older adult sample. This study did not use the common buffer distances of 400 m or 800 m, which are generally applicable to adults, but instead adopted an empirically derived average pedestrian speed of 0.8 m/s, based on local sampling of older adults in Wuhan. This core parameter formed the common basis for constructing all six sliding units.
Based on this, this paper constructed two sets of strictly comparable sliding units. The first set consisted of network-based isochrone buffers, calculating the actual reachable area based on the 0.8 m/s speed threshold, specifically defined as 5, 10, and 15 min walking areas. This set of units also aligns with the policy background of promoting “resident life circles” in China. The second set, for paired comparison, consisted of Euclidean-based isometric buffers, with distance thresholds also derived from the 0.8 m/s walking speed (the speed value was empirically obtained from field measurements of 156 older adults in Wuhan conducted by the research team in 2020; mean observed speed: 0.796 m/s, SD = 0.14): 240 m (equivalent to 5 min: 5 min × 60 s/min × 0.8 m/s), 480 m (10 min), and 720 m (15 min). Furthermore, to construct the network-based buffers, this paper—following existing research in the case city regarding spatial analysis precision—divided the area around respondents’ homes into a 50 m × 50 m grid [44]. It then calculated the actual network travel times by establishing an OD matrix connecting the respondent’s home to every surrounding grid cell, identifying only those grids accessible within the 5, 10, and 15 min thresholds.
After calculating BE variables within each of the six units, this study constructed independent XGBoost models for each. By comparing the overall explanatory power of the models, the most behaviorally relevant optimal intervention unit was identified. Next, using the variable RI output by the model, we ascertained the comparative dominance of macro- versus micro-scale attributes within the BE. Finally, to accurately capture the complex nonlinearity and determine the effective thresholds of environmental impacts, we produced Accumulated Local Effect (ALE) visualizations for each significant variable affecting AT.

3.2. Study Area and Sample Data

The study area for this research was the main urban area of Wuhan (within the 3rd Ring Road), a megacity in Central China. As the capital of Hubei Province, Wuhan is experiencing severe population aging challenges. The “Wuhan 7th National Population Census Bulletin” showed that in 2020, the city’s resident population reached 12.3265 million, comprising 2.1244 million people aged 60 and above, which corresponds to an aging rate of 17.23%. This was a significant increase of 4.55 percentage points from 2010, indicating that the degree of aging is deepening and accelerating. More importantly, analysis based on 2020 economic and census data shows that the density of the older adult population within Wuhan’s 3rd Ring Road (main urban area) is significantly greater in magnitude relative to the districts outside the 3rd Ring Road. This implies that the region serves as the principal locus for the daily routines of seniors and faces greater pressure in alleviating their mobility issues. Therefore, focusing the research scope on this high-density, high-demand core area has the most pressing practical significance for developing effective age-friendly intervention strategies.
For this analysis, we drew upon sample data from the “2020 Wuhan 4th Resident Travel Survey,” a comprehensive regional household travel census executed in late 2020. It must be emphasized that the validity of this survey was not compromised by the COVID-19 pandemic. Thanks to China’s “Dynamic Zero-COVID” policy at the time, there were no local confirmed cases reported in Wuhan during the survey period, nor were any travel restrictions implemented. Therefore, residents’ travel characteristics were fundamentally consistent with the pre-pandemic period, ensuring the authenticity and representativeness of the data. The survey adopted a proportional-to-population-size (PPS) sampling method, targeting a random sample equivalent to 0.5% of the total population within each Jiedao (sub-district administrative units). Data on residents’ socio-demographic characteristics and detailed daily travel logs were collected through structured in-home questionnaire interviews. Specifically, this 0.5% sampling proportion corresponds to a total sample size of 15,000 households across Wuhan, which is fully consistent with the national technical norms for large-scale urban resident travel surveys and the conventional sampling scale for megacities in China. Regarding the core research object of this study (elderly residents), the potential sample size derived from the 15,000 households reaches approximately a sufficient number, which is adequately large to capture the heterogeneity of older adults’ travel behavior (e.g., differences in age, health status, and travel needs). Statistically, the combination of PPS sampling and this sample size ensures that the structure of both the total sample and the elderly sub-sample is highly consistent with the overall population characteristics of each sub-district, effectively guaranteeing statistical representativeness.
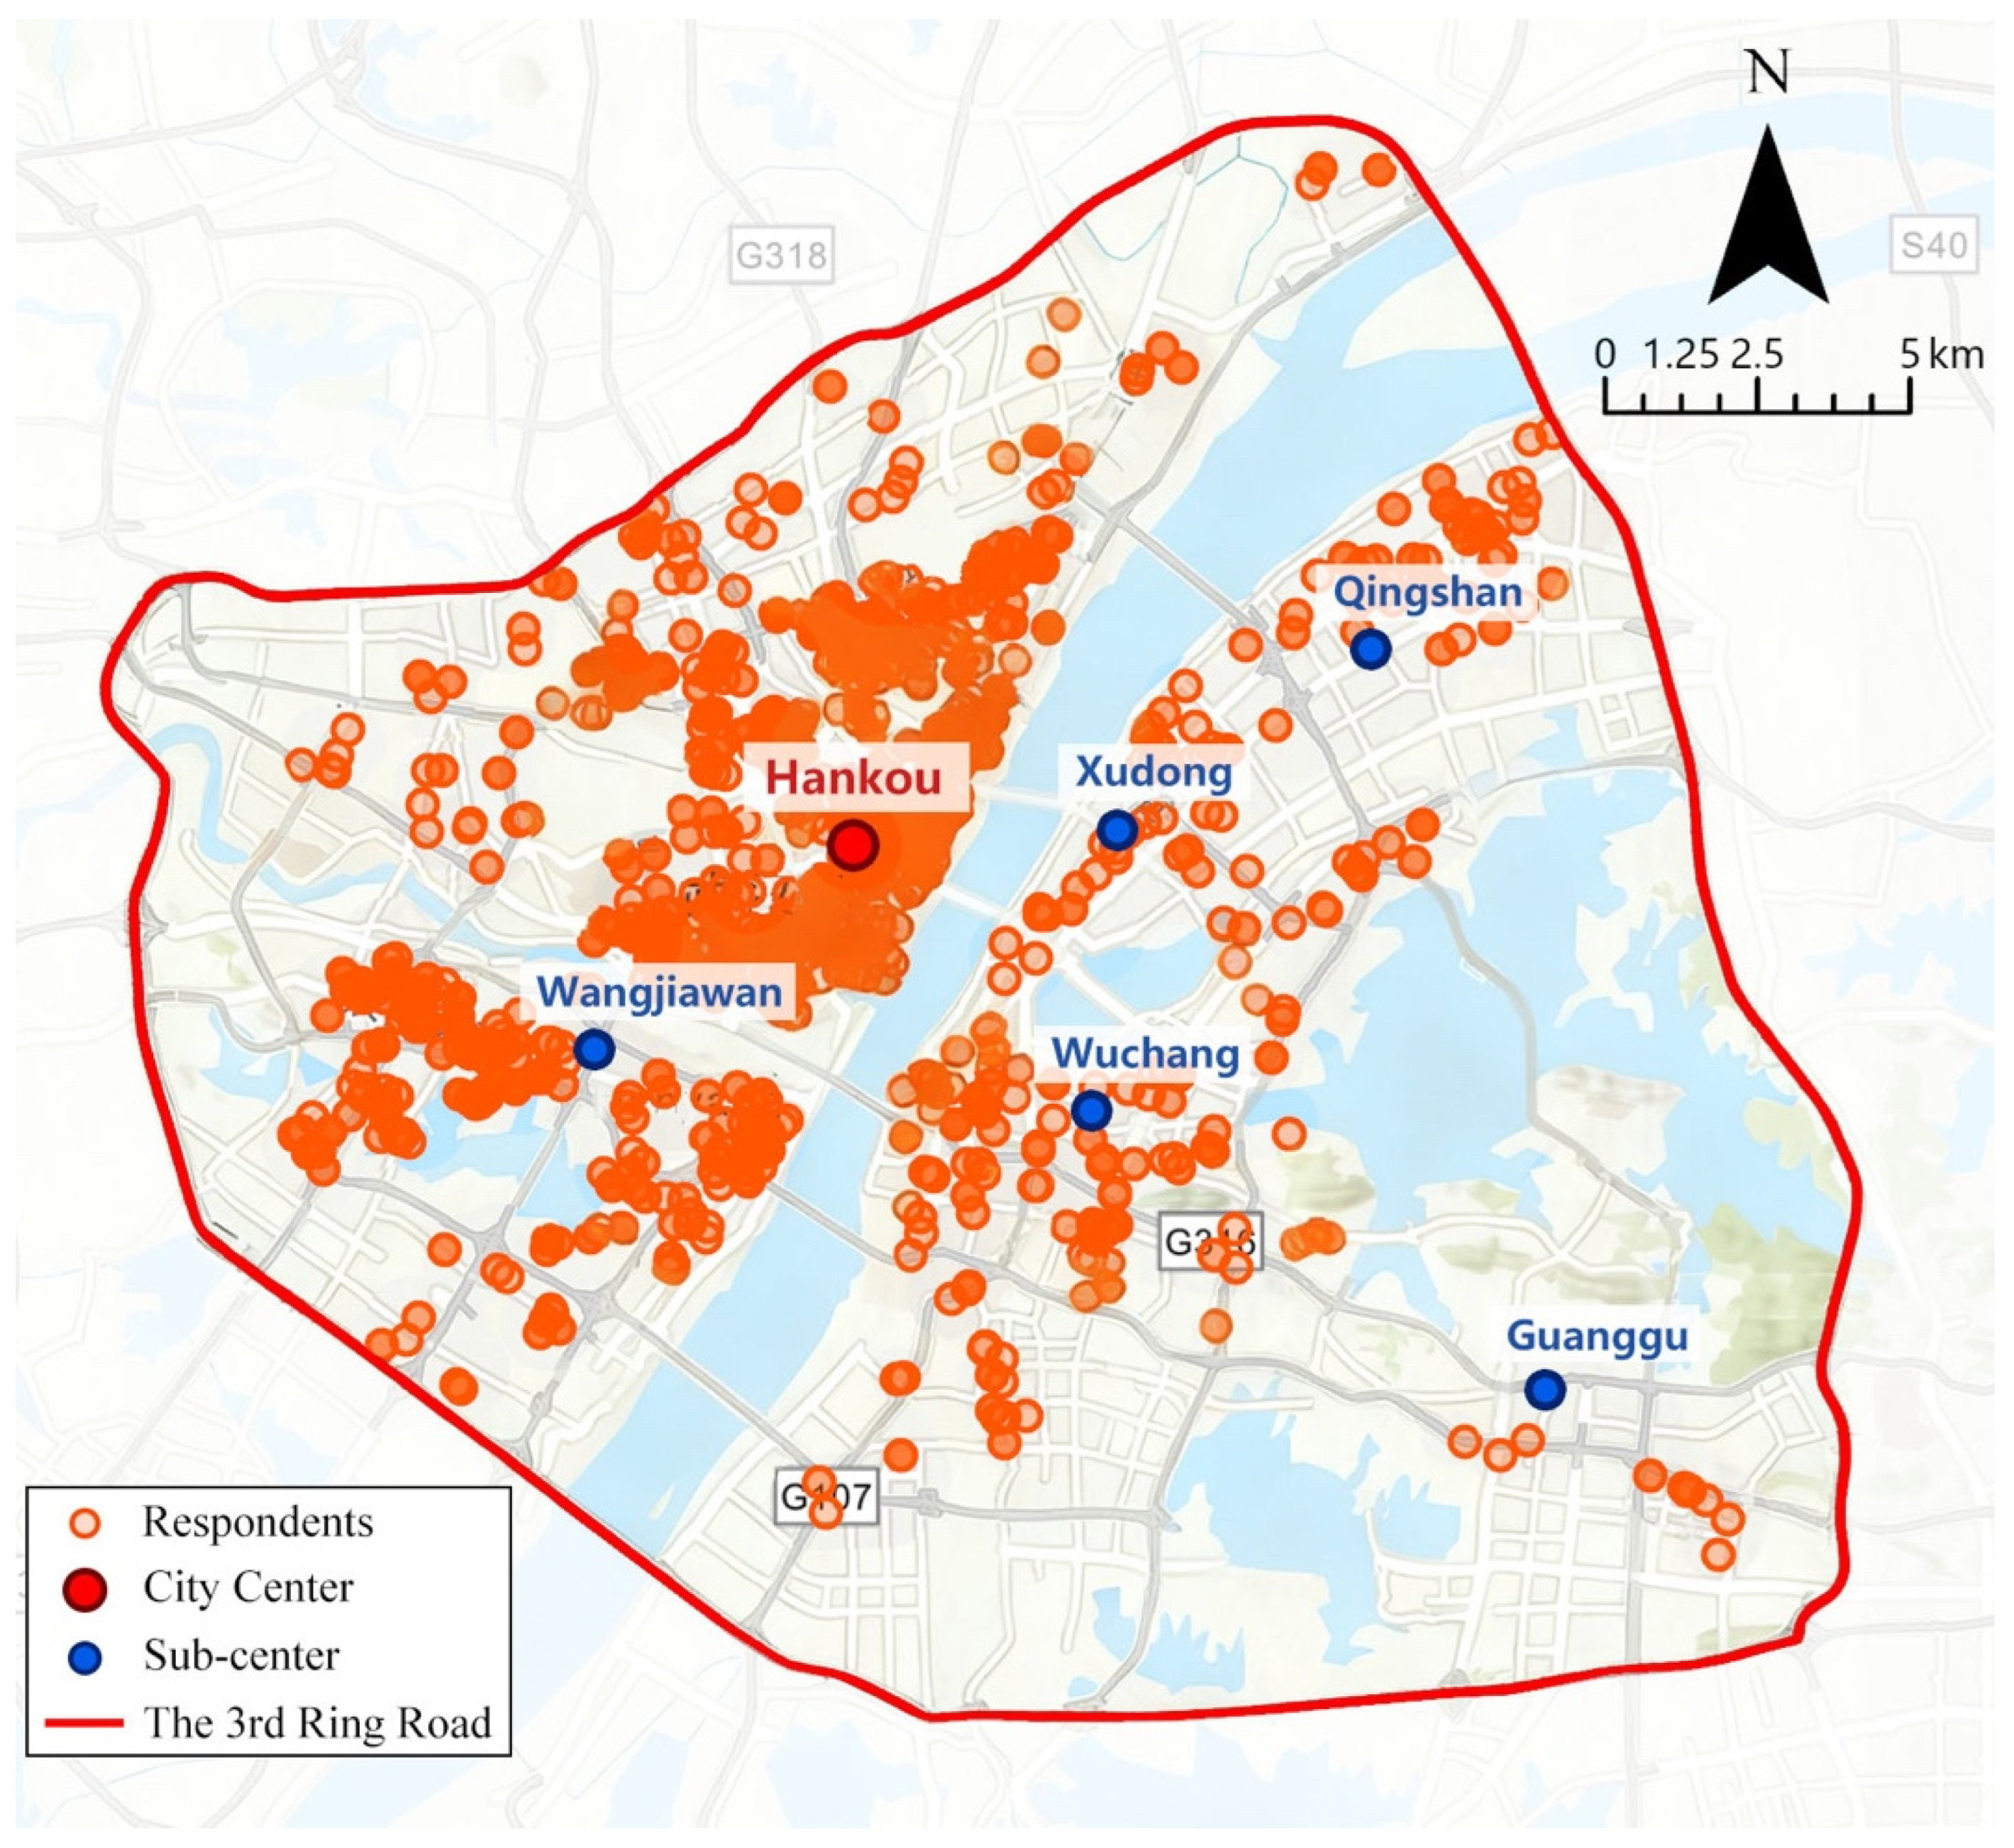
In this study, we defined older adults as individuals aged 60 and above. This cutoff was chosen to align with China’s legal retirement age and official domestic statistical standards, rather than the 65-year threshold often used in international studies, making it more appropriate for capturing the lifestyle shifts and mobility changes associated with retirement in the Chinese context. This study pre-processed the collected sample data. First, individuals aged 60 and above were screened from the total survey sample. Second, based on their residential coordinates, only samples residing within Wuhan’s 3rd Ring Road (the study area) were retained. Finally, samples with incomplete or abnormal key information (such as residence, travel mode) were excluded. After this series of cleaning and screening, this study obtained 2494 valid samples of older adults (Figure 2), of which 1877 samples used AT (walking or cycling) daily, and 617 samples chose other travel modes.

3.3. Key Variables

To ensure data consistency and timeliness, all variable data in this paper were sourced from 2019 to 2020.
The dependent variable for this study was the older adults’ AT choice. This variable indicated whether the respondent chose an AT mode (i.e., walking or cycling). This study processed this variable as a binary classification variable: No = 0; Yes = 1. Walking and cycling were combined into a single AT category, as the study focuses on the fundamental distinction between motorized and human-powered travel, and disaggregating them would introduce unnecessary model complexity. The two modes also share similar street-environment exposures relative to motorized transport. Furthermore, in Wuhan—a context with highly developed bike-sharing—older adults often switch seamlessly between walking and cycling within a single trip, further justifying their aggregated treatment in this analysis.
The independent variables in this study were mainly divided into socio-economic attributes and BE variables. Among them, socio-economic attributes were derived from the aforementioned travel survey, including the respondent’s age, gender, education level, household size, annual household income, and car ownership.
BE variables were divided into macro-scale and micro-scale levels. Macro-scale BE elements are primarily involved in land use, calculated from open-source Wuhan urban geographic information system databases, 2020 population and economic census data, and OpenStreetMap. Specific indicators included: population density (persons/km2), intersection density (intersections/km2), and transit stop density (stops/km2). In addition, land use mix (LUM) was evaluated across nine separate classifications (specifically: residential, commercial, public services, industrial, logistics, transportation, utilities, green space, and other land), summarized according to national standards (GB50137-2011) [45] and using the entropy index method referencing an existing study [22]. The formula is as follows:
L U M = i = 1 k P i ln P i ln k
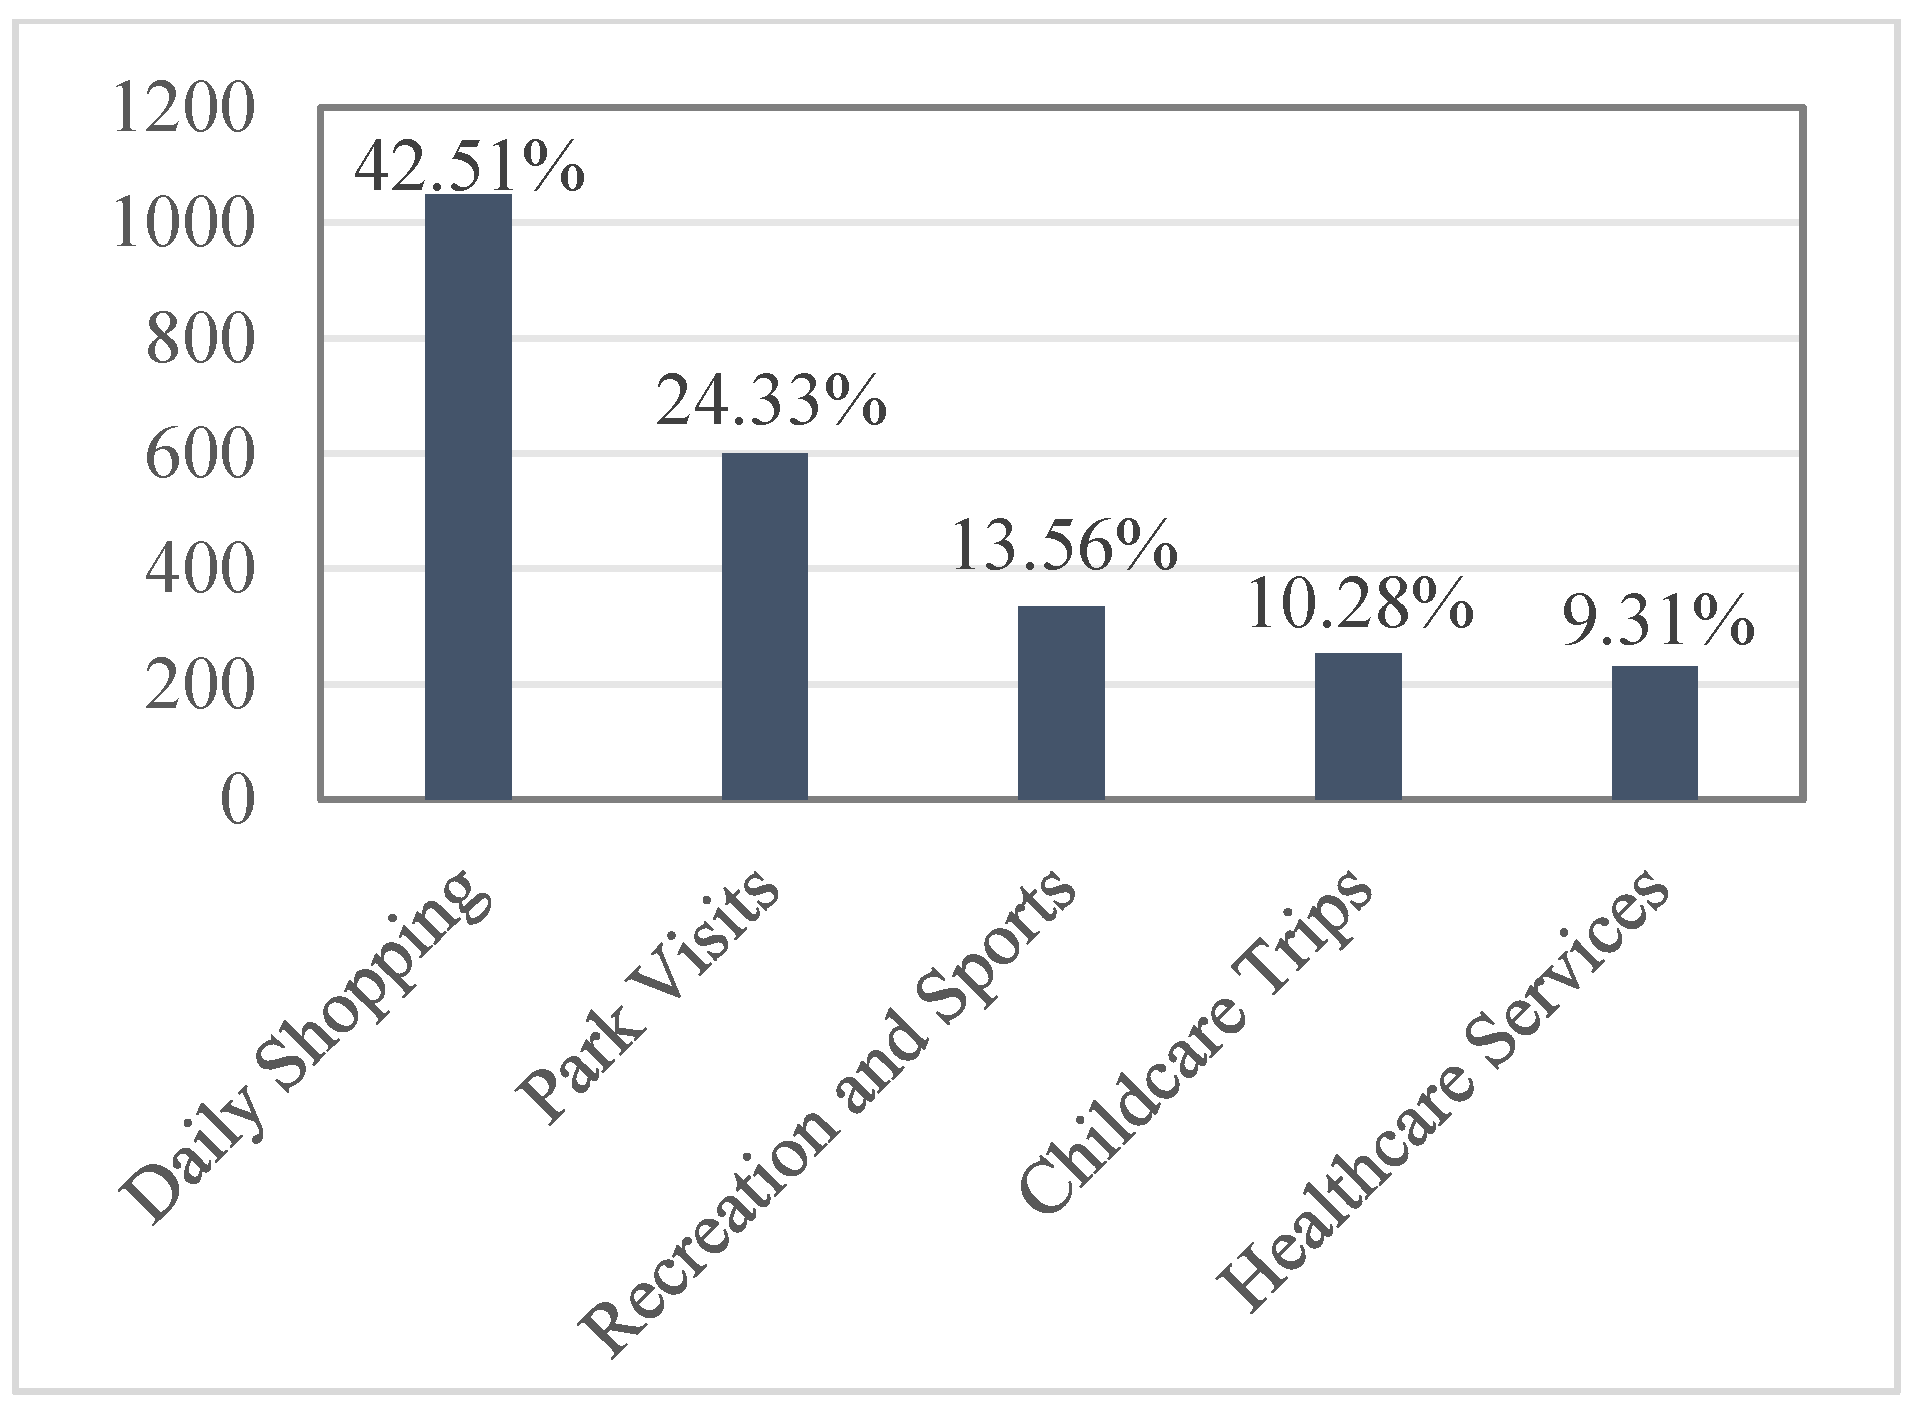
where k is the total number of land use classifications, and P i is the area proportion of land use type i within the statistical unit. LUM ranges from 0 to 1, with higher values indicating greater land use diversity. In terms of destination accessibility indicators, distance to the city center (to Hankou CBD) and distance to the nearest urban sub-center (referencing 5 urban sub-centers defined by the existing study [46]) were included. For service facility density, this study adopted a data-driven approach. First, by analyzing the sample travel logs, this study identified the five most frequently visited destination types by older adults (daily shopping, park visits, recreation and sports, childcare trips, and healthcare services) (Figure 3). Then, the corresponding five categories—commercial facilities, parks/squares, school facilities, cultural/sports facilities, and medical/health facilities—were selected as the research objects for service-facility-related variables. Finally, the total density of these five key facility types (facilities/km2) was calculated as the service facility density indicator. To characterize the spatial distribution patterns of service facilities, the Average Nearest Neighbor (ANN) formula was applied, in accordance with previous studies [19]:
A N N i = D ¯ O i D ¯ E i
where D ¯ O i is the observed mean nearest neighbor distance within unit i , and D ¯ E i is the expected mean distance under a random distribution. An A N N i < 1 indicates a clustered distribution; otherwise, facilities are dispersed.
Micro-scale BE elements related to street design were extracted from Baidu Street View (BSV) images using computer vision and deep learning techniques. The BSV images were from June 2019. It should be noted that there is a temporal misalignment of several months between the street view data and other datasets used in the study. However, most street-level indicators extracted from the imagery, apart from the green view index, exhibit relatively high temporal stability, which mitigates the impact of this discrepancy. Furthermore, historical greenery data can reflect past vegetation conditions as well as potential for future greening, and remains substantially correlated with greenery measures from other temporal points included in the model.
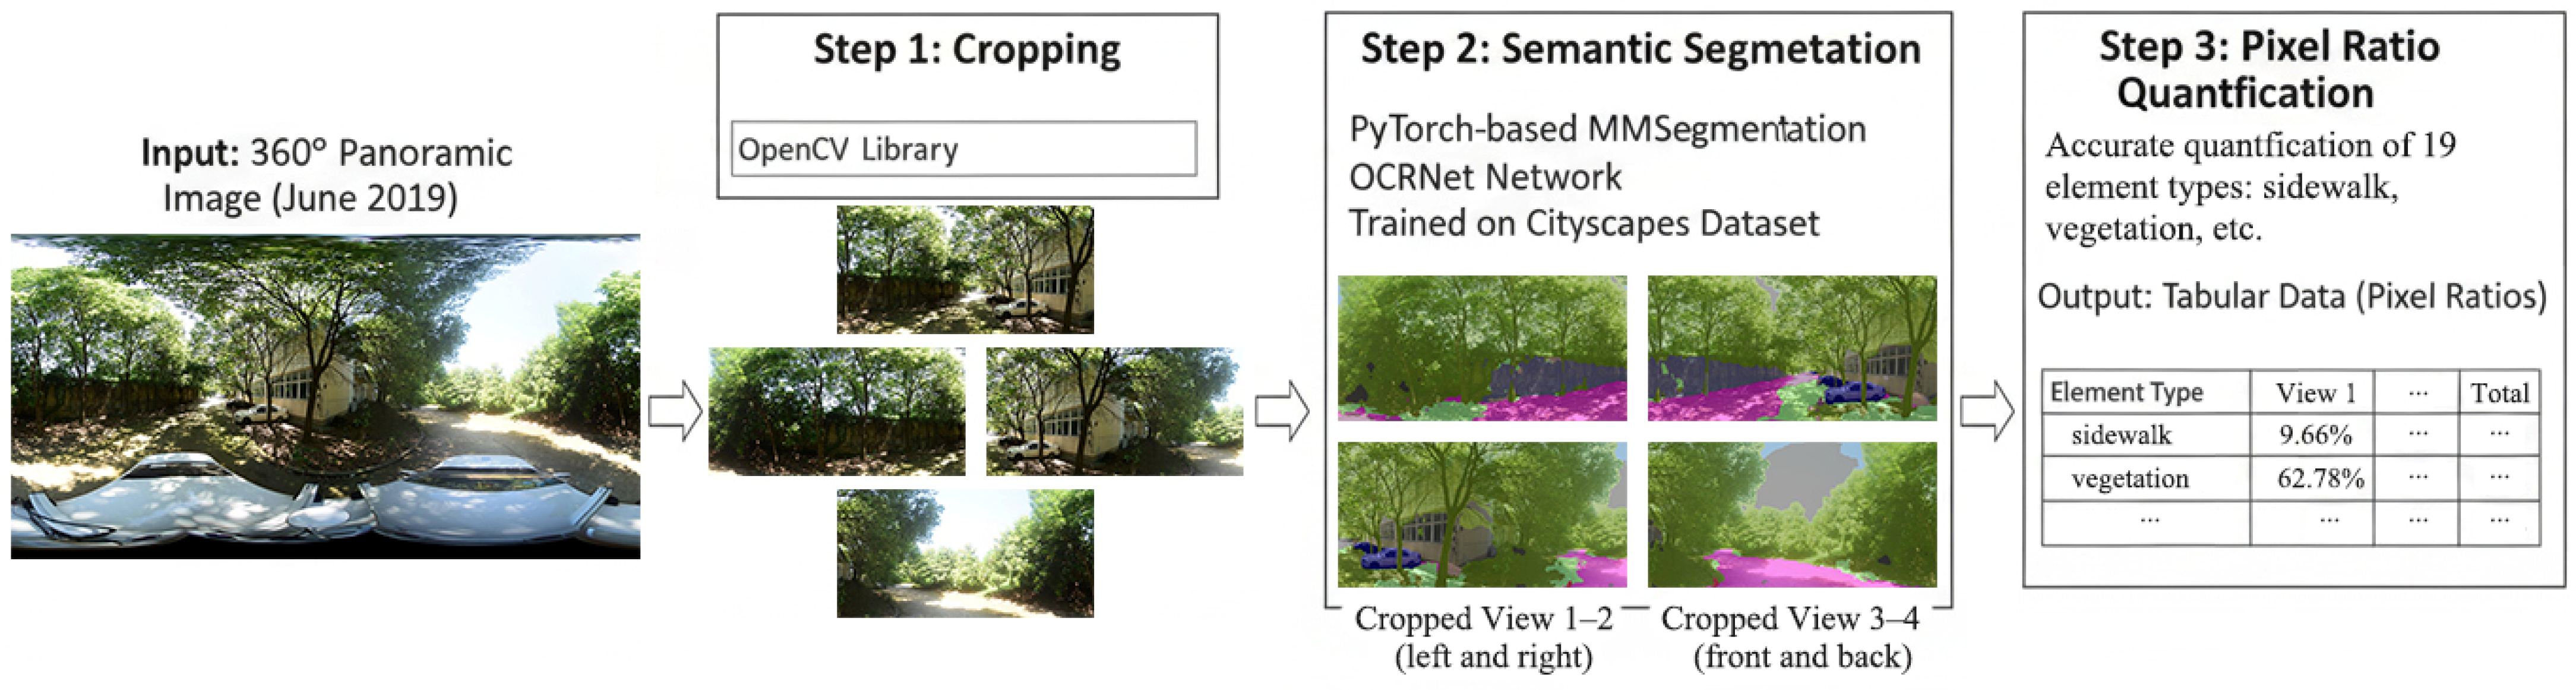
The BSV image processing flow is shown in Figure 4. First, the OpenCV library was used to crop the 360° panoramic images into four directional views. Next, the PyTorch1.13.1-based MMSegmentation model and OCRNet network were trained on the Cityscapes dataset. Third, the trained algorithm was deployed across the street view imagery to precisely calculate the pixel proportions for 19 distinct semantic categories, including “sidewalk” and “vegetation”. Lastly, the pixel information from the four directions of each sampling point was aggregated using the formula:
C s = ( C f + C b + C l + C r ) / ( P f + P b + P l + P r )
where C f , C b , C l , and C r represent pixel counts of the target element in the front, back, left, and right views, and P denotes the total pixels in each view. Subsequently, referencing the methods of Liu et al. (2024) for street walkable space ratio and street obstacle ratio [11], He et al. (2024) for street green view index [28], and Yang et al. (2025) for street enclosure [29], the calculation results from the sampling points were aggregated to the statistical unit level to construct four core micro-scale BE element indicators (Table 1).
Detailed definitions of all variables and their descriptive statistics in different spatial units (network-based buffers vs. circular buffers) are provided in Table 2 and Table 3.

3.4. Modeling Method

This study aimed to elucidate the intricate nonlinear dynamics between the BE and older adults’ AT, for which traditional linear models have limitations. Therefore, this study employed the tree-based ensemble machine learning algorithm XGBoost [47]. Recognized for its computational efficiency and speed, the XGBoost library functions as an optimized evolution of the traditional Gradient Boosting Decision Tree (GBDT) technique [48]. Although GBDT has become a common technique in travel behavior research due to its strong predictive power, it still suffers from limitations such as low computational parallelism and a tendency to overfit [21,49]. XGBoost introduces an architecture that supports efficient parallel computation and integrates regularization terms into the objective function, thus performing better in terms of both computational speed and model generalization.
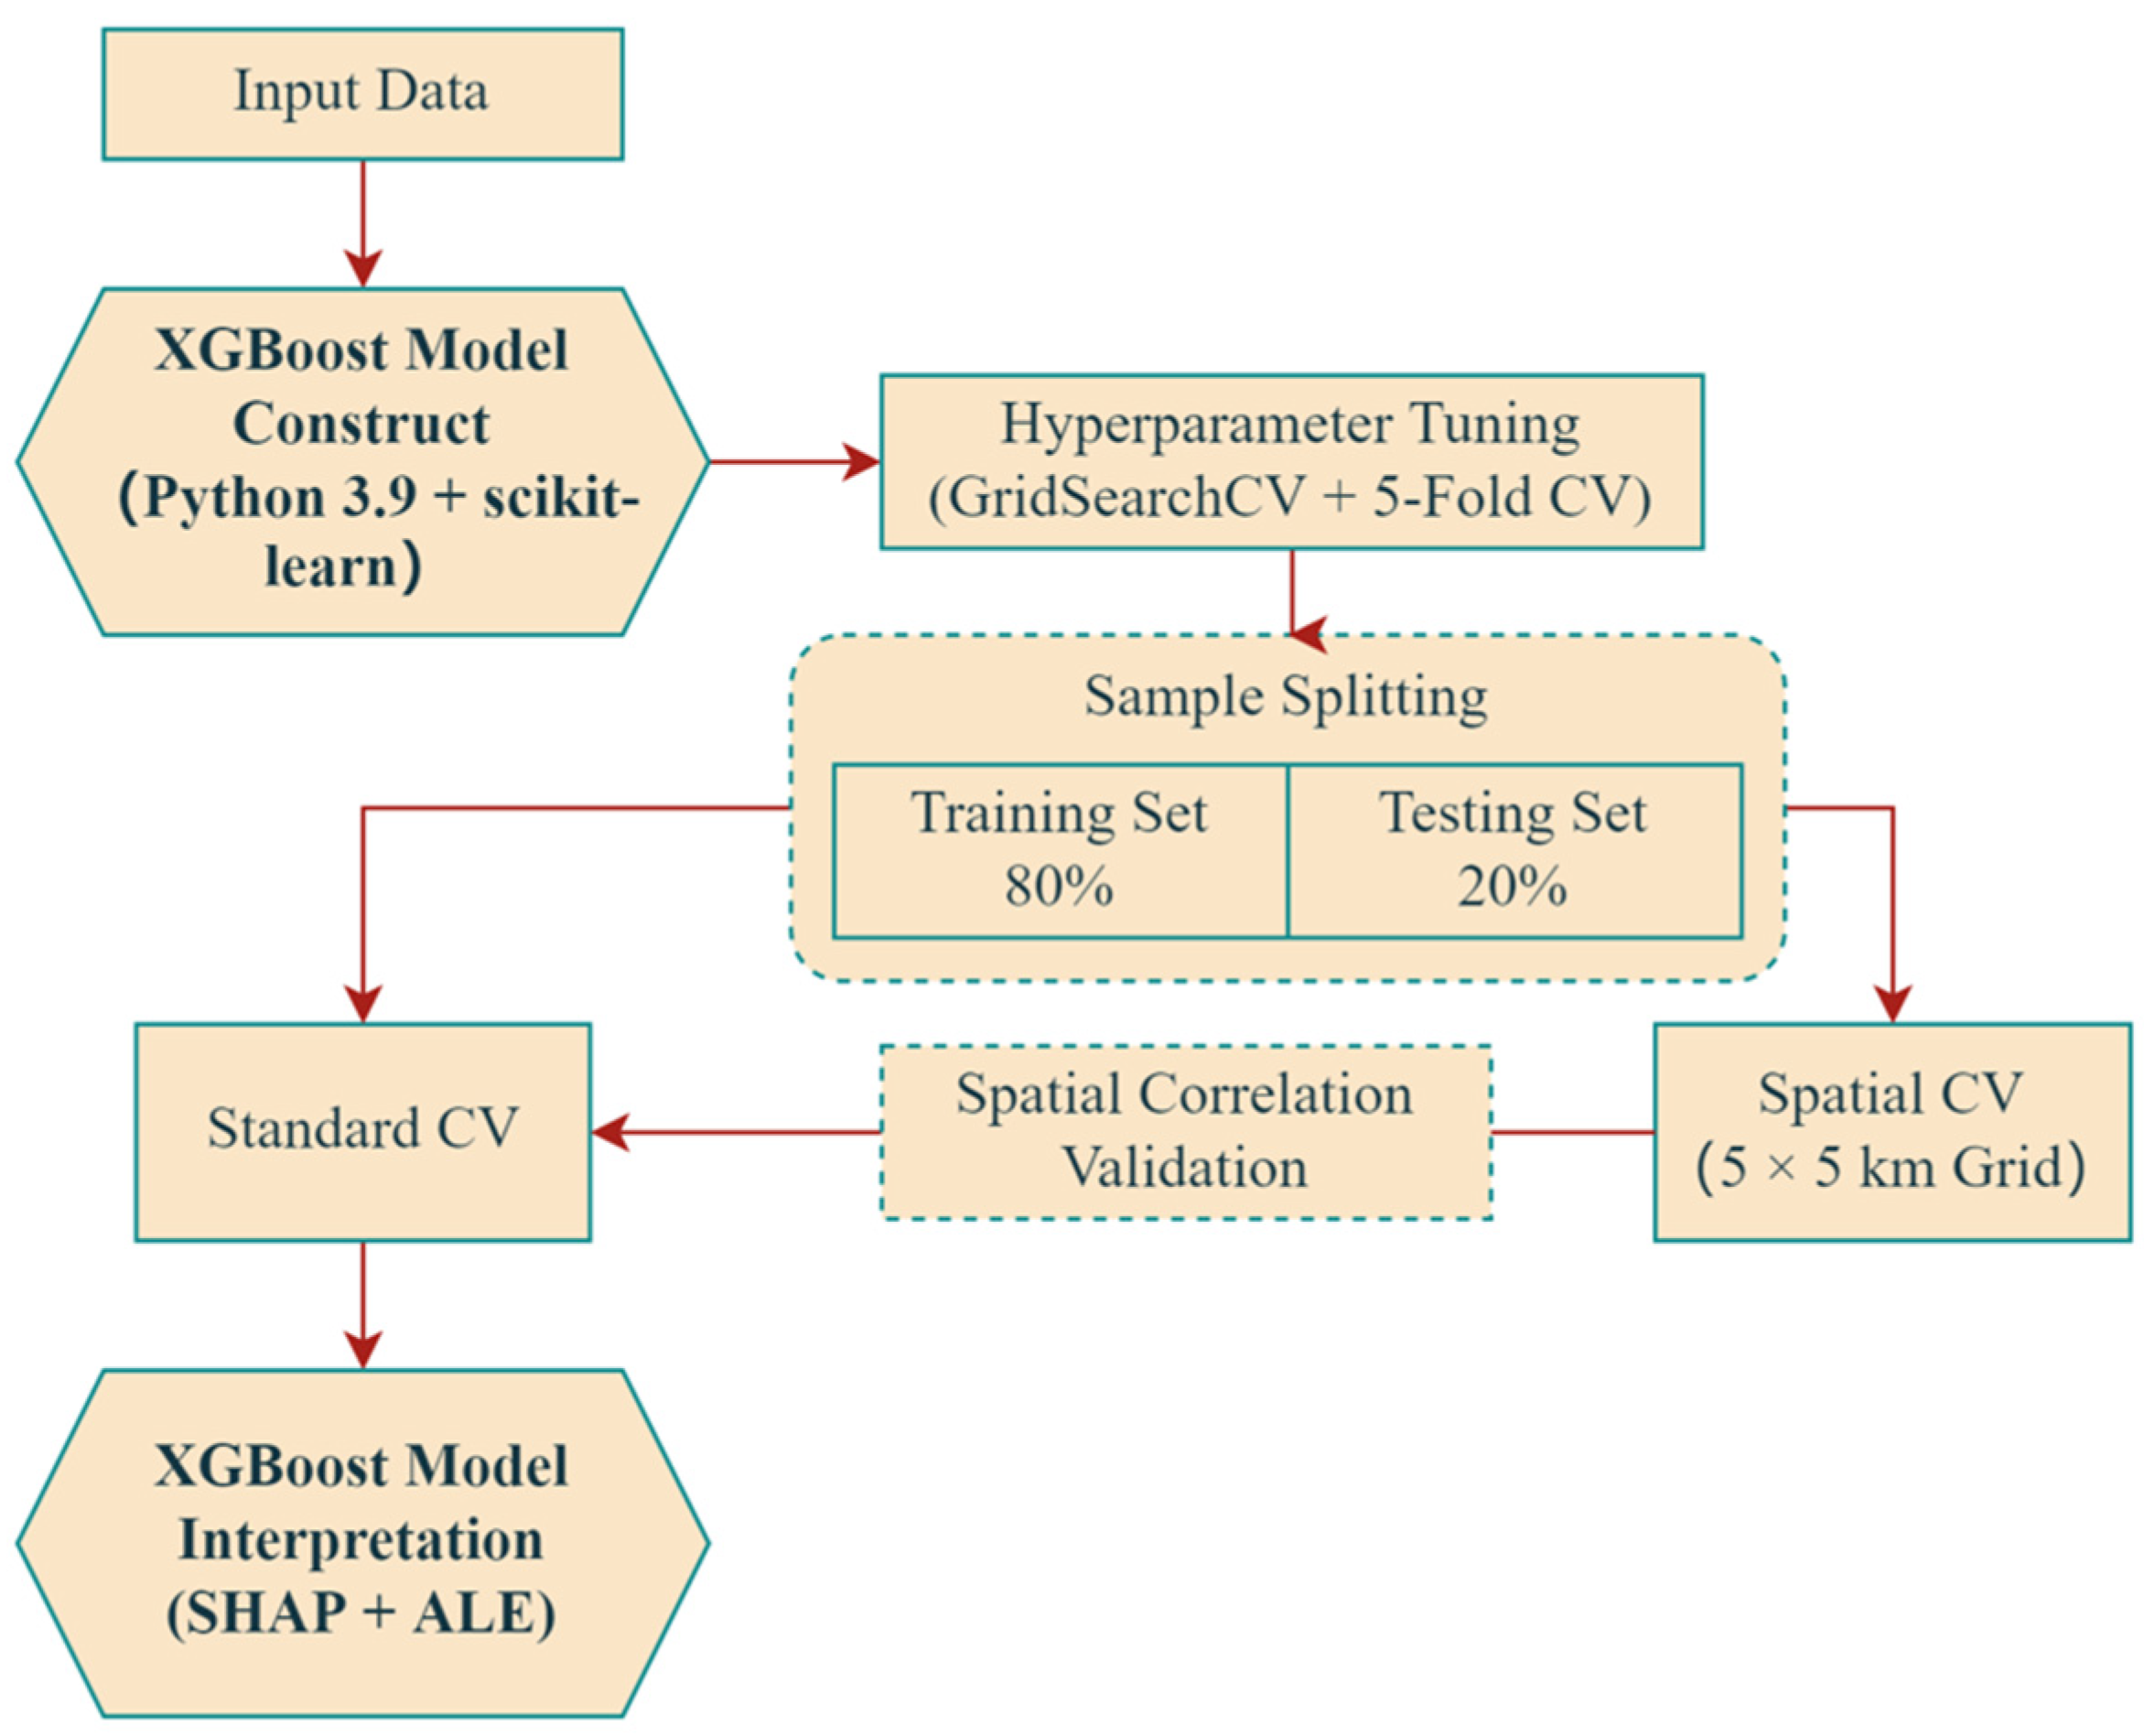
As shown in Figure 5, this study was based on the Python 3.9 environment, utilizing the scikit-learn toolkit to construct independent XGBoost binary classification models for each of the six spatial units defined in Section 3.1. For each model, we used random sampling to divide the dataset, where 80% of the samples were utilized to train the model, and 20% were held out specifically for performance testing. A fixed learning rate of 0.001 was applied to enhance generalization. Concurrently, key model parameters—specifically max_depth, n_estimators, and reg_alpha—were finely tuned via GridSearchCV and 5-fold cross-validation. To quantify the model’s classification performance, the Area Under the Curve (AUC) served as the primary metric for distinguishing AT behaviors.
To mitigate potential overestimation of model performance caused by spatial autocorrelation—a prevalent issue in geographic data analysis—spatial cross-validation (CV) was implemented. The study area was partitioned into non-overlapping 5 × 5 km grid cells to ensure strict geographic separation between training and testing samples, thereby eliminating information leakage from spatially adjacent observations. Additionally, to evaluate whether the models adequately captured the spatial patterns of older adults’ AT behavior, Moran’s I statistics were computed for the residuals of each XGBoost model, with statistical significance assessed via z-scores and p-values.
Although the XGBoost model performs excellently in predictive accuracy, its “black box” nature limits its direct application in planning decisions. Traditional interpretability tools, such as Partial Dependence Plots (PDPs) [50], assume that all feature variables are independent of each other. This assumption is almost always false in BE research (e.g., population density and LUM), leading to biased estimates of variable effects. To address this, this study adopted a more robust alternative: ALE plots. ALE was specifically designed to address the shortcomings of PDPs when dealing with correlated variables. It calculates the average change in predictions within small intervals (bins) of a feature, rather than averaging over unlikely feature combinations as a PDP does. This strategy allows it to effectively decouple the interference of other correlated features when estimating the marginal effect of a single feature. Therefore, the ALE method is not only naturally robust to variable correlation but also directly generates smooth, unbiased, and easily interpretable nonlinear trend curves, clearly revealing the specific marginal contribution of every BE factor to the final probability.

4. Results and Discussion

4.1. Comparison of Modeling Results

As shown in Table 4, all models achieved acceptable predictive accuracy, with AUC values ranging from 0.69 (240 m circular buffer) to 0.81 (15 min network buffer) under random train-test splitting; under spatial cross-validation (based on 5 × 5 km grid partition), mean AUC values decreased slightly by 0.01–0.06, while the relative performance ranking of spatial units remained consistent. Additionally, Moran’s I statistics indicated no significant spatial autocorrelation in residuals of network-based buffers (especially 10- and 15 min units, p > 0.05) and only mild residual spatial clustering in circular buffers, confirming the constructed models had no obvious spatial flaws and that subsequent MAUP analysis is robust. Notably, the 0.12 gap between the lowest and highest AUC values (0.69–0.81) rules out simple statistical fluctuation, further confirming a significant MAUP exists in the study of older adults’ BE and AT behavior.
Specifically, in the comparison of morphology, buffers based on the real street network systematically outperformed traditional circular buffers at all scales. The performance of the 5 min, 10 min, and 15 min network buffers (AUC = 0.74, 0.79, 0.81) was uniformly higher than their corresponding 240 m, 480 m, and 720 m circular buffers (AUC = 0.69, 0.75, 0.77). This finding is not surprising, as Euclidean-based circular buffers severely overestimate the actual reachable range of older adults by ignoring real street connectivity and physical barriers (e.g., buildings, walls). Conversely, network-based buffers, being based on actual paths, more closely approximate the path-dependent activity space of older adults, thus capturing the actual exposure to the BE more accurately. This result challenges studies that widely use Euclidean-based circular buffers as the primary unit for measuring BE.
Meanwhile, in the comparison of size, model performance improved as the spatial scale expanded, ultimately peaking at the “15 min network buffer.” Both network-based buffers (AUC increasing from 0.74 to 0.81) and circular buffers (AUC increasing from 0.69 to 0.77) showed a trend of improving performance with increasing scale. This trend suggests that for older adults, a very small area (e.g., 5 min or 240 m) covering only the immediate residential vicinity may be insufficient to capture the key BE elements driving their AT decisions. In contrast, a 15 min walking circle encompasses a richer set of “destination” facilities (such as large parks, supermarkets, community centers, or transit hubs). When older adults decide whether to undertake a “complete” active trip, it is BE within this 15 min range (rather than just their doorstep) that plays the dominant role. This study also found that the performance improvement diminishes as the spatial scale continues to expand. The AUC improvement from 10 min (480 m) to 15 min (720 m) was 0.02 (0.02), which is significantly lower than the 0.05 (0.06) improvement from 5 min (240 m) to 10 min (480 m). This indicates that as the spatial scale expands further, the model’s performance improvement is limited. BE issue for older adults’ AT is a medium-scale problem, around 10 to 15 min.
The above findings confirmed that, compared to Euclidean distance, the walking network range is more behaviorally relevant to the daily activities of older adults, with the 15 min network buffer being the optimal spatial unit scale. This result provides key evidence for the “15 min community life circle” policy currently being promoted in China. Based on this, all subsequent in-depth analyses in this study will be based on the walking network range.

4.2. The RI of Predictors

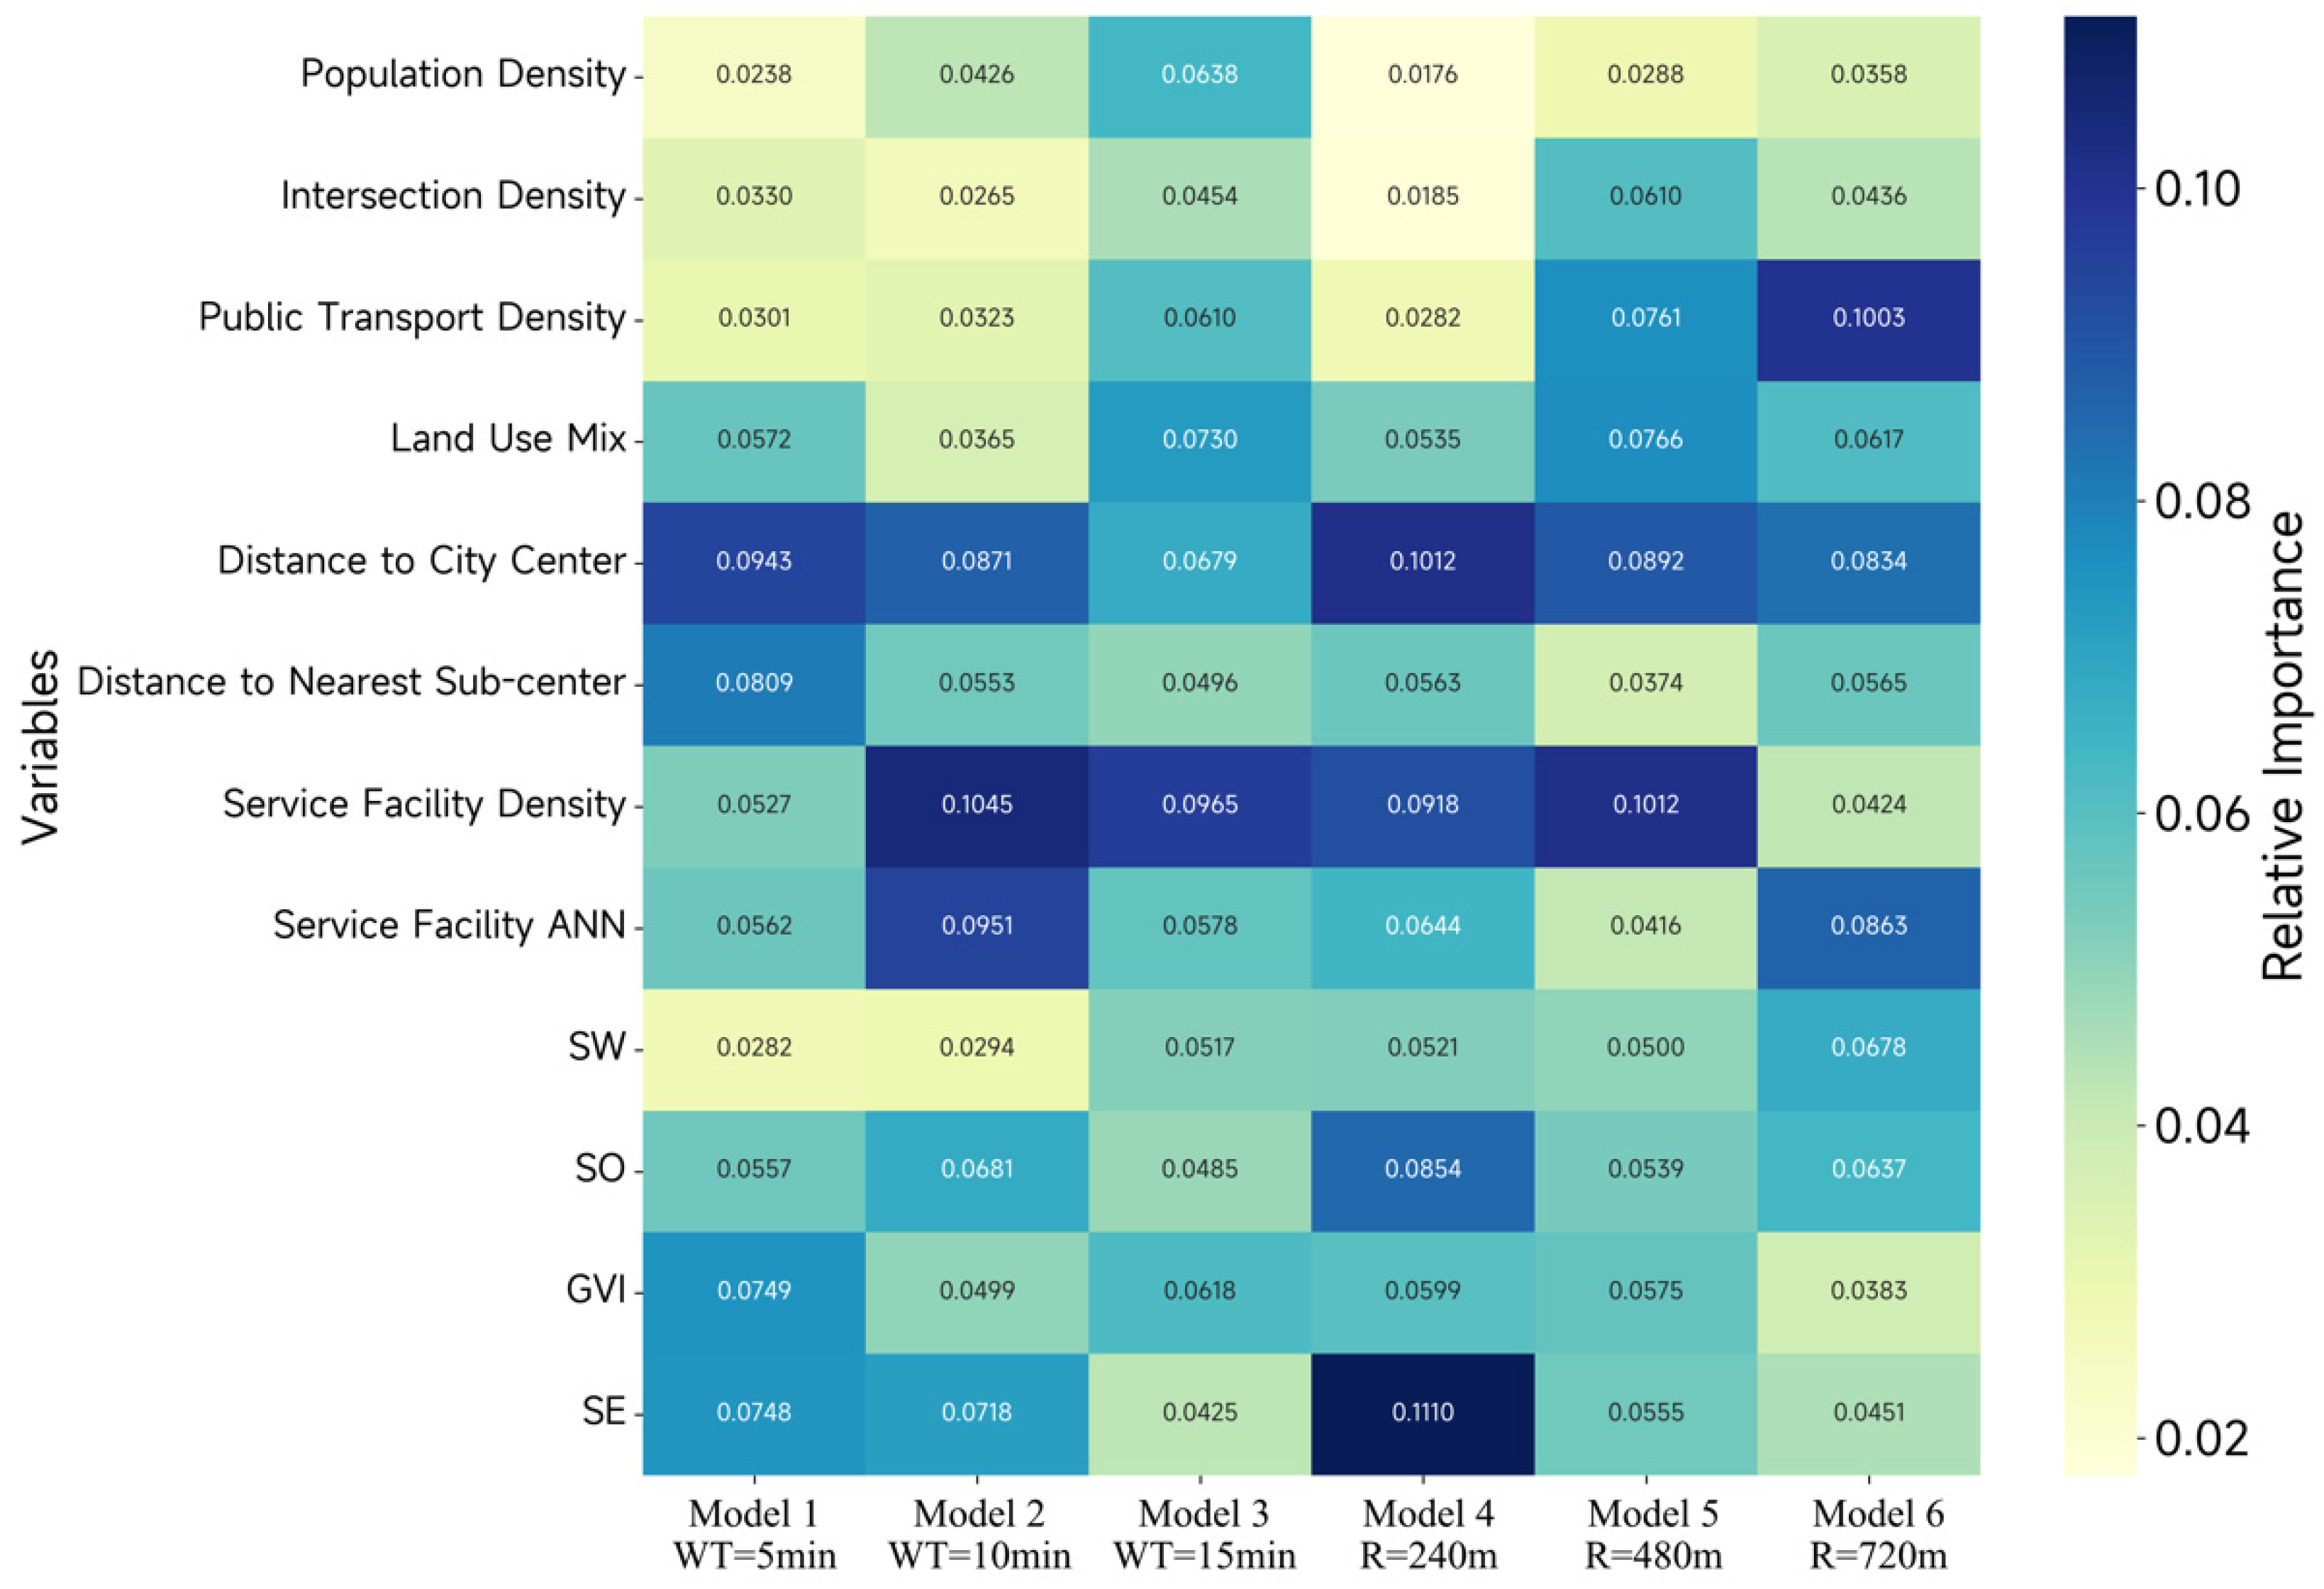
Table 5 shows the global RI of socio-economic attributes, macro-scale BE, and micro-scale BE in all six models. We also summarized the relative impacts of socio-economic and BE variables to compare their total contributions. The sum of the RI of all independent variables is 100%. First, the study found that BE dominated in all models. Furthermore, the RI of macro-scale BE was consistently higher than that of micro-scale BE. This suggests that for a high-density, aging city like Wuhan, systematically optimizing the macro-level layout of key living service facilities within a 15 min walking network may be the most efficient intervention strategy for increasing older adults’ AT, compared to micro-scale street improvements. Additionally, looking at the different models, the influence of the BE showed a significant “morphology effect,” where the importance of the BE in network-based units (Models 1–3) was markedly lower than in Euclidean-based units (e.g., Model 1 vs. Model 4: 66.18% vs. 74.01%; Model 2 vs. Model 5: 69.91% vs. 72.83%; and Model 3 vs. Model 6: 71.95% vs. 72.49%).
Second, this study also reflected a “size effect,” meaning the importance of BE features changed smoothly as the unit size increased. It is noteworthy that this change manifested as opposite results in the network-based models versus the Euclidean-based models (e.g., Model 1 vs. Model 2 vs. Model 3: 66.18% vs. 69.91% vs. 71.95%; Model 4 vs. Model 5 vs. Model 6: 74.01% vs. 72.83% vs. 72.49%). These results reflect that Euclidean-based buffer units, by including BE that older adults cannot reach, may cause effects such as exaggerating the overall role of the BE and leading to contradictory conclusions that the BE’s influence weakens as the unit is expanded.
Macro- and micro-scale BE showed significant differences in their sensitivity to changes in spatial unit size (Figure 6). As the spatial scale expanded from 5 min (240 m) to 15 min (720 m), the importance of macro-scale BE steadily rose (e.g., Model 1 vs. Model 2 vs. Model 3: 42.82% vs. 47.99% vs. 51.50%; Model 4 vs. Model 6: 43.15% vs. 51%), while the importance of micro-scale BE simultaneously declined (e.g., Model 1 vs. Model 2 vs. Model 3: 23.36% vs. 21.92% vs. 20.45%; Model 4 vs. Model 5 vs. Model 6: 30.84% vs. 21.69% vs. 21.49%). This inverse trend indicates that in small-scale units, older adults’ travel is more influenced by immediate street quality and other micro-scale BE factors. However, as the unit size increases, the decisive factors driving their AT shift to macro-scale BE factors related to travel destinations.
The sensitivity of specific variables to spatial unit size also varied. The contributions of variables like population density (2.38–4.26–6.38%), transit stop density (3.01–3.23–6.10%), and SW (2.82–2.94–5.17%) increased with unit scale. Conversely, the contributions of variables like distance to CBD (9.43–8.71–6.79%), distance to sub-center (8.09–5.53–4.96%), and SE (7.48–7.18–4.25%) showed the opposite trend. This phenomenon was more profoundly reflected in the ranking of individual variables. Service facility density ranked second in both the 15 min and 10 min models, making it the strongest predictor among BE factors. However, when the spatial scale was reduced to the 5 min network buffer, its ranking plummeted to 11th. This phenomenon underscores the necessity of addressing the MAUP: if planners had chosen the 5 min buffer, they would have reached the contradictory conclusion that “service facility density is not important.”

4.3. Nonlinear Associations of Predictors with Older Adults’ AT

The specific associations connecting BE to older adults’ AT were mapped out for different spatial scales by generating ALE visualizations for each factor. As the network-based models had better explanatory power, this study only displays the results for Models 1–3. Notably, this study adopted variable Y-axis scales instead of a fixed range. This approach was chosen to ensure that the magnitude of BE impacts at each specific spatial unit size is captured with maximum clarity.
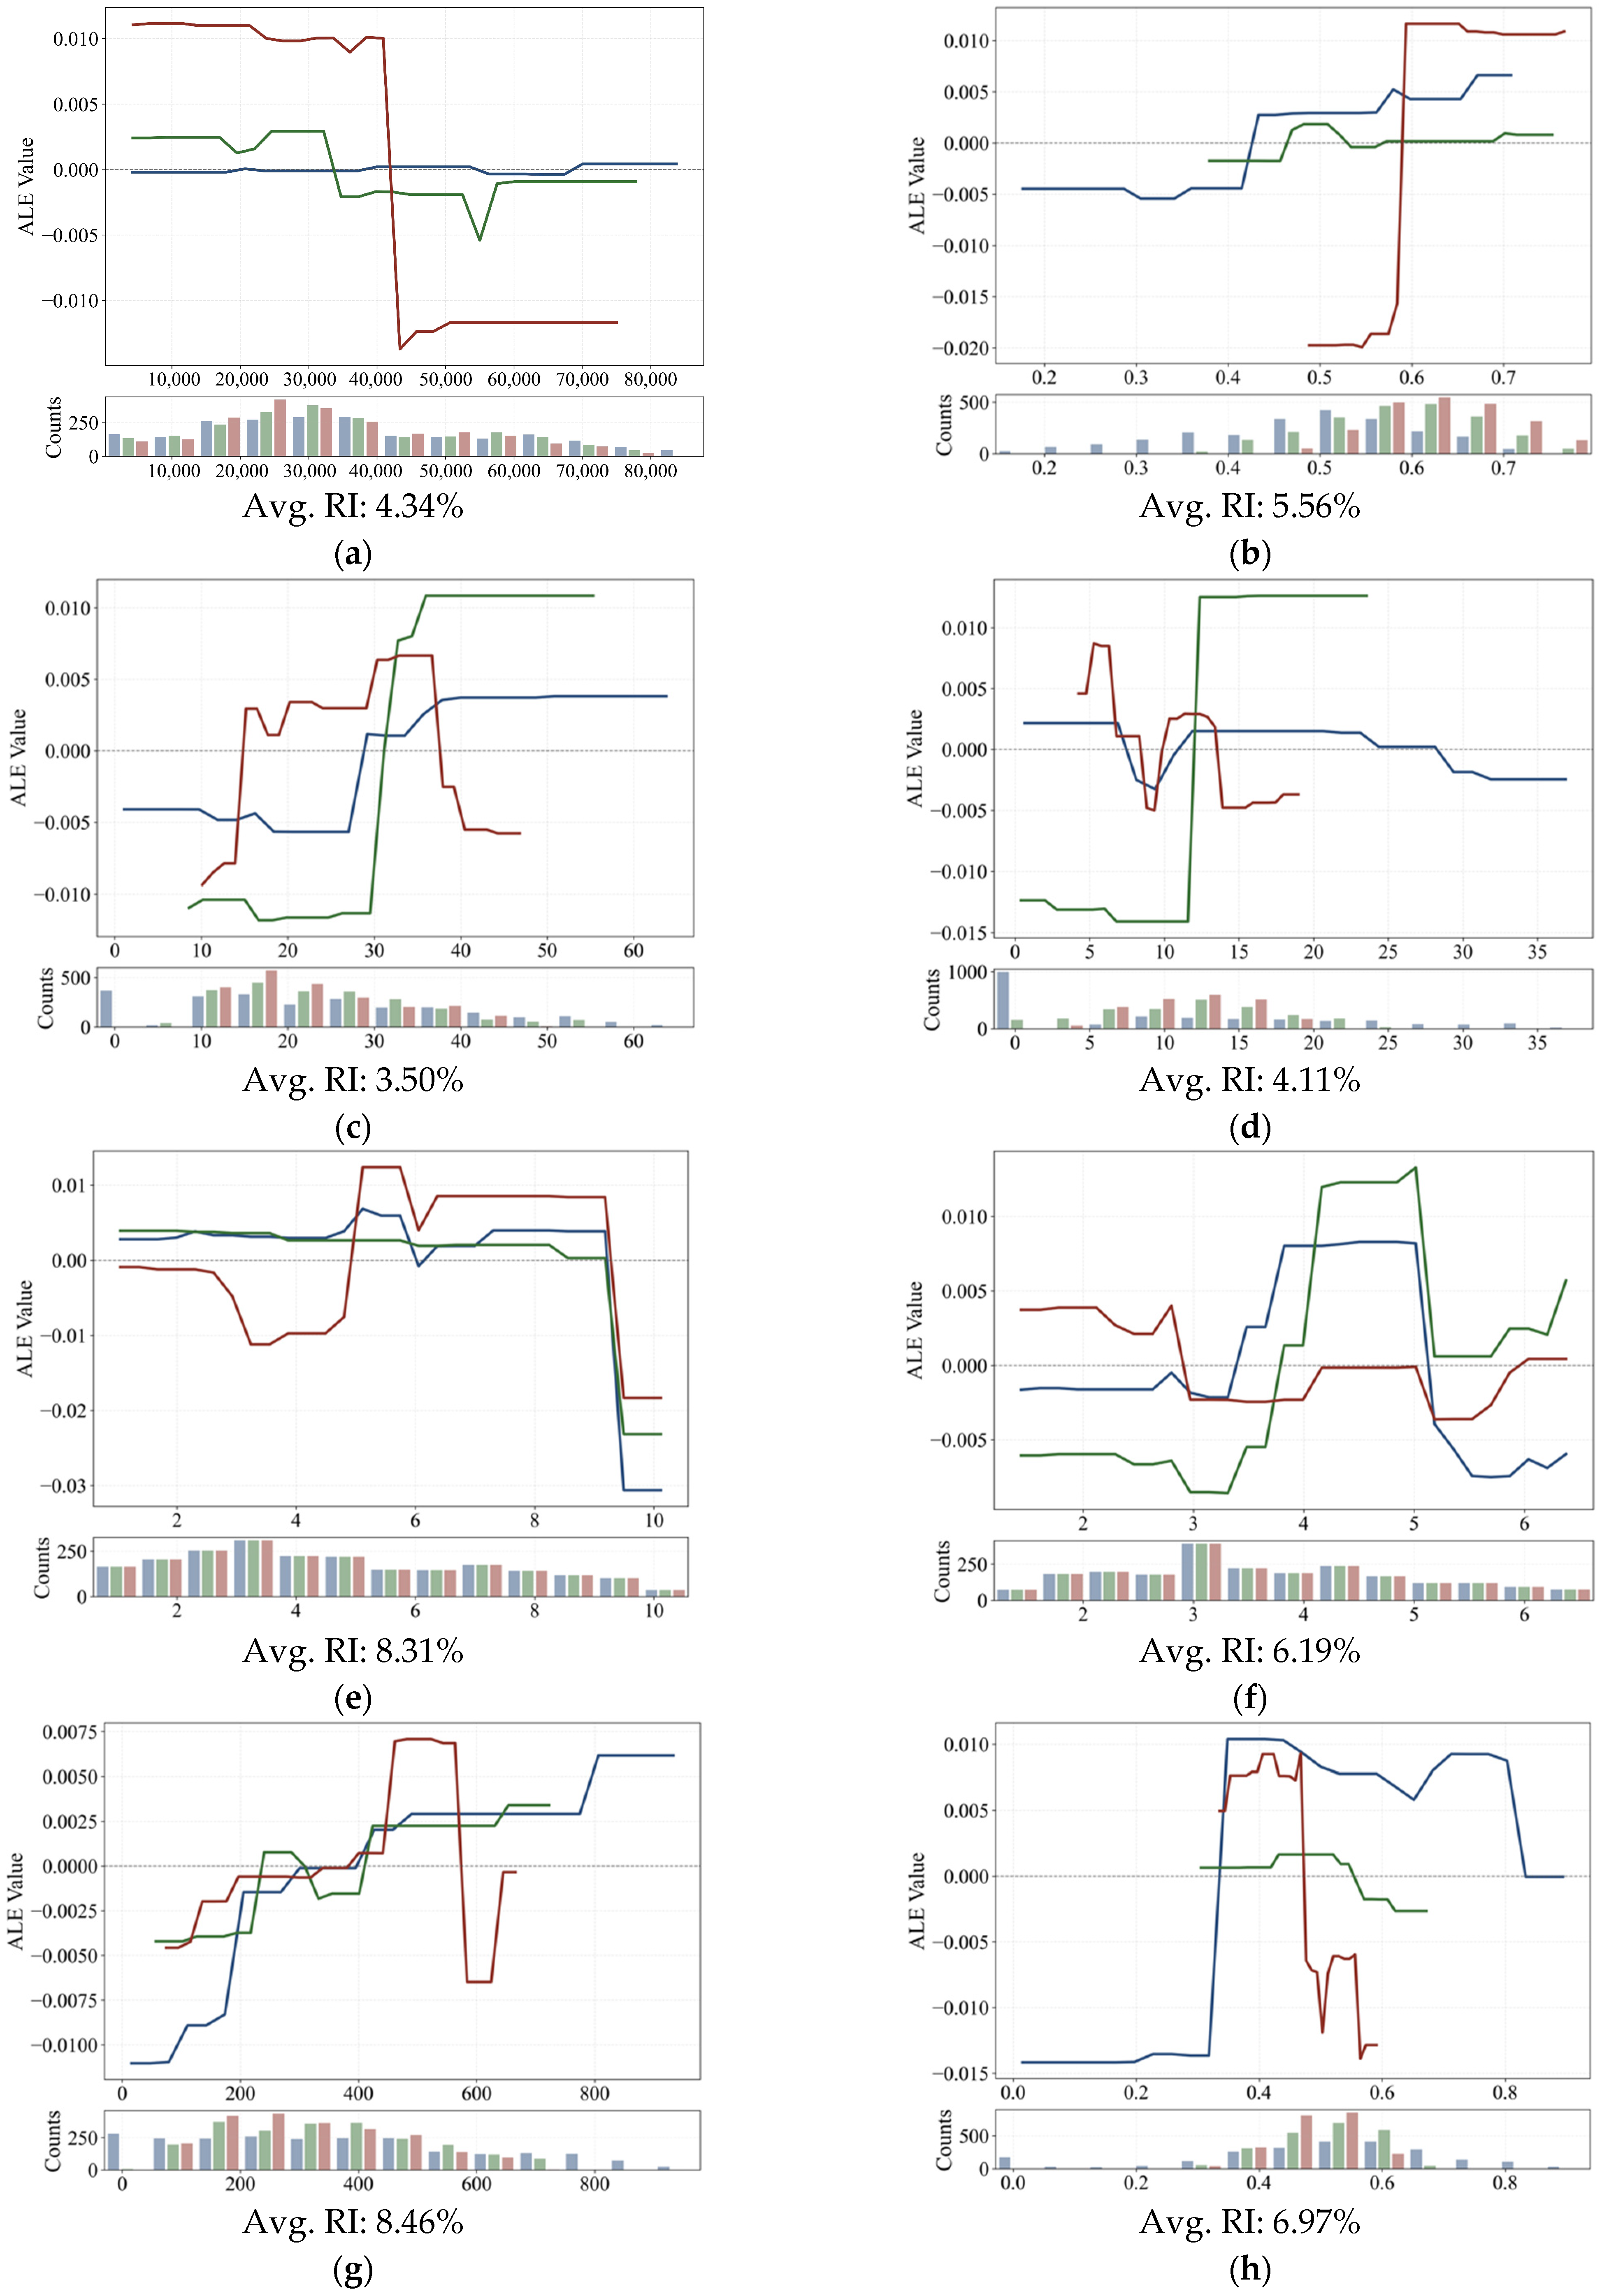
This study found that almost all BE features had nonlinear relationships with older adults’ AT behavior, and the relationships for some BE features showed marked differences across spatial units. Specifically, at the macro-scale BE level, the relationship between population density and older adults’ AT differed across the three spatial units. In the 10 min and 15 min walking ranges, population density and older adults’ AT both showed a negative correlation (Figure 7a), a result that is exactly the opposite of the findings of existing studies in countries such as Japan [16]. However, their thresholds differed slightly at different scales. Specifically, the tendency for older adults’ AT was stable during the initial increase in population density, then dropped sharply in a certain range, after which the negative correlation gradually weakened and disappeared. For the 10 min walking range, the sharp decline occurred in the 32,000–34,000 persons/km2 range. The corresponding range for the 15 min walking range was 41,000–43,000 persons/km2, which also showed a steeper negative gradient. In the 5 min walking range, population density had a negligible impact on older adults’ AT; compared to the other two spatial units, the ALE range for population density in this unit was almost a horizontal line near 0. This phenomenon may stem from the different connotations of density at different scales [51]; that is, compared to 5 and 10 min, the 15 min range covers more non-residential functional spaces, and its density value reflects the overall compactness of the community rather than purely residential crowding. When the 15 min life circle population density exceeded 41,000 persons/km2, the ALE value continued to drop to −0.014, a decline far exceeding the 10 min buffer. This suggests that high-density layouts at the macro-scale have a more profound inhibitory effect on older adults’ AT, possibly linked to a systematic decrease in traffic noise, pollution, and perceived safety at the regional level. This finding indicates that simply increasing population density is not a universal strategy for promoting older adults’ AT; on the contrary, we must be wary of the negative effects of excessive community agglomeration.
LUM showed a positive promotional effect on older adults’ AT (Figure 7b), consistent with existing studies [52,53]. The curves for all three spatial units showed a flat initial phase, followed by a gradual rise to a certain threshold (5 min: 0.42; 10 min: 0.53; 15 min: 0.59), after which they remained stable. Moreover, the 15 min walking range had the largest ALE curve drop, showing a strong promotional effect. This indicates that in the 15 min walking range, increasing the land mix of functionally monolithic areas has a very high cost–benefit ratio for promoting older adults’ travel. However, once the mix reaches a high level (>0.59), the marginal benefit of continuing to increase the mix diminishes. The study also found that as the spatial unit increased, the threshold for LUM also gradually increased, indicating that a higher demand for LUM is needed at larger scales to achieve the optimal promotional effect on older adults’ AT. This finding provides a fine-grained scalar guideline for age-friendly land allocation. In planning practice, a certain degree of land use purity can be retained within the small-scale 5 min range of older adults’ residences, while gradually increasing the LUM in the 10 min and 15 min gradients, forming a “gradient layout” that is “pure internally, mixed externally.” This serves as an important supplement to the universal “concentric circle mix” principle.
Intersection density showed different relationships with older adults’ AT across the three spatial units (Figure 7c). In the 5 min and 10 min walking ranges, it showed a positive correlation with older adults’ AT. The curve shapes were similar, but the ALE curve for the 10 min range changed more dramatically. The curve for the 15 min network buffer showed a completely different pattern, exhibiting an “inverted U-shaped” change. When intersection density was below 35 intersections/km2, the probability of AT rose with increasing intersection density, peaking and then beginning to decline. This result confirms the friendliness of a highly connected street network (“small blocks, dense grid”) for older adults’ walking in spatial units close to their homes [34]. However, the study also found that while moderately increasing intersection density in larger spatial units has a positive effect on promoting older adults’ travel, excessively high intersection density may inhibit travel by increasing traffic complexity and safety hazards.
Transit stop density showed significant differences across the three spatial units (Figure 7d). In the 5 min walking range, transit stop density was negatively correlated with older adults’ AT; as density increased, the tendency for AT gradually decreased. The 10 min walking range showed a significant positive correlation, with a very obvious drop in the ALE curve (−0.014 to 0.013). The 15 min walking range showed a very complex trend, with the curve shape exhibiting two consecutive “inverted U-shaped” relationships. This phenomenon aligns with reality: increasing transit stop density within a 5 min walk of older adults’ residences enhances public transport service opportunities, directly prompting older adults to substitute public transport for AT. This finding is consistent with the existing literature on transit stop density and commuting behavior, but highlights the specificity of the older adult group [15]. That is, in the 10 min walking range, increasing public transit stop density can greatly increase the accessibility of locations within that range. As the attractiveness of these locations significantly increases, older adults’ willingness to engage in AT rises [52].
Distance to the city center, overall, showed a common trend with older adults’ AT across the three spatial units within a certain range (Figure 7e). Specifically, when the distance to the city center exceeded 9 km, all three spatial units showed a consistent negative correlation, meaning the probability of older adults’ AT gradually decreased as the distance increased. The trend was very steep for all three units, and combined with the variable’s average RI of 8.31%, this reflects the fundamental constraint of spatial location on older adults’ travel behavior. Being far from the city center not only implies a decline in the accessibility of key services like medical care, commerce, and social activities but is also accompanied by multiple disadvantages, such as lower public transport frequency, deteriorating walking environment quality, and reduced psychological security, all of which systematically weaken older adults’ willingness and ability to travel. This finding is highly consistent with classic “distance decay” theory and existing research on older adult mobility, confirming the critical role of central locations in supporting older adults’ activity participation [54]. It is worth noting that within the 9 km range near the city center, the different buffer models showed clear divergence. The curves for the 5 min and 10 min ranges were relatively flat. Within this range, even with slight changes in distance to the center, older adults could still conveniently access daily life services via short-distance walking, and the marginal impact of distance on travel probability was limited. However, the 15 min walking range showed a U-shaped fluctuation within 5 km of the city center: travel probability decreased slightly in the 0–3 km core area, and then significantly rebounded in the 3–5.2 km range. This may be due to negative factors in some old city districts, such as excessively dense traffic and pedestrian flow, walking environment safety hazards, and a lack of parking facilities.
Distance to the nearest city sub-center, overall, showed a complex, segmented nonlinear association with older adults’ AT, with a common trend across the three spatial units (Figure 7f). Specifically, all three units showed a consistent negative correlation in the two ranges below 3.3 km and above 5 km: the farther from the sub-center, the lower the probability of older adults’ AT. This pattern is highly consistent with the findings for the “distance to CBD” variable, confirming the general rule of older adults’ reliance on central locations: being far from any level of center means reduced service density, increased travel costs, and weakened social ties, thereby inhibiting the willingness for AT. However, in the critical 3.3 km to 5 km range, all three models showed a significant positive correlation: the farther from the sub-center, the higher the probability of older adults’ AT. This anomalous phenomenon may stem from two reasons: First, the 3.3 km range roughly corresponds to the core influence area of the sub-center, where high-density development might bring issues like traffic congestion, compressed walking space, and a noisy environment, which in turn reduces older adults’ sense of travel safety and comfort. Second, the 3.3–5 km ring is on the “edge of the central influence zone,” which avoids the negative externalities of the core area while still allowing convenient access to central services via moderate walking, forming an advantageous buffer zone for older adults’ AT [28].
Service facility density was generally positively correlated with the probability of older adults’ AT, meaning the higher the density of living service facilities in the community, the stronger the willingness of older adults to travel actively (Figure 7g). This result aligns with the fundamental role of facility provision density in supporting older adults’ travel purposes [55]. Specifically, in the 5-min and 10-min walking buffers, the positive correlation showed a “steep-then-flat” characteristic: when facility density increased from 0 to about 200 facilities/km2, the probability of older adults’ AT rapidly increased, indicating that the initial establishment of basic service facilities has a key threshold effect in stimulating travel demand. Above this threshold, the curve flattened, suggesting diminishing marginal returns from facility density, as older adults’ travel decisions shifted more toward deeper factors like facility quality, diversity, and spatial layout reasonableness. It is noteworthy that in the high-density range (>580 facilities/km2), the curve for the 15 min walking range showed unstable fluctuations, presenting a nonlinear oscillation of a sharp drop followed by a climb. This abnormal phenomenon needs to be interpreted cautiously. On the one hand, data points in this range were sparse and the sample size was limited, increasing the variance of the ALE estimate and possibly introducing statistical noise. On the other hand, extremely high density might correspond to core urban commercial districts, which, despite extremely abundant facilities, are also accompanied by negative factors like traffic congestion, sidewalk encroachment, and noisy environments, which inhibit older adults’ travel intentions in the short term.
Service facility distribution structure (ANN) showed a clear inverted U-shaped nonlinear relationship with the probability of older adults’ AT, rising first and then falling (Figure 7h). When the ANN was too clustered, moderate dispersion helped expand the service coverage of facilities, forming multiple comprehensive service cores and attracting older adults to engage in longer-distance AT to access diverse services. However, excessive dispersion of facilities led to overly low single-point service efficiency, reduced choice, and lower recognizability, which in turn weakened older adults’ travel intentions. Specifically, all three scales had an optimal clustering range. In the 5 min walking buffer, the curve rose sharply in the 0.3–0.32 ANN index range, reflecting that at the micro-scale, as facilities transition from extremely clustered to moderately dispersed, service coverage expands rapidly, allowing more older adults to reach at least one facility within a short distance, significantly improving travel convenience. However, when the ANN exceeded about 0.8, the curve quickly turned negatively correlated, indicating that excessive facility dispersion at this point led to low single-point service efficiency, reduced choice, and lower recognizability, which in turn weakened travel intentions. In contrast, the 15 min walking buffer showed a stronger negative effect of dispersion. It maintained a flat positive correlation in the 0.32–0.43 range, and then turned to a steep negative correlation in the 0.43–0.5 ANN range. This indicates that at a larger spatial unit scale, high facility dispersion results in a lack of a clear service center within the 15 min range, severely undermining the clarity of older adults’ travel goals and route efficiency [43], thus causing a sharp drop in travel probability.
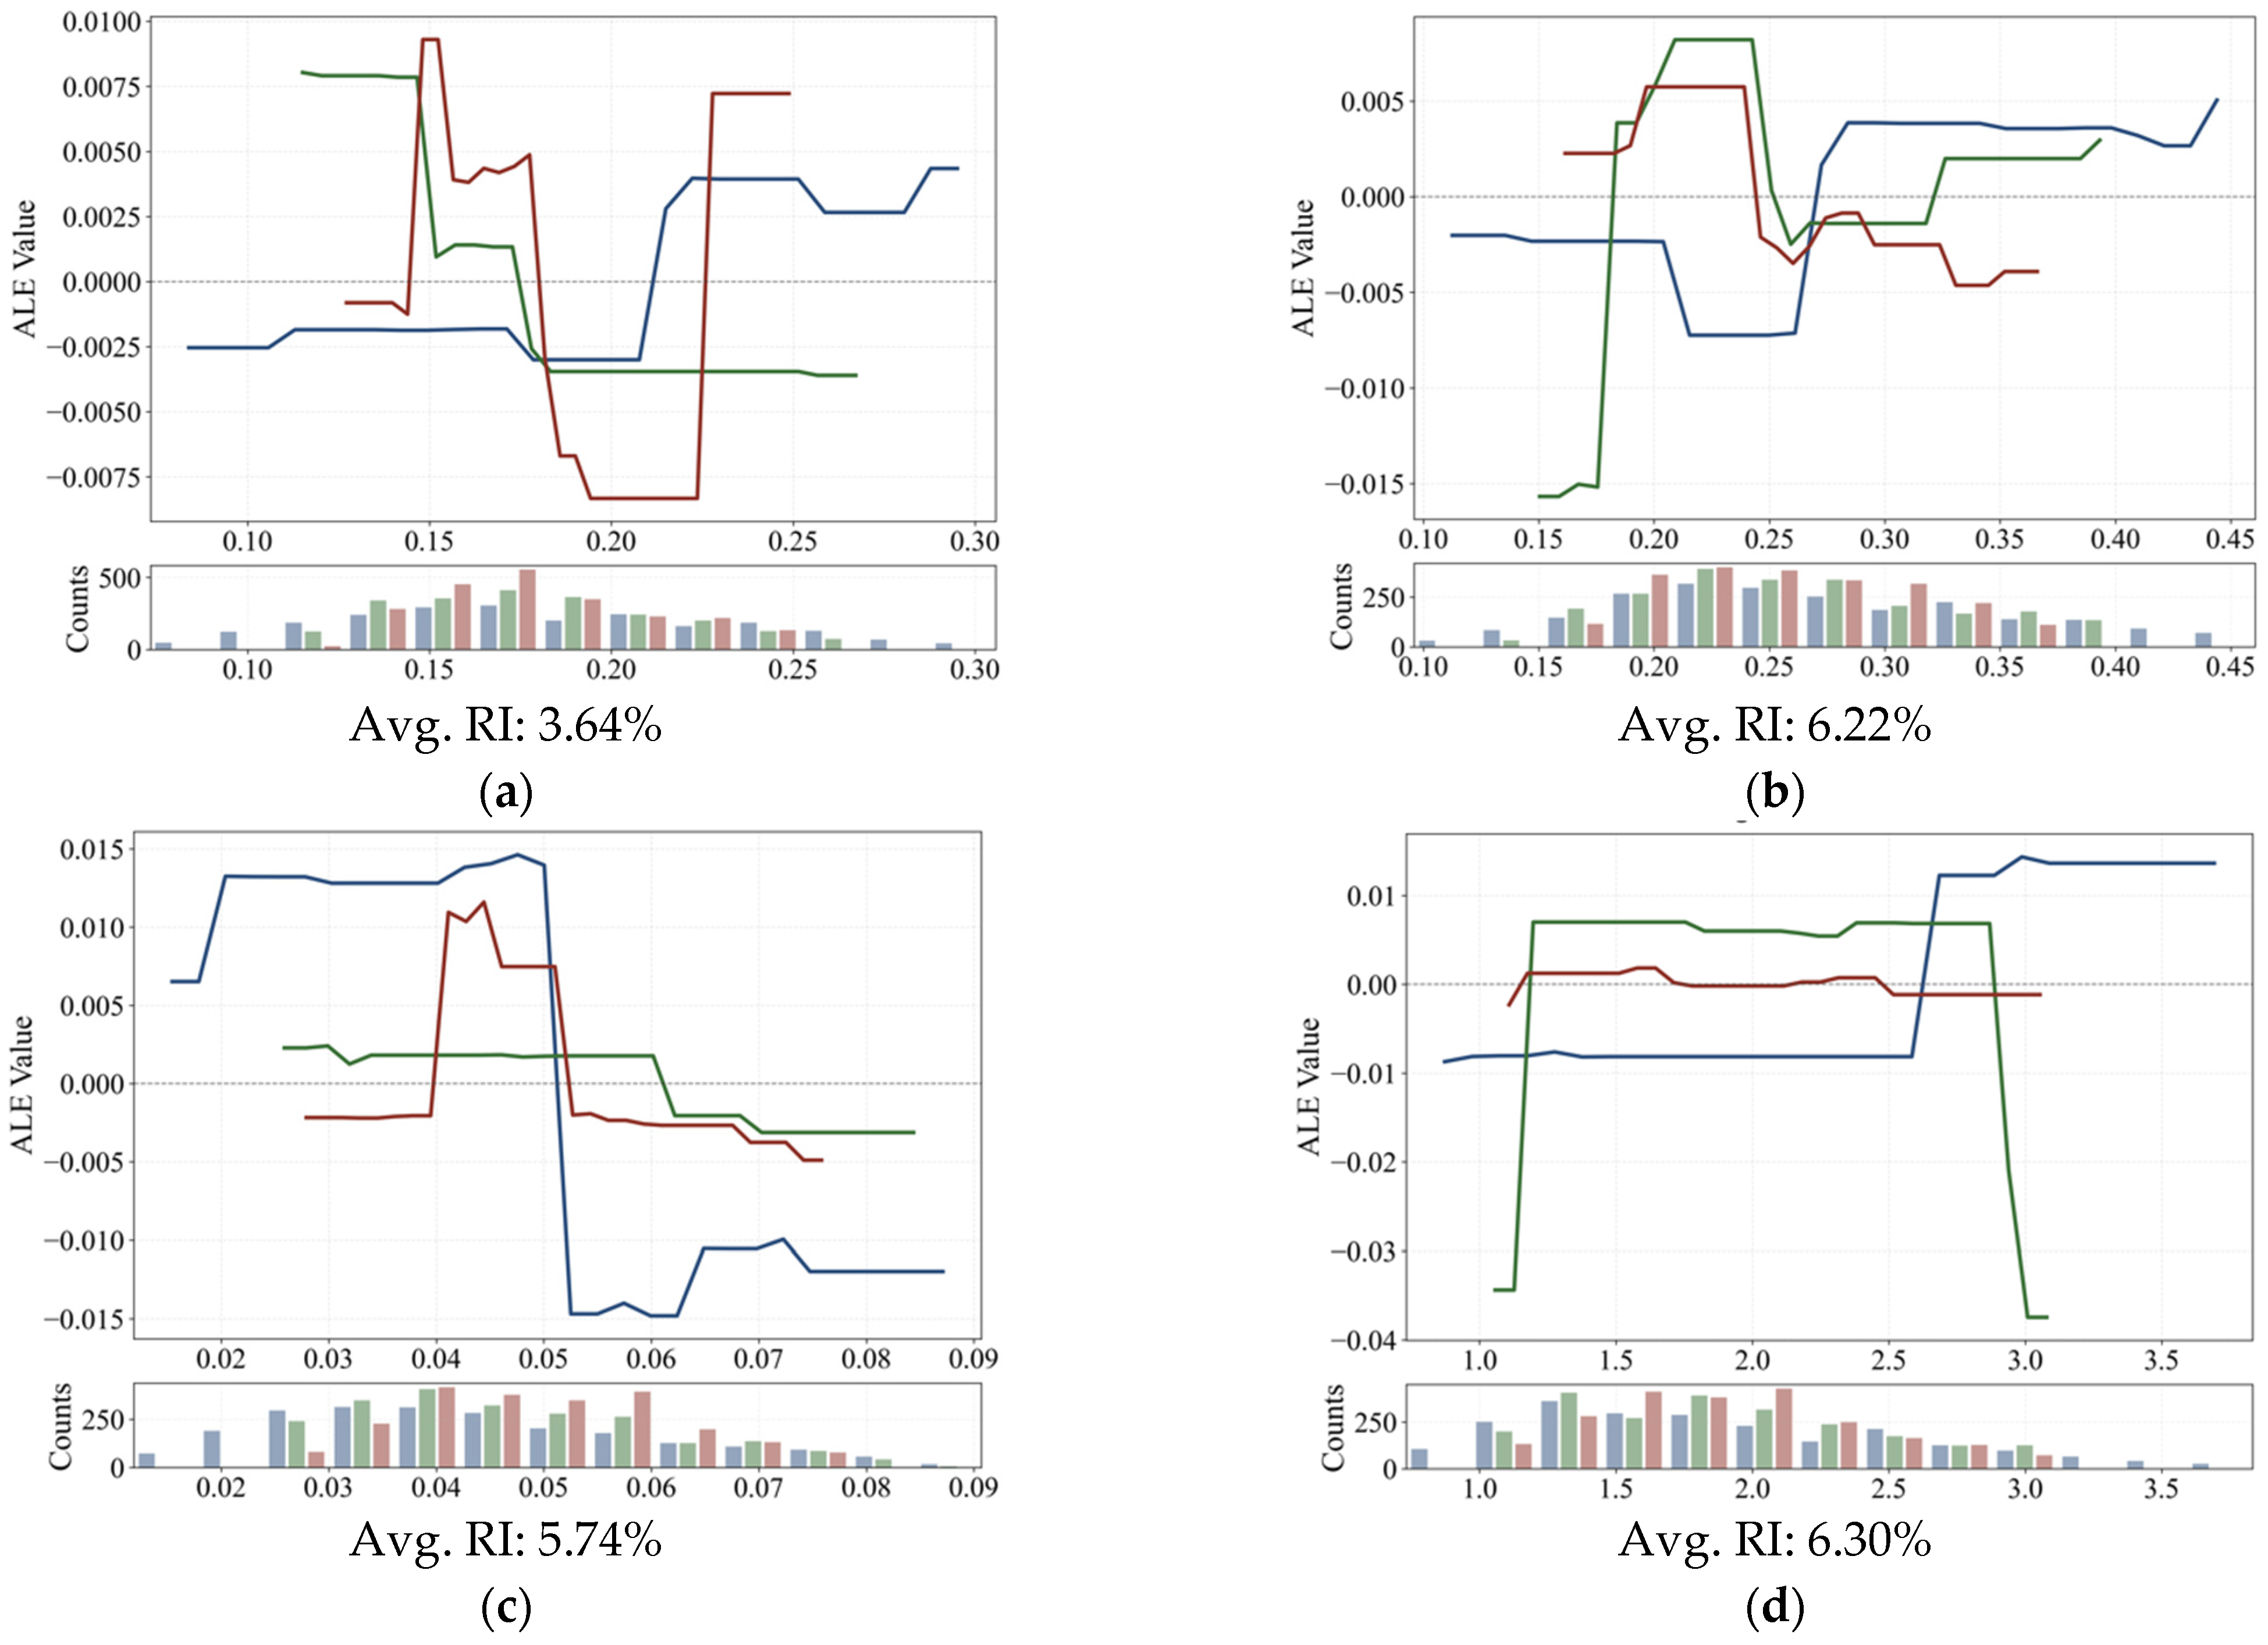
At the micro-scale BE level, the impacts of elements related to street design also revealed complex nonlinear relationships and significant scale differences. SW showed vastly different relationships with older adults’ AT across the three spatial units (Figure 8a). In the 5 min walking buffer, SW was stably positively correlated with older adults’ AT: the higher the sidewalk ratio and the lower the motor vehicle lane ratio, the greater the probability of older adults’ travel. This intuitive result at the micro-scale confirms the decisive role of walking environment safety for older adults’ short-distance travel: within the high-frequency activity range of older adults, physically separated sidewalks, reduced vehicle speeds, and fewer traffic conflicts directly enhance their sense of travel safety and comfort, thereby effectively stimulating their willingness for AT [28]. However, in the 10 min walking buffer, the relationship turned negative, meaning excessively increasing walkability actually inhibited older adults’ travel. This counter-intuitive phenomenon reveals an “efficiency paradox”: at the 10 min walking scale, if motor vehicle lane space is excessively compressed to expand sidewalks, it may lead to decreased road network connectivity, reduced bus operating efficiency, and inconvenience for taxi pick-ups/drop-offs, thereby weakening older adults’ ability to complete medium-to-long-distance trips that rely on a mix of transport modes. At this point, older adults may reduce travel due to fears of “being able to walk out but not get back” or “being unable to transfer conveniently,” indicating that at this scale, the overall efficiency of the transport system is more important than the mere sidewalk ratio. The 15 min walking buffer showed an extremely complex three-stage pattern, integrating the characteristics of the 5 min and 10 min models: when the sidewalk ratio was low (<0.15), the curve was positively correlated, consistent with the 5 min model, indicating that basic walking environment improvements also incentivize long-distance travel at the macro-scale. When the sidewalk ratio increased to the 0.15–0.22 range, the curve turned negative, reproducing the 10 min model’s efficiency paradox, showing that over-emphasizing walkability at the medium-scale damages travel efficiency. When the sidewalk ratio exceeded 0.22, the curve turned positive again, indicating that at a higher walkability level, the marginal effect of safety benefits re-dominated, and older adults were willing to accept moderate network efficiency losses to obtain a safer non-motorized environment.
GVI showed significant scale differentiation and complex threshold effects on older adults’ AT probability (Figure 8b). In the 0.15–0.21 moderate GVI range, the curves for the 10 min and 15 min buffers both showed a clear positive correlation, indicating that increasing street greening levels within this range can effectively enhance older adults’ willingness and probability to undertake medium-to-long-distance trips. Moderate greening at this scale played positive roles such as providing shade and cooling, alleviating walking fatigue, and enhancing environmental pleasure and psychological security, serving as an important environmental quality signal supporting older adults in completing more complex travel chains [11]. However, when the GVI exceeded about 0.21, both curves quickly turned negative, indicating that further increases in greening did not bring the expected benefits. Instead, excessive green view led to issues like reduced street openness, visual obstruction, discontinuous walking interfaces, and weakened commercial vitality, increasing older adults’ perception of environmental risks and uncertainty, thereby inhibiting their AT decisions. This phenomenon confirms that excessive greening can evolve into a spatial obstacle. In contrast, the 5 min walking buffer showed a distinctly different U-shaped pattern and a higher activation threshold. When the GVI was below 0.26, an increase in greening level was actually accompanied by a decrease in older adults’ travel probability, reflecting the rigid constraint of “safety-first” at the micro-scale: dense vegetation may compress effective walking width, increase tripping hazards, obstruct sightlines, and reduce nighttime illumination. These safety hazards posed a direct inhibition on the short-distance, high-frequency travel of older adults. Only when the GVI broke through 0.26 did the curve turn positive, indicating that at this point, greening began to transform from a “potential obstacle” to an “environmental asset.” It is noteworthy that when the GVI reached 0.27, the positive effect in the 5 min buffer hit a bottleneck, and subsequent increases produced no significant impact. This is internally consistent with the “diminishing returns after the optimum” phenomenon seen in the 10 and 15 min models, but the threshold was higher and the effective range narrower, highlighting the sensitivity and precision required for greening configuration at the micro-scale for older adults.
SO showed a significant negative dominant effect on older adults’ AT probability (Figure 8c). In the 5 min and 10 min walking buffers, both curves showed a stable negative correlation, flattening out after the SO exceeded approximately 0.05 and 0.06, respectively. This result was entirely as expected: at a small scale, barriers such as walls and fences directly compress effective walking width, increase detour distances, obstruct sightlines, and pose tripping hazards, systematically weakening older adults’ sense of travel safety and convenience. The 5 min buffer showed the most significant negative drop, with an inhibitory effect clearly stronger than the 10 min buffer. This reflects older adults’ extreme sensitivity to obstacles in their near-home environment; within the short-distance range used daily and frequently, any minor environmental obstacle is magnified into a serious barrier to mobility, directly inhibiting their most basic daily activities. The 15 min walking buffer showed a more complex two-stage pattern. When the SO was in the 0–0.042 range, the curve showed an anomalous positive correlation, meaning a moderate increase in obstacles was accompanied by a rise in older adults’ travel probability. This counter-intuitive phenomenon has yielded similar results in recent studies [11], which may stem from differences in urban spatial types corresponding to this range: within the 15 min buffer, a low SO might correspond to overly open traffic arteries or large public spaces lacking boundary definition. These environments, due to mixed traffic, improper spatial scale, and lack of recognizability, actually make older adults feel insecure. Moderate boundary elements like walls and fences might play a positive role in spatial definition at this stage, enhancing older adults’ sense of environmental control and travel confidence by separating pedestrians from vehicles, enclosing safe domains, and providing visual reference points. This reflects the special value of “safety boundary effects” at the macro-scale. However, when the SO exceeded 0.042, the 15 min curve quickly turned to a steep negative correlation, converging with the trends of the 5 min and 10 min curves. This indicates that beyond a critical threshold, the accumulation of obstacles ultimately constitutes a systematic barrier at the macro-scale as well. Their negative effects (obstructing passage, reducing connectivity, and increasing detours) surpassed the positive effects of boundary definition, leading older adults to avoid medium-to-long-distance travel.
SE showed significant scale-dependent and interval-specific response patterns in its relationship with older adults’ AT probability (Figure 8d). The ALE curve for the 15 min walking buffer fluctuated mostly around 0, indicating that at a larger spatial unit, SE has no significant systematic effect on older adults’ AT. This result confirms the functional orientation of macro-scale travel decisions: when older adults plan medium-to-long-distance trips within a 15 min range (e.g., for medical visits, shopping, or community activities), their decision mainly depends on structural factors like destination accessibility, facility completeness, and transport connectivity. The micro-scale morphological feature of the relative scale of buildings on either side of the street is “smoothed out” by the overall travel experience and fails to exert an independent effect. In contrast, the 5 min walking buffer showed a significant positive correlation, while other intervals were a horizontal line. This specific response reveals older adults’ need for spatial recognition in high-frequency, short-distance travel. In the micro-environment immediately adjacent to the home, a moderate sense of enclosure creates clear boundary definition, reduces environmental information complexity, and enhances a sense of territory and recognizability. This provides a stable spatial reference for older adults with potentially declining cognitive function, thereby boosting their confidence to go out for brief activities. However, the curve was flat when SE was below 2.6, indicating that even if the street is relatively open within the 5 min range, older adults are still willing to travel as long as the walking environment is safe; safety factors take precedence over spatial form. The effect saturated after SE exceeded 3.0, possibly because excessive enclosure leads to spatial oppression, but this did not show a significant negative trend due to the limited sample size. The 10 min walking buffer showed a typical inverted U-shaped relationship: positively correlated when SE was less than 1.3, and negatively correlated when greater than 2.8, with no significant effect in the intermediate range (1.3–2.8). This pattern reflects the theory of optimal stimulation in environmental psychology. Within a 10 min medium travel distance, a moderate enclosure provides older adults with a safe boundary, reduces the risk of accidental crossings, and creates a street atmosphere with a sense of community belonging, which is conducive to stimulating medium-distance walking. However, when SE exceeded 2.8, the street space became too enclosed and narrow, possibly triggering feelings of environmental oppression and safety anxiety. Older adults may worry about falling or facing security issues in an environment lacking open sightlines and “eyes on the street,” thus inhibiting their AT intentions.
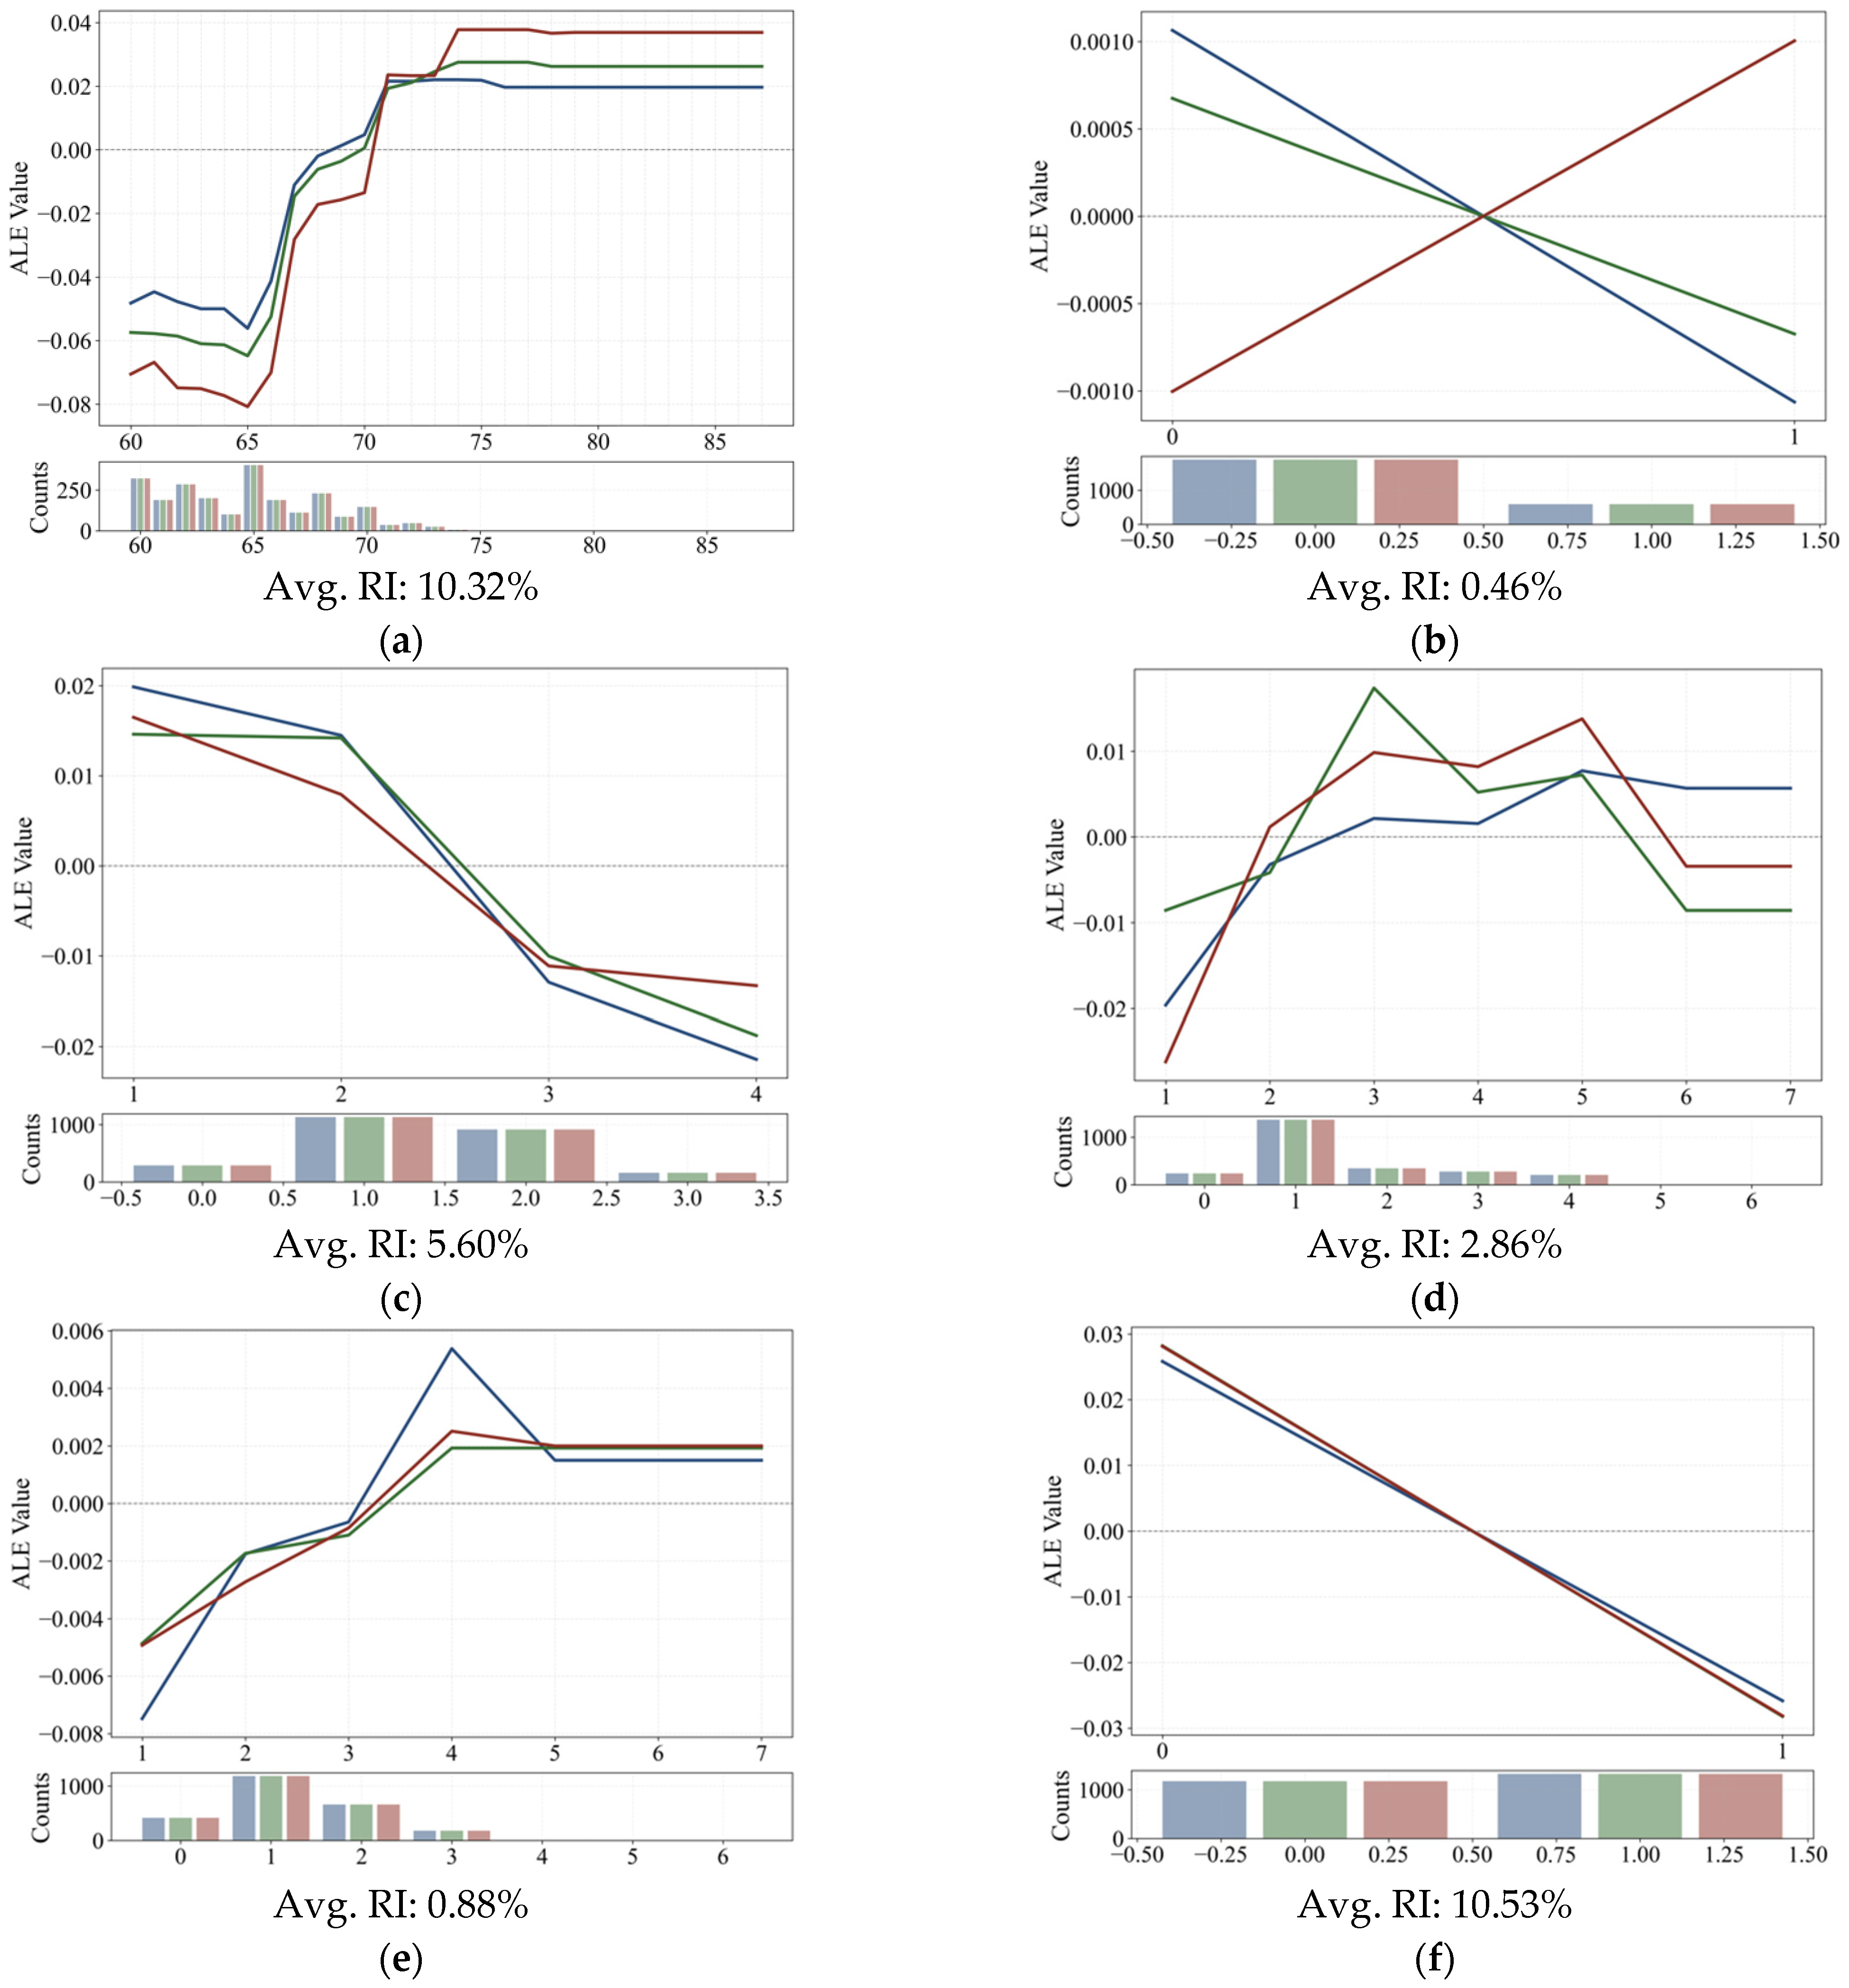
Finally, this study examined the nonlinear effects of individual socio-economic attributes. The effects of these variables showed a high degree of consistency across different spatial scales, indicating they are robust, individual-level drivers independent of the geographic context. Among them, gender had the highest average RI (10.53%), followed by age (10.32%) and education level (5.60%). Specifically, age had a V-shaped turning point relationship with AT (Figure 9a): it was negatively correlated before age 65, possibly due to a decline in travel willingness from natural physical decline [52], and turned positive after 65, perhaps reflecting increased free time after retirement and a greater emphasis on health-promoting activities. Car ownership showed a significant MAUP effect (Figure 9b): in the 5 and 10 min buffers, it was negatively correlated, indicating that for short-range trips, the private car acts as a “crutch” and inhibits AT [56]. But in the 15 min buffer, it turned positive, suggesting that for long-distance travel, the vehicle ensures the expansion of activity space and destination accessibility, indirectly incentivizing the formation of AT chains. Education level was negatively correlated at all scales (Figure 9c), possibly related to higher-educated groups demanding higher travel efficiency and being more inclined toward motorized travel. Household size showed an inverted U-shaped relationship (Figure 9d): a moderate size (about 3–4 people) promotes older adults’ travel through intergenerational companionship needs, but an overly large household size (>5 people) may reduce the necessity for older adults’ independent travel due to sufficient internal care resources. Household income was generally positively correlated (Figure 9e), reflecting that improved economic conditions support more diverse travel choices and higher-quality activity participation [6]. The gender difference was most prominent and consistent across scales (Figure 9f): female older adults had a significantly higher probability of AT than males, possibly related to their more active social engagement, stronger health consciousness, and more frequent daily shopping needs [7].

5. Discussion

Addressing our primary research objective regarding spatial unit selection, the empirical results confirmed the critical role of spatial unit selection and BE measurement scale in older adult travel research. First, the association characteristics between the BE and older adults’ AT indeed change systematically as the spatial resolution and boundary configurations of the observational units vary. Network-based buffers outperformed traditional Euclidean-based buffers at all analytical scales. This finding validates the theoretical hypothesis of Guo and Bhat (2007) [37] and extends it by providing the first large-scale empirical support in the field of older adult mobility. While previous studies have debated buffer types for general populations, our results demonstrate that Euclidean-based buffers, by ignoring the connectivity of the real street network and physical barriers (e.g., gated communities, railway divisions), severely overestimate the actual reachable range of older adults, leading to biased BE exposure measurements. In contrast, network-based buffers, calculated based on actual walking paths, are more aligned with the stringent requirements of older adults for path continuity and safety, given their physical limitations, and thus can more accurately capture the environmental impact of the “true causally relevant area” [57].
Second, the 15 min network-based walking buffer was identified as the most effective intervention unit for explaining older adults’ AT. This provides direct behavioral theory support for the “15 min community life circle” policy. The model AUC increased from 0.74 (5 min) to 0.81 (15 min), indicating that this scale optimally balances the completeness of environmental information with behavioral relevance. This finding echoes the conclusion of Liu et al. (2023) in subway travel research but crucially differentiates the unique “medium-scale” activity space characteristic of the older adult population [41]. Contrary to studies on commuters who rely on the city-level transport network, our findings confirm that the daily activities of older adults are anchored at the community level. The 15-min walking range precisely covers their high-frequency, diverse living needs (shopping, leisure, medical care, and socializing), constituting a self-contained “activity system.” It is noteworthy that the marginal AUC gain from 10 to 15 min (0.02) was significantly smaller than from 5 to 10 min (0.05), suggesting that after 10 min, the contribution of new environmental information to explanatory power shows diminishing marginal returns. This observation aligns with the literature regarding the physiological upper limits of older adults’ walking endurance and cognitive map complexity. Therefore, age-friendly life circle planning should not blindly expand the scale but should focus on functional completeness and environmental quality improvement within the 15 min range. This conclusion offers practical guidance for the current renovation of aging communities in China: compared to building new large-scale facilities, systematically supplementing small and micro-facilities like elderly service stations, community canteens, and pocket parks within the 15 min walking range is more effective in stimulating the AT potential of older adults.
Third, this study refined the influence of macro- and micro-scale BE on older adults’ AT. In spatial units of all sizes, the RI of macro-scale BE was higher than that of micro-scale BE. Particularly in the 15 min network buffer, the contribution of macro-scale BE reached 51.5%, far exceeding the micro-scale’s 20.45%. This implies that older adults’ AT is essentially “destination-driven” behavior: service facility density (RI 9.65%) and LUM (7.3%) directly reduce travel barriers and enhance travel motivation by providing diverse, nearby activity opportunities. Therefore, under resource constraints, prioritizing the optimization of the land use layout is more cost-effective than fine-grained street renovation. This should also be holistic; that is, once a balanced facility layout is formed within the 15 min range, the scale of the older adult population it benefits and the travel frequency it promotes far exceed that of a single street modification. However, this does not mean micro-scale BE is unimportant. Within the 5 min buffer, the contribution of micro-scale BE still reached 23.36%, and variables like SW and GVI had significant impacts on older adults’ AT. More critically, the positive role of macro-scale BE has a micro-scale prerequisite: high facility density, if lacking sidewalk connectivity, may actually inhibit older adults’ travel by increasing traffic conflicts (as seen in the negative correlation between transit stop density and AT in the 5 min buffer). This hierarchical relationship extends the existing “5D” framework by suggesting a complementary mechanism: macro-scale BE determines the potential demand of “whether to travel,” while micro-scale BE affects the realization capability of “whether one can travel safely.” Therefore, the ideal age-friendly intervention should follow a “macro-first, micro-precise” principle, coordinating facility layouts at the 15 min life circle level while strengthening pedestrian safety protection within the 5 min core activity circle. More importantly, this study revealed a structural divergence in the sensitivity of macro- and micro-scale BE elements to changes in spatial unit scale. The importance of macro-scale BE elements (e.g., population density, transit stop density) increased monotonically as the unit scale expanded, whereas micro-scale street design elements (e.g., SE) showed a decreasing trend. This divergent phenomenon profoundly reflects the dual-level logic of older adults’ travel decisions: within the 5 min walking range, travel choices are mainly driven by perceptions of the micro-environment, such as street safety and walking comfort. But when the spatial scale expands to the 15 min life circle, macro-scale structural factors like destination accessibility and functional mix become the key factors dominating travel intentions. Previous studies often relied on a single scale, which our results suggest may have masked the scale-dependency of BE effects, leading to impaired precision in policy interventions.
Fourth, by illuminating the critical nonlinear thresholds and scale dependencies, this study highlights the complex role of the BE. We trace the variability of these relationships across spatial units to two root causes: the inherent alteration of variable distribution when unit boundaries change, and—as noted by Kwan [57]—the fact that different environmental factors possess distinct “true causally relevant” areas. Our analysis reveals that the causal mechanisms driving travel behavior are not static but vary subtly by geographic unit. Therefore, urban planning practice requires either the adoption of differentiated guidelines tailored to specific scales or a rigorous search for optimal spatial delineations. More concretely, the positive effect of LUM strengthened as the scale expanded (threshold rising from 0.42 to 0.59), indicating that breaking down single-function zoning and implanting service facilities over a larger area is crucial for older adults’ cross-community travel. However, retaining moderate residential purity in the 5 min core circle can reduce environmental complexity, aligning with the life rhythm of older adults. The scale-specificity of transit stop density was most prominent. High density within 5 min actually reduced AT probability, as it provided a motorized alternative to walking. But in the 10 min range, it turned into a positive incentive, as it expanded activity space accessibility. In the 15 min range, a double inverted-U shape appeared, reflecting older adults’ complex decisions regarding “walking-transit-combined” trips; moderate transit coverage provides a backup option without weakening the willingness to walk. This finding contradicts the linear thinking of “more transit is better” found in some earlier literature, suggesting that stop density should be controlled within older adult communities to avoid walking substitution, while transit hubs should be placed at the edge of the life circle to enhance distal accessibility. Service facility density showed a “steep-then-flat” positive trend (threshold ~200/km2), validating the fundamental role of facility provision, but the fluctuation after 580/km2 warns against the negative environmental impacts of excessive commercialization. Among micro-scale street design variables, the scale-reversal effect of SW (5 min positive → 10 min negative → 15 min three-stage) profoundly revealed the “scale paradox” of walking environment optimization: ensuring walking safety at the micro-level is a rigid demand, but at the meso-level, excessively compressing vehicle lanes may harm bus efficiency and connection convenience, thereby limiting older adults’ long-distance travel capabilities. The optimal range for GVI (0.15–0.21) and the “excessive greening trap” (>0.21, negative) show that older adults’ demand for greenery exists within a “moderate range”; excessive vegetation can obstruct sightlines and increase tripping risks, especially within the 5 min range (threshold 0.26), where safety must be prioritized over landscape. The positive-to-negative turn of SO at the 15 min scale (threshold 0.042) revealed the psychological value of boundary enclosure: moderate obstacles at the macro-scale play a role in spatial definition and enhancing a sense of security, but beyond the critical threshold, their physical obstruction effect dominates. These complex nonlinear patterns fully demonstrate that age-friendly planning must transcend the simple logic of “more is better” and establish precise regulatory standards based on empirical thresholds.
This study has several strengths and limitations worth noting. A key strength is the adoption of a multi-scale framework combined with interpretable machine learning (XGBoost and SHAP), which allowed us to uncover nonlinear thresholds and scale interactions often missed by traditional linear regression models. This methodological approach enables us to bridge a significant gap in existing research: while a plethora of literature has validated the efficacy of increasing transit stop density, service facility density, and enhancing street greenery in promoting AT, the spatial scale of these benefits is often overlooked. By revealing that BE interventions are most potent within a 15 min walking distance while differentiated strategies within 5 and 10 min ranges remain equally critical, this study provides a more granular understanding of the “true causally relevant area” for older adults. Furthermore, the “macro–micro” dual-level BE framework and the theory of scale synergy constructed herein expand the applicability of Ewing and Cervero’s “5D” model to the aging context [14]. We emphasize that in an aging society, “destination accessibility” (macro-scale) and “path safety” (micro-scale) are not independent but must be coordinated across specific spatial scales to cultivate a functionally diverse and appropriately scaled “15 min complete community” [58].
However, limitations exist. First, limited by cross-sectional data, this study can only reveal “association,” not “causation.” Future research urgently needs to explore causal mechanisms. Second, while combining walking and cycling as AT avoids a complex model structure, it also precludes mode-specific analysis. Future studies with larger and more balanced samples should examine these modes separately to clarify their distinct environmental determinants and corresponding infrastructure needs. Third, analyzing AT differences by travel purpose (e.g., leisure walking vs. utilitarian walking) or incorporating the “perceived environment” into the analysis are highly promising research directions. Furthermore, given that different geographical phenomena or processes exhibit diverse scale/zoning characteristics, academia urgently needs to find general methods for simulating the MAUP and to clarify the underlying mechanisms governing these phenomena. Lastly, as the conclusions of this study are based on the high-density context of Wuhan, future work should apply a similar framework in multiple cities for comparative research to draw more universally applicable conclusions.

6. Conclusions

This study applied the XGBoost machine learning algorithm, based on 2020 Wuhan travel survey data, to systematically examine the mechanisms by which the spatial unit scale and measurement hierarchy of BE interventions affect the AT behavior of older adults, and quantified key threshold effects. As one of the few studies on older adult mobility to simultaneously address the MAUP and nonlinear associations, this research reveals an often-overlooked but crucial planning dimension: the search for a behaviorally relevant optimal analytical scale and spatial unit definition. This work is critically important because existing research has mostly been based on a single, preset unit, a non-discerning method that may lead to systematic biases in policy interventions due to geographic context uncertainty.
The findings confirm that the BE significantly promotes older adults’ AT, but its influence is highly dependent on both the scale and morphology of the spatial unit used. Through a multi-scale framework comparison, network-based and circular buffers consistently outperformed circular ones, with the “15 min network buffer” emerging as the optimal unit with the greatest explanatory power. Furthermore, macro-scale BE attributes contribute more to older adults’ AT than micro-scale features, revealing distinct mechanisms of influence across different spatial scales.
For planning and policy, these results emphasize that using a single predefined spatial unit can introduce systematic bias into BE interventions. Planners should prioritize the 15 min network buffer as a functionally meaningful unit for analysis and intervention. Additionally, policy efforts should focus first on macro-scale BE factors within this optimal range, moving beyond generic approaches to establish evidence-based thresholds tailored to local contexts. This shift from a “more is better” mindset to precision planning based on empirical scales and thresholds is essential for advancing effective, age-friendly community design.

Author Contributions

Conceptualization, Chang Liu, Yu Zhang and Shuo Yang; methodology, Chang Liu and Shuo Yang; software, Yu Zhang; validation, Shuo Yang and Hui He; formal analysis, Chang Liu and Yu Zhang; resources, Hui He and Xiaoli Sun; data curation, Chang Liu and Yu Zhang; writing—original draft preparation, Chang Liu and Yu Zhang; writing—review & editing, Shuo Yang and Hui He; visualization, Chang Liu and Yu Zhang; supervision, Shuo Yang, Liang Guo and Hui He; project administration, Liang Guo; funding acquisition, Liang Guo. All authors have read and agreed to the published version of the manuscript.

Funding

This research was funded by the National Natural Science Foundation of China, the National Basic Research Fund for Higher Education Institutions, and the China Scholarship Council with project numbers 52178039, 52578073, 2021WKZDJC014, and 202506160078.

Data Availability Statement

Data are available upon request.

Acknowledgments

We would like to thank the Wuhan Institute of Transportation Development Strategy for providing the survey data.

Conflicts of Interest

The authors declare no conflicts of interest. The funders had no role in the design of the study; in the collection, analyses, or interpretation of data; in the writing of the manuscript; or in the decision to publish the results.

Abbreviations

The following abbreviations are used in this manuscript:
ALEAccumulated local effects
ANNAverage nearest neighbor index
ATActive travel
AUCArea under the curve
BEBuilt environment
BSVBaidu street view
GBDTGradient boosting decision tree
GISGeographic information system
GVIStreet green view index
LUMLand use mix
MAUPModifiable areal unit problem
ODOrigin–destination
PDPsPartial dependence plots
PPSProportional-to-population-size
RFRandom forest
RIRelative importance
SEStreet enclosure
SOStreet obstacle ratio
SWStreet walkable space ratio
TAZsTraffic analysis zones
UGCoPUncertain geographic context problem
XGBoostExtreme gradient boosting

References

  1. Collaborators, G. Global, Regional, and National Burden of Diseases and Injuries for Adults 70 Years and Older: Systematic Analysis for the Global Burden of Disease 2019 Study. BMJ 2022, 376, e068208. [Google Scholar] [CrossRef]
  2. Brown, V.; Diomedi, B.Z.; Moodie, M.; Veerman, J.L.; Carter, R. A Systematic Review of Economic Analyses of Active Transport Interventions That Include Physical Activity Benefits. Transp. Policy 2016, 45, 190–208. [Google Scholar] [CrossRef]
  3. Said, M.; Biehl, A.; Stathopoulos, A. Interdependence in Active Mobility Adoption: Joint Modeling and Motivational Spillover in Walking, Cycling and Bike-Sharing. Int. J. Sustain. Transp. 2022, 16, 422–440. [Google Scholar] [CrossRef]
  4. Yang, P.-Y.; Ho, K.-H.; Chen, H.-C.; Chien, M.-Y. Exercise Training Improves Sleep Quality in Middle-Aged and Older Adults with Sleep Problems: A Systematic Review. J. Physiother. 2012, 58, 157–163. [Google Scholar] [CrossRef]
  5. Ghani, F.; Rachele, J.N.; Loh, V.H.; Washington, S.; Turrell, G. Do Differences in Built Environments Explain Age Differences in Transport Walking across Neighbourhoods? J. Transp. Health 2018, 9, 83–95. [Google Scholar] [CrossRef]
  6. Yang, Y.; Xu, Y.; Rodriguez, D.A.; Michael, Y.; Zhang, H. Active Travel, Public Transportation Use, and Daily Transport among Older Adults: The Association of Built Environment. J. Transp. Health 2018, 9, 288–298. [Google Scholar] [CrossRef]
  7. Cheng, L.; Chen, X.; Yang, S.; Cao, Z.; De Vos, J.; Witlox, F. Active Travel for Active Ageing in China: The Role of Built Environment. J. Transp. Geogr. 2019, 76, 142–152. [Google Scholar] [CrossRef]
  8. Ekelund, U.; Tarp, J.; Fagerland, M.W.; Johannessen, J.S.; Hansen, B.H.; Jefferis, B.J.; Whincup, P.H.; Diaz, K.M.; Hooker, S.; Howard, V.J.; et al. Joint Associations of Accelerometer-Measured Physical Activity and Sedentary Time with All-Cause Mortality: A Harmonised Meta-Analysis in More than 44 000 Middle-Aged and Older Individuals. Br. J. Sports Med. 2020, 54, 1499–1506. [Google Scholar] [CrossRef]
  9. Rodríguez, D.A.; Evenson, K.R.; Diez Roux, A.V.; Brines, S.J. Land Use, Residential Density, and Walking: The Multi-Ethnic Study of Atherosclerosis. Am. J. Prev. Med. 2009, 37, 397–404. [Google Scholar] [CrossRef]
  10. Rao, A.; Nandineni, R.D.; Shetty, R.S.; Mallaiah, K.; Kamath, G.B. Enhancing Walkability for Older Adults: The Role of Government Policies and Urban Design. Infrastructures 2025, 10, 77. [Google Scholar] [CrossRef]
  11. Liu, Y.; Wang, X.; Liu, Y.; Li, Y.; Ma, X.; Jin, A.; Song, C.; Yao, Y. Using the Hierarchy of Active Travel Needs to Examine Associations between Streetscape Environments and Older Adults’ Active Travel in China. J. Transp. Health 2024, 38, 101834. [Google Scholar] [CrossRef]
  12. Moniruzzaman, M.; Páez, A. An Investigation of the Attributes of Walkable Environments from the Perspective of Seniors in Montreal. J. Transp. Geogr. 2016, 51, 85–96. [Google Scholar] [CrossRef]
  13. Han, H.; Yang, K.; Yang, C.; Yang, G.; Xu, L. Influence and Mechanism of a Multi-Scale Built Environment on the Leisure Activities of the Elderly: Evidence from Hefei City in China. Int. J. Environ. Res. Public Health 2022, 19, 9237. [Google Scholar] [CrossRef] [PubMed]
  14. Ewing, R.; Cervero, R. Travel and the Built Environment. J. Am. Plan. Assoc. 2010, 76, 265–294. [Google Scholar] [CrossRef]
  15. Yang, Y.; Sasaki, K.; Cheng, L.; Tao, S. Does the Built Environment Matter for Active Travel among Older Adults: Insights from Chiba City, Japan. J. Transp. Geogr. 2022, 101, 103338. [Google Scholar] [CrossRef]
  16. Yang, Y.; Sasaki, K.; Cheng, L.; Liu, X. Gender Differences in Active Travel among Older Adults: Non-Linear Built Environment Insights. Transp. Res. Part D Transp. Environ. 2022, 110, 103405. [Google Scholar] [CrossRef]
  17. Shigematsu, R.; Sallis, J.F.; Conway, T.L.; Saelens, B.E.; Frank, L.D.; Cain, K.L.; Chapman, J.E.; King, A.C. Age Differences in the Relation of Perceived Neighborhood Environment to Walking. Med. Sci. Sports Exerc. 2009, 41, 314–321. [Google Scholar] [CrossRef]
  18. Hérick de Sá, T.; Sudsataya, D.; Fry, A.; Salehi, N.; Katiki, A.; Mcleod, M.; Rathmell, G.; Cylus, J.; Lafortune, L.; Buffel, T.; et al. The Impact of Transport, Housing, and Urban Development Interventions on Older Adults’ Mobility: A Systematic Review of Experimental and Quasi-Experimental Studies. J. Transp. Health 2024, 38, 101859. [Google Scholar] [CrossRef]
  19. Zhang, F.; Li, D.; Ahrentzen, S.; Zhang, J. Assessing Spatial Disparities of Accessibility to Community-Based Service Resources for Chinese Older Adults Based on Travel Behavior: A City-Wide Study of Nanjing, China. Habitat. Int. 2019, 88, 101984. [Google Scholar] [CrossRef]
  20. Ewing, R.; Tian, G.; Goates, J.P.; Zhang, M.; Greenwald, M.J.; Joyce, A.; Kircher, J.; Greene, W. Varying Influences of the Built Environment on Household Travel in 15 Diverse Regions of the United States. Urban Stud. 2015, 52, 2330–2348. [Google Scholar] [CrossRef]
  21. Ding, C.; Cao, X.; Yu, B.; Ju, Y. Non-Linear Associations between Zonal Built Environment Attributes and Transit Commuting Mode Choice Accounting for Spatial Heterogeneity. Transp. Res. Part A Policy Pract. 2021, 148, 22–35. [Google Scholar] [CrossRef]
  22. Guo, L.; Yang, S.; Peng, Y.; Yuan, M. Examining the Nonlinear Effects of Residential and Workplace-Built Environments on Active Travel in Short-Distance: A Random Forest Approach. Int. J. Environ. Res. Public Health 2023, 20, 1969. [Google Scholar] [CrossRef] [PubMed]
  23. Wu, J.; Zhao, C.; Li, C.; Wang, T.; Wang, L.; Zhang, Y. Non-Linear Relationships Between the Built Environment and Walking Frequency Among Older Adults in Zhongshan, China. Front. Public Health 2021, 9, 686144. [Google Scholar] [CrossRef] [PubMed]
  24. Meredith, S.J.; Cox, N.J.; Ibrahim, K.; Higson, J.; McNiff, J.; Mitchell, S.; Rutherford, M.; Wijayendran, A.; Shenkin, S.D.; Kilgour, A.H.M.; et al. Factors That Influence Older Adults’ Participation in Physical Activity: A Systematic Review of Qualitative Studies. Age Ageing 2023, 52, afad145. [Google Scholar] [CrossRef] [PubMed]
  25. Kemperman, A.D.A.M.; Timmermans, H.J.P. Influences of Built Environment on Walking and Cycling by Latent Segments of Aging Population. Transp. Res. Rec. 2009, 2134, 1–9. [Google Scholar] [CrossRef]
  26. Xiao, Y.; Miao, S.; Zhang, Y.; Xie, B.; Wu, W. Exploring the Associations between Neighborhood Greenness and Level of Physical Activity of Older Adults in Shanghai. J. Transp. Health 2022, 24, 101312. [Google Scholar] [CrossRef]
  27. Yang, Y.; He, D.; Gou, Z.; Wang, R.; Liu, Y.; Lu, Y. Association between Street Greenery and Walking Behavior in Older Adults in Hong Kong. Sustain. Cities Soc. 2019, 51, 101747. [Google Scholar] [CrossRef]
  28. He, H.; Zhou, L.; Yang, S.; Guo, L. Why Choose Active Travel over Driving? Investigating the Impact of the Streetscape and Land Use on Active Travel in Short Journeys. J. Transp. Geogr. 2024, 118, 103939. [Google Scholar] [CrossRef]
  29. Yang, S.; Guo, Y.; Zhou, L.; Chen, J.; Guo, L. Does the First/Last-Mile Design Matter for Transit Commuting Compared to Land Use? Transp. Res. Part D Transp. Environ. 2025, 146, 104889. [Google Scholar] [CrossRef]
  30. Ma, L.; Dill, J. Associations between the Objective and Perceived Built Environment and Bicycling for Transportation. J. Transp. Health 2015, 2, 248–255. [Google Scholar] [CrossRef]
  31. Jordan, M.I.; Mitchell, T.M. Machine Learning: Trends, Perspectives, and Prospects. Science 2015, 349, 255–260. [Google Scholar] [CrossRef] [PubMed]
  32. Pisoni, E.; Christidis, P.; Navajas Cawood, E. Active Mobility versus Motorized Transport? User Choices and Benefits for the Society. Sci. Total Environ. 2022, 806, 150627. [Google Scholar] [CrossRef]
  33. Xu, N.; Nie, Q.; Liu, J.; Jones, S. Post-Pandemic Shared Mobility and Active Travel in Alabama: A Machine Learning Analysis of COVID-19 Survey Data. Travel. Behav. Soc. 2023, 32, 100584. [Google Scholar] [CrossRef] [PubMed]
  34. Guo, C.; Jiang, Y.; Qiao, R.; Zhao, J.; Weng, J.; Chen, Y. The Nonlinear Relationship between the Active Travel Behavior of Older Adults and Built Environments: A Comparison between an Inner-City Area and a Suburban Area. Sustain. Cities Soc. 2023, 99, 104961. [Google Scholar] [CrossRef]
  35. Fotheringham, A.S.; Wong, D.W.S. The Modifiable Areal Unit Problem in Multivariate Statistical Analysis. Environ. Plan. A 1991, 23, 1025–1044. [Google Scholar] [CrossRef]
  36. Gehrke, S.R.; Wang, L. Operationalizing the Neighborhood Effects of the Built Environment on Travel Behavior. J. Transp. Geogr. 2020, 82, 102561. [Google Scholar] [CrossRef]
  37. Guo, J.Y.; Bhat, C.R. Operationalizing the Concept of Neighborhood: Application to Residential Location Choice Analysis. J. Transp. Geogr. 2007, 15, 31–45. [Google Scholar] [CrossRef]
  38. Mitra, R.; Buliung, R.N. Built Environment Correlates of Active School Transportation: Neighborhood and the Modifiable Areal Unit Problem. J. Transp. Geogr. 2012, 20, 51–61. [Google Scholar] [CrossRef]
  39. Zhang, M.; Kukadia, N. Metrics of Urban Form and the Modifiable Areal Unit Problem. Transp. Res. Rec. J. Transp. Res. Board 2005, 1902, 71–79. [Google Scholar] [CrossRef]
  40. Clark, A.; Scott, D. Understanding the Impact of the Modifiable Areal Unit Problem on the Relationship between Active Travel and the Built Environment. Urban Stud. 2014, 51, 284–299. [Google Scholar] [CrossRef]
  41. Liu, X.; Chen, X.; Tian, M.; De Vos, J. Effects of Buffer Size on Associations between the Built Environment and Metro Ridership: A Machine Learning-Based Sensitive Analysis. J. Transp. Geogr. 2023, 113, 103730. [Google Scholar] [CrossRef]
  42. Laviolette, J.; Morency, C.; Waygood, E.O.D. A Kilometer or a Mile? Does Buffer Size Matter When It Comes to Car Ownership? J. Transp. Geogr. 2022, 104, 103456. [Google Scholar] [CrossRef]
  43. Jia, Q.; Zhang, T.; Cheng, L.; Cheng, G.; Jin, M. The Impact of the Neighborhood Built Environment on the Walking Activity of Older Adults: A Multi-Scale Spatial Heterogeneity Analysis. Sustainability 2022, 14, 13927. [Google Scholar] [CrossRef]
  44. Yang, S.; Zhou, L.; Liu, C.; Sun, S.; Guo, L.; Sun, X. Examining Multiscale Built Environment Interventions to Mitigate Travel-Related Carbon Emissions. J. Transp. Geogr. 2024, 119, 103942. [Google Scholar] [CrossRef]
  45. GB50137-2011; Code for Classification of Urban Land Use and Planning Standards of Development Land. Ministry of Housing and Urban-Rural Development of the People’s Republic of China: Beijing, China, 2011.
  46. Yang, S.; Zhou, L.; Zhang, Z.; Sun, S.; Guo, L. Examining the Correlation of Household Electric Vehicle Ownership: Insights for Emerging Mobility and Planning. J. Transp. Geogr. 2024, 118, 103937. [Google Scholar] [CrossRef]
  47. Chen, T.; Guestrin, C. XGBoost: A Scalable Tree Boosting System. Available online: https://arxiv.org/abs/1603.02754v3 (accessed on 14 November 2025).
  48. Friedman, J.H. Greedy Function Approximation: A Gradient Boosting Machine. Ann. Stat. 2001, 29, 1189–1232. [Google Scholar] [CrossRef]
  49. Tao, T.; Cao, J. Exploring Nonlinear and Collective Influences of Regional and Local Built Environment Characteristics on Travel Distances by Mode. J. Transp. Geogr. 2023, 109, 103599. [Google Scholar] [CrossRef]
  50. Sun, S.; Guo, L.; Yang, S.; Cao, J. Exploring the Contributions of Ebike Ownership, Transit Access, and the Built Environment to Car Ownership in a Developing City. J. Transp. Geogr. 2024, 116, 103834. [Google Scholar] [CrossRef]
  51. Cheng, L.; Shi, K.; De Vos, J.; Cao, M.; Witlox, F. Examining the Spatially Heterogeneous Effects of the Built Environment on Walking among Older Adults. Transp. Policy 2021, 100, 21–30. [Google Scholar] [CrossRef]
  52. Zhang, Z.; Tang, X.; Shen, Z.; Yang, L. Built-Environment Determinants of Active Travel Behavior of Older Adults in Xiamen, China. Int. Rev. Spat. Plan. Sustain. Dev. 2022, 10, 130–145. [Google Scholar] [CrossRef]
  53. Nguyen, L.M.; Mertens, L. Psychosocial and Social Environmental Factors as Moderators in the Relation between the Objective Environment and Older Adults’ Active Transport. Int. J. Environ. Res. Public Health 2021, 18, 2647. [Google Scholar] [CrossRef]
  54. Mouratidis, K.; De Vos, J.; Yiannakou, A.; Politis, I. Sustainable Transport Modes, Travel Satisfaction, and Emotions: Evidence from Car-Dependent Compact Cities. Travel. Behav. Soc. 2023, 33, 100613. [Google Scholar] [CrossRef]
  55. Perchoux, C.; Brondeel, R.; Wasfi, R.; Klein, O.; Caruso, G.; Vallée, J.; Klein, S.; Thierry, B.; Dijst, M.; Chaix, B.; et al. Walking, Trip Purpose, and Exposure to Multiple Environments: A Case Study of Older Adults in Luxembourg. J. Transp. Health 2019, 13, 170–184. [Google Scholar] [CrossRef]
  56. Lo, A.W.-T.; Mitra, S.K. A Tale of Two Aging Nations: How Do Urban Designs Impact Older Adults’ Mobility in Automobile versus Transit Societies? Travel. Behav. Soc. 2025, 39, 100961. [Google Scholar] [CrossRef]
  57. Kwan, M.-P. The Uncertain Geographic Context Problem. In Geographies of Health, Disease and Well-Being; Routledge: Oxfordshire, UK, 2014. [Google Scholar]
  58. Weng, M.; Ding, N.; Li, J.; Jin, X.; Xiao, H.; He, Z.; Su, S. The 15-Minute Walkable Neighborhoods: Measurement, Social Inequalities and Implications for Building Healthy Communities in Urban China. J. Transp. Health 2019, 13, 259–273. [Google Scholar] [CrossRef]
Figure 1. Schematic diagram of different geographic statistical units. (a) Network-based buffer. (b) Euclidean-based buffer.
Ijgi 15 00109 g001
Figure 2. Study scope and sample distribution.
Ijgi 15 00109 g002
Figure 3. Statistics on travel destinations of the elderly.
Ijgi 15 00109 g003
Figure 4. Street view image processing.
Ijgi 15 00109 g004
Figure 5. Model construction schematic.
Ijgi 15 00109 g005
Figure 6. BE variable RI heatmap.
Ijgi 15 00109 g006
Figure 7. The relationships of macro-level BE attributes with older adults’ AT. Blue, green, and red represent the 5-min, 10-min, and 15-min walking ranges, respectively. (a) Population density (persons/km2). (b) LUM. (c) Intersection density (intersections/km2). (d) Public transport density (stations/km2). (e) Distance to city center (km). (f) Distance to nearest sub-center (km). (g) Service facility density (facilities/km2). (h) Service facility ANN.
Ijgi 15 00109 g007
Figure 8. The relationships of micro-level BE attributes with older adults’ AT. Blue, green, and red represent the 5-min, 10-min, and 15-min walking ranges, respectively. (a) SW (%). (b) GVI (%). (c) SO (%). (d) SE (%).
Ijgi 15 00109 g008
Figure 9. The relationships of socio-economic attributes with older adults’ AT. Blue, green, and red represent the 5-min, 10-min, and 15-min walking ranges, respectively. (a) Age. (b) Car ownership. (c) Education. (d) Household size (persons). (e) Income (1000 RMB). (f) Gender.
Ijgi 15 00109 g009
Table 1. Description of micro-level BE indicators.
Indicator NameFormulaDescription
Street Walkable Space Ratio (SW) S W i = k = 1 n j = 1 4 s w j k j = 1 4 ( s w j k + c j k + d j k ) n S W i :   street   walkability   index   in   unit   i ;   s w ,   c ,   d :   pixels   of   sidewalk ,   cars ,   and   roads ;   and   n : number of sampling points.
Street Obstacle Ratio (SO) S O i = k = 1 n j = 1 4 ( w j k + f j k + p j k ) 4 n S O i :   street   obstruction   index ;   w ,   f ,   p : pixels of walls, fences, and poles.
Street Green View Index (GVI) G V I i = k = 1 n j = 1 4 g j k 4 n G V I i :   green   view   index ;   g : pixels of vegetation.
Street Enclosure (SE) S E i = k = 1 n j = 1 4 b j k j = 1 4 ( s w j k + c j k + d j k ) n S E i :   street   enclosure   index ;   b : pixels of buildings.
Table 2. Variable description and descriptive statistics in 5, 10, 15 min network buffers.
VariableDescriptionMin.Max.Mean.Std.
Dependent Variable
Older Adults’ Travel ChoiceRespondent’s daily choice of AT mode. No = 0; Yes = 1010.750.43
Independent Variable
Socio-economic Attributes
AgeRespondent’s age609065.344.43
Gender1 = male; 0 = female010.530.5
Education Level1 = primary or below; 2 = junior high; 3 = senior high; 4 = college or above142.380.77
Household SizeNumber of family members172.591.17
IncomeAnnual household income level: 1 ≤ ¥50 k, 2 = ¥50–100 k, 3 = ¥100–250 k, 4 = ¥250–400 k, 5 = ¥400–550 k, 6 = ¥550–700 k, 7 ≥ ¥700 k172.310.93
Car OwnershipWhether the household owns a car (1 = Yes, 0 = No)010.240.43
Macro-level BE Factors
Population Density5 minNumber of residents per square kilometer within the buffer (persons/km2)0148,259.6238,053.1225,724.46
10 min0102,568.0635,994.5922,602.37
15 min089,213.4434,457.6720,993.62
Intersection Density5 minNumber of street intersections per square kilometer within the buffer (intersections/km2)012026.9320.34
10 min086.5425.5914.92
15 min2.5869.5323.7912.44
Public Transport Density5 minNumber of public transport stops per square kilometer within the buffer (stations/km2)063.1612.5813.33
10 min034.6812.36.76
15 min026.4611.644.73
LUM5 minLand use diversity measured by entropy index (0–1), calculated based on 9 land use types00.840.480.16
10 min00.860.580.12
15 min0.110.850.630.09
Distance to City CenterEuclidean distance from residence to Hankou CBD (km)0.1118.354.893.06
Distance to Nearest Sub-centerEuclidean distance from residence to the nearest of 5 identified urban sub-centers (km)0.188.913.721.62
Service Facility Density5 minDensity of five key service facilities per square kilometer within the buffer01824395.7299.33
10 min01100.83350.06210.01
15 min01025.98321.66184.88
Service Facility ANN5 minAverage Nearest Neighbor index measuring spatial distribution pattern of service facilities (<1 = clustered, ≥1 = dispersed)02.620.540.28
10 min01.80.50.14
15 min01.40.480.1
Micro-level BE Factors
SW5 minRatio of sidewalk area to total street area within the buffer, derived from street view image analysis00.420.180.07
10 min0.050.370.180.05
15 min0.080.310.180.04
SO5 minProportion of obstructive elements (walls, fences, and poles) in street view images within the buffer00.340.050.03
10 min0.010.220.050.02
15 min0.020.160.050.02
GVI5 minProportion of vegetation pixels in street view images within the buffer00.630.270.11
10 min0.020.610.260.08
15 min0.090.540.260.07
SE5 minRatio of building facade area to street area within the buffer, derived from street view image analysis07.251.960.98
10 min0.364.681.930.7
15 min0.594.061.940.61
Table 3. Descriptive statistics of BE variables in 240 m, 480 m, and 720 m circular buffers.
VariableMin.Max.Mean.Std.
Macro-level BE Factors
Population Density240 m0134,412.2437,117.1324,696.95
480 m096,697.5733,979.3321,091.73
720 m5.3290,433.5431,958.619,217.78
Intersection Density240 m0110.5822.5516.55
480 m07621.4813.24
720 m1.2364.4820.2511.05
Public Transport Density240 m049.7611.289.08
480 m029.0210.595
720 m022.7210.144.01
LUM240 m00.850.520.13
480 m0.080.860.610.1
720 m0.090.870.650.09
Service Facility Density240 m01631.11366.78255.48
480 m01130.36318.14194.7
720 m3.07922.39292.05172.98
Service Facility ANN240 m02.550.520.2
480 m01.810.480.11
720 m0.180.730.460.07
Micro-level BE Factors
SW240 m0.410.380.180.06
480 m0.070.310.180.04
720 m0.090.290.180.03
SO240 m0.010.340.050.03
480 m0.020.170.050.02
720 m0.020.170.050.02
GVI240 m0.020.620.270.09
480 m0.080.540.260.07
720 m0.090.560.260.06
SE240 m0.327.771.980.86
480 m0.544.661.960.66
720 m0.663.711.940.56
Table 4. Model parameters and performance results.
Model *ParametersRandom CV AUCSpatial CV AUCMoran’s I
Learning_RateMax_Depthn_EstimatorsReg_Alpha Z-Scorep-Value
Model 1 WT = 5 min0.0017325070.740.710.082.420.015
Model 2 WT = 10 min0.0015620080.790.770.061.870.061
Model 3 WT = 15 min0.0015610010.810.800.041.300.193
Model 4 R = 240 m0.0013995060.690.630.123.65<0.001
Model 5 R = 480 m0.0015310010.750.710.092.750.006
Model 6 R = 720 m0.0013825000.770.740.072.120.034
* WT = network buffer; R = circular buffer.
Table 5. The RI of independent variables in predicting older adults’ AT.
VariableModel 1
WT = 5 min
Model 2
WT = 10 min
Model 3
WT = 15 min
Model 4
R = 240 m
Model 5
R = 480 m
Model 6
R = 720 m
RIRankRIRankRIRankRIRankRIRankRIRank
Socio-economic Attributes33.82% 30.09% 28.05% 25.99% 27.17% 27.51%
Age10.55%29.92%310.48%18.86%510.09%39.71%3
Gender11.57%110.48%19.54%310.15%210.16%19.87%2
Education7.46%75.17%94.17%153.81%123.64%144.87%10
Household Size2.51%153.35%132.73%161.95%141.78%162.39%16
Income1.25%170.70%170.69%170.69%171.14%170.56%17
Car Ownership0.48%180.47%180.44%180.53%180.36%180.11%18
Macro-level BE Factors42.82% 47.99% 51.50% 43.15% 51.09% 51%
Population Density2.38%164.26%116.38%61.76%162.88%153.58%15
Intersection Density3.30%122.65%164.54%131.85%156.10%74.36%12
Public Transport Density3.01%133.23%146.10%82.82%137.61%610.03%1
LUM5.72%83.65%127.30%45.35%107.66%56.17%8
Distance to City Center9.43%38.71%56.79%510.12%38.92%48.34%5
Distance to Nearest Sub-center8.09%45.53%84.96%115.63%93.74%135.65%9
Service Facility Density5.27%1110.45%29.65%29.18%410.12%24.24%13
Service Facility ANN5.62%99.51%45.78%96.44%74.16%128.63%4
Micro-level BE Factors23.36% 21.92% 20.45% 30.84% 21.69% 21.49%
SW2.82%142.94%155.17%105.21%115.00%116.78%6
SO5.57%106.81%74.85%128.54%65.39%106.37%7
GVI7.49%54.99%106.18%75.99%85.75%83.83%14
SE7.48%67.18%64.25%1411.10%15.55%94.51%11
Disclaimer/Publisher’s Note: The statements, opinions and data contained in all publications are solely those of the individual author(s) and contributor(s) and not of MDPI and/or the editor(s). MDPI and/or the editor(s) disclaim responsibility for any injury to people or property resulting from any ideas, methods, instructions or products referred to in the content.