Article

Enhancing Ecosystem Service Value Through Land Use Optimization: A Multi-Objective Particle Swarm Optimization (PSO) Approach in Wuhan, China


1
Land Consolidation and Rehabilitation Center, Ministry of Natural Resources, Beijing 100035, China
2
School of Resource and Environment Sciences, Wuhan University, Wuhan 430079, China
3
School of Architecture, Soochow University, Suzhou 215031, China
4
Research Center for Eco-Environmental Sciences, Chinese Academy of Sciences, Beijing 100085, China
5
College of Geography and Planning, Chengdu University of Technology, Chengdu 610059, China
6
Key Laboratory of Digital Cartography and Land Information Application Engineering, Ministry of Natural Resources, Wuhan 430079, China
7
Hubei Luojia Laboratory, Wuhan University, Wuhan 430079, China
*
Author to whom correspondence should be addressed.
ISPRS Int. J. Geo-Inf. 2026, 15(3), 103; https://doi.org/10.3390/ijgi15030103
Submission received: 21 November 2025 / Revised: 9 February 2026 / Accepted: 25 February 2026 / Published: 1 March 2026
(This article belongs to the Topic Spatial Decision Support Systems for Urban Sustainability)

Abstract

Integrating ecosystem service value (ESV) into land use optimization is crucial for achieving sustainable development goals. Unlike traditional “post-evaluation” approaches that assess ESV after generating land use plans, this study pioneers a “goal-oriented” method by embedding ESV as an objective to guide land use optimization. A multi-objective particle swarm optimization (PSO) framework, which incorporates ESV with land quantity error, spatial aggregation of farmland and construction land, and economic benefits, was constructed for the research study. Applied to Wuhan, China, for the periods of 2005–2015 and 2010–2020, the results demonstrate the feasibility of the proposed framework in: (1) reducing construction land area while increasing farmland and ecological land; (2) spatially aggregating construction land towards urban functional areas while protecting farmland and ecological land in peri-urban and outer suburban areas; (3) improving spatial aggregation of farmland, construction land, and ecological land; and (4) slightly increasing ESV, particularly in peri-urban and outer suburban areas. The proposed PSO framework provides a valuable tool for optimizing land use layout, enhancing ecosystem service provision, and promoting balanced socio-ecological development.

1. Introduction

Rapid urbanization and resource exploitation over the past few decades have significantly impacted natural ecosystems, posing challenges to human well-being and sustainable development [1,2,3]. The United Nations’ Sustainable Development Goals (SDGs), particularly SDG 11 (inclusive and sustainable urban development) and SDG 15 (integrating ecosystem and biodiversity values into planning and development), emphasize the need for a harmonious balance between social, economic, and environmental objectives [4]. Achieving these goals requires effective land use planning that integrates ecological benefits to support decision-making [5,6,7].
Ecosystem services (ES) are the direct and indirect contributions of ecosystems to human well-being, encompassing provisioning, regulating, supporting, and cultural services [8]. The availability of ES is fundamentally linked to different types of land use [9,10,11,12]. However, land use changes have led to significant losses in Ecosystem Service Value (ESV) globally. Between 1995 and 2015, the depletion of forest and wetland/water ecosystems led to an estimated net loss of USD 1.21 trillion in ESV globally [13]. Therefore, it is necessary and feasible to address ESV concerns from the perspective of land use planning.
Current approaches to integrating ESV with land use planning can be categorized into two main methods: (1) “post-evaluation”, which evaluates ESV after generating land layout schemes, and (2) “goal-oriented”, which directly embeds ESV objectives to directly guide land layout optimization. Existing studies predominantly adopt the former approach. For example, Peng et al. [14] combined Random Forest and CLUE-S models to predict land use under various scenarios and assessed ESV to inform decision-making. Tonyaloğlu [15] employed the PLUS model to simulate land use changes and evaluated their impact on ES, demonstrating how ES-focused land management enhances both economic and ecological outcomes. However, this approach has limitations in integrating ESV indicators to directly guide the land use optimization process. To address this deficiency, studies have begun to develop “goal-oriented” approaches. For instance, Li et al. [16] developed a two-step spatial optimization method to determine land allocation that maximizes ES: first, determining the land quantity structure corresponding to the maximum ESV, and second, spatially allocating the optimized land use structure. Geissler et al. [17] developed a multi-objective mixed-integer quadratically constrained programming (MIQCP) model to design farmland, incorporating objectives of profit, biodiversity, greenhouse gas emissions, and water quality to optimize crop planting locations. Despite these advancements, the “goal-oriented” approach remains underexplored, particularly in balancing ecological, economic, and social objectives.
Constructing an appropriate optimization framework is essential in ESV-oriented land use optimization. Previous studies have developed various models, such as CA, CLUE-S, FLUS, and PLUS [18,19,20,21,22]. However, these models are more appropriate in the “post-evaluation” approach rather than the “goal-oriented” approach. In contrast, particle swarm optimization (PSO) has an advantage in “goal-oriented” land use optimization due to its intrinsic logic as well as its computational efficiency, global search capabilities, and ease of implementation [23,24,25]. It has been successfully applied to multi-objective land use optimization [26,27]. For example, Mirghaed et al. [28] employed the PSO algorithm to refine land spatial allocation, targeting a multiple-objective optimization of land suitability, water yield, and habitat quality. Similarly, Li et al. [29] optimized land use layout by PSO to pursue the coordinated development of carbon emissions and GDP. However, most studies focus on objectives such as land suitability, economic benefits, carbon emissions, and a few ecosystem services. Few studies have systematically and comprehensively incorporated multiple dimensions of ESV into a unified optimization framework to examine how ESV objectives can guide land-use configuration.
In this regard, this study aims to develop a PSO-based framework to integrate multiple dimensions of ESV as a core objective of land use optimization. Specific steps are as follows: (1) A PSO-based optimization framework was constructed, taking land quantity error, land spatial aggregation, economic benefits, and ESV as the fitness functions. (2) Taking Wuhan city as an example, land use patterns were simulated and optimized. (3) The effectiveness of the proposed framework was evaluated by comparing the landscape pattern indices and ESV of land use patterns before and after running the model.

2. Methodology

2.1. Study Area

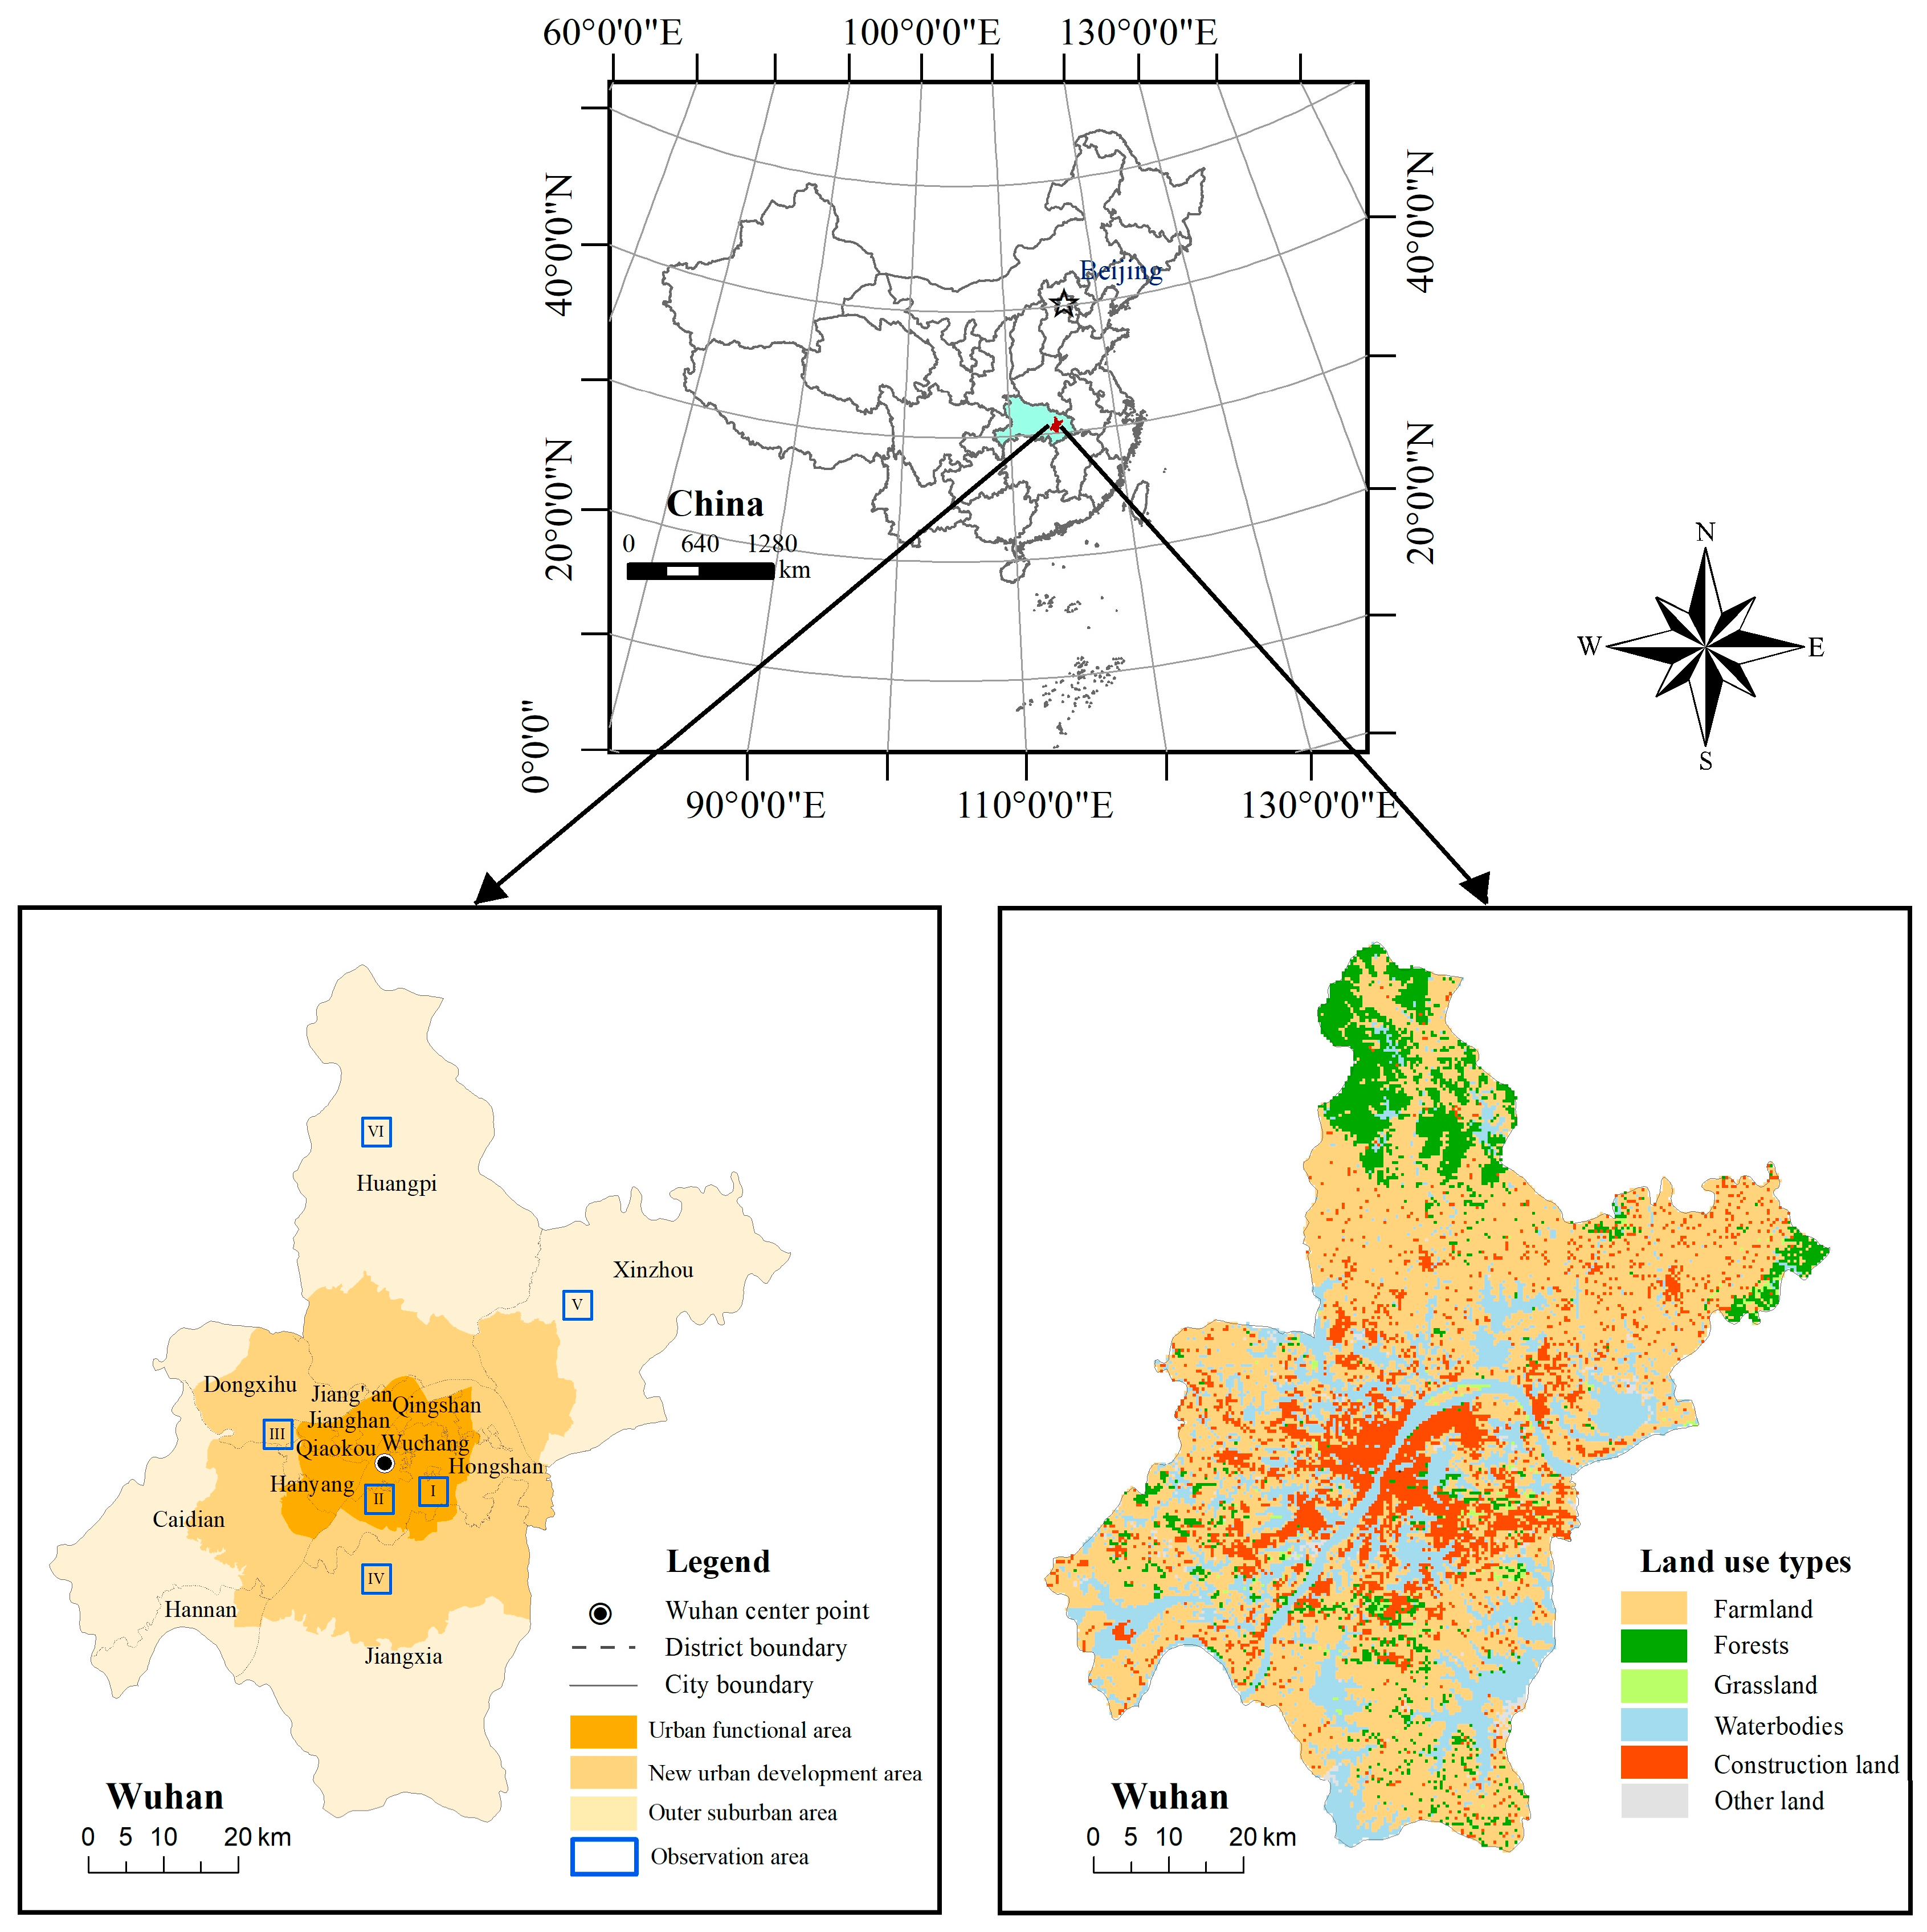
Wuhan, with a location between 29°58′–31°22′ N and 113°41′–115°05′ E, is the capital of Hubei Province in central China, with an area of approximately 8569.15 km2 (Figure 1). In 2022, the population of Wuhan reached 13.74 million, with an urbanization rate of 84.66% [30]. Forests, water, and wetlands account for nearly 50% of the city’s area, providing important environmental functions [2,14]. However, in recent years, the large-scale expansion of urban and construction land has led to the occupation and destruction of substantial natural ecological space. Among these spaces, the area of lakes in Wuhan’s main urban area has shrunk by nearly 60% compared with the 1980s [31]. Therefore, optimizing land use layout, protecting natural ecological spaces, and rationally guiding land development are crucial to maintaining the integrity and stability of Wuhan’s ecosystem.
Wuhan could be categorized into three spatial zones according to its urban–rural gradient, namely urban functional areas, new urban development areas, and outer suburban areas, in the Wuhan Territorial Spatial Planning (2021–2035) framework. Urban functional areas represent the high-density urban core, where human disturbance on the ecosystem is severe. New urban development areas represent the areas transforming from rural to urban areas, where intense conflicts between the urban system and the natural ecosystem arise. Outer suburban areas represent the outer suburbs, characterized by extensive farmland and ecological resources, which are not intensively disturbed by human activities. We selected two key observation areas in each urban functional area for observation and exploration. Specifically, area I and area II are located within the urban functional area, area III and area IV are situated in the new urban development area, and area V and area VI are in the outer suburban area. Basic information on these six observation areas is summarized in Table 1.

2.2. Data Sources

Multisource and heterogeneous data were collected to conduct this research. Specifically, (1) digital elevation model data (DEM) in raster format with a resolution of 30 m × 30 m were provided by the Geospatial Data Cloud (https://www.gscloud.cn). (2) Wuhan administrative district data were obtained from the Resource and Environmental Science Data Platform (https://www.resdc.cn). (3) Population density spatial data, with a spatial resolution of 1 km × 1 km, were provided by the Joint Research Centre (https://human-settlement.emergency.copernicus.eu). (4) Building distribution data, which includes urban building footprint outlines, were obtained from the Resource and Environmental Science Data Platform (https://www.resdc.cn). (5) The road network, including highways, national roads, provincial roads, and urban major roads, was provided by the Wuhan Planning and Design Institute. (6) Land use/land cover (LULC) data from 2005, 2010, 2015, and 2020, with classification of farmland, forests, grassland, water, construction land, and other land, were downloaded from the Chinese Academy of Sciences Resource and Environmental Sciences Data Platform (https://www.resdc.cn), representing spatial information on both the type and extent of human land utilization and natural surface coverage. (7) Point of Interests (POI) data, including commercial centers and bus stops, were obtained through the Application Programming Interface of the Gaode map (https://lbs.amap.com). (8) The basic farmland data was sourced from the Wuhan Urban Planning Research Institute. All data were projected on a CGCS2000_3_Degree_GK_CM_114E geographic coordinate system and resampled to a 500 m grid for modeling. The 500 m resolution was selected as a compromise between capturing spatial heterogeneity and maintaining computational feasibility for large-scale, multi-objective PSO runs; preliminary tests showed that a 100 m resolution substantially increased runtime without proportionate gains in large-scale pattern metrics.

2.3. Method Design

2.3.1. Methodology Flowchart

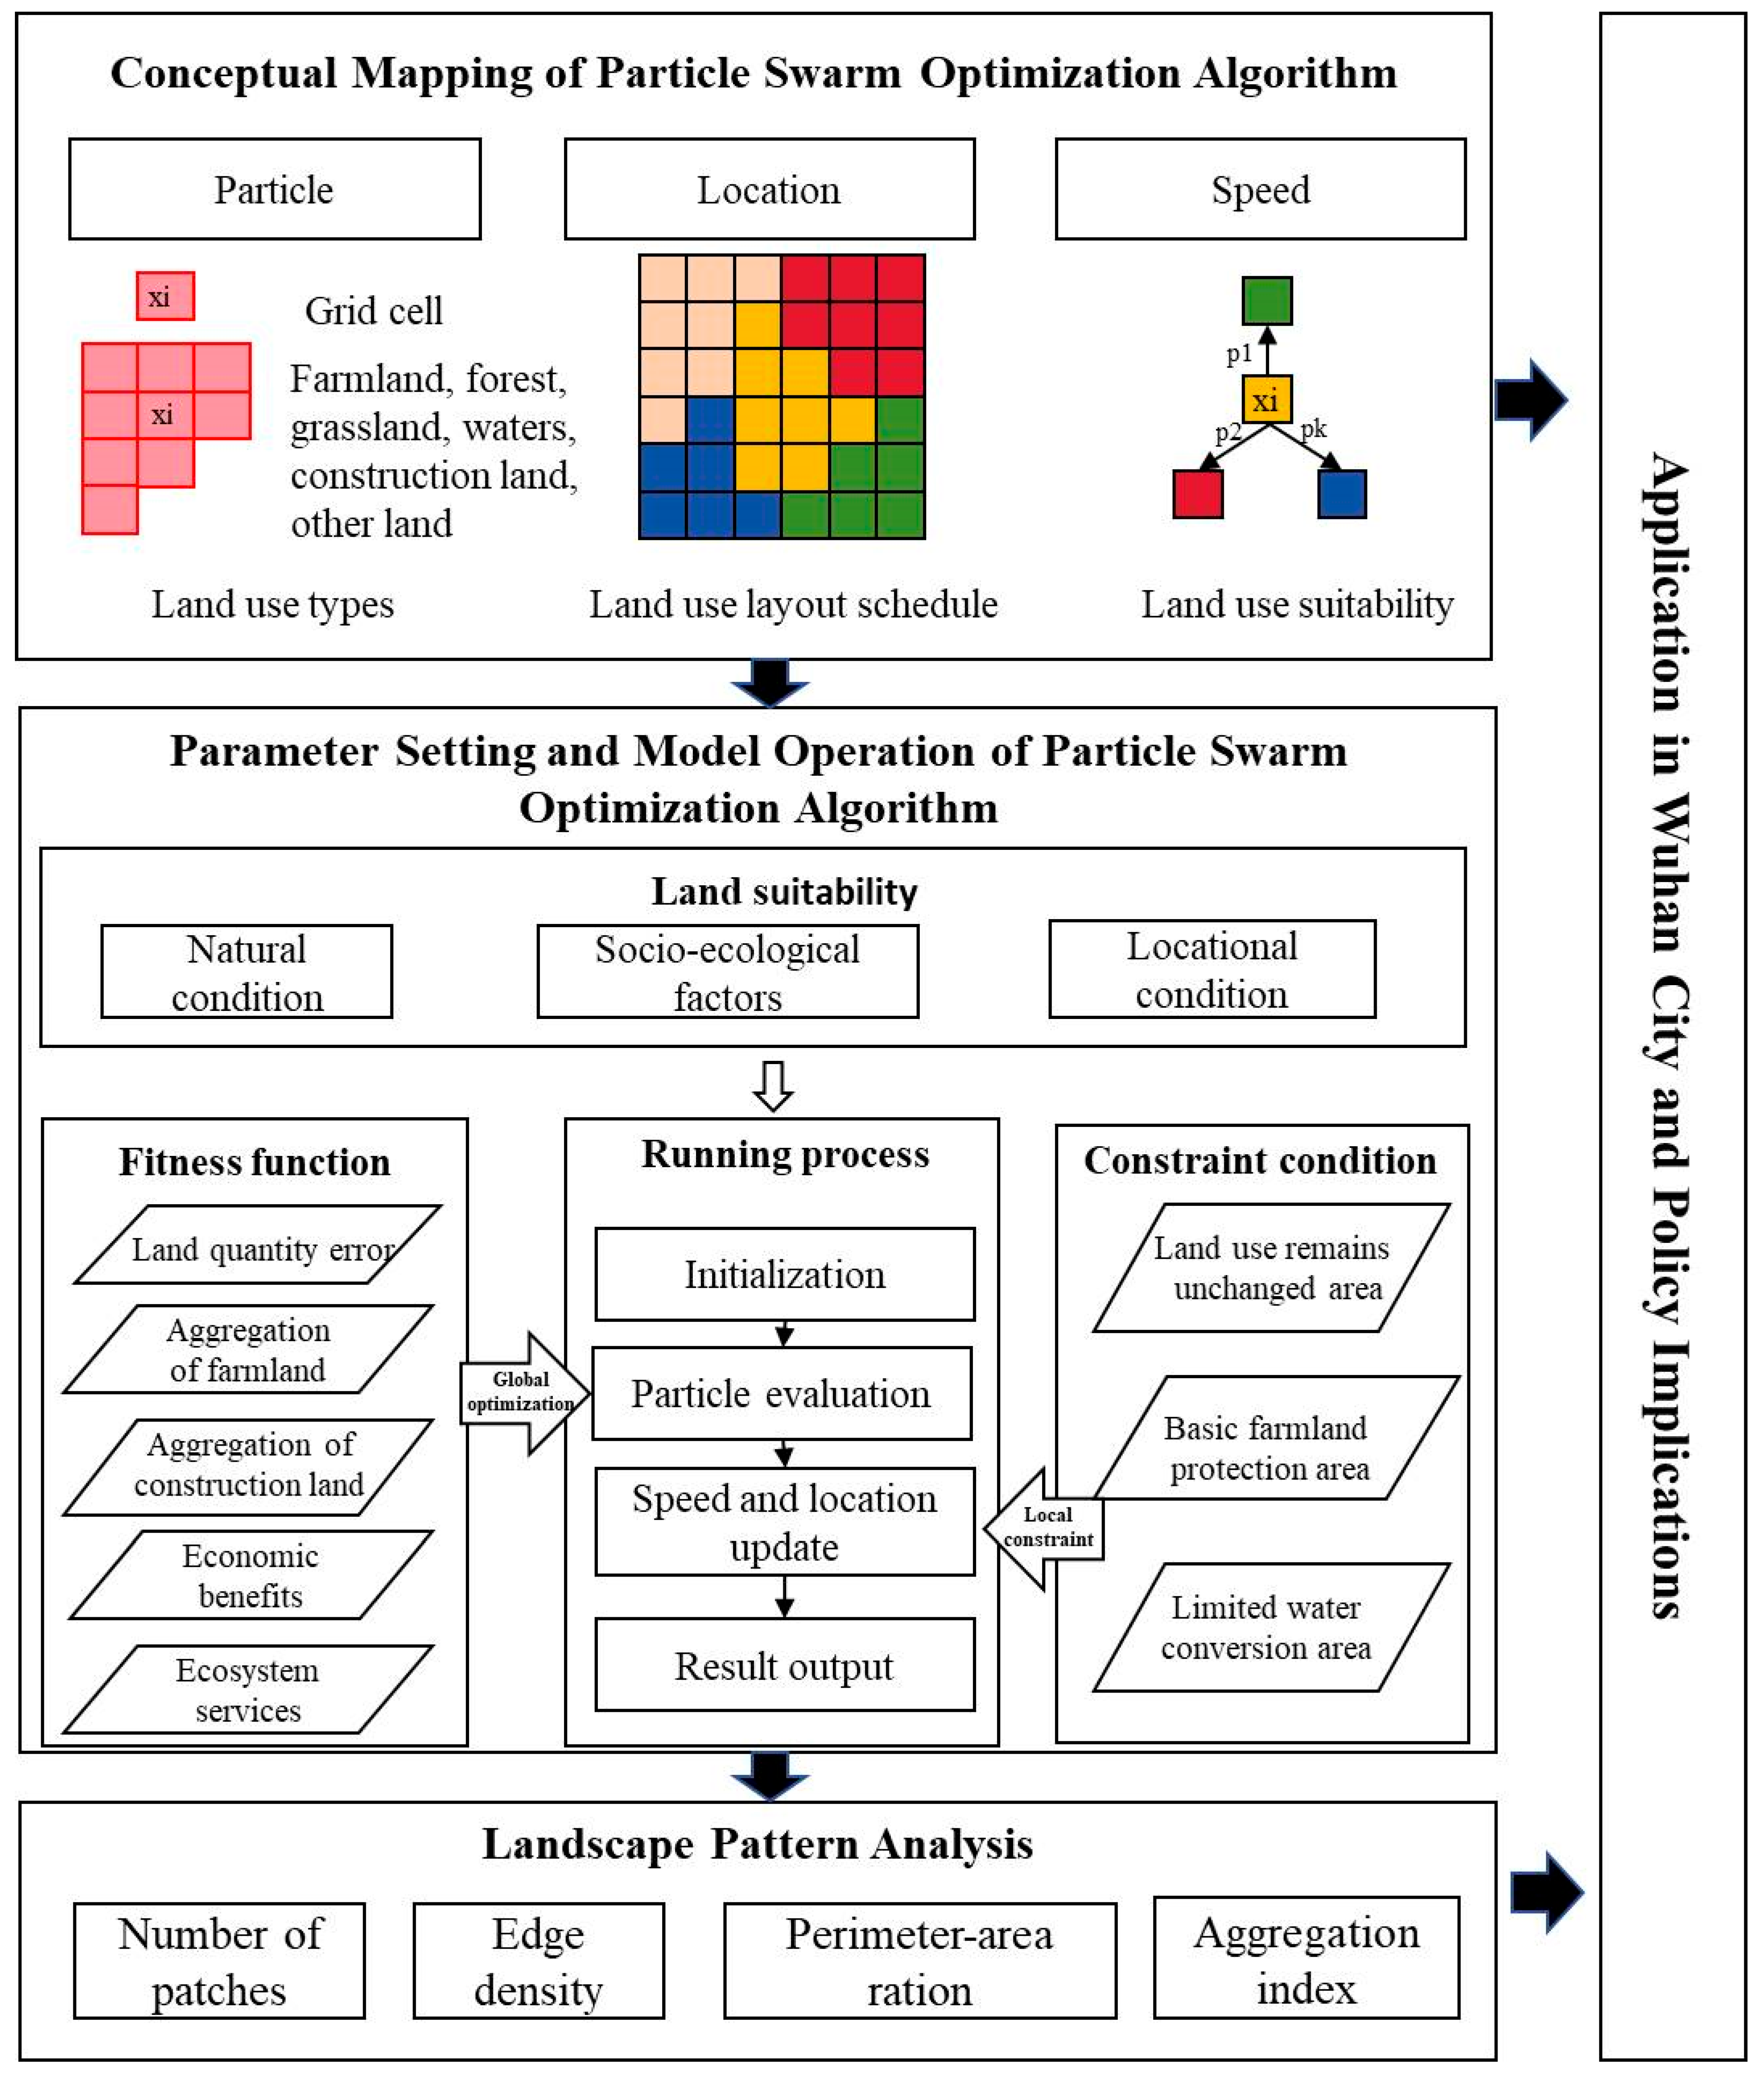
This study conducted land use optimization with the objective of enhancing ESV, following the following steps. First, a PSO-based optimization framework was constructed with the key steps of calculating land use suitability, setting fitness functions and constraint conditions, and determining model parameters. The land quantity error, the concentration of construction land and cultivated land, economic benefits, and ESV were utilized as the fitness function of the model to guide the land layout optimization. Second, with Wuhan selected as the study area, the framework was used to generate optimized land-use layouts from 2005 to 2015 and from 2010 to 2020, respectively. Third, the effectiveness of the proposed framework was evaluated by comparing the changes in land use layouts, landscape pattern indices, and ESV before and after running the model. A flowchart of the proposed framework is depicted in Figure 2.

2.3.2. Particle Swarm Optimization Algorithm

The PSO algorithm, proposed by Eberhart and Kennedy [32], is a population-based intelligent optimization algorithm. By simulating the flocking and migration behaviors of birds during foraging, individuals are modeled as massless, volumeless particles in flight. Based on collaboration and competition among individuals, each particle adjusts its velocity during flight according to its own experience and the collective experience of the swarm, continuously updating its velocity and position to converge toward the optimal solution in complex search spaces. The model holds biological significance, requires few parameters, and demonstrates strong simulation capabilities for solving nonlinear problems.
The position of a particle represents its state during a particular iteration process and can be expressed as an n-dimensional vector X i = ( x 1 , x 2 , x 3 , , x n ) , where n depends on the total number of spatial units (grid cells) in the study area. Each component of the position corresponds to the land use type value at a land use unit in the respective dimension. The velocity of a particle includes both the direction and speed of its flight. Each dimension of the particle has an independent velocity, representing the direction of land use type conversion for the corresponding land use unit. This can be represented by an n-dimensional vector V i ( t ) = ( V 1 ( t ) , V 2 ( t ) , V 3 ( t ) , , V n ( t ) ) , where n depends on the number of land use types defined in the study area. Each velocity component represents the probability of land use conversion for the corresponding land use unit. In this study, land suitability is used to characterize the particle’s velocity.
The position of a particle at a given moment is
X i ( t ) = ( x 1 ( t ) , x 2 ( t ) , x 3 ( t ) , , x n ( t ) )
The velocity of a particle at a given moment is
V i ( t ) = ( V 1 ( t ) , V 2 ( t ) , V 3 ( t ) , , V n ( t ) )
The particle’s position and velocity are updated according to formulas (3) and (4), where X p ( t ) represents the individual local best position of the particle at time t, and X g ( t ) represents the global best position of the swarm at time t.
V i ( t + 1 ) = ω V i ( t ) + c 1 r 1 ( t ) × ( X p ( t ) X i ( t ) ) + c 2 r 2 ( t ) × ( X g ( t ) X i ( t ) )
X i ( t + 1 ) = X i ( t ) + V i ( t + 1 )
where t represents the number of iterations; ω is the inertia weight controlling the influence of the particle’s previous velocity; c 1 and c 2 are the cognitive and social acceleration coefficients, respectively, while c 1 adjusts the particle’s movement towards its own previous best position (cognitive component), and c 2 adjusts the particle’s movement towards the swarm’s global best position (social component). r 1 ( t ) and r 2 ( t ) are independent random values between 0 and 1, which introduce stochasticity into the algorithm, and they represent the degree of influence of the previous velocity on the current velocity. Parameters α, β, δ, and ε denote the learning rate, balance coefficient, convergence factor, and perturbation term, respectively, which together regulate the particle’s exploration and convergence behavior.

Land Suitability Evaluation

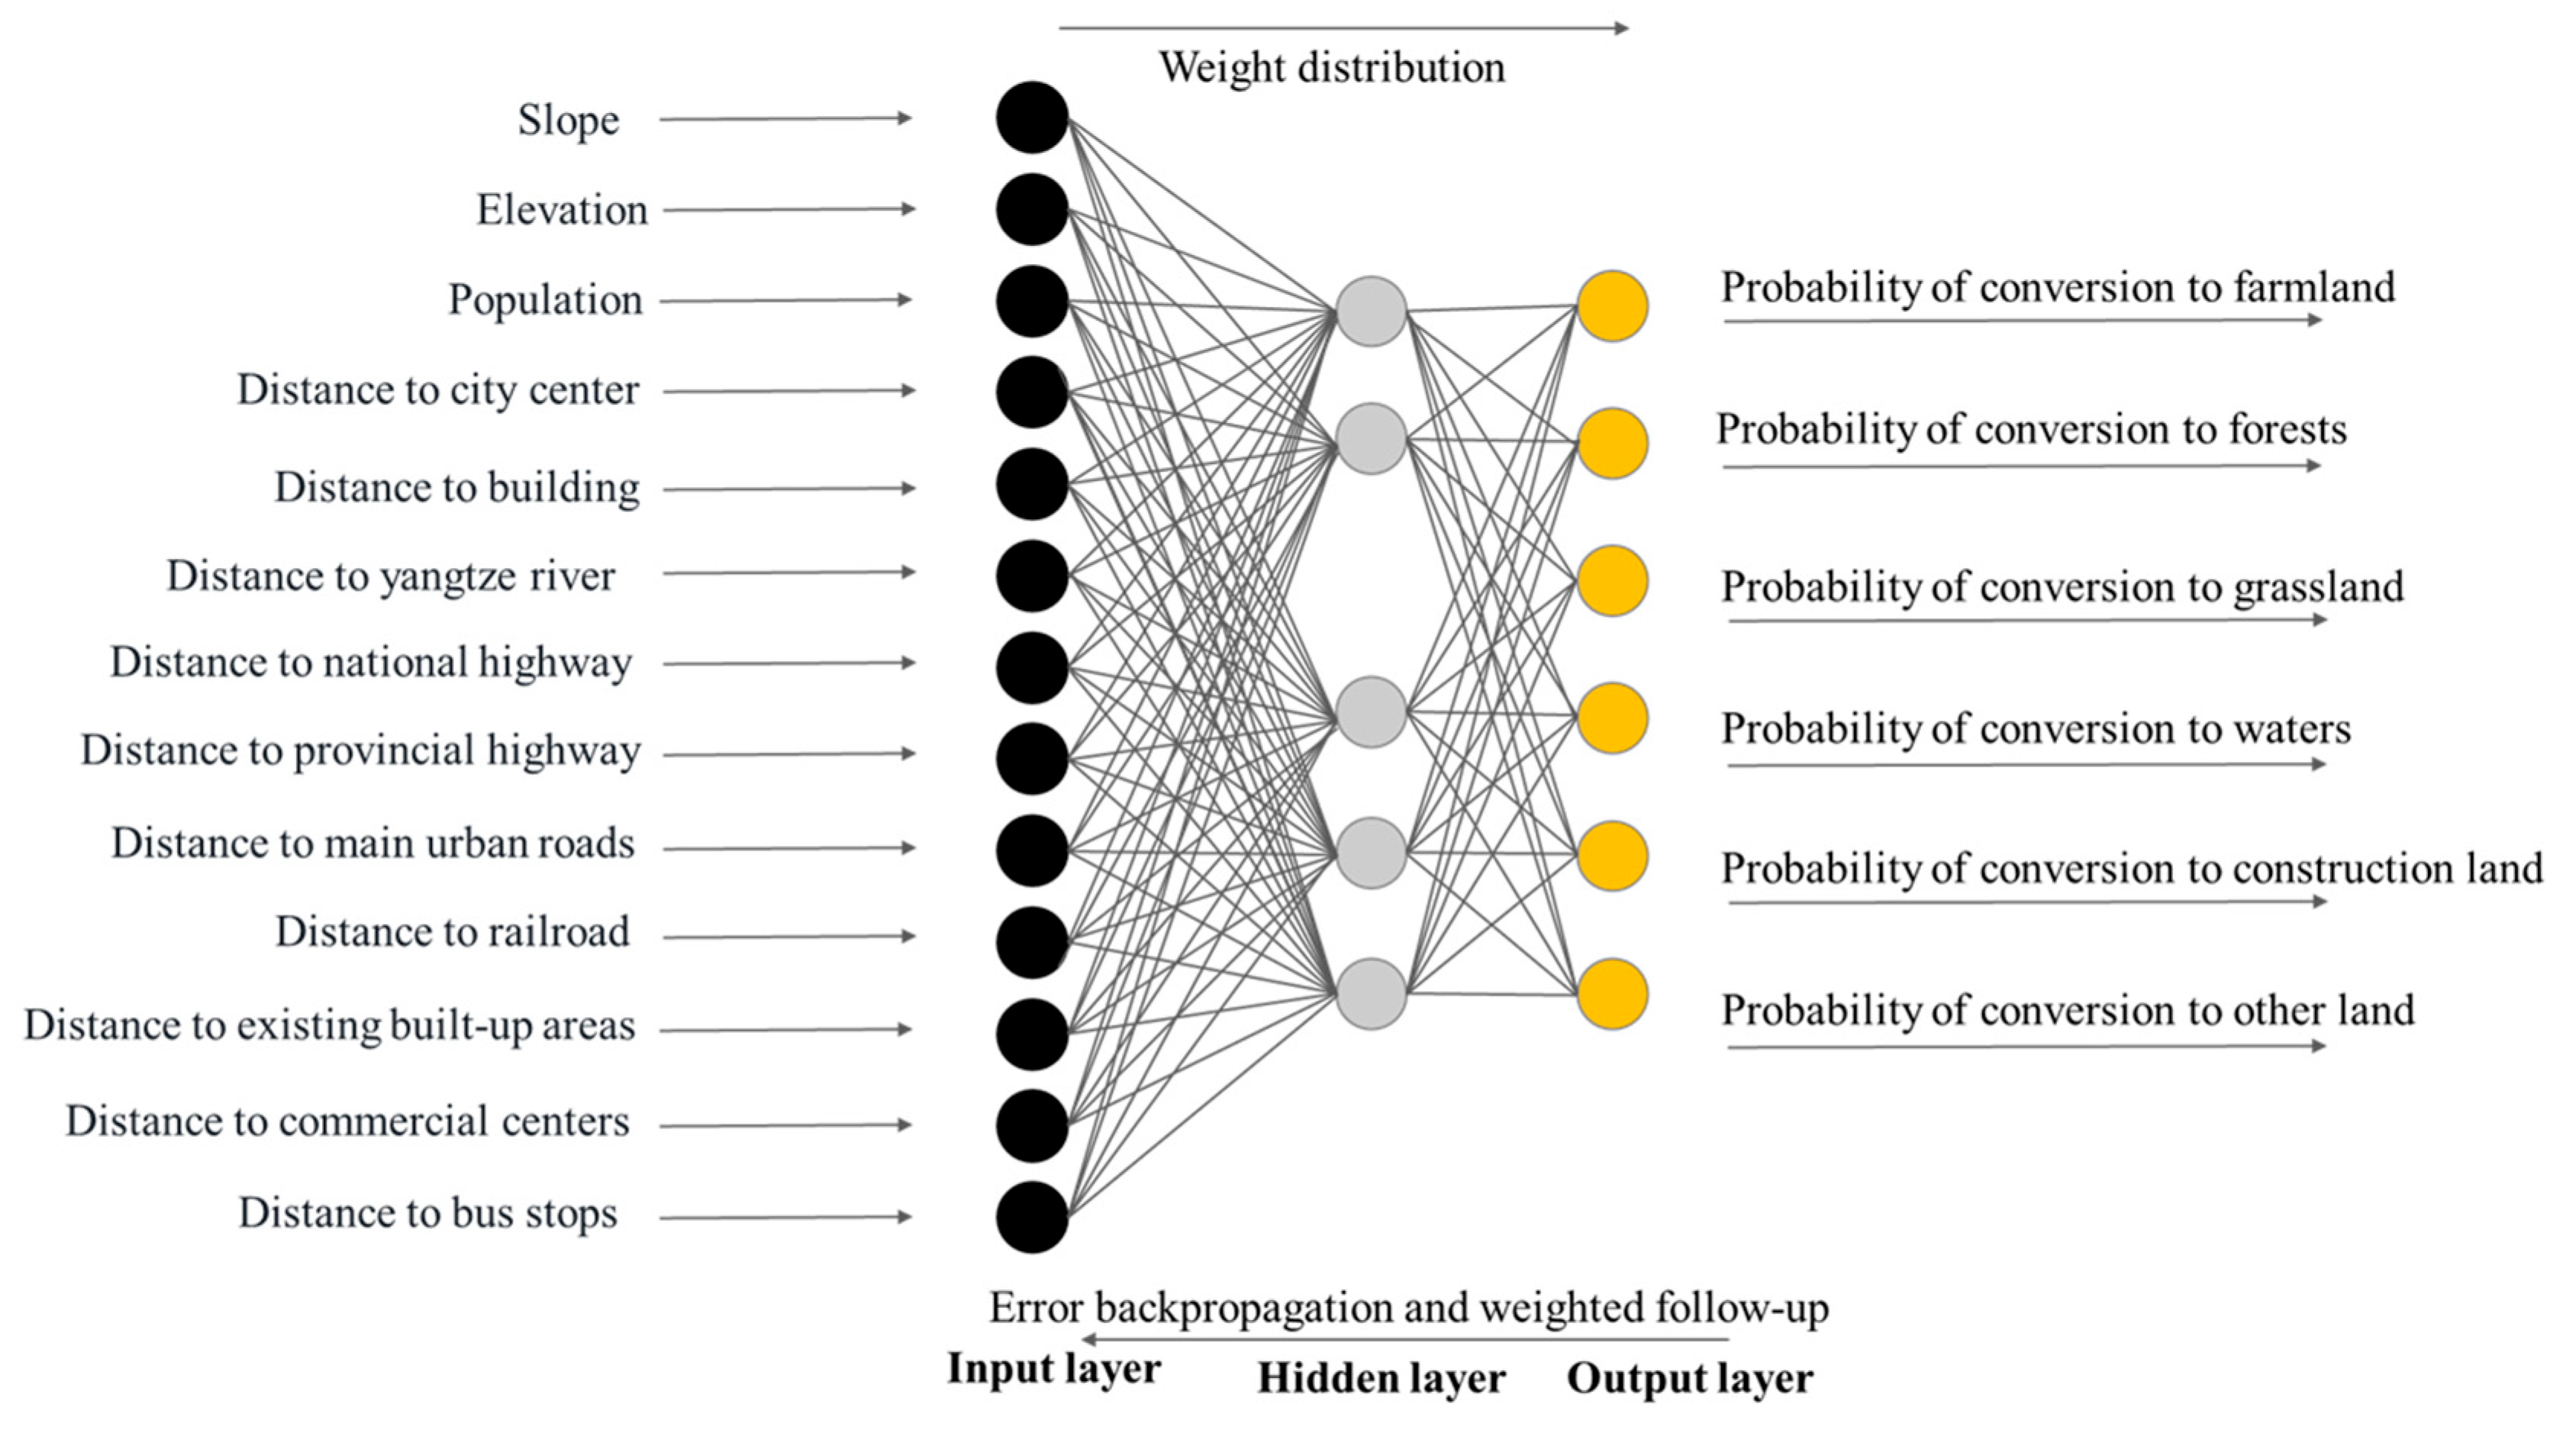
Land suitability is used to characterize particle velocity, and the Back Propagation Artificial Neural Network (BPANN) is employed to evaluate the land suitability values for different land use types [26]. Compared with traditional linear regression or AHP-based methods, BPANN demonstrates a superior ability to characterize nonlinear relationships between ESV and its multiple driving factors while minimizing human subjectivity. In general, BPANN consists of an input layer, a hidden layer, and an output layer. Both the input and hidden layers process the data through a weighted approach, and the processed data are then passed to the next layer according to the transfer rules [28]. The output layer, as its name implies, is responsible for producing the results. Specifically, in this study, the input layer represents the spatial indicators that influence land use conversion, while the neurons in the output layer represent the probabilities of each of the six land use types occurring in the land use units [27]. The indicators used for evaluating land suitability and the schematic diagram of the BPANN are shown in Figure 3.

Fitness Function

The fitness function is the objective function of the model optimization and needs to consider social, economic, and ecological benefits, as well as landscape patterns. The following optimization goals were considered in this study: minimization of land use area error, maximization of construction land aggregation, maximization of farmland aggregation, maximization of economic benefits, and maximization of total ESV. The objective function is expressed as follows in Formula (5).
F = α f e r r o r + β f C P c o n s t r u c t i o n + γ f C P f a r m l a n d + δ f e c o n o m y + ε f e c o log y
where f e r r o r represents the land use area error, which is calculated by comparing the simulated and actual land use area in the simulation process. f C P c o n s t r u c t i o n and f C P f a r m l a n d represent the spatial aggregation of construction land and farmland, respectively, computed by Formula (6). f e c o n o m y represents the economic benefit, calculated based on the economic benefit coefficient for each land use type, with the coefficients provided in Table 2. f e c o log y represents the total ESV of the land use types, calculated by Formula (7). The weights α, β, γ, δ, and ε represent the relative importance of each factor.
f C o m p a c t k = j = 1 n i = 0 m x k , ( i 1 , j 1 ) + x k , ( i 1 , j ) + x k , ( i 1 , j + 1 ) + x k , ( i , j 1 ) + x k , ( i , j + 1 ) + x k , ( i + 1 , j 1 ) + x k , ( i + 1 , j ) + x k , ( i + 1 , j + 1 )
where f C o m p a c t k represents the spatial compactness of land use type k. The term (i, j) denotes the spatial position of a land use unit, where i and j are the row and column indices of the grid cells within the study area, respectively.
f e c o log y = l = 1 p ω l j = 1 n i = 0 m E S V l , ( i , j )
where f e c o log y represents the total ESV of the study area. The parameter ω l indicates the weight of the l-th ESV. In this study, the coefficients of ESV for all services are set to 1. E S V l , ( i , j ) represents the value of the l-th ecosystem service at the land use spatial unit (i, j), calculated by the modified equivalence table for ESV per unit area in Hubei Province, as proposed by Li et al. [33], as shown in Table 3. n and m represent the row and column indices of the grid cells in the study area, while p denotes the total number of types of ESs.

Constraints

Adhering to the principles of the PSO algorithm, it is necessary to establish relevant constraints to direct the particle transitions and learning process. The constraints in this study are mainly: (1) Farmland, water, and construction land conversion constraints. Specifically, if a spatial unit is covered by farmland, water, or construction land and remains unchanged at both the beginning and end of the simulation period, the land use type will remain unchanged. This constraint is designed to ensure the effectiveness and operability of land use conversion. (2) Basic farmland conversion constraint. That is, the basic farmland protection areas extracted from the territorial spatial plan are designated as non-conversion zones. (3) Water increase constraint. The conversion of other land into water within restricted areas is restricted due to the considerable resistance to the conversion from other land to water.

Model Parameters and Execution

The parameters for the PSO model in this study are shown in Table 4. Among these parameters, ω represents the inertia weight, c 1 is the learning coefficient that guides particles towards their personal best position, and c 2 is the learning coefficient that guides particles towards the global best position of the swarm. The default parameters for ω, c 1 , and c 2 are 0.4, 2 and 2. However, since this study involves conversions between different land use types, using these typical parameters would lead to the model quickly converging to a local optimum. Therefore, by manually adjusting the parameters and observing the model’s performance, the final parameters were set as ω = 0.2, c 1 = c 2 = 0.4. The default population size is between 20 and 40 and can be increased to 100–200 in complex or specific situations. In this study, due to the large number of grid cells, the population size was set as 1000. The iteration time was set as 200, because the model result became stable and consistent once the iteration time reached 200.

2.3.3. Landscape Metrics

We evaluated the changes in the spatial layout of farmland, construction land and ecological land in Wuhan before and after optimization. Following the previous studies [2,9,35], we selected four commonly used indices, i.e., patch number, edge density, mean perimeter–area ratio, and spatial compactness, to characterize landscape pattern. Generally, if a land use type has fewer patches, it indicates a more aggregated landscape. Lower edge density corresponds to lower landscape fragmentation. A smaller perimeter–area ratio suggests that patch shapes are more regular. Greater spatial aggregation results in more compact land use. In practice, the concentrated and contiguous farmland is beneficial for large-scale, mechanized agricultural production; the spatial aggregation of construction land facilitates efficient and intensive socio-economic activities; and concentrated ecological land layouts help maintain ecosystem integrity, connectivity, and stability, thereby supporting ecosystem functions. The computational procedures for these indices, outlined in Table 5, were carried out with the Fragstats v 4.2 software.

3. Results

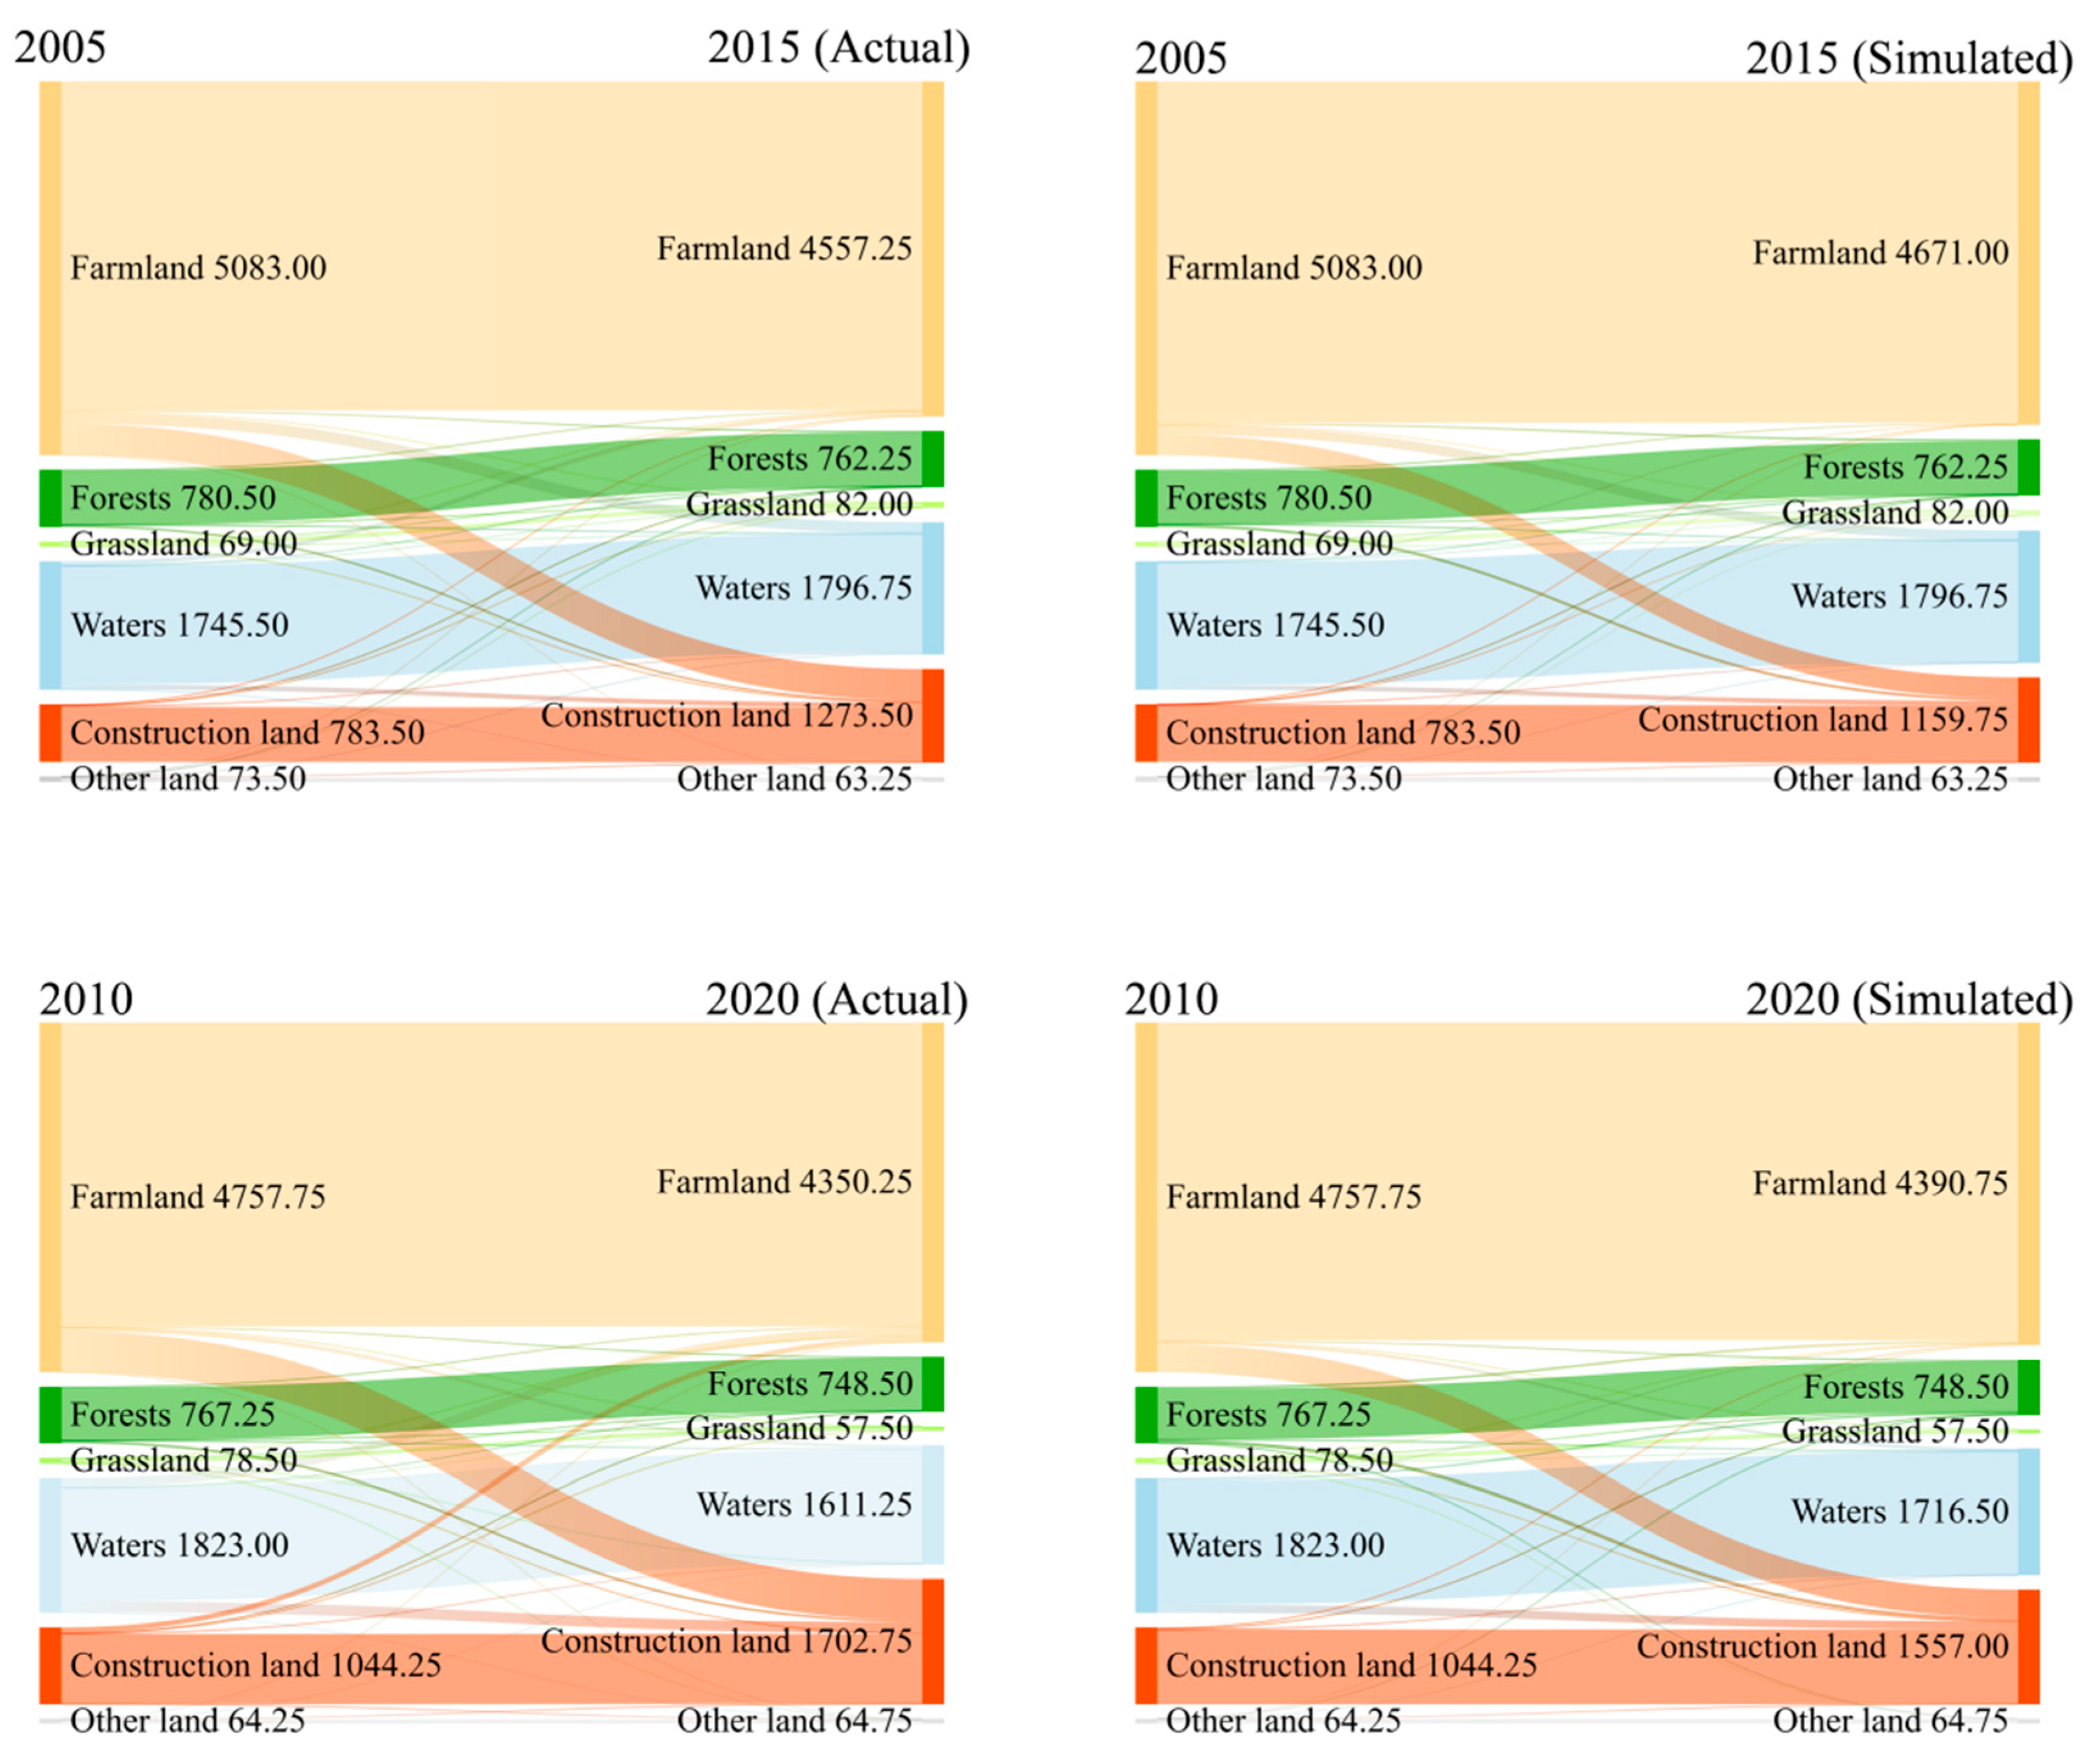
3.1. Land Use Quantity and Spatial Distribution Between Actual and Simulated

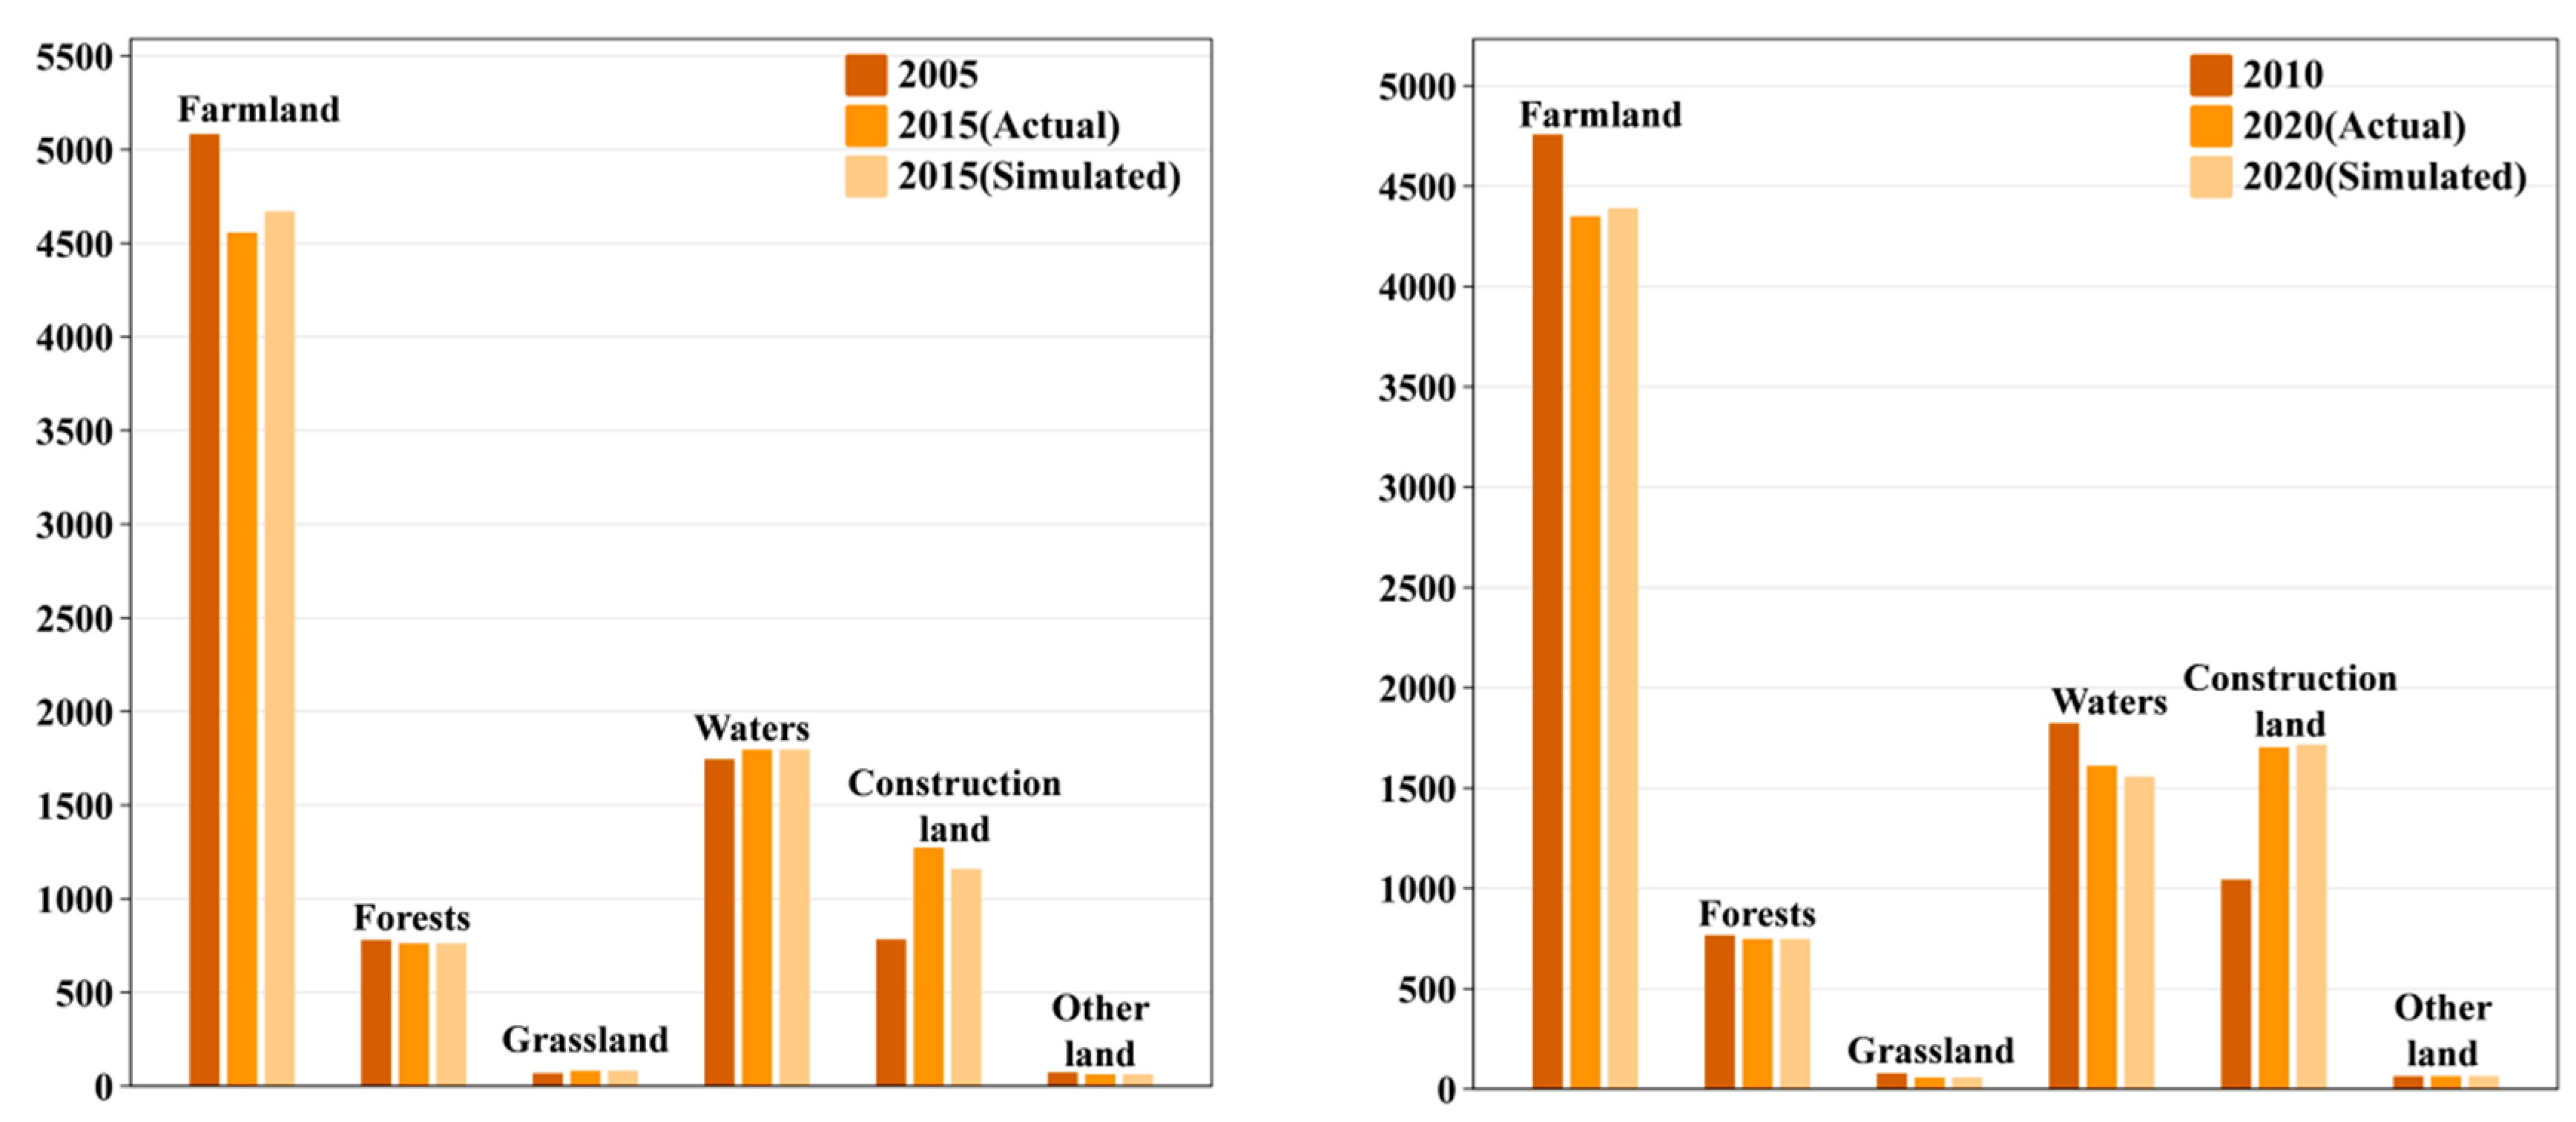
In this study, LULC data for 2005 and 2010 served as the baseline, and with a 10-year interval, the PSO method was applied to simulate the LULC for 2015 and 2020. Figure 4 shows the actual and simulated land use area for the periods 2005–2015 and 2010–2020. From 2005 to 2015, the actual areas of farmland, forests, and other land uses in Wuhan decreased, while the areas of construction land, water, and grassland increased, with construction land showing the largest increase. A comparison of the simulated and actual land use areas revealed that the framework produced no change in the areas of forests, grassland, water, and other land uses. However, the simulated area of farmland was 113.75 km2 larger than the actual area, while the area of construction land was 113.75 km2 smaller than the actual area. From 2010 to 2020, the actual areas of farmland, forests, grassland, and water in Wuhan decreased, with farmland experiencing the largest reduction. The area of construction land increased. Comparing the simulated and actual land use areas, it was found that there was no change in the areas of forests, grassland, and other land uses. However, the simulated areas for farmland and water were larger by 40.50 km2 and 105.25 km2, respectively, than the actual areas. The simulated increase in water area is attributable to the framework’s ESV-weighting in the objective function, which tends to favor water in spatial allocation; in contrast, the observed decline reflects real-world urban encroachment on lakes in Wuhan from 2010 to 2020. The simulated area of construction land was 145.75 km2 smaller than the actual area. After optimization, it was noted that the area of construction land in Wuhan contracted in both 2015 and 2020, while the areas of farmland and ecological land saw an increase.
Figure 5 illustrates the actual and simulated land use transitions from 2005 to 2015 and from 2010 to 2020. In both the actual and simulated scenarios, farmland and water were the main land use types transferred out, while construction land was the main type transferred in. From 2005 to 2015, the actual area of farmland transferred out was 611 km2, while the simulated area was 441.5 km2. After optimization, the area of farmland transferred out decreased by 169.5 km2. The actual area of water transferred out was 135.5 km2, while the simulated area was 83 km2. After optimization, the area of water transferred out decreased by 52.5 km2. Forests, grassland, construction land, and other land had relatively small areas transferred out in both the actual and simulated scenarios. Construction land had the largest area transferred in both actual and simulated scenarios, with a total of 526.25 km2 transferred in for the actual scenario, and 384.5 km2 transferred in after optimization. After optimization, the areas transferred into farmland, grassland, and water all slightly decreased, while the area transferred to forest land increased. The land use changes from 2010 to 2020 were similar to those from 2005 to 2015, with the largest area of farmland transferred out and the largest area of construction land transferred in before and after optimization. Except for forest land, the areas transferred in and out for the remaining land use types all decreased after optimization. Notably, after optimization under the framework, the conversion of farmland to construction land significantly decreased, while the conversion of other land use types to forest land increased.
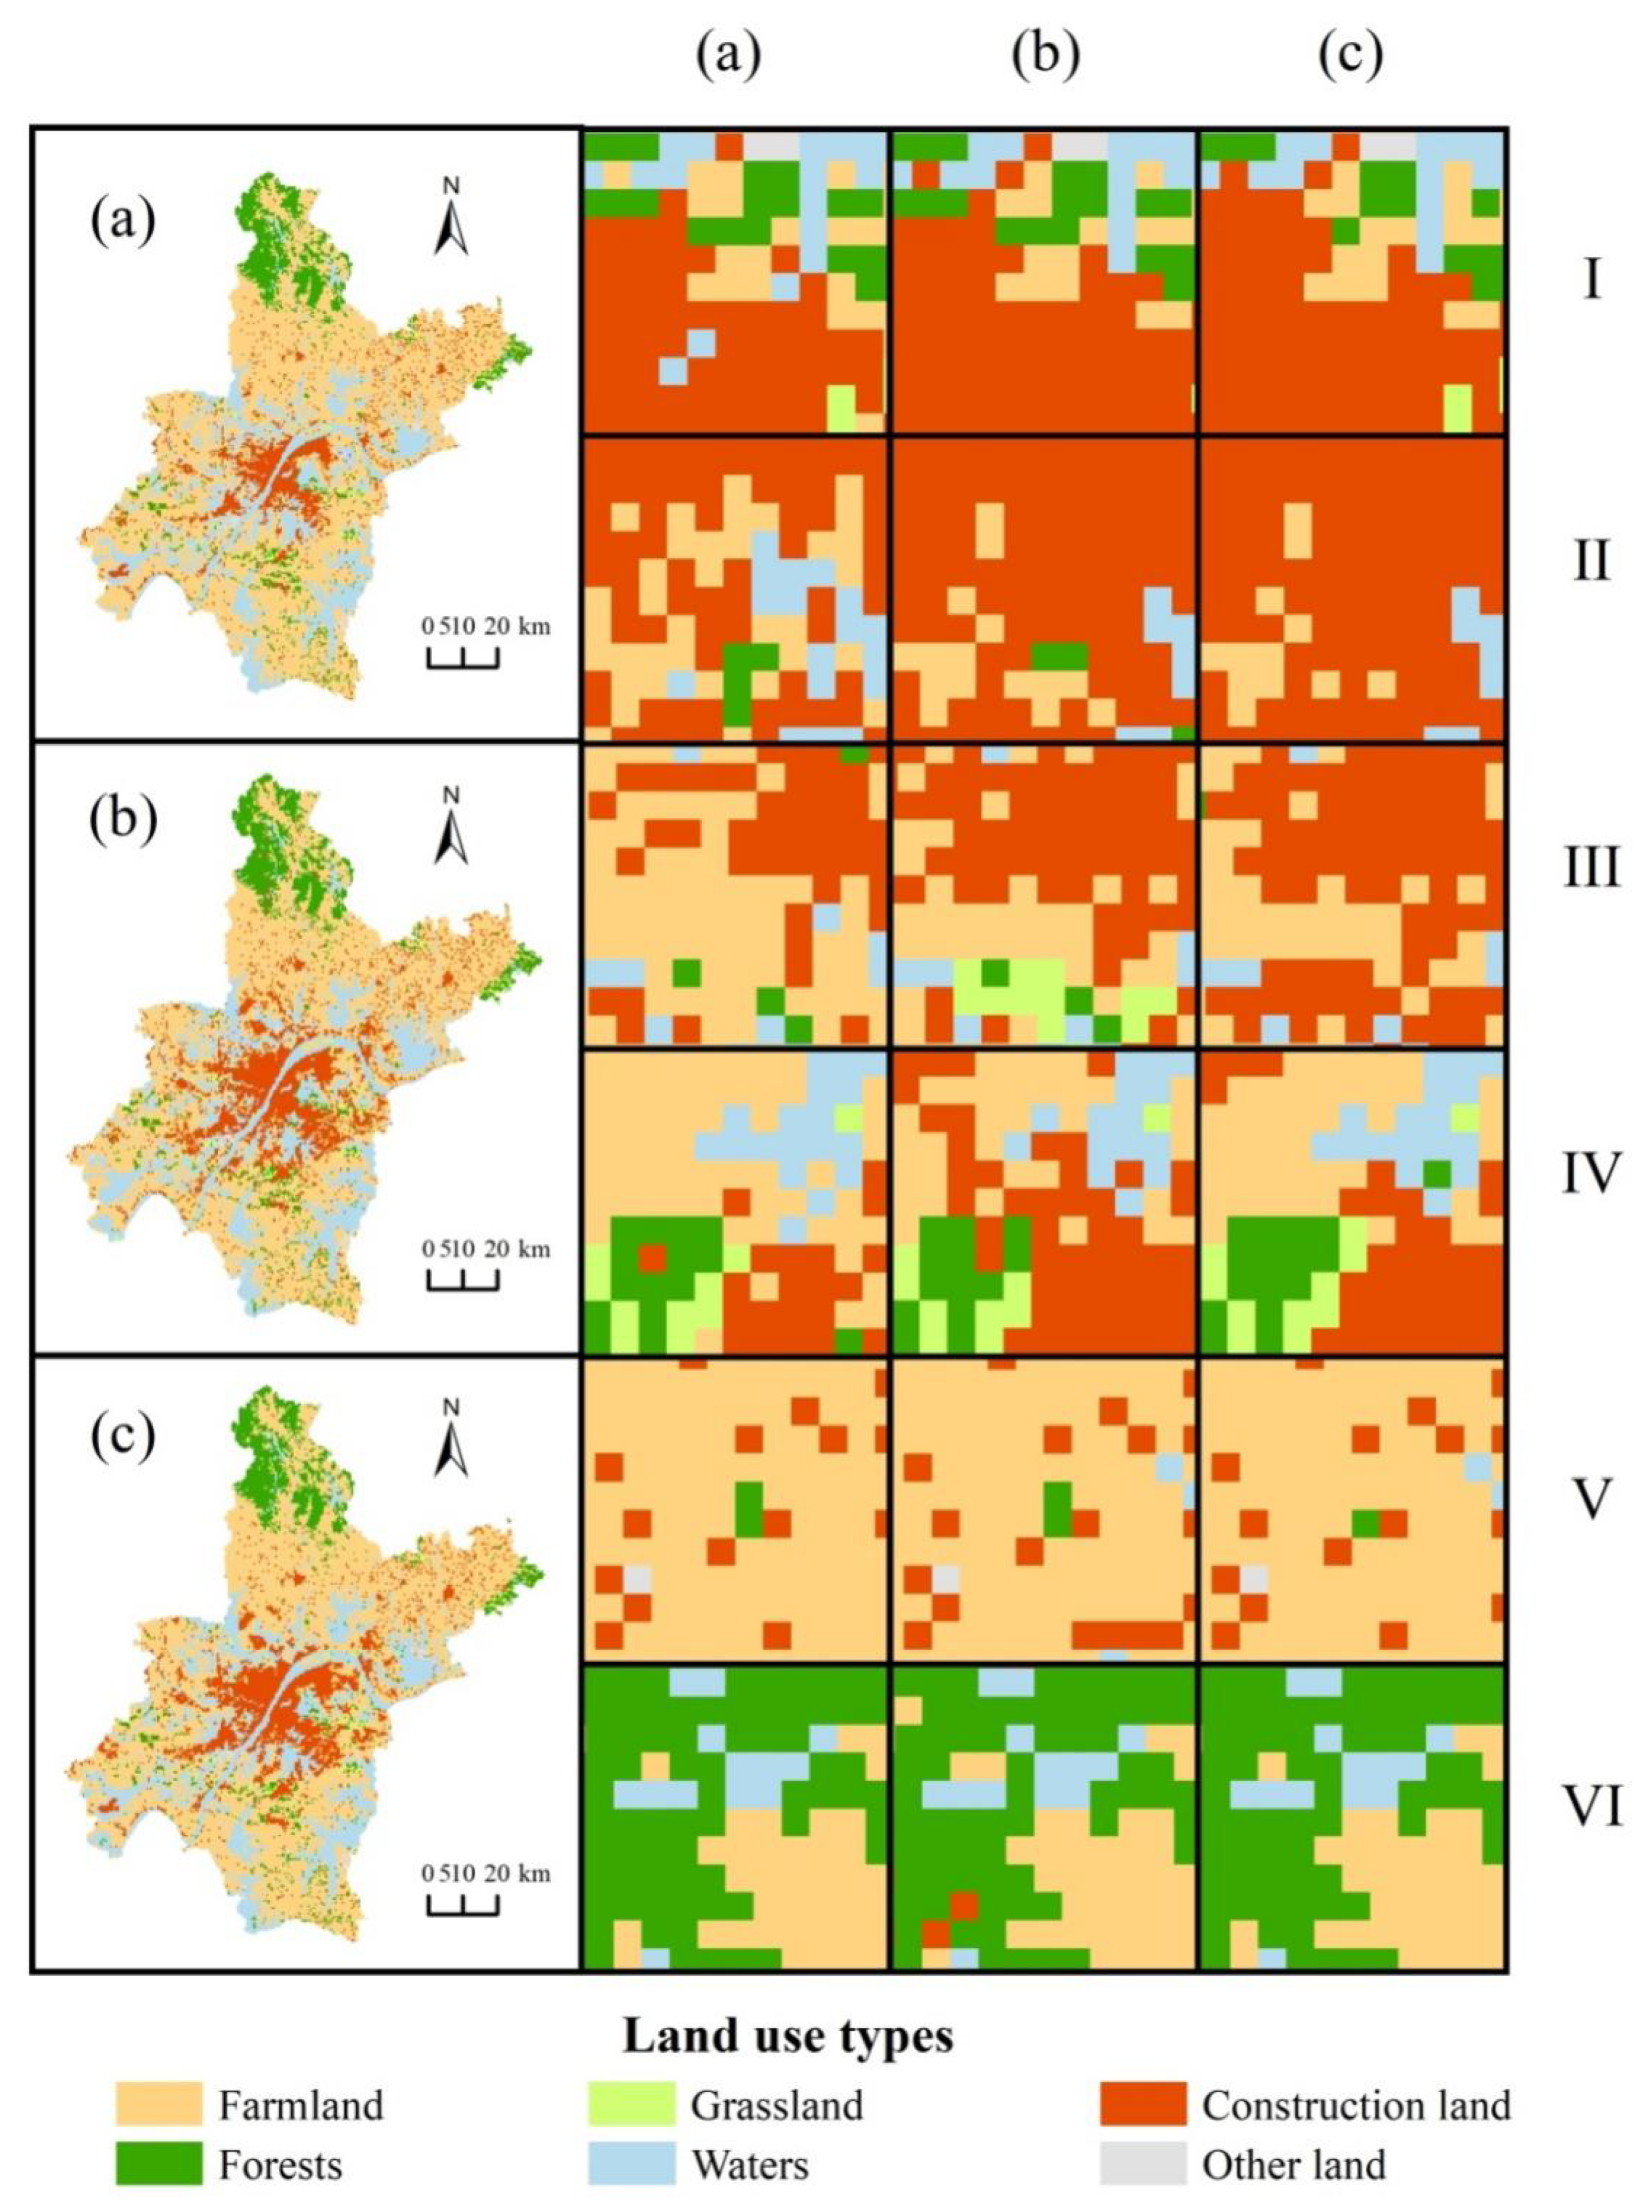
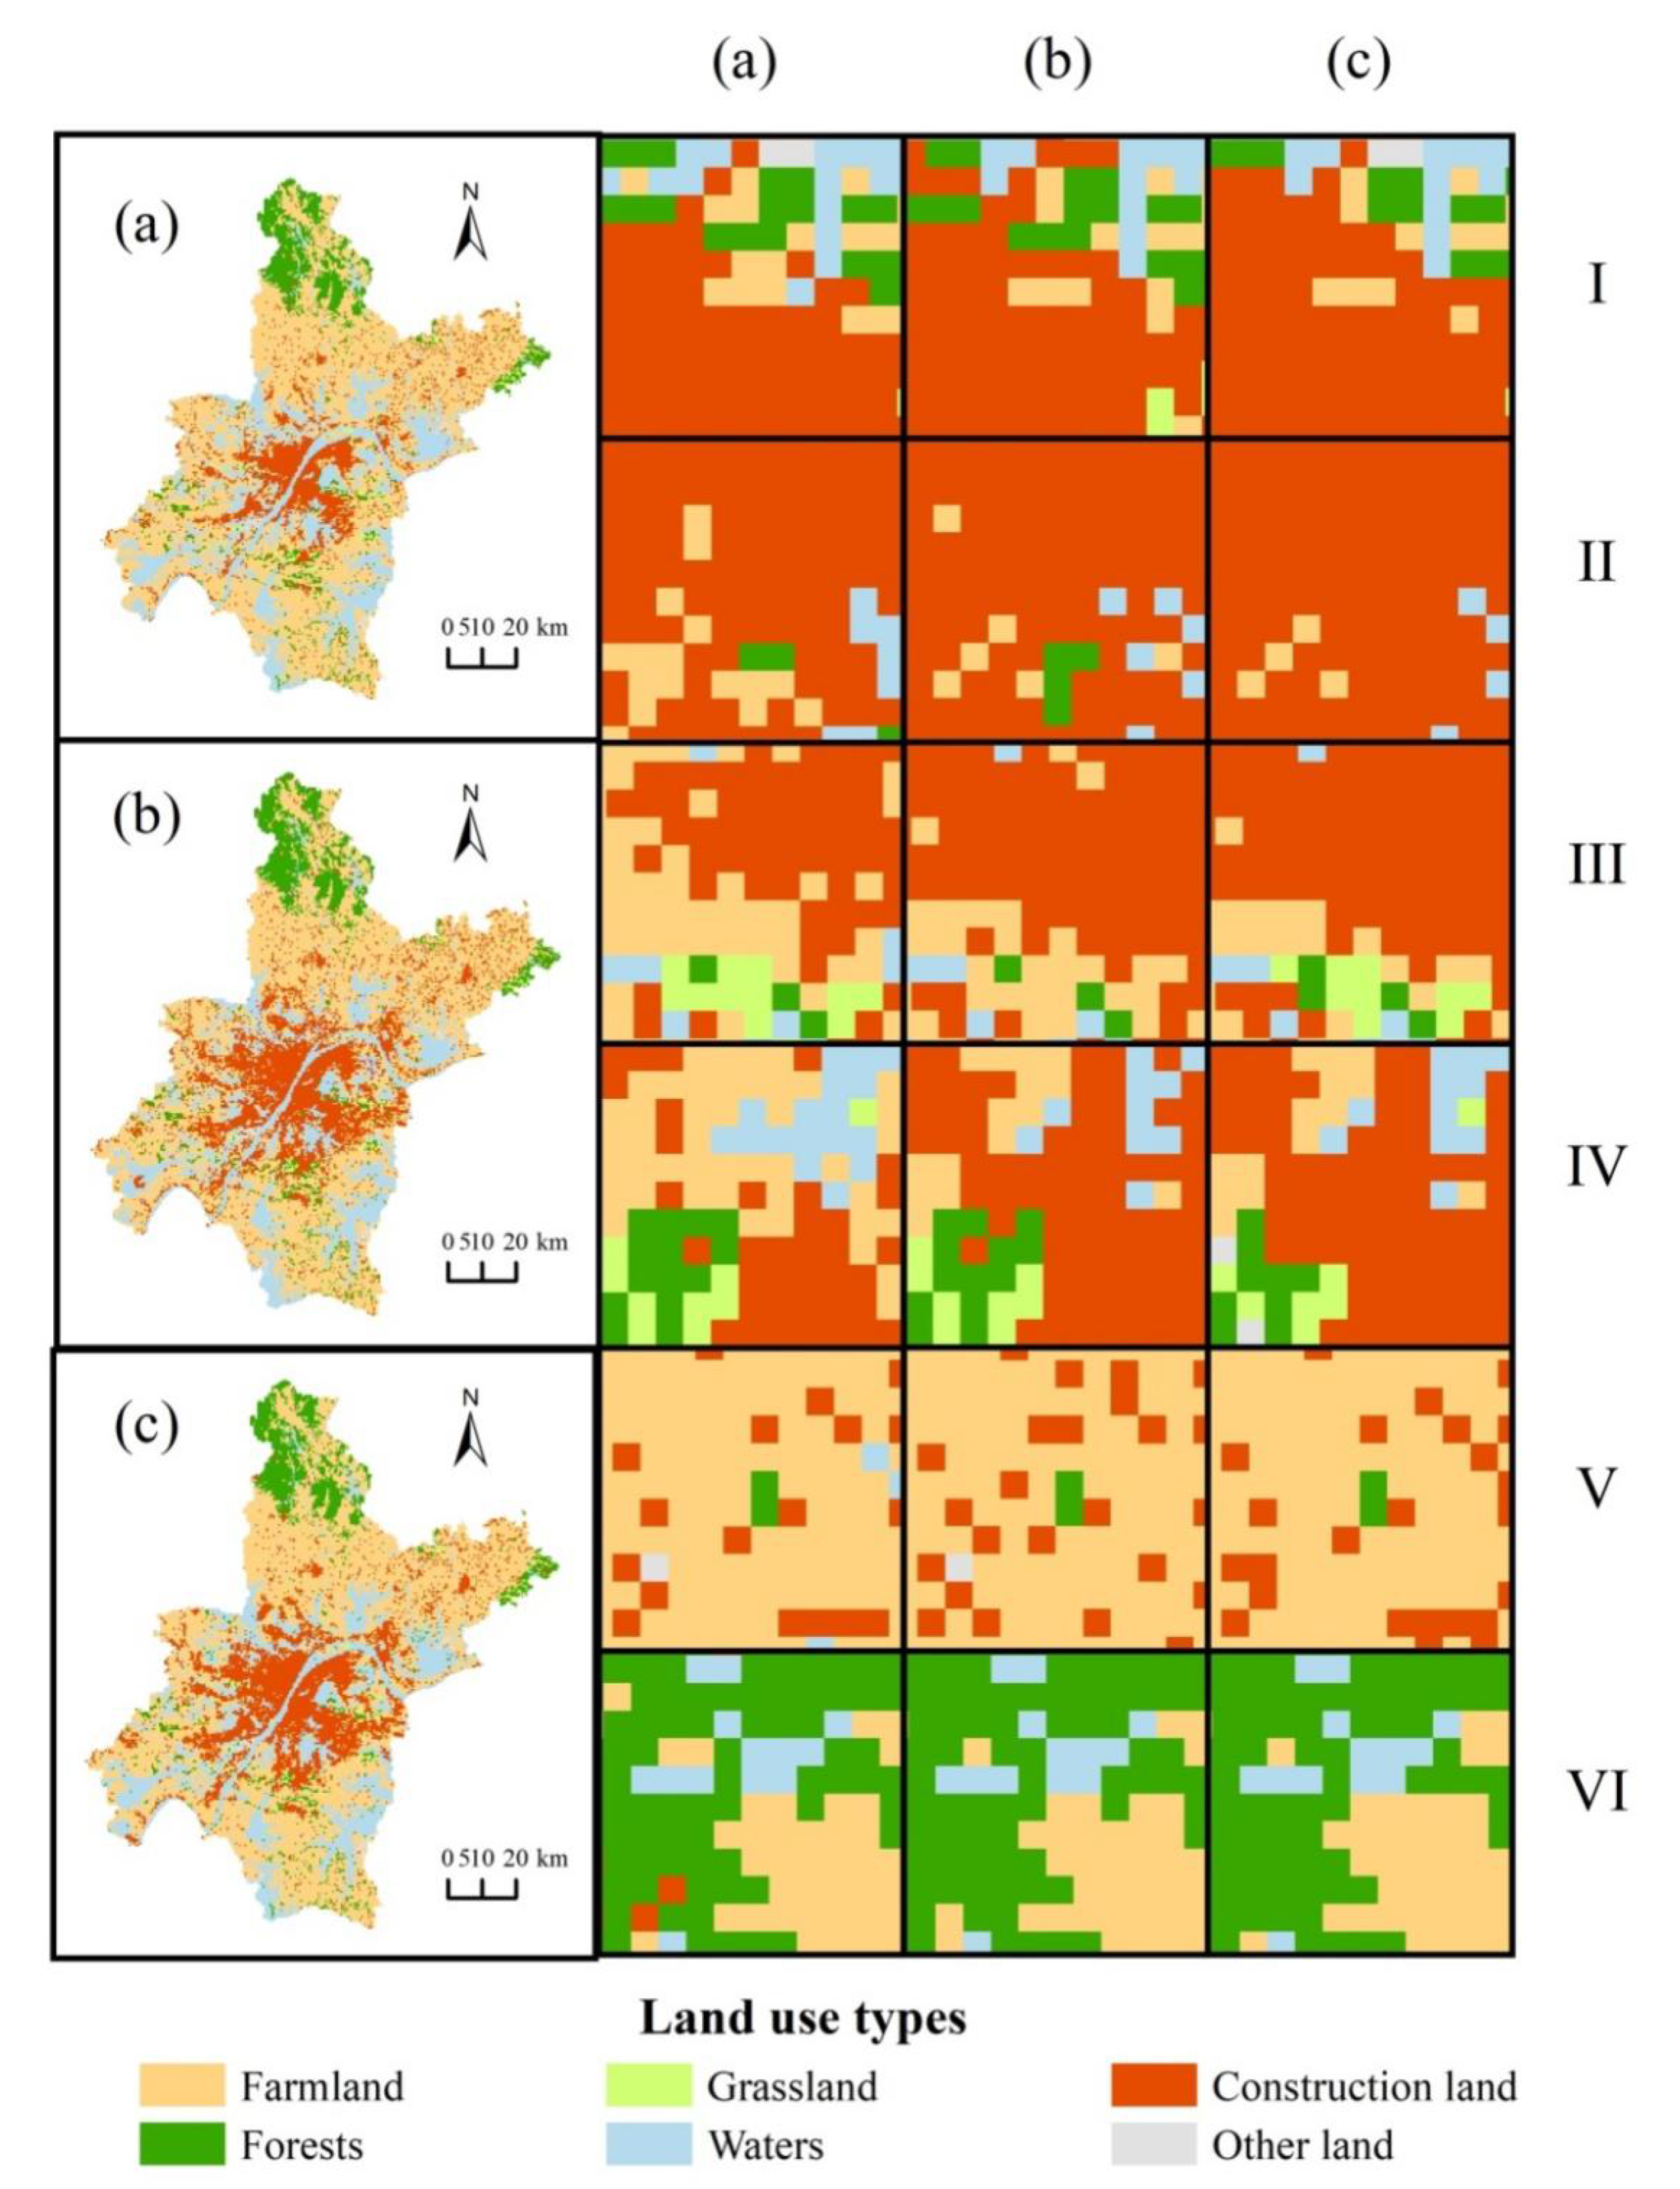
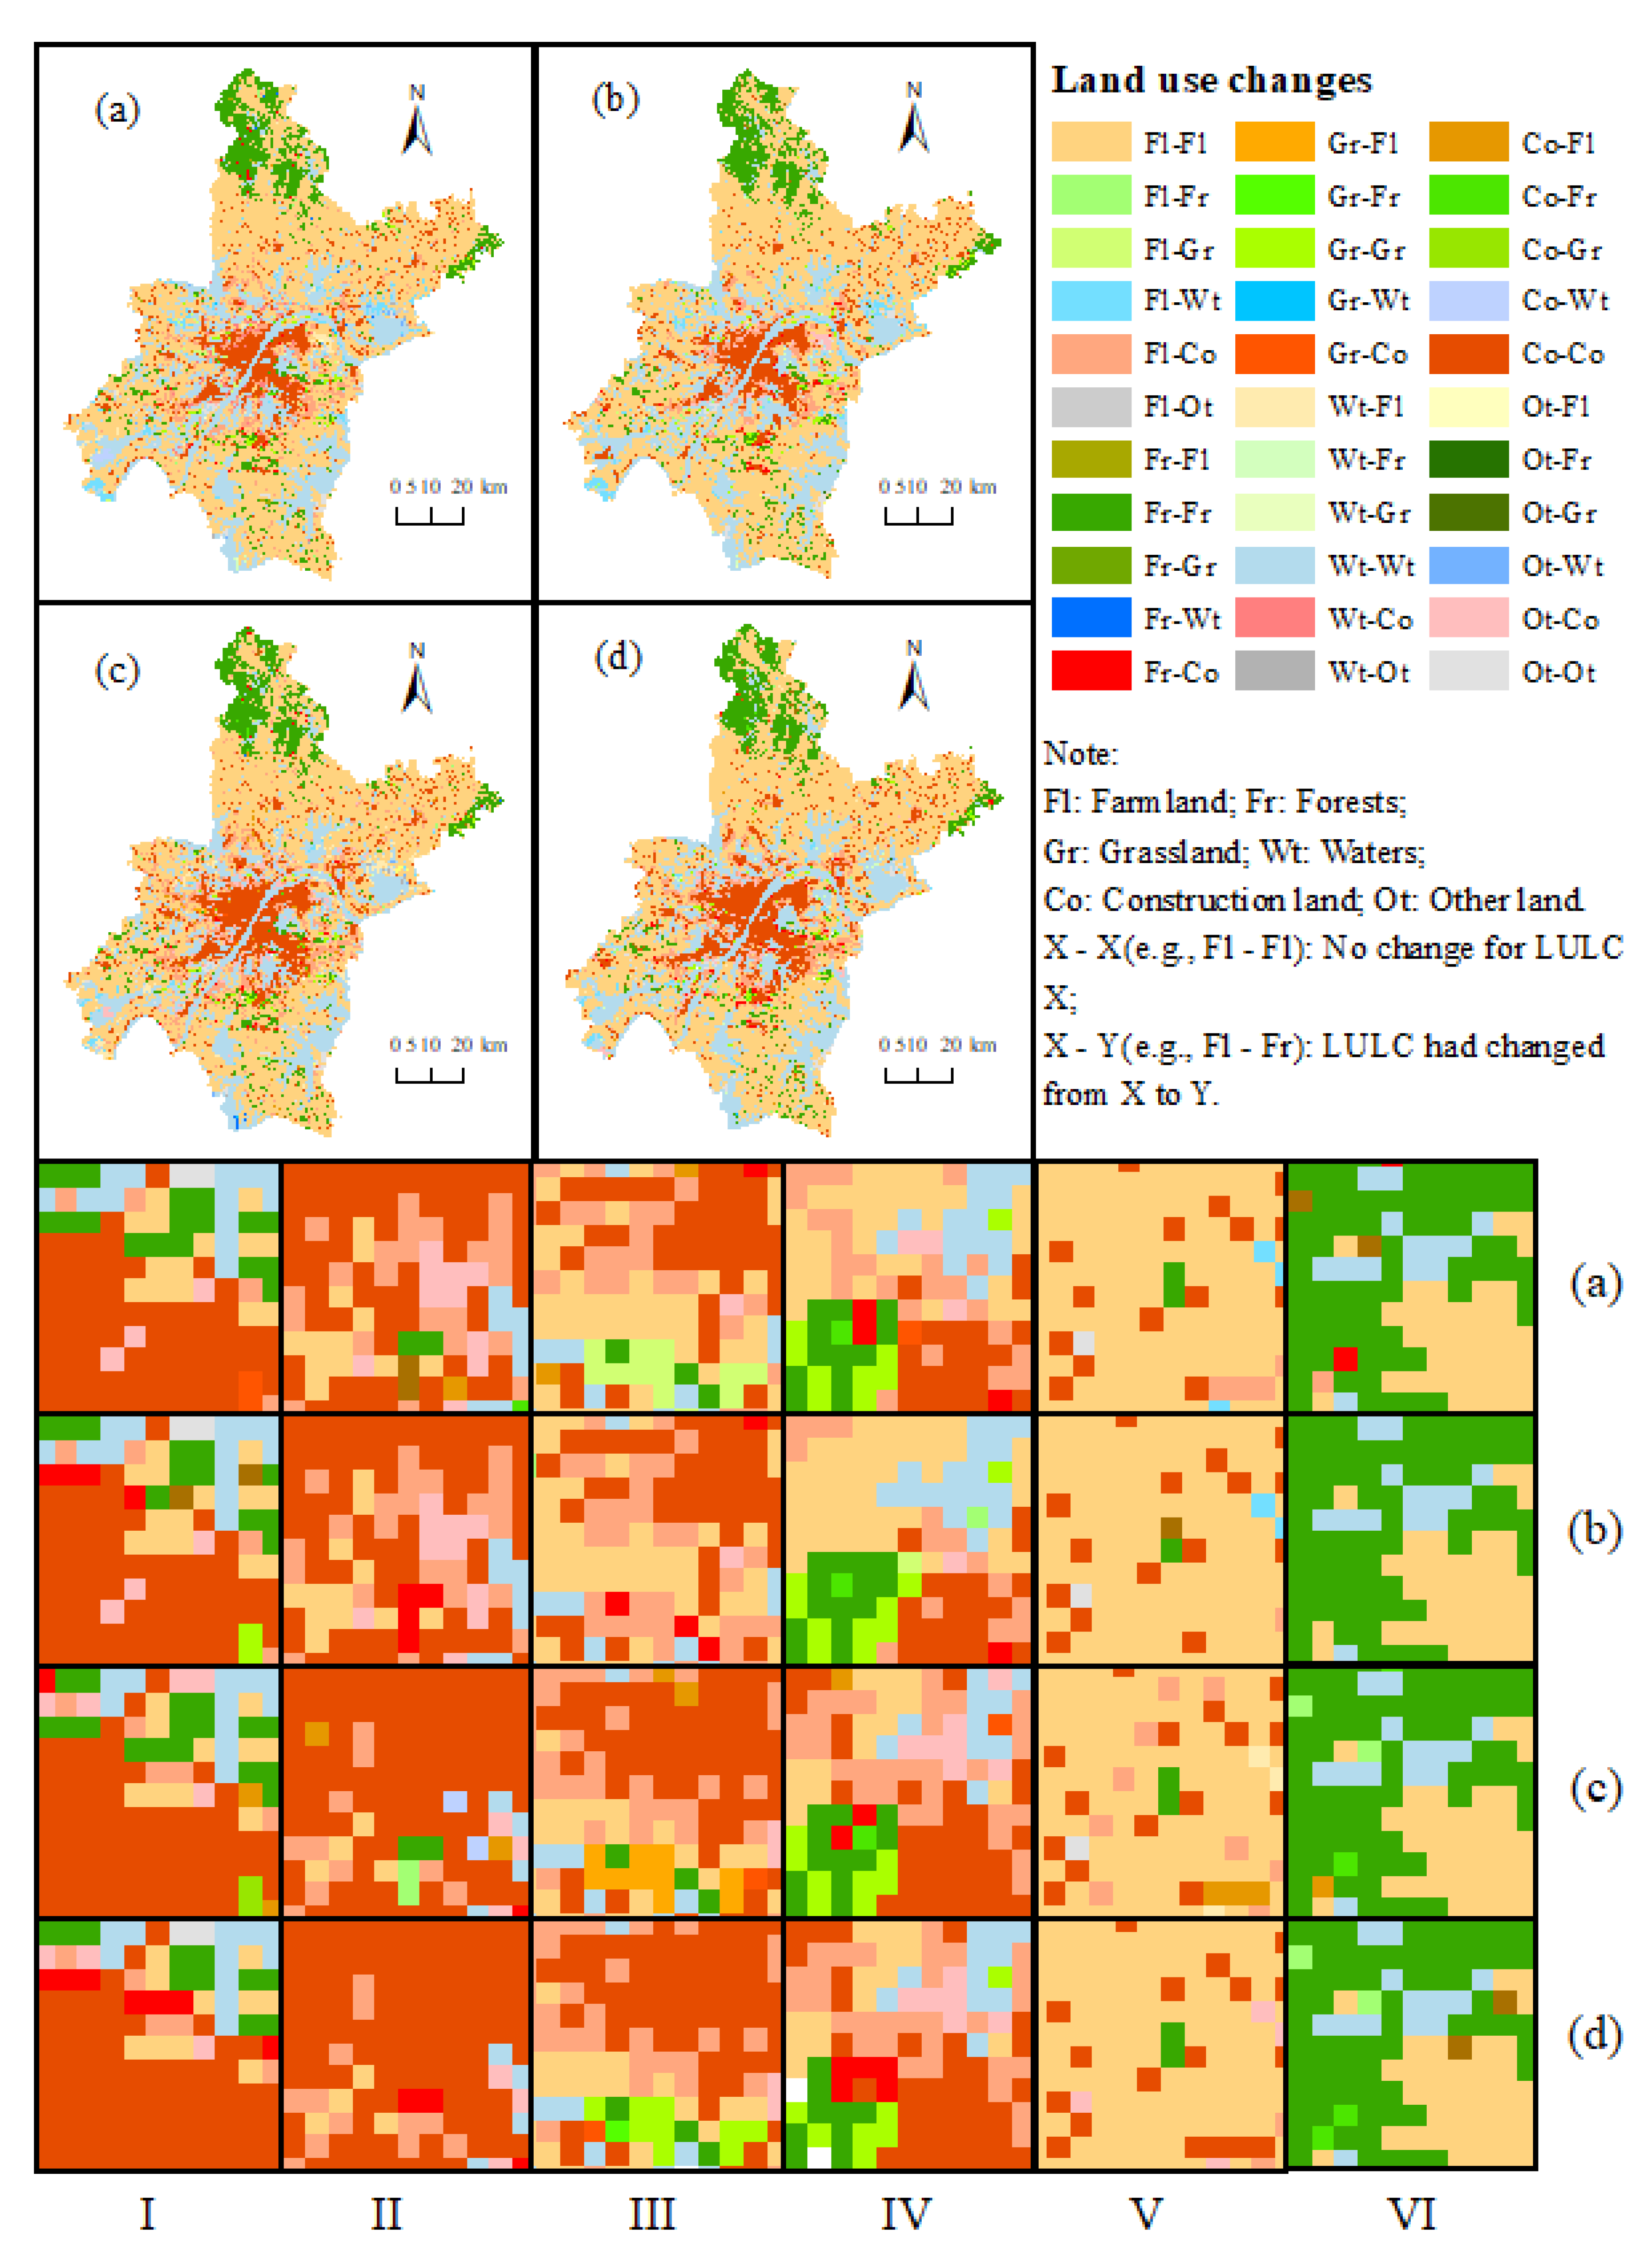
Figure 6 and Figure 7 illustrate the spatial distribution of actual and simulated land use types for the periods of 2005–2015 and 2010–2020, respectively. Figure 8 depicts the spatial distribution of actual and simulated land use transitions for the same periods. To better understand the framework’s performance in optimizing land use layout, this study focused on six specific areas within the urban functional area, new urban development area, and outer suburban area, as indicated in Figure 1. Compared to the actual land use layout, the simulated one exhibited the following features: (1) urban land expansion trends of the three urban functional areas were quite similar. In the face of disorderly urban land development, the optimized construction land pattern showed more spatially concentrated characteristics. Some construction land that previously encroached on ecological and agricultural land had been reallocated, moving closer to the urban functional area. (2) Concentrated agricultural areas demonstrated resistance to construction land invasion; fragmented agricultural land within important ecological conservation areas was restored to forest land, especially in outer suburban areas. (3) Ecological space effectively resisted the encroachment of construction land, thereby preserving the integrity of ecological land, especially in the outer suburban area. Overall, after adjustment, construction land, farmland, and ecological land exhibited more clustered spatial patterns, leading to partial restoration and stronger protection of ecological and agricultural spaces.

3.2. Landscape Pattern Indices Between Actual and Simulated Land Use Patterns

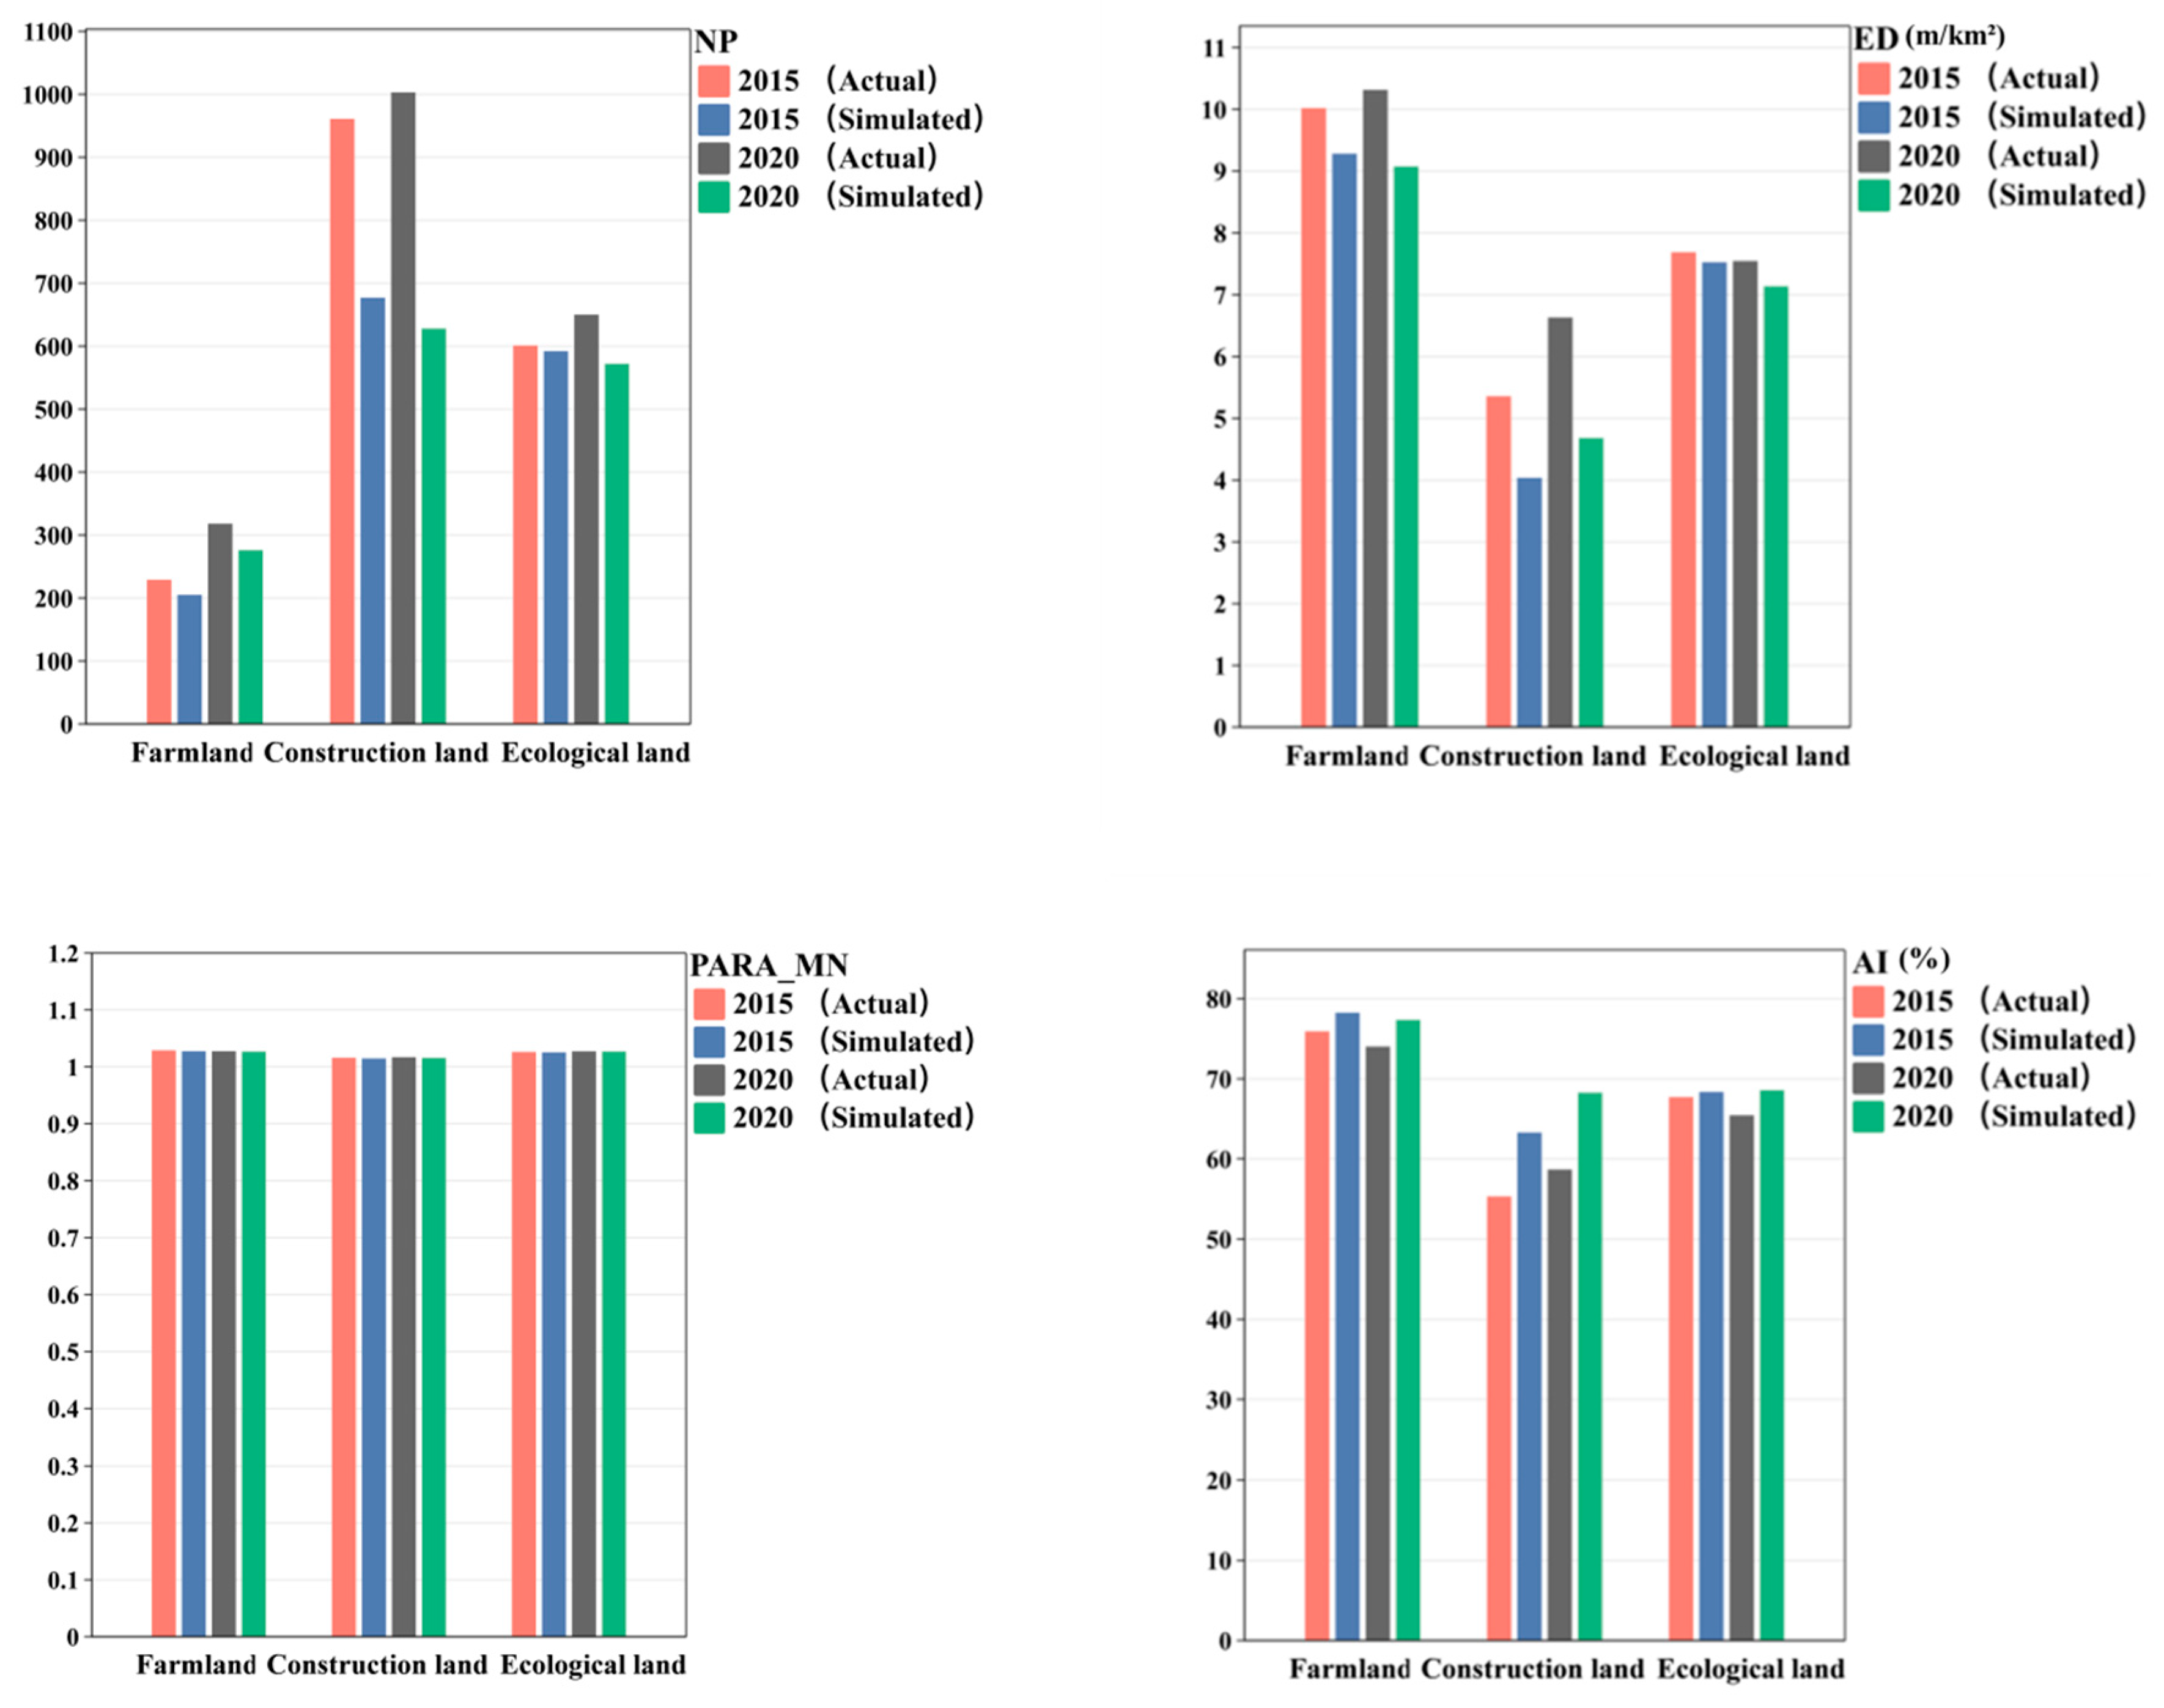
Figure 9 shows the landscape pattern indices for both actual and simulated land use, and Table 6 displays the changes in landscape pattern indices in 2015 and 2020. In comparison to the actual scenario, the optimized landscape exhibited a substantial reduction in the number of patches and edge density, with the mean perimeter–area ratio remaining relatively stable. However, the aggregation index saw a moderate increase in both 2015 and 2020. Construction land showed the most obvious landscape aggregation characteristics, followed by farmland and ecological land. Specifically, in 2015, after optimization, the patches and edge density of construction land decreased by 29.55% and 24.66%, respectively, while the aggregation index increased by 14.41%. For farmland, patches and edge density decreased by 10.48% and 7.37%, respectively, accompanied by a 3.07% increase in the aggregation index. Ecological land experienced a slight reduction in patches, edge density, and mean perimeter–area ratio, yet the aggregation index showed a modest increase. Similarly, in 2020, construction land showed decreases in patches and edge density by 37.39% and 29.42%, respectively, while the aggregation index rose by 16.35%; for farmland, patches and edge density decreased by 13.21%, 12.02%, respectively, with a 4.49% increase in aggregation index; ecological land patches and edge density decreased by 12.00%, 5.42%, respectively, with a 4.78% increase in aggregation index. The changes in landscape indices before and after optimization for 2015 and 2020 demonstrate that the optimization framework successfully reduced landscape fragmentation and improved spatial aggregation for all land use types. This suggests that the optimized spatial land use layout better meets Wuhan’s goals for efficient and intensive land use.

3.3. Spatial Distribution of ESV Between Actual and Simulated Land Use Patterns

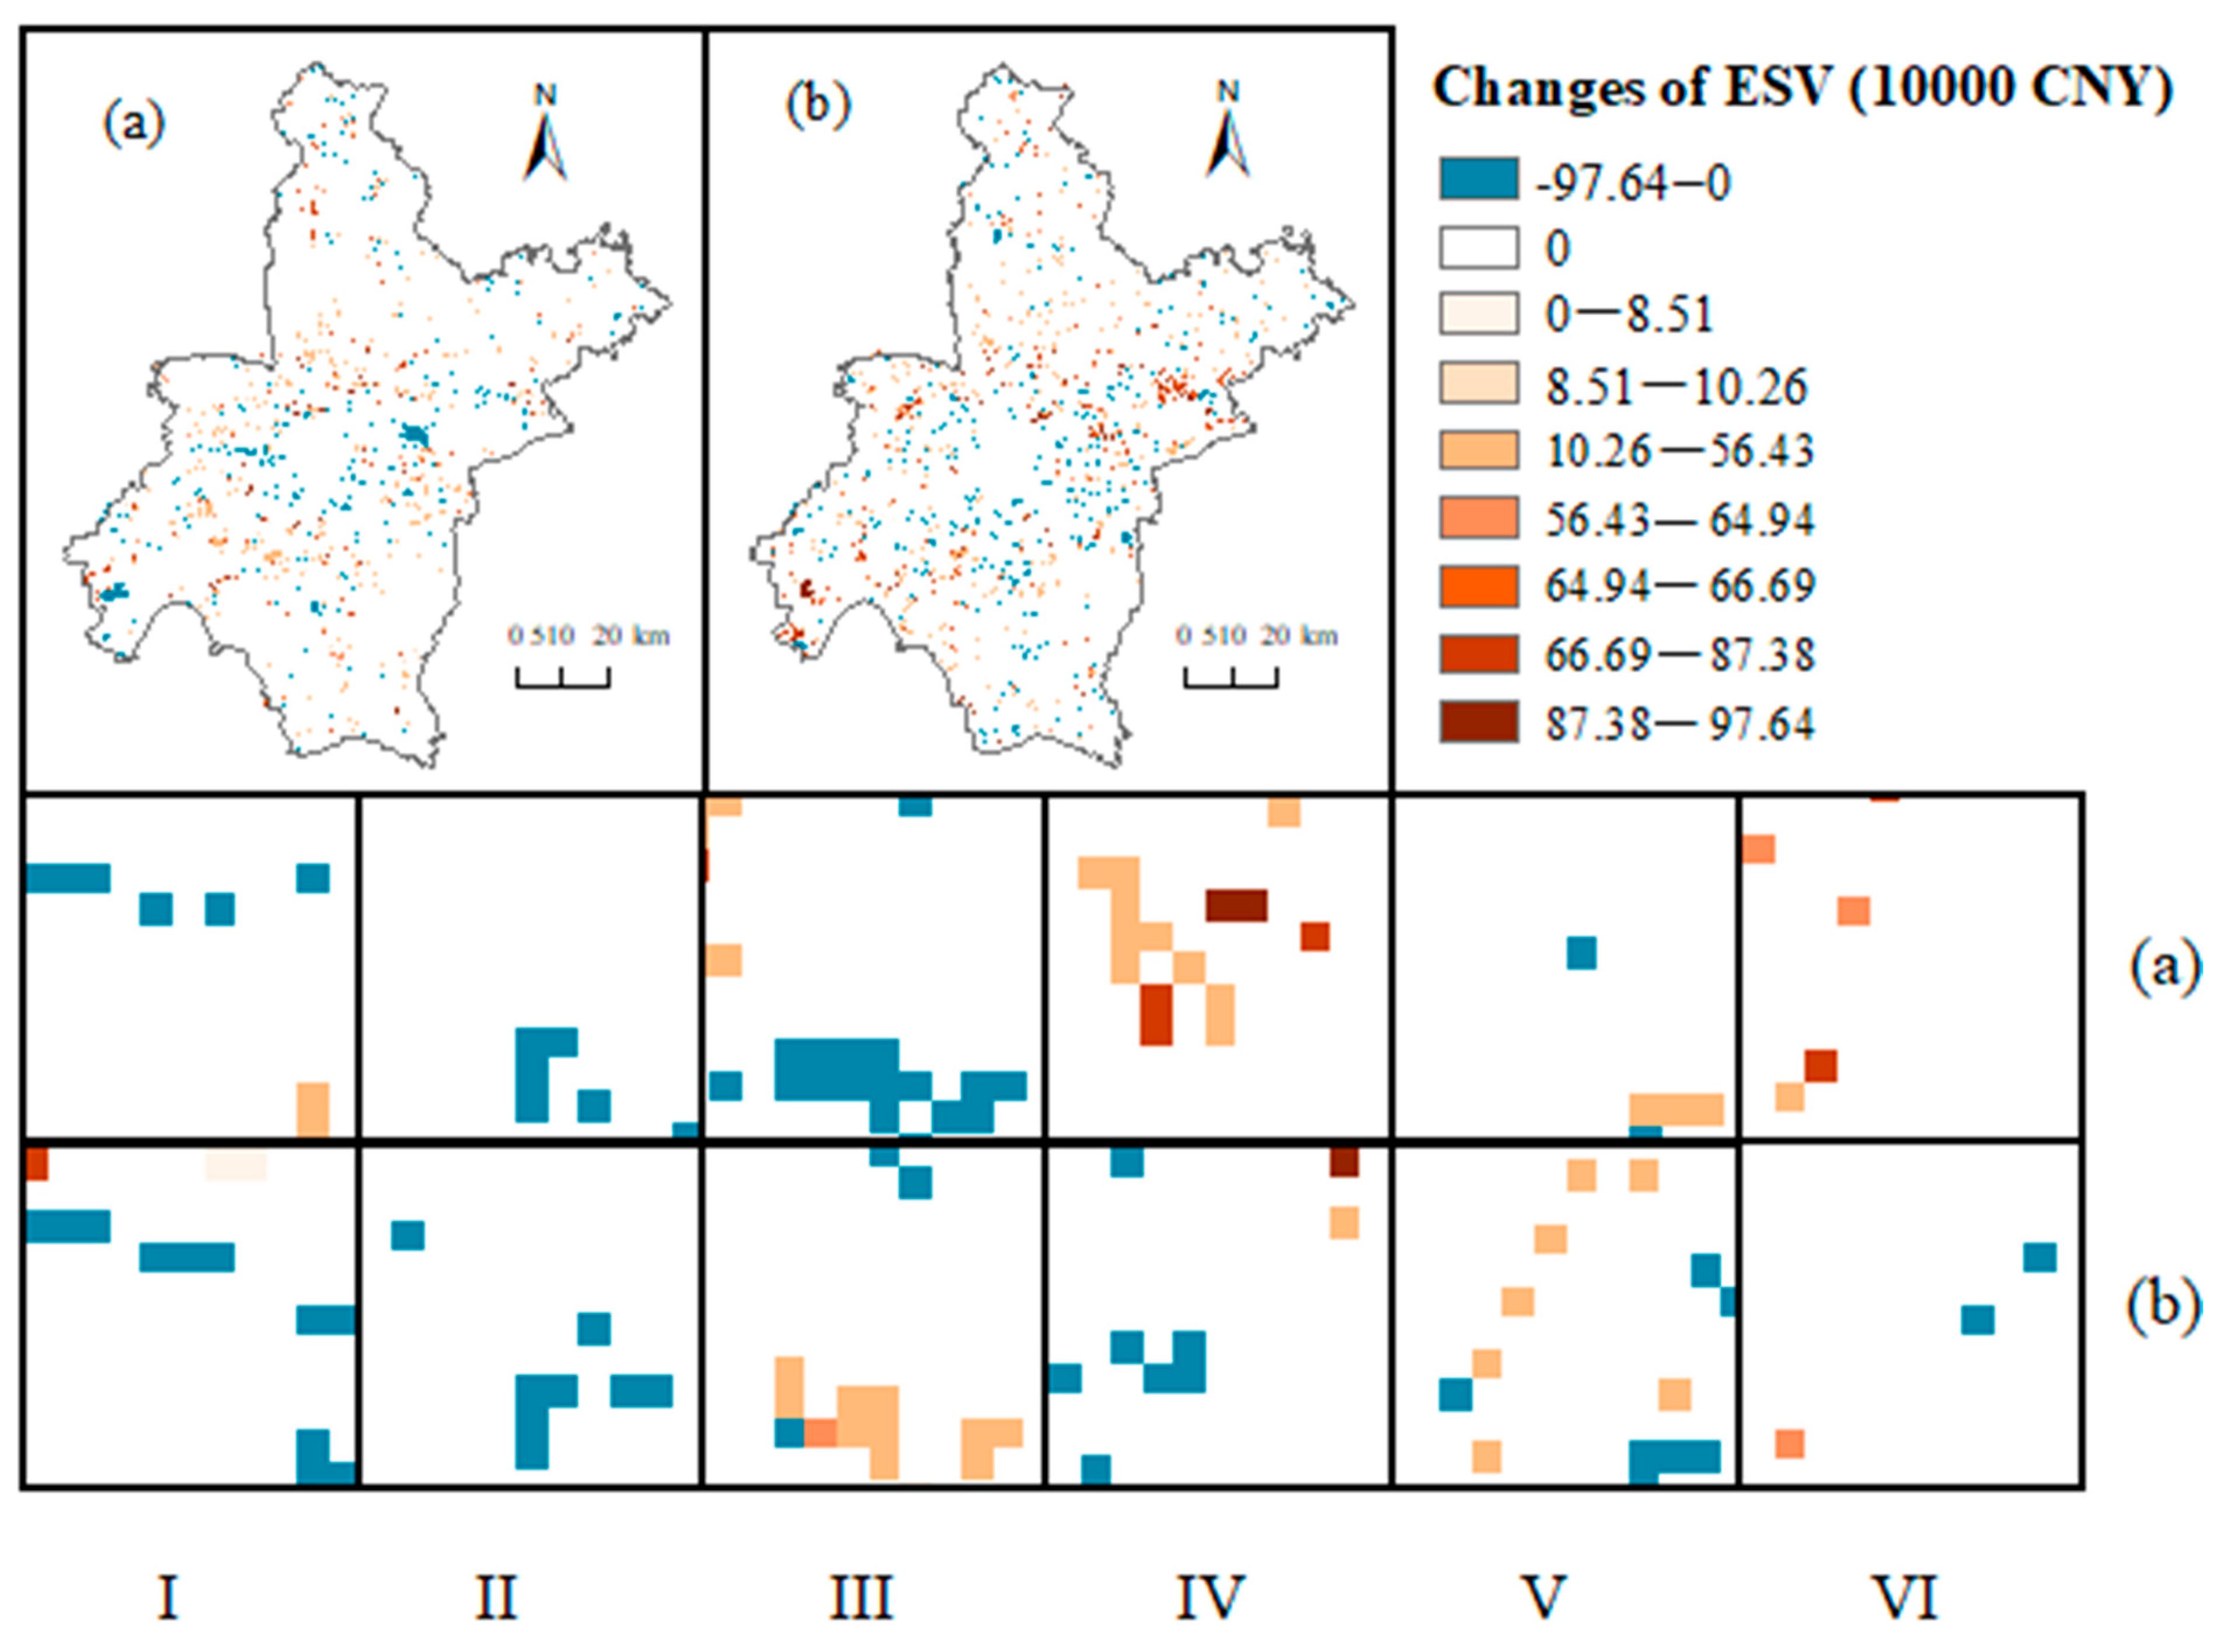
Figure 10 shows the spatial distribution of ESV before and after optimization for 2015 and 2020. In 2015, the total ESV of land use was approximately 1109.64 million Chinese Yuan (CNY), and it increased slightly to 1114.30 million CNY after optimization, showing a minor improvement. Specifically, after optimization, the area of farmland increased by 113.75 km2, contributing an additional 4.67 million CNY to the ESV. However, the areas of forests, grassland, water, and other land types did not change, and their respective contributions to ESV remained the same, at 203.33 million CNY, 17.19 million CNY, 701.71 million CNY, and 0.44 million CNY, respectively. In 2020, the total ESV of land use was approximately 1019.91 million CNY, and after optimization, it increased slightly to 1062.67 million CNY, again showing a slight improvement. After optimization, farmland and water areas increased by 40.50 km2 and 105.25 km2, respectively, contributing an additional 1.66 million CNY and 41.10 million CNY to the ESV. Meanwhile, the areas of forests, grassland, and other land types remained unchanged, with their contributions to ESV at 199.66 million CNY, 12.05 million CNY, and 0.45 million CNY, respectively. Since construction land contributes minimally to ESV, the reduction in construction land area between 2005 and 2015 and 2010 and 2020 did not result in a loss of ESV. In fact, the decrease in construction land allowed other land types to expand, leading to a slight increase in ESV. The results show that construction land became more concentrated around the central urban area, causing areas with reduced ESV to be primarily located at the urban fringe and in suburban areas, while areas with increased ESV were mainly found at the edges of the suburbs and in the outer regions.
A spatial comparison among functional zones reveals that the optimization of ESV varies along with the urban–rural gradient. In urban functional areas (I–II), ESV slightly increased, mainly due to small-scale green space restoration, which reflects the limited ecological flexibility in densely built environments. New development areas (III–IV) experienced moderate ESV improvements, mainly due to the alleviation of pressure from urban expansion on farmland. Outer suburbs (V–VI) experienced the most substantial ESV gains, where large-scale ecological restoration and water expansion significantly enhanced regulating and supporting services. Further analysis of service components reveals that the overall increase in ESV was mainly driven by regulating and supporting services—such as climate regulation, water conservation, and habitat maintenance—enhanced by the restoration of forest and water areas in suburban and outer suburban zones. This improvement aligns with the spatial aggregation of ecological land, as shown in Figure 9. In contrast, provisioning services, particularly crop production, declined slightly due to farmland loss in urban and peri-urban areas. These findings indicate that the optimization process effectively strengthened ecological regulating and supporting functions while maintaining essential agricultural capacity.

4. Discussion

4.1. Ecological System Service-Oriented Territorial Spatial Land Use Layout Optimization

National territorial spatial planning provides the fundamental framework for guiding development, protection, and construction activities in China. It emphasizes both land layout optimization and land use conversion regulation to enhance spatial efficiency and balance socio-economic growth with ecological sustainability [12,36,37]. In line with the principle of ecological civilization, spatial planning must account for the ecological and environmental impacts of land use [38]. Ecosystem services (ESs), which represent ecological processes and functions, offer an effective indicator for guiding land use layout optimization.
Incorporating ecosystem service value (ESV) into land use layout optimization involves addressing three key issues. First, ESV indicators must be appropriately selected and reasonably evaluated. This study adopts the equivalence factor method to estimate ESV, which, compared with direct market valuation, contingent valuation (CVM), and model-based methods [39,40,41], offers computational simplicity if data is readily available [33,42,43]. Moreover, its capability for real-time calculation during model iterations makes it particularly suitable as a land use optimization objective. Nevertheless, similar to other equivalence-based approaches, this method cannot effectively account for the spatial variations in ESV across different locations when optimizing land use [33,41].
Second, selecting an appropriate modeling method is critical for spatial land use optimization. In this study, a particle swarm optimization (PSO) algorithm is employed for multi-objective land use optimization. Although models such as Cellular Automata (CA), CLUE-S, FLUS, and PLUS have been widely used for land use simulation [22,44,45,46], they perform less effectively when applied to goal-oriented land use optimization. By contrast, PSO directly embeds the objective function to guide land use conversion during the optimization process, making the approach more efficient in achieving its objectives. Its transparent conceptualization and flexible parameterization also provide advantages for addressing complex multi-objective optimization.
Third, a robust mechanism is required to integrate ESV into the land use optimization process. The setting of parameters in the PSO model (e.g., land suitability, fitness functions and spatial constraints) can lead to varied outcomes. In this study, ESV is incorporated alongside land use error, spatial aggregation, and economic benefits to construct the objective function. The results confirm that this integrated PSO framework effectively optimizes land use landscape patterns and enhances ESV (Figure 9 and Figure 10).
The results of the proposed method in this study reveal several distinct findings. First, there is a continued decrease in farmland area and an expansion of construction land in Wuhan from 2005 to 2020. This persistent farmland loss is an inevitable outcome of the rapid industrial and urban expansion over the past two decades, accompanied by rural-to-urban migration and the decline of agricultural production. The observed pattern reflects a structural transformation rather than random fluctuations, consistent with Wu et al. [47], who noted that farmland across China has been increasingly converted from grain production to construction and other non-agricultural uses. Although the PSO-based optimization improved the spatial allocation, it did not reverse this overall trend of urbanization-driven land conversion, echoing the findings of Zhang et al. [34]. Therefore, controlling land use quantity and implementing farmland conservation remain critical components of territorial spatial planning to mitigate the pressures of economic growth on food security and ecological integrity [48,49,50].
Moreover, the results also confirm that the proposed framework yields a more aggregated landscape pattern. After optimization, fragmentation of farmland, construction land, and ecological land was reduced, and spatial aggregation increased (Figure 9). Scattered construction patches were consolidated, and ecological land became more spatially continuous around major built-up areas, particularly in suburban and outer suburban zones. A slight enhancement in ESV was also observed (Figure 10), mainly along suburban edges and ecological buffers. These results indicate that the proposed PSO framework can effectively alleviate ecosystem stress while maintaining land use balance, providing a methodological tool to support resource-efficient spatial development.
Finally, distinct spatial restructuring effects were observed among different urban functional areas. Specifically, in core urban areas (I–II), optimization reduced construction land fragmentation and improved land-use compactness; in suburban and outer suburban areas (V–VI), it controlled construction land expansion and maintained ecological and agricultural spaces. These results demonstrate the different performances of the framework in diverse urban–rural contexts to inform landscape planning: strengthening land use redevelopment to enhance land use intensity in the urban core, promoting balanced urban development and agricultural protection in urban–rural transitional zones (III–IV), and enhancing ecological protection in suburban and outer suburban regions (V–VI). Although this study provides a qualitative comparison of ESV improvements across functional zones, a more detailed quantitative assessment at the zone level could further strengthen the interpretation and will be explored in future work.

4.2. Improvements and Limitations

This study employs an improved PSO algorithm to conduct “goal-oriented” territorial spatial land use layout optimization. Compared to the “post-evaluation” approach [51,52], the “goal-oriented” method incorporates a specific objective as the objective function of the framework, allowing for a more direct land use optimization effect. When setting the objective function, this study not only considers economic benefits, land use intensification, and land use errors, but also includes ES objectives, which generates better performance in improving ES benefits during land use optimization. Moreover, compared to the other intelligence algorithms, such as FLUS and hybrid GA–CA models [21,22,51], the proposed PSO-based framework demonstrates greater adaptability for complex multi-objective optimization problems and requires fewer parameters to implement. It should be noted that a formal comparative analysis of computational performance against these algorithms was not conducted, as the primary aim of this study was to establish the feasibility of the multiple goal-oriented paradigm rather than to benchmark computational efficiency. With a clear conceptual framework, well-defined required parameters, and easy access to data, the proposed framework can be transferred and replicated under various environmental conditions.
Although the proposed method demonstrates several advantages, there remain aspects for improvement. First, the study focuses on constructing and validating a simulation framework based on a PSO module, based on the past land use patterns, but lacks a section for predicting future land use patterns. In fact, by simulating future land-use patterns under different policy and conservation scenarios, the framework can serve as a vital tool for informed and proactive territorial spatial planning. Second, when constructing the ESV objective, we treat all ESs as equally important, which does not explicitly consider the trade-offs or synergies among different ESs. Moreover, our ESV estimation, based on the equivalence factor method, does not account for the spatial heterogeneity of service potential within the same land-use type caused by variations in environmental factors such as soil, climate, or vegetation structure. Adjusting the relative weights of different ESs and incorporating higher-resolution environmental drivers in future work would help refine ecological priorities in land allocation. Third, the performance of PSO is influenced by parameter settings such as the inertia weight, learning coefficients, and spatial resolution. A systematic sensitivity analysis is required to quantify how parameters influence outcomes, thus enhancing the robustness and reliability of the proposed framework in future research. Finally, although a specific spatial policy, i.e., permanent basic farmland protection zones, was incorporated in the framework, some other economic aspects, e.g., land-use transition cost and ecological compensation, were not considered. Integrating cost–benefit or input–output analyses would improve the practical applicability of the framework in the real-world territorial spatial planning.

5. Conclusions

In this study, the PSO algorithm, built on a multi-objective function of land quantity, spatial intensification, economic benefits, and ESV, was utilized to conduct “goal-oriented” land use layout optimization in Wuhan City for 2015 and 2020. The optimization results reveal that farmland and water are the main land use types transferred out, while construction land is the main land use type transferred in. Moreover, compared to the actual land use layout, the optimized one shows the following characteristics: (1) The area of construction land in 2015 and 2020 slightly decreased, while the areas of farmland and ecological land slightly increased. (2) The construction land is more concentrated around the main urban area, releasing redundant construction land space and restoring some farmland and ecological land in suburban and outer suburban areas. (3) The landscape fragmentation of farmland, construction land, and ecological land decreased, and the spatial aggregation of these land types improved. (4) The total ESV increased, with a particularly noticeable improvement in ESs on the edges of the suburbs and outer suburbs. The results indicate that the PSO-based optimization framework developed in this study has a clear effect on optimizing land use layout, as well as improving ecosystem service levels, thus it is enlightening for coordinated development between human society and ecosystems.

Author Contributions

Conceptualization, Yan Zhang and Lu Wei; Methodology, Yiheng Wang; Software, Yiheng Wang; Validation, Yan Zhang, Lu Wei, and Yasi Tian; Formal analysis, Yasi Tian and Xu Zhou; Investigation, Lu Wei; Resources, Fanjie Kong; Data curation, Yan Zhang and Yasi Tian; Writing-original draft preparation, Yan Zhang; Writing-review and editing, Lu Wei, Fanjie Kong, Yang Zhang, and Yiyun Chen; Visualization, Yang Zhang; Supervision, Yiyun Chen; Project administration, Xu Zhou; Correspondence, Xu Zhou; Funding acquisition, Yan Zhang and Yiyun Chen. All authors have read and agreed to the published version of the manuscript.

Funding

This study was supported by the National Natural Science Foundation of China (No. 42101284) and (No. 42371200).

Data Availability Statement

The data are available from the corresponding author on reasonable request.

Conflicts of Interest

The authors declare no conflict of interest.

References

  1. Almulhim, A.I.; Cobbinah, P.B. Can rapid urbanization be sustainable? The case of Saudi Arabian cities. Habitat Int. 2023, 139, 102884. [Google Scholar] [CrossRef] [Scilit]
  2. He, C.; Liu, Z.; Tian, J.; Ma, Q. Urban Expansion Dynamics and Natural Habitat Loss in China: A Multiscale Landscape Perspective. Glob. Change Biol. 2014, 20, 2886–2902. [Google Scholar] [CrossRef] [Scilit]
  3. Li, S.; Shao, Y.; Hong, M.; Zhu, C.; Dong, B.; Li, Y.; Lin, Y.; Wang, K.; Gan, M.; Zhu, J.; et al. Impact mechanisms of urbanization processes on supply-demand matches of cultivated land multifunction in rapid urbanization areas. Habitat Int. 2023, 131, 102726. [Google Scholar] [CrossRef] [Scilit]
  4. United Nations. Transforming Our World: The 2030 Agenda for Sustainable Development; United Nations: New York, NY, USA, 2015; Available online: https://sdgs.un.org/publications/transforming-our-world-2030-agenda-sustainable-development-17981 (accessed on 24 February 2026).
  5. Longato, D.; Cortinovis, C.; Albert, C.; Geneletti, D. Practical applications of ecosystem services in spatial planning: Lessons learned from a systematic literature review. Environ. Sci. Policy 2021, 119, 72–84. [Google Scholar] [CrossRef] [Scilit]
  6. Pozoukidou, G.; Papageorgiou, M.; Kesisoglou, D. Integrating Ecosystem Services (E.S.) in Spatial Planning: A Literature Review. In Proceedings of the 17th International Conference on Environmental Science and Technology (CEST2021), Athens, Greece, 1–4 September 2021. [Google Scholar] [CrossRef] [Scilit]
  7. Toor, G.; Tater, N.G.; Chandra, T. Exploring Recent Trends in Integrating Urban Planning and Ecology. Environ. Dev. Sustain. 2024, 26, 19093–19111. [Google Scholar] [CrossRef] [Scilit]
  8. Millennium Ecosystem Assessment. Ecosystems and Human Well-Being: Synthesis; Island Press: Washington, DC, USA, 2005.
  9. Bekele, B.; Wu, W.; Tsegaye, L.; Tilahun, M.; Girma, T.; Assefa, H.K. Urban expansion-induced land use land cover changes and the subsequent changes in ecosystem service and land surface temperature in the central highland of Ethiopia. Environ. Sustain. Indic. 2025, 26, 100626. [Google Scholar] [CrossRef] [Scilit]
  10. Costanza, R.; de Groot, R.; Braat, L.; Kubiszewski, I.; Fioramonti, L.; Sutton, P.; Farber, S.; Grasso, M. Twenty years of ecosystem services: How far have we come and how far do we still need to go? Ecosyst. Serv. 2017, 28, 1–16. [Google Scholar] [CrossRef] [Scilit]
  11. de Groot, R.; Brander, L.; van der Ploeg, S.; Costanza, R.; Bernard, F.; Braat, L.; Christie, M.; Crossman, N.; Ghermandi, A.; Hein, L.; et al. Global estimates of the value of ecosystems and their services in monetary units. Ecosyst. Serv. 2012, 1, 50–61. [Google Scholar] [CrossRef] [Scilit]
  12. Fu, H.; Chai, B.; Jin, C.; Kang, H.; Zhang, Y.; Tan, X.; Wang, W. Response and prediction of ecosystem service values to land use change resulting from underground coal mining in high groundwater table areas: A case study of Jining City, China. Environ. Sustain. Indic. 2024, 23, 100441. [Google Scholar] [CrossRef] [Scilit]
  13. Sannigrahi, S.; Bhatt, S.; Rahmat, S.; Paul, S.K.; Sen, S. Estimating global ecosystem service values and its response to land surface dynamics during 1995–2015. J. Environ. Manag. 2018, 223, 115–131. [Google Scholar] [CrossRef] [Scilit]
  14. Peng, K.F.; Jiang, W.G.; Ling, Z.Y.; Hou, P.; Deng, Y.W. Evaluating the potential impacts of land use changes on ecosystem service value under multiple scenarios in support of SDG reporting: A case study of the Wuhan urban agglomeration. J. Clean. Prod. 2021, 307, 127321. [Google Scholar] [CrossRef] [Scilit]
  15. Tonyaloğlu, E.E. Future land use/land cover and its impacts on ecosystem services: Case of Aydın, Turkey. Int. J. Environ. Sci. Technol. 2025, 22, 4601–4617. [Google Scholar] [CrossRef] [Scilit]
  16. Li, X.; Xu, H.B.; Jing, X.D.; Huang, Y. A two-step spatially explicit optimization approach of integrating ecosystem services (ES) into land use planning (LUP) to generate the optimally sustainable schemes. Land Degrad. Dev. 2023, 34, 2508–2522. [Google Scholar] [CrossRef] [Scilit]
  17. Geissler, C.H.; Haan, N.L.; Basso, B.; Fowler, A.; Landis, D.A.; Lark, T.J.; Maravelias, C.T. A multi-objective optimization model for cropland design considering profit, biodiversity, and ecosystem services. Ecol. Model. 2025, 500, 110954. [Google Scholar] [CrossRef] [Scilit]
  18. Cheng, L.; Sun, H.; Zhang, Y.; Zhen, S. Spatial structure optimization of mountainous abandoned mine land reuse based on system dynamics model and CLUE-S model. Int. J. Coal Sci. Technol. 2019, 6, 113–126. [Google Scholar] [CrossRef] [Scilit]
  19. Dammag, A.Q.; Dai, J.; Cong, G.; Derhem, B.Q.; Latif, H.Z. Assessing and predicting changes of ecosystem service values in response to land use/land cover dynamics in Ibb City, Yemen: A three-decade analysis and future outlook. Int. J. Digit. Earth 2024, 17, 2323174. [Google Scholar] [CrossRef] [Scilit]
  20. Marey, A.; Wang, L.; Goubran, S.; Gaur, A.; Lu, H.; Leroyer, S.; Belair, S. Forecasting urban land use dynamics through patch-generating land use simulation and Markov chain integration: A multi-scenario predictive framework. Sustainability 2024, 16, 10255. [Google Scholar] [CrossRef] [Scilit]
  21. Zhang, Y.; Yu, P.H.; Tian, Y.S.; Chen, H.T.; Chen, Y.Y. Exploring the impact of integrated spatial function zones on land use dynamics and ecosystem services tradeoffs based on a future land use simulation (FLUS) model. Ecol. Indic. 2023, 150, 110246. [Google Scholar] [CrossRef] [Scilit]
  22. Zhu, Y.; Zhou, M. Optimization of land use structure integrating ecosystem service function and economic development—A case study in Dongting Lake Ecological and Economic Zone, China. Environ. Sustain. Indic. 2025, 26, 100604. [Google Scholar] [CrossRef] [Scilit]
  23. Coello, C.A.C.; Lechuga, M.S. MOPSO: A proposal for multiple objective particle swarm optimization. In Proceedings of the 2002 Congress on Evolutionary Computation (CEC’02, Cat. No. 02TH8600), Honolulu, HI, USA, 12–17 May 2002; Volume 2, pp. 1051–1056. [Google Scholar] [CrossRef] [Scilit]
  24. García, I.C.; Coello, C.A.C.; Arias-Montaño, A. MOPSOhv: A new hypervolume-based multi-objective particle swarm optimizer. In Proceedings of the 2014 IEEE Congress on Evolutionary Computation (CEC), Beijing, China, 6–11 July 2014; pp. 266–273. [Google Scholar] [CrossRef] [Scilit]
  25. Zhu, Q.L.; Lin, Q.Z.; Chen, W.N.; Wong, K.C.; Coello, C.A.C.; Li, J.Q.; Chen, J.Y.; Zhang, J. An External Archive-Guided Multiobjective Particle Swarm Optimization Algorithm. IEEE Trans. Cybern. 2017, 47, 2794–2808. [Google Scholar] [CrossRef] [Scilit]
  26. Liu, X.; Ou, J.; Li, X.; Ai, B. Combining System Dynamics and Hybrid Particle Swarm Optimization for Land Use Allocation. Ecol. Model. 2013, 257, 11–24. [Google Scholar] [CrossRef] [Scilit]
  27. Li, F.X.; Gong, Y.; Cai, L.Y.; Sun, C.Y.; Chen, Y.M.; Liu, Y.X.; Jiang, P.H. Sustainable Land-Use Allocation: A Multiobjective Particle Swarm Optimization Model and Application in Changzhou, China. J. Urban Plan. Dev. 2018, 144, 04018010. [Google Scholar] [CrossRef] [Scilit]
  28. Mirghaed, F.A.; Mohammadzadeh, M.; Salmanmahiny, A.; Mirkarimi, S.H. Decision scenarios using ecosystem services for land allocation optimization across Gharehsoo watershed in northern Iran. Ecol. Indic. 2020, 117, 106645. [Google Scholar] [CrossRef] [Scilit]
  29. Li, W.; Chen, Z.J.; Li, M.C.; Zhang, H.; Li, M.Y.; Qiu, X.Q.; Zhou, C. Carbon emission and economic development trade-offs for optimizing land-use allocation in the Yangtze River Delta, China. Ecol. Indic. 2023, 147, 109950. [Google Scholar] [CrossRef] [Scilit]
  30. Wuhan Municipal Bureau of Statistics. Wuhan Statistical Bulletin on National Economic and Social Development in 2022; Wuhan Municipal Bureau of Statistics: Wuhan, China, 2023. Available online: https://tjj.wuhan.gov.cn/tjfw/tjgb/202303/t20230330_2177979.shtml (accessed on 24 February 2026).
  31. Xie, Q.J.; Liu, J.H. Spatio-temporal dynamics of lake distribution and their impact on ecosystem service values in Wuhan urbanized area during 1987–2016. Acta Ecol. Sin. 2020, 40, 7840–7850. [Google Scholar] [CrossRef] [Scilit]
  32. Eberhart, R.C.; Kennedy, J. A new optimizer using particle swarm theory. In Proceedings of the Sixth International Symposium on Micro Machine and Human Science (MHS'95), Nagoya, Japan, 4–6 October 1995; pp. 39–43. [Google Scholar] [CrossRef] [Scilit]
  33. Li, Z.J.; Chen, J.P.; Zhang, W.K.; Lei, L.Z.; Sha, Z.Y. Analysis of spatiotemporal differentiation and driving factors of ecosystem service value in Hubei Province, China. Sci. Surv. Mapp. 2023, 48, 245–257. [Google Scholar] [CrossRef]
  34. Yuan, L.; Liu, Y.H.; Qiu, J.J. An Optimal Allocation Analysis of Land Use under Different Scenarios with Economic and Ecological Benefits in Guangzhou. Ecol. Econ. 2021, 37, 103–109. [Google Scholar] [CrossRef]
  35. Zhang, Y.; Chang, X.; Liu, Y.F.; Lu, Y.C.; Wang, Y.H.; Liu, Y.L. Urban expansion simulation under constraint of multiple ecosystem services (MESs) based on cellular automata (CA)-Markov model: Scenario analysis and policy implications. Land Use Policy 2021, 108, 105667. [Google Scholar] [CrossRef] [Scilit]
  36. Ma, J.R.; Tian, L.; Zhang, Y.D.; Yang, X.; Li, Y.F.; Liu, Z.A.; Zhou, L.; Wang, Z.X.; Ouyang, W. Global Property Rights and Land Use Efficiency. Nat. Commun. 2024, 15, 8525. [Google Scholar] [CrossRef] [Scilit] [PubMed]
  37. Zhang, Q.; Shen, X.X.; Shen, C.Z.; Chen, Y.Q.; Su, B.; Yin, Q.Q.; Zhou, S.L. Integration of Land Ecological Consolidation and Ecosystem Product Value Realization: A Case from the Yangtze Riverside Industrial Park in Changzhou, China. J. Environ. Manag. 2024, 353, 120120. [Google Scholar] [CrossRef] [Scilit]
  38. Yu, P.H.; Wei, Y.J.; Ma, L.J.; Wang, B.; Yung, E.H.K.; Chen, Y.Y. Urbanization and the urban critical zone. Earth Crit. Zone 2024, 1, 100011. [Google Scholar] [CrossRef] [Scilit]
  39. Barrio, M.; Loureiro, M.L. A meta-analysis of contingent valuation forest studies. Ecol. Econ. 2010, 69, 1023–1030. [Google Scholar] [CrossRef] [Scilit]
  40. Brander, L.M.; Bräuer, I.; Gerdes, H.; Ghermandi, A.; Kuik, O.; Markandya, A.; Navrud, S.; Nunes, P.A.L.D.; Schaafsma, M.; Vos, H.; et al. Using meta-analysis and GIS for value transfer and scaling up: Valuing climate change induced losses of European wetlands. Environ. Resour. Econ. 2012, 52, 395–413. [Google Scholar] [CrossRef] [Scilit]
  41. Hamel, P.; Guerry, A.D.; Polasky, S.; Han, B.; Douglass, J.A.; Hamann, M.; Janke, B.; Kuiper, J.J.; Levrel, H.; Liu, H.; et al. Mapping the benefits of nature in cities with the InVEST software. npj Urban Sustain. 2021, 1, 25. [Google Scholar] [CrossRef] [Scilit]
  42. Costanza, R.; d’Arge, R.; de Groot, R.; Farber, S.; Grasso, M.; Hannon, B.; Limburg, K.; Naeem, S.; O’Neill, R.V.; Paruelo, J.; et al. The value of the world’s ecosystem services and natural capital. Nature 1997, 387, 253–260. [Google Scholar] [CrossRef] [Scilit]
  43. Xie, G.D.; Zhang, C.X.; Zhang, L.M.; Chen, W.H.; Li, S.M. The Improvement of Ecosystem Service Valuation Method Based on Unit Area Value Equivalent Factor. J. Nat. Resour. 2015, 30, 1243–1254. [Google Scholar] [CrossRef]
  44. Liang, X.; Guan, Q.F.; Clarke, K.C.; Chen, G.Z.; Guo, S.; Yao, Y. Mixed-Cell Cellular Automata: A New Approach for Simulating the Spatio-Temporal Dynamics of Mixed Land Use Structures. Landsc. Urban Plan. 2021, 205, 103960. [Google Scholar] [CrossRef] [Scilit]
  45. Liu, X.P.; Liang, X.; Li, X.; Xu, X.C.; Ou, J.P.; Chen, Y.M.; Li, S.Y.; Wang, S.J.; Pei, F.S. A future land use simulation model (FLUS) for simulating multiple land use scenarios by coupling human and natural effects. Landsc. Urban Plan. 2017, 168, 94–116. [Google Scholar] [CrossRef] [Scilit]
  46. Zhang, Y.F.; Yu, M.K.; Ye, Y.S. Spatial Land Use Optimization Using the CLUE-S Model: A Case Study in the Keerqinzuoyihou Banner, China. Pol. J. Environ. Stud. 2022, 31, 5963–5974. [Google Scholar] [CrossRef] [Scilit]
  47. Wu, X.; Zhao, N.; Wang, Y.; Zhang, L.; Wang, W.; Liu, Y. Cropland Non-Agriculturalization Caused by the Expansion of Built-Up Areas in China during 1990–2020. Land Use Policy 2024, 146, 107312. [Google Scholar] [CrossRef] [Scilit]
  48. Lan, Y.; Xu, B.J.; Huan, Y.Z.; Guo, J.H.; Liu, X.J.; Han, J.W.; Li, K.R. Food security and land use under sustainable development goals: Insights from food supply to demand side and limited arable land in China. Foods 2023, 12, 4168–4187. [Google Scholar] [CrossRef] [Scilit]
  49. Li, X.; Liu, X.J.; Lu, S.J.; Cheng, G.Y.; Hu, Y.C.; Liu, J.G.; Dou, Z.X.; Cheng, S.K.; Liu, G. China’s food loss and waste embodies increasing environmental impacts. Nat. Food 2021, 2, 519–528. [Google Scholar] [CrossRef] [Scilit]
  50. Xu, Y.F.; Zhao, X.Q.; Huang, P.; Pu, J.W.; Ran, Y.J.; Zhou, S.J.; Zhao, Q.Q.; Feng, Y.; Tang, Y.Y.; Tao, J.Y.; et al. A New Framework for Multi-Level Territorial Spatial Zoning Management: Integrating Ecosystem Services Supply-Demand Balance and Land Use Structure. J. Clean. Prod. 2024, 441, 141053. [Google Scholar] [CrossRef] [Scilit]
  51. Shu, R.; Wang, Z.; Guo, N.; Wei, M.; Zou, Y.; Hou, K. Multi-Scenario Land Use Optimization Simulation and Ecosystem Service Value Estimation Based on Fine-Scale Land Survey Data. Land 2024, 13, 557. [Google Scholar] [CrossRef] [Scilit]
  52. Zhang, M.M.; Chen, E.Q.; Zhang, C.; Liu, C.; Li, J.X. Multi-scenario simulation of land use change and ecosystem service value based on the Markov–FLUS model in Ezhou City, China. Sustainability 2024, 16, 6237. [Google Scholar] [CrossRef] [Scilit]
Figure 1. Study Area. Location of Wuhan city in China, three functional areas according to urban–rural gradient in Wuhan City (I–II represent urban functional areas, areas III–IV represent new urban development areas, and areas V–VI represent outer suburban areas); land use types in Wuhan City.
Ijgi 15 00103 g001
Figure 2. Flowchart of the method.
Ijgi 15 00103 g002
Figure 3. Schematic diagram of land suitability evaluation based on BPANN.
Ijgi 15 00103 g003
Figure 4. Area of each land-use type in actual and simulated framework visualizations (km2).
Ijgi 15 00103 g004
Figure 5. Land-use transition matrix, actual and simulated framework implementation (Unit: km2).
Ijgi 15 00103 g005
Figure 6. Spatial land-use layout under different scenarios: (a) actual land use in 2005; (b) actual land use in 2015; (c) simulated land use in 2015.
Ijgi 15 00103 g006
Figure 7. Spatial land-use layout under different scenarios: (a) actual land use in 2010; (b) actual land use in 2020; (c) simulated land use in 2020.
Ijgi 15 00103 g007
Figure 8. Spatial distribution of land-use transitions. (a) Observed land-use transitions from 2005 to 2015; (b) simulated spatial land-use transitions from 2005 to 2015; (c) observed land-use transitions from 2010 to 2020; (d) simulated spatial land-use transitions from 2010 to 2020.
Ijgi 15 00103 g008
Figure 9. Changes in landscape pattern indices for construction land, farmland, and ecological land from actual to simulated scenarios. (NP: number of patches, ED: edge density, PARA_MN: Mean value of perimeter–area ratio; AI: aggregation index).
Ijgi 15 00103 g009
Figure 10. Spatial distribution of ESV changes before and after framework optimization: (a) 2015 (simulated)–2015 (actual); (b) 2020 (simulated)–2020 (actual).
Ijgi 15 00103 g010
Table 1. Basic information on the six observation areas in Wuhan.
IDFunctional Zone TypeKey Land Use Characteristics
IUrban functional areaHigh-density built-up area; minimal farmland or vegetation.
IIUrban functional areaDense residential and public facilities; limited ecological land.
IIINew urban development areaMix of industrial, residential, and remaining farmland; active land conversion.
IVNew urban development areaRapid urban expansion alongside remaining wetlands and farmland.
VOuter suburban countryDominated by farmland and woodland; lower construction intensity.
VIOuter suburban countryLarge proportion of forest and water bodies; key ecological buffer.
Table 2. Economic benefit coefficient table (1000 CNY/km2) [34].
Benefit IndicatorFarmlandForestsGrasslandWaterConstruction LandOther Land
Economic Benefit Coefficient144.17462.38164.561990.24110.571
Table 3. Unit area ESV equivalency adjustment table for Hubei Province (10,000 CNY/ha) [33].
ESs/LULCFarmlandForestsGrasslandWaterConstruction LandOther Land
Provision servicesCrop production0.18470.04220.05010.133700.0000
Raw materials0.04090.09690.07440.038400.0000
Water yield−0.21810.05010.04091.385400.0000
Regulation servicesGas regulation0.14870.31880.25990.128700.0100
Climate0.07770.95380.68770.382700.0000
Environment0.02260.27950.22730.927500.0300
Support servicesSoil formation0.08690.38810.31670.155400.0100
Nutrient cycling0.02590.02970.02420.011700.0000
Habitat0.02840.35340.28830.426100.0100
Cultural servicesoutdoor0.01250.15500.12700.315800.0100
Total value0.41032.66752.09643.905400.0700
Table 4. Model parameters.
ω c 1 c 2 αβγδεPopulation SizeIteration Count
0.20.40.40.20.20.20.20.21000200
Table 5. Landscape pattern indices.
LandscapeFormulaDescription
Number of Patches NP = N N” represents the total number of patches in the landscape.
Edge Density ED = E A × 10000 E” represents the total edge length, with the unit of meters. “A” represents the total area of the landscape, with the unit of square meters.
Perimeter–Area Ratio PAR = P A P” represents the perimeter of a patch, with the unit of meters; “A” represents the area of a patch, with the unit of square meters.
Aggregation Index AI = gii max - gii × 100 gii” represents the actual number of like adjacencies, while “max-gii” represents the maximum possible number of like adjacencies.
Table 6. The improvement of landscape pattern indices for farmland, construction land, and ecological land from actual to simulated scenarios. (NP: number of patches, ED: edge density, PARA_MN: Mean value of perimeter–area ratio; AI: aggregation index).
YearLandNPEDPARA_MNAI
2015Farmland−10.48%−7.37%−0.17%3.07%
Construction land−29.55%−24.66%−0.11%14.41%
Ecological land−1.50%−2.11%−0.07%0.95%
2020Farmland−13.21%−12.02%−0.06%4.49%
Construction land−37.39%−29.42%−0.13%16.35%
Ecological land−12.00%−5.42%−0.03%4.78%
Disclaimer/Publisher’s Note: The statements, opinions and data contained in all publications are solely those of the individual author(s) and contributor(s) and not of MDPI and/or the editor(s). MDPI and/or the editor(s) disclaim responsibility for any injury to people or property resulting from any ideas, methods, instructions or products referred to in the content.