1. Introduction
An estimated 63 million people aged 65 and older lived in the United States in 2025, representing 19% of all U.S. residents. This number is expected to increase by 30% to 82 million by 2050, comprising 23% of the U.S. population [
1]. For adults aged 65 and older, the total Medicare (U.S. federal health insurance program for insured people aged 65 and older and eligible people with disabilities) expenditures in 2020 were
$624 billion, with additional costs of
$123 billion in Medicaid spending,
$162 billion from private health insurance,
$165 billion out-of-pocket spending, and
$170 billion from other payers and programs [
2]. Additionally, billions of dollars in unpaid informal care are provided to older adults; a 2014 study valued this care at
$522 billion per year [
3]. As a result, maintaining the health and well-being of this segment of the population is an important societal goal [
4].
Geospatial mobility, or movement beyond one’s home to areas within and beyond a community [
5], is necessary in later life to experience optimal physical and mental health, and full social inclusion and participation [
6,
7]. Older adults’ geospatial mobility is an important component of active aging [
8]. It is associated with better physical and mental health, and lower levels of depression and loneliness [
9,
10,
11]. Accessing public spaces away from the home is vital to older adults’ social participation, helping them connect not only with friends but also with acquaintances and others more peripheral in their lives [
8]. Transportation to destinations outside the home is also essential for fulfilling basic and social needs for quality of life and for fostering a sense of community for older adults [
8,
12]. Despite the importance of mobility to older adults’ health and well-being, older Americans often face significant challenges in accessing reliable transportation options. With increased age, the experience of unmet travel needs (i.e., not having transportation to desired locations) becomes more common [
13], especially for people who have aged into disabling conditions that make driving themselves or using public transportation difficult or impossible [
14,
15]. For example, people with dementia need transportation that is not only affordable but also provided in circumstances that are low in stress, noise, and navigation complexity, and by ride providers who are understanding, patient, and empathetic [
16], such as would be delivered by private ride providers.
1.1. U.S. Policy to Meet the Travel Needs of Older Adults
In the United States, the main policy response for people with disabilities that prevent them from using fixed route public transportation, including age-related functional limitations, is the Americans with Disabilities Act (ADA) mandate for paratransit services. Paratransit is a type of alternative transportation operating within the same service area as fixed public transit routes. Beyond paratransit services, the federal government offers no policy response specifically for older adults. ADA paratransit services consist of origin-to-destination transportation—often in vehicles such as wheelchair-accessible vans or small buses with lifts or ramps—in locations within a designated paratransit zone, usually defined as a ¾-mile buffer around fixed-route public transportation [
17]. The cost to the public to provide ADA paratransit services can be astonishingly high; a study of costs from 2013 to 2018 in five Texas cities found the average operational cost of taking one person to a common destination (e.g., grocery store, health care, religious services) was
$88 in 2018 [
18].
Despite the provision of these costly services to many older adults, the transportation needs of many older adults in the United States remain largely unfulfilled [
13]. Many older adults consider paratransit services an unattractive way to fulfill their needs because they are geographically limited, require booking in advance, are inconsistent and unreliable, are considered inconvenient, have high variability in terms of travel times per trip, often have long wait times, and may limit the number of non-disabled companions who may accompany the older adults [
19,
20,
21]. Moreover, most older adults, especially those in suburban and rural areas, are accustomed to using private automobiles for transportation, which offer convenience, independence, and even a sense of self-identity [
22,
23,
24]. In general, older adults in the United States prefer private automobiles for transportation over other modes. For those who can no longer drive or who never drove, riding with someone else in the ride provider’s automobile (i.e., “getting rides”) is a common form of transportation [
25,
26]. Policy solutions to older adults’ transportation needs should consider the role of private ride provision due to its potential cost savings, efficiencies, and alignment with older adults’ practices, preferences, and needs.
This manuscript seeks to build preliminary knowledge and capacity for conducting research and considering new policy approaches by exploring ways to assess and operationalize what we conceive of as the geospatial burden of providing rides for older adults [
27]. Research related to the operationalization and assessment of transportation burden is a necessary first step in considering subsidies, reimbursement, or other ways to support private ride provision for older adults’ transportation.
1.2. Private Rides Given to Older Adults
For older adults who cannot drive themselves to destinations, getting rides from others in their informal and formal care networks is the most common and preferred alternative mode of transportation [
25,
26,
28]. Within these networks, family members and friends are the primary source of rides [
29]. Survey research of a sample of 1103 nationally representative Medicare recipients with at least one caregiver found caregivers were an average of 62 years old (SD = 14.3) and tended to be adult children (51%) or spouses (22%), and most (55%) lived with the care recipient [
30]. A survey of a random sample of 268 informal caregivers in Michigan (M
age = 61 years; SD = 9.4 years) who provided transportation for their care recipients found that 82% of the transportation providers were relatives (53% children, 6% spouses, 20% other family) and 18% were friends [
31].
Among primary caregivers who provided older Medicare recipients with rides, an estimated one-third provide rides every day or most days per week [
30]. For U.S. residents who provide care to older adults, approximately 16% of their daily routine travel time is spent transporting their care recipient [
32]. Ride providers provide transportation less frequently to older adults with high levels of support needs [
30], perhaps because of the added complexities of transporting someone with high levels of functional limitations. Caregivers who provide regular transportation have reported spending more total hours per week in overall caregiving tasks [
33], suggesting an increased burden for those who provided rides to their older care recipient. In Michigan, almost half (47%) of transportation providers surveyed worked outside the home for pay [
31]. For this group, the additional hours of caregiving required to provide transportation could take an even greater toll. Among a nationally representative sample of Millennials (those born from 1980 to 1998 and aged 18 through 34 at the time of the study) who provided care to an older adult with dementia, transportation was the most common type of assistance, reported by 79% of the caregivers [
34]. A large majority of the Millennial caregivers (84%) lived in a different household than the older adult care recipient, and 16% reported having to drive over an hour to get to the house of the person living with dementia. They indicated emotional distress and missing work were consequences of their caregiving. Providing transportation assistance to the care recipient can have positive effects, such as acknowledgement of emotional and loving bonds [
35]. However, it can also present challenges for the ride provider, including disruption of the ride provider’s own pursuits, scheduling conflicts, missed work, increased stress, feelings of pressure related to a sense of obligation, strain on familial roles, and even changes in living situations [
35,
36].
Older adults are likely aware of these difficulties. They have reported a reticence to ask for rides out of concern for being a burden or an inconvenience, or from recognizing that ride providers may not be able to reliably and consistently provide rides [
37,
38]. As a result, they may limit or delay trips outside the home [
39], which could lead to an erosion of well-being [
6,
7].
1.3. Assessing Ride Provider Burden
Although providing transportation to older adults can pose challenges and place a burden on their ride providers, few geospatial or transportation-specific tools for quantifying the burden exist. Price [
40] developed a 34-item scale for providers to self-report the degree of their burden with items such as, “Providing transportation for my loved one feels confining to me,” “Providing transportation for my loved one tries my patience,” and “I cannot afford to pay for transportation assistance for my loved one” (pp. 107–114). These items capture a holistic perspective of burden ranging from emotional and mental to financial. However, they do not account for accessibility (i.e., the extent to which the ride provider can easily reach the older adult and his or her travel destinations). If older adults and their destinations are more accessible, the ride provider will likely be able to provide rides more frequently and with less personal sacrifice.
For research and policy directly related to financial and time costs of providers, quantifying the accessibility of the locations to which an older adult is transported is critical. Several different approaches are used to measure accessibility to types of destinations (e.g., health care facilities), including distance, travel time, the number of opportunities (e.g., service providers/locations) within a specified distance or travel time from one’s home, and the number of opportunities within an area based on an individual’s routine activities [
41,
42]. Distance and travel time to a ride recipient’s destinations have limitations as measures of a ride provider’s burden because they do not account for the routine travel of the ride provider. For instance, a 10-mile drive to take someone to a medical appointment places a greater burden on the ride provider if the facility is in the opposite direction from the ride provider’s work location. However, if the ride provider works 10 miles away and the health care facility is one block from their work, the 10-mile drive would be much more accessible for the driver. Similarly, considering the number of opportunities within a certain time or distance constraint using a cumulative opportunity approach [
43], may not be appropriate as the concern is not how many opportunities the ride provider can access for themselves, but rather how easily the ride provider can access a destination determined by the older adult’s preferences and needs (e.g., a neighborhood senior center where they have long-standing social connections). To address these limitations, we propose an approach that considers the ride provider’s routine travel patterns when assessing levels of geospatial accessibility and, consequently, the ride provider’s burden.
Activity Spaces
To consider the routine travel of a ride provider when assessing their potential ride-providing burden, we use the concept of an activity space. An activity space is the local geographical area in which a person moves during their day-to-day routine activities [
44]. It can be perceived as the movement near one’s home, for routine activities, and around and through the areas where routine activities occur [
45]. Rather than relying solely on residential boundaries, activity spaces capture individuals’ routine mobility and therefore may offer a more accurate depiction of their functional neighborhoods [
46]. Because they reflect the locations people actually encounter in daily life, activity spaces are frequently used to assess spatial access to resources and opportunities within local environments [
44,
47].
A range of spatial representations has been proposed for modeling activity spaces [
45,
48]. Among these, the one standard deviation ellipse (SDE1) has been identified as especially informative for accessibility analyses based on comparative testing of alternative methods [
49]. The SDE1 is generated by calculating an ellipse around the geographic mean center of an individual’s activity locations, enclosing approximately 68% of all recorded activities [
49,
50].
1.4. Gaps in Knowledge and the Current Study
Despite the potentially harmful individual and societal consequences of both unmet travel needs for older adults and the burden on ride providers, few studies have explored how best to measure transportation burden, and even fewer, if any, have used geospatial accessibility approaches to understand the potential burden of providing private automobile transportation to older adults. Building on identified gaps, this analysis uses an activity space approach to investigate geospatial ride-providing burden among people providing transport in personal automobiles to older Vietnamese adults, using data collected in a study conducted in the Dallas–Fort Worth, Texas area (DFW) [
27].
This analysis draws on survey data from individuals who provide rides to construct two distinct activity spaces: one reflecting routine daily activities and another capturing travel related to ride provision. Based on these representations, the study introduces a set of activity space-based indicators of geospatial burden, evaluates their interrelationships, and assesses how they correspond with the impacts of providing rides. The broader objective is to generate evidence relevant to policy, practice, and research that can both support ride providers and reduce barriers to geospatial mobility for older adults. This exploratory study poses two main research questions:
What are the levels of three indicators of ride-providing burden: (1) the size of the ride-provision activity space, (2) the share of that area that lies outside the provider’s accessible area, and (3) the portion of ride-provision space considered inaccessible to the ride provider relative to their regular activity space?
How are three indicators correlated and related to ride provision frequency and experiencing a negative impact from providing rides?
2. Materials and Methods
This exploratory study used cross-sectional survey data that were collected from July 2020 to January 2021. The University of Texas at Arlington’s research ethical review committee reviewed and approved all aspects of this research (IRB protocol #2019-0454). The study examined transportation among older Vietnamese immigrants in DFW. Additional methodological information is available elsewhere [
27,
51]. In community meetings prior to the research, representatives from this population of older adults had expressed difficulties accessing transportation to social and health care opportunities, leading to the development and implementation of this research. Prior research has documented transportation disadvantage and unmet travel needs among older immigrants [
52,
53], yet little, if any, research has examined transportation among older Vietnamese immigrants. Because older Vietnamese immigrants have high levels of chronic illness and disability [
54] and often live in language-isolated households [
55] or low-density urban areas with high levels of automobile dependency [
56], they are at increased risk for unmet travel needs [
13] and warrant research attention.
The current study focuses on two types of activity spaces for the ride providers. The first was a regular activity space of routine activities, a construct commonly used in previous research [
44,
57]. The second was a ride-provision activity space that we conceived to capture the geospatial area where ride providers routinely travel to provide rides. We then used these two activity spaces to operationalize three indicators of geospatial ride-providing burden and to explore their association with each other, frequency of ride provision, and ride-providing impacts.
2.1. Recruitment and Data Collection
Ride providers were eligible to participate in the study if they were at least aged 18 years old, spoke either Vietnamese or English, and provided a ride to a Vietnamese adult aged 65 or older. Eligibility was not restricted to specific relationship types or caregiver status, and this relationship information was not collected from the ride providers. Recruitment for this study was linked to a parent study in DFW [
27,
51,
58]. When older adults in the parent study reported receiving rides from others, they were asked to provide contact information for the ride providers so they could be invited to participate in a survey of ride providers. Because relatively few participants in the parent study reported receiving rides from others, recruitment for the ride-provider survey was broadened to include any individual who provided transportation to an older Vietnamese adult in DFW. The expanded recruitment efforts included snowball sampling, outreach to student groups at a local university, and flyers posted at locations commonly used by Vietnamese residents, such as Asian grocery stores, shopping centers, churches, temples, and gyms. Participants initially received a
$10 Walmart gift card for a completed questionnaire; beginning in October 2020, the gift card became
$20 to attract more participants. Telephone-based, interviewer-administered surveys were used to collect data, with questionnaires administered in Vietnamese or English based on participant preference and programmed using Qualtrics XM (July 2020). The interviews took approximately 20 min.
Our original sample was 20 ride providers. However, after excluding 8 who did not provide enough destination points to construct regular and ride-provision SDE1 activity spaces, our final sample was 12. Seven of the 12 participants (58.3%) conducted their interview in Vietnamese, the remaining five (41.7%) in English.
2.2. Measures
Participants reported demographic information for their age, gender, marital status, education, country of birth, length of time in the United States (if born elsewhere), ethnicity, primary language spoken at home, and monthly household income (in dollars).
2.2.1. Modes of Transportation
One survey item assessed household automobile ownership with response options of owning a functioning automobile, owning a non-functioning automobile, having a household member who owned a functioning automobile, or having a household member who owned a non-functioning automobile. Participants were also asked to report all modes of transportation they used from a list of options, including the ability to specify other, unlisted modes. For each selected mode, participants were asked to indicate how often they used it from a range of ordinal response options.
2.2.2. Routine Activities
The participants’ regular activity spaces were constructed using questionnaire items capturing two core components: residential location and destinations associated with routine activities. Drawing on items adapted from the VERITAS questionnaire [
59], participants reported the frequency and locations of routine activities over the previous month. Routine activity participation was elicited with a prompt asking about activities that were routinely done at least monthly and a list of responses including 20 types of activities such as visiting friends or family, dining out, attending religious services, or going to health care appointments. Participants were given the option to report additional activities not listed. For each activity selected, participants reported the number of days per month (0–30) and its location. Activity locations were recorded using the Google Maps integration within Qualtrics, allowing interviewers to enter a precise address when available or, when necessary, to place a map pin at a nearby intersection. The data were stored as latitude/longitude coordinates.
2.2.3. Rides Provided to Older Adult
Ride-provision activity spaces were developed using information on both the destinations to which providers transported older adults and the frequency of those trips. The questionnaire included a set of items parallel to those used to define regular activity spaces, capturing ride-related locations and frequencies for the same routine activities, with opportunities for respondents to report additional activities not listed. Location data were entered into Qualtrics using the Google Maps integration described previously and stored as latitude and longitude coordinates. Overall ride frequency was measured with a single item that asked the number of days rides were given to the older adult each month. The frequency with which rides were given was assessed with a single item asking for the total number of days per month that rides were provided to the ride recipient.
2.2.4. Impacts of Providing Rides
Potential adverse effects of providing rides to an older adult were assessed by asking the participants to indicate all applicable impacts from a predefined list that included incurring financial costs, missing work or health care appointments, or additional personal or family stress, with an opportunity to write in impacts not on the list. Responses were dichotomized such that selecting at least one item indicated the presence of a ride-providing impact (0 = no impact; 1 = any impact). Respondents who indicated transportation-related costs were asked to estimate their total monthly expenses associated with providing rides, including fuel, tolls, and parking, reported as a continuous dollar amount per month.
2.3. Analysis
All analyses, except geospatial analyses, were conducted in SPSS Version 29 (IBM SPSS Statistics, Chicago, IL, USA). Descriptive statistics for the sample’s demographic characteristics, transportation characteristics, and routine activities were calculated using means, standard deviations, frequencies, and percentages. To answer the study’s first research question, which focused on developing and computing activity space–based indicators of geospatial ride-providing burden, geospatial analyses were used to construct and examine participants’ regular and ride-provision activity spaces. For the second research question, bivariate correlational analyses evaluated relationships among the proposed indicators, ride-giving frequency, and reported impacts of ride provision.
2.3.1. Geospatial Analyses
We conducted geospatial analyses for this study using ArcGIS Pro 3.0 (ESRI, Redlands, CA, USA) [
60]. Using the location and frequency information outlined in the Measures section, both regular and ride-provision activity spaces were generated. Finally, we examined each participant’s regular and ride-provision activity spaces and their intersections to propose metrics for the geospatial burden of providing rides. This overlap informed the development of three proposed measures. (i.e., “burden indicators”) for geospatial ride-providing burden. Each provides a different conceptualization of the extent to which the ride provider must travel for rides or depart from routine travel patterns to provide rides.
2.3.2. Estimating Regular Activity Spaces
As described in Mauldin et al. [
27], latitude and longitude data from the survey were transformed in ArcGIS into geographic locations representing regular monthly destinations. Each of the 12 participants reported their home address and no fewer than two regular activity locations, allowing for the construction of a one standard deviation ellipse (SDE1) for their regular activity space. We weighted the locations using the number of days going to the activity’s destination each month [
47], with the home address having a weight of 30 days, to reflect its role as a central “home base”. This assumption was particularly salient during the data collection period of the COVID-19 pandemic data collection period, when travel was restricted. Respondents’ weighted activity locations were then mapped in ArcGIS and then summarized using a directional distribution–based SDE1. The procedure identifies a mean center from x- and y-coordinate dispersion and estimates directional spread by rotating orthogonal axes around this center. The semi-minor and semi-major axes correspond to the minimum and maximum standard deviations, respectively; the resulting full axis lengths are therefore twice these values [
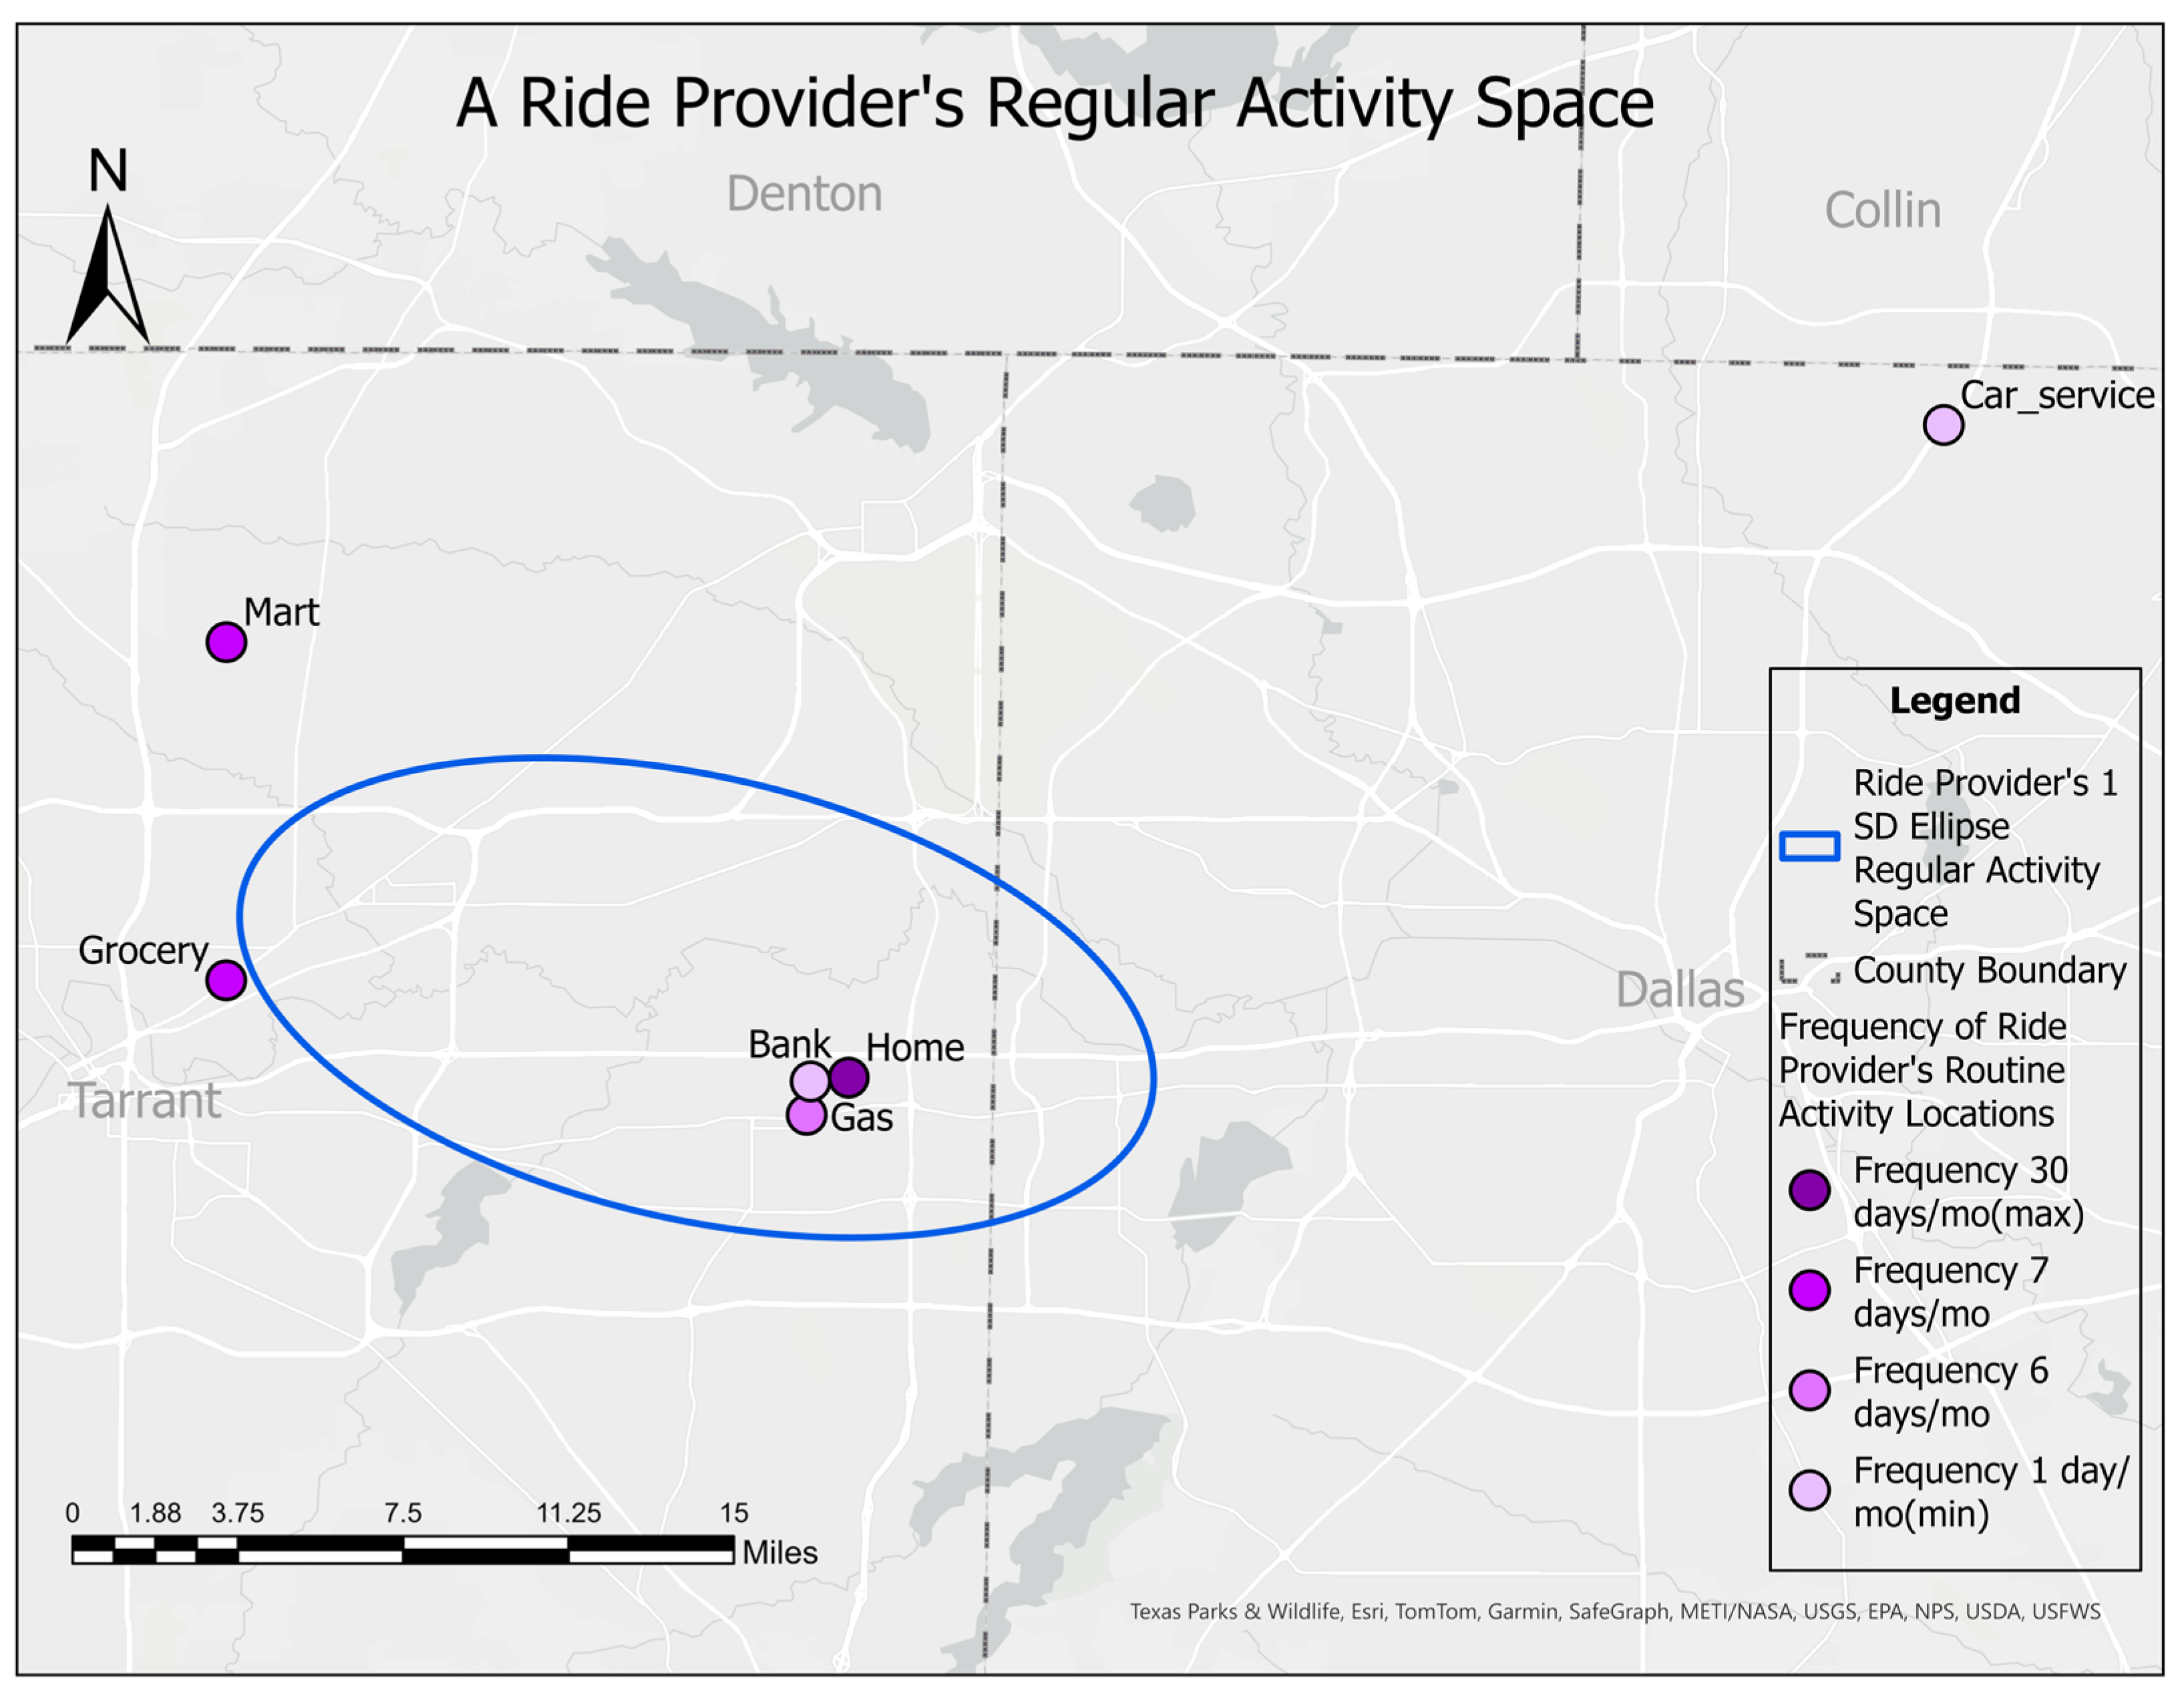
50]. An example of a ride provider’s SDE1 generated using this approach is shown in
Figure 1.
2.3.3. Ride-Provision Activity Spaces
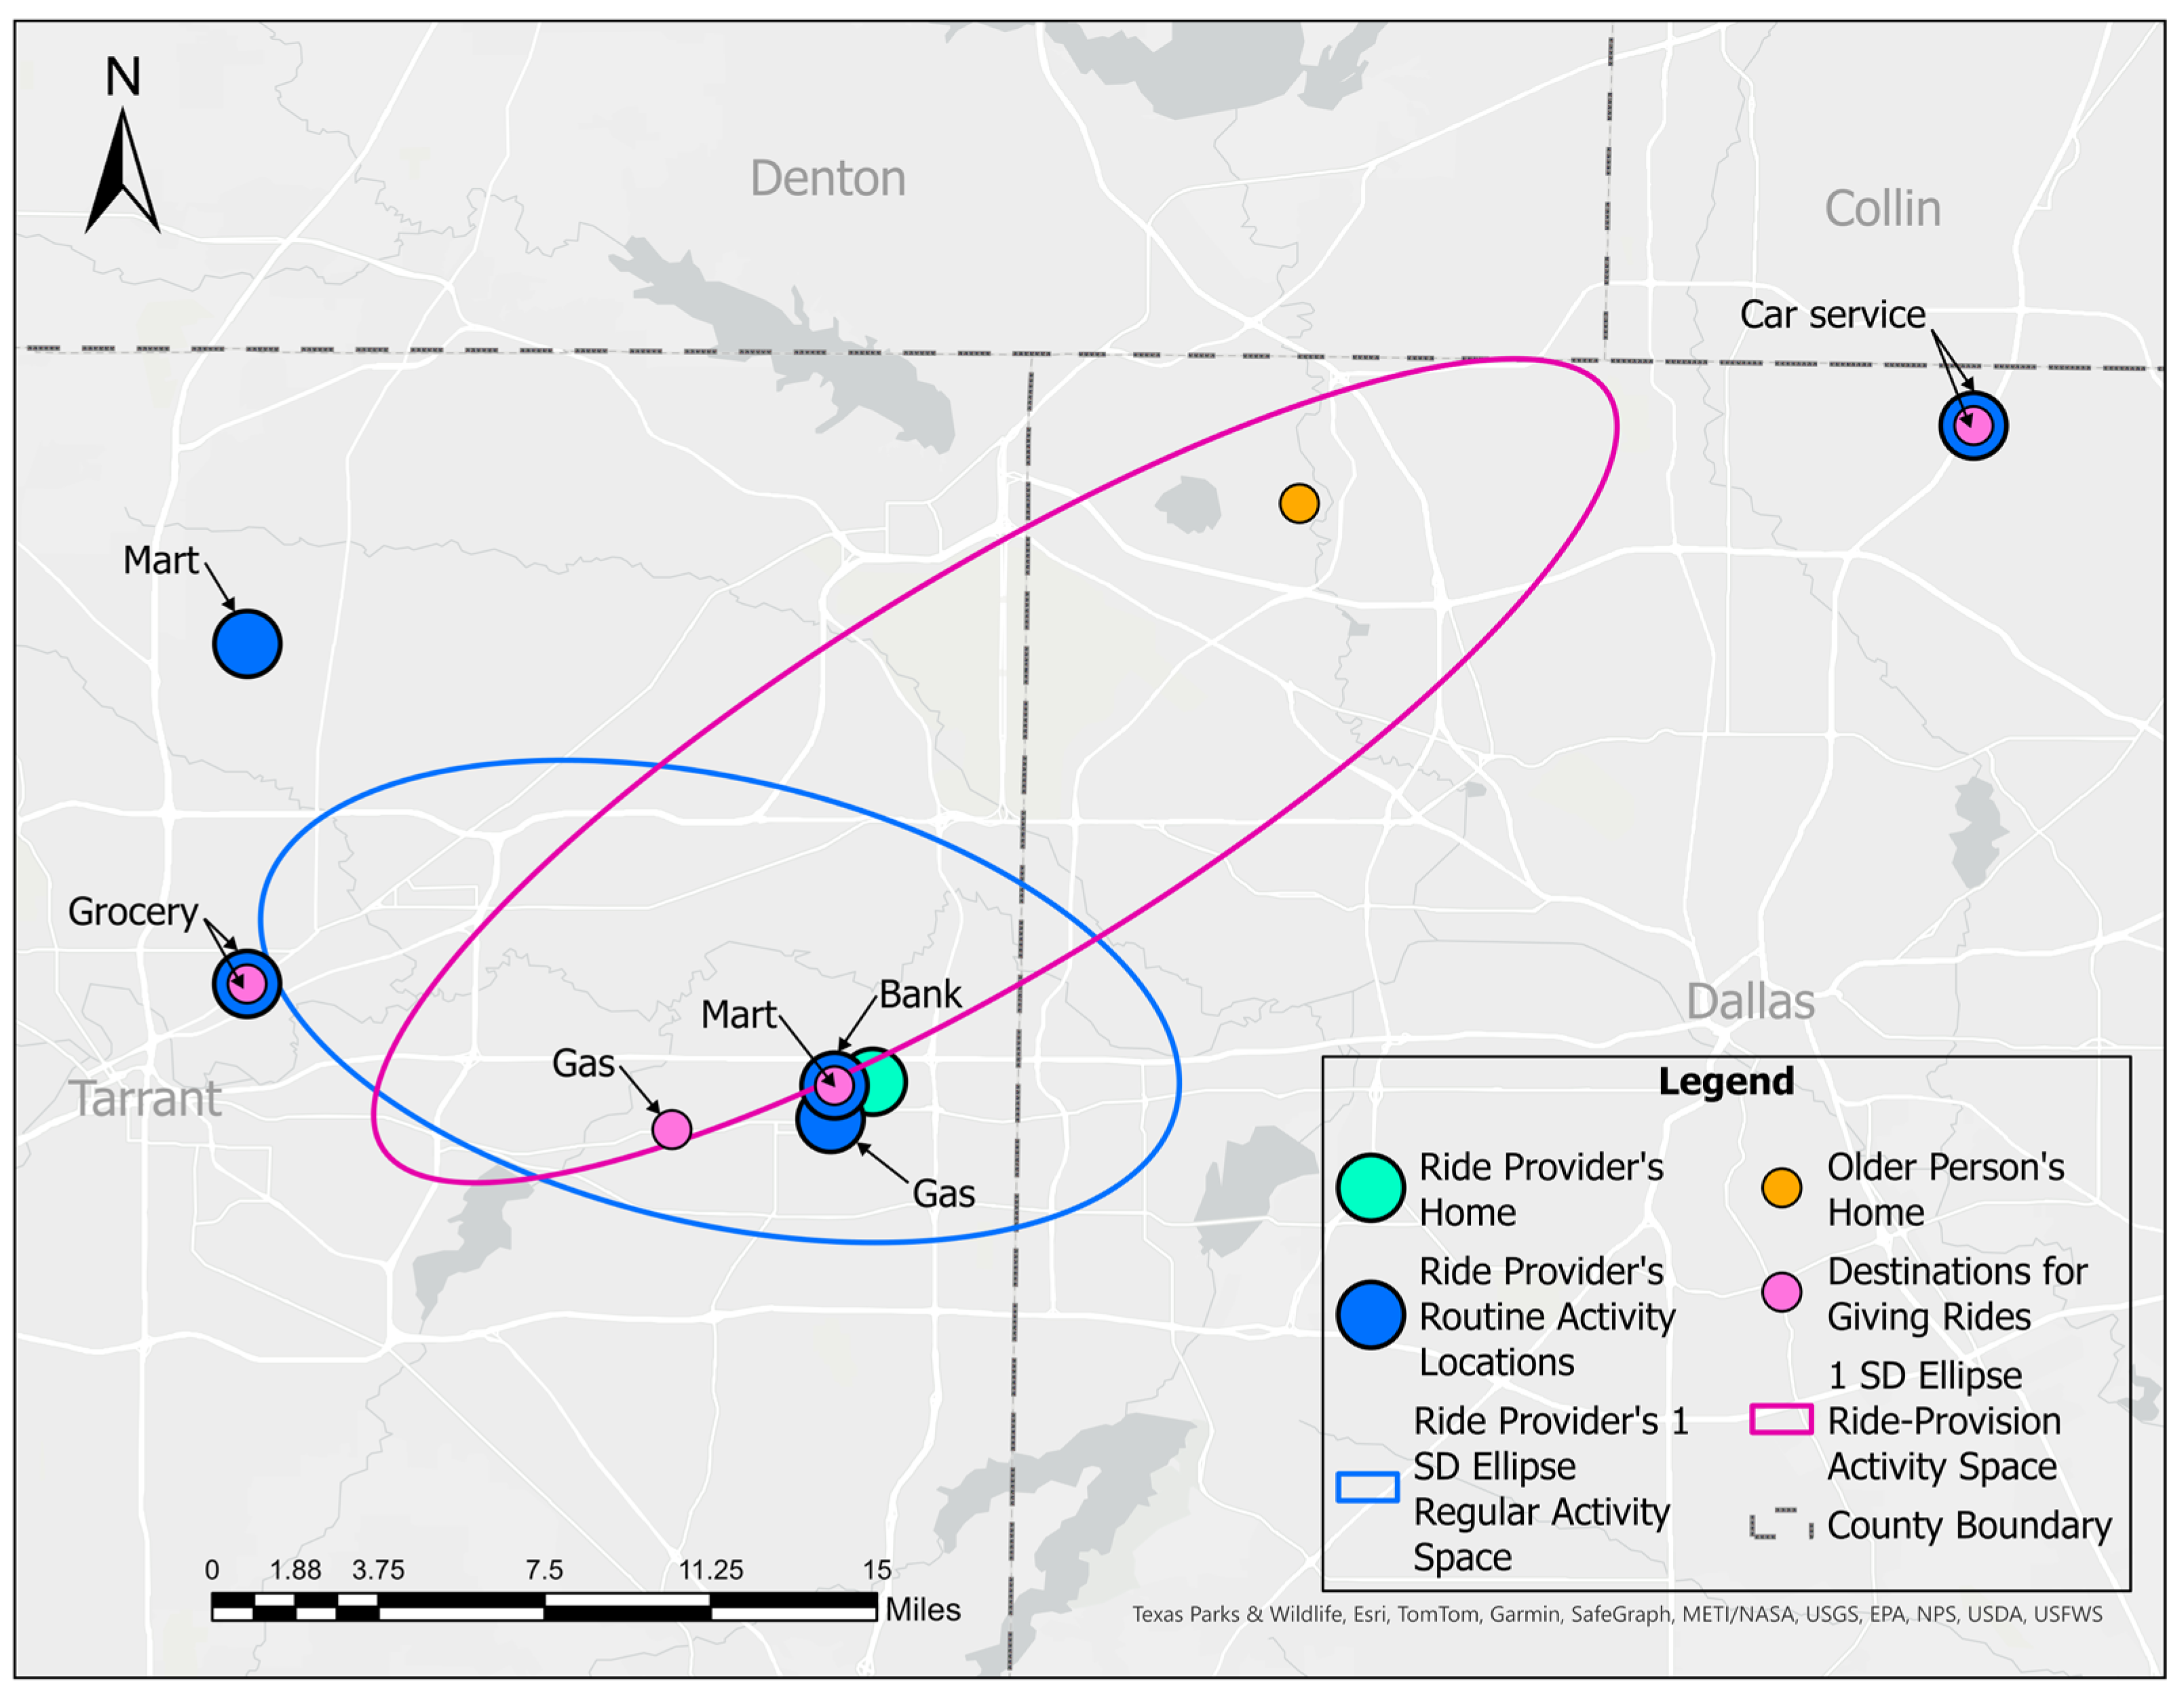
The ride-provision activity spaces capture the set of locations associated with providing private automobile rides to an older adult. SDE1s were created to model ride-provision activity spaces based on ride-related destinations and the older adult’s home latitude and longitude coordinates when available (
n = 9), with point locations weighted by the frequency of rides provided there. The location of the older adult’s home address was weighted by the frequency associated with the most frequent activity for which rides were provided. This approach is demonstrated in
Figure 2, which shows an example of a ride provider’s regular SDE1 alongside their ride-provision SDE1.
2.3.4. Metrics for Estimating Ride-Providing Geospatial Burden
The study proposes three indicators to quantify the geospatial burden of ride provision for older adults, referred to as Burden Indicators A, B, and C. For each, we calculated the mean, standard deviation, 5% trimmed mean, minimum, and maximum.
Burden Indicator A: Area of Ride-Provision SDE1. Geospatial burden may vary with the geographic dispersion of ride-provision activities, with smaller, more concentrated areas posing less burden than larger, dispersed ones. To capture this dimension, Burden Indicator A (BIA) is operationalized as the area of the ride-provision SDE1 in miles squared.
Burden Indicator B: Inaccessible Ride-Provision Activity Space (%). Building on accessibility concepts from Sherman et al. [
49], this metric captures the share of a ride provider’s ride-provision activity space that lies beyond the boundaries of their regular activity space. Calculating this indicator requires identifying and measuring the spatial overlap between the two activity spaces.
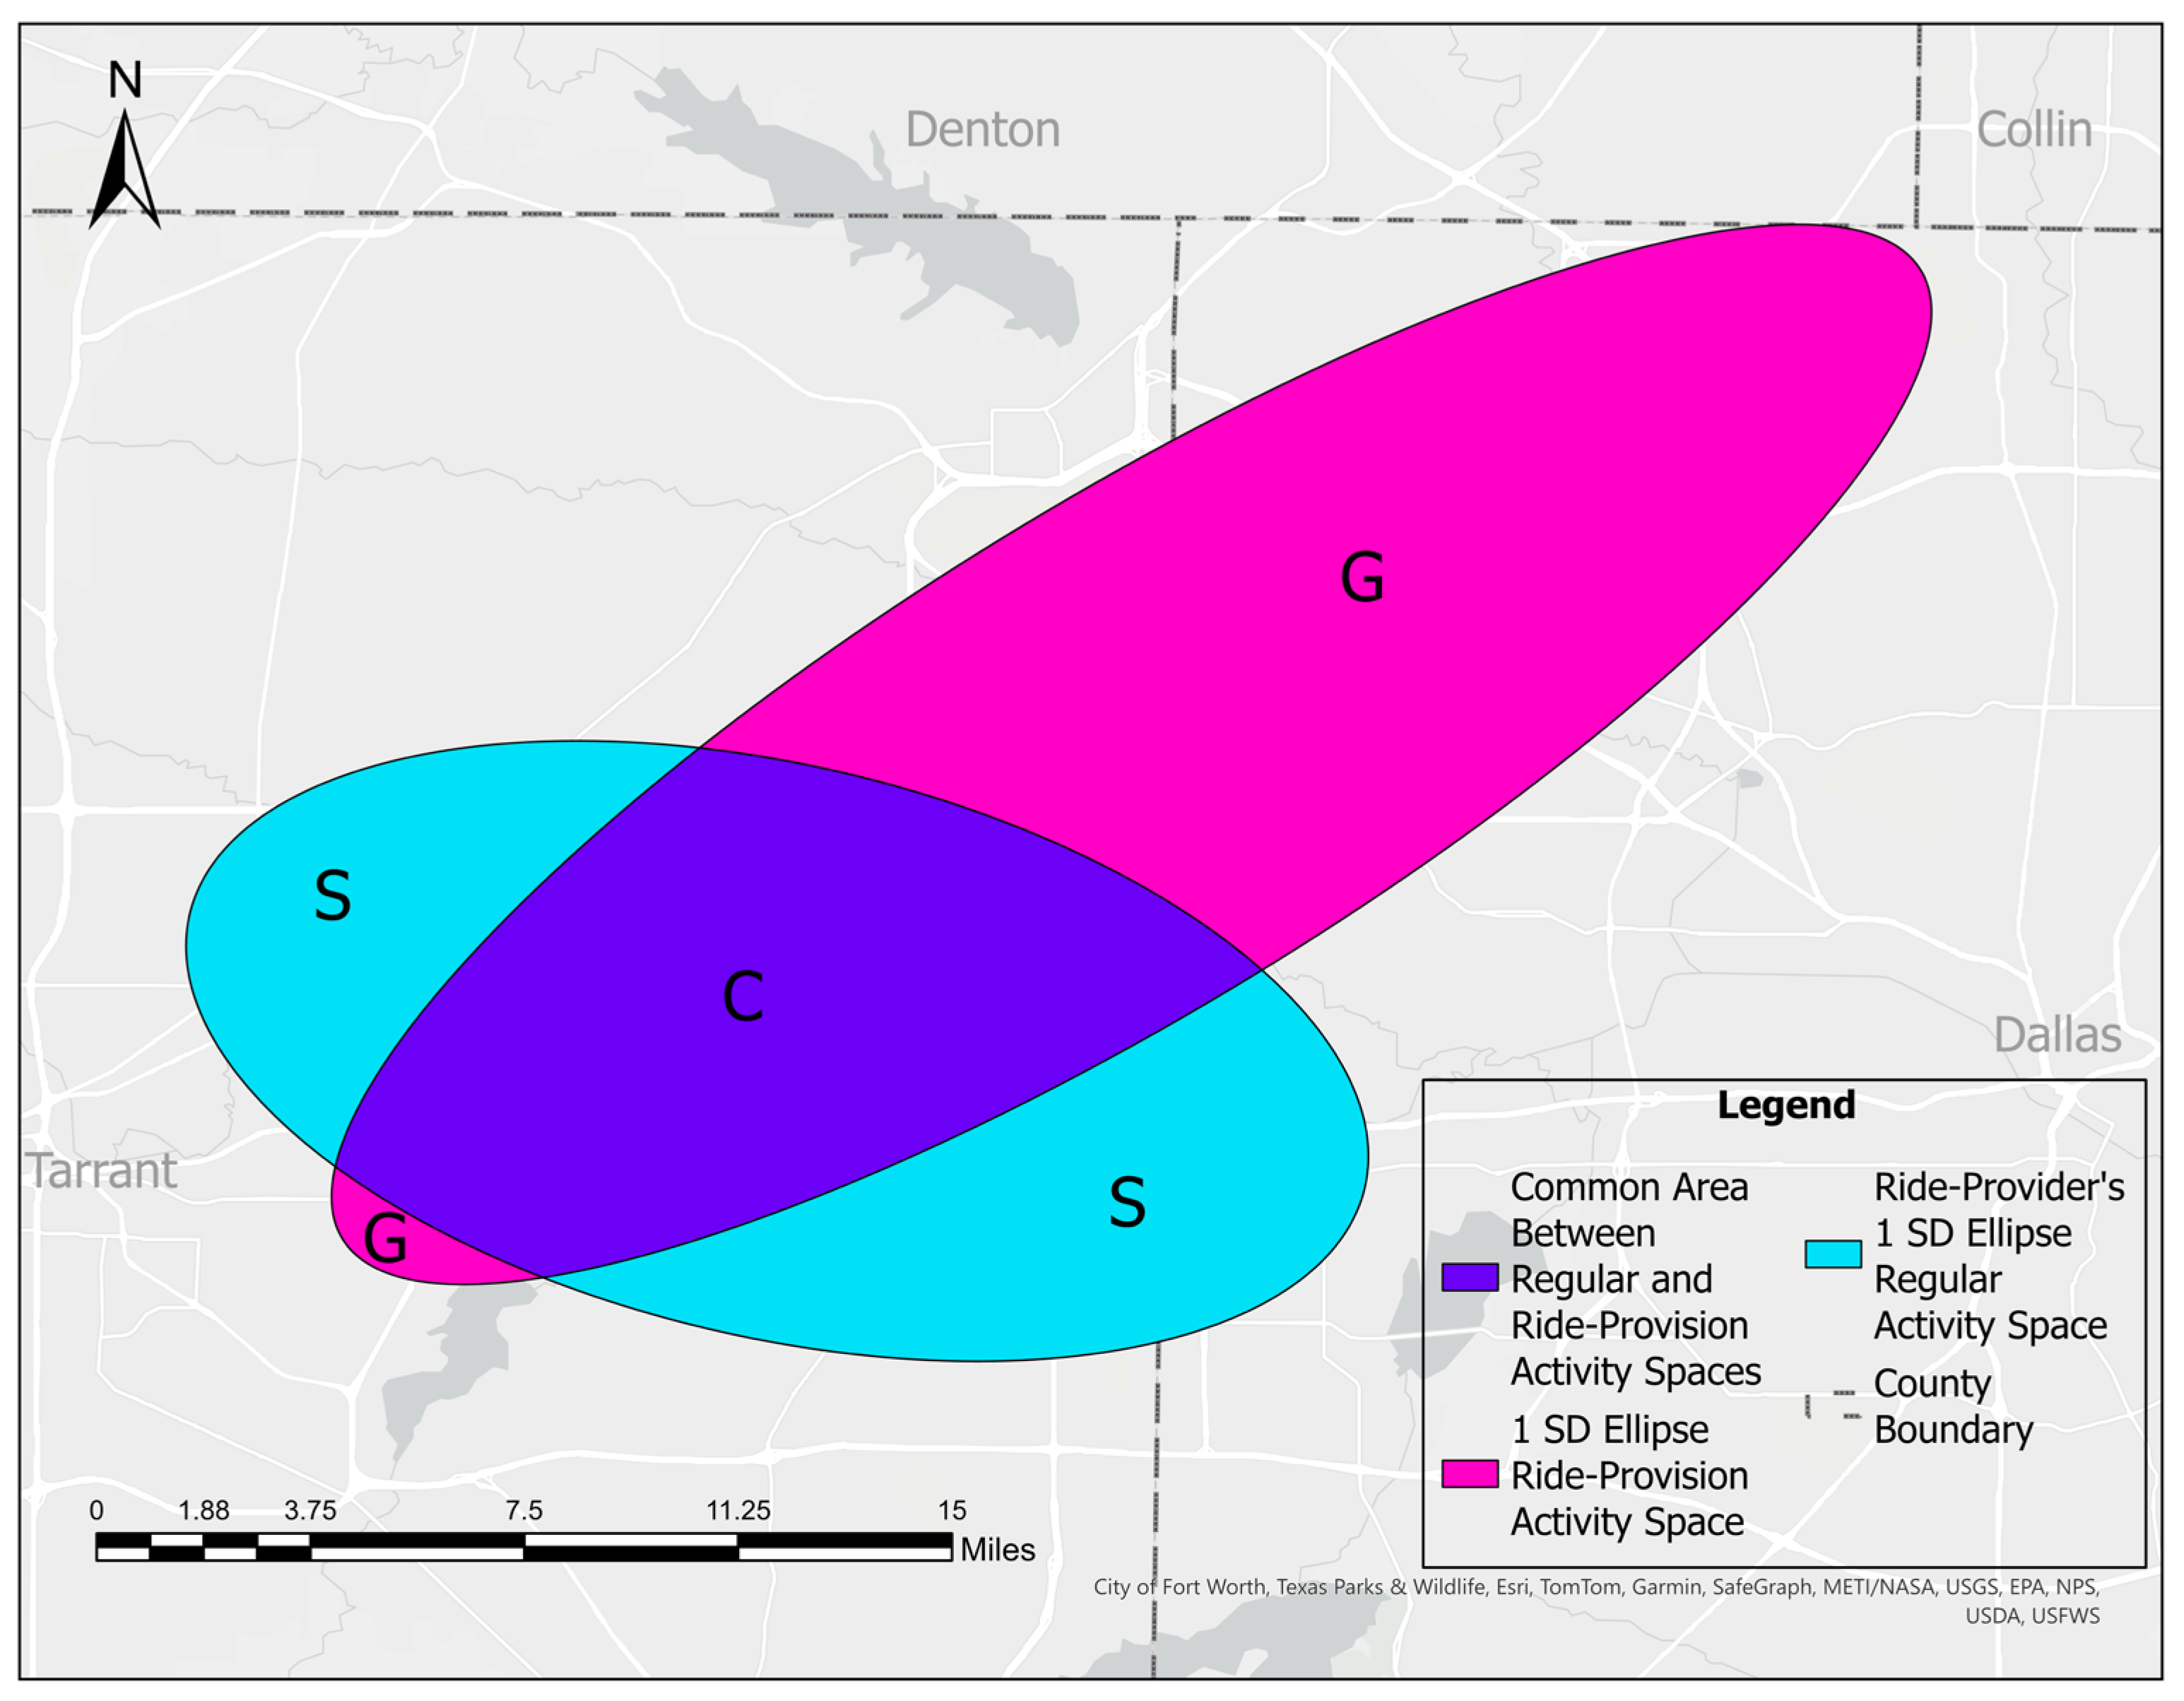
Figure 3 graphically depicts this method using shaded areas of the SDE1s.
Figure 3 provides illustrations of the following areas:
C + S: total area of the regular SDE1
C + G: total area of the ride-provision SDE1
G: portion of the ride-provision SDE1 outside the regular SDE1 (classified as inaccessible)
C: area of overlap between the regular and ride-provision activity spaces.
Using these definitions, Burden Indicator B (BI
B) is calculated as shown in Equation (1).
Burden Indicator C: Inaccessible Ride-Provision SDE1 Relative to Regular SDE1. Burden Indicator C (BIC) contextualizes the extent of ride provision occurring outside the regular activity space relative to its overall size. Providers with more expansive regular activity spaces may be more accustomed to traveling longer distances as part of their daily routines and, as a result, may experience less burden when providing rides beyond those areas than providers whose routine activity spaces are more geographically limited.
Operationally, this indicator reflects the area where ride-provision activities extend beyond the rider’s regular activity space, expressed relative to the area of the regular SDE1. BI
C is calculated as shown in Equation (2):
2.3.5. Associations Among Burden Indicators, Ride Frequency, and Reported Impacts
Bivariate correlations were used to assess relationships among the burden indicators, ride-giving frequency, and reported impacts of providing rides, addressing Research Question 2. We used Spearman’s rho correlation coefficient because the data violated the assumptions of normality. We also calculated a nonparametric point-biserial correlation coefficient to assess the association of reporting ride-provision impacts and burden metrics and ride-provision frequency.
Confidence intervals for the correlation coefficients were estimated using a bias-corrected and accelerated (BCa) bootstrap approach. Statistical significance was determined by using =0.05. Analyses were conducted using pairwise deletion to account for missing data.
3. Results
As shown in
Table 1, the sample consisted entirely of Vietnamese-identifying ride providers, most of whom spoke Vietnamese as their primary household language. Distributions across gender, age, marital status, and immigrant status were relatively even. Educational attainment was low overall, with the majority reporting no more than a high school education or equivalent. Mean monthly household income was
$2102 (M =
$2102/month; SD =
$1763.50).
3.1. The Sample’s Transportation-Related and Regular Activity Space Characteristics
Table 2 presents descriptive statistics for the sample’s transportation-related and regular SDE1 characteristics. Most participants (
n = 11, 92%) reported having a working automobile and all drove themselves for transportation. The average area of the regular activity space was 46.1 square miles/119.40 square kilometers (SD = 48.3 square miles/125.1 square kilometers).
3.2. Ride-Provision Activity Spaces and Characteristics
The average area of the ride-provision activity spaces was 44.2 square miles/114.4 square kilometers (SD = 91.0 square miles/235.7 square kilometers). The regular activity space was larger than the SDE1 for ride provision for most providers (
n = 10, 83.3%). Ride provision spanned a range of routine activities, with providers reporting between two and nine activity types (M = 3.67, SD = 2.06). Monthly ride frequency ranged from five to 30 days, with an average of 13.4 days (SD = 9.4). Grocery shopping was the most common ride destination (
n = 9, 75%), with an average of 4.9 grocery-related rides given per month per ride provider (SD = 1.5). Half of the providers (
n = 6, 50%) reported providing rides to religious services (M = 9.8 days per month; SD = 10.4) and to health care facilities (M = 1.8 days per month; SD = 1.3), while 42% (
n = 5) provided rides for visits to the older adult’s friends or family. While fewer providers transported older adults to senior centers or work, these activities were associated with relatively high average trip frequencies (senior center: M = 15 rides per month, SD = 19.8; work: M = 14.7 rides per month, SD = 11.7).
Table 3 presents additional details about each type of activity for which they provided rides.
3.3. Rides-Providing Impacts
At least one adverse impact of providing rides was reported by most participants (n = 7, 58.3%). Transportation-related costs were the most common (n = 5, 41.7%), followed by missing work (n = 3, 25%), and increased personal stress (n = 2, 16.7%). No respondents indicated missing health care appointments or experiencing increased family stress due to providing rides. For those reporting transportation expenses, mean monthly costs were $90.00 (SD = $39.84), with reported amounts ranging from $20 to $120.
3.4. Indicators of Ride-Providing Burden
The three geospatial burden indicators (A, B, and C) were computed based on each participant’s regular and ride-provision activity spaces to evaluate the spatial burden associated with providing rides. Burden Indicator A (BIA) represents the total square miles of the ride-provision SDE1. The smallest BIA value was 0.17 square miles (0.44 square kilometers) and the largest was 279.5 square miles (723.90 square kilometers). On average, BIA was 44.18 square miles/114.43 square kilometers (SD = 91.0 square miles/235.69 square kilometers, 5% trimmed mean = 33.55 square miles/86.89 square kilometers). The distribution of values for BIA was highly skewed (skewness = 2.240) and contained one outlier with a particularly large ride-provision activity space (279.5 square miles/723.90 square kilometers).
Burden Indicator B (BIB) reflects the portion of ride-provision SDE1 lying outside the regular activity space and is therefore considered inaccessible. The values for BIB ranged from 0.94% to 78.83%, with a mean of 40.67% (SD = 23.44%, 5% trimmed mean = 40.76%). The distribution of BIB scores approximated a normal distribution, only slightly skewed (skewness = −0.413), and containing no outliers.
Burden Indicator C (BIC) quantifies the ratio of ride-provision activity space occurring outside the regular SDE1 to the size of the regular SDE1. The mean value of BIC was 0.416 (SD = 0.617, 5% trimmed mean = 0.358). The majority of BIC values (n = 10, 83.3%) were below 1.0 indicating that the non-accessible component of ride provision was typically smaller than the regular activity space. The distribution of values for BIC was somewhat skewed (skewness = 1.532).
3.5. Correlations Among Burden Indicators, Ride Frequency, and Ride-Related Monthly Expenses
Correlations among the geospatial burden indicators are reported in
Table 4. A strong statistically significant correlation (ρ = 0.755,
p = 0.005) was observed between BI
A and BI
C, as between BI
B and BI
C (ρ = 0.755,
p = 0.005). In contrast, the association between BI
B and BI
A was moderate in magnitude but did not reach statistical significance (ρ = 0.378,
p = 0.226).
4. Discussion
Older adults in the United States require transportation solutions that allow them access to health care and healthy food, opportunities to participate socially, and the ability to enhance or maintain quality of life. As researchers, practitioners, and policymakers seek sustainable solutions to meet the transportation needs of a rapidly growing older adult population, greater attention must be paid not only to older adults’ unmet travel needs but also to the often-unrecognized burden borne by those who provide them rides in private automobiles. Informal ride provision remains the most common and preferred transportation option for older adults who do not drive, yet few tools exist to quantify the burden on ride providers.
In response to the conceptual gap in how ride-providing burden has been represented in prior work, this study adopts a geospatial framework that examines how routine activity travel patterns of ride providers align with the spatial demands of providing rides. Existing studies have used regular activity spaces within geospatial analyses to evaluate accessibility to services. This study extends that work by examining how the relationship between a ride provider’s regular and ride-provision activity spaces reflects the burden of providing rides to older adults. From a selection of potential methods [
48], this paper relies on an ellipse-based method for evaluating activity space because this approach measures a total area of potential activity rather than the alternative methods that utilize a geospatial grid or a shortest-path network based on existing activity patterns. The ellipse provides stronger support for trip chaining that deviates from one’s current activity pattern, which makes it suitable for assessing the interaction between activity spaces.
Despite its exploratory scope, this study provides preliminary evidence that the geospatial burden of ride provision can be examined using self-reported activity data with associated locations. While GPS tracking can be an attractive method for gathering
regular activity space data [
61,
62], it is a poorer method for collecting data on a
ride-provision activity space because it will not capture unserved travel to desired or necessary activities. Furthermore, if ride providers must forego travel to provide transportation to an older care recipient, a GPS track will likely be unable to capture their preferred, but unrealized, activity spaces. Populations at risk of transportation disadvantage need alternative data collection strategies to capture their latent demand and missed trips [
63]. One App, MyAmble, shows promise for collecting a full set of completed, desired, and necessary activities with their point locations [
64]. This approach also supports separating trips associated with caregiving from a ride provider’s regular activity pattern.
Petry et al. [
65] suggest providing services and subsidies to address the excess burden experienced by older caregivers. Their strategies include more frequent use of community health workers to provide care, normalizing respite care for older caregivers, and providing financial compensation directly to older caregivers. These approaches involve direct payments to caregivers, including ride providers, and the findings from this study can support the development and implementation of such strategies in policy and practice. The burden indicators may be useful for assessing ride-providing burden to identify and prioritize eligibility for potential supports. Agencies seeking to implement services or financial supports for people who give rides to older adults could use structured instruments for assessment to collect information about routine activities, including how often and where individuals travel for their own purposes and for ride provision. Purpose-built geospatial instruments—such as a ride-providing application potentially adapted from existing platforms such as the MyAmble app [
64]—could facilitate efficient assessment of accessibility and burden. Such tools could also be designed to suggest alternative service options. These could include recommending more conveniently located destinations for both the ride provider and the older adult. Large-scale data generated from these tools could inform planning decisions by city planners, housing authorities, and private-sector stakeholders regarding the placement of services and housing near older adult care recipients and their caregivers.
Beyond methodological and policy considerations, the findings also highlight important cultural dimensions of informal ride provision. In this study, all the ride providers for the older adults reported being Vietnamese, and most spoke the Vietnamese language at home. This finding suggests the importance of ride providers having a strong cultural and linguistic match with the older adults for whom they are providing rides, something Salkas [
66] identified as a deficit in many paratransit services.
Limitations and Future Directions
Although exploratory, this study shows the potential effectiveness of formulating a burden indicator for ride providers, its main limitations are a small sample size and lack of random sampling, which result in low statistical power and limit the robustness and generalizability of conclusions. The findings should be replicated using larger and more representative samples. Expanding sample size and employing random sampling would improve generalizability and allow for more robust examination of correlates of geospatial burden including macro-level conditions such as policy, practices, road networks, and regional differences; culture (including acculturation and filial norms); personal resources (e.g., financial capacity) and characteristics; and negative outcomes experienced by ride providers.
From a methodological perspective, the findings also underscore the importance of how activity spaces are operationalized when assessing ride-providing burden. From a selection of potential methods [
48,
49], this paper relies on a standard deviation ellipse-based method. Methodologically, our approach of using SDE1 activity spaces fails to allow for circumstances in which a ride provider takes an older adult to only one destination. This is because constructing an SDE1 ride-provision activity space requires at least three points (i.e., two ride-providing destinations plus the older adult’s home or pick-up location). Future research could explore the use of road buffer network or similar approaches to operationalizing an activity space [
49,
59,
67]. The road network buffer approach may not capture the full scope of a person’s routine travel [
67,
68] or their perceptions of their neighborhood [
69]; however, it provides an analytical option for spatially representing an area of ride provision. As such, future research should consider its use to better understand the geospatial burden of providing rides to an older adult.
Because data collection took place during the summer and into the winter of 2020, findings reflect travel and activity patterns shaped by COVID-19 restrictions. Some participants reported that these conditions constrained travel and routine activities. As a result, the activity spaces, routine activities, and rides observed in this study are potentially smaller in number and scope than would be expected under non-pandemic conditions. This could possibly inflate estimates of inaccessible activity space by reducing the size of regular activity spaces, or conversely, may have reduced the burden indicators because of limited travel by the older adult. More research is needed to assess the various geospatial burden indicators under more typical travel conditions than those in the current study.
Future research should also capture additional information about the ride providers. For example, it is plausible that the relationship with the ride provider could affect their caregiving responsibilities, perceptions of burden, and impacts of providing rides. Therefore, collecting and incorporating data about the ride provider’s relationship to the older adult into analyses would be important in future studies. There is also a need to better understand the negative impacts of ride providers’ experiences. This goal could be achieved by including more comprehensive indices, Likert-type scales or other composite measures to arrive at a more sophisticated understanding than our binary approach to negative impacts, or by conducting mixed-methods research to capture the lived experiences of ride providers. Additionally, when ride providers use paratransit, ride-hailing, and public transportation to provide transportation for the care recipients, these modes may pose an even greater burden on ride providers due to their high costs or long travel times. Enhanced qualitative data collection would allow researchers to add context for transportation behaviors and assess the care recipients’ willingness to use alternative modes of transportation. Future research should also investigate the trip origins and trip-chaining behaviors of ride providers. Many rides, particularly for working providers, may begin at work rather than at home. Moreover, different types of trips (such as grocery shopping versus health care visits) likely differ in timing flexibility and sequencing, resulting in varying temporal and spatial encumbrances.
5. Conclusions
As the U.S. population ages and reliance on informal transportation support grows, understanding and addressing the geospatial dimensions of ride-providing burden will become increasingly important. This study lays foundational groundwork for future research to refine burden indicators, test them in larger and more diverse samples, and integrate them into transportation policy and caregiving support systems. For example, we found that higher values on each of the three geospatial burden measures were linked to less frequent provision of rides over the course of a month. As burden rises and ride frequency declines, older adults’ travel needs may be less consistently met, leading to clear policy and practice implications of assessing geospatial burden. We also found the measure of inaccessible ride-provision activity space (BI
B) demonstrated promise as a broadly applicable measure of geospatial burden, conceptually similar to traditional accessibility measures that define access in terms of single points [
49].
While these findings are exploratory and based on a limited sample, they demonstrate how geospatial indicators can be operationalized to capture dimensions of ride-providing burden. Conceptually, this work extends activity-space approaches by shifting the analytical focus from mere trip-making to the spatial burden borne by those who provide transportation support to older adults. There is plenty of work ahead to replicate this research; validate, extend, and explain findings; and more deeply explore the nature and consequences of ride providers’ geospatial burden. By making the invisible work of ride providers more visible and measurable, geospatial approaches such as the one proposed here can help advance more equitable and effective transportation solutions for older adults and those who support them.





 ,
,