Article

Spatiotemporal Dynamics and Multi-Scale Equity Evaluation of Urban Rail Accessibility: Evidence from Hangzhou

School of Earth Sciences and Engineering, Hohai University, Nanjing 211100, China
*
Author to whom correspondence should be addressed.
ISPRS Int. J. Geo-Inf. 2025, 14(9), 361; https://doi.org/10.3390/ijgi14090361
Submission received: 30 July 2025 / Revised: 4 September 2025 / Accepted: 16 September 2025 / Published: 18 September 2025
(This article belongs to the Special Issue Spatial Data Science and Knowledge Discovery)

Abstract

In recent years, the rapid expansion of urban rail transit has significantly improved travel efficiency, yet it has also exacerbated spatial inequality in service coverage. Accessibility, as a fundamental metric for evaluating the equity of service distribution, remains limited by three major shortcomings in current assessment methods: the neglect of actual road network characteristics, reliance on a single static scale, and the absence of quantitative mechanisms to assess accessibility equity. These deficiencies hinder a comprehensive understanding of how equity evolves with the spatiotemporal dynamics of rail systems. To address the aforementioned issues, this study proposes an innovative spatiotemporally dynamic and multi-scale analytical framework for evaluating urban rail accessibility and its equity implications. Specifically, we develop a network-based buffer decay model to refine service population estimation by incorporating realistic walking paths, capturing both distance decay and road network constraints. The framework integrates multiple spatial analytical techniques, including the Gini coefficient, Lorenz curve, global and local spatial autocorrelation, center-of-gravity shift, and standard deviation ellipse, to quantitatively assess the equity and evolutionary patterns of accessibility across multiple spatial scales. Taking the central urban area of Hangzhou as a case study, this research investigates the spatiotemporal patterns and equity changes in metro station accessibility in 2019 and 2023. The results indicate that the expansion of the metro network has partially improved overall accessibility equity: the Gini coefficient at the TAZ (Traffic Analysis Zone) scale decreased from 0.56 to 0.425. Nevertheless, significant inequality remains at finer spatial resolutions (grid-level Gini coefficient = 0.404). In terms of spatial pattern, the core area (e.g., Wulin Square) forms a ‘high-high’ accessibility agglomeration area, while the urban fringe area (e.g., northern Yuhang) presents a ‘low-low’ agglomeration, and the problem of local ‘accessibility depression’ still exists. Additionally, the accessibility centroid has consistently shifted northwestward, and the long axis of the standard deviation ellipse has rotated from an east–west to a northwest-southeast orientation, indicating a growing spatial polarization between core and peripheral zones. The findings suggest that improving equity in urban rail accessibility cannot rely solely on expanding network size; rather, it requires coordinated strategies involving network structure optimization, branch line development, multimodal integration, and the construction of efficient transfer systems to promote more balanced and equitable spatial distribution of rail transit resources citywide.

1. Introduction

With the acceleration of urbanization, rail transit has emerged as a core solution for alleviating traffic congestion and optimizing travel patterns [1,2], functioning as the ‘lifeline’ of modern urban development. Its high capacity and low emissions not only enhance residents’ travel efficiency but also profoundly influence the evolution of urban spatial structures and social equity [3]. However, the rapid expansion of metro networks is often accompanied by uneven service coverage—while some areas benefit from dense station distribution, others face limited accessibility due to the persistent ‘last-mile’ problem [4]. This spatial inequality not only intensifies the imbalance in transportation resource allocation but also raises concerns regarding social justice [5,6]. As a critical metric for quantifying the balance of service coverage, accessibility plays a central role in urban transport planning. However, accurately evaluating urban rail accessibility and uncovering the equity mechanisms underlying its spatiotemporal disparities remain pressing challenges for urban planners [7,8].
Accessibility refers to the ease with which individuals can reach desired services or destinations, typically quantified as the cumulative opportunities reachable within a given impedance threshold [9]. In the context of urban rail transit, accessibility reflects the potential for residents to reach metro stations within a reasonable walking or travel time, considering both spatial and temporal constraints [10,11]. Current research on the accessibility of public service facilities primarily relies on static buffer methods (e.g., an 800 m Euclidean distance) or basic road network analyses to delineate service areas [2,12]. However, these approaches exhibit significant limitations. First, they overlook the actual road network structure and geographical barriers (e.g., rivers, elevated roads), leading to inaccuracies in estimating the population truly served [13]. Second, they depend on a single spatial scale (e.g., street or traffic zones), making it difficult to capture spatial heterogeneity at finer grid levels [14,15]. Third, they fail to incorporate temporal dynamics, thereby missing the long-term effects of urban expansion and population migration on accessibility [16,17]. More critically, traditional methods rarely integrate accessibility assessments with equity indicators (e.g., the Gini coefficient and Lorenz curve), making it difficult to quantify the extent of spatial inequality in rail transit services [18,19].
Equity addresses the distributive justice of transportation benefits and burdens across different socio-spatial groups [20]. It emphasizes a fair and balanced allocation of public transit resources, ensuring that mobility needs are met for all population segments, particularly vulnerable groups, thereby mitigating spatial mismatches between service supply and travel demand [21,22]. As a fundamental objective of urban public service provision, it requires that public transportation resources meet the basic travel needs of diverse population groups [23,24]. This approach seeks to rectify spatial mismatches between service provision and travel demand, ensuring basic mobility access as a fundamental right [25]. However, most existing studies focus on single-scale or static analyses, lacking a multidimensional spatiotemporal perspective and offering limited systematic exploration of the coupling mechanisms between station attractiveness and population distribution [11]. Standard inequality metrics (Gini, Lorenz) assume independence across observational units; but accessibility and demand are spatially autocorrelated (clusters of well-served or underserved areas). Ignoring spatial dependence can bias inequality estimates and obscure local pockets of disadvantage. Recent papers recommend spatially aware metrics or local decomposition, but these are still not routine [26,27]. For instance, disparities in walkability to metro stations may compel residents to rely on motorized transfers, thereby increasing congestion around stations and hindering the development of transit-oriented development (TOD) patterns [28,29]. Furthermore, current methods rely heavily on static survey data, making it difficult to capture the spatiotemporal dynamics of passenger flows and multi-scale spatial correlations, ultimately leading to a disconnect between service coverage assessments and actual travel demand [30,31].
At the urban spatial scale, multi-scale analytical methods have been widely applied and refined [32]. At the district scale, researchers employ aggregation units such as TAZs and street-level populations to assess metro network coverage and accessibility differences across districts, thereby revealing macro-scale imbalances. At the mesoscale, subnetworks extracted from local metro systems are analyzed to examine how passenger-flow balance and employment–residence balance influence station-flow distributions based on network attributes and built-environment factors [33]. For example, a study in Shanghai demonstrated that multi-scale network characteristics within a 6–8 km radius significantly affect peak-hour passenger-flow distributions. At the micro-scale, grid-based analysis (500 m × 500 m) identifies local ‘accessibility depressions’ and ‘highlands’ and quantifies service equity at the community level by combining the Gini coefficient with inequality measures such as the Lorenz curve [34]. Moreover, the development of multi-scale spatiotemporal dynamic models facilitates dynamic assessments of rail transit service equity amid urban expansion and population migration trends [17,35]. Thus, through spatiotemporal analyses across multiple scales, researchers can more comprehensively uncover issues of urban rail accessibility and equity [8,36].
To address these issues, this study develops a multi-scale spatiotemporal dynamic accessibility assessment framework, exemplified by the main urban area of Hangzhou. First, leveraging high-precision road network data and population distributions, a ‘buffer-based road network decay method’ is devised to compute an accessibility index, dynamically adjusting each station’ s service population by simulating walking-path resistance. The novelty of the method lies in (i) operationalizing the served-population term using realistic road network decay and linearized population weighting, (ii) explicitly incorporating service frequency as a continuous supply weight, and (iii) integrating these elements into a multi-scale equity analysis pipeline. Second, a multi-scale analysis across streets, grids (500 m × 500 m), and traffic analysis zones (TAZs) reveals accessibility patterns and disparities at different spatial resolutions. Third, the Gini coefficient and Lorenz curve are employed to quantitatively assess the evolution of service equity in rail transit in 2019 and 2023. Finally, spatial clustering and heterogeneity mechanisms are examined using standard deviation ellipses, center of gravity migration models, and global and local Moran’ s I indices.
The principal contributions of this study are as follows:
(1)
Integration of a road network decay method with multi-scale spatiotemporal analysis to overcome the limitations of traditional static models.
(2)
Application of the Gini coefficient and spatial autocorrelation metrics to elucidate the spatiotemporal differentiation patterns of rail transit service inequality.
(3)
Development of an equity evolution map for rail transit services in Hangzhou’ s main urban area in 2019 and 2023, providing a scientific foundation for optimizing station layouts and advancing ‘station-city’ integration.
The remainder of this paper is organized as follows. Section 2 details the methodologies employed. Section 3 describes the study area and data sources. Section 4 presents the empirical results for Hangzhou’ s main urban area, including accessibility spatial differentiation, equity evolution, and driving mechanism analysis. Section 5 discusses the findings. Finally, Section 6 concludes with a summary of the study’ s contributions and limitations.

2. Methodology

The overall methodological framework of this study is depicted in Figure 1. The study is divided into five parts, including data processing, station accessibility calculation, spatial distribution inequality analysis, spatial heterogeneity assessment, and five-year spatiotemporal trend evaluation. First, all datasets (road network, metro stations, and population) are projected, aligned, and cleaned, then classified into three scales: street, grid (500 m × 500 m), and traffic analysis zone (TAZ). Second, for each of the two target years and across all three scales, a buffer-based road network decay method is applied to compute the accessibility of existing rail transit stations in Hangzhou’ s main urban area. Third, the Lorenz curve and Gini coefficient are employed to assess spatial equity of accessibility. Fourth, Moran’ s I statistic is used to evaluate spatial heterogeneity. Finally, five-year changes in accessibility are examined through combined trend analysis, centroid migration modeling, and standard deviation ellipse methods.

2.1. Station Accessibility Calculations

Classical SFCA variants commonly use Euclidean buffers, travel-time thresholds, or hypothetical catchments. Our approach constructs network-based decay buffers along the pedestrian road topology, so decay is applied along realistic walking paths. This captures physical barriers and route geometry (overpasses, rivers) that planar catchments miss, improving the realism of which population is actually accessible to a station. To address the aforementioned limitations of existing accessibility index calculations [32], this study proposes a station accessibility method based on the buffer-based road network decay approach. The station accessibility is then computed using the following formulas:
A i R = P S P T F =   j n l L j P i R P i f l t l
where Ai(R) denotes the accessibility index of area i to metro stations, PS denotes the number of people in the covered area (unit is person), PT denotes the total population of the study area (unit is person), and F denotes the frequency of metro (unit is trips/day). Pi(R) denotes the number of residents in area i covered by stations (unit is person) and Pi denotes the total population of area i (unit is person). n denotes the number of areas covered by stations, and j denotes the number of areas covered by each station. l denotes the number of metro lines, Lj denotes the metro line passing through the area covered by station j, fl denotes the number of departing shifts in the metro line, shifts/hour, and tl denotes the operating time of the metro line l, hours, where the fltl can be viewed as a whole and denotes the number of departure shifts in subway line l throughout the day [37]. Table 1 shows the operational frequency of the Hangzhou Urban Rail Transit.
The station service population based on the road network attenuation method is calculated as follows:
P i R = k 0 h k f h ρ i R d h
where f(h) denotes the distance attenuation function, k denotes the total number of all roads in the station coverage area, and ρi denotes the population density along the road network in the station coverage area of area i, persons/km. hk denotes the length of the kth road in the coverage area.
The distance attenuation function is modeled as an exponential decay, defined by the following formula:
f h = e x p β h
where β denotes the weighting factor, calculated as:
β = ln 0.01 h 0
where h denotes the distance along the road network from the origin to the metro station (unit is km), and h0 denotes the distance threshold. Regarding the selection of walking thresholds, it is necessary to align with the generally accepted standards for the walking service range around public transportation stations, which represent approximately a 10 min walking distance [30]. Recent empirical studies utilizing smart card data and walking surveys have confirmed that the probability of choosing walking as a mode of connection to the subway system decreases significantly beyond this distance [33]. This threshold has been explicitly adopted and validated in recent studies targeting Chinese cities, including those with similar high-density urban forms to Hangzhou, making its application in this study contextually appropriate [13,29]. In this study, h0 is set to 800 m to represent the walking-distance threshold to the station [12], and the attenuation function graph obtained is shown in Figure 2.

2.2. Assessing Inequalities in SA

In this study, the Lorenz curve and Gini coefficient were employed to assess station accessibility (SA) inequality in urban rail transit [19]. As the Lorenz curve deviates further from the line of equality, inequality intensifies. The Gini coefficient ranges from 0 to 1, with higher values indicating greater inequality [11,13]. Inequality indicators were computed for two years across three spatial scales, and variations in Gini coefficient calculations as well as five-year temporal changes were analyzed. The Gini coefficient is defined as the ratio of the area between the Lorenz curve and the line of absolute equality to the total area beneath the line of absolute equality [38,39]. The computation procedure is as follows:
G I N I = S 1 S 1 + S 2 = 1 2 S 2
where GINI denotes the Gini coefficient, S1 denotes the area delimited by the inequality curve and the absolute equality line, and S2 denotes the area under the inequality curve. In this study, S2 is calculated as follows:
S 2 = i = 1 N S A i + S A i 1 P i P i 1 2
where N denotes the number of districts, SAi denotes the cumulative share of SA in the top i districts, and Pi denotes the cumulative share of population size in the top i districts. Equation (6) implements the standard discrete trapezoidal approximation of Gini and, given the large number of spatial units and double-precision calculation used here, the numerical approximation error is negligible.
Finally, the Gini coefficient can be transformed into:
G I N I = 1 i = 1 N S A i + S A i 1 P i P i 1

2.3. Spatial Heterogeneity in SA

We used Moran’ s I to examine the spatial relationships and heterogeneity of SA [15]. Firstly, Global index was used to detect spatial relationships. When the value is greater than zero, it indicates that there is clustering in the distribution of SA, when the value is less than zero it indicates that the distribution of SA is dispersed, and when the value is close to zero, it indicates that the distribution of SA is random [17]. Next, Anselin Local Moran’s I local Moran’ s index was used to find the heterogeneity and location of spatial outliers in the SA. Specifically, five relationships can be found to exist in the space [40]: low value clustered regions (regions with low SA also have low SA in their surrounding regions), high value clustered regions (regions with high SA also have high SA in their surrounding regions), low values surrounded by high values (regions with low SA surrounded by regions with high SA), high values surrounded by low values (regions with high SA surrounded by regions with low SA), and non-significant [41,42].

2.4. Gravity Center Migration and Standard Deviation Ellipse

The Gravity Center Migration (GCM) method captures system dynamics by tracking the temporal migration trajectory of factor centroids within a region [43]. In this study, spatial accessibility (SA) values for each region serve as weights to compute weighted average centroid coordinates for successive years. By comparing centroid shifts across multiple scales, we examine the five-year evolution of spatial patterns associated with Hangzhou’ s completed metro stations and lines. The centroid location is calculated as follows:
x ¯ i = i = 1 n S A i x i i = 1 n S A i
y ¯ i = i = 1 n S A i y i i = 1 n S A i #
where x i ¯ , y i ¯ denotes the weighted average centroid of the region and x i , y i denotes its geographic center of the country i. The Standard Deviation Ellipse (SDE) method quantifies the spatial distribution characteristics and their changes by computing the mean center and directional standard deviations of spatial data points, thereby revealing the principal direction of dispersion, concentration degree, and pattern evolution [44,45]. In this study, SDE was applied to analyze high-low distributions and clustering features of spatial accessibility (SA) at three scales within Hangzhou’s main urban area. By comparing the changes in SA at different scales, the spatial changes and unbalanced regional development of urban rail transit are revealed. The calculation formula is as follows:
x i = x i x ¯ i
y i = y i y ¯ i
tan θ = i = 1 n S A i 2 x i 2 i = 1 n S A I 2 y i 2 + i = 1 n S A i 2 x i 2 i = 1 n y i 2 2 + 4 i = 1 n S A i 2 x i 2 y i 2 2 i = 1 n S A i 2 x i y i
σ x = i = 1 n S A i x i cos θ S A i y i sin θ 2 i = 1 n S A i 2
σ y = i = 1 n S A i x i sin θ S A i y i cos θ 2 i = 1 n S A i 2
where n denotes the total number of regions, x i and y i denote the coordinate deviation of the spatial coordinates of region i with respect to the mean center; σ x and σ y denote the distances of the long and short axes of the SDE, respectively; and θ denotes the direction angle of the SDE.

3. Study Area and Data Source

3.1. Study Area

Hangzhou, located in the Yangtze River Delta region, features a terrain characterized by higher elevations in the west and lower elevations in the east, interwoven with mountains and rivers. Historically known as a scenic and prosperous city—‘Heaven above, Suzhou and Hangzhou below’—it now serves as the capital of Zhejiang Province and a leading center for economy, culture, science, and education in China. In recent years, with rapid urbanization and economic liberalization, Hangzhou has prioritized the development of a ‘digital economy capital’ and has taken the lead nationwide in achieving accelerated expansion of its metro network. This study adopts the Hangzhou Metro system as a case study. The city possesses a well-developed urban transportation network and comprehensive public infrastructure, supporting a permanent population of approximately 12 million. As shown in Figure 3a, over 80% of residents live within the central municipal districts. In 2019, Hangzhou operated only three metro lines with around 80 stations, covering approximately 70 km. By 2023, the system had expanded to 12 lines, over 260 stations, and a cumulative operational mileage of 516 km, with peak daily ridership exceeding 3.2 million. The rapid growth of the metro network not only accommodates high-density commuter flows in central areas but also extends service coverage to suburban districts, providing robust support for coordinated regional development. Additionally, this study incorporates the Traffic Analysis Zone (TAZ) classification provided by the Hangzhou Urban Planning Bureau. The study area includes nearly 2000 TAZs, over 85% of which are smaller than 1 km2. As shown in Figure 3c, the TAZ distribution and major metro lines are illustrated-for example, the West Lake Cultural Square area contains three metro stations within just 0.35 km2 and supports approximately 60,000 employed residents.

3.2. Data Source

This study integrates multi-source heterogeneous datasets, including metro network data, population census data, road network topology data, and boundary data of streets, grids, and traffic analysis zones (TAZ), to assess the changes in urban rail accessibility in the central urban area of Hangzhou between 2019 and 2023. The TAZ data were obtained from Hangzhou Municipal Transport Bureau on 13 April 2025 (https://tb.hangzhou.gov.cn/). Population data were sourced from the 10th National Population Census (2020), published by the National Bureau of Statistics of China. The road network data were retrieved from the OpenStreetMap (OSM) open-source community.
This study acquired Hangzhou metro network data for 2019 and 2023 from the Hangzhou Open Data Platform on 31 October 2024 (https://data.hangzhou.gov.cn/dop/), while population figures were drawn from the 10th National Population Census of 2020. Road network datasets for both years were retrieved from OpenStreetMap (OSM). To enable a valid temporal comparison between 2019 and 2023, the metro and road data underwent preprocessing steps comprising projection alignment and redundancy filtering. In 2019, the metro system comprised three lines serving 79 stations, with population distribution based on the 2020 census; by 2023, network coverage expanded to 12 lines and 223 stations, with population inputs held constant to isolate the effects of network growth on accessibility and equity. For spatial consistency, all vector layers-including metro lines, stations, road segments, and administrative boundaries-were reprojected to WGS 84/UTM Zone 51N. Subsequent data cleaning and topological checks identified and removed duplicate station features from multi-source overlays, ensuring the integrity of the network topology. The station point layers in 2019 and 2023 were merged separately. Duplicate stations (often occurring at line transfer points) were identified using a spatial join and removed to ensure each physical station was represented once. Line geometries were checked for connectivity at transfer stations. Then the OSM road data was processed to create a pedestrian-specific network. This involved: Filtering for “highway” IN (‘primary’, ‘secondary’, ‘tertiary’, ‘residential’, ‘footway’, ‘path’, ‘steps’) and using ArcGIS Pro’s Fix Topology tool to eliminate dangling nodes (unsnapped road endings) with a tolerance of 5 m, trimming overshoots, and ensuring network connectivity. This step is critical for generating accurate pedestrian catchment areas. Finally, two distinct network models, representing the 2019 and 2023 configurations, respectively, were generated for downstream comparative analyses.

4. Results

4.1. Spatial Distribution of SA

This study applies a buffer-based network attenuation method to compute the accessibility index of existing subway stations in Hangzhou’ s urban core. Figure 4 illustrates the population density distribution at the grid scale. Figure 5 and Figure 6 compare, respectively, the service-population distribution and the accessibility index of subway stations across three spatial scales over two years. Both service population and accessibility indices are predominantly aligned with subway corridors and stations. At the largest scale, these metrics are more evenly dispersed along urban streets, whereas at medium and small scales (gridded cells and TAZs), they exhibit fine-grained clustering around station locations.

4.2. Unequal Spatial Distribution of SA

This study presents the Lorenz curves and Gini coefficients at three spatial scales over two years (Figure 7). The Lorenz curves deviate markedly from the line of perfect equality, indicating pronounced inequality in SA as population accumulates. Although the inequality levels differ slightly by year and scale, the 2019 average Gini coefficient exceeded 0.5, signifying substantial disparity. Notably, in 2023 all three scales exhibit lower Gini coefficients than in 2019, and their Lorenz curves shift closer to the equality line—evidence of improved accessibility equity. The magnitude of improvement is greatest at the traffic analysis zone (TAZ) scale, followed by the grid scale, and least at the street scale, suggesting that the road network-based TAZ delineation more sensitively captures changes in inequality. The observed decline in inequality is mainly attributable to the extension of new lines (e.g., Lines 5, 6, 7) into peripheral districts, reducing zero-accessibility zones. In central areas, marginal gains in accessibility diminished as the network was already saturated, while peripheral areas benefited more significantly from first-time coverage. The primary reason for the steeper decline in the Gini coefficient at the TAZ scale is directly attributable to the smaller size, finer granularity, and road network-based delineation of TAZs compared to street-scale units, which allows them to more sensitively capture the redistributive effects of new metro stations.

4.3. Spatial Heterogeneity of SA

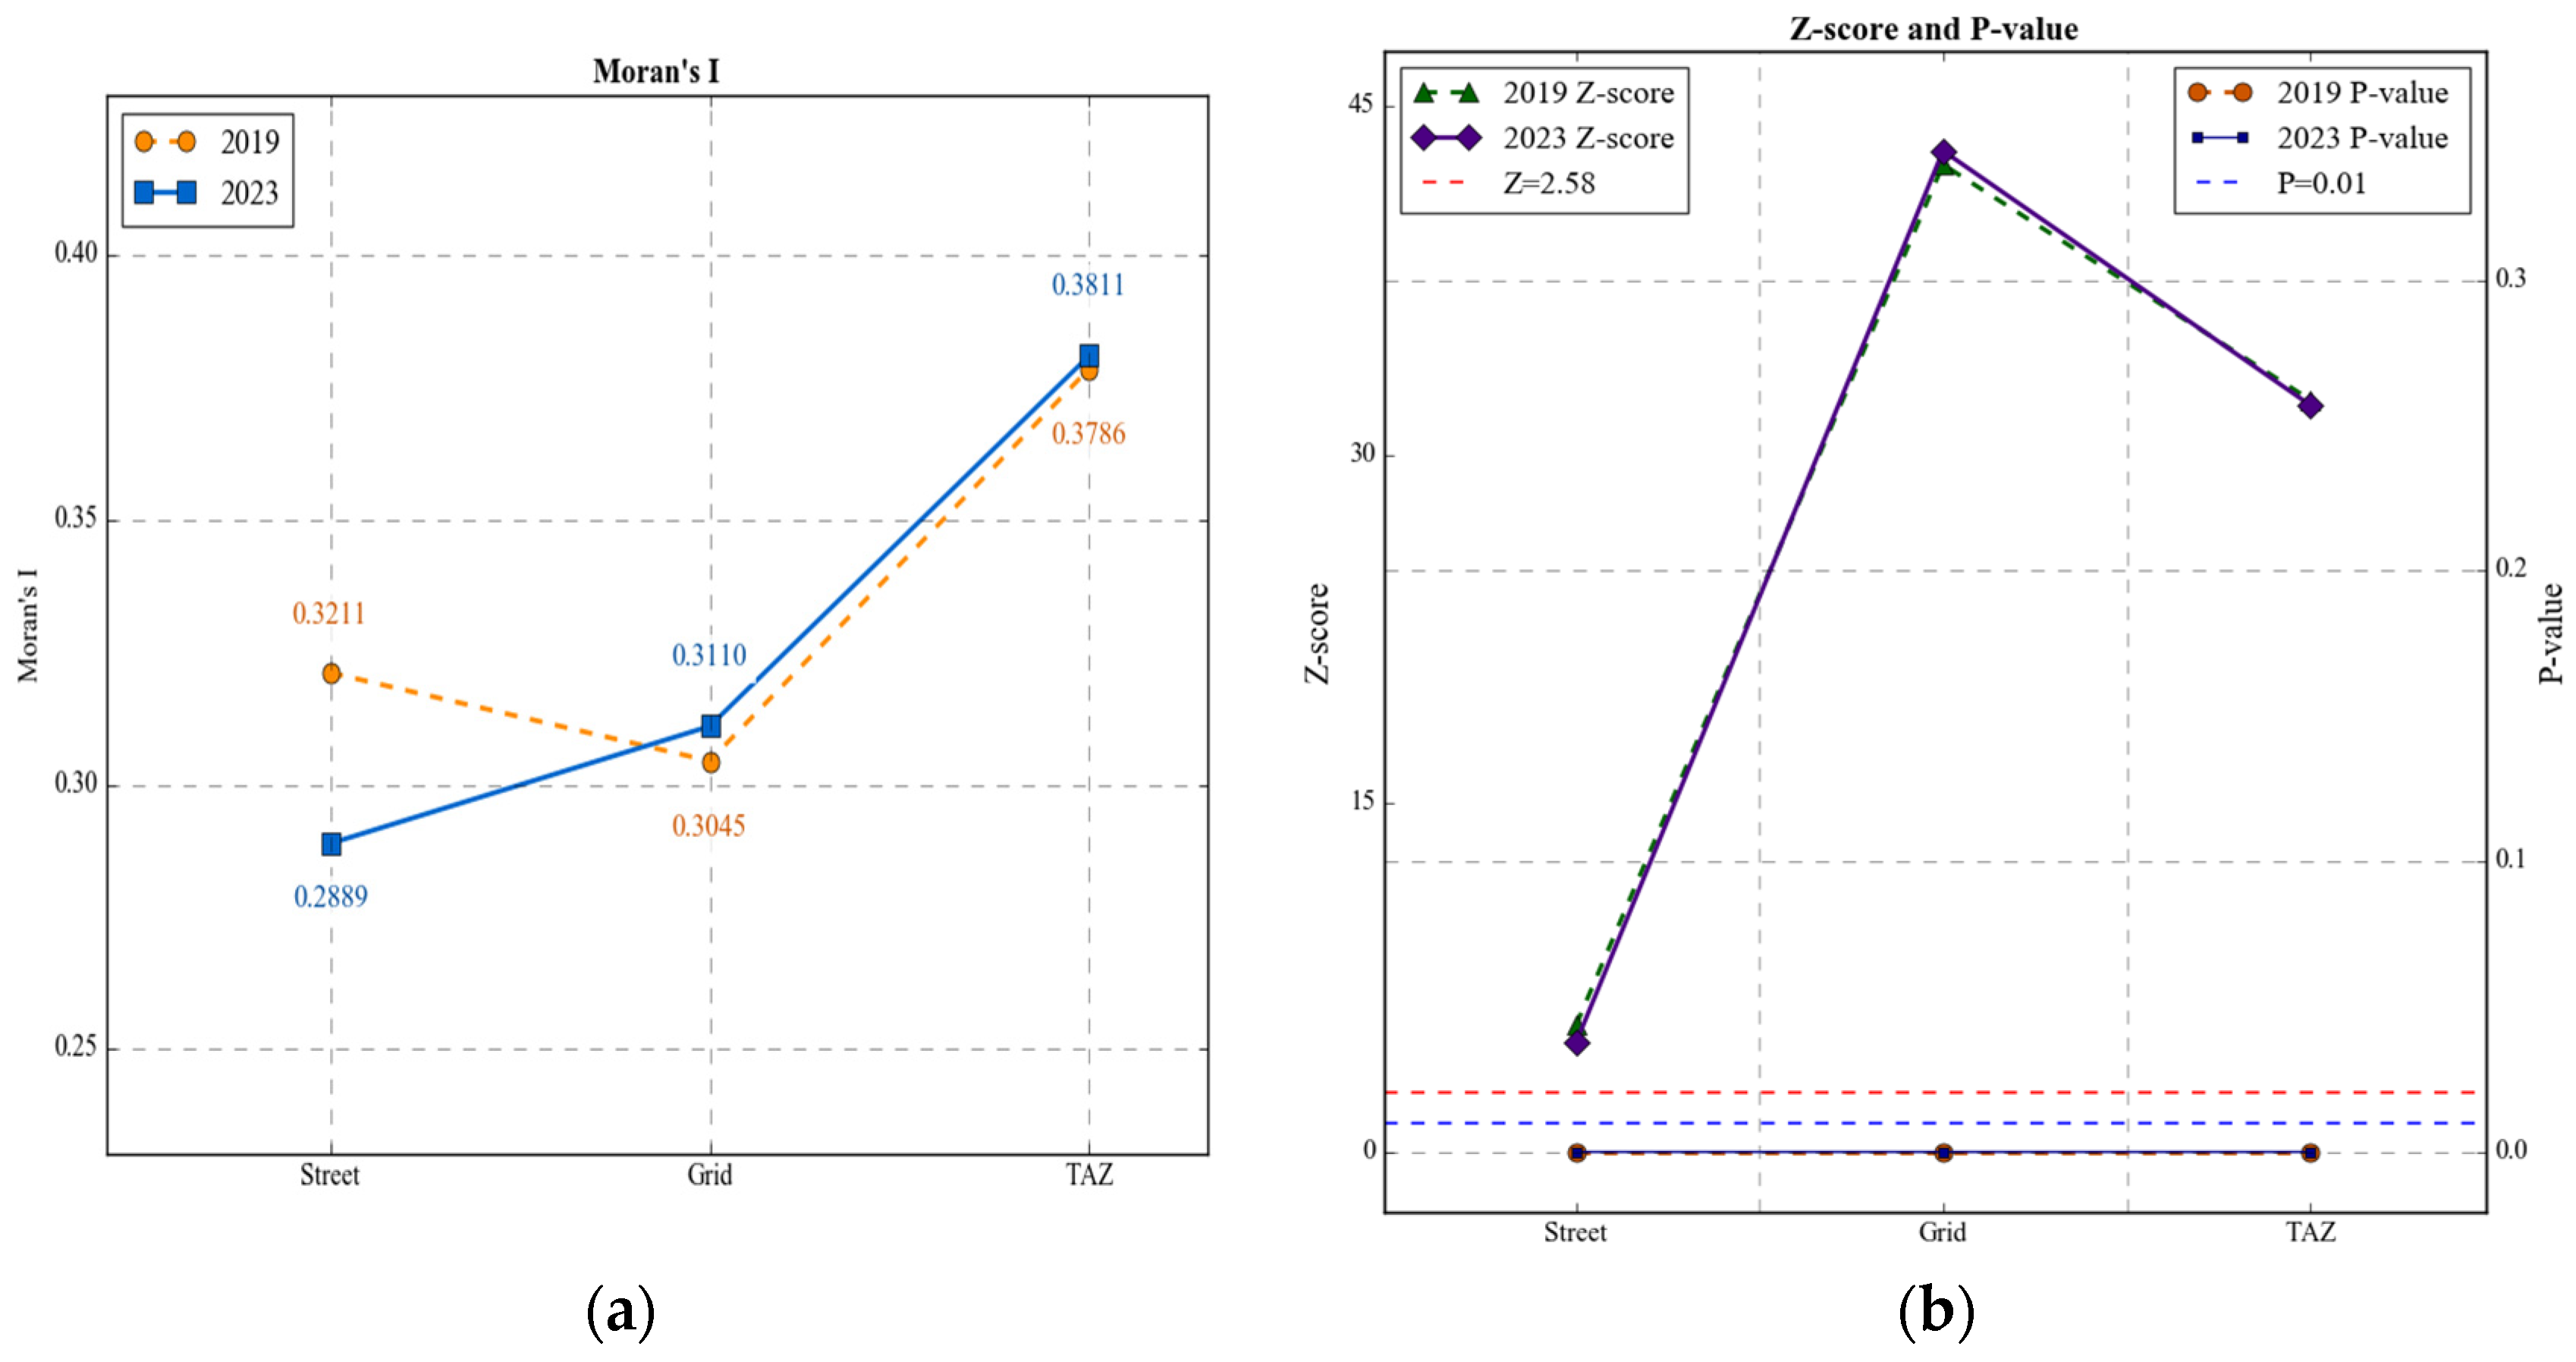
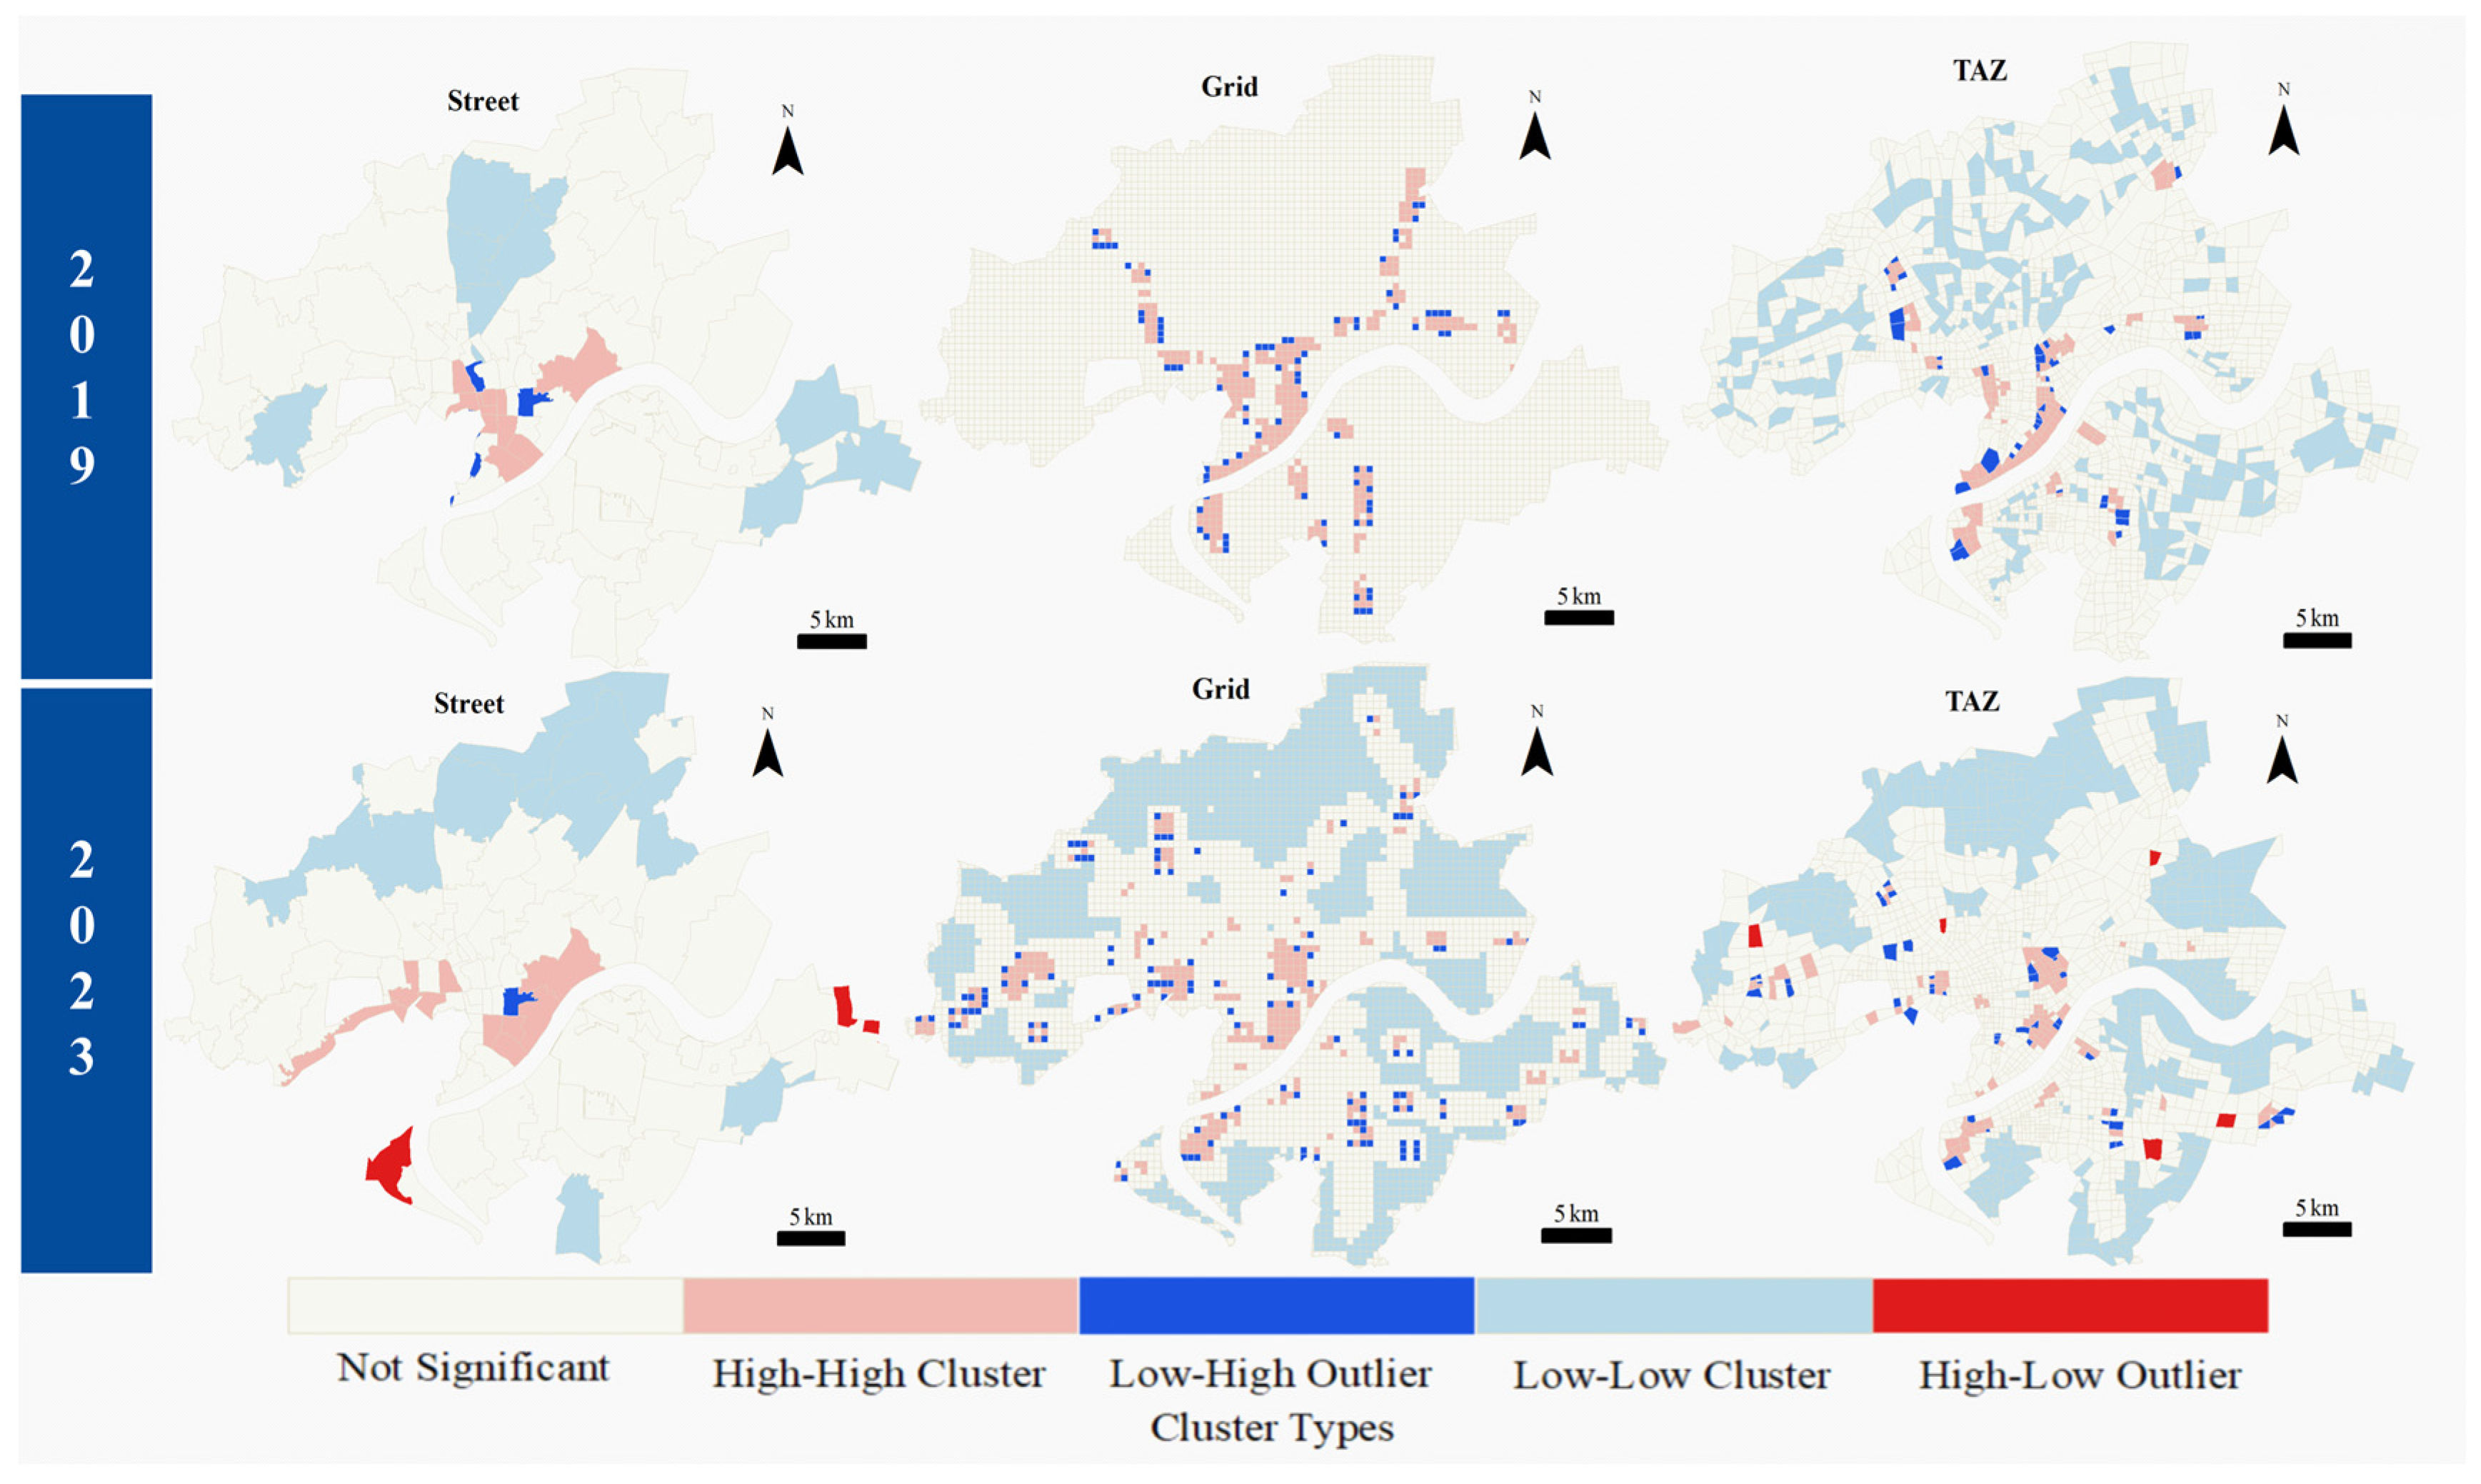
Figure 8 illustrates the spatial autocorrelation of SA and compares the differences across three spatial scales over two years. Figure 8a shows that Moran’ s I for SA consistently remains greater than zero, indicating positive spatial dependence. Figure 8b, which displays the corresponding p-values and z-scores, confirms that the results are statistically significant at the 0.01 level. This suggests that SA exhibits a statistically significant and positive spatial autocorrelation, indicating spatial clustering [46]. Figure 9 presents the spatial distribution patterns of SA at the three scales for the two years under study. The clustering patterns in 2023 are noticeably more prominent than those observed in 2019. Although certain local areas exhibit some variation, the overall clustering locations remain largely consistent. Hot spots (high-high clusters) are predominantly concentrated in the central areas of major cities, whereas cold spots (low-low clusters) are mainly found in the northeastern part of Yuhang District. Among the three scales, the grid scale provides a finer level of granularity, allowing for more detailed detection of spatial clustering. We provide a quantitative-informed discussion using the existing cluster labels and spatial outputs. Counting by scale (Figure 9): street: High–High (HH) 10 → 9, Low–Low (LL) 8 → 9; grid: HH 325 → 326, LL 0 → 1908; TAZ: HH 172 → 147, LL 250 → 536. HH clusters are concentrated in the urban core and along major transfer corridors; these areas correspond to the major interchange stations and visibly denser station networks in Figure 4. LL clusters are predominantly located in suburban and peripheral zones characterized by sparser station coverage and fewer transfer options. (1) HH areas encompass the central transfer hubs and a large share of rail stations, supporting higher effective access to the network; (2) LL areas cover a substantial portion of outlying districts where station density and transfer opportunities are visibly lower; (3) between 2019 and 2023, LL clusters show modest spatial expansion into newly urbanized suburbs, whereas HH clusters remain concentrated in the central corridor (Figure 4).

4.4. Multi-Scale Temporal and Spatial Trends in SA

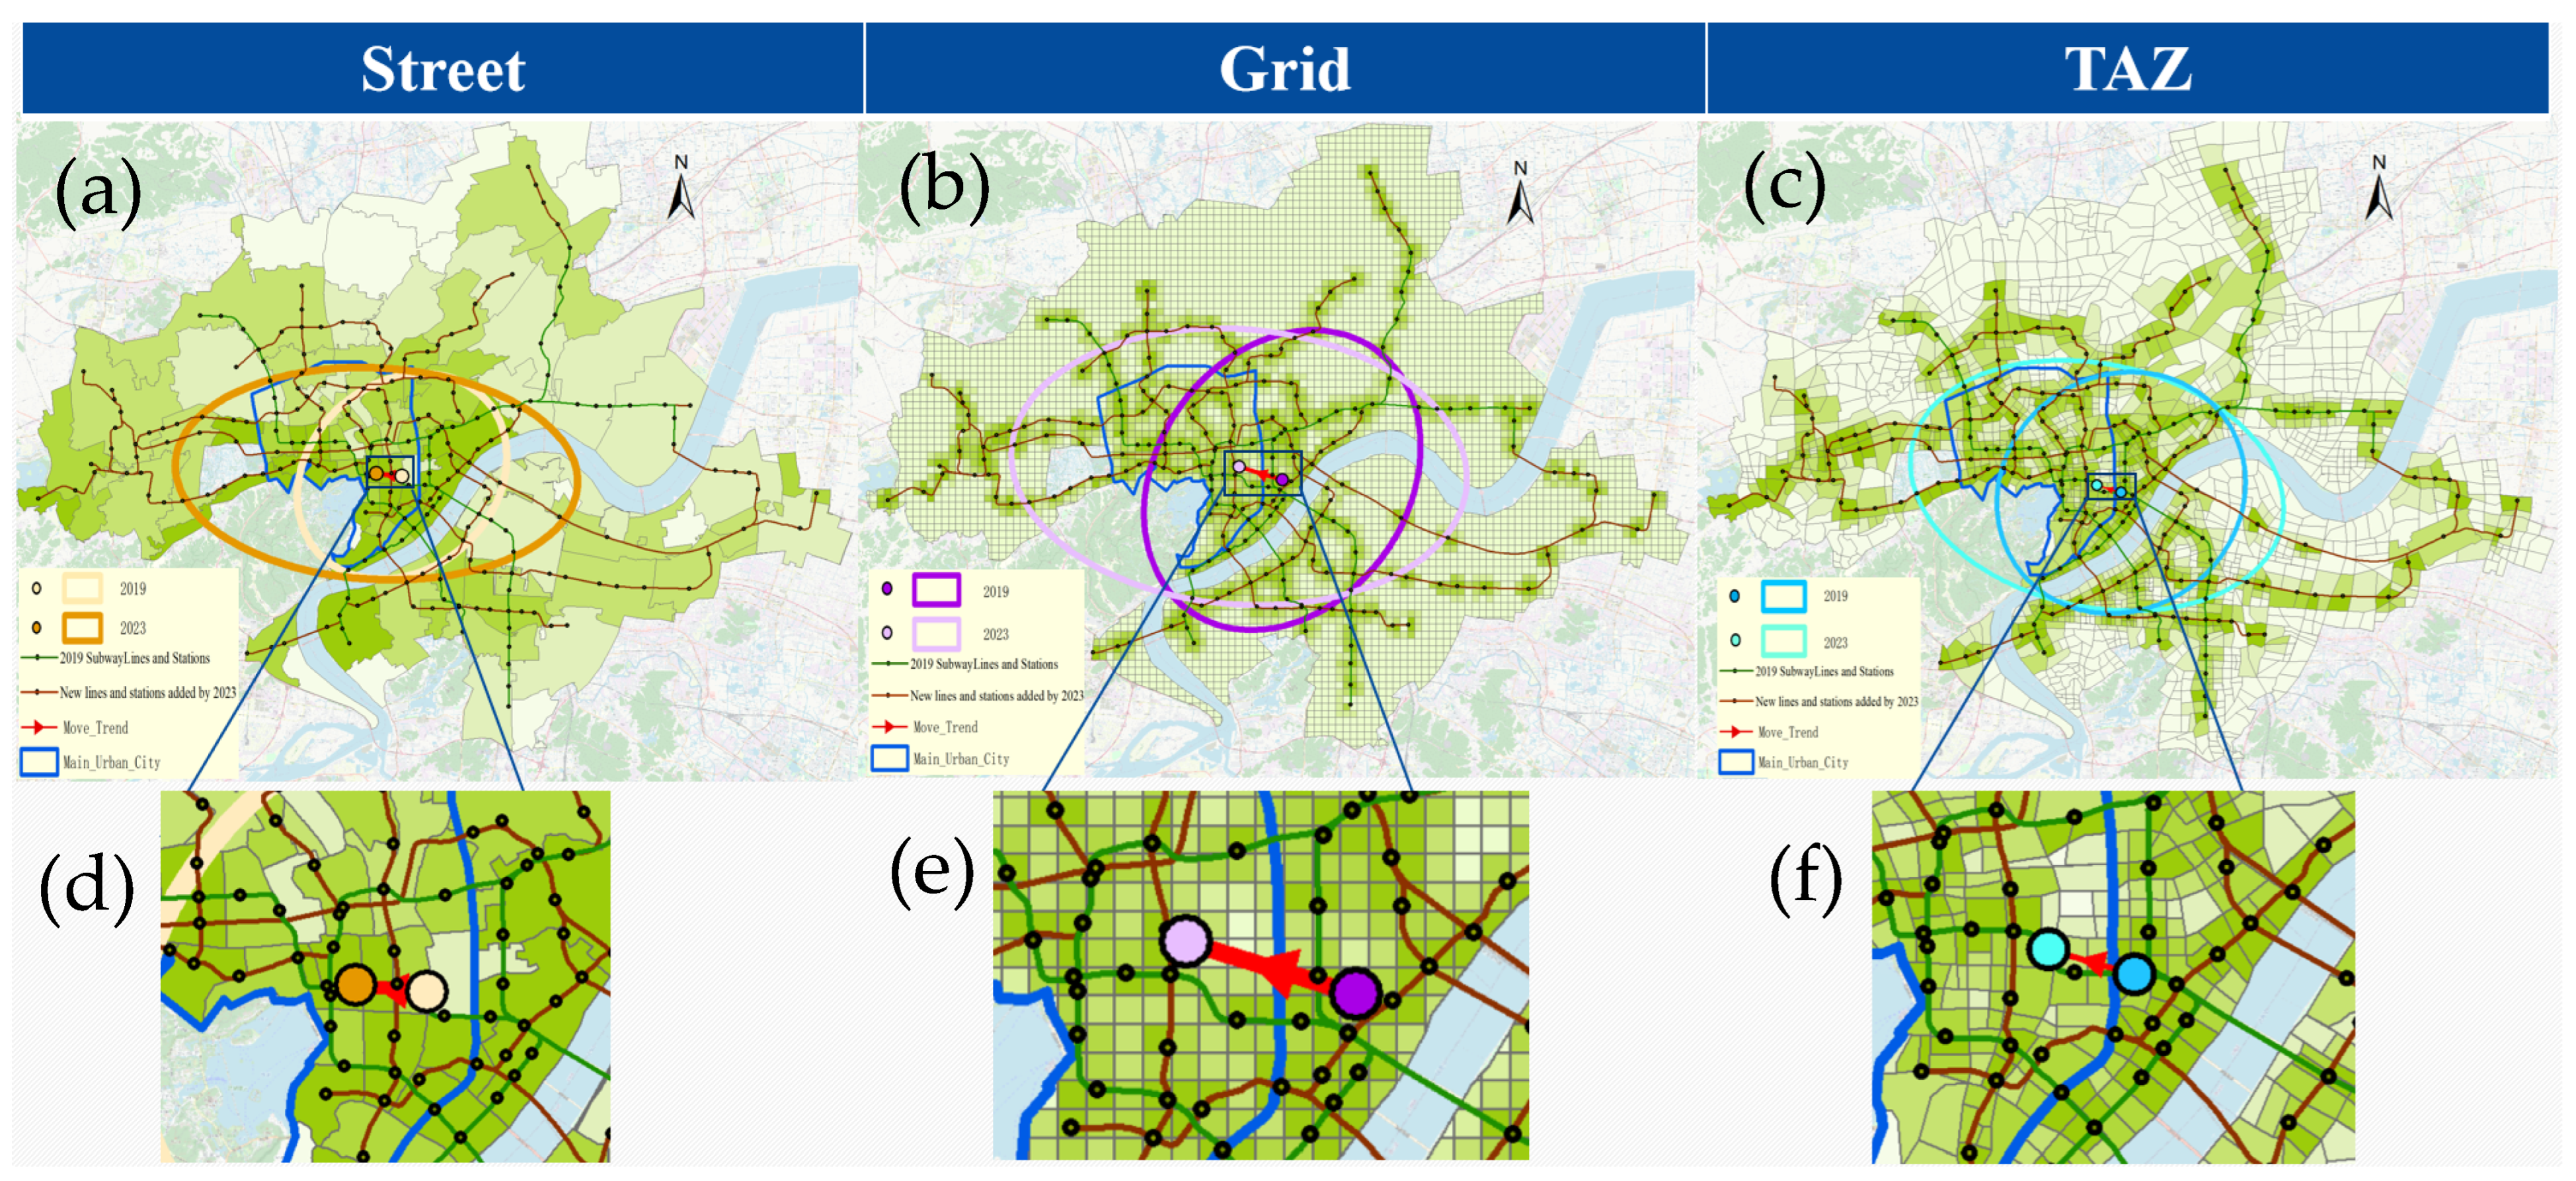
Using trend analysis, the Standard Deviation Ellipse (SDE), and the gravity center migration model, the spatial distribution changes in rail transit in Hangzhou over a two-year period were quantified based on the previously calculated station accessibility index. As shown in Figure 10, most areas exhibited a stable trend in SA. Results from the trend analysis and SDE indicate that changes in SA were primarily concentrated near the urban core, including districts such as Shangcheng, Xiacheng, Xihu, Gongshu, and Jianggan. Furthermore, at all three spatial scales, the directional trend of SA shifted from northeast-southwest in 2019 to northwest-southeast in 2023, with a more pronounced shift observed at the grid scale. Analysis using both the gravity center migration model and SDE further revealed that the overall spatial distribution of annual SA changes across all scales gradually migrated toward the northwest, indicating a trend of movement toward the central urban areas. This northwestward migration was most evident at the grid scale.

5. Discussions

This study provides an in-depth investigation of spatial inequality and the spatiotemporal dynamics of urban rail accessibility in Hangzhou from a multi-scale perspective. By comparing three spatial scales-street level, 500 m × 500 m grid, and traffic analysis zone (TAZ)—the study overcomes the limitations of traditional single-scale approaches to accessibility assessment. The findings reveal that the grid scale effectively captures high-accessibility clusters (Figure 6) in core urban areas such as Shangcheng District and West Lake Cultural Square, highlighting micro-scale heterogeneity in population density within an 800 m service radius of metro stations. In contrast, the aggregation effects inherent in the street and TAZ scales obscure internal variations; for example, accessibility in localized high-density residential zones within Xihu District is flattened through spatial averaging. The TAZ scale, due to its alignment with urban transportation planning frameworks, more sensitively detects trends toward improving spatial equity (Figure 7c). These results underscore the importance of adopting a multi-scale framework: macro-level scales (street/TAZ) facilitate the identification of broader regional equity issues, while the micro-level grid scale provides essential granularity for station-level optimization [14].
This study found that between 2019 and 2023, Hangzhou’ s subway network expanded from 3 to 12 lines, with significant increases in total operating mileage and the number of stations, reflecting both network expansion and a superimposed effect of spatial differentiation. Multi-scale accessibility analysis revealed that although overall accessibility levels improved, a pronounced accessibility gap persists between core urban districts (Shangcheng, Xiacheng, West Lake) and suburban areas such as Qiantang New Area and Yuhang. At the TAZ scale, the Gini coefficient decreased from 0.56 in 2019 to 0.425 in 2023, suggesting a reduction in inequality. However, at the 500 m × 500 m grid scale, the Gini coefficient remained around 0.404, well above the threshold for ‘low inequality’, indicating a legacy of early subway planning that prioritized the city center [19]. Before 2019, the metro system comprised only Lines 1, 2, and 4, all of which were concentrated in the urban core, with transfer hubs such as Wulin Square and the railway station. This resulted in a strong ‘transfer convenience and route overlap’ effect in central areas [2]. Hundreds of grid units in the city center formed high-accessibility clusters (Figure 9), while peripheral areas lacked subway coverage entirely, leading to zero-accessibility zones. The accessibility index model, which incorporates walking distance and line frequency into a single framework, disproportionately favored central grids by combining short walking distances, dense transfer nodes, and frequent service. As a result, central areas scored significantly higher in accessibility, producing a distinct ‘Matthew Effect’ in the Lorenz curve and Gini coefficient analysis [18,19]. Although subsequent expansions extended metro service to peripheral zones, ‘weak links’ remain. Since 2020, new lines such as Lines 5, 6, and 7 have been opened annually, extending coverage to Yuhang, Qiantang New Area, and Xiaoshan Airport—bringing subway access for the first time to previously underserved areas. At the TAZ level, accessibility improved notably, especially in zones directly served by new lines between 2022 and 2023, where the Gini coefficient saw the most significant decline. However, improvements at the grid level remained limited. New lines in some areas were unidirectional, with sparse station distribution and a lack of transfer hubs, creating ‘stepped’ disparities in accessibility between adjacent grids. As a result, grids within the same TAZ can show large disparities in accessibility, and this intra-TAZ variation persists, hindering improvements in street-level Gini coefficients. Additionally, there exists a mismatch between functional zoning and population distribution. TAZs in the city center often integrate commercial, office, and high-density residential land use, resulting in higher population and employment densities and thus higher accessibility demand. In contrast, while new stations have been added in suburban TAZs, the surrounding land is often composed of newly developed towns or industrial parks, where pedestrian flows remain sparse and both residential and employment densities are low [24,30]. Even if these stations fall within the theoretical accessibility range, the number of actual beneficiaries remains limited, preventing effective service delivery within the grid or short-walk catchments. This spatiotemporal mismatch between supply and demand continues to hinder the short-term accessibility equity of peripheral grids compared to those in the urban core.
The analysis of Global Moran’ s I and Local Moran’ s I indicates that accessibility indices at various spatial scales in both 2019 and 2023 exhibit significant positive spatial autocorrelation (I > 0.3, p < 0.01). Local Moran’ s I identifies prominent ‘high-high’ and ‘low-low’ clusters. High-accessibility clusters are mainly concentrated in areas such as Wulin Square and other multi-line interchange hubs, whereas low-accessibility clusters are located in the northern part of Yuhang and other peripheral zones lacking metro coverage or located at the extremities of loop lines. When overlaid with road network configurations and urban functional distributions, it becomes evident that ‘high-high’ cluster centers exhibit spillover effects [6]. Stations such as Wulin Square, City Station, and Jiangling Road serve as intersections of two or more metro lines, with walking catchments that encompass dense commercial centers and residential areas. These stations offer seamless transfers and are supported by well-integrated micro-circulation systems, including public buses and shared bicycles, forming exemplary multimodal hubs (metro + express rail + bus) [41]. The presence of high-accessibility clusters in the city center reflects both the outcomes of deliberate metro network planning and the effectiveness of transit-oriented development (TOD) strategies. When multiple lines converge, land values surrounding commercial, service, and residential zones increase rapidly, attracting population and economic activity and reinforcing the positive feedback of accessibility metrics [23,28]. Conversely, ‘low-low’ clusters are indicative of edge ‘transportation islands’ [15]. For example, northeastern Yuhang remains outside the coverage of any metro lines, with scattered and infrequent public transport services, exacerbating the ‘last-mile’ problem [30]. Local Moran’ s I identifies multiple contiguous grids forming clusters of accessibility cold spots—underserved areas that have persistently remained on the fringe of the public transport network. Although recent metro extensions have reached some new districts, cold spot locations have shifted: former peripheral areas near the central city have seen improvements, but new ‘low-low’ clusters have emerged in grids more than 800 m walking distance from newly opened stations.
Between 2019 and 2023, the spatial and temporal evolution of SA in Hangzhou’s main urban area exhibited a clear northwestward shift in the center of gravity, particularly pronounced at the grid scale. This shift reflects the ‘center of gravity migration’ effect induced by the extension of newly constructed lines, such as Line 5, Line 9 in Qiantang New District, and the Xiaoshan Airport Line to the southwest. It indicates that city planners have begun incorporating the development of peripheral areas into the rail transit network layout. However, due to the still high population density in the urban core, the accessibility center has not fully departed from the city center. The direction of the long axis of the Standard Deviation Ellipse (SDE) demonstrates the coexistence of network expansion and structural differentiation. From 2019 to 2023, the SDE’ s long axis shifted from a northeast-southwest orientation to a northwest-southeast direction, with the ellipse area increasing across all spatial scales. This trend suggests a growing dispersion in accessibility distribution, with new extension corridors diverging from existing high-accessibility zones. Specifically, the short axis of the SDE in the central area remained relatively stable. However, the long axis to stretch, reflecting an increasing core–periphery polarization. Without timely optimization of intra-urban connections and transit hubs, accessibility in the terminal areas of the long axis may continue to grow in a distorted pattern, posing risks of potential social stratification [47].

6. Conclusions

Based on multi-source data of subway network, road network topology and population distribution in 2019 and 2023 in Hangzhou main urban area, this study constructs a urban rail station accessibility model based on the buffer zone road network attenuation method from three spatial scales: street, 500 m × 500 m grid and TAZ, and systematically reveals the spatial distribution characteristics of urban rail accessibility in the main urban area of Hangzhou, the degree of inequality and its temporal and spatial evolution patterns by means of the Gini coefficient, the Lorenz curve, the Global/Local Moran’ s I index, center of gravity migration and standard deviation ellipse. Before 2019, Hangzhou’ s metro system was primarily concentrated in the central urban area, with dense transfer hubs and high pedestrian accessibility, supported by frequent services. This configuration formed a positive feedback loop between accessibility and employment opportunities. In contrast, newly developed peripheral areas lacked a metro backbone and relied on bus services or bike-sharing systems for connectivity. These areas exhibited steeper walking decay rates at the grid level, resulting in persistently low accessibility indices. Although metro lines extended toward Yuhang and Qiantang New Districts after 2020, the unidirectional layout and centralized station planning have not yet formed integrated multimodal hubs. Consequently, spatial inequality in accessibility at the grid and subdistrict levels remains unresolved. Among the three spatial scales, the grid level most effectively captures fine-grained characteristics, revealing the coexistence of local ‘service peaks’ and ‘service gaps’. The TAZ scale highlights the overall trend of inequality improvement, while the subdistrict scale shows the lowest sensitivity to inequality.
In terms of aggregation patterns and spatial and temporal trends in SA, the presence of high-high clusters in the central area reflects a strong coupling between transportation resources and economic activities, but it also exacerbates homogeneous development and rising land prices. Conversely, low-low clusters illustrate the deprivation effects caused by ‘last-mile’ barriers in disadvantaged areas, where residents face higher commuting costs and limited job opportunities. The spatial centroid of SA has gradually shifted northwestward—toward Qiantang New District and Xiaoshan—with a growing long axis, indicating an intensifying core–periphery polarization. These findings suggest that expanding the metro network alone is insufficient to eliminate accessibility disparities. Future planning should prioritize intra-district connectivity and the clustering effect of station groups. Measures such as introducing micro-circulation buses, enhancing bike-sharing systems, and improving pedestrian infrastructure are essential to bridging the ‘last-mile’ gap. Additionally, accessibility equity must consider dynamic population distributions and micro-environmental disparities by offering targeted subsidies and facility improvements for vulnerable populations such as the elderly and low-income groups, thereby promoting fairer access to rail transit across the city.
Several limitations of this study should be noted. Firstly, in terms of data sources, we relied on the 2020 static population census data. However, such static data may not accurately capture recent shifts in population size and spatial distribution, especially in newly developed areas. This likely leads to an underestimation of actual travel demand and potential accessibility pressures in these growing fringe areas, meaning our results might portray a slightly more optimistic picture of equity improvement than currently exists. Future research could incorporate dynamic population flow data—such as mobile phone signaling, bike-sharing usage records, or real-time check-in data from social media platforms—to enhance the timeliness and accuracy of accessibility assessments [48]. Secondly, the current model focuses primarily on spatial impedance between metro stations and pedestrian movement, without accounting for multimodal transport options such as bike-sharing. These options can significantly extend the effective service radius of a metro station. Consequently, the model may overestimate the “last-mile” barrier and slightly underestimate the actual accessibility, especially for stations where these services are well-integrated. Future studies could integrate metro networks with buses, shared bicycles, and cycling lanes to construct a multimodal network. This would allow for hierarchical modeling of different travel modes and the derivation of a composite accessibility index [49]. Thirdly, coupling the accessibility model with a gravity-based framework could help evaluate the attraction strength of stations in relation to the distribution of commercial and public service facilities, offering a more comprehensive understanding of spatial interaction mechanisms. Finally, this study treats the population as a homogeneous group. It did not differentiate the varying needs and constraints of different demographic segments (e.g., the elderly, low-income populations, or people with disabilities) who may have different walking tolerances, schedule constraints, or travel purposes [50]. Therefore, the fine-scale, intra-zone equity disparities among social groups might be obscured. In the future, social attributes such as age and income (e.g., elderly groups’ sensitivity to walking distance) can be embedded to assess group-differentiated accessibility deprivation.

Author Contributions

Conceptualization, data curation, formal analysis, investigation, methodology: Jiasheng Zhu and Xiaoping Rui. Software, visualization, writing—original draft: Jiasheng Zhu. Funding acquisition, project administration, supervision, validation, writing—review & editing: Xiaoping Rui. All authors have read and agreed to the published version of the manuscript.

Funding

This research was funded by the National Natural Science Foundation of China (Grant No. 42376180).

Data Availability Statement

Data is available on request.

Acknowledgments

During the preparation of this manuscript, the authors used Deeply machine translation from Chinese to English and conversely for the purposes of correct use of language. The authors have reviewed and edited the output and take full responsibility for the content of this publication.

Conflicts of Interest

The authors declare no conflicts of interest.

References

  1. Lu, J.; Sun, D. Spatiotemporal Evolution and Complexity of Urban Networks in China, 1978–2019: An Enterprise Linkages Perspective. Complexity 2021, 2021, 9931985. [Google Scholar] [CrossRef]
  2. Ding, F.; Tang, Y.; Wang, Y.; Zhao, Z. Unraveling the network effects in station ridership growth patterns under metro network expansion. J. Transp. Geogr. 2025, 125, 104205. [Google Scholar] [CrossRef]
  3. Yu, X.; Chen, Z.; Liu, F.; Zhu, H. How urban metro networks grow: From a complex network perspective. Tunn. Undergr. Space Technol. 2023, 131, 104841. [Google Scholar] [CrossRef]
  4. Du, Q.; Zhou, Y.; Huang, Y.; Wang, Y.; Bai, L. Spatiotemporal exploration of the non-linear impacts of accessibility on metro ridership. J. Transp. Geogr. 2022, 102, 103380. [Google Scholar] [CrossRef]
  5. Huang, X.; Kang, C.; Yin, C.; Tang, J. Influence of Transportation Accessibility on Urban-rural Income Disparity and Its Spatial Heterogeneity. Chin. Geogr. Sci. 2024, 34, 453–467. [Google Scholar] [CrossRef]
  6. Yang, M.; Sun, Z.; Ouyang, X.; Li, H.; Han, Y.; Gunasekera, D. Spatial and Temporal Dynamics of Transportation Accessibility in China: Insights from Sustainable Development Goal Indicators from 2015 to 2022. Remote Sens. 2024, 16, 4452. [Google Scholar] [CrossRef]
  7. Shi, F. Research on accessibility and equity of urban transport based on multisource big data. J. Adv. Transp. 2021, 2021, 1103331. [Google Scholar] [CrossRef]
  8. Zhang, M.; Zhao, P. Literature review on urban transport equity in transitional China: From empirical studies to universal knowledge. J. Transp. Geogr. 2021, 96, 103177. [Google Scholar] [CrossRef]
  9. Hansen, W.G. How Accessibility Shapes Land Use. J. Am. Inst. Plan. 1959, 25, 73–76. [Google Scholar] [CrossRef]
  10. Lee, J.; Miller, H.J. Robust accessibility: Measuring accessibility based on travelers’ heterogeneous strategies for managing travel time uncertainty. J. Transp. Geogr. 2020, 86, 102747. [Google Scholar] [CrossRef]
  11. Li, D.; Zang, H.; Guan, Z.; Yu, D. Study on spatial distribution and inequity of rail transit travel accessibility under multi modal traveling: A case study of Beijing. Sci. Rep. 2025, 15, 15823. [Google Scholar] [CrossRef]
  12. Cong, W.; Zhou, J.; Lai, Y. The coordination between citywide rail transit accessibility and land-use characteristics in Shenzhen, China: An explorative analysis based on multidimensional spatial data. Sustain. Cities Soc. 2024, 113, 105691. [Google Scholar] [CrossRef]
  13. Yan, C.; Gao, Y.; Yang, Y. Exploring the Spatial Patterns of Accessibility to Metro Services Considering the Locations of Station Entrances/Exits. Buildings 2024, 14, 3532. [Google Scholar] [CrossRef]
  14. Pinheiro, C.D.; Feliu, J.G.; Bertoncini, B.V. Addressing spatial heterogeneity and MAUP in urban transport geography: A multi-scale analysis of accessibility and warehouse location. J. Transp. Geogr. 2025, 123, 104078. [Google Scholar] [CrossRef]
  15. Jian, W.; Liu, X.; Liu, H.; Hu, Y.; Gao, L. The Impacts of the Multiscale Built Environment on Commuting Mode Choice: Spatial Heterogeneity, Moderating Effects, and Implications for Demand Estimation. J. Adv. Transp. 2023, 2023, 9346631. [Google Scholar] [CrossRef]
  16. Li, J.; Ma, M.; Xia, X.; Ren, W. The Spatial Effect of Shared Mobility on Urban Traffic Congestion: Evidence from Chinese Cities. Sustainability 2021, 13, 14065. [Google Scholar] [CrossRef]
  17. Yang, L.; Chau, K.W.; Szeto, W.Y.; Cui, X.; Wang, X. Accessibility to transit, by transit, and property prices: Spatially varying relationships. Transp. Res. Part D Transp. Environ. 2020, 85, 102387. [Google Scholar] [CrossRef]
  18. Lai, W.; Lin, D.; Li, Z.; Peng, Y.; Zhou, W.; Feng, T. Grid-level assessment on spatial equity in access to urban public facilities by vulnerable groups based on the multi-source data. Habitat Int. 2025, 161, 103423. [Google Scholar] [CrossRef]
  19. Li, C.; Wang, J. Measuring multi-activities accessibility and equity with accessibility-oriented development strategies. Transp. Res. Part D Transp. Environ. 2024, 126, 104035. [Google Scholar] [CrossRef]
  20. Litman, T. Evaluating Transportation Equity. World Transp. Policy Pract. 2002, 8, 50–65. [Google Scholar]
  21. Yu, L.; Cui, M. How subway network affects transit accessibility and equity: A case study of Xi’an metropolitan area. J. Transp. Geogr. 2023, 108, 103556. [Google Scholar] [CrossRef]
  22. Zhu, L.; Lucas, K. Towards calculated and perceived transport equity: An equity evaluation framework for accessibility. Transp. Res. Part D Transp. Environ. 2025, 146, 104908. [Google Scholar] [CrossRef]
  23. Chen, H.; Yang, W.; Li, T. The Impact of Rail Transit on Accessibility and Spatial Equity of Public Transit: A Case Study of Guangzhou, China. Int. J. Environ. Res. Public Health 2022, 19, 11428. [Google Scholar] [CrossRef]
  24. Sun, Z.; Zacharias, J. Transport equity as relative accessibility in a megacity: Beijing. Transp. Policy 2020, 92, 8–19. [Google Scholar] [CrossRef]
  25. Guo, J.; Brakewood, C. Analysis of spatiotemporal transit accessibility and transit inequity of essential services in low-density cities, a case study of Nashville, TN. Transp. Res. Part A Policy Pract 2024, 179, 103931. [Google Scholar]
  26. D’ORso, G.; Yasir, M.; Migliore, M. Combining walkability assessments at different scales in measuring spatial inequalities in access to railway stations. J. Transp. Health 2025, 44, 102081. [Google Scholar] [CrossRef]
  27. Beza, A.D.; Demissie, M.G.; Kattan, L. Equity implications of emerging mobility services and public transit coopetition: A review. Transp. Res. Part D Transp. Environ. 2025, 144, 104751. [Google Scholar] [CrossRef]
  28. Zhu, M.; Sze, N.N.; Li, H. Influence of walking accessibility for metro system on pedestrian safety: A multiple membership multilevel model. Anal. Methods Accid. Res. 2024, 43, 100337. [Google Scholar] [CrossRef]
  29. Wu, T.; Li, M.; Zhou, Y. Measuring Metro Accessibility: An Exploratory Study of Wuhan Based on Multi-Source Urban Data. ISPRS Int. J. Geo Inf. 2023, 12, 18. [Google Scholar] [CrossRef]
  30. Ha, J.; Ki, D.; Lee, S.; Ko, J. Mode choice and the first-/last-mile burden: The moderating effect of street-level walkability. Transp. Res. Part D Transp. Environ. 2023, 116, 103646. [Google Scholar] [CrossRef]
  31. Liao, C.; Scheuer, B. Evaluating the performance of transit-oriented development in Beijing metro station areas: Integrating morphology and demand into the node-place model. J. Transp. Geogr. 2022, 100, 103333. [Google Scholar] [CrossRef]
  32. Li, M.; Zhang, H.; Chen, J. Fine-Grained Dynamic Population Mapping Method Based on Large-Scale Sparse Mobile Phone Data. In Proceedings of the 2019 20th IEEE International Conference on Mobile Data Management (MDM), Hong Kong, China, 10–13 June 2019; pp. 473–478. [Google Scholar] [CrossRef]
  33. Peungnumsai, A.; Miyazaki, H.; Witayangkurn, A.; Kim, S.M. A Grid-Based Spatial Analysis for Detecting Supply–Demand Gaps of Public Transports: A Case Study of the Bangkok Metropolitan Region. Sustainability 2020, 12, 10382. [Google Scholar] [CrossRef]
  34. Liu, L.; Porr, A.; Miller, H.J. Realizable accessibility: Evaluating the reliability of public transit accessibility using high-resolution real-time data. J. Geogr. Syst. 2023, 25, 429–451. [Google Scholar] [CrossRef]
  35. Liu, J.; Chau, K.W.; Bao, Z. Multiscale spatial analysis of metro usage and its determinants for sustainable urban development in Shenzhen, China. Tunn. Undergr. Space Technol. 2023, 133, 104912. [Google Scholar] [CrossRef]
  36. Ma, S.; Chen, X.; Wu, Y.; Shao, H.; Zhang, J. Equity Analysis of Transportation Networks in Urban Agglomerations Based on Accessibility. J. Transp. Syst. Eng. Inf. Technol. 2022, 22, 51–59. [Google Scholar]
  37. Yao, Z.; Fu, Y.; Zhang, J. Impacts of accessibility to transit measures on inequality index of public transport. J. Transp. Syst. Eng. Inf. Technol. 2021, 21, 206–213. [Google Scholar] [CrossRef]
  38. Xu, X.; Zhang, D.; Liu, X.; Ou, J.; Wu, X. Simulating multiple urban land use changes by integrating transportation accessibility and a vector-based cellular automata: A case study on city of Toronto. Geo Spat. Inf. Sci. 2022, 25, 439–456. [Google Scholar]
  39. Faghihinejad, F.; Zoghifard, M.; Amiri, A.M.; Monajem, S. Evaluating Social and Spatial Equity in Public Transport: A Case Study. Transp. Lett. 2022, 15, 1420–1429. [Google Scholar] [CrossRef]
  40. Wang, J.; Li, B.; Zhang, H.; Xing, H.; Cao, D. An analysis of the spatial-temporal accessibility and change intensity of attraction-oriented parks. J. South China Norm. Univ. (Nat. Sci. Ed.) 2021, 53, 88–95. [Google Scholar] [CrossRef]
  41. Anselin, L. Local Indicators of Spatial Association—LISA. Geogr. Anal. 1995, 27, 93–115. [Google Scholar] [CrossRef]
  42. Ye, C.; He, Q.; Huang, W.; Ma, H. Analysis of the Spatial Distribution Characteristics of Residences and Workplaces under the Influence of Metro Transportation in Metropolises from the Perspectives of Accessibility and Travelers’ Industries: The Case of Guangzhou. Sustainability 2022, 14, 14187. [Google Scholar] [CrossRef]
  43. Fu, X.; Shen, Y.; Dong, R.; Deng, H.; Wu, G. Analysis of Urbanization Based on Center-Of-Gravity Movement and Characteristics in Songhua River Basin of China and Its Southern Source Sub-Basin Between 1990 and 2010. Chin. Geogr. Sci. 2016, 26, 117–128. [Google Scholar] [CrossRef]
  44. Yu, J.; Li, X.; Guan, X.; Shen, H. A Remote Sensing Assessment Index for Urban Ecological Livability and Its Application. Geo-Spat. Inf. Sci. 2022, 27, 289–310. [Google Scholar] [CrossRef]
  45. Zhao, Y.; Wu, Q.; Wei, P.; Zhao, H.; Zhang, X.; Pang, C. Explore the Mitigation Mechanism of Urban Thermal Environment by Integrating Geographic Detector and Standard Deviation Ellipse (SDE). Remote Sens. 2022, 14, 3411. [Google Scholar] [CrossRef]
  46. Zhang, K.; Jin, Y.; Li, D.; Wang, S.; Liu, W. Spatiotemporal variation and evolutionary analysis of the coupling coordination between urban social-economic development and ecological environments in the Yangtze River Delta cities. Sustain. Cities Soc. 2024, 111, 105561. [Google Scholar] [CrossRef]
  47. Wu, W.; Cao, M.; Wang, F.; Wang, R. Nonlinear influences of landscape configurations and walking access to transit services on travel satisfaction. Trans. Res. Part A Policy Pract. 2024, 189, 104232. [Google Scholar]
  48. Liu, D.; Wei, J.; Kan, Z. Integrated transit service status assessment using smart transit card big data under the x-minute city framework. J. Transp. Geogr. 2025, 125, 104189. [Google Scholar] [CrossRef]
  49. Fan, Z.; Harper, C.D. Taking a multimodal approach to equitable bike share station siting. J. Transp. Geogr. 2024, 115, 103814. [Google Scholar] [CrossRef]
  50. Shao, Y.; Luo, W. Supply-demand adjusted two-steps floating catchment area (SDA-2SFCA) model for measuring spatial access to health care. Soc. Sci. Med. 2022, 296, 114727. [Google Scholar] [CrossRef]
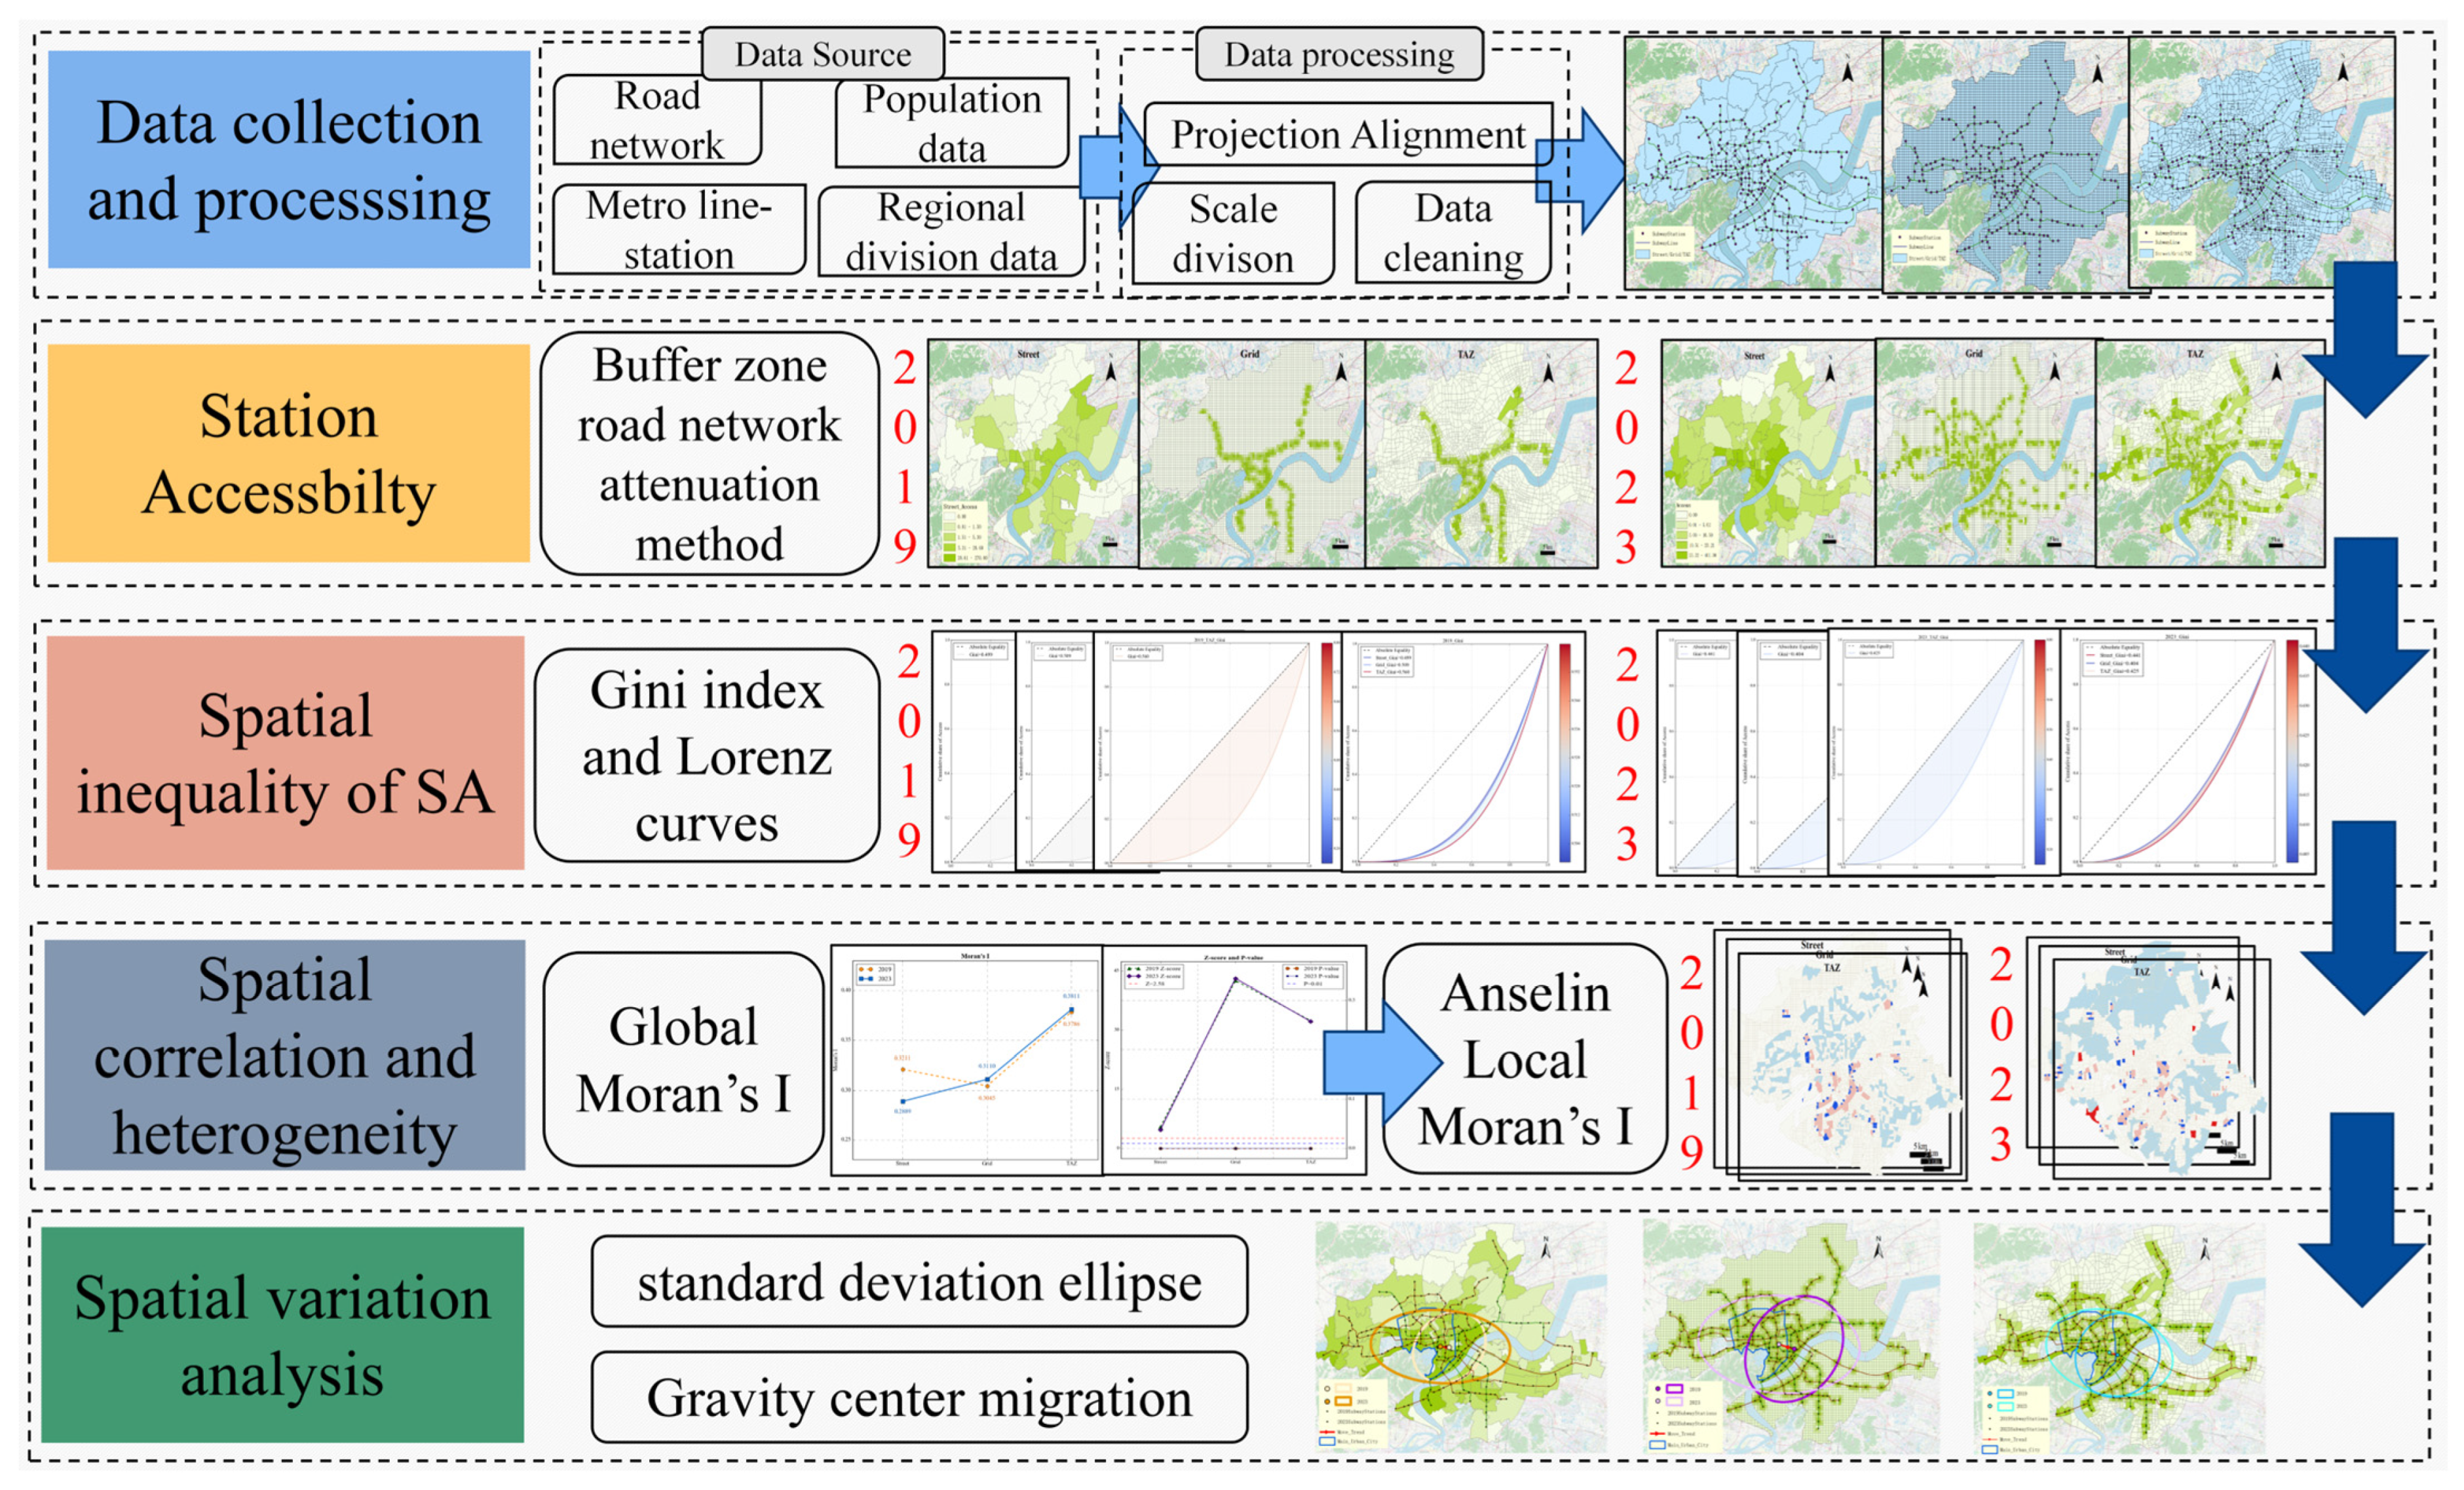
Figure 1. General framework of the study.
Ijgi 14 00361 g001
Figure 2. An 800 m walking threshold attenuation function diagram.
Ijgi 14 00361 g002
Figure 3. The study area. Where (a) is the street scale, (b) is the grid scale, (c) is the TAZ scale.
Ijgi 14 00361 g003
Figure 4. Population density distribution at grid scale.
Ijgi 14 00361 g004
Figure 5. Spatial distribution of population served by stations, where (ac) show the population served by stations for Street, Grid and TAZ in 2019 respectively and where (df) show population served by stations for Street, Grid and TAZ in 2023 respectively.
Ijgi 14 00361 g005
Figure 6. Spatial distribution of station accessibility, where (ac) show the station accessibility for Street, Grid and TAZ in 2019 respectively and where (df) show the station accessibility for Street, Grid and TAZ in 2023 respectively.
Ijgi 14 00361 g006
Figure 7. Lorenz curves and Gini coefficients for station accessibility at three scales over two years, where (a) shows the Gini coefficients for the Street scale in 2019 and 2023; (b) shows the Gini coefficients for the Grid scale in 2019 and 2023; (c) shows the Gini coefficients for the TAZ scale in 2019 and 2023.
Ijgi 14 00361 g007
Figure 8. (a). Moran’s I for SA at three scales for two years, (b). p-values and Z-scores at three scales for two years.
Ijgi 14 00361 g008
Figure 9. SA spatial pattern at three scales for two years.
Ijgi 14 00361 g009
Figure 10. Trend of SA from 2019 to 2023, where (ac) shows the change in SDE and where (df) shows the center of gravity migration trajectory.
Ijgi 14 00361 g010
Table 1. Metro line supply frequency table.
Metro LineLine1Line2Line3Line4Line5Line6Line7Line8Line9Line10Line16Line19
Frequency
(trips/day)
70637812056105749079758486
Disclaimer/Publisher’s Note: The statements, opinions and data contained in all publications are solely those of the individual author(s) and contributor(s) and not of MDPI and/or the editor(s). MDPI and/or the editor(s) disclaim responsibility for any injury to people or property resulting from any ideas, methods, instructions or products referred to in the content.