Abstract
This study explores the use of conditional Generative Adversarial Networks (cGANs) for simulating urban morphology, a domain where such models remain underutilized but have significant potential to generate realistic and controllable city patterns. To explore this potential, this research includes several contributions: a bespoke model architecture that integrates attention mechanisms with visual reasoning through a generalized conditioning layer. A novel mechanism that enables the steering of urban pattern generation through the use of statistical input distributions, the development of a novel and comprehensive training dataset, meticulously derived from open-source geospatial data of Berlin. Our model is trained using a hybrid loss function, combining adversarial, focal and L1 losses to ensure perceptual realism, address challenging fine-grained features, and enforce pixel-level accuracy. Model performance was assessed through a combination of qualitative visual analysis and quantitative evaluation using metrics such as Kullback–Leibler Divergence (KL Divergence), Structural Similarity Index (SSIM), and Dice Coefficient. The proposed approach has demonstrated effectiveness in generating realistic and spatially coherent urban patterns, with promising potential for controllability. In addition to showcasing its strengths, we also highlight the limitations and outline future directions for advancing future work.
1. Introduction
Although urban areas are estimated to occupy only 3% of the Earth’s surface [1], the United Nations reports that more than 56% of the global population now lives in cities [2]. This figure is projected to rise to 67% by 2050 [3]. The design and development of the urban environment have a profound influence on the quality of life for this growing majority of the population, as well as on the environment, given that cities are responsible for the majority of global greenhouse emissions [1].
Given the magnitude of their impact, decision makers must consider a wide range of factors including resource optimization, reduction of energy consumption, improvement of public safety and anticipation of future needs. These decisions, along with the resulting systems, their interconnection and their interactions with the public and the environment, directly and collectively influence the sustainability, resilience and livability of cities as well as the global climate. Therefore having the right tools to support decision makers in this complex task is essential for creating livable and resilient urban spaces. To meet these goals, smart cities embrace innovation across key domains including smart governance, economy, mobility, environment, living, and people [4].
Innovation across these domains benefits significantly from having high-quality Urban Digital Twins (UDTs) which are essential for computational urban planning [5]. There already exist solutions that offer a comprehensive suite of tools for management, editing, navigating [6] analyzing, and exchanging two-dimensional (2D) and three-dimensional (3D) geospatial data [7], enabling immersive creation [8], visualization [9], and of virtual city models and across multiple formats [10] and levels [11]. However, manually changing and simulating scenarios by altering the foundational data of UDTs is both complex and time consuming. Geometric and semantic urban objects are typically high-dimensional, topologically interconnected structures. Modifying a single or a group of objects such as buildings, roads or blocks requires not only modeling the object itself but also accounting for the surrounding fabric. This complexity can lead to lengthy modelling processes, prolonged decision-making cycles and difficulty in efficiently involving other stakeholders and domain experts. Moreover, the interaction between urban elements and resulting change, whether positive or negative, can often be unforeseen by the user due to the inherent complexity of the urban systems. This highlights the need for automatic tools capable of simulating high-dimensional spatial data and patterns in near real-time.
Artificial intelligence has been a transformative force in the last decades that has the unique ability to process large datasets, handle multi-dimensional objectives and adapt to multi-modal input simultaneously. All while reducing reliance on domain experts by automatically deriving relevant features. This is particularly evident in the emerging class of systems known as Generative Artificial intelligence (GenAI), which are distinguished by their capabilities to generate novel data such as text, image, and videos. After the release of the ChatGPT (based on the Generative Pre-trained Transformer GPT-3.5) product in November 2022, the world witnessed a surge in the applications powered by GenAI [12]. This success extended beyond Natural Language Processing (NLP) and Large Language Models (LLMs), including technologies such as Generative Pre-trained Transformer (GPT). It also encompasses other domains, such as image generation, video synthesis, and multi-modal models [13]. This rapid success is largely driven by advances in deep learning architectures, such as Variational AutoEncoders (VAEs) [14], Generative Adversarial Networks (GANs) [15] as well as the availability of large-scale training datasets. These achievements are prominently accelerating in domains where there is an abundance of data available for training and evaluation [16].
Many cities maintain and publish publicly accessible datasets that offer a rich representation of many phenomena including demographic, administrative, geographic, topographic, infrastructure, environmental and ecological data. In addition, they often provide high-dimensional data such as aerial imagery, three-dimensional (3D) and temporal datasets [17]. This abundance of multi-modal data, combined with the rapid advancement in Generative AI presents a significant opportunity to develop powerful simulation tools that benefit not only urban planners but also a broad range of stakeholders including citizens and operators. Citizens for example, could receive tailored, accessible information about changes that directly impacts their daily lives and neighborhoods. This lowers the technical barrier to participation via GenAI interfaces. Use cases include, simulating changes in zoning or transportation plans, modeling noise levels or accessibility to point of interest, and visualizing neighborhood transformation in real time. Operators, such as municipal departments responsible for logistics and infrastructure can evaluate the feasibility proposals, detect potential bottlenecks and respond dynamically to “what-if?” scenarios. For urban planners, key objectives include modelling the longer-term effects of urban proposals, interactively comparing alternative futures, and making optimal data-driven decisions in collaborative environments [18].
These use cases imply that GenAI systems in this context must be capable of performing multi-dimensional simulations, integrating policy-aware reasoning over heterogeneous datasets, allowing controllable input manipulation, and producing explainable and interpretable output that can be communicated to stakeholders visually [18]. Several cities have already begun integrating GenAI into their technical infrastructure. For instance, Barcelona, Helsinki, Singapore, and Copenhagen have adapted GenAI models at various levels to serve both administrative and public end users [18]. GeoSynth [19] demonstrates the technical feasibility of generating highly realistic satellite images conditioned on spatial layouts and text prompts, highlighting the potential of Gen-AI-driven approaches in spatial simulation and urban visualisation.
Albeit the benefits and opportunities offered by generic generative AI solutions, several inherent limitations and challenges persist, particularly when employing general purpose models or those trained on global datasets. The models often carry substantial environmental and financial costs, and they struggle to reflect local urban identity, as the “one-size-fits-all” approach tends to struggle with edge-cases [20]. Furthermore, such models are notoriously difficult to control and steer toward specific outputs [21] and their decision-making processes remain largely opaque due to their black-box nature [20]. These limitations have led researchers to explore more specialized generative deep learning models that can produce realistic scenes and structures tailored to specific spatial settings. While this progress is essential and enhanced controllability within the context of urban planning, for instance through latent space manipulation [22] semantic inputs [23] or sketch based interfaces [24], these methods still fall short in allowing control via specific analytical precise inputs such as real object distributions. We argue that such statistically grounded conditioning would allow users to articulate their design intention with greater precision. To explore this potential, we propose a novel pipeline for controllable, spatially-aware city pattern synthesis using multi-modal conditioning. Our approach emphasizes the generation of realistic urban forms that respects the local context, we set our contribution apart using specific analytical conditioning over the building height and footprint area distributions. We chose Generative Adversarial Networks (GANs) [15], a subclass of deep learning architecture, and specifically their variant conditional Generative Adversarial Networks (cGAN) [25] as the main architecture for this research. These networks provide significant potential for conducting experiments and developing high quality prototypes rapidly. They achieve this while arguably maintaining relatively low computational costs and preserving the simplicity of model design compared to modern solutions such as diffusion models [26]. Diffusion models, albeit capable of producing more detailed and higher-fidelity outputs, demand significantly higher computational resources in that they utilize forward and backward noise diffusion in addition to multi-step refinements with iterative denoising steps, compared to GANs that require a single pass and minimal sampling complexity. In addition, GANs have demonstrated outstanding results in capturing comprehensive scene context and modeling the underlying data distribution [27]. Similarly, their extension Deep Convolutional GANs (DCGAN) can capture detailed topological relationships and higher abstract representation of complex scenes [28]. When trained, such networks have the ability to sample novel data points that align with the distribution of the original training datasets. Another key advantage lies in the use of artificial agents, namely a discriminator network to evaluate the loss function which arguably reduces human bias inherent in manually crafted custom loss functions with predefined rules. In addition, conditional Generative Adversarial Networks (cGAN) [25] enabled a pivotal functionality namely data driven conditioning, making them a promising approach to achieve controllability in this research.
In addition, to achieve the goal of generating urban patterns that closely align with the morphological and statistical characteristics of a desired target area or planning objective, the integration of Feature-wise Linear Modulation (FiLM) layers [29] equips the network the ability to dynamically translate and scale hidden features, thereby effectively leveraging the conditional input. FiLM is a proven technique for enabling effective conditioning. Additionally, the incorporation of multi-head self-attention mechanism [30], enables the network to selectively focus on the relevant features, capture intricate spatial and contextual relationships, and automatically detect dependencies. These capabilities are particularly valuable when conditioning on the surrounding urban environment. In order to set our contribution apart we give an overview of state-of-art solutions that utilizes deep learning in generating city patterns. From a high-level perspective, existing solutions can be categorized based on their capabilities to handle different building block geometries. Some pipelines generate axis-aligned urban patterns, such as BlockPlanner [31] and LayouTransformer [22], while others support arbitrary block shapes, including models like GlobalMapper [23], CityDreamer [32], and InfiniCity [24].
BlockPlanner is capable of generating valid land lots that divide building blocks with different usage types [31]. It utilizes a Graph Neural Network (GNN) with a custom loss function that enforces the adjacency between lots, alignments to block boundaries, and valid land use category distributions. To generate building footprints, BlockPlanner applies image-to-image translation method, specifically pix2pix pipeline [33], which maps building block masks to footprints masks. This method represents building blocks using a canonical closed ring format and assumes a rectangular shape for the blocks. Similarly, LayouTransformer [22] formulates polygon pattern generation as an unsupervised sequence modeling task. The approach specifically maps the two-dimensional (2D) layouts to one-dimensional (1-D) sequences and leverages well-known transformer architecture [34] to generate novel urban patterns. These approaches are successful in producing reliable patterns in a controlled environment or even in realistic environments such as in Manhattan in New York City [31] however, exhibit limitations when applied on more complex or irregular urban morphologies. For instance, irregular, radial or non-grid street patterns commonly found in many European cities present significant challenges. The constraints applied on the block geometry simplify learning and inferences; it also inherently limits the model’s capability to generate scenes that fill irregular blocks. Additionally both models offer only limited user controllability over the generated outputs [23].
GlobalMapper [23] addresses the aforementioned limitations by generating building footprints for complete urban scenes, conditioned on either street networks or using footprints samples that serve as spatial prior. The model generates the footprints by employing a graph attention network within a Variational AutoEncoder (VAE) framework [14] allowing it to produce structurally coherent and visually realistic buildings. GlobalMapper has the ability to use a block prior which provides a degree of controllability. However, this generation process remains constrained to a set of primitives, namely Rectangular (R), L, U, and X-shape building footprints. This limitation restricts the model’s flexibility when applied to cities with more diverse architectural styles. This is evident in the model’s underlying design assumptions, such as organizing buildings in procedurally generated rows, and in its evaluation protocol, which is based exclusively on North American urban datasets. Consequently, the model’s generalizability to cities with irregular, organic, or radial urban morphologies remains limited [24].
InfiniCity [35] focuses on generating infinite 3D urban scenes by leveraging both 2D and 3D data. The pipeline begins with the generation of realistic semantic maps conditioned on satellite imagery, using a model architecture that is inspired by InfinityGAN [36]. The pipeline converts the resulting 2D map to a 3D representation through a 3D Octree-based voxel completion process, followed by voxel-based neural rendering, which enables the synthesis of multiple realistic viewpoints of the generated city. In a similar vein, CityDreamer produces unbounded city layouts by extending semantic maps and height fields. The pipeline is divided into two stages: the first generates buildings, while the second focuses on background elements such as roads, green spaces and water bodies. A composer module combines then merges these outputs into a coherent 3D city image.
Although both approaches demonstrate the ability to generate an expandable 3D urban environment, the exhibit is limited in controllability and diversity and may produce artifacts at the scenes boundaries [24]. CityGen [24] attempts to address these limitations by enabling the generation of infinite, diverse and controllable city layouts. It allows users to influence the layout generation through using simple sketches based inputs, enhancing interactivity. CityGen introduces an expansion module designed to mitigate repetitive patterns and promote structural diversity in the generated urban layouts.
To contextualize our contribution, Table 1 presents a comparative overview of state-of-the-art frameworks, detailing their functionalities along the key contributions introduced by our method. The table is designed to emphasize the additional capabilities that differentiate our approach, without implying superiority in output quality.

Table 1.
Functionality evaluation and a comparison with state of the art methods.
2. Materials and Methods
To perform the experiment, we designed and implemented a multi-modal generative framework capable of synthesizing novel urban patterns within predefined building blocks. For this end we processed publicly available data and created customized dataset. The dataset is used to train and evaluate the deep learning model performance. This section outlines the framework architecture, the exploratory data analysis conducted on the Berlin dataset, model architecture, data preprocessing, training data-samples creation and model specification and training process. Figure 1 presents multiple examples generated by our model, demonstrating the framework’s ability to produce plausible, contextually coherent urban environments that seamlessly integrate with real-world surroundings. We demonstrate that our model is capable of generating building layouts that are not only contextually coherent but also conditioned using statistical profiles of the input. We provide visual evidence of plausibility, showcasing the model’s ability to synthesize credible urban patterns under real-world constraints using a visual inspection of generated samples of different urban environments that is supported by an analytical evaluation with well-known metrics.
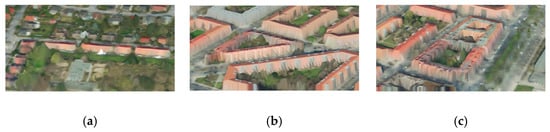
Figure 1.
A 3D urban environment scene is generated by combining normalized two-and-a-half-dimensional (2.5D) Digital Surface Model (nDSM) data with Red-Green-Blue (RGB) imagery, resulting in extruded structures rendered with realistic color mapping extruded to their respective heights. (a) A rural setting with sparse structures; (b) A dense urban area with compact building patterns; (c) A street-aligned generated building block. Each scene includes additional 3D elements such as colored vegetation and buildings.
2.1. Framework Architecture
The objective of the experiment is to populate land-use blocks with realistic 3D urban patterns that are both contextually coherent with the surrounding environment and user-controllable. To achieve this goal, the framework is designed to allow the model’s output to be manipulated through both user-defined inputs and contextual information. The framework consists of the following components:
- Control Module;
- Context Imagery Module;
- Custom Neural Network;
- Output Module.
Figure 2 illustrates the complete architecture and its constituent components. The control module allows users to specify input, including:
- frequency distributions of building heights and footprint areas;
- district classification;
- land-use categorical classes.
The frequency distributions are expected to reflect object counts falling within the geographical extent of the network’s 2D input imagery and the targeted land-use block. Additionally, the control module requires rasterized representation of land-use classes, encoded as categorical numerical values aligned to land-use blocks locations.
To encode the conditioning information in compact and expressive form, the input control values are embedded into dense representations. Namely, linear embeddings are used to map frequency distributions [29], while categorical embeddings are applied on discrete values such as land-use classes and district classification [37]. This embedding approach aimed to enhance the expressiveness and interaction between the control signals and the network during training and inference.
The context imagery module processes the surrounding environmental data and plays a key role in providing spatial awareness to the network model. It ingests multi-channel 2D arrays consisting of several textural layers including:
- orthophotos with Red, Green, Blue and Near-Infrared (RGBI) channels
- normalized Digital Surface Models (nDSM)
- a shaded relief map that simulates sunlight on terrain and rooftops to highlight elevation and landforms (hillshade)
- rasterized building footprints

Figure 2.
The figures demonstrate our generative framework modules namely, control, context imagery, custom neural network, predictions, and output. The framework has two types of input multi-layer and semantic inputs. Depicted in blue, brown, dark grey and light-grey are blocks that relate to conditioning, FiLM layers [29], U-Net architecture [38], and self-attention blocks [30]. The prediction of the model can be combined in multiple ways. The two-dimensional building footprints, normalized two-and-a-half-dimensional (2.5D) Digital Surface Model (nDSM), and hillshade layers are combined to produce an extrusion of the built-up areas with a hillshade rendering. The 2.5D nDSM and RGB colors are combined to produce an extruded and RGB colored urban environment scene.
To simulate a planning scenario, the footprint of the target land-use block is obfuscated for all imagery layers. Furthermore, to prevent unintentional model bias by topologically connected features such as cast shadows or adjacent infrastructure, the module obfuscates the location of road network footprint systematically from all input layers that are adjacent to the target block. Obfuscation is achieved by setting the relevant pixel values to zero.
The neural network module is based on a U-Net-inspired encoder-decoder architecture [38], widely known for its performance in practical applications that requires dense predictions. A Feature-wise Linear Modulation (FiLM) layer [29] gives the network the ability to dynamically translate and scale hidden features thus effectively utilizing the conditional input. Additionally, a multi-head self-attention mechanism [30] enables the network to dynamically focus on the relevant features. The final output layer produces four distinct outputs RGBI, nDSM, hillshade and rasterized binary building footprints masks.
The output module composes 3D urban scenes by integrating the network module predictions. Building footprints are extracted, and corresponding nDSM and hillshade values are clipped to these areas. The building height is approximated by computing the average nDSM pixel intensity over each footprint. To enhance realism, the building roofs are textured with the values of the predicted hillshade pixel intensity to give the illusion of a 3D roof form. The full 3D scene is rendered by extruding to the predicted nDSM applying the RGB orthophoto predictions. This results in a rapid and realistic visualization of newly generated urban patterns that complete the targeted land-use block.
2.2. Data Preprocessing
To evaluate the proposed framework capability to integrate 2D and 3D spatial data to model urban scenes, we utilize publicly available data provided by the city of Berlin through its official Geoportal [17]. These datasets include comprehensive layers such as land use zones (blocks), building footprints, high resolution orthophotos, and administrative boundaries. For 3D representation, we derive a normalized Digital Surface Model (nDSM) and hillshade layer to represent roof morphology and a hillshade layer to capture roof morphology and elevation texture. The multi-layer image input True color orthophotos including Red, Green, Blue, and Near-Infrared bands (RGBI) to capture textural features such as vegetation, surfaces, and materials and sourced from [39]. Digital Surface Model (DSM) to represent urban surface elevations obtained from [40] and Digital Elevation Model (DEM) to provide bare-earth elevation data and support height normalization as provided in [41]. For reproducibility, Table 2 summarizes a statistical metadata for these layers; A visual representation of the tile distribution and geographical extent can be found in graphical representation published by the Senate Department for Urban Development, Building and Housing Berlin [42].
Table 2.
Multi-Layer Image Datasets Statistical Metadata.
Although Berlin exhibits relatively low terrain variation, it is crucial to account for topographical influence when working with deep learning models. These models are sensitive to raw input distributions; without normalization, absolute height values in DSMs can lead to misinterpretation of building height due to topographic drift. To mitigate this, we normalize the DSM using the corresponding DEM. This two-and-half-dimensional (2.5D) nDSM is used as the basis for the 3D components throughout the experiment. This process enables approximation of 3D building heights information, as no direct building height data is available in the raw dataset. Figure 3 shows the impact of this process on the DSM layer and its importance even in topographically subtle environments like Berlin. To visually represent the roof morphology in a clear way, a hillshading computation is applied on the normalized DSM with a light source azimuth of 315° and an altitude of 45° degrees, following standard cartographic practice [43].
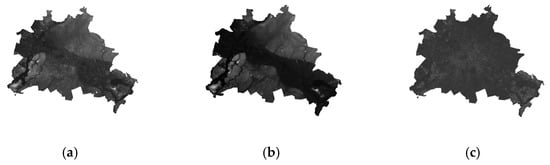
Figure 3.
Illustration of the normalization process for the Digital Surface Model (DSM). (a) shows the original DSM representing the combined elevation of terrain and built structures. (b) depicts the Digital Elevation Model (DEM), capturing only the ground surface elevation. (c) presents the normalized DSM resulting from subtracting the DEM from the DSM. Brighter pixels correspond to higher elevations, whereas darker pixels correspond to lower elevations.
For semantic enrichment, we incorporate multiple administrative and cadastral layers provided within the standard of the Authoritative Real Estate Cadastre Information System (ALKIS) sourced from reference [44], land use zones with the data obtained from [45] and Berlin district representations as provided in [46]. These layers provide a rich contextual foundation. The land use zones cover the complete area of Berlin city with 24 unique classes that describe the semantic usage of the building block for example the class of Industrial and Commercial Area, Road Traffic and Residential Building Area. Additionally, the district dataset provides 12 administrative boundaries of governmental districts of Berlin, each with distinct morphological and architectural traits. For example, the district of “Mitte”, located in the center of Berlin, is characterized by densely built structures with significant historical architecture. In contrast, the district of “Spandau” in the west of the city presents a diverse urban fabric comprising both single standing homes and high rise buildings. Table 3 provides metadata and schema information for the administrative and semantic datasets utilized in this work.
Table 3.
Metadata and schema information for the administrative and semantic datasets.
2.3. Exploratory Data Analysis
A data exploration analysis of the building footprints dataset reveals that both height and area features exhibit long-tailed distributions. Choosing meaningful bins and data range automatically is not a trivial task. For example, a naive approach such as equal-width binning yields highly unbalanced class frequencies. Resulting in shifts and skews of the area distribution towards predominantly lower-value bins that have a large number of very small buildings. To mitigate this, empirical binning was manually applied to capture distribution frequency changes. For building areas the selected bins were: 30, 40, 50, 60, 60, 70, 90, 120, 150, 400, 500, ∞ square meters. For building heights the selected bins were: 5, 10, 15, 20, 25, 30, 35, 40, 45, 50, ∞ meters. During analysis, it was observed that a disproportionately high number of buildings fell into the less than 30 m2 area bin. A manual inspection showed that samples in this range belong predominantly to small auxiliary structures or building parts. These small structures are not representative of the primary urban morphology. To remedy this issue buildings within this range (i.e., with footprint area less than 30 m2) are excluded and the area bins start at 30 m2 (see Figure 4). However, to preserve the fine-grained morphological details, all structures, buildings parts and buildings, including small structures remain intact during the image generation process for both the input and targets. This exclusion is only performed during the windows sampling process, with the goal of achieving a balanced sample count for each defined bin during the training and evaluation processes.
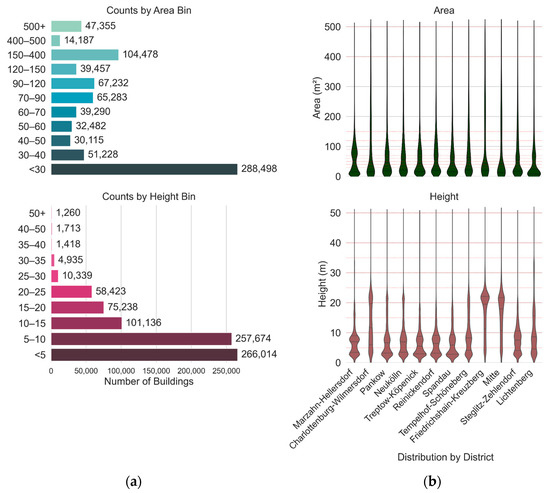
Figure 4.
This figure illustrates the distributional characteristics of building footprints. (a) shows count plots using the empirically chosen bin ranges, capturing the distribution of height and area across the dataset. (b) displays distribution plots of the same features, grouped by administrative district. The upper row (blue) represents area, and the lower row shows height. The red horizontal lines represent the starting ranges and indicate where binning occurs, corresponding to regions where the distribution varies.
Figure 4 shows that the area distribution is highly similar across districts, with the exception of the “Marzahn-Hellersdorf” district. The area distribution plot of this district shows a noticeable increase in frequency between 50 and 100 m2. For building heights, while most districts display consistent patterns, several deviations are observed. The districts of “Friedrichshain-Kreuzberg” and “Mitte” exhibit spikes in building counts within the 20–25 m range, possibly reflecting dense residential architecture. Charlottenburg-Wilmersdorf demonstrates an elongated distribution in the 0–25 m range, indicating a mix of low- to mid-rise structures.
2.4. Training Data Samples Creation
To train and evaluate the proposed generative model, the dataset was divided into training, validation, and testing subsets. The validation dataset consists of samples from the districts of “Pankow” or “Spandau”. The testing dataset is manually curated to include a variety of urban forms such dense and sparse urban patterns. The testing subset is strictly excluded from any training or early stopping loss computing to ensure unbiased model evaluation. Figure 5 shows the geographical extent of the test area and these regions are used to evaluate the model’s generalization to previously unseen urban contexts.
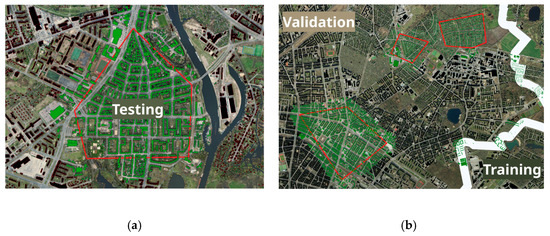
Figure 5.
Demonstrates the test dataset in both districts and data-overlap prevention strategy. The areas of interest highlighted by a red boundary outline the test areas (a) Test area in the district of “Spandau”. (b) Test area in the district of “Pankow”. Both figures depict buffers around the test area highlighted in green colored buildings footprints. These buildings are excluded from the validation dataset to prevent any data overlapping between the two datasets. (b) additionally shows a white strip that separates the training and validation areas. Buildings that intersect with this strip are also excluded from the validation dataset.
Each training dataset consists of input frequency distributions of areas and height, district unique numerical identifiers (district id) and input imagery layers including RGBI, hillshade, nDSM, and rasterized building footprints. Unlike traditional approaches that tile spatial regions, this framework adopts a per-building sampling strategy. Each data sample is spatially centered around the centroid of a building footprint. The image data is clipped at a fixed geographical extent on the x and y-axis. This sampling strategy also enables data augmentation, as each building effectively generates a slightly shifted version of its surrounding scene. This results in a diverse dataset that captures a wide range of urban morphologies. The data subsets extent and geographical coverage is shown in Figure 6.
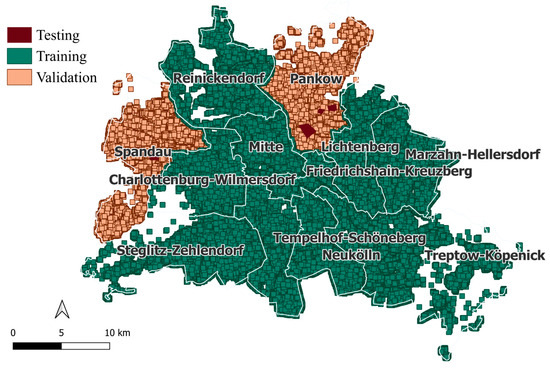
Figure 6.
Spatial extent of training and validation samples across Berlin. Each rectangle represents an individual data sample. Blue rectangles denote training samples. Yellow rectangles indicate validation samples.
To simplify the data processing pipeline, each training sample is defined with a fixed spatial extent of 256 m by 256 m and a spatial resolution of 1 m per pixel. This configuration ensures that the image arrays have 2D dimensions that are power of two. This facilitates efficient processing by the neural network and eliminates the need for image resizing and resampling during the downsampling stages.
To generate meaningful conditioning inputs, each sample is associated with a target land use block that intersects its spatial extent. For each block, the building footprint area and height values are binned to the empirically defined intervals described in Section 2.3. These distributions are then used as multi-modal conditioning inputs for the model. To simulate the generative task, the pixels corresponding to the targeted land use block and the street network are masked in all input layers by assigning a value of zero. The ground truth outputs for training are the original, unmasked image arrays corresponding to these regions. An example data sample is shown in Figure 7.
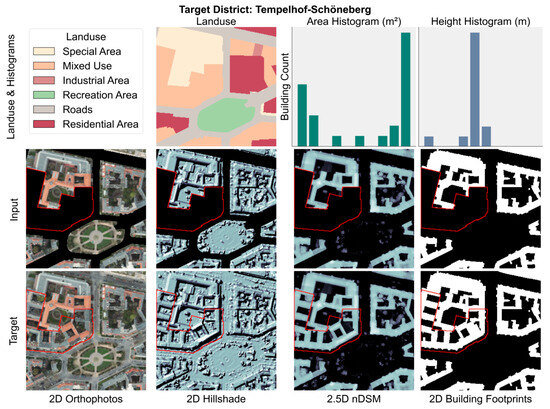
Figure 7.
Example training sample from the district of “Tempelhof-Schöneberg”. The top row illustrates land use, area, and height frequency histograms, presented without numerical axes for illustrative purposes. The second row represents the input image layers RGBI, nDSM, hillshade, and building footprints with masked target regions highlighted in red. The land use raster is encoded using categorical numerical values, displayed with distinct colors.
Different urban scenes have drastically different area and height distributions. For example, Figure 7 taken from the district of Tempelhof-Schöneberg which depicts a dense urban scene, characterized by large, prominent buildings with a uniform height profile, reflecting formal and consistent architectural planning. In contrast, Figure 8 taken from the district of Marzahn-Hellersdorf shows greater diversity of building sizes, primarily in the small to midsize range with consistently low building heights, indicative of low-density development. These contrasting patterns across samples help the model train on diverse urban configurations with the aim that it generalizes across morphological styles.
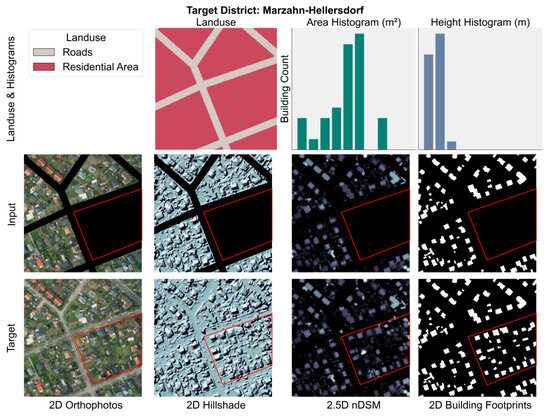
Figure 8.
Example training sample from the district of “Marzahn-Hellersdorf”. The top row illustrates land use, area, and height frequency histograms, presented without numerical axes for illustrative purposes. The second row represents the input image layers RGBI, nDSM, hillshade, and building footprints with masked target regions highlighted in red. The land use raster is encoded using categorical numerical values, displayed with distinct colors.
2.5. Model Specification and Training Process
To ensure reproducibility, the complete model architecture and parameters are detailed in Table 4 and Figure 9. The proposed model follows an encoder-decoder architecture inspired by U-Net [38], with enhancements designed to incorporate conditional embeddings and improve feature learning. The generator receives an 8-channel raster input, which includes RGBI, hillshade, DSM, and related contextual layers.
Table 4.
Model architecture and parameters.
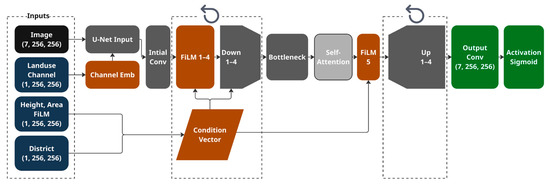
Figure 9.
Detailed model architecture. Depicted in blue, brown, dark grey and light-grey are blocks that relate to conditioning, FiLM layers [29], U-Net architecture [38], and self-attention blocks [30]. Note the repeated blocks that allows for down and upsampling of the input and outputs. The conditional vector is passed to the film layer four times to allow for multi-scale conditioning. For exact implementation details refer to Table 4.
The Down block reduces the spatial resolution of the feature map so that abstract features are captured, the implementation of this block is represented as a max pooling operation followed by a double convolution block each followed by a normalization with a Rectified Linear Unit (ReLU) activation. The Up block up samples the feature map by a factor of two with a bilinear interpolation with the corresponding features from the encoder branch followed by a double convolution and ReLU activation which is a standard architecture for down and up sampling of features. The skip connections between the encoder and decoder branches allow for preserving information and enable precise localization.
To numerically scale the outputs to values between zero and one the network output head applies a Sigmoid activation [47] on the last convolutional layers and outputs images with the dimensions of 256 by 256 with seven channels that correspond to RGBI, hillshade, Normalized DSM and Binary building footprints respectively, producing output image arrays with dimensions 256 × 256 × 7.
FiLM layers [29] are applied after each Down block, conditioning on concatenated district and film embeddings. The FiLM layer is also incorporated at the bottleneck (latent) layer to capture long-range spatial dependencies within the encoded feature maps. This enables the model to dynamically focus on salient regions, which is particularly important for modeling diverse urban morphologies [30]. Embedding dimensions were selected empirically, favoring even-valued configurations close to the vocabulary size to ensure binary-compatible scaling. This yielded 16 and 8 for vocabularies of size 26 and 13, that correspond to thematic channel dimension and distinct identity count respectively. For the linear embedding representing area and height, we selected a dimension of 8 to effectively encode the ten bins used in each category. Figure 9 represents a visual representation of the model’s architecture with the corresponding blocks.
The loss function is a combination between mean absolute error (L1-loss), Focal loss [48] and adversarial loss [25]. The adversarial loss is calculated using a standard conditional Generative Adversarial Network (cGAN) setup [25]. Both generator and discriminator are optimized using the Adaptive Moment Estimation optimizer (Adam) [49] with learning rates of 1 × 10⁻⁴ and 1 × 10⁻⁵, respectively, and a batch size of 32. The discriminator is a PatchGAN-style Convolutional Neural Network (CNN) and used to evaluate the realism of generated samples. This CNN outputs a matrix of patch-level real or fake predictions, enabling fine-grained adversarial supervision. FiLM conditioning is also applied to the discriminator using the same embeddings [33].
The loss function is expressed as follows:
where:
is the mean absolute error (L1-loss)
is the focal loss for the building classification channel [48]
is the adversarial loss.
is the classification weight.
is the adversarial-loss weight.
is the L1 loss weight.
The L1 loss encourages the model to produce outputs that closely match the ground truth at the pixel level. This is particularly important for the nDSM and hillshade channels, where pixel-wise accuracy is critical for preserving spatial detail and increasing overall fidelity. By assigning higher weight to uncertain and minority class predictions, the focal loss enables the model to better focus on challenging or underrepresented samples [48]. The adversarial loss encourages the model to produce realistically looking images that improves the perceptual sharpness and coherence of the predictions. The combination between these losses are used in the training process and the values of , , and are set to one.
The model is trained for ten epochs, and evaluated on the validation set consisting of buildings from the “Pankow” and “Spandau” districts. Table 5 gives a detailed view on the loss function progress and metric used during the training process. We used the following metrics in addition to the network loss we track the training progress: structural similarity index measure (SSIM) [50], Kullback–Leibler Divergence (KL Divergence) [51], Dice Coefficient [52] to evaluate the quality of the predicted RGBI channels, nDSM, hillshade, Rasterized building footprints respectively. The values of these metrics are measured by comparing the predictions to the ground truth values on the validation dataset.
Table 5.
Training specifications.
Table 6 presents a comprehensive overview of the model’s performance throughout the training process, demonstrating an overall stability and consistency. Notably the model achieved high scores across RGBI channels early in training, with the highest value of Structural Similarity Index Measure (SSIM) achieved at the epoch. The lowest KL Divergence value measured on the normalized Digital Surface Model (nDSM) was recorded at the second epoch. The maximum value of the Dice Coefficient was achieved at the third epoch. While the optimal total loss and adversarial loss values were achieved at the fifth epoch. The peak value for SSIM on hillshade channel in addition to the lowest L1-loss were achieved at the eights epoch whereas the best focal loss was achieved on the ninth epoch. Routine visual inspection confirmed these numerical findings and we observed increasing improvement in the quality and consistent results indicating training stability. Based on the numeric evaluation and visual inspection, we terminated the training at the tenths epoch and selected the model number 8 to generate the results shown in the rest of this experiment.
Table 6.
The average loss and metric values measured on the validation dataset.
3. Results
We conduct a qualitative visual evaluation across a range of urban scenes, including densely built environments, areas with varied block geometries, and low-density regions characterized by dispersed single-family homes. The evaluation primarily utilizes the validation dataset, which includes densely populated areas, heterogeneous architectural typologies and varying building densities. In addition, we present results on a separate set of unseen test samples to evaluate the model’s ability to generalize beyond the training distribution.
To further analyze model behavior and limitations, we identify and highlight failure cases that expose specific shortcomings in prediction accuracy. Furthermore, we examine the influence of building height and area distributions by performing distribution transfer experiments, where statistical distributions from sparsely built scenes are applied to dense urban samples, and vice versa. This procedure allows us to observe the effects of structural statistics on the model’s predictive capabilities. In addition, we perform a quantitative evaluation on the test area to evaluate both the model generalizability and controllability in an objective way.
3.1. Results on Training
As illustrated in Figure 10, the model demonstrates high fidelity in reconstructing scenes from the training dataset. The generated outputs closely resemble the ground truth across multiple channels, suggesting that the model effectively captures the underlying spatial, structural, and semantic features inherent to the training samples.
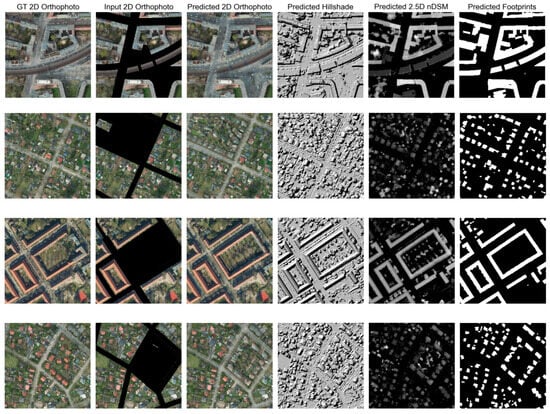
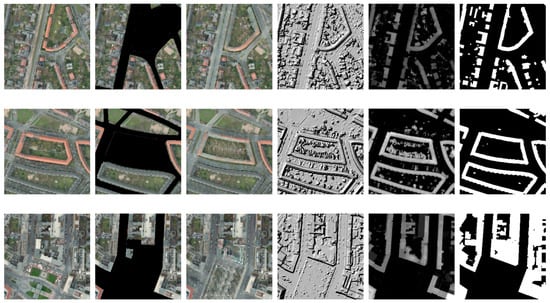
Figure 10.
Predictions on the training dataset. The first column (GT RGB) shows the 2D ground truth orthophoto. The second column (Input RGB) displays the corresponding conditional 2D orthophoto used as input to the network. The remaining columns depict the model’s predicted outputs, including 2D RGB, hillshade, 2.5D nDSM, and rasterized 2D building footprint layers. For clarity, only a subset of the input channels is shown, highlighting a variety of spatial and morphological patterns across different urban scenes.
Notably, the model exhibits strong performance across diverse urban typologies. It is particularly effective at generating realistic urban configurations, maintaining coherent architectural styles, consistent building alignment, and well-structured block layouts. The model generalizes well to both compact city centers and sparsely developed peripheral areas, successfully reproducing distinct patterns of urban morphology despite variations in density, geometry, and scene complexity.
3.2. Results on Validation Dataset
The model also demonstrated consistent performance on the validation dataset. Figure 11 showcases selected prediction results obtained from the validation dataset, highlighting the model’s capacity to generate spatial patterns that extend beyond the confines of the training distribution. These examples illustrate the model’s ability to synthesize novel urban configurations that faithfully mimic the morphological characteristics of the surrounding built environment, despite not having been explicitly exposed to such regions during training.
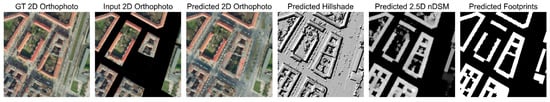
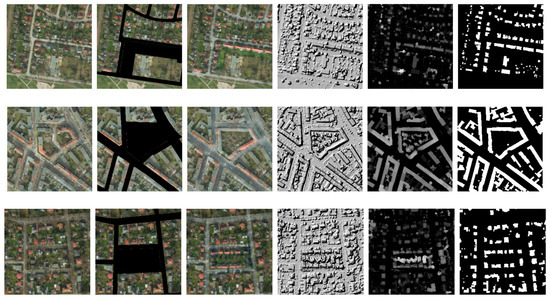
Figure 11.
Predictions on the validation dataset. The first column (GT RGB) shows the 2D ground truth orthophoto. The second column (Input RGB) displays the corresponding conditional 2D orthophoto used as input to the network. The remaining columns depict the model’s predicted outputs, including 2D RGB, hillshade, 2.5D nDSM, and rasterized 2D building footprint layers. For clarity, only a subset of the input channels is shown, highlighting a variety of spatial and morphological patterns across different urban scenes.
The generated patterns exhibit consistency in architectural layout, road network integration, and block-level organization, suggesting that the model effectively extrapolates learned structures into previously unseen spatial contexts.
D espite overall success in generating structurally coherent urban layouts, certain limitations persist. As illustrated in Figure 12, the predicted patterns generally align well with the spatial boundaries of individual blocks. However, challenges emerge when the input data contains heterogeneous urban configurations specifically, a mixture of single-family structures with high-density building blocks within the same spatial extent. In such scenarios, the model tends to interpolate between the distinct typologies, resulting in hybrid predictions that reflect elements of both sparse and dense urban forms within a single block, leading to a loss of typological clarity.
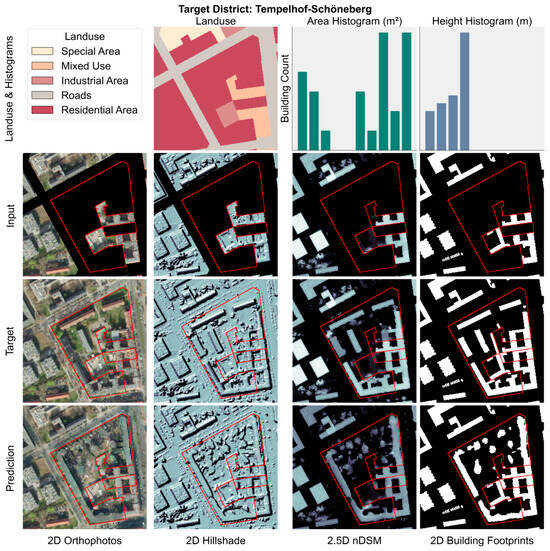
Figure 12.
Predictions on heterogeneous urban typologies. Example validate sample with target distinct Tempelhof-Schöneberg showing prediction with artifacts. The top row illustrates land use, area, and height frequency histograms, presented without numerical axes for illustrative purposes. The second row represents the input image layers RGBI, nDSM, hillshade, and building footprints with masked target regions highlighted in red with the corresponding predictions for each layer displayed in the fourth row. The land use raster is encoded using categorical numerical values, displayed with distinct colors.
3.3. Results on Test Dataset
The model demonstrates consistent performance on the unseen test dataset. Figure 13 illustrates a selection of prediction outcomes derived from the test dataset, which was fully excluded from both model training and early stopping loss evaluation. This separation ensures a rigorous assessment of the model’s generalization capability.
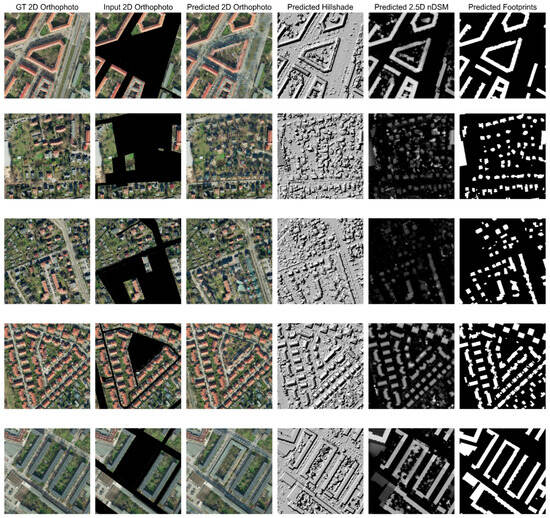
Figure 13.
Predictions on the test dataset. The first column (GT RGB) shows the 2D ground truth orthophoto. The second column (Input RGB) displays the corresponding conditional 2D orthophoto used as input to the network. The remaining columns depict the model’s predicted outputs, including 2D RGB, hillshade, 2.5D nDSM, and rasterized 2D building footprint layers. For clarity, only a subset of the input channels is shown, highlighting a variety of spatial and morphological patterns across different urban scenes.
Across a diverse range of test samples, the model produces spatial outputs with strong structural fidelity and coherence. To better examine the model’s robustness, the test dataset was carefully curated to include regions with distinct urban morphologies, such as atypical block shapes and uncommon spatial arrangements not encountered during training.
Figure 13 illustrates examples where the model accurately generates spatial layouts that align closely with the prescribed block geometries and surrounding urban morphology. However, further inspection such as shown in Figure 14 reveals cases where the model’s predictions adhere strictly to the formal land-use block boundaries, while the actual built morphology deviates. In these instances, the real-world construction does not fully conform to the planned block edges, suggesting a discrepancy between designed and realized urban form. The model, having learned from patterns where planning and construction align, continues to follow the block outlines in its predictions, highlighting a potential limitation in adaptability.
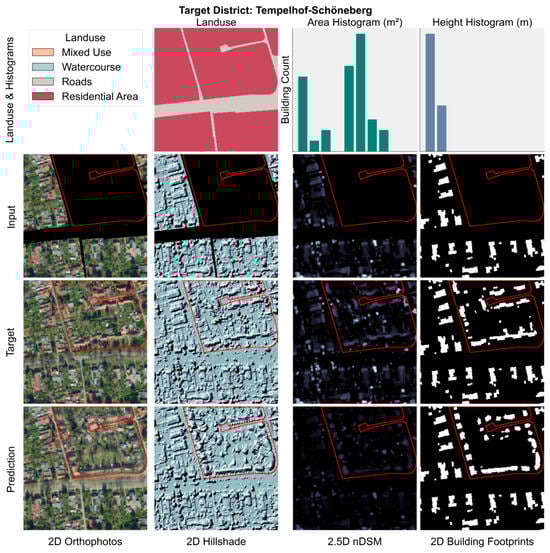
Figure 14.
Block following predictions. Example test sample with target distinct “Lichtenberg”. The top row illustrates land use, area, and height frequency histograms, presented without numerical axes for illustrative purposes. The second row represents the input image layers RGBI, nDSM, hillshade, and building footprints with masked target regions highlighted in red with the corresponding predictions for each layer displayed in the fourth row. The land use raster is encoded using categorical numerical values, displayed with distinct colors.
In another test case shown in Figure 15, the model-generated building structure contains noticeable artifacts characterized by spatial noise and clear erroneous structure. Despite the regularity of the input block geometry, the prediction fails to produce a coherent or plausible structural layout in this instance. The underlying cause of these artifacts remains uncertain. One potential contributing factor could be the atypical geometry of the block, which exhibits a narrow footprint and a relatively trilinear edge configuration.
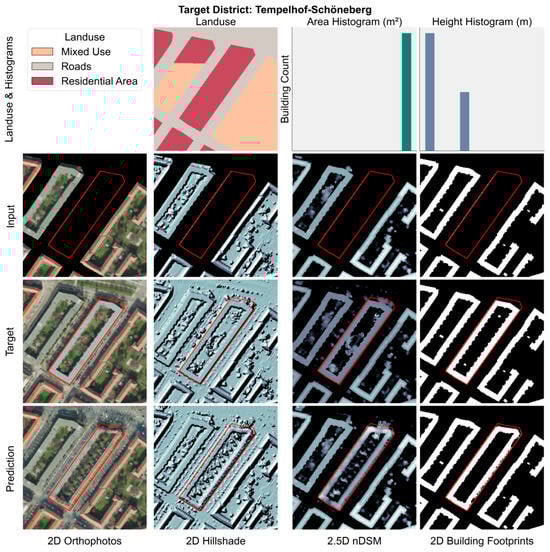
Figure 15.
Artifact on the predicted orthophoto. Example test sample with target distinct Lichtenberg. The top row illustrates land use, area, and height frequency histograms, presented without numerical axes for illustrative purposes. The second row represents the input image layers RGBI, nDSM, hillshade, and building footprints with masked target regions highlighted in red with the corresponding predictions for each layer displayed in the fourth row. The land use raster is encoded using categorical numerical values, displayed with distinct colors.
A further example is shown in Figure 16, where the predicted urban structure represents a closed block populated with isolated buildings, none of which maintain direct access to road networks or adjacent public streets. This layout is considered implausible from an urban design standpoint, as it violates basic planning principles of accessibility, connectivity, and circulation. The emergence of such unrealistic configurations suggests that while the model excels in reproducing known patterns, it may struggle when faced with blocks that occupy large propositions of the input spatial context.
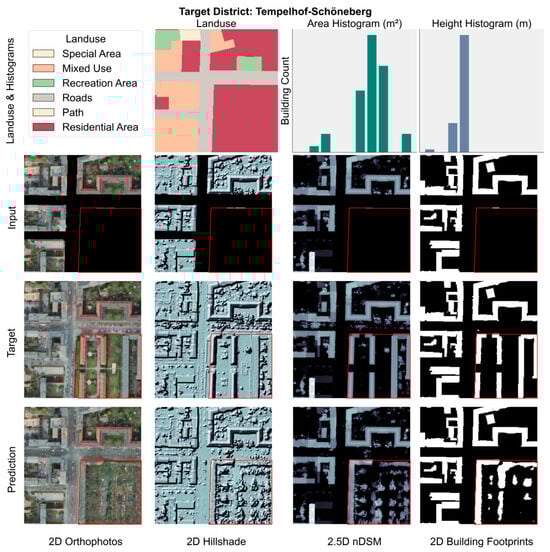
Figure 16.
Single standing homes pattern within a closed block. Example test sample with target distinct Tempelhof-Schöneberg. The top row illustrates land use, area, and height frequency histograms, presented without numerical axes for illustrative purposes. The second row represents the input image layers RGBI, nDSM, hillshade, and building footprints with masked target regions highlighted in red with the corresponding predictions for each layer displayed in the fourth row. The land use raster is encoded using categorical numerical values, displayed with distinct colors.
3.4. Controllability
To evaluate the model’s responsiveness to user-guided control inputs, a targeted experiment was conducted involving frequency distribution transfer. This procedure assesses whether the model can adapt its predictions in response to changes in the statistical characteristics of building height and area, key elements of urban form. The results are assessed through visual inspection of the predicted images and quantitative analysis using KL Divergence metric that compare the area and height distributions of the samples of interest.
In the first phase of the experiment (phase I), a baseline sample was predicted using its original ground truth height and area frequency distributions in a sample (A). As shown in Figure 17, the output reflects the local morphological context, generating sparse, low-rise structures that align closely with the surrounding urban fabric predominantly characterized by single-family homes. The predicted buildings also respect the outer boundary of the designated land-use layout, indicating spatial coherence. For clarity the prediction with the corresponding conditional probability can be expressed in mathematical terms as follows:
where:
- = the whole image;
- = the specific block within sample A;
- = image A without block x (context);
- = distribution of areas in block ;
- = distribution of heights in block ;
- Y = prediction.

Figure 17.
Area and height frequency distribution transfer across experimental phases I and II. Columns one and two illustrate the area and height distributions, respectively, for all samples. The third column visualizes the 2.5D height maps, highlighting the blocks of interest (x and y) in black and white, with a height scale corresponding to the height values within the block. The remaining image contexts () and () is displayed in filled grey, providing spatial reference.
In the second phase (phase II), a contrasting sample (B) was selected, one that exhibited markedly different urban characteristics featuring dense construction, homogenous building height, and continuous block structures. The frequency distribution of building height and area from this target sample was extracted and introduced into the original (baseline) sample, effectively replacing its local morphological statistics. A new prediction was then generated using this modified input, with all other conditions held constant. For clarity the prediction with the corresponding conditional probability can be expressed in mathematical terms as follows:
where:
- = the specific block within sample ;
- = distribution of areas in block ;
- = distribution of heights in block ;
- Y = prediction.
The results reveal a clear and interpretable shift in the model’s output. The generated scene now exhibits a highly dense and continuous urban block, markedly different from the baseline. This transformation suggests that the model effectively incorporates the transferred frequency distribution, responding to the introduced statistical priors by altering both the density and configuration of the predicted built form. Specifically, the resulting morphology reflects larger building footprints, uniform building heights, and reduced open space, all of which align with the characteristics of the dense reference sample. This is further supported by the quantitative analysis presented in Table 7. Step 1 demonstrates a high similarity between height distributions that belong to sample (A) and and the prediction conditioned on , resulting in a KL Divergence value of 0.076 and a moderate similarity between the corresponding area distributions, with a value of 0.833. Similarly, step 2 shows the predictions conditioned on exhibit a high dissimilarity in height distribution compared to sample (B) with a KL Divergence value of 2.302, and similarity between area distributions, with a value of 0.294. Step 3 shows when predictions conditioned on y were compared to (B), the KL Divergence values were 0.120 for the area distribution and 0.031 for the height distribution. This indicates that the prediction closely aligns with the distribution found in block y, showing high similarity. Step 4 demonstrates that when the distributions of predictions were conditioned on y compared to that of (A), the KL Divergence values of 1.276 for the area distribution and 0.119 for the height distribution remained moderately for the area and low for the height. This reflects that the model’s solution is also relatively close to the distribution of A, which is consistent with observations from the visual inspection.
Table 7.
First Experiment, Height and Area Distributions Comparison.
As a complementary test of distribution control, an inverse experiment was conducted by applying the frequency distributions of building height and area from a low-rise, sparse urban scene to a densely built and morphologically homogeneous target sample. The original prediction for the dense sample conformed well to its surroundings, generating continuous urban blocks consistent with the prevailing architectural typology. After the distribution transfer, however, the resulting prediction did not exhibit a complete transformation as shown in Figure 18. Notably, only the row of buildings adjacent to the image edge adapted to the transferred parameters, producing smaller, single-standing structures with repeated separation. In contrast, the row facing similarly dense built environments retained its original morphology. Which is continuous, closely packed buildings aligned with the surrounding fabric.
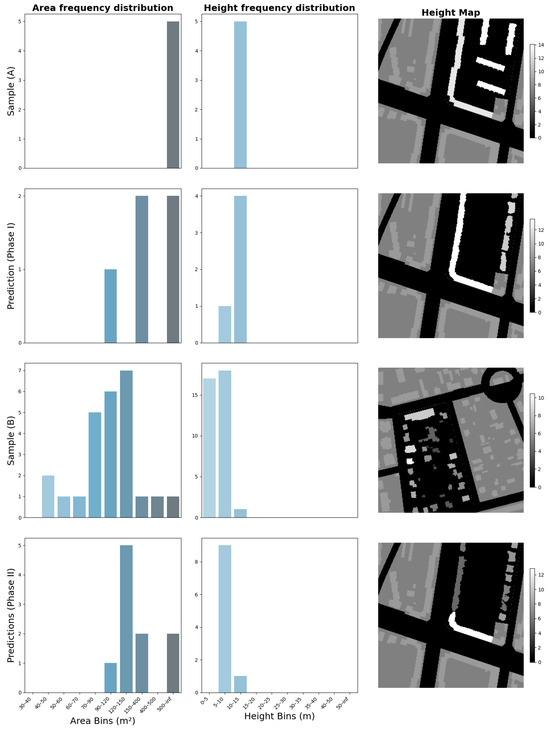
Figure 18.
Area and height frequency distribution transfer across experimental phases I and II. Columns one and two illustrate the area and height distributions, respectively, for all samples. The third column visualizes the 2.5D height maps, highlighting the blocks of interest (x and y) in black and white, with a height scale corresponding to the height values within the block. The remaining image context is displayed in filled grey, providing spatial reference.
This is further supported by the quantitative analysis presented in Table 8 displaying KL Divergence values comparing different scenarios. Step 1 indicates a high similarity in height distribution between sample (A) and prediction conditioned on , with a KL Divergence value of 0.022, and strong similarity in area distribution, with a value of 0.091. Similarly, step 2 reveals a low similarity in height distribution between sample (B) and prediction conditioned on with a value of 2.222, and moderate similarity in area distribution, with a value of 1.425. After performing the prediction using the distributions of y vs. (B) in step 3, the KL Divergence values were 0.821 for the area distribution and 1.019 for the height distribution. This indicates that the prediction more closely aligns with the distribution found in block y, showing higher similarity. Additionally, when evaluating predictions conditioned on y vs. (A) in step 4, the KL Divergence values of 0.160 for the area distribution and 0.230 for the height distribution remained low for the area and low for the height. This reflects that the model’s solution is also relatively close to the distribution of A, which is consistent with observations from the visual inspection.
Table 8.
Second Experiment, Height and Area Distributions Comparison.
Further empirical analysis revealed that altering the target district as a control variable resulted in only minor differences in the model’s output. The most notable changes involved subtle variations in building size, which appeared inconsistently across predictions. These adjustments did not translate into a meaningful architectural representation of the target districts. Despite each district exhibiting unique frequency distributions for building height and area, these differences did not manifest strongly in the predicted spatial patterns.
3.5. Framework Outputs
The outputs generated by the framework are provided as Geographical Information System (GIS) layers embedded in real-world coordinates, enabling seamless integration with spatial datasets and facilitating direct comparison with existing urban data. This georeferenced output structure supports visualization and analysis workflows analogous to traditional cartographic data, enhancing usability for planning, simulation, and remote sensing applications. We illustrate two primary use cases that emphasize the model’s capability to produce 3D visualizations. These scenarios showcase realistic urban reconstructions through the fusion of lidar-derived elevation data, building footprints, and hillshade layers. When combined, these elements enable the rapid generation of immersive and navigable 3D models suitable for real-time exploration and environmental simulation. A key capability of the framework lies in the extrusion of RGB-based building footprints using their corresponding nDSM elevation values. This enables the synthesis of detailed, three-dimensional approximations of real-world terrain and built morphology as shown in Figure 19.

Figure 19.
Framework 3D output scene. The figure illustrates two examples of this functionality. (a) shows a 3D urban scene as a combination between the 2.5D nDSM data and the RGB channels focused on the predicted block in the middle. The figure also shows the predicted trees in the scene. (b) presents 2.5D extruded buildings structures hillshades roof rendering. The predicted block is highlighted with the red color.
3.6. Quantitative Evaluation
To objectively evaluate the performance, the selected model (Model 8) was tested on an unseen dataset. The evaluation metrics, presented in Table 9, were calculated by analyzing discrepancies between predictions and ground truth data within the testing area. While the Dice Coefficient is relatively low, it remains consistent with the evaluation metric. Additionally, the KL Divergence value for the nDSM is moderately low at 1.132, suggesting slight differences between the distributions, potentially due to the existence of multiple valid solutions for the same block. The results align with the metrics observed during training, with visual similarity metrics for the RGBI and hillside channels remaining high at 0.840 and 0.821, respectively.
Table 9.
Model performance metrics on the testing area.
4. Discussion and Future Work
In this section, we critically examine the study limitations, discuss the results and propose strategies to mitigate their impact, offering a constructive roadmap for future research and model refinement.
4.1. Limitations
Designing and implementing experiments involved numerous practical and methodological choices, each of which may have influenced the outcomes in ways not fully accounted for in this study. These decisions, while necessary for operationalizing the model, introduce potential biases and constraints that warrant further scrutiny.
Although the algorithmic components were rigorously assessed through both qualitative and quantitative methods, the study does not include validation by urban planning experts. The primary objective of this study was to evaluate the feasibility of generating analytically conditioned urban patterns, which we believe has been successfully demonstrated. However, incorporating practitioner perspectives represents an important direction for future work to ensure the practical relevance and applicability of the framework’s predictions within real-world planning scenarios.
Additionally, in this study we include a thematic representation of the zoning areas as conditional input. However, a significant limitation is the absence of legal, historical, financial and social constraints within the system’s input parameters or as a conditional input. These factors are integral to the urban planning process, as any viable solution must comply with established laws and contextual norms. For a production-level framework, it is essential to embed these considerations at the core of the system to ensure that the generated proposals are not only innovative but also legally and socially grounded.
Moreover, the framework and model design, particularly its deep learning components, included numerous hyperparameters such as, among others, the number of epochs, image size, spatial resolution, model depth, loss function weights, and the design of specialized embedding layers and attention mechanisms. Each of these choices can significantly influence the model’s performance and output and, for that, alternative hyperparameters may yield different results. In addition, this research employs a model with a fixed input image size of 256 by 256 pixels with a spatial resolution of one meter. Varying the spatial resolution and the windows dimensions might lead to capturing architectural and urban morphological details on a different scale, namely emerging urban properties, and might impact the overall performance of the model. While the design decisions were guided by our objective to maintain simplicity and computational feasibility, this introduces a limitation. In the absence of a comprehensive ablation study, the impact of individual components in addition to a varying input resolution remains underexplored.
Another notable limitation of this research is to rely solely on Berlin as the main data source for the training dataset. Even though Berlin is recognised for its diverse architectural and complex historical narrative, it has a European urban layout. This style is characterized by radial structures and repeated blocks. Hence, the model is restricted by its training data without including varied geographical and urban representations of other cities that might help generalize this study to over locations. In addition, in order to ensure data algorithm governance, the building centric sampling mechanism is applied on the training, validation and testing datasets. This introduces the limitation that the scores calculated on the validation and training dataset might have an inherent bias toward densely built areas. Both of these aspects limit the ability of unbiased evaluation that can estimate the model’s ability to generalize beyond its training data.
While the model demonstrates responsiveness to input parameters, specifically the frequency distributions of building area and height. There is no formal guarantee that the output will conform to the expected statistical properties. Although the discriminator is conditioned on these distributions and, in theory, an optimal solution should converge towards samples that emulate the provided priors, this behavior has not been quantitatively verified. This limitation underscores the need for explicit mechanisms that enforce compliance with input distributions. And in the current experimental setup, bin selection for building area and height is conducted empirically and does not explicitly reflect formally recognized building typologies. This simplification limits the semantic granularity of the conditioning mechanism and may obscure architectural or functional distinctions embedded in the urban fabric.
Finally, in the current framework, building parts and small-scale structures are excluded from the binning process and treated as erroneous or outlier data. Even though these structures still are included in the images, the exclusion from the conditioning process, may inadvertently omit relevant morphological information of the blocks. Preliminary observations suggest that incorporating these minor structures, either through dedicated classification or systematic integration, could significantly alter the statistical profiles of individual urban blocks.
4.2. Discussion
The generative robustness across all datasets training, validation and testing suggests the model has effectively internalized the distribution of urban morphology, allowing it to produce plausible configurations that generalize across different spatial contexts. Particularly the model quantitative and quantitative performance on the validation and testing samples indicates strong spatial awareness and highlights the model’s potential for adaptive urban synthesis in real-world scenarios where data coverage may be incomplete.
However, certain particularities are noted during the experiment. The model tends to interpolate between the distinct typologies when a mixture of urban representation exists. From an urban planning perspective, it remains uncertain whether this behavior aligns with the intended objectives. However, from a methodological standpoint, the observed behavior indicates that the model’s internal representation struggles to disentangle overlapping spatial cues when confronted with mixed-context samples. Further refinement may be necessary to enhance architectural resolution and preserve typological fidelity in multi-pattern environments.
In some samples the model predicted structures that are adjacent to land use blocks whereas there was a deviation from the block layout in ground truth data. The underlying reasons for this deviation remain unclear and outside of the paper scope. However, It is possible that external constraints such as zoning or building regulations, or socio-economic and historical factors may have influenced development patterns and inhibited full utilization of the block perimeter. This observation highlights the complexity of real-world urban morphology and underscores the need for models to account for latent variables that affect architectural outcomes beyond geometric alignment.
Additionally, some artifacts existed where geometrical particularities may introduce ambiguity in the spatial encoding process, leading to instability or misalignment during pattern synthesis. Similarly, large block sizes produced an anomaly where the model produced a mixture of patterns. This may stem from the relatively large size of the block, which appears to have prompted the model to synthesize a heterogeneous mix of urban typologies. In particular, the generated layout integrates elements that resemble rural or peri-urban development patterns, marked by fragmented building distributions and reduced emphasis on road integration within what should be a more structured urban context. This blending of architectural regimes may suggest limitations in the model’s ability to consistently infer functional land-use logic when confronted with ambiguous or expansive spatial envelopes.
Another limitation is the district influence on the predictions. One possible explanation is that the resolution scale at which the experiments were conducted is not sufficient to detect district-level nuances such as stylistic details, typological rhythms, and contextual transitions may be insufficiently expressed or detectable at coarse spatial granularity. This limitation highlights the challenge of encoding high-level urban semantics through low-level distributional parameters and suggests future work should consider multi-scale modeling approaches to better preserve contextual identity.
The controllability of the model is successful The results demonstrate that the model successfully adapted its output, replicating the dense, connected urban typology of the target examples. The generated structures filled the block boundary, with long spatial arrangements and architectural continuity, confirming the model’s ability to synthesize user-controlled spatial outcomes based on statistical parameters. The inverse experiment showed that the context influenced the outcome heavily. This outcome suggests the model incorporates contextual cues from neighboring urban structures during prediction. Its partial resistance to distributional change may reflect sensitivity to local morphological patterns, particularly in cities like Berlin, where repetitive and structured block formations dominate. Following a similar logic in analysing the previous results, it remains uncertain if these results are desirable from an urban planning perspective. However, from a methodological point of view, these results highlight the interplay between controlled input distributions and implicit spatial dependencies in the model’s architecture. Our quantitative evaluation confirms that the model is able to adapt the results based on the suggested distribution and confirmed the visual observation. The analysis demonstrated that the block area and height distributions shifted in the predicted sample to resemble the desired distributions and in the same time remained moderately similar to the original block statistics.
4.3. Outlook
One promising avenue for algorithmic improvement lies in expanding the multi-scale conditioning process. The current version of the model incorporates only two levels of details in conditioning namely the building footprint and height distributions and the land use maps that abstract usage area. However, it might enrich the generation process to include fine details that gradually emerge and aggregate into abstract features on higher levels of the urban fabric. For example, including in the conditions a detailed description of roof and wall structures, aggregating into building areas and columns, and emerging as block and city level and statistics. Therefore, it is worth exploring in tandem with corresponding models such as hierarchical GAN architecture that might improve capturing the nuances of spatial dependencies and span from micro-level features to macro-scale urban patterns and offer capabilities that go beyond building and block level representations.
The loss function in this work primarily relies on adversarial loss, which effectively steers the model toward generating realistic looking samples. However, it might be possible to enhance the architectural and morphological coherence of the results by introducing a custom loss function that incorporates spatial constraints, such as promoting architectural homogeneity within blocks and across the overall solution.
In addition, comparing the model’s output with existing rule based approaches such as buildout analysis may provide transparent benchmarking. Additionally, the rule based approaches might be a viable data source beyond existing built structure. Therefore, future work can explore the integration of the proposed model with GIS-based buildout analysis techniques to deepen understanding of the urban planning processes, zoning characteristics, regulatory codes, urban growth pattern, and financial feasibility and implications [53].
Future work could also investigate introducing a dedicated loss function that penalizes discrepancies between the predicted and expected frequency distributions of area and height. Such a function would map the output morphology to its corresponding bin-wise input priors and compute distributional deviation, thereby promoting more consistent and controllable urban synthesis.
Additionally numerous studies have demonstrated that morphological characteristics such as footprint size, height, and spatial configuration can be used to estimate building typology. Notable examples include the Tabula dataset [54], which offers a structured classification of building types across multiple European contexts, and the official categorization provided by the German Federal Statistical Office [55], which systematically divides buildings into standardized classes based on form and function. Future research could improve the binning strategy by leveraging such typological frameworks to define bins that correspond to meaningful architectural classes.
The current approach to district-level conditioning yielded limited stylistic and distributional variation in the model’s predictions and produced hybrid predictions in heterogeneous urban morphology context. While input district identifiers were provided as conditioning variables, the resulting architectural outputs did not consistently reflect meaningful changes in urban form or typology across different districts. This suggests that the existing dataset may lack sufficient morphological contrast or spatial richness to drive distinctive generative behavior. Similarly, block context rarely consists of one morphological class and often is a mixture of multiple classes. Therefore, introducing well-defined urban morphology classes as conditional inputs can be informative for planners and deep learning models. When combined with a disentangled deep learning architecture, this approach enhances the interoperability and controllability of the output. To address these gaps, future work could incorporate data from cities with more diverse and well-differentiated urban patterns, such as New York City, Barcelona, or Paris. These metropolitan areas exhibit highly recognizable planning logics, street morphologies, and building typologies, which could introduce stronger signal-to-noise ratios for district-level conditioning [56]. This investigation can be complemented by an in-depth exploration of the latent space or architectural modification [57] coupled with well defined morphological classes to enhance the model’s explainability and interpretability, thereby addressing its black-box nature and fostering trust and giving a finer controllability to planning stakeholders over the results [56].
A key limitation of the current generative framework is its lack of awareness regarding legal, historical, and financially feasible aspects of the spatial patterns it proposes. Future research should aim to bridge this gap by incorporating such constraints into the generation pipeline. This could be achieved through the inclusion of conditional embeddings that encode regulatory zoning categories, historical preservation status, or cost-based development heuristics. Alternatively, modular architectures could be explored, where specialized components evaluate proposed layouts against external criteria such as land-use legality, historical compliance, or economic viability.
The 2D and 2.5D output of the framework generates not only a plausible virtual environment of the urban scene but are also formatted for direct integration into Geographical Information Systems (GIS) workflows. These output includes a prediction of the 2D building footprints, a 2.5D nDSM representation of the scene including the surrounding environment including green structures. In addition, a hillshade rendering roof structures and elevation changes. Together, these results enable a wide range of urban planning analyses, such as evaluating solar panels suitability, surface sealing impact, shading effects and computing volumetric and area metrics for built-up spaces. Future work can explore the practical feasibility of applying these generated data in real-world planning scenarios and policy development. And further integrate the solution with high well-known 3D city management solutions [6].
5. Conclusions
This study introduces a generative framework capable of producing novel urban scenes with high visual and spatial realism. The model demonstrates adaptability to specific analytical conditioning inputs, allowing precise control over urban morphological features such as building height and area distributions. Furthermore, we show that stylistic transfer from exemplar samples enables flexible manipulation of output structure, guiding the synthesis toward desired urban typologies.
The study successfully implemented a novel approach leveraging publicly available data from the city of Berlin to train the model and conduct both quantitative and qualitative analyses. The dataset provided a comprehensive representation of 2D and 3D urban environments, serving as inputs and outputs for the framework. These included building footprints, normalized Digital Surface Models (nDSM), hillshades, RGBI imagery, and land use blocks.
On the modelling side, by leveraging Generative Adversarial Networks (GANs), the model demonstrated strong performance while maintaining a streamlined design and minimizing computational overhead. The inclusion of FiLM layers and attention mechanisms enabled effective multi-scale conditioning and robust performance across diverse scenes.
On the functional side, the model demonstrated the ability to generate urban patterns across a variety of settings that corresponded to their context, including urban, sparsely built, and mixed environments. By leveraging conditioning on area and height distributions, the model effectively adapted the block distributions to align with the desired input while maintaining consistency with the original distribution. This capability highlights the model’s flexibility in generating contextually appropriate outputs that adhere to both the conditioning parameters and the inherent characteristics of the input data. Rigorous quantitative and qualitative evaluations validated both the numerical and visual observations. This was achieved through a detailed analysis conducted on the validation and testing areas, utilizing metrics that assess visual similarity, distribution dissimilarity, and overlap with existing structures.
The study critically addressed the limitations of the proposed framework while highlighting its ability to deliver compelling qualitative outputs and structurally coherent urban layouts. However, further research is required to enhance its analytical robustness. Specifically, systematic quantitative evaluations along with an ablation study should be conducted to benchmark prediction accuracy and assess distributional fidelity and to further the research to enhance the explainability and improve the interpretation of mixed or uniform urban forms predictions. Additionally, future work could focus on integrating custom loss functions designed to enforce statistical consistency with target morphological profiles. Additionally, to increase contextual relevance and practical applicability, future development should extend the conditioning framework to include legal, historical, economic, and typological constraints along with urban planning experts evaluation. Incorporating such multifaceted inputs would support more context-aware urban synthesis and bolster the framework’s utility for urban planning, simulation, and policy evaluation.
The research introduces a promising technology that has the potential to significantly support urban planners and stakeholders by generating foundational data for further analysis. This technology is particularly valuable in the context of urban digital twin development, where it can provide inputs in raw data form for optimizing urban environments. By leveraging advanced generative models, the framework offers urban planners a tool to aid in creating realistic and contextually accurate urban layouts that can be statistically conditioned, paving the way for more precise decision-making.
Author Contributions
For this research, the following contributions are made. Conceptualization, Amgad Agoub; Data curation, Amgad Agoub; Formal analysis, Amgad Agoub; Investigation, Amgad Agoub; Methodology, Amgad Agoub; Software, Amgad Agoub; Supervision, Martin Kada; Visualization, Amgad Agoub; Writing—original draft, Amgad Agoub; Writing—review & editing, Martin Kada. All authors have read and agreed to the published version of the manuscript.
Funding
This research received no external funding.
Data Availability Statement
The original data presented in this study are openly available from the following sources: Senatsverwaltung für Stadtentwicklung, Bauen und Wohnen Berlin. bDOM—Bildbasiertes Digitales Oberflächenmodell, 2024. Available online: https://fbinter.stadt-berlin.de/fb/feed/senstadt/a_dom/0 (accessed on 6 June 2025). Senatsverwaltung für Stadtentwicklung, Bauen und Wohnen Berlin. ATKIS® DGM—Digitales Geländemodell, 2021. Available online: https://fbinter.stadt-berlin.de/fb/feed/senstadt/a_dgm/0 (accessed on 6 June 2025). Senatsverwaltung für Stadtentwicklung, Bauen und Wohnen Berlin. Blattschnitte, 2024. Available online: https://fbinter.stadt-berlin.de/fb/atom/Blattschnitte/2X2_EPSG_25833.gif (accessed on 6 June 2025). Senatsverwaltung für Stadtentwicklung, Bauen und Wohnen Berlin. ALKIS Berlin (Gebäude, Tatsächliche Nutzungsflächen, Bezirke), 2024. Available online via WFS: https://gdi.berlin.de/services/wfs/alkis (accessed on 6 June 2025). Senatsverwaltung für Stadtentwicklung, Bauen und Wohnen Berlin. Digitale Orthophotos Berlin 2024 (True Color, RGBI), 2024. Available online: https://fbinter.stadt-berlin.de/fb/feed/senstadt/a_luftbild2024_true_rgbi/0 (accessed on 6 June 2025). Sample datasets used to generate the processed data for this study can be provided by the authors upon reasonable request.
Acknowledgments
We gratefully acknowledge the use of geospatial data provided by the Berlin Geoportal, maintained by the Senate Department for Urban Development, Building and Housing. All datasets used in this study, including orthophotos, DSM and DEM elevation data, building footprints, and land-use maps, were obtained through this portal. The availability of high-quality, openly accessible urban data was instrumental in enabling the development, training, and evaluation of the proposed framework.
Conflicts of Interest
The authors declare no conflicts of interest.
Correction Statement
This article has been republished with a minor correction to the Data Availability Statement. This change does not affect the scientific content of the article.
Abbreviations
The following abbreviations are used in this manuscript:
| cGAN | Generative Adversarial Networks |
| L1-Loss | mean absolute error |
| KL Divergence | Kullback–Leibler Divergence |
| SSIM | Structural Similarity Index |
| UDT | Urban Digital Twins |
| 2D | two-dimensional |
| 3D | three-dimensional |
| GenAI | Generative Artificial intelligence |
| GPT | Generative Pre-trained Transformer |
| NLP | Natural Language Processing |
| LLMs | Large Language Models |
| VAEs | Variational AutoEncoders |
| GANs | Generative Adversarial Networks |
| 1D | one-dimensional |
| DCGAN | Deep Convolutional GANs |
| GNN | Graph Neural Network |
| FiLM | Feature-wise Linear Modulation |
| R | Rectangular |
| 2.5D | two-and-a-half-dimensional |
| nDSM | Normalized Digital Surface Models |
| RGB | Red, Green, Blue |
| RGBI | Red, Green, Blue and Near-Infrared |
| DSM | Digital Surface Model |
| DEM | Digital Elevation Model |
| ALKIS | Authoritative Real Estate Cadastre Information System |
| Adam | Adaptive Moment Estimation |
| CNN | Convolutional Neural Network |
| GT | Ground Truth |
| GIS | Geographical Information System |
References
- Smart Cities and Urban Energy Planning. Available online: https://encyclopedia.pub/entry/54821 (accessed on 21 June 2025).
- United Nations. World Urbanization Prospects: The 2018 Revision; United Nations: New York, NY, USA, 2019. [Google Scholar]
- Khor, N.J.K. World Cities Report 2022: Envisaging the Future of Cities; United Nations Human Settlements Programme (UN-Habitat): Nairobi, Kenya, 2022. [Google Scholar]
- Wolniak, R.; Stecuła, K. Artificial Intelligence in Smart Cities—Applications, Barriers, and Future Directions: A Review. Smart Cities 2024, 7, 1346–1389. [Google Scholar] [CrossRef]
- Srivastava, S.; Singh, M.; Elamer, A.A. Digital Twins for Inclusive Urban Planning to Empowering Communities in a Data-Driven Future. In Digital Twins for Smart Cities and Urban Planning; CRC Press: Boca Raton, FL, USA, 2025; pp. 34–52. Available online: https://www.taylorfrancis.com/chapters/edit/10.1201/9781003510338-2/digital-twins-inclusive-urban-planning-empowering-communities-data-driven-future-sonali-srivastava-manisha-singh-ahmed-elamer (accessed on 13 July 2025).
- Yao, Z.; Nagel, C.; Kunde, F.; Hudra, G.; Willkomm, P.; Donaubauer, A.; Adolphi, T.; Kolbe, T.H. 3DCityDB—A 3D geodatabase solution for the management, analysis, and visualization of semantic 3D city models based on CityGML. Open Geospat. Data Softw. Stand. 2018, 3, 5. [Google Scholar] [CrossRef]
- Goetz, M. Towards generating highly detailed 3D CityGML models from OpenStreetMap. Int. J. Geogr. Inf. Sci. 2013, 27, 845–865. [Google Scholar] [CrossRef]
- Koukofikis, A.; Coors, V.; Gutbell, R. Interoperable visualization of 3D city models using OGC’S standard 3D portrayal service. ISPRS Ann. Photogramm. Remote. Sens. Spat. Inf. Sci. 2018, 4, 113–118. [Google Scholar] [CrossRef]
- Schilling, A.; Bolling, J.; Nagel, C. Using glTF for streaming CityGML 3D city models. In Proceedings of the 21st International Conference on Web3D Technology, Anaheim, CA, USA, 22–24 July 2016; ACM: New York, NY, USA, 2016; pp. 109–116. [Google Scholar] [CrossRef]
- Benner, J.; Geiger, A.; Leinemann, K. Flexible generation of semantic 3D building models. In Proceedings of the 1st International Workshop on Next Generation 3D City Models, Bonn, Germany, 21–22 June 2005; Gröger/Kolbe, Ed.; ISPRS: Bonn, Germany, 2005; pp. 17–22. Available online: https://www.researchgate.net/profile/Thomas-Kolbe-2/publication/343539567_Proceedings_of_the_1st_International_Workshop_on_Next_Generation_3D_City_Models_21-22_June_2005_Bonn_Germany_Jointly_organized_by_University_of_Bonn_DGPF_EuroSDR_and_ISPRS/links/5f2fec1e458515b729100695/Proceedings-of-the-1st-International-Workshop-on-Next-Generation-3D-City-Models-21-22-June-2005-Bonn-Germany-Jointly-organized-by-University-of-Bonn-DGPF-EuroSDR-and-ISPRS.pdf#page=21 (accessed on 27 August 2025).
- Döllner, J.; Baumann, K.; Buchholz, H. Virtual 3D City Models as Foundation of Complex Urban Information Spaces. 2006. Available online: https://www.corp.at/archive/CORP2006_DOELLNER.pdf (accessed on 27 August 2025).
- CEPR. The Rapid Adoption of Generative AI. Available online: https://cepr.org/voxeu/columns/rapid-adoption-generative-ai (accessed on 21 June 2025).
- Gemini Team Google. Gemini: A Family of Highly Capable Multimodal Models. arXiv 2025, arXiv:2312.11805. [Google Scholar] [CrossRef]
- Kingma, D.P.; Welling, M. Auto-Encoding Variational Bayes. arXiv 2013, arXiv:1312.6114. [Google Scholar] [CrossRef]
- Goodfellow, I.J.; Pouget-Abadie, J.; Mirza, M.; Xu, B.; Warde-Farley, D.; Ozair, S.; Courville, A.; Bengio, Y. Generative adversarial nets. In Proceedings of the Advances in Neural Information Processing Systems, Montreal, QC, Canada, 8–13 December 2014; Volume 27. Available online: https://proceedings.neurips.cc/paper_files/paper/2014/hash/f033ed80deb0234979a61f95710dbe25-Abstract.html (accessed on 13 July 2025).
- Kaplan, J.; McCandlish, S.; Henighan, T.; Brown, T.B.; Chess, B.; Child, R.; Gray, S.; Radford, A.; Wu, J.; Amodei, D. Scaling laws for neural language models. arXiv 2020, arXiv:2001.08361. Available online: https://arxiv.org/pdf/2001.08361/1000 (accessed on 13 July 2025). [CrossRef]
- Geoportal Berlin. Available online: https://www.berlin.de/sen/sbw/stadtdaten/geoportal/ (accessed on 21 June 2025).
- Shetgaonkar, A.; Pradhan, D.; Arora, L.; Girija, S.S.; Kapoor, S.; Raj, A. Opportunities and Applications of GenAI in Smart Cities: A User-Centric Survey. arXiv 2025, arXiv:2505.08034. [Google Scholar] [CrossRef]
- Sastry, S.; Khanal, S.; Dhakal, A.; Jacobs, N. GeoSynth: Contextually-Aware High-Resolution Satellite Image Synthesis. In Proceedings of the IEEE/CVF Conference on Computer Vision and Pattern Recognition, Seattle, WA, USA, 17–18 June 2024; pp. 460–470. Available online: https://openaccess.thecvf.com/content/CVPR2024W/EarthVision/html/Sastry_GeoSynth_Contextually-Aware_High-Resolution_Satellite_Image_Synthesis_CVPRW_2024_paper.html (accessed on 23 June 2025).
- Schneider, J. Explainable Generative AI (GenXAI): A survey, conceptualization, and research agenda. Artif. Intell. Rev. 2024, 57, 289. [Google Scholar] [CrossRef]
- Wang, D.; Lu, C.-T.; Fu, Y. Towards Automated Urban Planning: When Generative and ChatGPT-like AI Meets Urban Planning. arXiv 2023, arXiv:2304.03892. [Google Scholar] [CrossRef]
- Wen, L.; Zhu, Y.; Ye, L.; Chen, G.; Yu, B.; Liu, J.; Xu, C. LayouTransformer: Generating Layout Patterns with Transformer via Sequential Pattern Modeling. In Proceedings of the 41st IEEE/ACM International Conference on Computer-Aided Design, San Diego, CA, USA, 30 October–3 November 2022; ACM: New York, NY, USA, 2022; pp. 1–9. [Google Scholar] [CrossRef]
- He, L.; Aliaga, D.G. GlobalMapper: Arbitrary-Shaped Urban Layout Generation. In Proceedings of the IEEE/CVF International Conference on Computer Vision, Paris, France, 2–6 October 2023; pp. 454–464. [Google Scholar] [CrossRef]
- Deng, J.; Chai, W.; Guo, J.; Huang, Q.; Huang, J.; Hu, W.; Hao, S.; Hwang, J.N.; Wang, G. CityGen: Infinite and Controllable City Layout Generation. In Proceedings of the Computer Vision and Pattern Recognition Conference, Nashville, TN, USA, 17–21 June 2025; pp. 1995–2005. Available online: https://openaccess.thecvf.com/content/CVPR2025W/USM3D/html/Deng_CityGen_Infinite_and_Controllable_City_Layout_Generation_CVPRW_2025_paper.html (accessed on 22 June 2025).
- Mirza, M.; Osindero, S. Conditional Generative Adversarial Nets. arXiv 2014, arXiv:1411.1784. [Google Scholar] [CrossRef]
- Rombach, R.; Blattmann, A.; Lorenz, D.; Esser, P.; Ommer, B. High-resolution image synthesis with latent diffusion models. In Proceedings of the IEEE/CVF Conference on Computer Vision and Pattern Recognition, New Orleans, LA, USA, 19–24 June 2022; pp. 10684–10695. Available online: https://openaccess.thecvf.com/content/CVPR2022/html/Rombach_High-Resolution_Image_Synthesis_With_Latent_Diffusion_Models_CVPR_2022_paper (accessed on 26 August 2025).
- Karras, T.; Laine, S.; Aila, T. A style-based generator architecture for generative adversarial networks. In Proceedings of the IEEE/CVF Conference on Computer Vision and Pattern Recognition, Long Beach, CA, USA, 15–20 June 2019; pp. 4401–4410. Available online: http://openaccess.thecvf.com/content_CVPR_2019/html/Karras_A_Style-Based_Generator_Architecture_for_Generative_Adversarial_Networks_CVPR_2019_paper.html (accessed on 26 August 2025).
- Radford, A.; Metz, L.; Chintala, S. Unsupervised Representation Learning with Deep Convolutional Generative Adversarial Networks. arXiv 2016, arXiv:1511.06434. [Google Scholar] [CrossRef]
- Perez, E.; Strub, F.; De Vries, H.; Dumoulin, V.; Courville, A. Film: Visual reasoning with a general conditioning layer. In Proceedings of the AAAI Conference On Artificial Intelligence, New Orleans, LA, USA, 2–7 February 2018; Available online: https://ojs.aaai.org/index.php/AAAI/article/view/11671 (accessed on 8 July 2025).
- Vaswani, A.; Shazeer, N.; Parmar, N.; Uszkoreit, J.; Jones, L.; Gomez, A.N.; Kaiser, Ł.; Polosukhin, I. Attention is all you need. In Proceedings of the Advances in Neural Information Processing Systems, Long Beach, CA, USA, 4–9 December 2017; Volume 30. Available online: https://proceedings.neurips.cc/paper/2017/hash/3f5ee243547dee91fbd053c1c4a845aa-Abstract.html (accessed on 8 July 2025).
- Xu, L.; Xiangli, Y.; Rao, A.; Zhao, N.; Dai, B.; Liu, Z.; Lin, D. BlockPlanner: City Block Generation with Vectorized Graph Representation. In Proceedings of the 2021 IEEE/CVF International Conference on Computer Vision (ICCV), Montreal, QC, Canada, 10–17 October 2021; IEEE: New Orleans, LA, USA, 2021; pp. 5057–5066. [Google Scholar] [CrossRef]
- Xie, H.; Chen, Z.; Hong, F.; Liu, Z. CityDreamer: Compositional Generative Model of Unbounded 3D Cities. In Proceedings of the IEEE/CVF Conference on Computer Vision and Pattern Recognition (CVPR), Seattle, WA, USA, 17–21 June 2024; IEEE: Piscataway, NJ, USA, 2024; pp. 9666–9675. [Google Scholar] [CrossRef]
- Isola, P.; Zhu, J.-Y.; Zhou, T.; Efros, A.A. Image-to-image translation with conditional adversarial networks. In Proceedings of the IEEE Conference on Computer Vision and Pattern Recognition, Honolulu, HI, USA, 21–26 July 2017; IEEE: Piscataway, NJ, USA, 2017; pp. 1125–1134. Available online: http://openaccess.thecvf.com/content_cvpr_2017/html/Isola_Image-To-Image_Translation_With_CVPR_2017_paper.html (accessed on 23 June 2025).
- Dai, Z.; Yang, Z.; Yang, Y.; Carbonell, J.; Le, Q.V.; Salakhutdinov, R. Transformer-XL: Attentive Language Models Beyond a Fixed-Length Context. arXiv 2019, arXiv:1901.02860. [Google Scholar] [CrossRef]
- Lin, C.H.; Lee, H.-Y.; Menapace, W.; Chai, M.; Siarohin, A.; Yang, M.-H.; Tulyakov, S. InfiniCity: Infinite-scale city synthesis. In Proceedings of the IEEECVF International Conference on Computer Vision ICCV, Paris, France, 2–6 October 2023; pp. 22751–22761. [Google Scholar] [CrossRef]
- Lin, C.H.; Lee, H.Y.; Cheng, Y.C.; Tulyakov, S.; Yang, M.H. INFINITYGAN: Towards Infinite-pixel Image Synthesis. In Proceedings of the 10th International Conference on Learning Representations, ICLR 2022, Virtual Conference, 25–29 April 2022; Available online: https://yonsei.elsevierpure.com/en/publications/infinitygan-towards-infinite-pixel-image-synthesis (accessed on 6 July 2025).
- Bengio, Y.; Ducharme, R.; Vincent, P.; Jauvin, C. A neural probabilistic language model. J. Mach. Learn. Res. 2003, 3, 1137–1155. [Google Scholar]
- Ronneberger, O.; Fischer, P.; Brox, T. U-Net: Convolutional Networks for Biomedical Image Segmentation. In Medical Image Computing and Computer-Assisted Intervention—MICCAI 2015; Navab, N., Hornegger, J., Wells, W.M., Frangi, A.F., Eds.; Lecture Notes in Computer Science; Springer: Cham, Switzerland, 2015; Volume 9351, pp. 234–241. [Google Scholar] [CrossRef]
- Senatsverwaltung für Stadtentwicklung, Bauen und Wohnen Berlin. Digitale Orthophotos Berlin 2024 (True Color, RGBl). 2024. Available online: https://fbinter.stadt-berlin.de/fb/feed/senstadt/a_luftbild2024_true_rgbi/0 (accessed on 6 June 2025).
- Senatsverwaltung für Stadtentwicklung, Bauen und Wohnen Berlin. bDOM—Bildbasiertes Digitales Oberflächenmodell. 2024. Available online: https://fbinter.stadt-berlin.de/fb/feed/senstadt/a_dom/0 (accessed on 6 June 2025).
- Senatsverwaltung für Stadtentwicklung, Bauen und Wohnen Berlin. ATKIS®® DGM—Digitales Geländemodell. 2021. Available online: https://fbinter.stadt-berlin.de/fb/feed/senstadt/a_dgm/0 (accessed on 6 June 2025).
- Senatsverwaltung für Stadtentwicklung, Bauen und Wohnen Berlin. Blattschnitte. 2024. Available online: https://fbinter.stadt-berlin.de/fb/atom/Blattschnitte/2X2_EPSG_25833.gif (accessed on 6 June 2025).
- Horn, B.K. Hill shading and the reflectance map. Proc. IEEE 1981, 69, 14–47. [Google Scholar] [CrossRef]
- Senatsverwaltung für Stadtentwicklung, Bauen und Wohnen Berlin. ALKIS Berlin—Gebaeude. 2024. Available online: https://gdi.berlin.de/services/wfs/alkis_gebaeude?REQUEST=GetFeature&SERVICE=wfs&VERSION=2.0.0&TYPENAMES=alkis_gebaeude:gebaeude&OUTPUTFORMAT=json (accessed on 6 June 2025).
- Senatsverwaltung für Stadtentwicklung, Bauen und Wohnen Berlin. ALKIS Berlin—Tatsaechlichenutzungflaechen. 2024. Available online: https://gdi.berlin.de/services/wfs/alkis?REQUEST=GetFeature&SERVICE=wfs&VERSION=2.0.0&TYPENAMES=alkis:tatsaechlichenutzungflaechen&OUTPUTFORMAT=json (accessed on 6 June 2025).
- Senatsverwaltung für Stadtentwicklung, Bauen und Wohnen Berlin. ALKIS Berlin—Bezirk. 2024. Available online: https://gdi.berlin.de/services/wfs/alkis?REQUEST=GetFeature&SERVICE=wfs&VERSION=2.0.0&TYPENAMES=alkis:bezirk&OUTPUTFORMAT=json (accessed on 6 June 2025).
- Bishop, C.M.; Nasrabadi, N.M. Pattern Recognition and Machine Learning; Springer: New York, NY, USA, 2006; Volume 4, Available online: https://link.springer.com/book/9780387310732 (accessed on 9 July 2025).
- Lin, T.-Y.; Goyal, P.; Girshick, R.; He, K.; Dollár, P. Focal loss for dense object detection. In Proceedings of the IEEE International Conference on Computer Vision, Venice, Italy, 22–29 October 2017; pp. 2980–2988. Available online: http://openaccess.thecvf.com/content_iccv_2017/html/Lin_Focal_Loss_for_ICCV_2017_paper.html (accessed on 13 July 2025).
- Kingma, D.P. Adam: A method for stochastic optimization. arXiv 2014, arXiv:1412.6980. [Google Scholar]
- Wang, Z.; Bovik, A.C.; Sheikh, H.R.; Simoncelli, E.P. Image quality assessment: From error visibility to structural similarity. IEEE Trans. Image Process. 2004, 13, 600–612. [Google Scholar] [CrossRef] [PubMed]
- Kullback, S.; Leibler, R.A. On information and sufficiency. Ann. Math. Stat. 1951, 22, 79–86. [Google Scholar] [CrossRef]
- Dice, L.R. Measures of the amount of ecologic association between species. Ecology 1945, 26, 297–302. [Google Scholar] [CrossRef]
- Balsas, C.J.L. GIS Buildout Analysis and Urban Planning. Chin. J. Urban Environ. Stud. 2021, 9, 2150006. [Google Scholar] [CrossRef]
- TABULA WebTool. Available online: https://webtool.building-typology.eu/#bm (accessed on 14 July 2025).
- Systematik der Bauwerke, Ausgabe 1978—Version 2014. Statistisches Bundesamt. Available online: https://www.destatis.de/DE/Methoden/Klassifikationen/Bauwerke/klassifikation-sb1978-v14.html (accessed on 14 July 2025).
- Agoub, A.; Kada, M. Exploring the latent manifold of city patterns. ISPRS Int. J. Geo-Inf. 2021, 10, 683. [Google Scholar] [CrossRef]
- Higgins, I.; Matthey, L.; Pal, A.; Burgess, C.; Glorot, X.; Botvinick, M.; Mohamed, S.; Lerchner, A. beta-VAE: Learning basic visual concepts with a constrained variational framework. In Proceedings of the International Conference on Learning Representations, Toulon, France, 24–26 April 2017; Available online: https://openreview.net/forum?id=Sy2fzU9gl (accessed on 29 August 2025).
Disclaimer/Publisher’s Note: The statements, opinions and data contained in all publications are solely those of the individual author(s) and contributor(s) and not of MDPI and/or the editor(s). MDPI and/or the editor(s) disclaim responsibility for any injury to people or property resulting from any ideas, methods, instructions or products referred to in the content. |
© 2025 by the authors. Published by MDPI on behalf of the International Society for Photogrammetry and Remote Sensing. Licensee MDPI, Basel, Switzerland. This article is an open access article distributed under the terms and conditions of the Creative Commons Attribution (CC BY) license (https://creativecommons.org/licenses/by/4.0/).