Article

Evaluating UAV Flight Parameters for High-Accuracy in Road Accident Scene Documentation: A Planimetric Assessment Under Simulated Roadway Conditions

by
Thanakorn Phojaem
1,
Adisorn Dangbut
1,
Panuwat Wisutwattanasak
2,
Thananya Janhuaton
1,
Thanapong Champahom
3,
Vatanavongs Ratanavaraha
1 and
Sajjakaj Jomnonkwao
1,*
1
School of Transportation Engineering, Institute of Engineering, Suranaree University of Technology, Nakhon Ratchasima 30000, Thailand
2
Institute of Research and Development, Suranaree University of Technology, Nakhon Ratchasima 30000, Thailand
3
Department of Management, Faculty of Business Administration, Rajamangala University of Technology Isan, Nakhon Ratchasima 30000, Thailand
*
Author to whom correspondence should be addressed.
ISPRS Int. J. Geo-Inf. 2025, 14(9), 357; https://doi.org/10.3390/ijgi14090357
Submission received: 23 July 2025 / Revised: 14 September 2025 / Accepted: 16 September 2025 / Published: 17 September 2025
(This article belongs to the Special Issue Spatial Data Science and Knowledge Discovery)

Abstract

Unmanned Aerial Vehicles (UAVs) have become increasingly valuable for accident scene reconstruction and forensic surveying due to their flexibility and ability to capture high-resolution imagery. This study investigates the impact of flight altitude, camera angle, and image overlap on the spatial accuracy of 3D models generated from UAV imagery. A total of 27 flight configurations were conducted using a DJI Phantom 4 Pro V2, combining three altitudes (30 m, 45 m, 60 m), three camera angles (90°, 75°, 60°), and three overlap levels (60%, 70%, 80%). The resulting 3D models were assessed by comparing measured linear distances between ground control points with known reference distances. The Root Mean Square Error (RMSE) was used to quantify model accuracy. The results indicated that lower flight altitudes, nadir or moderately oblique camera angles, and higher image overlaps consistently yielded the most accurate reconstructions. A Wilcoxon rank-sum test confirmed that the differences in accuracy across parameter settings were statistically significant. These findings highlight the critical role of flight configuration in achieving centimeter-level accuracy, as evidenced by RMSE values ranging from 1.7 to 7.6 cm, and provide practical recommendations for optimizing UAV missions in forensic and engineering applications.

1. Introduction

In recent years, Unmanned Aerial Vehicles (UAVs), commonly referred to as drones, have revolutionized the domain of road accident investigation by offering rapid, cost-effective, and non-intrusive methods for capturing high-resolution imagery and reconstructing crash scenes [1,2,3,4]. Traditional accident documentation techniques are not only time-consuming and labor-intensive but also expose investigators to safety hazards, particularly on high-speed or high-traffic roadways [5,6]. In contrast, UAVs can be deployed within minutes and cover large or complex crash sites from multiple angles without disrupting traffic flow. It also includes calculating sight distance in a geographic information system. The results enabled the detection of accident-prone locations [7].
UAV-based photogrammetry has enabled the generation of detailed 3D reconstructions and orthomosaics, which support spatial measurements, trajectory analysis, and legal admissibility in court proceedings [5,8,9,10,11,12]. However, the geometric accuracy of these reconstructions is highly sensitive to drone flight parameters [13]. Critical parameters such as flight altitude, camera angle, and image overlap influence the quality of Structure-from-Motion (SfM) and Multi-View Stereo (MVS) processes [13,14,15,16].
Empirical research has demonstrated that flight altitude is a fundamental parameter influencing the geometric accuracy of UAV-based 3D reconstructions. It directly affects the ground sampling distance (GSD), which determines the spatial resolution and detail captured in the imagery [13,17,18,19,20,21]. Lower altitudes typically yield finer GSD and improved spatial precision, which is critical for forensic or engineering applications. In addition, the camera angle relative to the ground significantly impacts both the geometric fidelity and the spatial completeness of 3D models. While nadir images are preferred for top-down accuracy, incorporating oblique views improves the ability to reconstruct vertical elements and complex surfaces [22,23,24]. Equally important is the percentage of image overlap, which has been shown to greatly affect model quality. Higher overlap improves the robustness of tie-point matching and the reliability of Structure-from-Motion (SfM) algorithms, leading to more accurate reconstructions [25,26].
Operationally, UAV-based scene documentation provides considerable time savings [27,28]. Recent investigations report that entire crash sites can be documented in as little as 10–15 min, approximately half the time required by conventional total station or ground-based photographic methods [4,5]. Moreover, 3D models generated from UAV imagery have demonstrated high spatial fidelity, with Root Mean Square Error (RMSE) values commonly ranging from 0.9 to 4.6 cm, even under suboptimal lighting or environmental conditions.
Despite the growing adoption of drones for accident reconstruction, the lack of standardized guidelines regarding optimal flight parameters presents a major limitation in the field. Many forensic practitioners and crash investigators must rely on trial-and-error or manufacturer recommendations that are not tailored to the demands of forensic-grade modeling [29]. This lack of standardization may compromise the reproducibility, accuracy, and legal reliability of photogrammetric outputs in high-stakes investigations. To address this critical gap, the present study advances the state of knowledge by (1) systematically evaluating the combined influence of flight altitude, camera angle, and image overlap across 27 configurations; (2) validating results statistically using the Wilcoxon rank-sum test; (3) providing evidence-based recommendations for forensic UAV deployment; and (4) quantifying accuracy improvements, with RMSE. This research aims to identify optimal settings that strike a balance between efficiency and accuracy, thereby providing evidence-based recommendations for the deployment of UAVs in road accident investigations. The findings are expected to contribute to the establishment of standardized flight parameters and enhance the credibility of drone-generated evidence in road accident investigations.
The remainder of this paper is structured as follows: Section 2 overview of the flight parameters. Section 3 details the research methodology, including experimental setup, data collection, and accuracy evaluation procedures. Section 4 presents the empirical results derived from RMSE analysis. Section 5 discusses the implications of the findings in light of practical UAV deployment strategies. Finally, Section 6 offers conclusions and recommendations for future implementation.

2. Literature Review

Various mission planning choices influence accurate 3D reconstruction through UAV photogrammetry. Among these, flight altitude, camera angle, and image overlap are the three most impactful parameters in determining the geometric accuracy and spatial completeness of resulting models [22,25,30]. This section reviews the current literature and theoretical understanding of these parameters to guide experimental design.

2.1. Flight Altitude

A UAV’s flight altitude is a critical factor influencing the Ground Sampling Distance (GSD), which directly affects the spatial resolution and accuracy of UAV-derived 3D models. Lower altitudes result in finer GSD, thereby enabling greater detail capture and improved precision in surface modeling and point cloud generation [30,31]. Several studies have demonstrated the benefits of low-altitude flights. For instance, Zulkifli and Tahar [32] tested two flight techniques (Point of Interest (POI) and Waypoint) at altitudes of 5, 7, and 10 m. While all configurations yielded similar outcomes, the best result (RMSE of 0.040 m) was achieved with the POI technique at 5 m. Similarly, Seifert et al. [25] found that lower altitudes, especially when paired with high image overlap, produced the most detailed reconstructions and highest spatial accuracy. Udin and Ahmad [20] explored stream mapping using small-format UAVs and reported sub-meter accuracy even at higher altitudes. However, they emphasized that lower altitudes offered noticeable improvements in absolute accuracy. Korumaz and Yıldız [33] further confirmed this by showing a consistent decline in positional accuracy as flight altitude increased, based on comparisons of orthophotos and digital surface models (DSMs). Interestingly, not all findings support the lowest altitude as the most optimal. Santos Santana et al. [17] found that among the altitudes of 30 m, 60 m, 90 m, and 120 m, the 60 m flight offered the best operational efficiency, balancing flight duration, number of images, and spatial resolution. This was attributed to a favorable interplay between the sensor’s focal length, survey area size, and altitude.
However, very low altitudes can present challenges, such as reduced coverage per image, increased flight duration due to the need for more images, and possible occlusions from terrain or urban clutter. On the other hand, higher altitudes enhance area coverage and mission efficiency but may lead to reduced accuracy due to coarser resolution and fewer image tie points [34,35,36]. Therefore, identifying an optimal flight altitude is essential. Several studies suggest that flying at 20–30 m provides a good compromise between spatial accuracy and coverage, particularly in applications such as crash scene reconstruction [29]. Achieving a balance among accuracy, efficiency, and operational constraints remains a core challenge in UAV photogrammetric planning.
While several studies advocate low-altitude flights for maximum accuracy due to finer GSD, others emphasize moderate altitudes to balance efficiency and coverage. This inconsistency highlights a research gap regarding the optimal altitude for forensic-grade accident reconstructions, where both accuracy and operational feasibility must be achieved simultaneously.

2.2. Camera Angle

Traditionally, aerial mapping relies on nadir images (camera pointing vertically downward), which are effective for creating orthophotos but often fall short in capturing vertical structures, surface contours, or obstructed features, particularly in accident scenes with vehicles, barriers, or signage. These limitations may lead to systematic geometric distortions such as doming or flattening effects in the point cloud [5]. To address this, oblique imagery, where the camera is angled between 45° and 75° from the vertical axis, has emerged as a superior approach for capturing both horizontal and vertical surfaces [37]. UAV-based photogrammetry that integrates both nadir and oblique imagery proves highly effective for detailed monitoring of complex environments, especially when repeatability and spatial accuracy are required. Research shows that combining vertical and off-vertical captures significantly improves the geometric precision of reconstructed models, particularly along sharp edges and vertical discontinuities [38,39]. Oblique views increase the angular diversity of image data, which in turn enhances tie-point generation and surface definition during Structure-from-Motion (SfM) and Multi-View Stereo (MVS) reconstruction [14]. This is particularly beneficial in forensic applications where accurate edge delineation of vehicles, road markings, and surrounding features is critical. Moreover, recent studies confirm that including oblique images improves the density and structural realism of the 3D point cloud, especially when combined with circular or multi-axis flight paths [1].
However, a trade-off exists: increasing obliqueness may reduce the consistency of features matching across overlapping images and require more advanced flight planning to avoid occlusions and maintain sufficient coverage. Therefore, selecting an optimal camera angle is crucial. Empirical evidence suggests that moderate oblique angles, typically in the range of 60° to 75°, strike a balance between geometric fidelity and operational feasibility, making them ideal for reconstructing complex road crash environments with high detail and minimal error [29].
Although oblique imagery improves vertical feature capture, there is disagreement on the optimal degree of tilt, with some studies recommending nadir-heavy missions while others suggest mixed oblique strategies. This controversy underscores the need for controlled experiments that systematically evaluate angle effects under real crash-scene conditions.

2.3. Image Overlap

Image overlap coverage shared between consecutive images in flight significantly influences the spatial accuracy, completeness, and geometric robustness of UAV photogrammetric models. Higher overlap facilitates better tie-point redundancy, which improves the reliability of Structure-from-Motion (SfM) and Multi-View Stereo (MVS) reconstructions. This leads to denser point clouds and smoother surface geometry. Empirical studies consistently show that increasing overlap dramatically reduces reconstruction error. For example, Seifert et al. [25] conducted controlled forest flights varying overlap and altitude. They found that 80% forward and side overlap yielded the best RMSE values (~0.04 m), whereas lower overlap rates resulted in considerable accuracy loss [40,41]. Their study highlighted that accuracy gains diminish beyond approximately 85% overlap, indicating a practical threshold. Similarly, a study on canopy mapping over Pinus radiata plantations demonstrated that 90% forward and 85% side overlap at 120 m altitude produced optimal spatial fidelity compared to lower overlap combinations [42]. This finding reinforces the notion that high overlap is essential, particularly in complex environments where occlusions and texture variability may hinder reconstruction. Conversely, insufficient overlap below 60% has been shown to lead to fragmented point clouds, gaps in surface data, and degraded RMSE performance [25,40]. Therefore, while higher overlap increases flight duration, data storage requirements, and processing load, aligning overlap with mission objectives and environmental complexity is vital. As demonstrated by Liu et al. [43], an image overlap of at least 60% is essential to ensure sufficient feature matching, robust tie-point generation, and high-density point clouds. In contrast, Nadir outperforms oblique imagery point cloud in the orthomosaic. Accordingly, for 2D analyses, nadir imagery alone is sufficient, as combining nadir and oblique angles produces results virtually identical to nadir-only datasets [44].
High image overlap plays a critical role in ensuring reconstruction integrity. Although overlaps exceeding 80% can enhance model reliability, they also increase flight duration and data processing requirements [1]. Recent studies suggest that maintaining overlap rates between 70% and 80% offers an effective balance between image redundancy and modeling accuracy, particularly in crash scene reconstructions where high spatial fidelity is essential [29]. Similarly, Jiménez-Jiménez et al. [45] recommend forward overlaps of 70–90% and side overlaps of 60–80%. Moreover, as flight altitude decreases, the required overlap should approach the upper limits of these ranges to compensate for reduced ground coverage and to preserve geometric consistency in the resulting models.
While higher overlaps consistently improve spatial fidelity, practical trade-offs in flight duration and data volume remain unresolved. This methodological gap underscores the need to define overlap thresholds that strike a balance between accuracy and operational resource utilization.

2.4. Summary of Flight Parameters

Prior studies have extensively examined the influence of flight altitude, camera angle, and image overlap on the accuracy of UAV-based photogrammetry. While many studies provide valuable insights, the findings are often fragmented, with individual parameters analyzed in isolation. To establish a more unified framework, it is essential to compare these parameters systematically in relation to reconstruction accuracy and point cloud quality. Table 1 synthesizes representative studies, highlighting the flight configurations tested, reported accuracies, and key conclusions.
As shown in Table 1, lower altitudes, nadir imagery, and higher overlaps consistently improve reconstruction accuracy, though often at the expense of flight duration and processing demands. Conversely, higher altitudes and oblique imagery may enhance efficiency or capture vertical features but typically reduce accuracy in the orthomosaic. These trade-offs highlight the need for systematic evaluation under controlled conditions, which forms the core objective of this study.
In summary, the overview of all three parameters is evident that each plays a crucial role in determining 3D model accuracy. Their combined influence provides a strong foundation for the experimental design and the development of practical recommendations.

3. Methodology

This study was designed to experimentally evaluate the influence of UAV flight parameters, namely flight altitude, camera angle, and image overlap, on the spatial accuracy of 3D models for reconstructing road accident scenes. The overall methodology was structured to ensure scientific rigor, repeatability, and direct relevance to practical photogrammetric applications.
The research process followed a sequential workflow as illustrated in Figure 1, beginning with a literature review to establish theoretical foundations in UAV photogrammetry and image processing. This informed the experimental design, which involved setting up a controlled site, defining flight paths, and configuring drone parameters using pre-programmed mission planning software. Data collection involved capturing aerial imagery under 27 unique flight configurations, followed by data correction and processing in Agisoft Metashape to generate 3D models. Quantitative analysis was conducted by measuring linear distances within the models and comparing them to ground-truth references obtained from total station and tape-based field surveys. Root Mean Square Error (RMSE) was calculated for each model as an indicator of spatial accuracy. A Wilcoxon rank-sum test checks whether a parameter is significant. The findings were then statistically compared across different parameter combinations.
The following sections detail the experimental design, equipment, data collection procedures, model generation, and evaluation techniques used in the study.

3.1. Research Design

This study employed an experimental design to systematically evaluate the influence of UAV flight parameters, namely flight altitude, camera angle, and image overlap, on the spatial accuracy of 3D reconstructions. The research approach was guided by best practices in UAV [5,14,16,43,47,48]. The flight altitudes of 30 m, 45 m, and 60 m were selected based on prior UAV photogrammetry research and practical operational constraints. These ranges are commonly adopted in crash scene documentation as they balance ground sampling distance (GSD) and coverage efficiency. Flying below 30 m results in very fine resolution but limited coverage, requiring excessive flights, while altitudes above 60 m substantially degrade spatial precision. A total of 27 3D models were generated using Agisoft Metashape Professional [49,50], each corresponding to a unique combination of three flight altitudes (30, 45, and 60 m), three camera angles (90°, 75°, and 60°), and three image overlap percentages (60%, 70%, and 80%).

3.2. UAV Equipment

The UAV platform used was a DJI Phantom 4 Pro V2, featuring a 1-inch 20-megapixel CMOS sensor and a mechanical shutter. Flight missions were planned and executed using DJI Go4 and Ground Station Pro (GS Pro) applications. Key flight configuration settings included:
  • Shooting Angle: Course Aligned;
  • Capture Mode: Hover and Capture at Point;
  • Flight Course Mode: Inside Mode.
These settings were selected to maintain a consistent orientation and ensure dense coverage of the surveyed area, both of which are essential for high-quality photogrammetric reconstruction.

3.3. Study Area and Ground Control

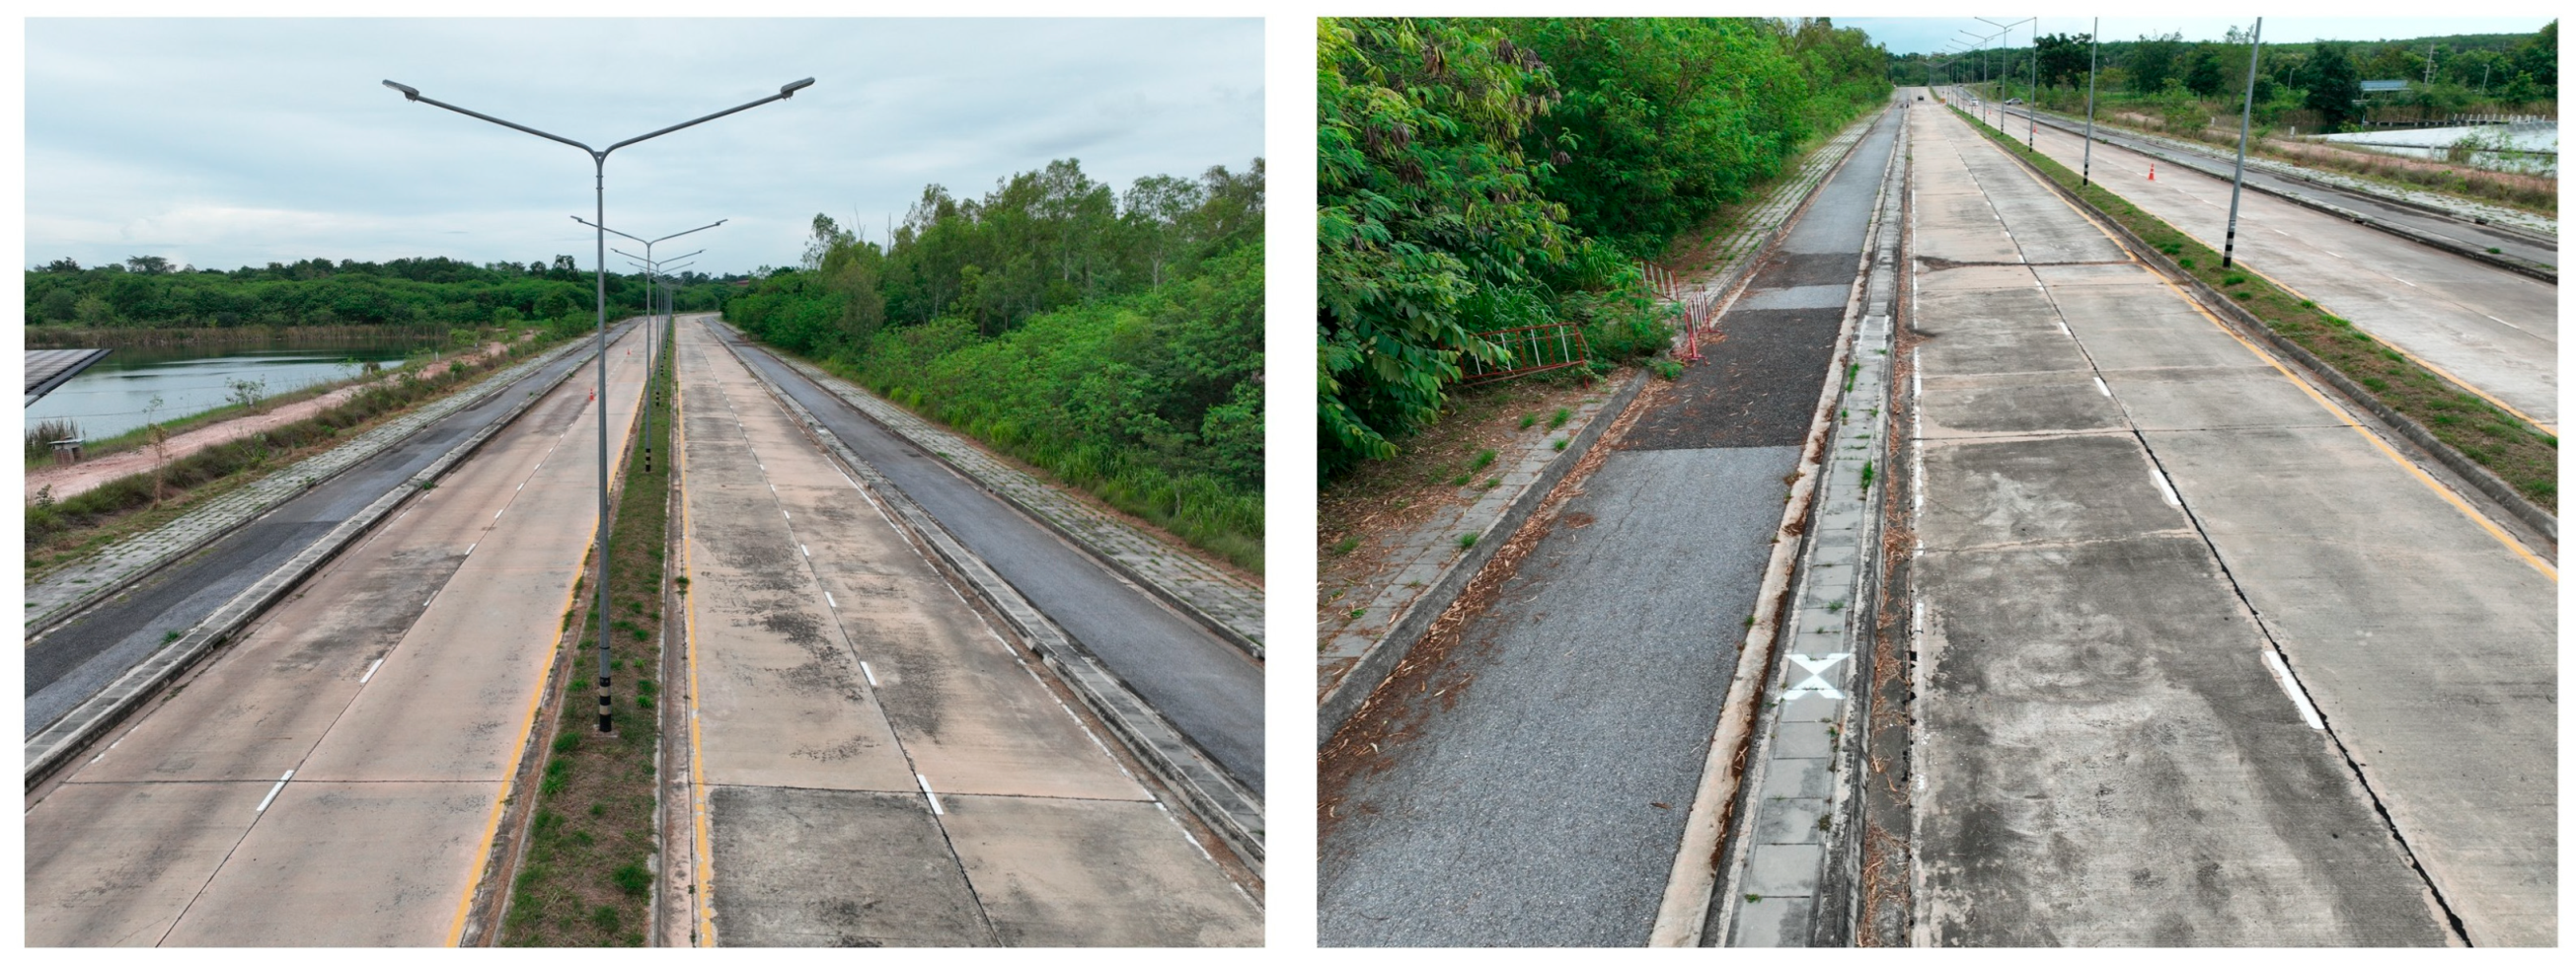
The experimental flight site was selected to resemble actual road environments, as shown in Figure 2. Unlike a controlled laboratory setting, the area contained typical urban roadside elements such as trees, light poles, and uneven surfaces, which introduced realistic obstructions and shadows that often occur in actual crash scenes. This setting enabled a more practical assessment of how UAV flight parameters perform under field conditions, where occlusions and varying elevations are present.
Within the study area, a total of 10 linear horizontal distances were established as shown in Figure 3. The arrows represent the measured ground control point (GCP) distances (L1–L10), where L1 = skid mark, L2, L3 = distance between light poles, L4, L5 = width and length of the asphalt concrete used for road repair, L6, L7 = lane and road direction width, L8 = length of the lane marking dash and L9, L10 = length and diagonal of the cement slab. These distances provided varied geometric baselines for evaluating Road Accident Scene Documentation accuracy and were carefully measured using a total station and steel tape to ensure centimeter-level accuracy. The ground-truth measurements were later used to evaluate the accuracy of the 3D models produced from UAV photogrammetry.

3.4. Data Collection and Image Acquisition

For each of the 27 UAV flight configurations, aerial imagery was captured under stable weather conditions (clear sky, low wind speed) using automated flight paths pre-programmed in DJI Ground Station Pro. The configurations varied across three flight altitudes (30, 45, and 60 m), three camera angles (90°, 75°, and 60°), and three image overlap percentages (60%, 70%, and 80%).
All flights were conducted under stable meteorological conditions, with wind speeds below 5 km/h and clear sky illumination to minimize shadowing effects. To enhance reproducibility, three repeated flights were carried out for selected configurations, and the averaged results are reported.
Images were captured using the DJI Phantom 4 Pro V2 camera system. The photographs were stored in JPEG format at a resolution of 5280 × 3956 pixels with a bit depth of 24 bits, and a horizontal/vertical resolution of 96 dpi. The sRGB color space was used for all images, ensuring color consistency and compatibility with photogrammetric processing software. The resolution unit was set to 2 (inch-based), and image compression was applied automatically by the camera firmware. These specifications were selected to maintain radiometric detail and spatial fidelity suitable for 3D reconstruction.
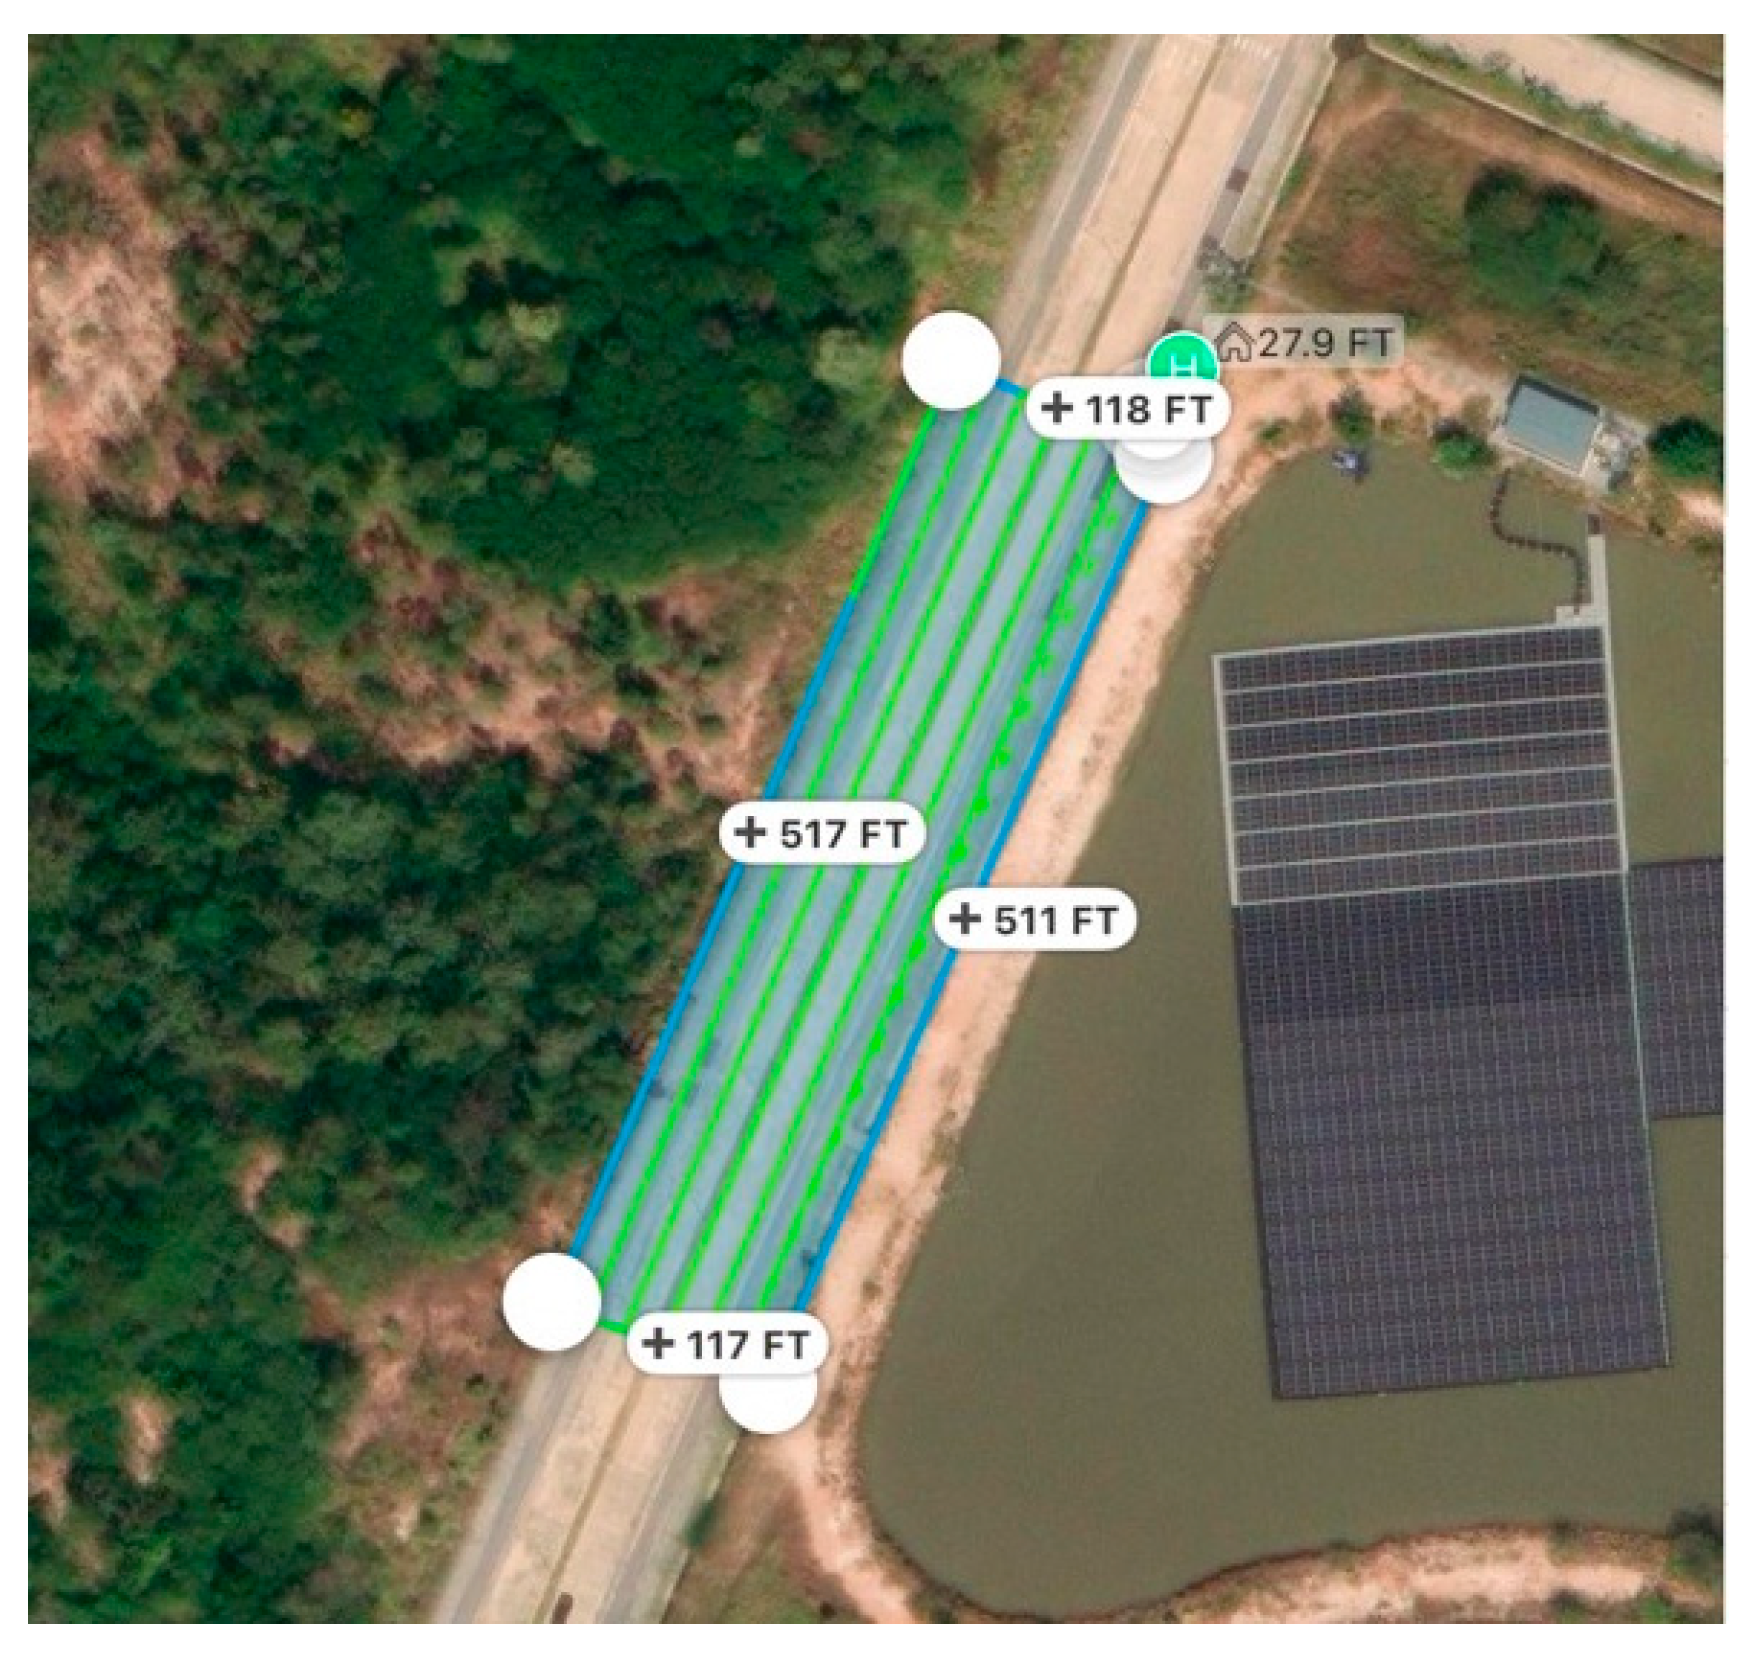
Each of the 27 flight missions, conducted over a 1.39-acre area, was executed using automated flight paths planned via DJI Ground Station Pro (GS Pro) as shown in Figure 4. Flight parameters, including altitude, camera angle, and image overlap, were pre-set in the mission planner before launch. The drone followed a grid-based flight path that ensured consistent coverage of the survey area according to the specified overlap settings.
After each flight, the images were transferred to a high-performance workstation for further processing. Alongside image capture, flight duration and number of images per flight were recorded. These metrics were later correlated with reconstruction accuracy to evaluate the impact of different flight parameters.
To ensure reliable accuracy assessment, artificial markers with known ground-truth horizontal distances were placed at ten control sites across the test area. Measurements between these markers were recorded using a total station and a steel measuring tape for use in post-reconstruction RMSE calculations.

3.5. Three-Dimensional Model Generation and Accuracy Assessment

The aerial imagery from each flight configuration was processed in Agisoft Metashape Professional (v2.0) to generate 3D models. Processing was carried out with consistent parameters across all 27 configurations: high-density point cloud generation, mesh reconstruction using the arbitrary surface method, texture mapping enabled, and tie-point accuracy set to high. Dense cloud processing employed the Structure-from-Motion (SfM) and Multi-View Stereo (MVS) algorithms. To enhance reliability, outliers were removed through gradual selection based on reprojection error, applying a 3σ deviation threshold before RMSE calculation. These standardized procedures ensure that the workflow is reproducible and that spatial accuracy evaluations are not biased by spurious points.
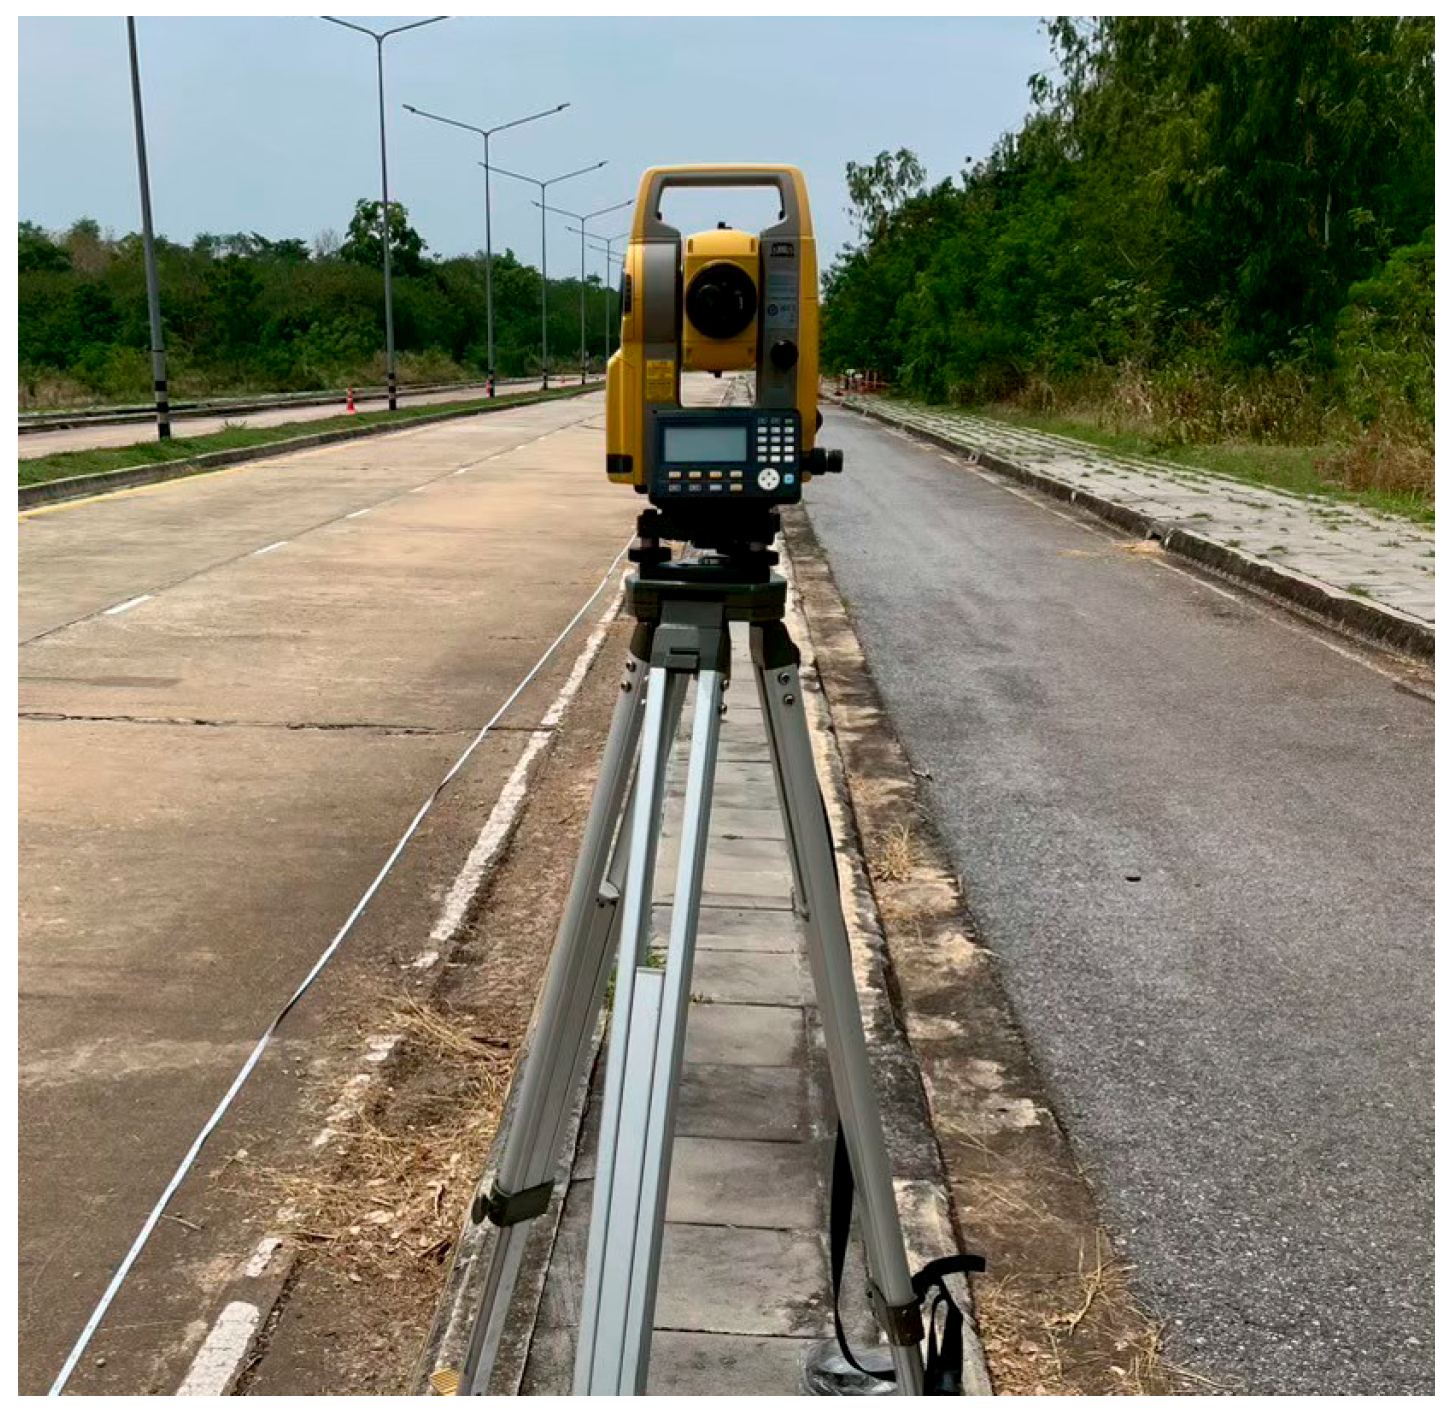
After generating the 3D models, linear distances between predefined ground control points were measured within each reconstructed model. These measurements were then compared to the actual reference distances obtained using a total station (Figure 5) and tape-based surveys. A total of 10 ground-truth distances were used for each model, resulting in 270 distance comparisons across all 27 configurations, as shown in Table 2. These values were used to compute the Root Mean Square Error (RMSE) for each configuration, which served as the primary indicator of spatial accuracy.
To assess the accuracy of each model, linear horizontal distances between reference points in the 3D environment were measured and compared with the corresponding ground-truth distances recorded at the 10 test sites. The difference between model measurements and actual measurements was quantified using the Root Mean Square Error (RMSE) [51], calculated in centimeters using the formula:
R M S E = [ ( 1 / n ) × Σ ( P i O i ) 2 ]
where Pi is Predicted distance from the 3D model, Oi is Observed (ground-truth) distance and n is Number of measured distances.

3.6. Statistical Comparison Using Wilcoxon Rank-Sum Test

To statistically compare the spatial accuracy between flight configurations with varying parameters, the Wilcoxon rank-sum test (Mann–Whitney U test) [52] was employed. This non-parametric test was chosen due to its robustness when normality assumptions are violated and small sample sizes are involved. The test evaluates whether the RMSE distributions from different groups (e.g., low vs. high overlap, nadir vs. oblique angle, and low vs. high altitude) originate from the same distribution. Statistical significance was determined at a 95% confidence level (p-value < 0.05). The hypotheses for the statistical tests were as follows:
H0: 
The median RMSE between two experimental conditions is equal.
H1: 
The median RMSE between two experimental conditions is not equal.

4. Results

4.1. Overview of Model Generation

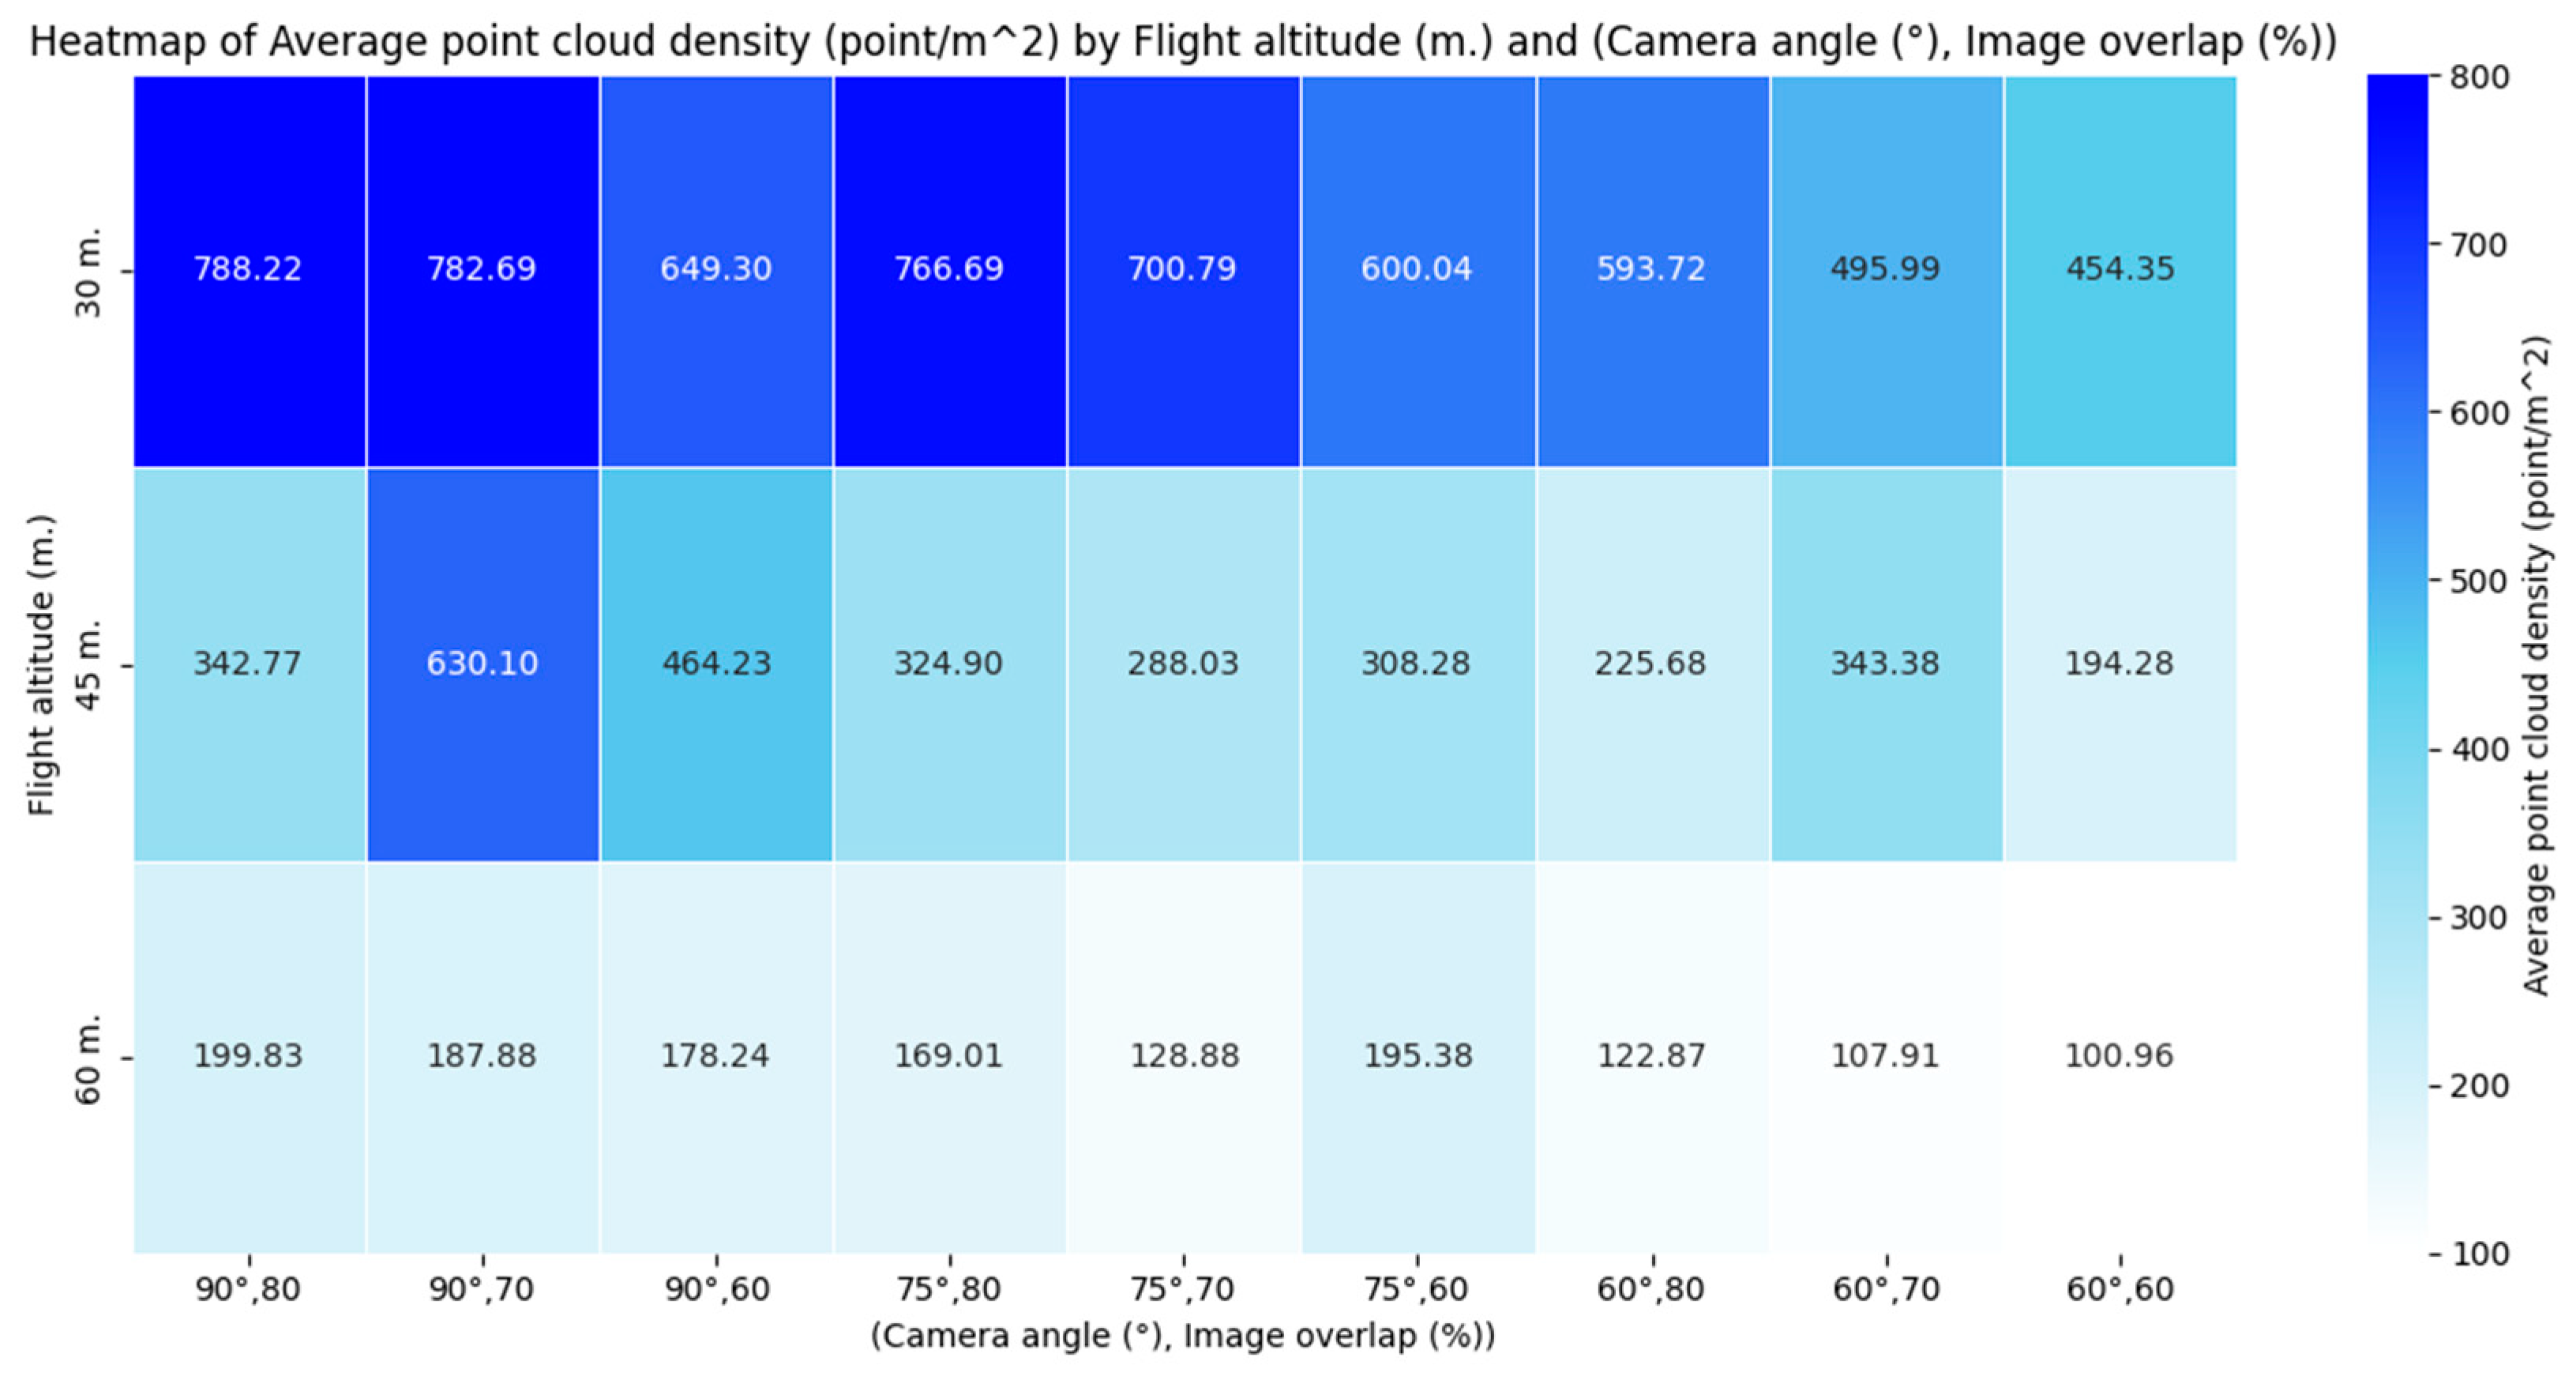
The experiment produced 27 distinct 3D models generated under different flight parameter configurations. Figure 6 illustrates the variation in average point cloud density across altitude, camera angle, and image overlap settings. The highest density was obtained at 788.22 points/m2 using a flight altitude of 30 m, a nadir angle of 90°, and 80% overlap, as shown in Figure 7a, where the model exhibits a dense and detailed point distribution. In contrast, the lowest density, 100.96 points/m2, occurred at 60 m altitude, a 60° camera angle, and 60% overlap, with Figure 7b depicting the noticeably sparse point distribution.
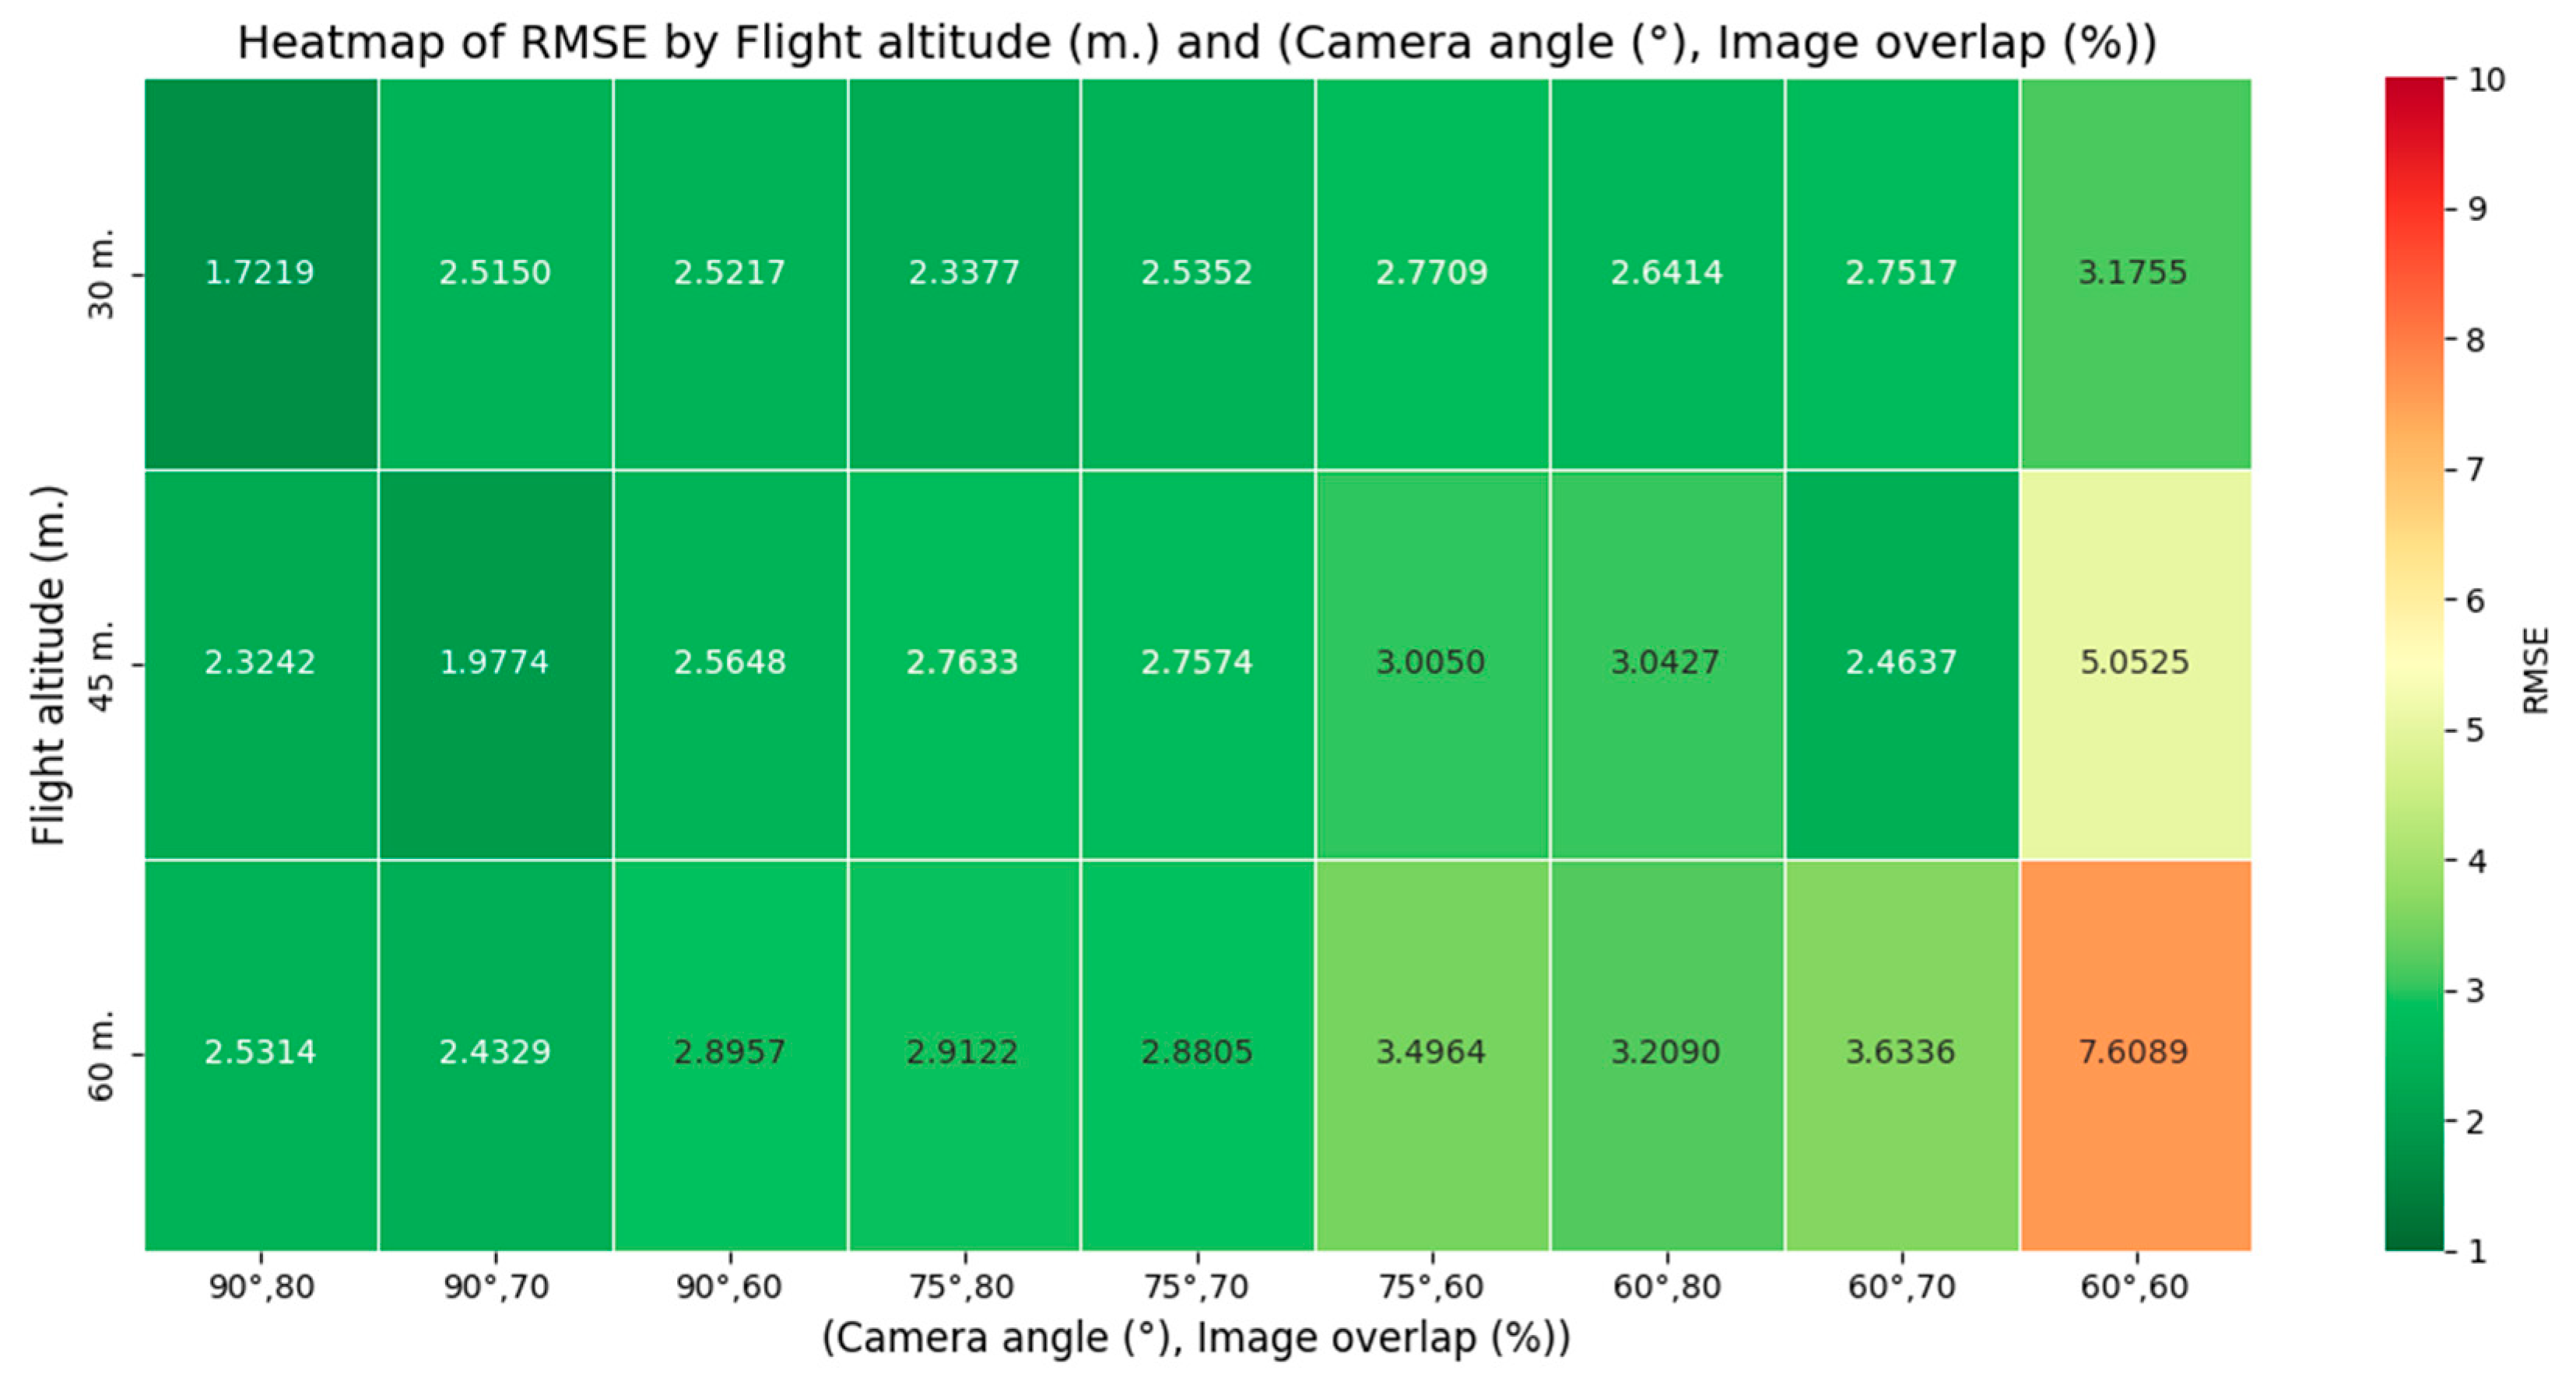
Figure 8 shows that the RMSE values ranged from 1.72 cm to 7.61 cm, indicating substantial variability in model accuracy depending on the selected height, camera angle, and overlap. This section analyzes the influence of each parameter individually to determine optimal configurations for road accident reconstruction using UAV photogrammetry.
The experimental results highlight the significant influence of drone flight parameters on the geometric accuracy of 3D reconstructions. The configuration with the lowest RMSE of 1.72 cm was achieved using a flight altitude of 30 m, a camera angle of 90°, and 80% image overlap, consistent with optimal settings found in previous UAV mapping studies [1,14,29]. Lower altitudes and higher overlaps contributed to improved accuracy by increasing ground resolution and enhancing feature matching during photogrammetric processing [1,35,53]. These insights support standardization efforts for operational guidelines in UAV-based accident documentation.
While the heatmap (Figure 8) provides a visual representation of the variation in RMSE across parameter combinations, statistical significance cannot be directly annotated on this figure because the Wilcoxon rank-sum test requires comparisons of distributions from multiple models. Therefore, the formal significance results are presented separately in later section (Section 4.6), which identifies the specific parameter pairings with statistically significant differences.
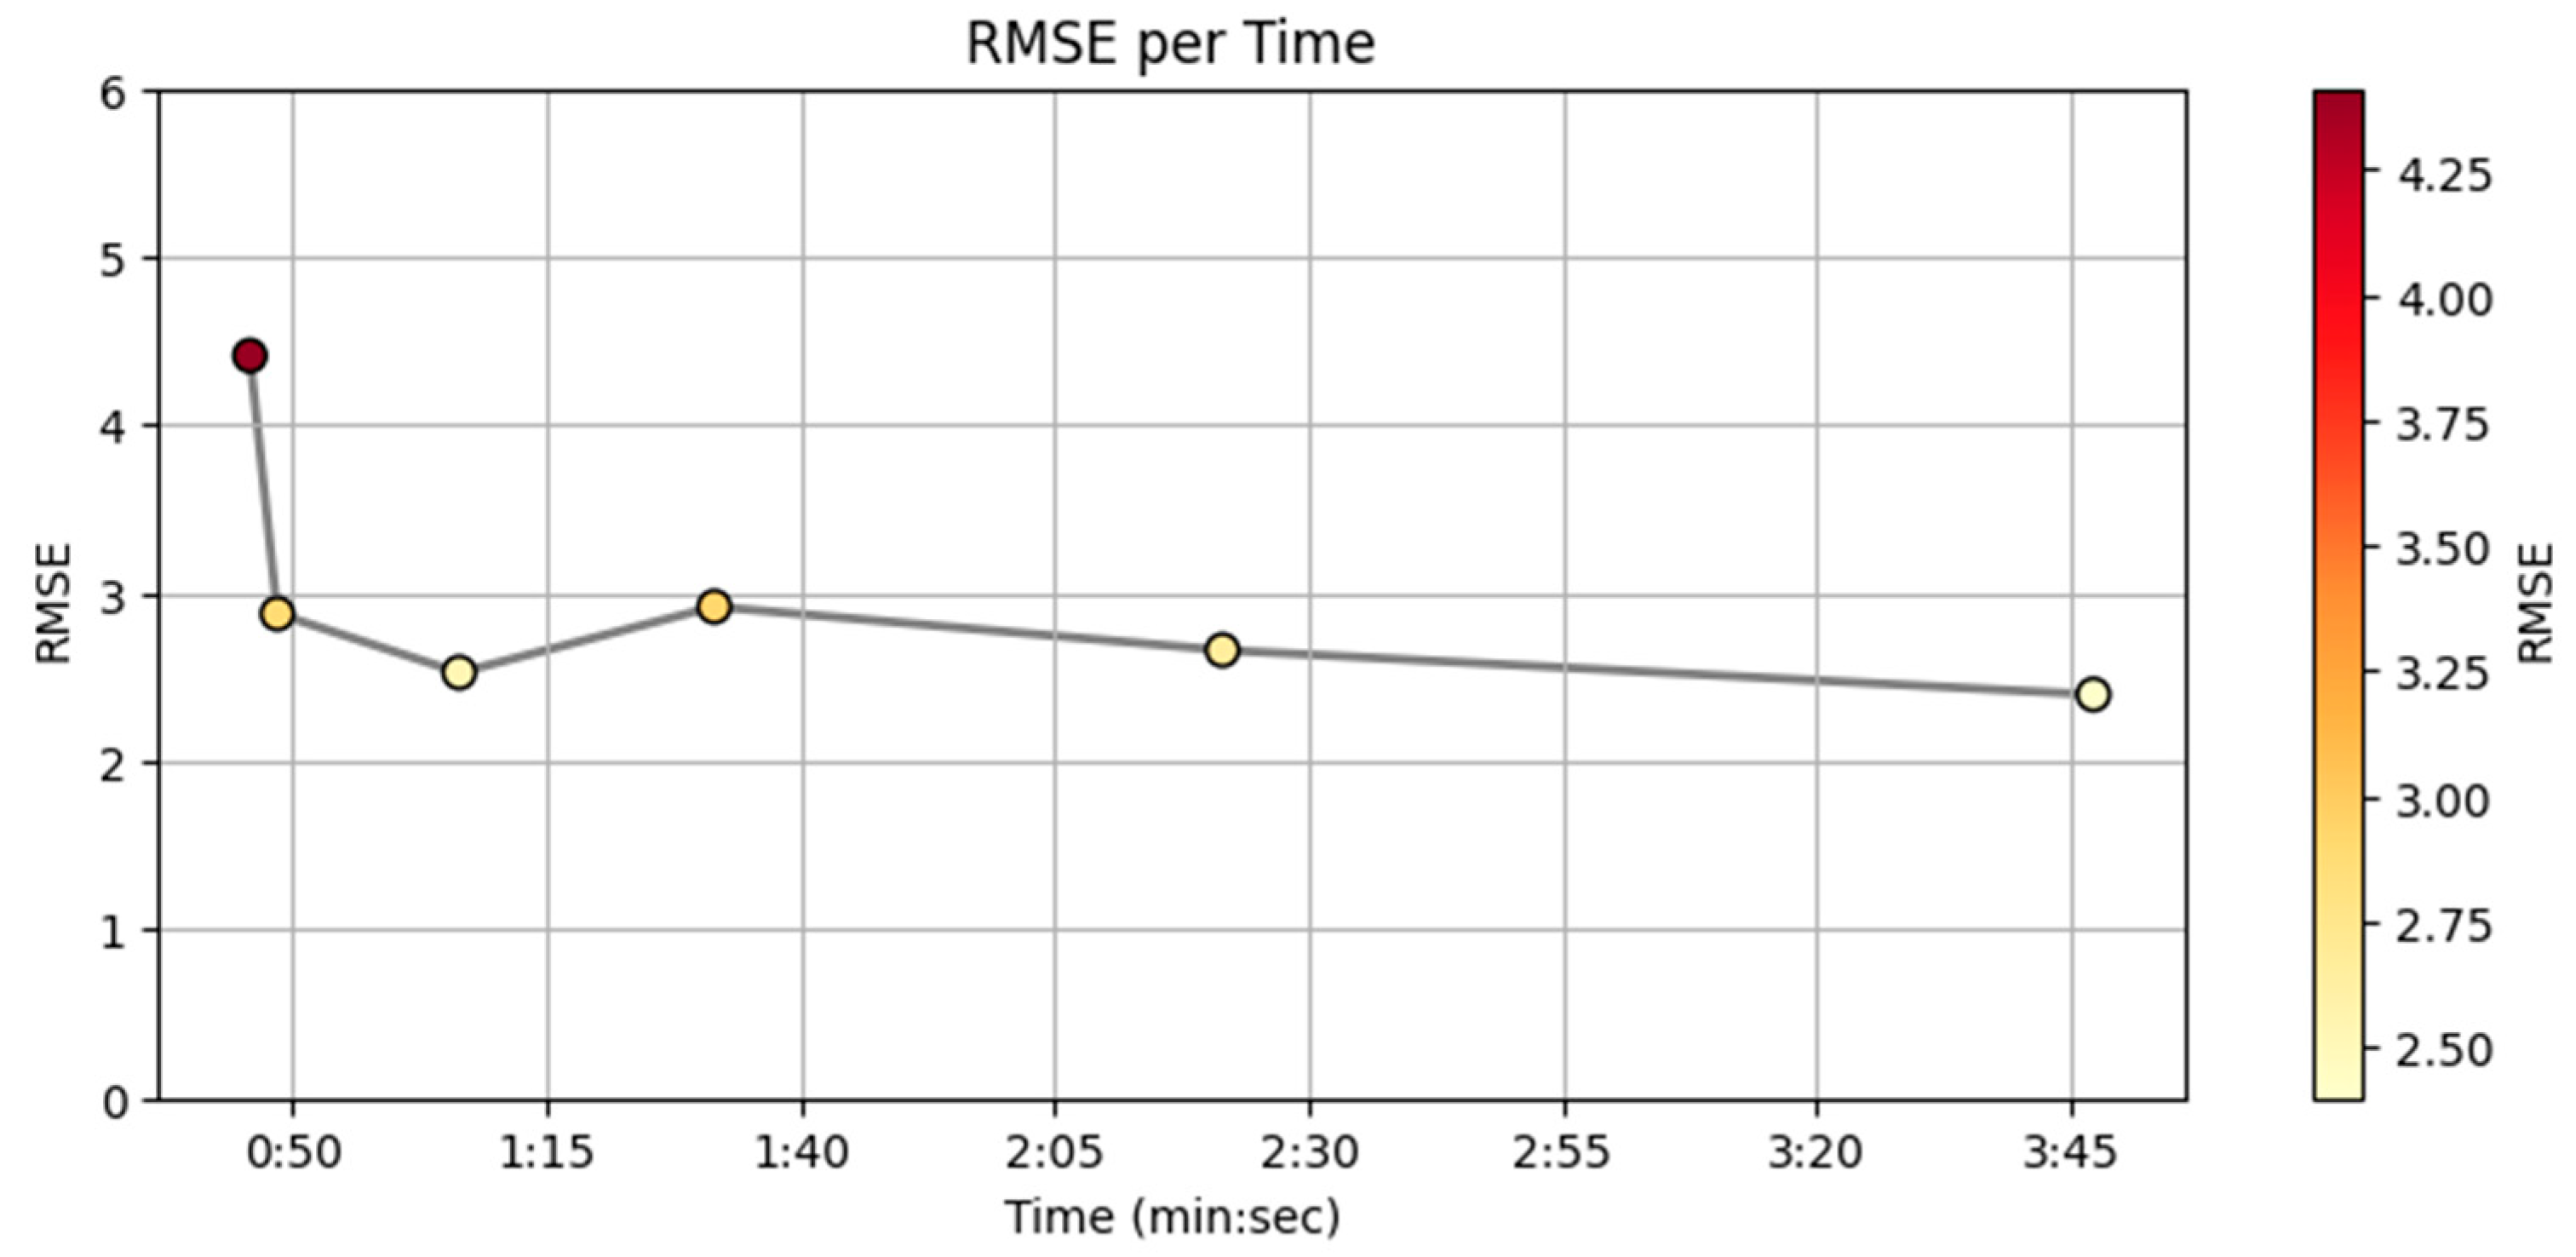
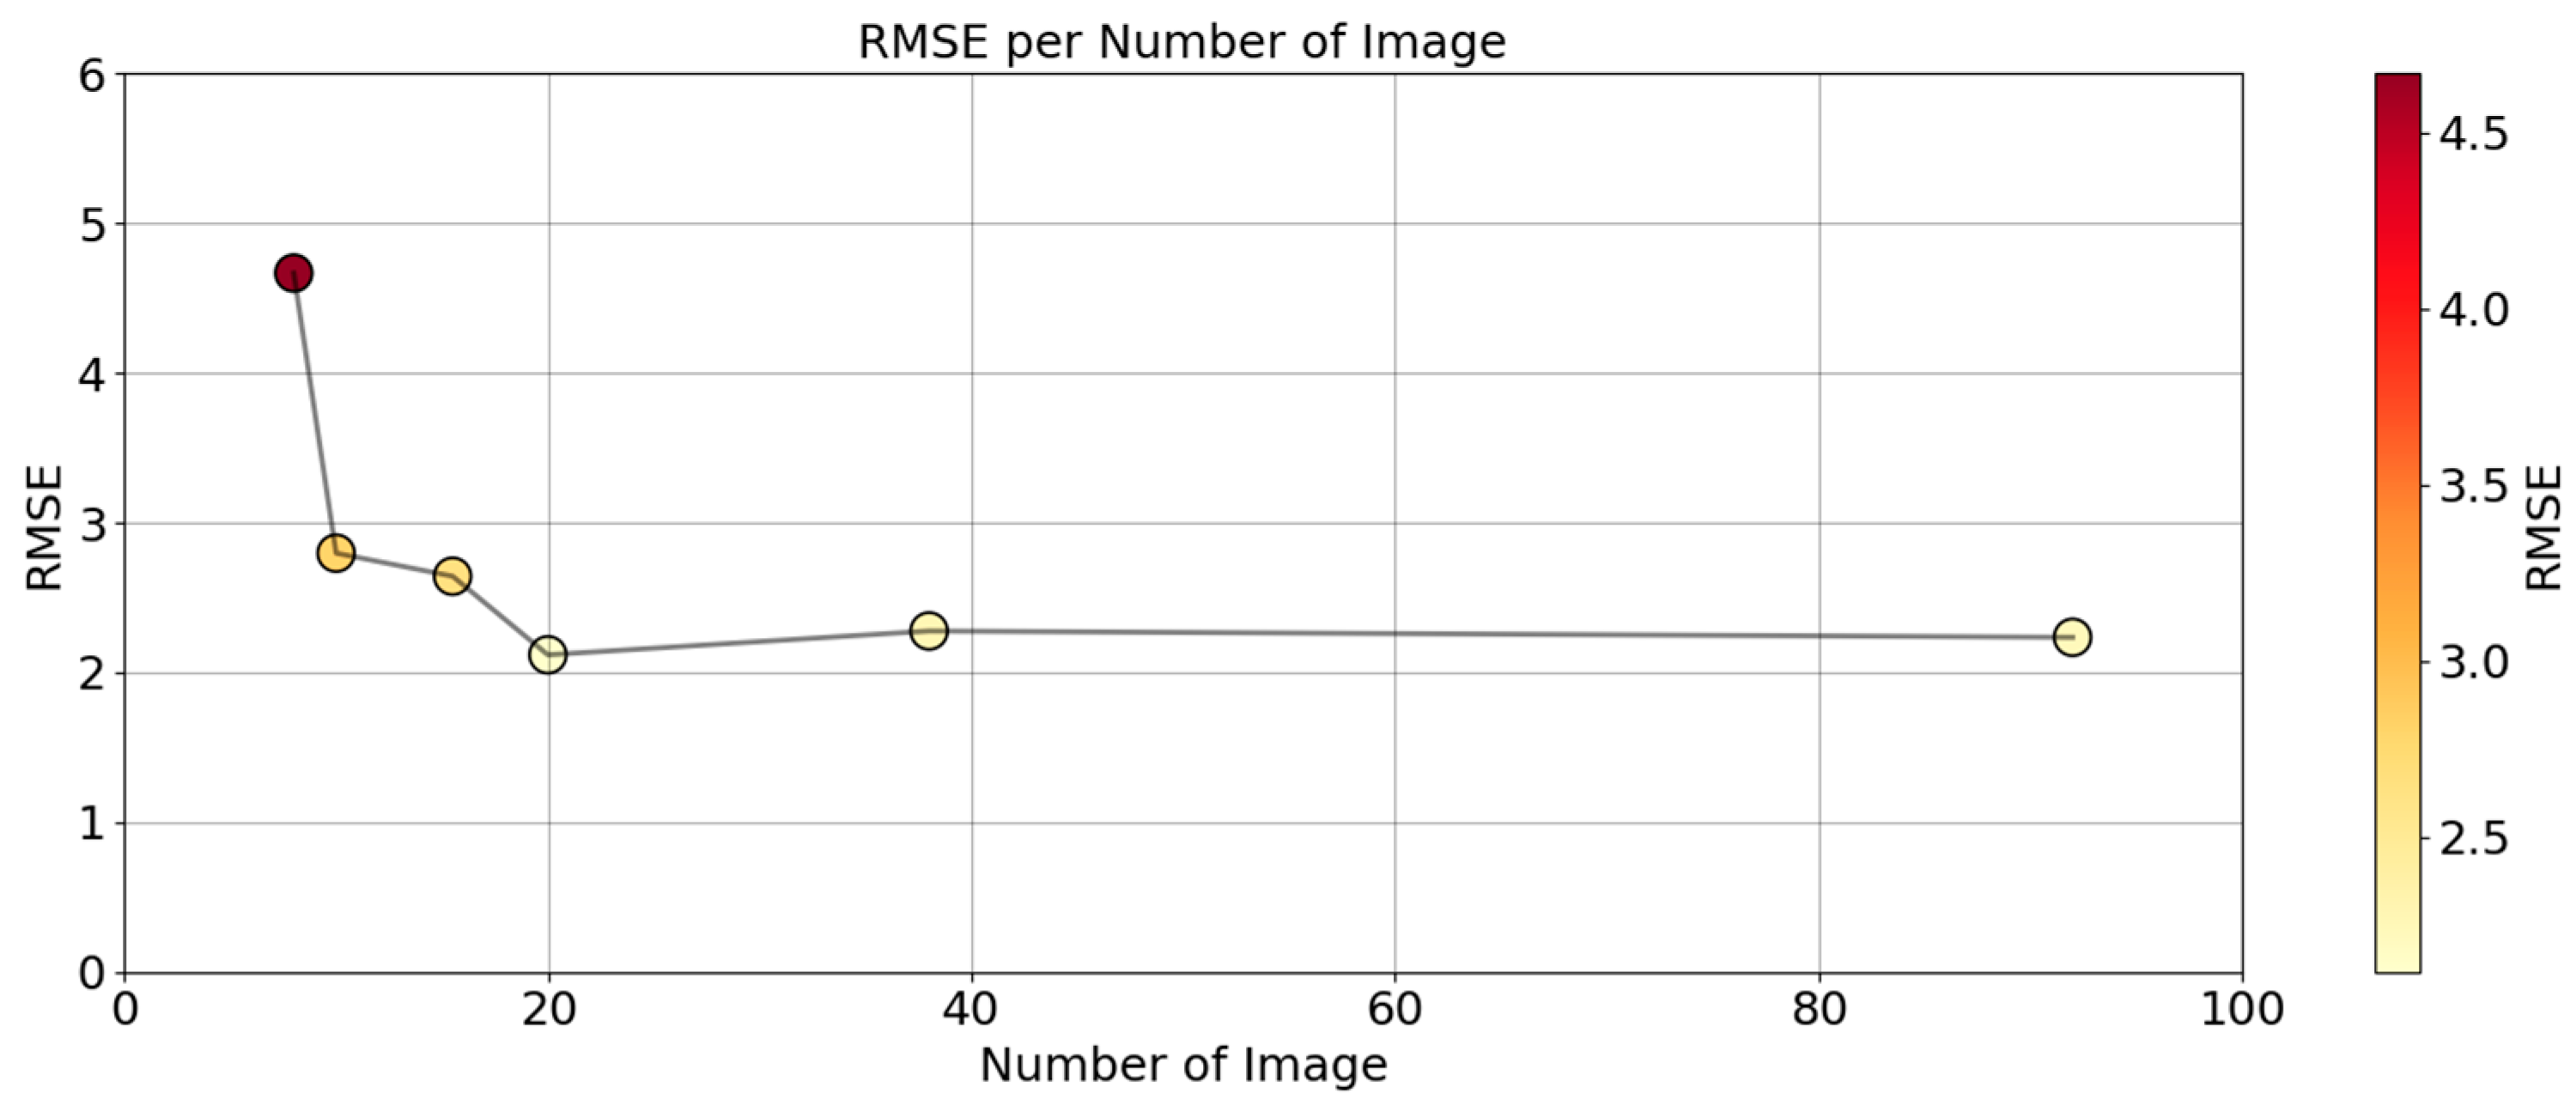
Flight duration and number of photographs emerged as key enablers of model accuracy. Lower RMSE values were strongly correlated with longer flight durations and higher numbers of overlapping photographs, particularly under configurations involving lower altitudes and higher image overlaps. For example, the configuration yielding the best RMSE of 1.72 cm. involved a 30 m altitude, 90° camera angle, 80% image overlap, a flight duration of approximately 5 min (Figure 9), and around 92 photos (Figure 10). This rich dataset allowed for superior keypoint matching and dense point cloud generation in Agisoft Metashape.

4.2. Results of Flight Altitude

This experiment tested three flight altitude levels: 30, 45, and 60 m. For each altitude, nine flights were conducted under varying camera angles and image overlap percentages. At 30 m, the configuration of angle = 90° and image overlap = 80% produced the lowest RMSE value of 1.722, whereas the configuration with angle = 75° and image overlap = 60% yielded an RMSE of 2.771. At 45 m, the configuration of angle = 90° and overlap = 80% achieved an RMSE of 2.324, while configurations with 60% overlap produced higher RMSE values, including 2.565, 3.005, and 5.053 for angles of 90°, 75°, and 60°, respectively. At 60 m, the best-performing configuration (90°, 80% overlap) resulted in an RMSE of 2.531, whereas the poorest-performing setup (60°, 60% overlap) reached 7.609, the highest RMSE recorded in the experiment.
Overall, the results indicate that lower altitudes, higher overlaps, and nadir imagery (90°) consistently produce more accurate reconstructions, while higher altitudes, reduced overlaps, and oblique angles are associated with greater RMSE values.

4.3. Results of Camera Angle

The experiment tested three camera angle settings: 90°, 75°, and 60°, each under different flight altitudes and image overlap percentages. Results showed that the 90° angle at 30 m altitude with 80% overlap achieved the lowest RMSE of 1.722. In contrast, at 60 m altitude with 60% overlap, the same 90° angle produced a higher RMSE of 2.896. For the 75° angle, the best result was obtained at 30 m altitude with 80% overlap, yielding an RMSE of 2.338, while the poorest result occurred at 60 m altitude with 60% overlap, where the RMSE increased to 3.496. With a 60° angle, the lowest RMSE was recorded at 60 m altitude and 70% overlap (2.464), whereas the highest RMSE of the experiment (7.609) occurred at 60 m altitude with 60% overlap.
Overall, the results indicate that nadir imagery (90°) consistently produces the highest accuracy, especially when combined with lower altitudes and higher overlaps. Oblique angles (75° and 60°) generally resulted in higher RMSE values, particularly under conditions of greater altitude and reduced overlap, underscoring the sensitivity of reconstruction accuracy to both camera orientation and image redundancy.

4.4. Results of Image Overlap

This section explores three image overlap settings: 80%, 70%, and 60%, each tested under different altitudes and camera angles. At 80% overlap, the lowest RMSE of 1.722 was obtained at 30 m altitude with a 90° camera angle, while at 60 m altitude and a 60° angle, the RMSE increased to 3.209. For the 70% overlap setting, the minimum RMSE of 2.522 was observed at 30 m with a 90° camera angle, whereas the highest RMSE of 3.634 occurred at 60 m with a 60° angle. With 60% overlap, the lowest RMSE of 1.977 was achieved at 45 m with a 90° angle, while the poorest result was again at 60 m and a 60° angle, producing the maximum RMSE of 7.609 across all experiments.
Overall, the results show a clear trend: higher image overlaps consistently reduce RMSE and improve reconstruction accuracy, while lower overlaps, particularly when combined with higher altitudes and oblique angles, substantially increase RMS.

4.5. Relationship Between Number of Photographs, Flight Duration, and RMSE

This section explores how the number of photographs captured and the total flight duration correlate with the spatial accuracy of the resulting 3D models, measured using Root Mean Square Error (RMSE). Across all 27 UAV flight configurations, it was observed that denser image capture, defined by a greater number of photographs and extended flight durations, generally resulted in lower RMSE values.
For instance, the configuration with the lowest RMSE of 1.722 cm was achieved at a 30 m flight altitude, using a camera angle of 90° and 80% image overlap, which also resulted in the longest flight duration (4 min 44 s) and the highest number of photographs (92 images). This indicates that comprehensive image coverage and minimal gaps between image captures significantly enhance model accuracy.
In contrast, the highest RMSE of 7.609 cm was recorded at a 60 m flight altitude, with a camera angle of 60° and only 60% image overlap. This configuration produced just 8 images, with a flight duration of 45 s (the shortest of all flights). The limited image density and shorter acquisition duration contributed to reduced tie-point generation and lower reconstruction quality, leading to higher spatial errors.
These findings suggest a direct inverse relationship: as the number of images and flight duration increase, the RMSE tends to decrease. However, this comes with increased data volume and processing time. Therefore, selecting an optimal balance between image density and operational efficiency is essential, especially in actual forensic or surveying contexts where time and resources may be limited.

4.6. Results of Wilcoxon Rank-Sum Test

According to Figure 8, Table 3 shows that the Wilcoxon rank-sum test was conducted on nine parameter pairings (three comparisons each for altitude, camera angle, and image overlap) using R statistical software. At the 95% confidence level (Z-critical = ±1.96, p < 0.05), four of the nine comparisons yielded statistically significant differences in RMSE values. Specifically, within the altitude group, the comparison between 30 m and 60 m (Z = −2.252, p = 0.024) revealed that higher flight altitude significantly increased error, whereas the comparisons involving 45 m did not show significant differences. For the camera angle group, both 90° vs. 75° (Z = −2.517, p = 0.012) and 90° vs. 60° (Z = −2.958, p = 0.003) were significant, confirming that nadir images (90°) provide superior accuracy compared to oblique configurations. Within the overlap group, only the comparison between 80% and 60% (Z = −2.252, p = 0.024) was significant, indicating that increasing overlap from 60% to 80% reduces reconstruction errors, while the intermediate overlap level (70%) did not significantly differ from the others.

5. Discussion

The findings of this study clearly demonstrate that UAV flight parameters play a pivotal role in determining the geometric accuracy of 3D reconstructions. By systematically varying altitude, camera angle, and image overlap across 27 configurations, the results reveal consistent accuracy patterns while also highlighting inherent trade-offs between operational efficiency and spatial fidelity. This discussion interprets these outcomes in the context of existing literature, identifies potential error sources, and explores their implications for forensic and engineering practice. Rather than simply presenting numerical differences, it emphasizes how parameter choices influence the reliability of UAV-based accident documentation and outlines limitations and directions for future research.
Several external factors beyond flight parameters may also influence accuracy. For instance, lighting conditions significantly impact feature detection: “The calibration of non-metric cameras is sensitive to poor lighting conditions, which leads to the generation of a higher determination error for each intrinsic orientation and distortion parameter”—resulting in higher reprojection error and lower precision of tie points in dimly lit settings [54]. Additionally, UAV attitude instability and minor camera calibration errors can introduce distortions that degrade geometric accuracy, particularly in dynamic flight environments [55].

5.1. Influence of Flight Altitude

The analysis of RMSE values in Section 4.2 reveals a consistent trend: increased flight altitude leads to reduced spatial accuracy in 3D model reconstructions. Specifically, the average RMSE values rose from 2.30 cm at 30 m, to 2.79 cm at 45 m, and 3.37 cm at 60 m, clearly indicating that higher flight altitudes are associated with diminished geometric precision.
This observation aligns with prior UAV photogrammetry studies. For instance, Jiménez-Jiménez et al. [45] found that elevating flight altitude from 30 m to 60 m led to an increase in vertical RMSE, with accuracy degrading due to reduced ground sampling distance (GSD) and less detailed feature capture. Similarly, Seifert et al. [25] demonstrated that lower altitudes enhance tie-point density and model resolution, contributing to improved surface reconstruction fidelity. Nex and Remondino [14] also emphasized the critical impact of GSD on 3D reconstruction quality, recommending low-altitude flights for applications demanding high precision.
While flying at higher altitudes shortens flight duration and reduces the number of captured images, which are benefits particularly valuable for mapping extensive areas, such configurations are generally less suitable for forensic or accident reconstruction contexts where centimeter-level accuracy is often required. Therefore, a flight altitude of 30 m offers an optimal trade-off, balancing sufficient area coverage with the high spatial fidelity necessary for detailed documentation of features such as vehicle deformation, skid marks, or lane boundaries.

5.2. Influence of Camera Angle

Section 4.3 showed that camera orientation significantly affected spatial accuracy. At all altitudes, a 90° (nadir) angle consistently delivered the lowest RMSE values (for example, 1.722 cm at 30 m with 80% overlap), whereas more oblique angles like 75° and 60° generally produced higher errors, particularly under conditions of low overlap and greater altitude.
These results align with findings from UAV photogrammetry research, which highlight two key effects:
  • Reduction in geometric distortion: Including oblique imagery helps reduce systematic errors known as “doming” or “flattening,” especially when working with nadir-only imagery. Studies demonstrate that combining nadir and oblique images enhances reconstruction completeness and model geometry, particularly in areas with vertical structures or complex terrain [37,46];
  • Improved detail in vertical features: Off-nadir images (20–35° tilt) boost the accuracy of building façades and roadside vertical elements by approximately 10–20%, compared to nadir-only captures. Experiments across more than 150 flight scenarios confirm that hybrid image sets (combining nadir and oblique angles) significantly improve cm-level accuracy [53].
These insights suggest a balanced strategy: use predominantly nadir images for minimum distortion and worst-case RMSE, while supplementing with moderate oblique captures (around 30°) to capture structural context and reduce geometric errors. This hybrid approach aligns with your findings, where nadir angles produced optimal RMSE, and moderate oblique angles yielded improved vertical detail without dramatically increasing model error.

5.3. Influence of Image Overlap Percentage

Section 4.4 demonstrated a clear association between image overlap and 3D model accuracy. Flights with 80% overlap consistently produced the lowest RMSE values across all altitudes. For example, at a flight altitude of 30 m, an RMSE of 1.722 cm was achieved. In contrast, a 60% overlap led to the poorest reconstructions, with RMSE values reaching up to 7.609 cm, particularly at higher flight altitudes.
Overlap percentage strongly influenced both image count and reconstruction quality. Configurations with 80% overlap consistently yielded lower RMSE values, supporting findings by Gohari et al. [1], who reported that higher image redundancy enhances tie-point accuracy and reduces gaps in the 3D point cloud. A high overlap percentage significantly improved output quality compared to a low overlap [56]. Although 80% overlap consistently reduced RMSE, it also increased flight duration and image count, resulting in longer processing times and higher computational load. This trade-off highlights the need to balance accuracy requirements with operational efficiency, particularly in time-critical accident investigations.
However, it is important to balance increased overlap with mission efficiency. Although higher overlap improves spatial fidelity, it also leads to longer flight durations and a larger volume of data, which are factors that must be carefully considered during operational planning. Based on both the experimental results and literature evidence, an overlap threshold of 70–80% offers a practical balance between precision and efficiency for crash scene reconstruction or similar forensic applications.

5.4. Influence of Flight Duration and Number of Images on RMSE

The analysis from Section 4.5 revealed a clear pattern: models with more photographs and longer flight durations consistently yielded greater spatial accuracy, as measured by RMSE.
For example, the best-performing configuration (30 m altitude, 90° camera angle, and 80% overlap) produced 92 images over 4 min and 44 s, achieving the lowest RMSE of 1.722 cm. In contrast, the least accurate model (60 m altitude, 60° camera angle, and 60% overlap) captured only 8 images in 45 s, resulting in an RMSE of 7.609 cm. This stark contrast highlights how increased image density and extended flight durations contribute to more accurate and detailed reconstructions.
These findings are supported by broader photogrammetric studies. For instance, Chodura et al. [57] found that a GSD between 0.75 and 1.26 cm paired with 85% overlap produced high-accuracy models using fewer images but at the cost of flight duration. Additionally, research on construction site monitoring in Poland emphasized that increasing the number of photographs significantly improved positional accuracy and reduced RMSE [58].
However, the practical downside of higher image counts is the need for longer missions, greater data storage, and increased computational loads, all of which impact field efficiency. Thus, the optimal balance for forensic UAV applications is one where mission duration and photo count are sufficient to achieve low RMSE, without overburdening operational resources.

5.5. Statistical Confirmation via Wilcoxon Rank-Sum Test

The Wilcoxon rank-sum test provided robust statistical evidence that UAV flight parameters exert measurable effects on spatial accuracy. Significant differences in RMSE were detected when comparing lower versus higher altitudes (30 m vs. 60 m), nadir versus oblique camera angles (90° vs. 75° and 90° vs. 60°), and higher versus lower overlap levels (80% vs. 60%). These results validate that increased altitude, greater obliquity, and reduced overlap are associated with systematically higher reconstruction errors. Conversely, configurations employing lower altitudes, nadir or moderately oblique angles, and higher image overlap consistently yielded more accurate models.
This analysis confirms that not all parameter settings within each group are equivalent in their impact on 3D reconstruction accuracy. Instead, certain settings (e.g., 30 m altitude, 90° angle, 80% overlap) provide statistically superior outcomes. These findings underscore the importance of selecting optimal flight parameters to minimize error margins, thereby enhancing the reliability of UAV-based photogrammetry for precision-sensitive applications such as road accident investigation and infrastructure documentation.

5.6. Practical Implications and Recommendations

The results of this study offer meaningful guidance for professionals engaged in crash scene investigation, photogrammetric modeling, and forensic documentation using UAVs. The identification of optimal flight parameters (specifically a flight altitude of 30 m, a camera angle of 90°, and image overlap of 80%) provides a foundation for standardized UAV deployment protocols that prioritize spatial accuracy while maintaining operational feasibility.
In practical terms, the combination of low flight altitude and high image overlap yields denser point clouds and finer ground sampling distances (GSD), enhancing the model’s ability to preserve critical spatial features such as skid marks, debris scatter, and vehicle deformation patterns. These details are often vital in legal investigations and accident reconstructions where centimeter-level precision is required. Moreover, the orthogonal (nadir) camera angle facilitates the production of geometrically consistent orthophotos and digital surface models (DSMs), which are easily interpretable by both engineers and legal personnel.
However, the integration of moderate oblique angles (e.g., 75°) should not be dismissed. While nadir images are geometrically superior for flat surface mapping, oblique imagery improves edge definition for vertical structures such as signposts, barriers, or damaged vehicle components. When combined with circular or multi-axis flight paths, these angles can dramatically enhance model completeness and spatial realism [1,14]. Therefore, for accident scenes involving complex topography or obstructed views, a hybrid approach utilizing both nadir and oblique captures is recommended.
In practice, low-altitude nadir missions are more suitable for confined, cluttered crash sites, whereas moderate heights and oblique imagery may be more efficient for open highway environments. This context-specific applicability highlights the need for adaptable mission planning strategies.
A key practical insight concerns the balance between data acquisition efficiency and model quality. The findings demonstrate that configurations with fewer images (resulting from lower overlap or higher flight altitude) enabled faster data collection but reduced spatial accuracy. This trade-off is particularly relevant in time-sensitive scenarios, such as heavy traffic or adverse weather, where adopting adaptive flight strategies may be advantageous. For instance, an initial high-efficiency survey can be complemented by targeted low-altitude passes over critical forensic areas if greater detail is required. Figure 11 illustrates this balance, highlighting differences in geometric completeness and visual fidelity between the best and worst models. The best model produced a point cloud density of 788.22 points/m2, compared to only 100.96 points/m2 in the worst model. While this suggests that higher point density can improve RMSE, overall accuracy is also shaped by factors such as image quality, GCP distribution, and the handling of outliers [59,60]. Consequently, the interpretation of these results should be made in light of these interdependent factors.
Although the lowest RMSE values were obtained under configurations with longer flight durations and denser imagery, such conditions may not always be feasible during time-critical crash documentation. Thus, operational trade-offs between achieving sub-2 cm accuracy and ensuring rapid deployment should be carefully considered by practitioners.
In terms of relative contributions to error, the experimental results indicate that flight altitude and image overlap were the most influential factors, together accounting for the largest variations in RMSE (up to ~6 cm difference between optimal and suboptimal configurations). The camera angle had a moderate but consistent effect, particularly when combined with higher altitudes or lower overlaps, where the RMSE increased by 2–3 cm. By comparison, secondary sources of error, such as image quality, tie-point distribution, and residual outliers after filtering, contributed less substantially, typically within 1 cm. Environmental factors, including shadows, uneven surfaces, and obstructions such as trees and poles, further amplified these effects by reducing keypoint detection in certain flight paths. This highlights that denser image capture at lower altitudes can partially compensate for environmental challenges, whereas high-altitude or oblique configurations are more sensitive to lighting and occlusion. These insights underscore the need to select flight strategies based not only on parameter optimization but also on the specific environmental conditions of the crash scene.
In terms of implementation policy, agencies deploying UAVs for traffic crash documentation should consider institutionalizing minimum technical requirements, such as overlap thresholds and recommended altitudes, to standardize data quality across different operators and equipment. The incorporation of Ground Control Points (GCPs) and Real-Time Kinematic (RTK) GPS systems can further enhance georeferencing accuracy, ensuring admissibility in court proceedings and compliance with forensic standards.
Future investigations should explore hybrid UAV operations that combine fixed-wing platforms for area coverage with multi-rotors for localized detail capture. Additionally, AI-assisted flight path planning may provide adaptive optimization, balancing speed, overlap, and accuracy in real time.
Finally, the findings also underscore the need for training and workflow optimization. UAV operators should be proficient not only in drone piloting but also in mission planning software (e.g., DJI GS Pro, DroneDeploy, UgCS), image processing platforms (e.g., Agisoft Metashape, Pix4Dmapper, 3DF Zephyr), and basic geospatial analysis. Integrating these skills into crash response protocols can significantly shorten investigation timeframes and improve the quality of spatial evidence.

6. Conclusions and Recommendations

This study systematically examined the impact of three key UAV flight parameters (flight altitude, camera angle, and image overlap) on the spatial accuracy of 3D reconstructions for road accident scene analysis. Using a total of 27 UAV flight configurations, the research generated corresponding 3D models and assessed their geometric accuracy by comparing linear distances measured in the models with ground-truth references obtained from total station surveys.
The findings clearly show that lower flight altitudes (specifically 30 m), higher image overlaps (80%), and nadir camera angles (90°) yield significantly more accurate 3D reconstructions, with the lowest recorded RMSE at 1.722 cm (statistical analysis using the Wilcoxon rank-sum test confirmed significant differences in accuracy across key UAV flight parameters). These conditions resulted in the highest number of photographs and longest flight duration, indicating a direct relationship between data density and spatial fidelity. Conversely, the highest RMSE value of 7.609 cm was observed under the configuration of 60 m altitude, 60° camera angle, and 60% image overlap—conditions that produced the fewest images and shortest flight duration. The optimal configuration achieved an RMSE of 1.72 cm, whereas the least accurate configuration resulted in an RMSE of 7.61 cm. This nearly fourfold difference demonstrates the practical significance of parameter selection in UAV-based crash documentation and underscores a clear trade-off between operational efficiency and model precision.
Additionally, the results confirm that camera angle plays a pivotal role in capturing complex geometries. While nadir views are effective for horizontal measurements, moderate oblique angles can improve the delineation of vertical features and reduce systematic distortions in point cloud generation. Image overlaps also emerged as a critical factor; greater overlaps contributed to more tie points and surface detail, though they also increased flight duration and data processing time.
Overall, this research provides strong evidence supporting the careful calibration of UAV parameters to balance practical constraints with the need for high reconstruction accuracy. The methodology developed, encompassing flight planning, image collection, three-dimensional reconstruction, and accuracy assessment using RMSE, serves as a replicable framework applicable to both forensic investigations and engineering surveys. The study site, designed to mimic actual conditions with environmental obstacles like poles and trees, adds further validity to the results, emphasizing the applicability of this approach beyond controlled settings.
A key limitation of this study lies in its reliance on steep camera angles (60–90°), which, while effective for capturing horizontal roadway structures, are less suitable for representing vertical features. Forensic investigations often require precise documentation of elements such as light poles, signage, or damaged vehicle facades, and prior research indicates that incorporating oblique imagery (30–50°) can improve vertical geometry and facade detail in 3D models [61,62]. Addressing vertical geometry would require more integration of oblique camera angles, which falls beyond the current scope. To overcome this limitation, future research should incorporate vertical validation with oblique imagery, supported by RTK GPS and varied-elevation ground control points. Moreover, the present analysis was restricted to planimetric accuracy based on horizontal distances—an emphasis consistent with many practical accident scene measurements such as tire track lengths, lane widths, and vehicle positions—but this excludes vertical validation, which is essential for slopes, elevation changes, and deformation assessment. The relatively simple experimental environment, which lacked moving vehicles, variable lighting, vegetation occlusion, and complex vertical structures, also limits generalizability. Future work should therefore validate the methodology under more challenging and realistic conditions, including active crash sites, while also exploring post-processing enhancements such as GCP optimization and RTK correction. Extending the approach to larger-scale or dynamic environments will further broaden the operational scope of UAV-based accident scene documentation and strengthen its forensic applicability.

Author Contributions

Conceptualization, T.P., P.W., T.C. and S.J.; methodology, T.P.; software, A.D. and T.P.; validation, P.W. and V.R.; formal analysis, T.P. and P.W.; investigation, A.D.; resources, T.P. and A.D.; data curation, T.P. and P.W.; writing—original draft preparation, T.P.; writing—review and editing, P.W. and T.P.; visualization, A.D. and T.J.; supervision, S.J. All authors have read and agreed to the published version of the manuscript.

Funding

This work was supported by Suranaree University of Technology (SUT), Thailand Science Research and Innovation (TSRI), and National Science, Research and Innovation Fund (NSRF) (Project code: 204286).

Informed Consent Statement

The study was conducted according to the guidelines of the Declaration of Helsinki and approved by the Ethics Committee of Suranaree University of Technology (COE No. 177/2567, 1 December 2024).

Data Availability Statement

Data are available on request due to privacy restrictions.

Acknowledgments

The authors express their gratitude to the Suranaree University of Technology (SUT), Thailand Science Research and Innovation (TSRI), and National Science, Research and Innovation Fund for their support in undertaking this research.

Conflicts of Interest

The authors declare no conflicts of interest.

References

  1. Gohari, A.; Ahmad, A.B.; Rahim, R.B.A.; Elamin, N.I.M.; Gismalla, M.S.M.; Oluwatosin, O.O.; Hasan, R.; Ab Latip, A.S.; Lawal, A. Drones for road accident management: A systematic review. IEEE Access 2023, 11, 109247–109256. [Google Scholar] [CrossRef]
  2. Su, S.; Liu, W.; Li, K.; Yang, G.; Feng, C.; Ming, J.; Liu, G.; Liu, S.; Yin, Z. Developing an unmanned aerial vehicle-based rapid mapping system for traffic accident investigation. Aust. J. Forensic Sci. 2016, 48, 454–468. [Google Scholar] [CrossRef]
  3. Raj, C.V.; Sree, B.N.; Madhavan, R. Vision based accident vehicle identification and scene investigation. In Proceedings of the 2017 IEEE Region 10 Symposium (TENSYMP), Cochin, India, 14–16 July 2017; pp. 1–5. [Google Scholar]
  4. Almeshal, A.M.; Alenezi, M.R.; Alshatti, A.K. Accuracy assessment of small unmanned aerial vehicle for traffic accident photogrammetry in the extreme operating conditions of Kuwait. Information 2020, 11, 442. [Google Scholar] [CrossRef]
  5. Vida, G.; Melegh, G.; Süveges, Á.; Wenszky, N.; Török, Á. Analysis of UAV Flight Patterns for Road Accident Site Investigation. Vehicles 2023, 5, 1707–1726. [Google Scholar] [CrossRef]
  6. Tan, Y.; Li, Y. UAV photogrammetry-based 3D road distress detection. ISPRS Int. J. Geo-Inf. 2019, 8, 409. [Google Scholar] [CrossRef]
  7. Iglesias, L.; De Santos-Berbel, C.; Pascual, V.; Castro, M. Using Small Unmanned Aerial Vehicle in 3D Modeling of Highways with Tree-Covered Roadsides to Estimate Sight Distance. Remote Sens. 2019, 11, 2625. [Google Scholar] [CrossRef]
  8. Barroso, A.; Henriques, R.; Cerqueira, Â.; Gomes, P.; Ribeiro Antunes, I.M.H.; Reis, A.P.M.; Valente, T.M. Acid mine drainage and waste dispersion in legacy mining sites: An integrated approach using UAV photogrammetry and geospatial analysis. J. Hazard. Mater. 2025, 495, 138827. [Google Scholar] [CrossRef]
  9. Puniach, E.; Gruszczyński, W.; Ćwiąkała, P.; Matwij, W. Application of UAV-based orthomosaics for determination of horizontal displacement caused by underground mining. ISPRS J. Photogramm. Remote Sens. 2021, 174, 282–303. [Google Scholar] [CrossRef]
  10. Liu, Y.; Zheng, X.; Ai, G.; Zhang, Y.; Zuo, Y. Generating a high-precision true digital orthophoto map based on UAV images. ISPRS Int. J. Geo-Inf. 2018, 7, 333. [Google Scholar] [CrossRef]
  11. Papadopoulou, E.-E.; Vasilakos, C.; Zouros, N.; Soulakellis, N. DEM-based UAV flight planning for 3D mapping of geosites: The case of olympus tectonic window, Lesvos, Greece. ISPRS Int. J. Geo-Inf. 2021, 10, 535. [Google Scholar] [CrossRef]
  12. Kerle, N.; Nex, F.; Gerke, M.; Duarte, D.; Vetrivel, A. UAV-based structural damage mapping: A review. ISPRS Int. J. Geo-Inf. 2019, 9, 14. [Google Scholar] [CrossRef]
  13. Liu, Y.; Han, K.; Rasdorf, W. Assessment and prediction of impact of flight configuration factors on UAS-based photogrammetric survey accuracy. Remote Sens. 2022, 14, 4119. [Google Scholar] [CrossRef]
  14. Nex, F.; Remondino, F. UAV for 3D mapping applications: A review. Appl. Geomat. 2014, 6, 1–15. [Google Scholar] [CrossRef]
  15. Inzerillo, L.; Di Mino, G.; Roberts, R. Image-based 3D reconstruction using traditional and UAV datasets for analysis of road pavement distress. Autom. Constr. 2018, 96, 457–469. [Google Scholar] [CrossRef]
  16. Wu, S.; Feng, L.; Zhang, X.; Yin, C.; Quan, L.; Tian, B. Optimizing overlap percentage for enhanced accuracy and efficiency in oblique photogrammetry building 3D modeling. Constr. Build. Mater. 2025, 489, 142382. [Google Scholar] [CrossRef]
  17. Santos Santana, L.; Ferraz, G.A.E.S.; Bedin Marin, D.; Dienevam Souza Barbosa, B.; Mendes Dos Santos, L.; Ferreira Ponciano Ferraz, P.; Conti, L.; Camiciottoli, S.; Rossi, G. Influence of flight altitude and control points in the georeferencing of images obtained by unmanned aerial vehicle. Eur. J. Remote Sens. 2021, 54, 59–71. [Google Scholar]
  18. Nagendran, S.K.; Tung, W.Y.; Ismail, M.A.M. Accuracy assessment on low altitude UAV-borne photogrammetry outputs influenced by ground control point at different altitude. IOP Conf. Ser. Earth Environ. Sci. 2018, 169, 012031. [Google Scholar]
  19. Anders, N.; Smith, M.; Suomalainen, J.; Cammeraat, E.; Valente, J.; Keesstra, S. Impact of flight altitude and cover orientation on Digital Surface Model (DSM) accuracy for flood damage assessment in Murcia (Spain) using a fixed-wing UAV. Earth Sci. Inform. 2020, 13, 391–404. [Google Scholar] [CrossRef]
  20. Udin, W.; Ahmad, A. Assessment of Photogrammetric Mapping Accuracy Based on Variation Flying Altitude Using Unmanned Aerial Vehicle. IOP Conf. Ser. Earth Environ. Sci. 2014, 18, 012027. [Google Scholar] [CrossRef]
  21. Siebert, S.; Teizer, J. Mobile 3D mapping for surveying earthwork projects using an Unmanned Aerial Vehicle (UAV) system. Autom. Constr. 2014, 41, 1–14. [Google Scholar] [CrossRef]
  22. Ahmed, S.; El-Shazly, A.; Abed, F.; Ahmed, W. The influence of flight direction and camera orientation on the quality products of UAV-based SfM-photogrammetry. Appl. Sci. 2022, 12, 10492. [Google Scholar] [CrossRef]
  23. Chiabrando, F.; Lingua, A.; Maschio, P.; Teppati Losè, L. The influence of flight planning and camera orientation in UAVs photogrammetry. A test in the area of Rocca San Silvestro (LI), TUSCANY. Int. Arch. Photogramm. Remote Sens. Spat. Inf. Sci. 2017, 42, 163–170. [Google Scholar] [CrossRef]
  24. Hastedt, H.; Luhmann, T. Investigations on the quality of the interior orientation and its impact in object space for UAV photogrammetry. Int. Arch. Photogramm. Remote Sens. Spat. Inf. Sci. 2015, 40, 321–328. [Google Scholar] [CrossRef]
  25. Seifert, E.; Seifert, S.; Vogt, H.; Drew, D.; Van Aardt, J.; Kunneke, A.; Seifert, T. Influence of drone altitude, image overlap, and optical sensor resolution on multi-view reconstruction of forest images. Remote Sens. 2019, 11, 1252. [Google Scholar] [CrossRef]
  26. Domingo, D.; Ørka, H.O.; Næsset, E.; Kachamba, D.; Gobakken, T. Effects of UAV image resolution, camera type, and image overlap on accuracy of biomass predictions in a tropical woodland. Remote Sens. 2019, 11, 948. [Google Scholar] [CrossRef]
  27. Georgiou, A.; Masters, P.; Johnson, S.; Feetham, L. UAV-assisted real-time evidence detection in outdoor crime scene investigations. J. Forensic Sci. 2022, 67, 1221–1232. [Google Scholar] [CrossRef]
  28. Pérez, J.A.; Gonçalves, G.R.; Barragan, J.R.M.; Ortega, P.F.; Palomo, A.A.M.C. Low-cost tools for virtual reconstruction of traffic accident scenarios. Heliyon 2024, 10, e29709. [Google Scholar] [CrossRef]
  29. Ruzgienė, B.; Kuklienė, L.; Kuklys, I.; Jankauskienė, D.; Lousada, S. The use of kinematic photogrammetry and LiDAR for reconstruction of a unique object with extreme topography: A case study of Dutchman’s Cap, Baltic seacoast, Lithuania. Front. Remote Sens. 2025, 6, 1397513. [Google Scholar] [CrossRef]
  30. Yang, Y.; Lin, Z.; Liu, F. Stable imaging and accuracy issues of low-altitude unmanned aerial vehicle photogrammetry systems. Remote Sens. 2016, 8, 316. [Google Scholar] [CrossRef]
  31. Rabiu, L.; Ahmad, A. Unmanned Aerial Vehicle Photogrammetric Products Accuracy Assessment: A Review. Int. Arch. Photogramm. Remote Sens. Spat. Inf. Sci. 2023, 48, 279–288. [Google Scholar] [CrossRef]
  32. Zulkifli, M.H.; Tahar, K.N. The Influence of UAV Altitudes and Flight Techniques in 3D Reconstruction Mapping. Drones 2023, 7, 227. [Google Scholar] [CrossRef]
  33. Korumaz, S.A.G.; Yıldız, F. Positional Accuracy Assessment of Digital Orthophoto Based on UAV Images: An Experience on an Archaeological Area. Heritage 2021, 4, 1304–1327. [Google Scholar] [CrossRef]
  34. Bazrafkan, A.; Worral, H.; Perdigon, C.; Oduor, P.G.; Bandillo, N.; Flores, P. Evaluating Sensor Fusion and Flight Parameters for Enhanced Plant Height Measurement in Dry Peas. Sensors 2025, 25, 2436. [Google Scholar] [CrossRef]
  35. de Lima, R.S.; Lang, M.; Burnside, N.G.; Peciña, M.V.; Arumäe, T.; Laarmann, D.; Ward, R.D.; Vain, A.; Sepp, K. An Evaluation of the Effects of UAS Flight Parameters on Digital Aerial Photogrammetry Processing and Dense-Cloud Production Quality in a Scots Pine Forest. Remote Sens. 2021, 13, 1121. [Google Scholar] [CrossRef]
  36. Næsset, E. Effects of different flying altitudes on biophysical stand properties estimated from canopy height and density measured with a small-footprint airborne scanning laser. Remote Sens. Environ. 2004, 91, 243–255. [Google Scholar] [CrossRef]
  37. Nesbit, P.R.; Hugenholtz, C.H. Enhancing UAV–SfM 3D Model Accuracy in High-Relief Landscapes by Incorporating Oblique Images. Remote Sens. 2019, 11, 239. [Google Scholar] [CrossRef]
  38. Rossi, P.; Mancini, F.; Dubbini, M.; Mazzone, F.; Capra, A. Combining nadir and oblique UAV imagery to reconstruct quarry topography: Methodology and feasibility analysis. Eur. J. Remote Sens. 2017, 50, 211–221. [Google Scholar] [CrossRef]
  39. Nikolakopoulos, K.G.; Kyriou, A.; Koukouvelas, I.K. Developing a Guideline of Unmanned Aerial Vehicle’s Acquisition Geometry for Landslide Mapping and Monitoring. Appl. Sci. 2022, 12, 4598. [Google Scholar] [CrossRef]
  40. Elhadary, A.; Rabah, M.; Ghanem, E.; Abd El Ghany, R.; Soliman, A. The influence of flight height and overlap on UAV imagery over featureless surfaces and constructing formulas predicting the geometrical accuracy. NRIAG J. Astron. Geophys. 2022, 11, 210–223. [Google Scholar] [CrossRef]
  41. Wang, F.; Zou, Y.; del Rey Castillo, E.; Lim, J. Optimal UAV Image Overlap for Photogrammetric 3D Reconstruction of Bridges. IOP Conf. Ser. Earth Environ. Sci. 2022, 1101, 022052. [Google Scholar] [CrossRef]
  42. Dhruva, A.; Hartley, R.; Redpath, T.; Estarija, H.; Cajes, D.; Massam, P. Effective UAV Photogrammetry for Forest Management: New Insights on Side Overlap and Flight Parameters. Forests 2024, 15, 2135. [Google Scholar] [CrossRef]
  43. Liu, X.; Zou, H.; Niu, W.; Song, Y.; He, W. An Approach of Traffic Accident Scene Reconstruction Using Unmanned Aerial Vehicle Photogrammetry. In Proceedings of the 2019 2nd International Conference on Sensors, Signal and Image Processing, Prague, Czech Republic, 8–10 October 2019; pp. 31–34. [Google Scholar]
  44. Buunk, T.; Vélez, S.; Ariza-Sentís, M.; Valente, J. Comparing Nadir and Oblique Thermal Imagery in UAV-Based 3D Crop Water Stress Index Applications for Precision Viticulture with LiDAR Validation. Sensors 2023, 23, 8625. [Google Scholar] [CrossRef]
  45. Jiménez-Jiménez, S.I.; Ojeda-Bustamante, W.; Marcial-Pablo, M.D.J.; Enciso, J. Digital Terrain Models Generated with Low-Cost UAV Photogrammetry: Methodology and Accuracy. ISPRS Int. J. Geo-Inf. 2021, 10, 285. [Google Scholar] [CrossRef]
  46. Agüera-Vega, F.; Ferrer, E.; Martínez-Carricondo, P.; Sánchez-Hermosilla, J.; Carvajal-Ramírez, F. Influence of the Inclusion of Off-Nadir Images on UAV-Photogrammetry Projects from Nadir Images and AGL (Above Ground Level) or AMSL (Above Mean Sea Level) Flights. Drones 2024, 8, 662. [Google Scholar] [CrossRef]
  47. Róg, M.; Rzonca, A. The impact of photo overlap, the number of control points and the method of camera calibration on the accuracy of 3D model reconstruction. Geomat. Environ. Eng. 2021, 15, 67–87. [Google Scholar] [CrossRef]
  48. Zhao, M.; Chen, J.; Song, S.; Li, Y.; Wang, F.; Wang, S.; Liu, D. Proposition of UAV multi-angle nap-of-the-object image acquisition framework based on a quality evaluation system for a 3D real scene model of a high-steep rock slope. Int. J. Appl. Earth Obs. Geoinf. 2023, 125, 103558. [Google Scholar] [CrossRef]
  49. Zhang, S.; Zheng, L.; Zhou, H.; Zhao, Q.; Li, J.; Xia, Y.; Zhang, W.; Cheng, X. Fine-scale Antarctic grounded ice cliff 3D calving monitoring based on multi-temporal UAV photogrammetry without ground control. Int. J. Appl. Earth Obs. Geoinf. 2025, 142, 104620. [Google Scholar] [CrossRef]
  50. Elkhrachy, I. Accuracy assessment of low-cost unmanned aerial vehicle (UAV) photogrammetry. Alex. Eng. J. 2021, 60, 5579–5590. [Google Scholar] [CrossRef]
  51. Chiabrando, F.; Sammartano, G.; Spanò, A. Historical buildings models and their handling via 3D survey: From points clouds to user-oriented HBIM. Int. Arch. Photogramm. Remote Sens. Spat. Inf. Sci. 2016, 41, 633–640. [Google Scholar]
  52. Wilcoxon, F. Individual Comparisons by Ranking Methods. Biom. Bull. 1945, 1, 80–83. [Google Scholar] [CrossRef]
  53. Eisenbeiß, H. UAV Photogrammetry; ETH Zurich: Zurich, Switzerland, 2009. [Google Scholar]
  54. Burdziakowski, P.; Bobkowska, K. UAV Photogrammetry under Poor Lighting Conditions—Accuracy Considerations. Sensors 2021, 21, 3531. [Google Scholar] [CrossRef]
  55. Santrač, N.; Benka, P.; Batilović, M.; Zemunac, R.; Antić, S.; Stajić, M.; Antonić, N. Accuracy analysis of UAV photogrammetry using RGB and multispectral sensors. Geod. Vestn. 2023, 67, 459–472. [Google Scholar] [CrossRef]
  56. Zaman, A.A.U.; Abdelaty, A. Effects of UAV imagery overlap on photogrammetric data quality for construction applications. Int. J. Constr. Manag. 2025, 1–16. [Google Scholar] [CrossRef]
  57. Chodura, N.; Greeff, M.; Woods, J. Evaluation of Flight Parameters in UAV-based 3D Reconstruction for Rooftop Infrastructure Assessment. arXiv 2025, arXiv:2504.02084. [Google Scholar] [CrossRef]
  58. Pargieła, K. Optimising UAV Data Acquisition and Processing for Photogrammetry: A Review. Geomat. Environ. Eng. 2023, 17, 29–59. [Google Scholar] [CrossRef]
  59. Leem, J.; Mehrishal, S.; Kang, I.-S.; Yoon, D.-H.; Shao, Y.; Song, J.-J.; Jung, J. Optimizing Camera Settings and Unmanned Aerial Vehicle Flight Methods for Imagery-Based 3D Reconstruction: Applications in Outcrop and Underground Rock Faces. Remote Sens. 2025, 17, 1877. [Google Scholar] [CrossRef]
  60. Yang, Q.; Li, A.; Liu, Y.; Wang, H.; Leng, Z.; Deng, F. Machine learning-based optimization of photogrammetric JRC accuracy. Sci. Rep. 2024, 14, 26608. [Google Scholar] [CrossRef]
  61. Mueller, M.; Dietenberger, S.; Nestler, M.; Hese, S.; Ziemer, J.; Bachmann, F.; Leiber, J.; Dubois, C.; Thiel, C. Novel UAV Flight Designs for Accuracy Optimization of Structure from Motion Data Products. Remote Sens. 2023, 15, 4308. [Google Scholar] [CrossRef]
  62. Lee, K.; Lee, W.H. Earthwork Volume Calculation, 3D Model Generation, and Comparative Evaluation Using Vertical and High-Oblique Images Acquired by Unmanned Aerial Vehicles. Aerospace 2022, 9, 606. [Google Scholar] [CrossRef]
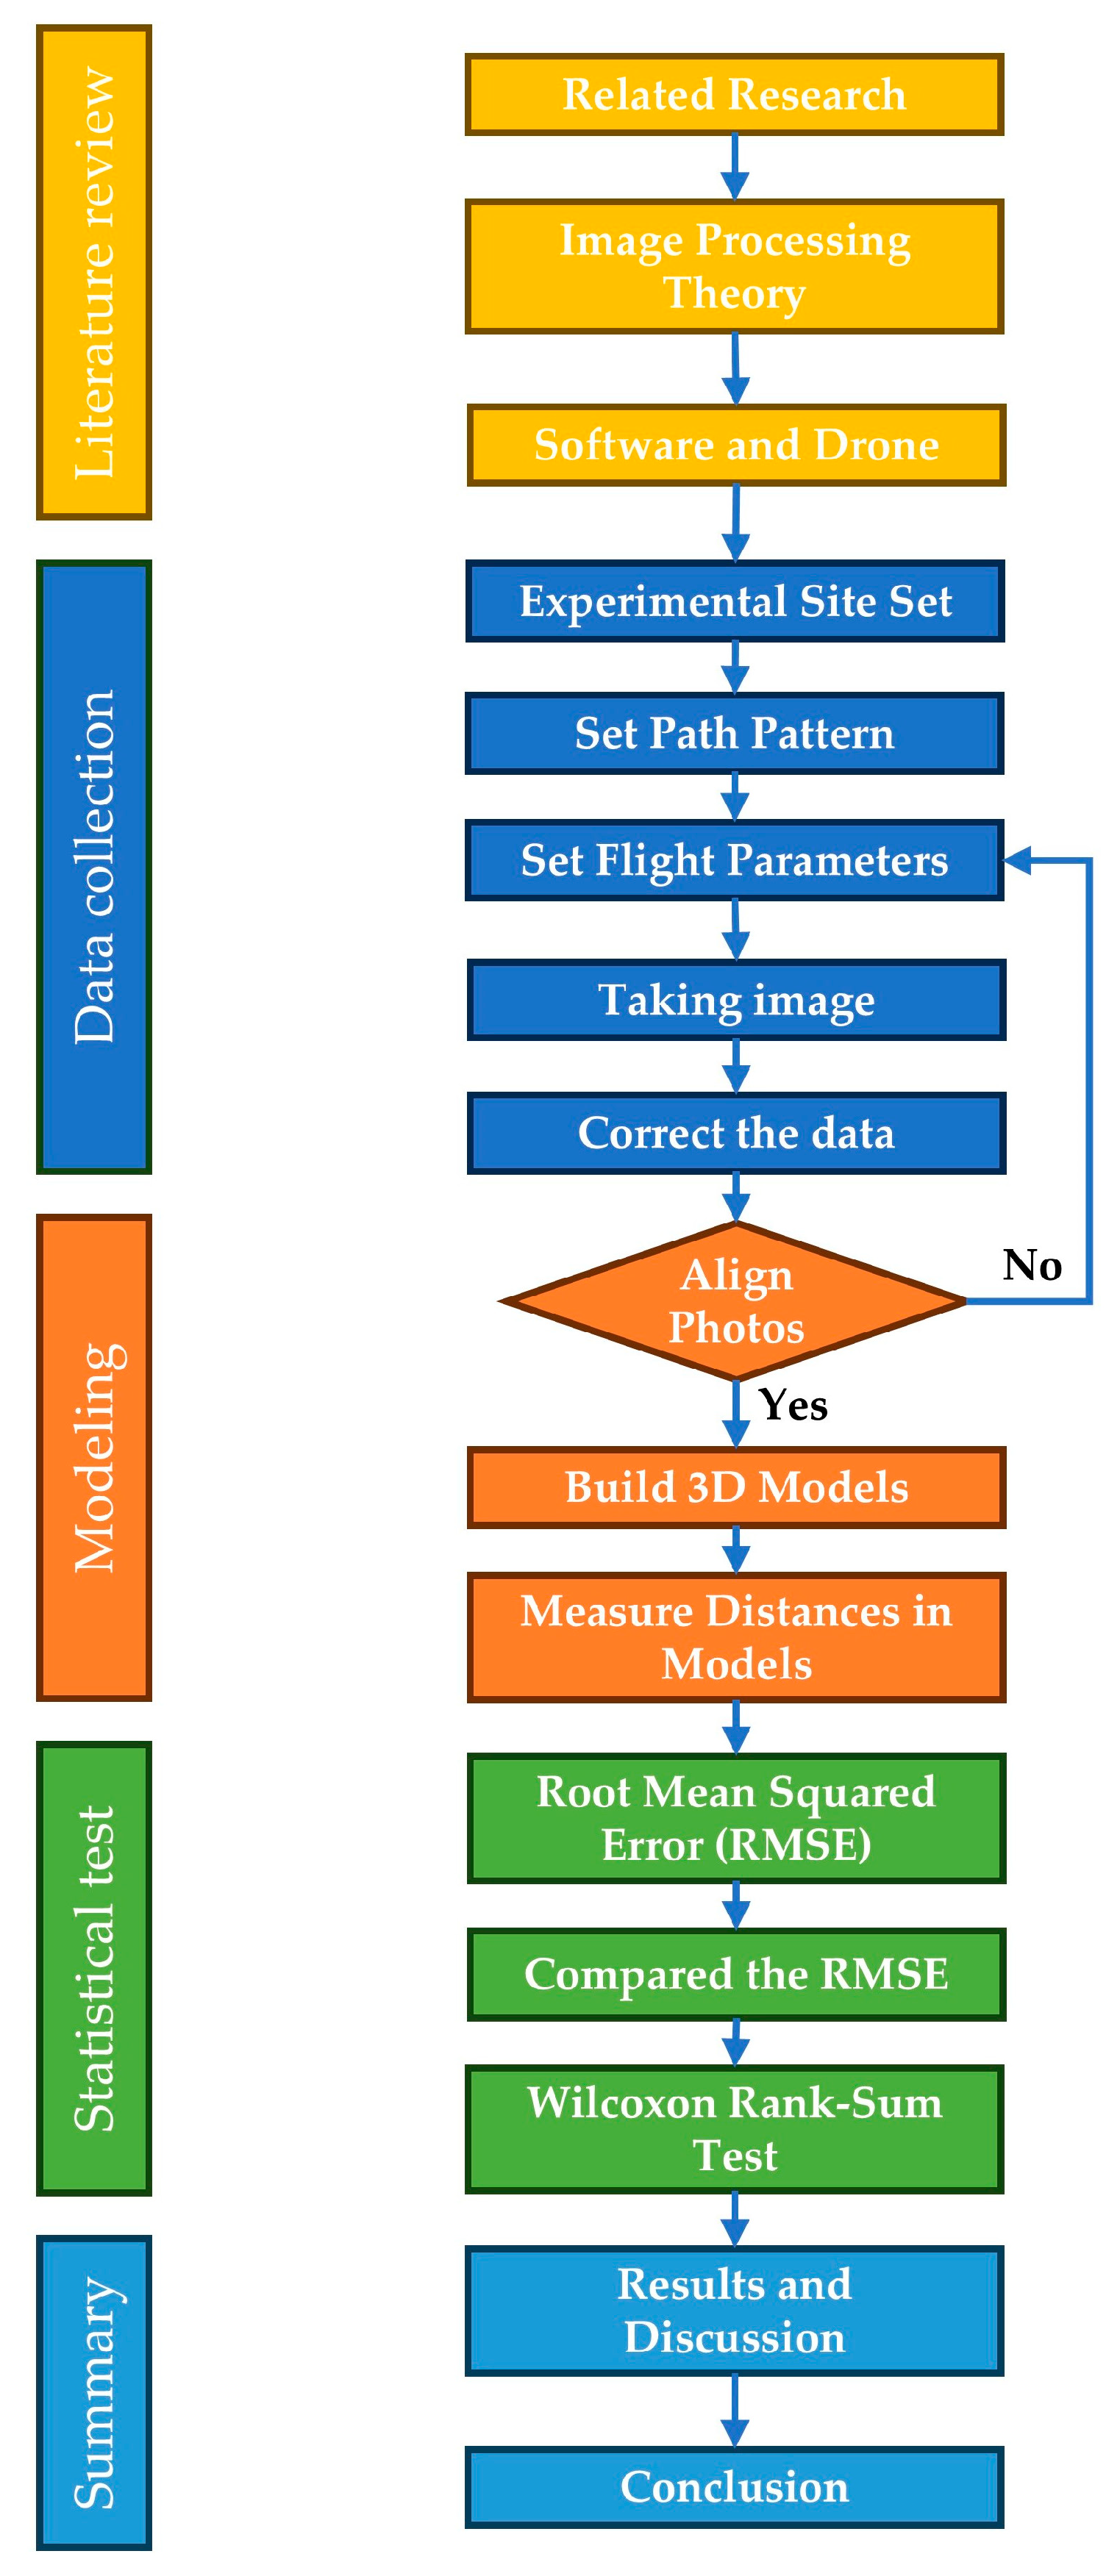
Figure 1. Workflow of the UAV-Based Experimental Procedure for 3D Model Accuracy Evaluation.
Ijgi 14 00357 g001
Figure 2. Actual road used for experimentation using UAV, which introduced realistic obstructions (such as trees, light poles, and uneven surfaces) and shadows that often occur in actual crash scenes.
Ijgi 14 00357 g002
Figure 3. Sample of linear horizontal distances of ground control points (GCPs). (a) skid mark, (b) width-length of the repaired asphalt concrete, and (c) length of the lane width.
Ijgi 14 00357 g003
Figure 4. Flight path configuration used in the study. The green line represents the flight path, and the blue line indicates the area boundary.
Ijgi 14 00357 g004
Figure 5. Total station, which is used to measure the actual reference distance.
Ijgi 14 00357 g005
Figure 6. Heatmap of Average point cloud density by Height and (Angle (°), %Overlap). Dark blue represents high point cloud density, while white represents low density.
Ijgi 14 00357 g006
Figure 7. Point Cloud 3D model with the highest and least average point cloud density. (a) 3D model with the highest average point cloud density; (b) 3D model with the least average point cloud density.
Ijgi 14 00357 g007
Figure 8. Heatmap of RMSE by Height and (Angle (°), %Overlap). Green tone represents low RMSE values, red tone represents high RMSE values.
Ijgi 14 00357 g008
Figure 9. Relationship between accuracy (RMSE) and flight duration.
Ijgi 14 00357 g009
Figure 10. Relationship between accuracy (RMSE) and number of images.
Ijgi 14 00357 g010
Figure 11. Comparison of 3D models from the best and worst accurate configurations: (a) 3D model from the best configurations; (b) 3D model from the worst configurations; (c) close up view of 3D models from the best configurations; (d) close up view of 3D model from the worst configurations.
Ijgi 14 00357 g011aIjgi 14 00357 g011b
Table 1. Summary of previous studies on UAV flight parameters and their influence on RMSE/point cloud density.
StudyAltitude (m)Camera Angle (°)Overlap (%)RMSE/Accuracy/Point CloudKey Findings
Zulkifli and Tahar [32]5, 7, 10Nadir80–90RMSE ≈ 4 cm (best at 5 m, POI)Lower altitude with the POI technique improved accuracy
Seifert et al. [25]25–100NadirVariedRMSE ≈ 4 cmHigh overlap + low altitude yielded the best reconstructions
Udin and Ahmad [20]40, 60, 80, 100Nadir60RMSE ≈ 0.249–0.296 cmLower altitude improved accuracy
de Lima et al. [35]90–15070–90565 points cloud/m2Lower altitude with the quality of DAP products improved the accuracy
Santos Santana et al. [17]30, 60, 90, 120RMSE < 7 cm (60 m altitude)60 m provided a balance between efficiency and accuracy
Agüera-Vega et al. [46]65, 80Nadir/ 11.25°, 22.5°, 33.75°, 45°90 (F), 70 (S)Accuracy < 3.5 cmBetween 20°, 35° angles yielded the best accuracy and precision
Nesbit and Hugenholtz [37]0–35 (Oblique)70–90Mean accuracy < 3 cmIncreasing the camera tilt angle improved vertical accuracy
Rossi et al. [38]Nadir, ObliqueCentimeter-level accuracyThe integration of nadir and oblique imagery enhances the geotechnical interpretation of spatially variable conditions
Buunk et al. [44]30Nadir, Oblique70181,372–215,199 point cloudNadir outperforms oblique imagery point cloud in the orthomosaic
Nex and Remondino [14]100–200Nadir, Oblique60–80RMSE 3.7 cm in planimetryHigh overlap and low altitude yielded the best 3D model
Jiménez-Jiménez et al. [45]70–90 (F), 60–80 (S)RMSE 1 to 7 × GSDRecommended 70–90% forward and 60–80% side overlap
Dhruva et al. [42]80, 120Nadir80–90RMSE of 0.6 cm for X, Y, and 0.04 cm for Z valuesIdentified 90% (f) and 85% (s) overlap at 120 m altitude as the optimal flight parameters
Elhadary et al. [40]140, 160, 180, 20060, 70, 80RMSE < 6 cmAn increase in the image overlap leads to an increase in the RMSE and the point clouds’ geometric accuracy
Table 2. Measured distances from 3D models and actual reference values across 10 linear distances.
HeightAngle%OverlapMeasured Distances (m.)
Control PointL1L2L3L4L5L6L7L8L9L10
Actual Reference17.0419.87920.6198.512.786.443.241.0210.5059.969
30 m9080Model 0117.02819.87620.6598.5272.7876.4513.2661.02210.5089.961
70Model 0217.02719.87320.6858.5242.7916.4673.2621.02910.5029.957
60Model 0317.0319.86920.6928.5262.7836.453.261.02210.519.963
7580Model 0417.02919.87320.6838.5212.7816.4663.2591.0210.5129.971
70Model 0517.01719.86820.6848.5312.7866.4613.2631.02410.59.961
60Model 0617.00119.86320.6838.5152.7966.4713.2611.02110.5169.969
6080Model 0717.0119.85220.6838.5112.7776.4623.2611.02610.5219.964
70Model 0817.02119.87320.698.5282.7796.473.2671.02410.5139.959
60Model 0917.02319.84820.6968.5332.7836.4613.2751.0210.5319.974
45 m9080Model 1017.02319.85820.6728.5382.7676.453.2621.02910.5199.962
70Model 1117.0319.8520.658.512.7766.4533.2731.02210.5049.942
60Model 1217.03419.87620.6058.5052.7746.4833.281.01910.499.918
7580Model 1317.0319.90120.6878.5252.7936.4523.2741.0310.539.966
70Model 1417.0519.91320.5938.4942.776.4723.2751.01610.4769.922
60Model 1517.06819.92420.5988.5112.7746.4793.291.03110.5069.929
6080Model 1617.0119.86720.6918.5262.7856.4753.2781.0210.5139.965
70Model 1717.04419.89820.6228.5142.7686.5033.2691.02810.59.944
60Model 1817.08119.97820.6178.5312.8116.533.3061.02610.5039.957
60 m9080Model 1917.0219.88820.6778.532.7856.4693.271.03910.5119.969
70Model 2017.02219.88820.6698.532.7826.4753.2681.02410.5029.945
60Model 2117.02519.86620.6798.5222.7796.4823.281.03510.5149.945
7580Model 2217.03619.87120.678.5182.7796.493.281.03710.549.98
70Model 2317.04119.92520.6088.4992.786.4883.2781.03410.489.932
60Model 2417.05619.93720.588.5152.766.4833.2951.0310.5079.928
6080Model 2517.00119.8720.6778.5432.7796.4913.281.01410.5079.968
70Model 2617.0619.90520.688.552.86.5023.281.02910.539.985
60Model 2717.08419.68320.688.562.7866.5153.311.0410.5249.97
Table 3. Statistical test differences among RMSE for each group.
Altitude (meters)Angle (Degree)Overlap (%)
Pairs30m V 45m30m V 60m45m V 60m90° V 75°90° V 60°75° V 60°80% V 70%80% V 60%70% V 60%
Z-stat−0.662−2.252−1.369−2.517−2.958−1.3690.132−1.810−2.252
p-value0.5080.0240.1710.0120.0030.1710.8950.0700.024
ResultsNo differenceDifferenceNo differenceDifferenceDifferenceNo differenceNo differenceNo differenceDifference
Note: Z-critical = ±1.96 (95% confidence interval).
Disclaimer/Publisher’s Note: The statements, opinions and data contained in all publications are solely those of the individual author(s) and contributor(s) and not of MDPI and/or the editor(s). MDPI and/or the editor(s) disclaim responsibility for any injury to people or property resulting from any ideas, methods, instructions or products referred to in the content.