Article

Assessment of Land Degradation in the State of Maranhão to Support Sustainable Development Goal 15.3.1 in the Agricultural Frontier of MATOPIBA, Brazil

by
Antonia Mara Nascimento Gomes
1,
Andreza Maciel de Sousa
1,
Marcus Willame Lopes Carvalho
1,
Washington da Silva Sousa
1,
Marcos Vinícius da Silva
1,
Gustavo André de Araújo Santos
1,
Aldair de Souza Medeiros
2,
Jhon Lennon Bezerra da Silva
3,
José Francisco de Oliveira-Júnior
4 and
Nítalo André Farias Machado
1,*
1
Chapadinha Science Center, Federal University of Maranhão, Chapadinha 65500-000, MA, Brazil
2
Campus Professora Cinobelina Elvas, Federal University of Piauí, Bom Jesus 64900-000, PI, Brazil
3
Cerrado Irrigation Graduate Program, Goiano Federal Institute, Campus Ceres, GO-154, Km 218, Rural Zone, Ceres 76300-000, GO, Brazil
4
Institute of Atmospheric Sciences, Federal University of Alagoas, Maceió 57072-260, AL, Brazil
*
Author to whom correspondence should be addressed.
ISPRS Int. J. Geo-Inf. 2025, 14(9), 356; https://doi.org/10.3390/ijgi14090356
Submission received: 16 July 2025 / Revised: 7 September 2025 / Accepted: 15 September 2025 / Published: 17 September 2025

Abstract

Globally, land degradation represents both an environmental and socioeconomic challenge, necessitating continuous monitoring due to its impacts on ecosystem services. Given the substantial changes in land use and land cover in Maranhão, this study aimed to evaluate land degradation across the state between 2001 and 2023, based on Sustainable Development Goal (SDG) indicator 15.3.1. To this end, we integrated data on land cover (LC), soil organic carbon (SOC), and land productivity (LP) using the Trends.Earth algorithm (v.2.1.16), based on datasets from the MapBiomas platform (collections 9 and Beta) and MODIS (MOD13Q1 product), along with the application of the RESTREND model for climate adjustment. The results indicated that 39.56% of Maranhão’s territory showed signs of degradation, particularly in the central and northwestern (NW) regions, as well as parts of the southern (S) region. Stable areas accounted for 26.39%, while 32.08% were classified as improving, with notable trends in the southern and southeastern (SE) regions, suggesting vegetation recovery and more sustainable land management practices. The integrated analysis of LC, SOC stocks, and land productivity sub-indicators revealed that environmental degradation in Maranhão is strongly driven by the conversion of natural ecosystems into agricultural and livestock areas, especially in the central-eastern and NW regions. In conclusion, the findings highlight a misalignment with the SDG 15.3.1 target but also point to zones of stability and recovery, indicating potential for mitigation, restoration, and the implementation of sustainable land management strategies.

1. Introduction

Land degradation is a multifaceted and complex phenomenon, with a wide array of definitions found in the literature [1,2]. A comprehensive concept is provided by the United Nations Convention to Combat Desertification (UNCCD), which defines this phenomenon as the reduction or impairment of the biological and economic capacity of terrestrial ecosystems. It affects irrigated and rainfed agricultural crops, pastures, forests, and woodlands, and is caused by multiple factors such as erosion, loss of the soil’s physical, chemical, biological, or economic properties, and the persistent decline of natural vegetation cover [3]. AbdelRahman adopts an environmental perspective, defining land degradation as an additional component of environmental degradation, as it affects air and water pollution, contributes to biodiversity loss, and disrupts the Earth’s natural processes [4].
Land degradation represents one of the greatest challenges to human survival and environmental preservation, primarily because it reduces the potential of terrestrial ecosystems to provide essential goods and ecosystem services necessary for sustaining life [5,6]. The global economic impact of land degradation is estimated at an annual loss of USD 6.3 trillion in ecosystem service value [7]. Furthermore, projections indicate that land degradation may cause a 12% decline in global food production over the next 25 years, accompanied by an average increase in food prices of up to 30%, thereby posing a serious threat to food security [4,8]. Despite these alarming implications, approximately one-third of the world’s ecosystems are already degraded [4], and forecasts suggest that by 2050, nearly 90% could be affected to some degree [9].
Land degradation results from a complex interaction between natural factors and human activities [1]. Human actions are the main drivers of this process [10,11,12]. Human actions are the main drivers of this process [10,11,12]. The global demand for food, energy and infrastructure continues to grow. Population growth, expected to reach 8.6 billion by 2032 [13], increases pressure on terrestrial ecosystems. This leads to overuse of natural resources and loss of productivity in farming systems [4]. Ongoing climate change acts as an additional stressor, exacerbating the effects of degradation and further compromising the resilience of agro-environmental systems. These shifts in climate regimes amplify the impacts on soil productivity and establish a feedback loop between environmental instability and reduced food supply [1]. Estimates show that the productivity potential of the world’s ten major crops (barley, cassava, maize, oil palm, rapeseed, rice, sorghum, soybean, sugarcane, and wheat) has been affected by climate change [14]. Moreover, rising greenhouse gas (GHG) emissions could push approximately one-third of global food production beyond safe climatic thresholds by 2081–2100 [15].
Brazil is recognized as one of the global leaders in agricultural production [16,17]. However, the expansion of this sector presents challenges regarding the need to reconcile production growth with environmental preservation [18,19]. Historically, Brazilian agricultural expansion has intensified in areas located in the far north of the country (latitudes near 0°), particularly within the Cerrado biome [20,21]. This process has established the MATOPIBA region—a geographic area that partially encompasses the states of Maranhão, Tocantins, Piauí, and Bahia—as the country’s primary agricultural frontier [22,23]. Despite its economic success, agricultural expansion in MATOPIBA has led to significant environmental impacts, including predatory deforestation [24], biodiversity loss, habitat fragmentation [25], and recurrent wildfires [26,27,28], thereby compromising the ecological resilience of the landscape [24,29].
In this context, the state of Maranhão, with 33 million hectares distributed between the Cerrado (65%) and Amazon (35%) biomes [10,30], has been facing increasing threats to its environmental services and, consequently, growing socioeconomic vulnerability among rural populations—an issue that has drawn increasing concern [31,32,33]. As a result, much of Maranhão’s territory is undergoing degradation [10,34]. In 2023 alone, the state was responsible for 26.6% of all deforestation recorded in the Cerrado, leading among the MATOPIBA states, which together accounted for 75% of the total native vegetation loss in the biome [35].
To address environmental pressures and human demands, the United Nations (UN) established the 2030 Agenda with 17 Sustainable Development Goals (SDGs), including specific targets and indicators [36,37]. Within this framework, SDG 15 (Life on Land) aims to protect terrestrial ecosystems and includes Target 15.3, which focuses on the protection, restoration, and sustainable management of land ecosystems, forests, biodiversity, and the fight against desertification and land degradation. Progress toward this target is monitored through Indicator 15.3.1, which measures the proportion of degraded land using changes in land cover (LC), soil organic carbon (SOC), and land productivity [38,39,40].
In this context, the objective of this study was to assess land degradation in the state of Maranhão between 2001 and 2023 based on the UN’s Indicator 15.3.1. More specifically, it aims to identify and quantify environmental changes in landscape dynamics related to SDG 15, resulting from agricultural expansion in the state. To this end, geospatial techniques were applied to map and spatially delineate critical degradation hotspots, contributing to the development of effective strategies for mitigation, restoration, and sustainable ecosystem management in Maranhão, promoting a more sustainable development model.

2. Materials and Methods

2.1. Study Area

This study was conducted in the state of Maranhão, located in the Northeast region of Brazil (NEB), covering an area of approximately 329,651.495 km2 and home to a population of 6776,699 inhabitants (Figure 1). According to data from the Brazilian Institute of Geography and Statistics (IBGE), Maranhão has a population density of 20.56 inhabitants per km2, the lowest per capita household income (USD 187.125), and the lowest Human Development Index (HDI = 0.676) in Brazil [41]. Based on the Köppen climate classification, Maranhão’s climate is characterized by Tropical Savanna (Aw) and Monsoon (Am) types, with two well-defined seasons: (i) a rainy season from January to July, and (ii) a dry season from August to December. The state has an average annual precipitation of 1623 mm and an average temperature of 27.3 °C [42,43,44].
Maranhão stands out for its endemic biodiversity and ecological significance [10], occupying a strategic transitional zone between the Cerrado and Amazon biomes. The state also features a diverse hydrographic network (e.g., rivers, lakes, dunes, and mangroves), which plays a critical role in water regulation [45]. Additionally, Maranhão holds agricultural importance due to its production of key commodities such as soybeans, maize, sugarcane, and beef [20,22,46], as well as for serving as a major route for the export of these products through its port infrastructure.

2.2. Dataset

The dataset was compiled for the historical time series from 2001 to 2023, and a summary of the information is presented in Table 1. Land productivity data, represented by the Normalized Difference Vegetation Index (NDVI), were obtained from the MOD13Q1—Collection 6 product, provided by the MODIS (Moderate Resolution Imaging Spectroradiometer) sensor. The algorithm selects the best available pixel value from all 16-day acquisitions, with a spatial resolution of 250 m [47]. Data acquisition was performed using the Trends.Earth tool (http://trends.earth/), version 2.16 [48], within the Quantum GIS software [49].
Precipitation data were obtained from the CHIRPS dataset (Climate Hazards Group InfraRed Precipitation with Station Data), which provides global coverage at a 5 km spatial resolution, with public data accessible at: https://data.chc.ucsb.edu/products/CHIRPS-2.0/global_daily/netcdf/ (accessed on 20 February 2025). CHIRPS combines ground station precipitation measurements with satellite-based estimates, resulting in a continuous and consistent time series suitable for climate analysis [50].
The Trends.Earth tool uses global land cover data from the European Space Agency’s (ESA) and soil organic carbon data from SoilGrids (ISRIC) [40]. However, in this study, data from the MapBiomas platform were used. MapBiomas is a global and collaborative network that monitors environmental transformations using satellite imagery, machine learning, and cloud computing. Created in Brazil in 2015, the project has expanded and, by 2025, is present in 14 countries, covering all of South America and Indonesia. Currently, the MapBiomas Project receives financial support from 31 organizations. Among the main ones are: Skoll Foundation, Fundo Amazônia, Climate and Land Use Alliance (CLUA), Yield Giving, Ballmer Group, Instituto Alana, and Instituto Beja, with public data accessible at: https://brasil.mapbiomas.org/ (accessed on 12 February 2025).
Land cover data were obtained from Collection 9 of the MapBiomas Platform (https://brasil.mapbiomas.org/, accessed on 12 February 2025), which has a spatial resolution of 30 m and covers the entire Brazilian territory. MapBiomas uses images from Landsat 5, 7, and 9, analyzing them with machine learning algorithms to classify and monitor land use and land cover changes over the period from 1985 to 2023. Soil Organic Carbon (SOC) data were obtained from the Beta Collection of the MapBiomas platform (http://soildata.mapbiomas.org/, accessed on 26 July 2025) with a resolution of 30 m. The data were accessed and processed via Google Earth Engine (GEE) and integrated into QGIS for spatial and statistical analyses. Both products were resampled to a spatial resolution of 250 m.

2.3. Monitoring of SDG Indicator 15.3.1

The SDG Indicator 15.3.1 was estimated using the Trends.Earth tool for the period 2001 to 2023, following the Good Practice Guide (GPG) of the United Nations Convention to Combat Desertification, based on three sub-indicators: (i) Land cover, (ii) Soil organic carbon, and (iii) Land productivity [39]. These three sub-indicators are considered robust for identifying different dynamics of land degradation: from faster processes, such as changes in land cover or productivity, to slower transformations, which can be observed through reductions in carbon stocks [51].
According to this approach, if degradation is detected in any of the sub-indicators, the pixel is automatically classified as degraded in the overall indicator. This is a precautionary rule that ensures stability or improvement in other sub-indicators does not mask the effects of degradation in a single component [52]. A pixel is classified as stable when all three sub-indicators remain stable, and as improved when there is a combination of improvement and stability, with no occurrence of degradation in any of the sub-indicators.
For the land cover sub-indicator, the dataset from the MapBiomas platform [53], Collection 9 (Table 1), was used. The tool presents seven land cover classes: forest, grassland, cropland, wetland, artificial area, water bodies, and other land. However, minor adjustments were made to account for eight land cover classes, namely: forest, grassland, cropland, pasture, wetland, artificial area, other land, and water bodies. This adaptation aimed to improve the representation of land cover classes in the state of Maranhão.
For processing, the adapted land cover degradation typology matrix presented in Table 2 was applied. This matrix evaluates land cover changes by classifying the sub-indicator into three categories: improvement, stable, or degradation. Among the main adaptations made in this study, one stands out: the decision to classify the conversion from “Other land” to “Cropland” as degradation. Although the original methodology interprets this conversion as an improvement, in the present study it was treated as degradation. This choice is justified by the fact that these areas correspond almost exclusively to the Lençóis Maranhenses National Park, characterized by vast sand dunes that form lagoons during the rainy season. In July 2024, this region was officially designated as a UNESCO World Natural Heritage Site (https://whc.unesco.org/en/list/1611/, accessed on 28 August 2025).
In general, within the degradation typology matrix, areas that were converted from native vegetation or natural ecosystems to anthropogenic uses were classified as degraded. Areas were considered improved when the transition occurred in the opposite direction, and as stable when no changes in land cover class were observed during the assessment period.
To estimate changes in Soil Organic Carbon (SOC), cartographic land cover products were integrated with SOC data (0 to 30 cm) from MapBiomas Collection 2, using Equation (1). In this study, areas were classified as degraded when SOC loss was equal to or greater than 10%, and as improved when SOC increased by 10% or more [52].
SOC Final = SOC Ref   ×   Land   Cover   Coefficient
where SOCRef is the soil organic carbon during the reference period (2001). The land cover coefficient depends on global climatic regions, with the following values: Dry Temperate (f = 0.80), Humid Temperate (f = 0.69), Dry Tropical (f = 0.58), Humid Tropical (f = 0.48), and Tropical Montane (f = 0.64).
For the assessment of land productivity, the NDVI was used, calculated from reflectance data in the red and near-infrared bands (Equation (2)) derived from the MOD13Q1 product of the MODIS sensor, accessible via the Trends.Earth tool (Table 1). According to Bari et al. [40], this tool processes the data and generates annual integral NDVI values to calculate the ratio between healthy and stressed vegetation. In this study, land productivity dynamics were estimated based on the integration of trajectory, performance, and state metrics, following the methodology proposed by Sims et al. [39], allowing each pixel to be classified as undergoing degradation, improvement, or stability. However, we acknowledge that variations in threshold values can influence classification outcomes. The Residual Trends (RESTREND) analysis, available on the Trends.Earth platform, was applied to assess productivity trajectories using the CHIRPS precipitation dataset (Table 2) during processing. This approach aims to minimize the effects of natural climatic variability on vegetation productivity, thereby reducing the likelihood of misattributing anthropogenic degradation in areas where vegetation dynamics are influenced by regional patterns of water availability [39,54,55]. In Maranhão, where seasonality is pronounced, this methodology is particularly relevant, as climatic patterns can influence productivity without necessarily indicating degradation.
NDVI = ( NIR RED ) ( NIR + RED )
where NIR and RED correspond to reflectance in the near-infrared and red bands, respectively.

3. Results

3.1. Land Cover Dynamics

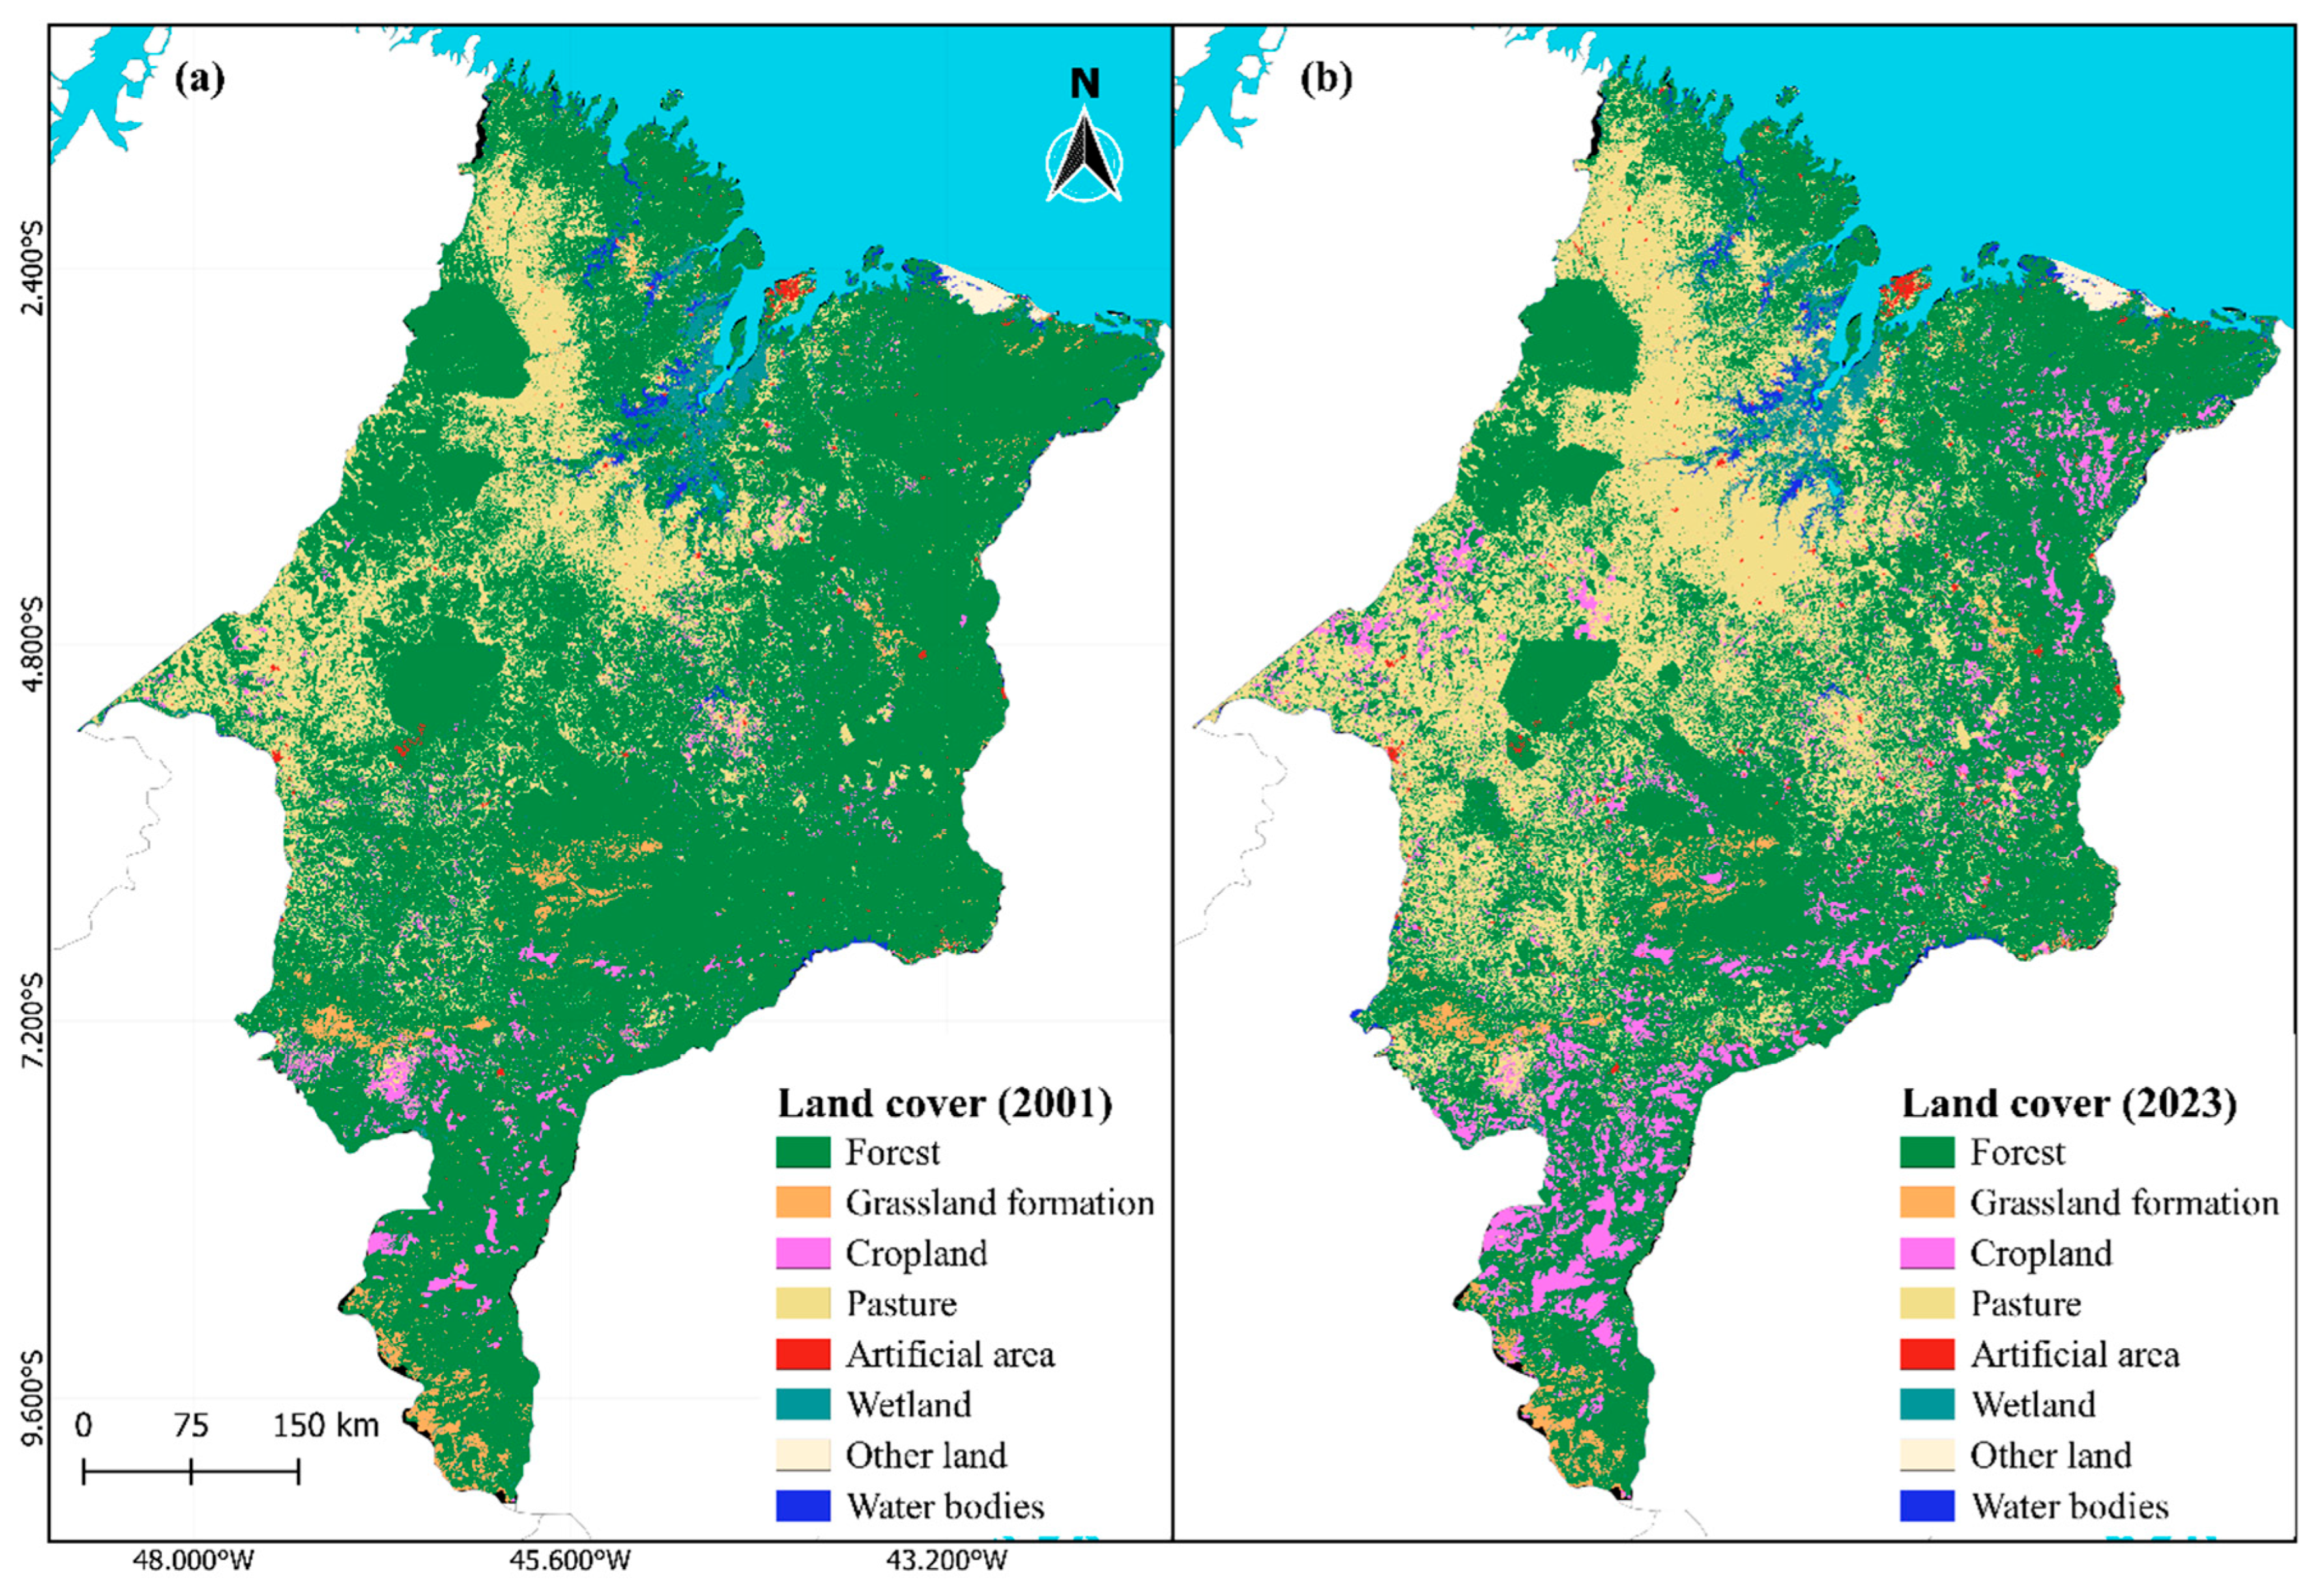
The results of land cover changes in Maranhão during the study period are presented in Table 3. In 2001, the forest class was the most representative, covering approximately 75% of the total area (248,590.89 km2), followed by pasture and cropland classes, which together accounted for about 19% (62,675.85 km2). Although the dominance of forest cover persisted in 2023, a reduction of 23.60% (58,677.50 km2) was observed, primarily in the western (W) region (Amazon biome), southern (S), eastern (E) (Cerrado biome), and central (C) areas, corresponding to the transition zone between the two biomes (Figure 2). In contrast, pasture and cropland classes increased by 76.36% (41,874.02 km2) and 192.36% (15,079.56 km2), respectively. This expansion was significant in the southern (S), southeastern (SE), and northeastern (NE) regions for cropland, and in the central (C), SE, S, and northwestern (NW) regions for pasture, reflecting a land use intensification process aimed at agricultural and livestock production (Figure 2).
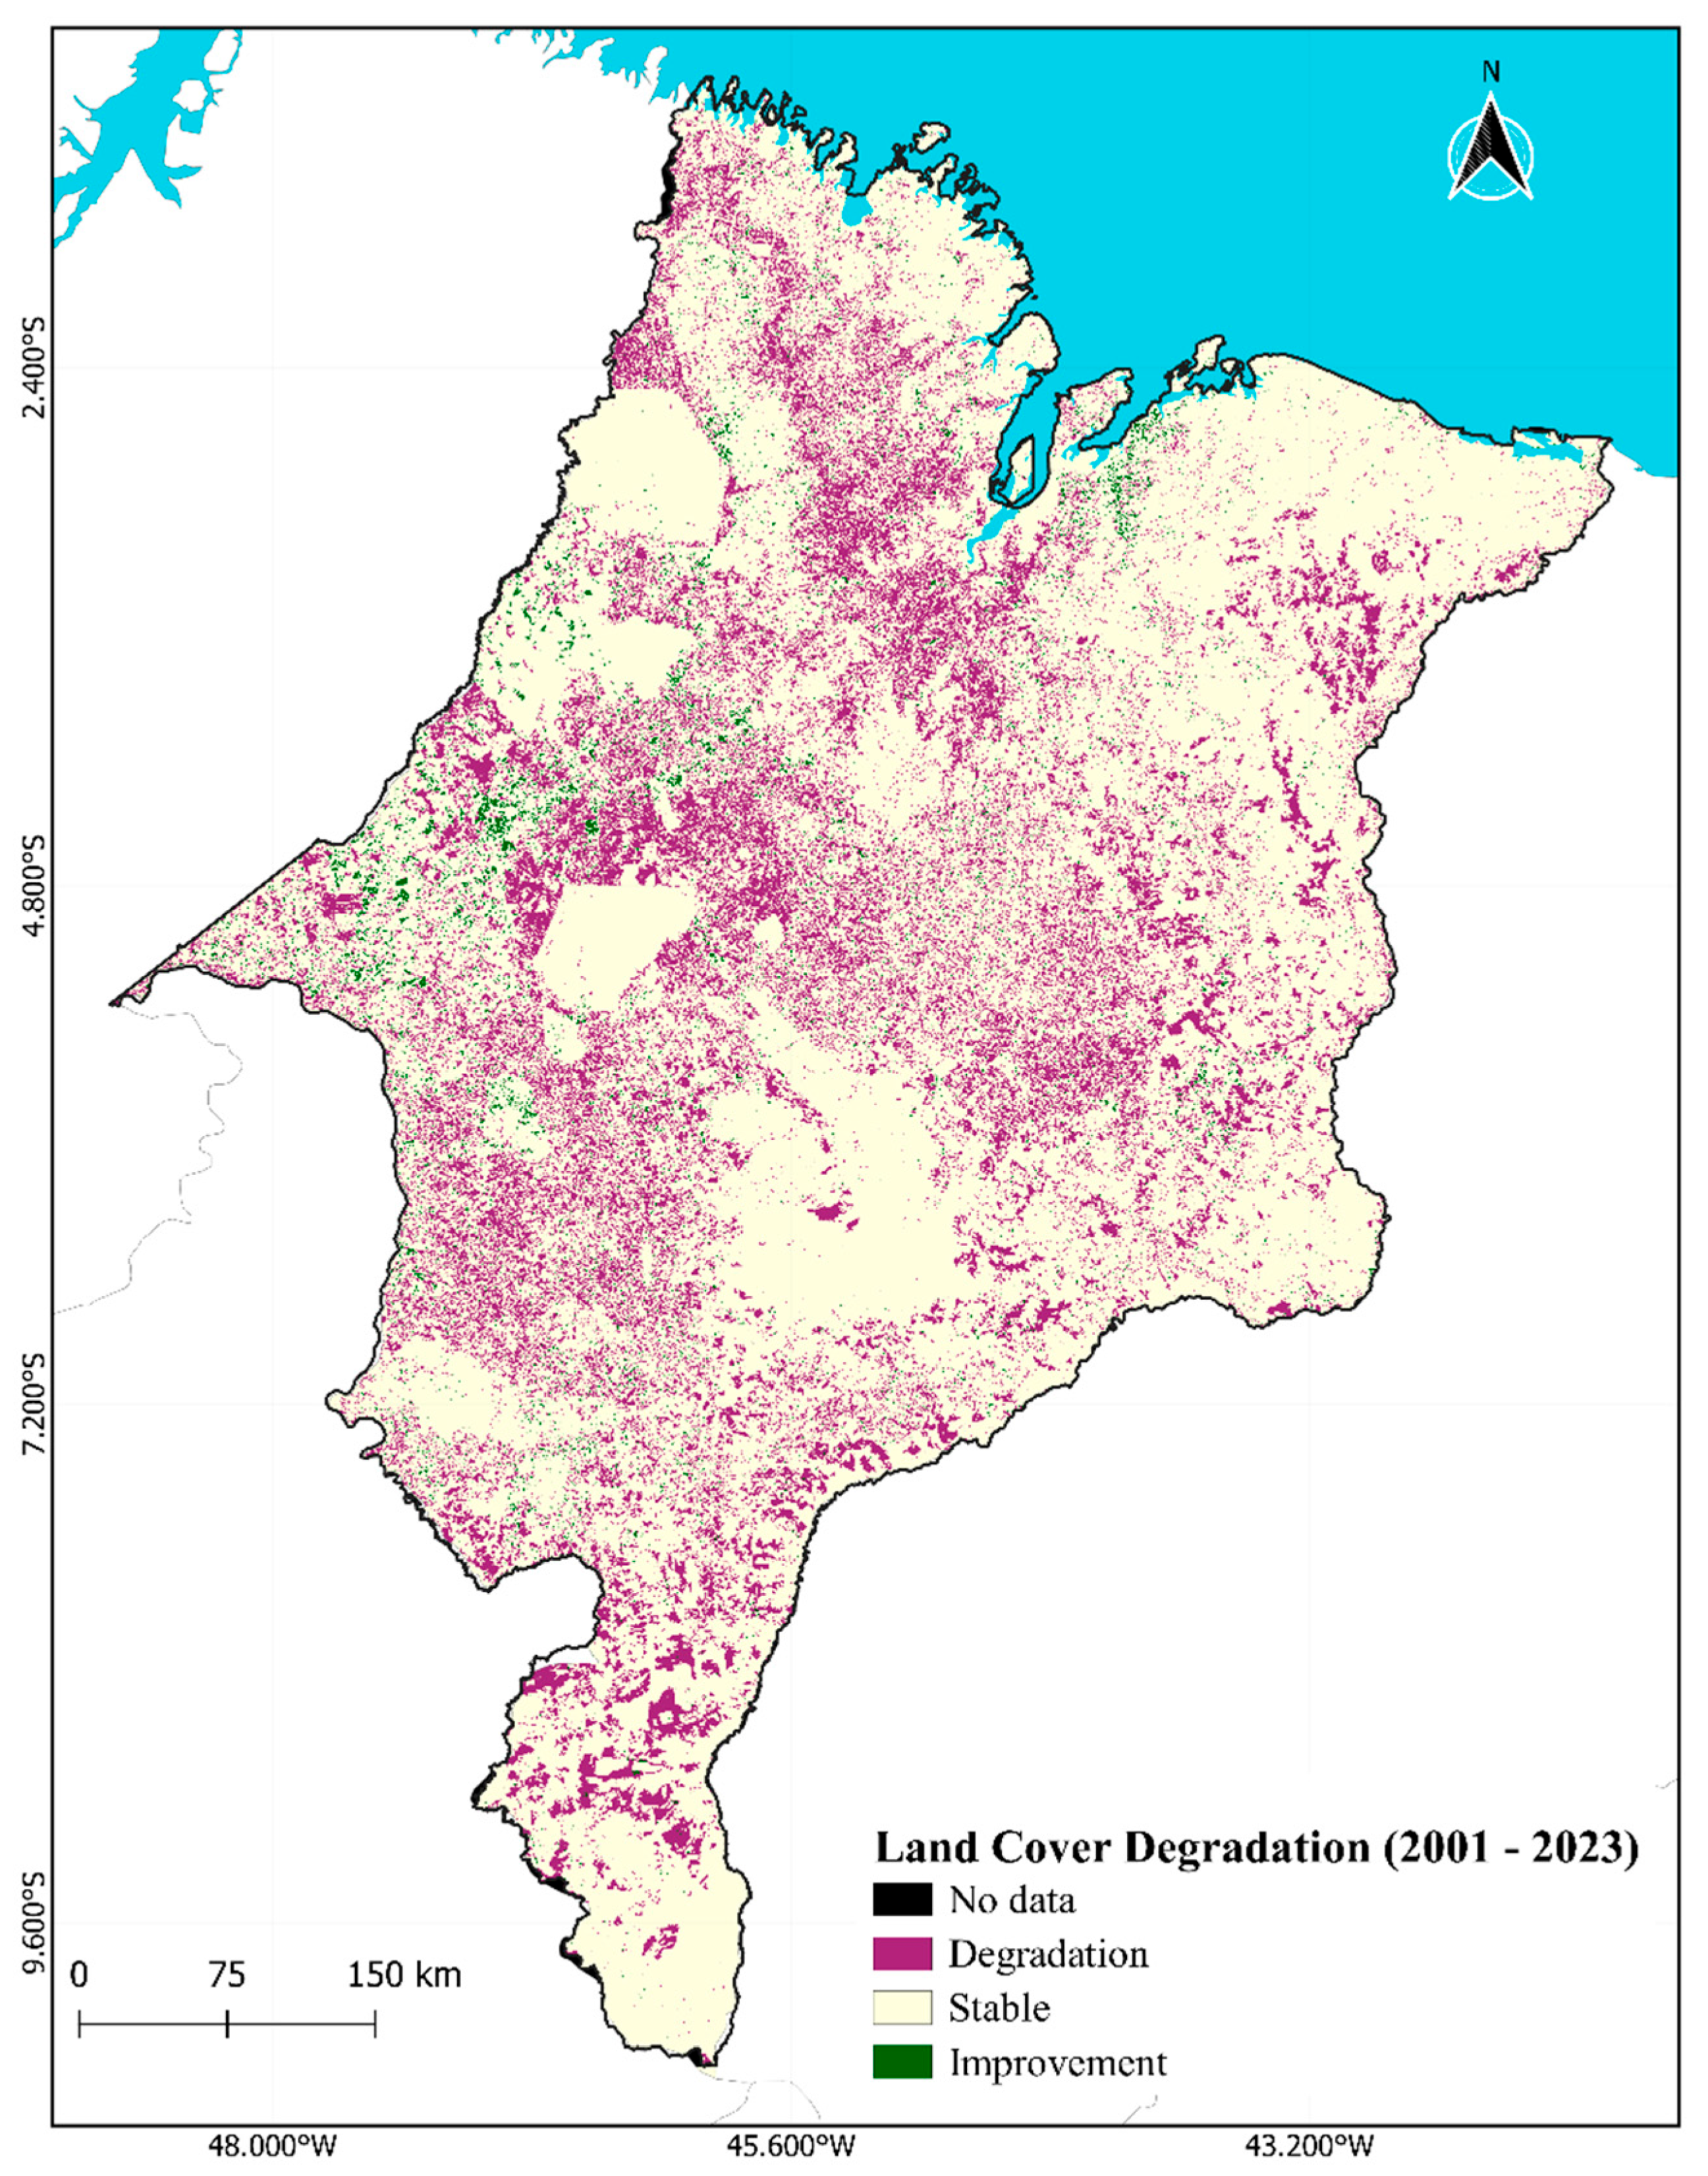
Deforestation is primarily associated with transitions from forested areas to pasture and cropland. Of the total forest loss, 44,938.92 km2 and 16,022.45 km2 were converted to pasture and cropland, respectively. Another notable transition is from grassland formation to cropland, with approximately 484.40 km2 converted to this class. Based on the assessment of the land cover sub-indicator, the results indicated that 19.91% of Maranhão’s total area was classified as degraded. These degraded areas are distributed across various regions of the state, with higher concentrations in the south (S), east-central, east (E), and northwest (NW) regions (Figure 3). However, the majority of the territory, corresponding to 78.22%, was considered stable, showing no significant land cover changes over the analyzed period. Areas classified as improved accounted for 1.69% of the total, with localized distribution mainly in the west-central (WC) and northwest (NW) regions (Figure 3). The land cover change matrix for the period 2001 to 2023, areas in km2, is presented in Table 4. In this study, about 0.17% of Maranhão’s territory was not accounted for due to missing data.

3.2. Soil Organic Carbon Stock Dynamics

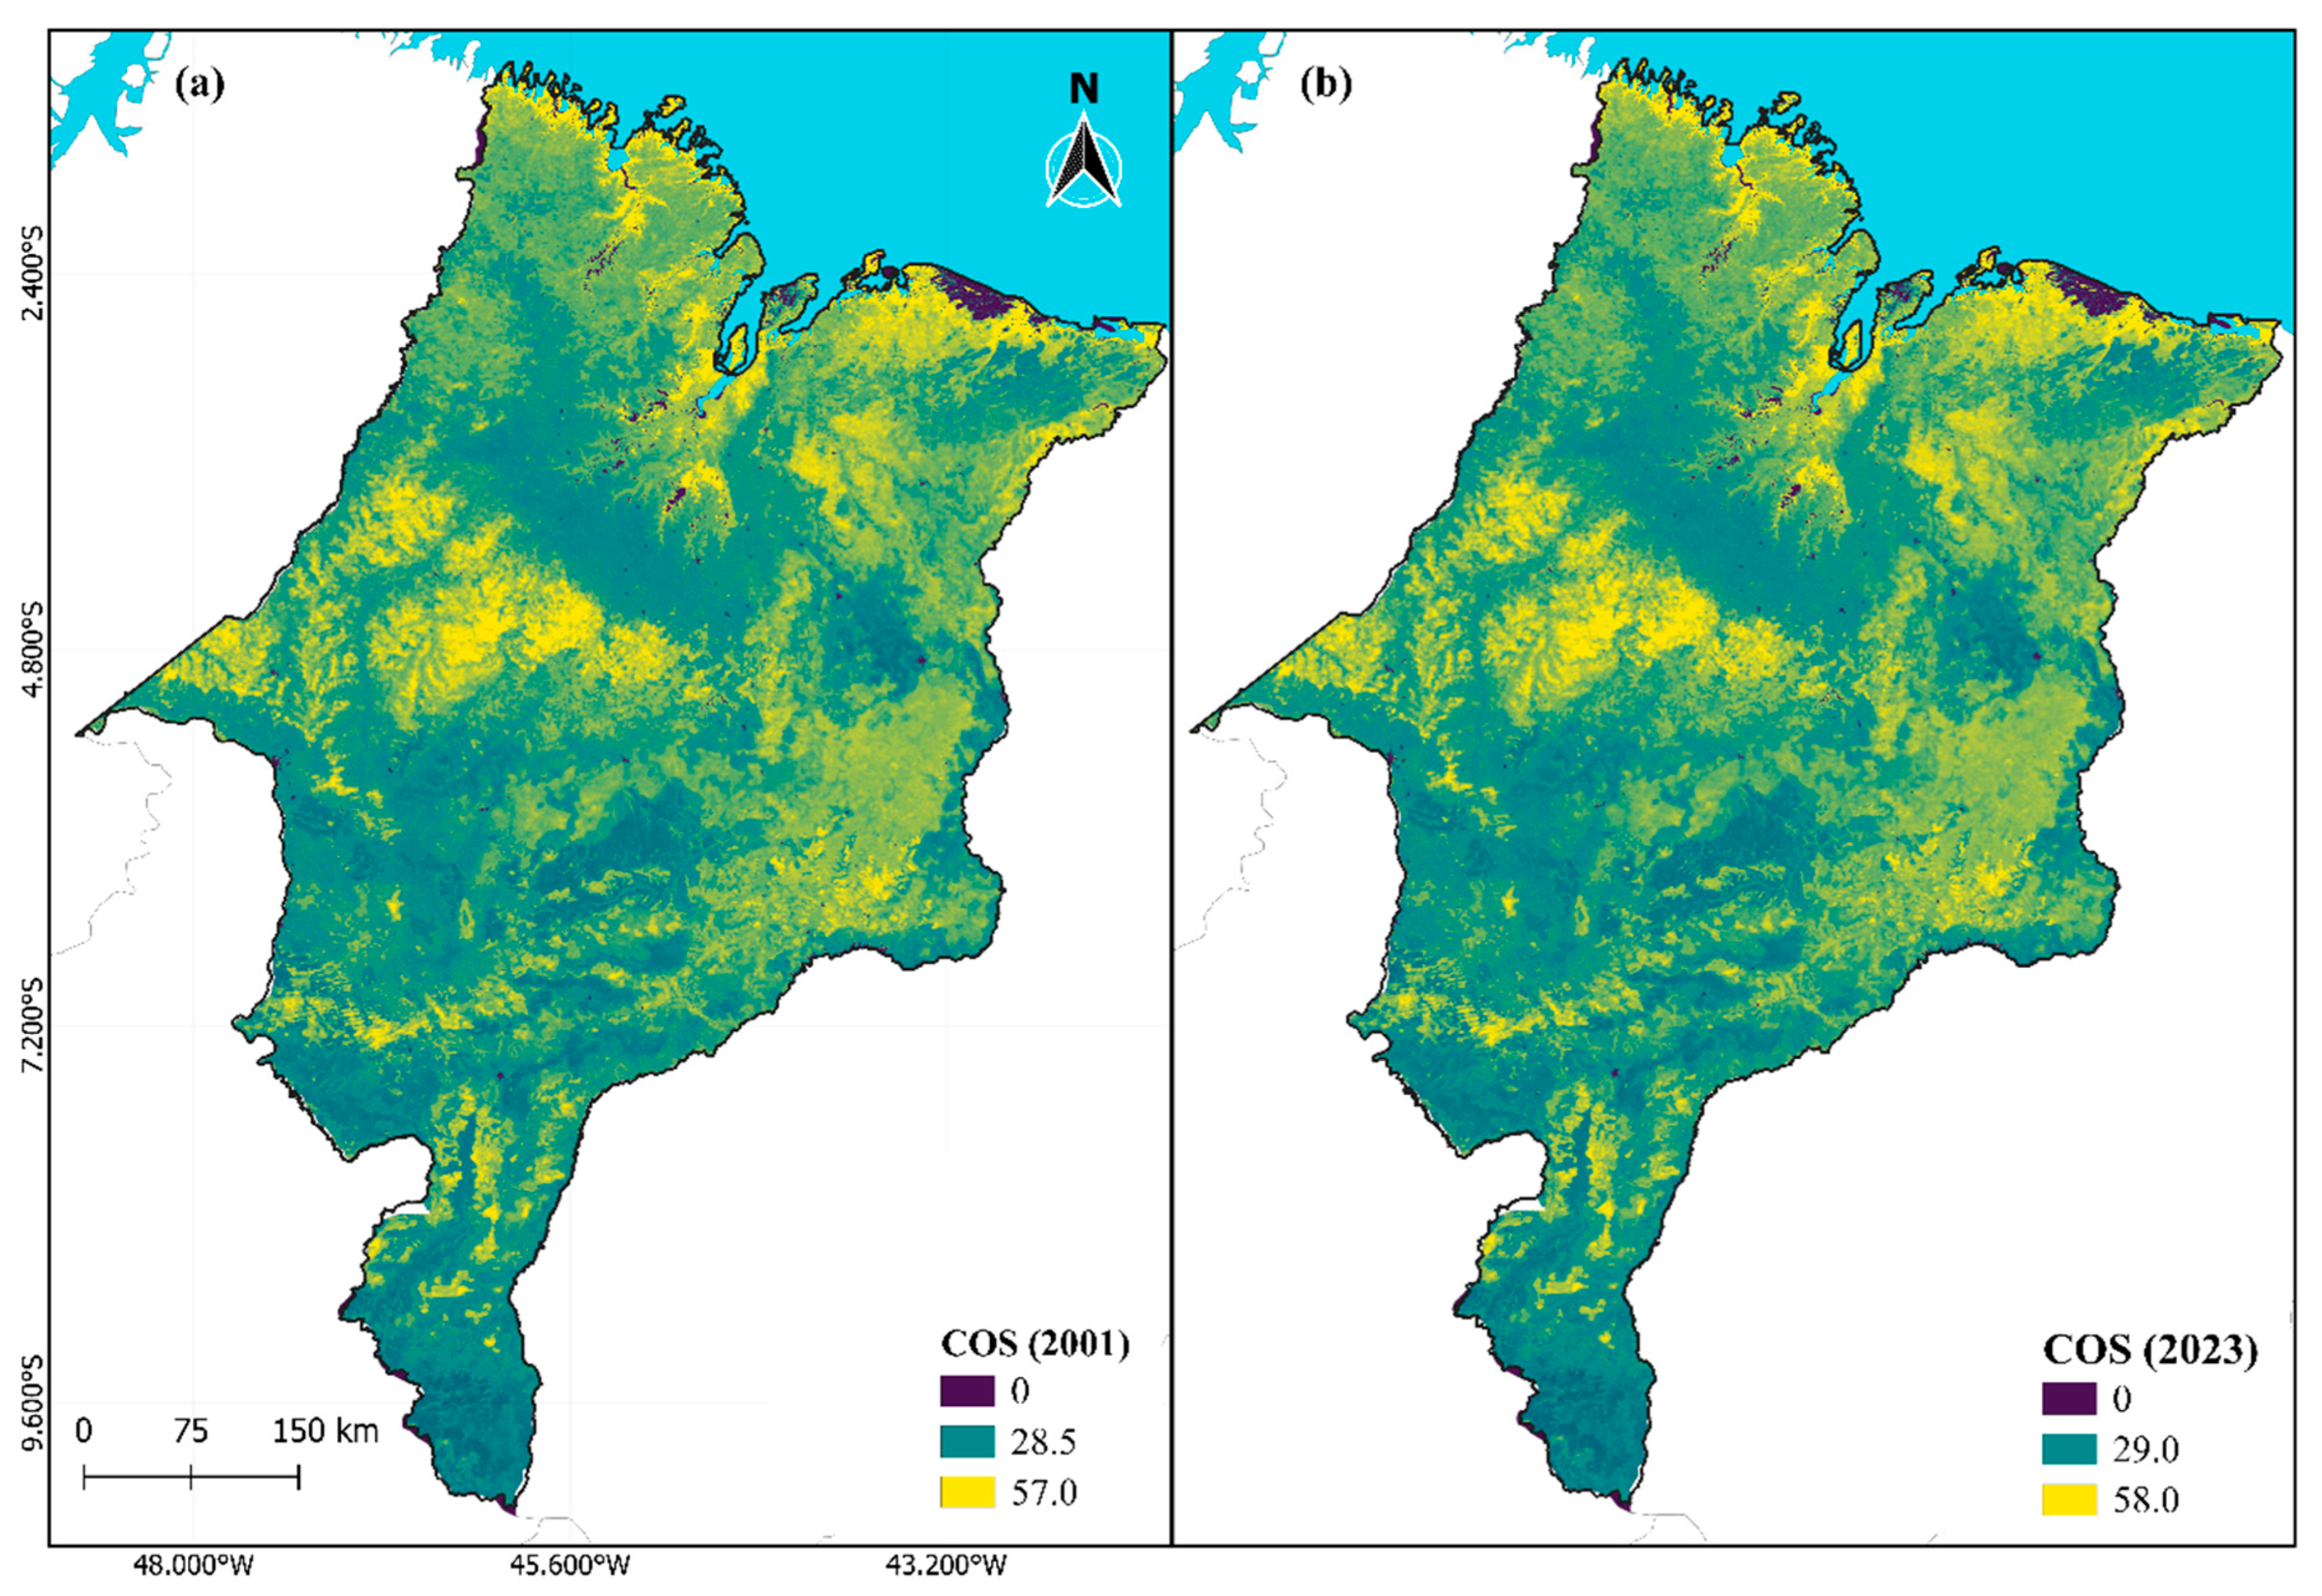
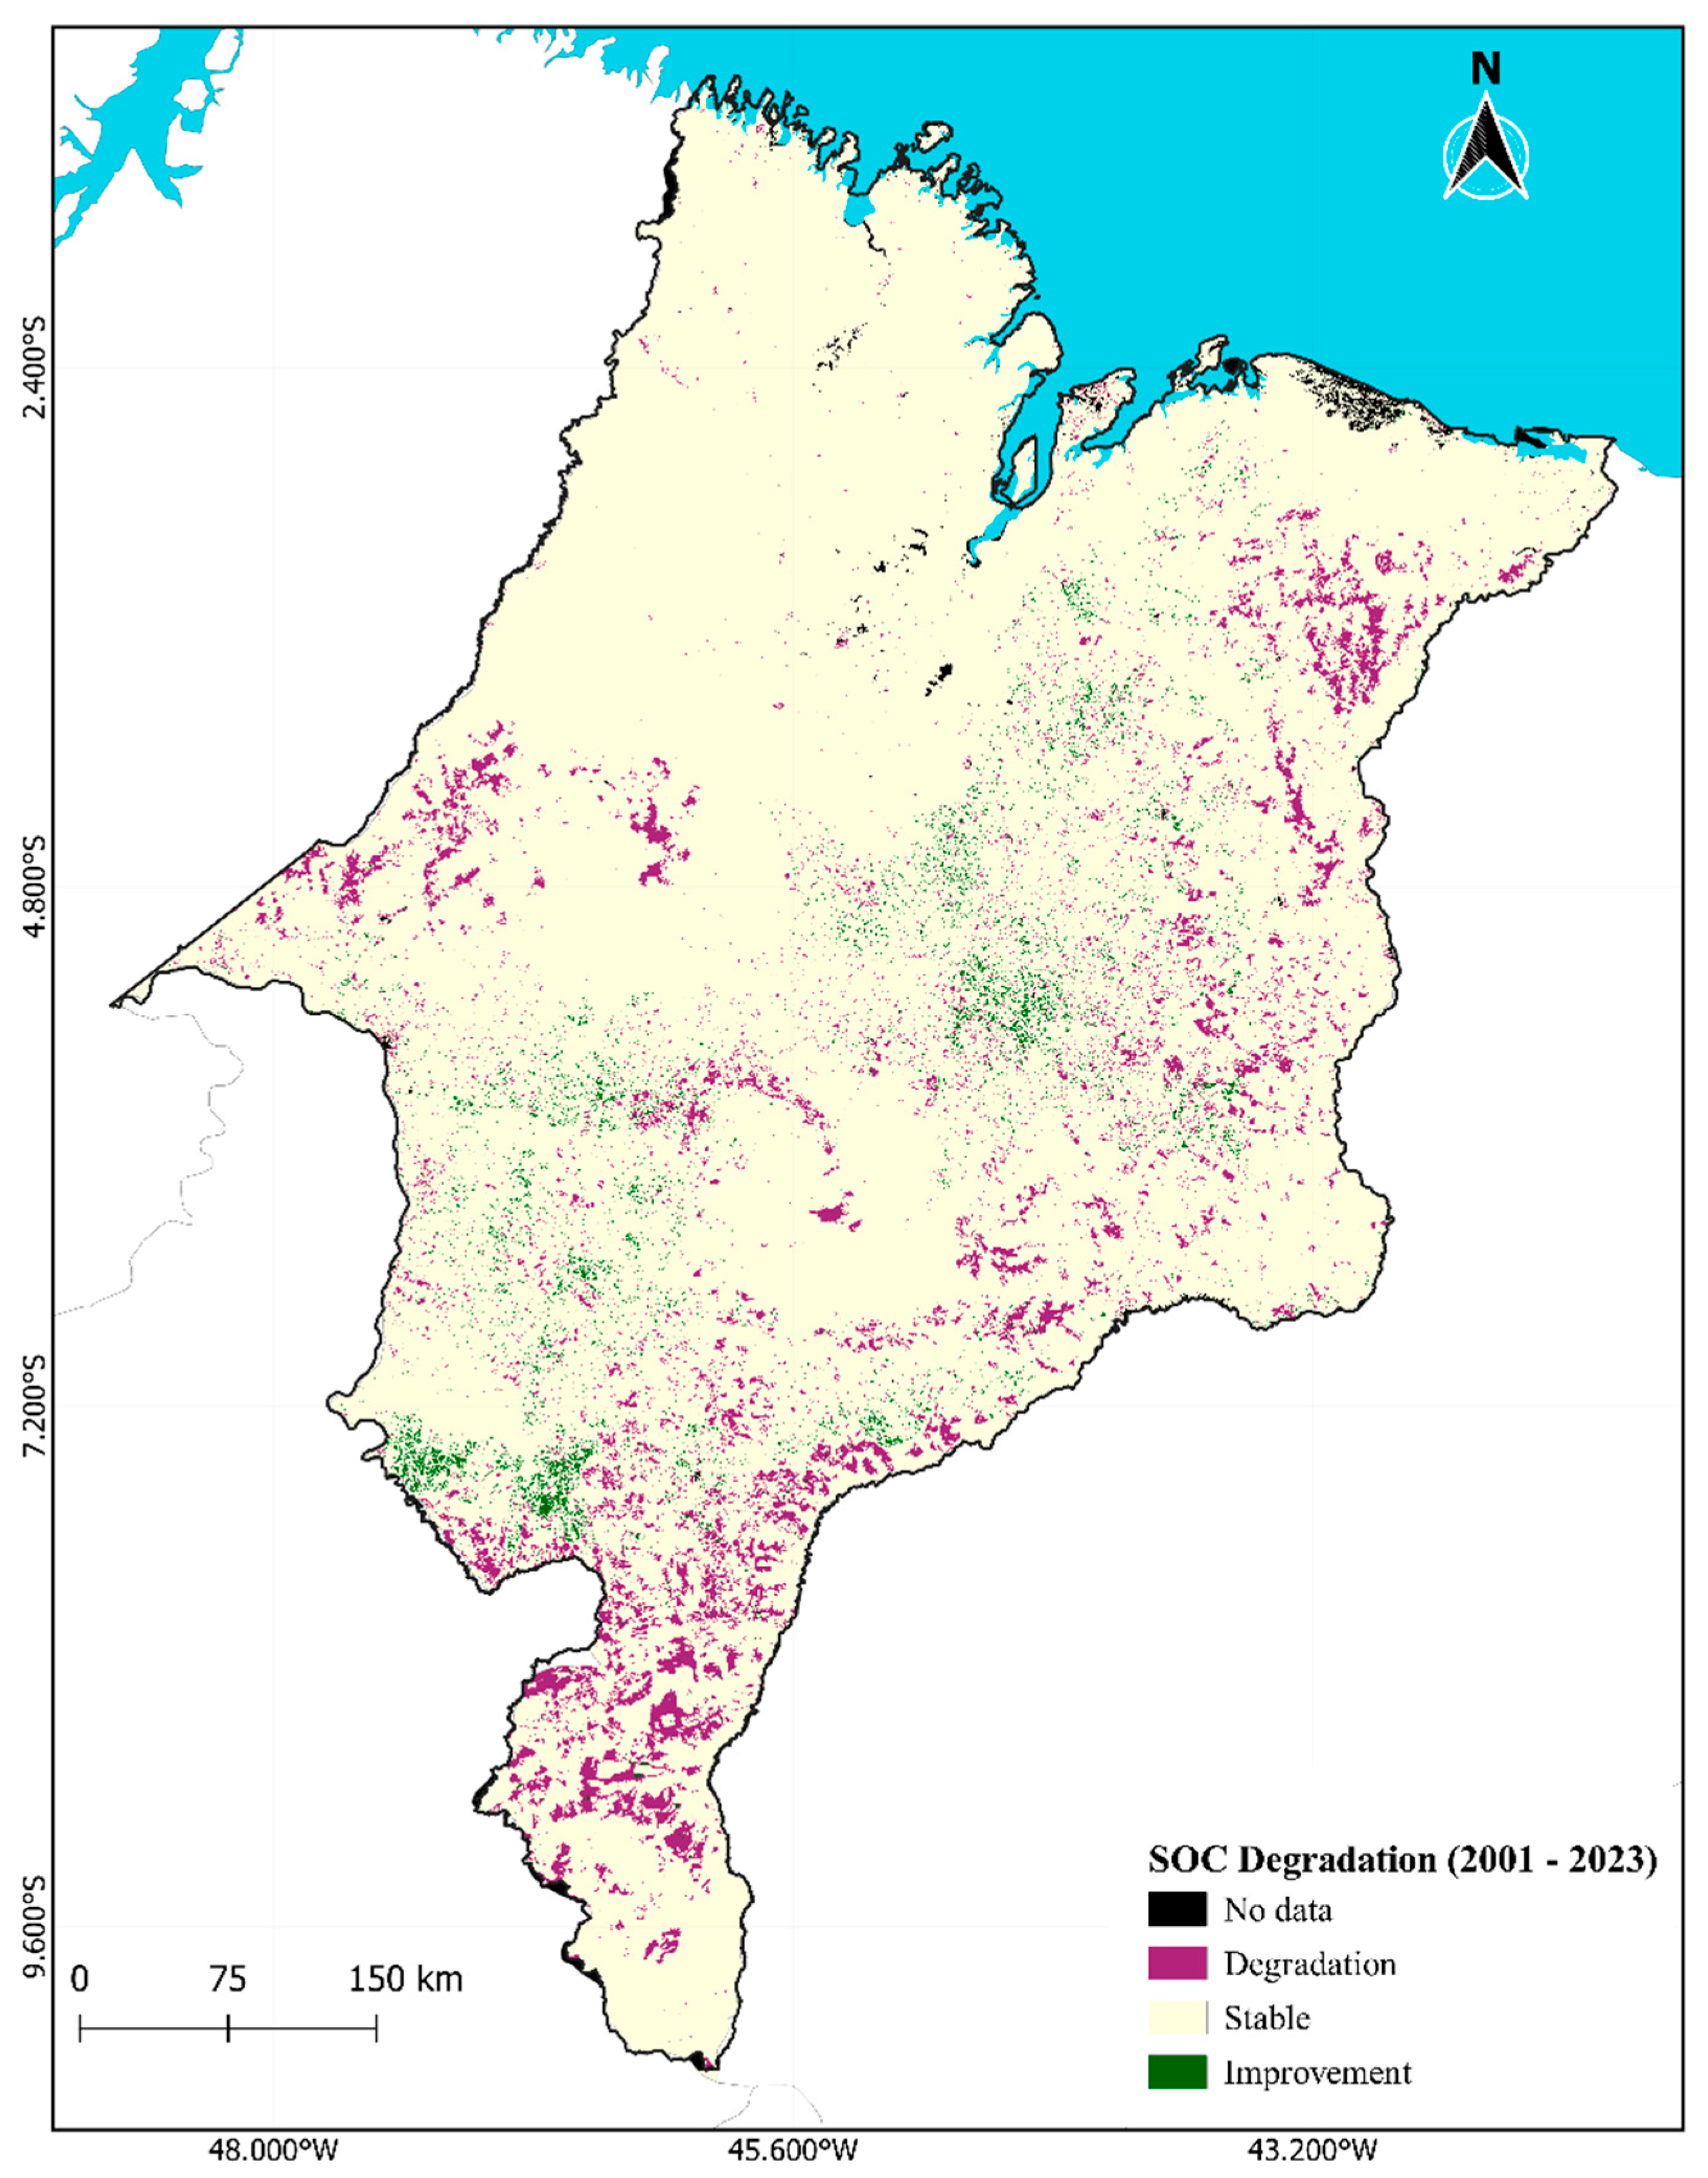
The spatial distribution of soil organic carbon (SOC) stocks in the state of Maranhão is shown in Figure 4, while the average values per land cover class are presented in Table 5. Higher SOC densities were found in wetland and forest classes, with average values of 46.77 and 37.80 Mg ha−1 in 2001, and 46.19 and 38.12 Mg ha−1 in 2023, respectively. In contrast, the lowest concentrations were recorded in artificial areas and other lands. Average SOC stocks per hectare remained relatively stable in forest, grassland formation, and pasture classes, while significant losses per unit area were observed in agricultural areas. However, when considering total stock per land cover class area, forest and grassland formation areas showed accumulated losses of 215.7 and 2.1 million Mg, respectively, while cropland and pasture classes showed increases of approximately 37.7 and 158.4 million Mg of SOC between 2001 and 2023, due to the considerable expansion of these classes into native vegetation areas. Due to this dynamic, an estimated loss of 14.2 million Mg of SOC was accounted for across the Maranhão territory. Analysis of SOC changes indicated that 1.26% of Maranhão’s territory showed improvement, 92.07% remained stable, and 6.09% were classified as degraded (Figure 5).

3.3. Land Productivity Dynamics

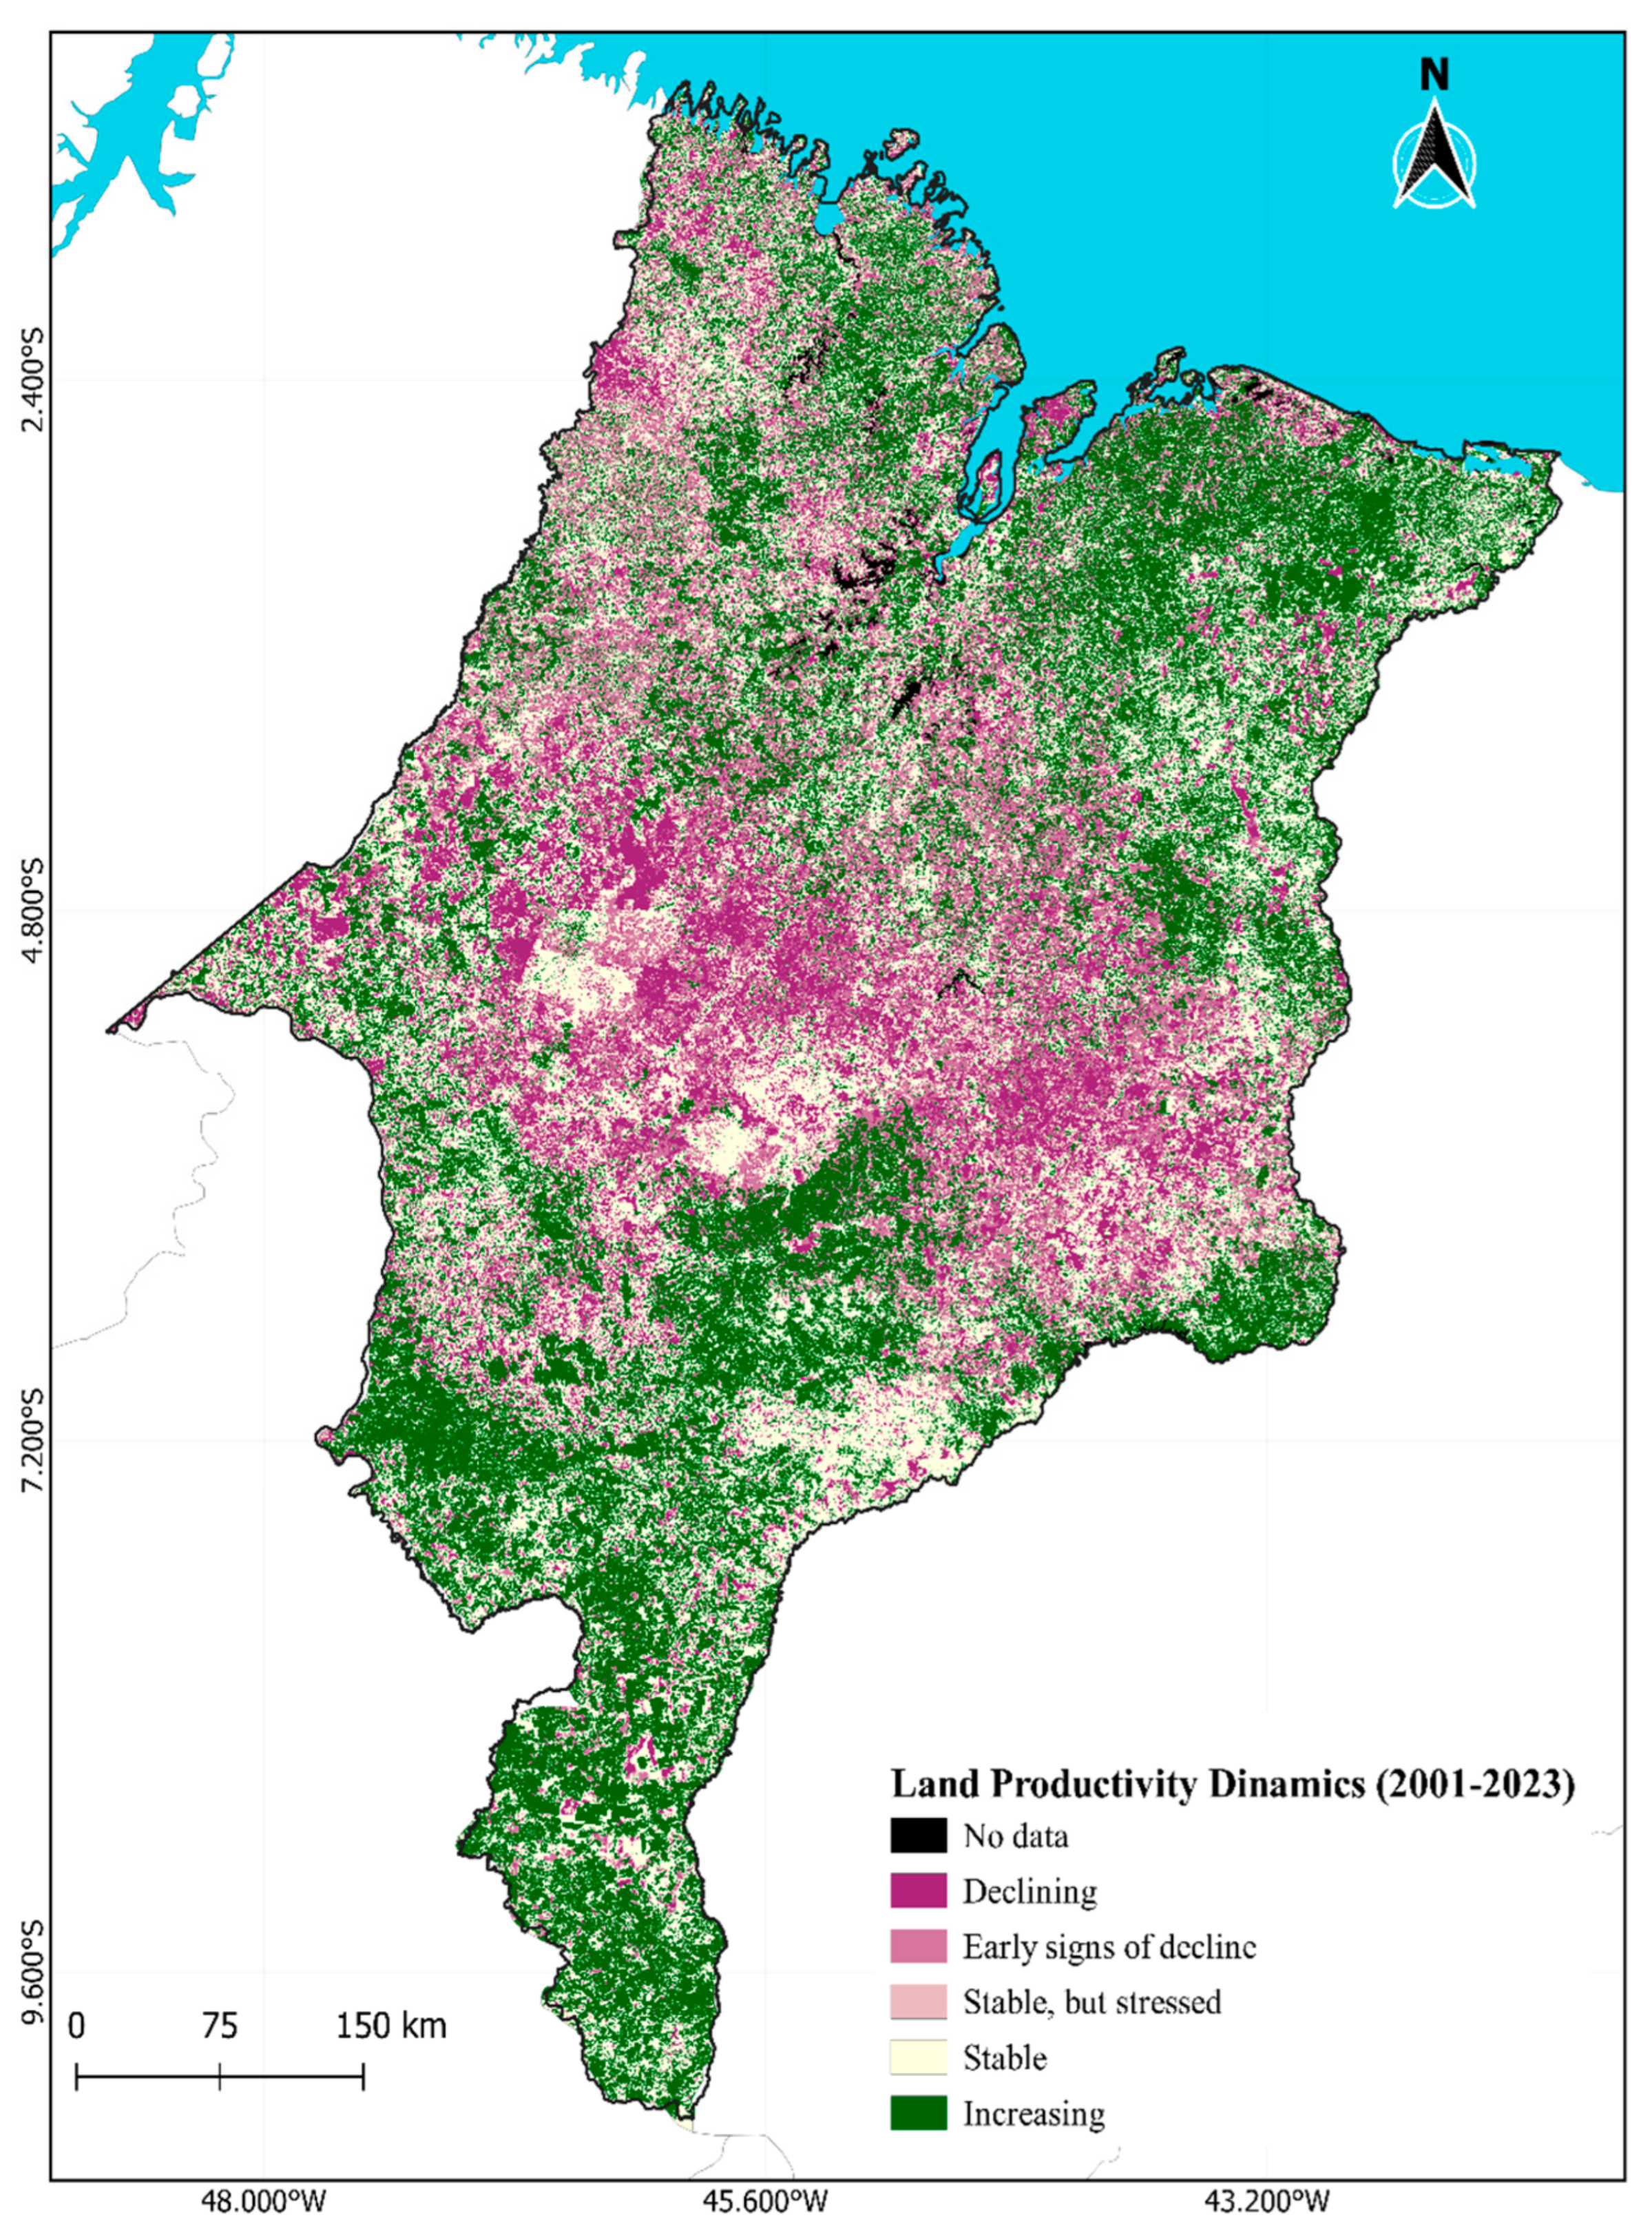
Approximately 35.28% of Maranhão’s total area showed an improving trend, 34.41% remained stable, and 30.04% was classified as undergoing degradation, with 13.10% in decline and 16.94% exhibiting early signs of decline. Additionally, only 0.26% of the area could not be evaluated due to lack of data (Table 6). Most areas experiencing degradation or early decline are widely distributed in the central, eastern, and western regions of the state, reflecting possible anthropogenic pressures associated with intensive land use, deforestation, and unsustainable practices. Areas with an improving trend are mainly concentrated in the southern, southeastern, and parts of the northeastern regions, which may indicate recovery processes or sustainable productive intensification in these zones. Stable areas, although scattered, appear predominantly in the north-central region and in some stretches of the western and far northern regions (Figure 6). The land cover classes contributing most to the areas of productivity degradation were forest and pasture, with 44,297.97 km2 and 41,212.93 km2, respectively. However, these same classes also represented the largest extents of areas showing increasing productivity trends, with 79,699.11 km2 for forest and 20,472.98 km2 for pasture. Agricultural areas showed 8378.20 km2 undergoing degradation and 7111.06 km2 showing improvement. Other land cover classes (artificial area, wetland, and other land) represented smaller portions of the total surface but also registered dynamics of change, mainly within the stability and degradation categories.

3.4. SDG Indicator 15.3.1

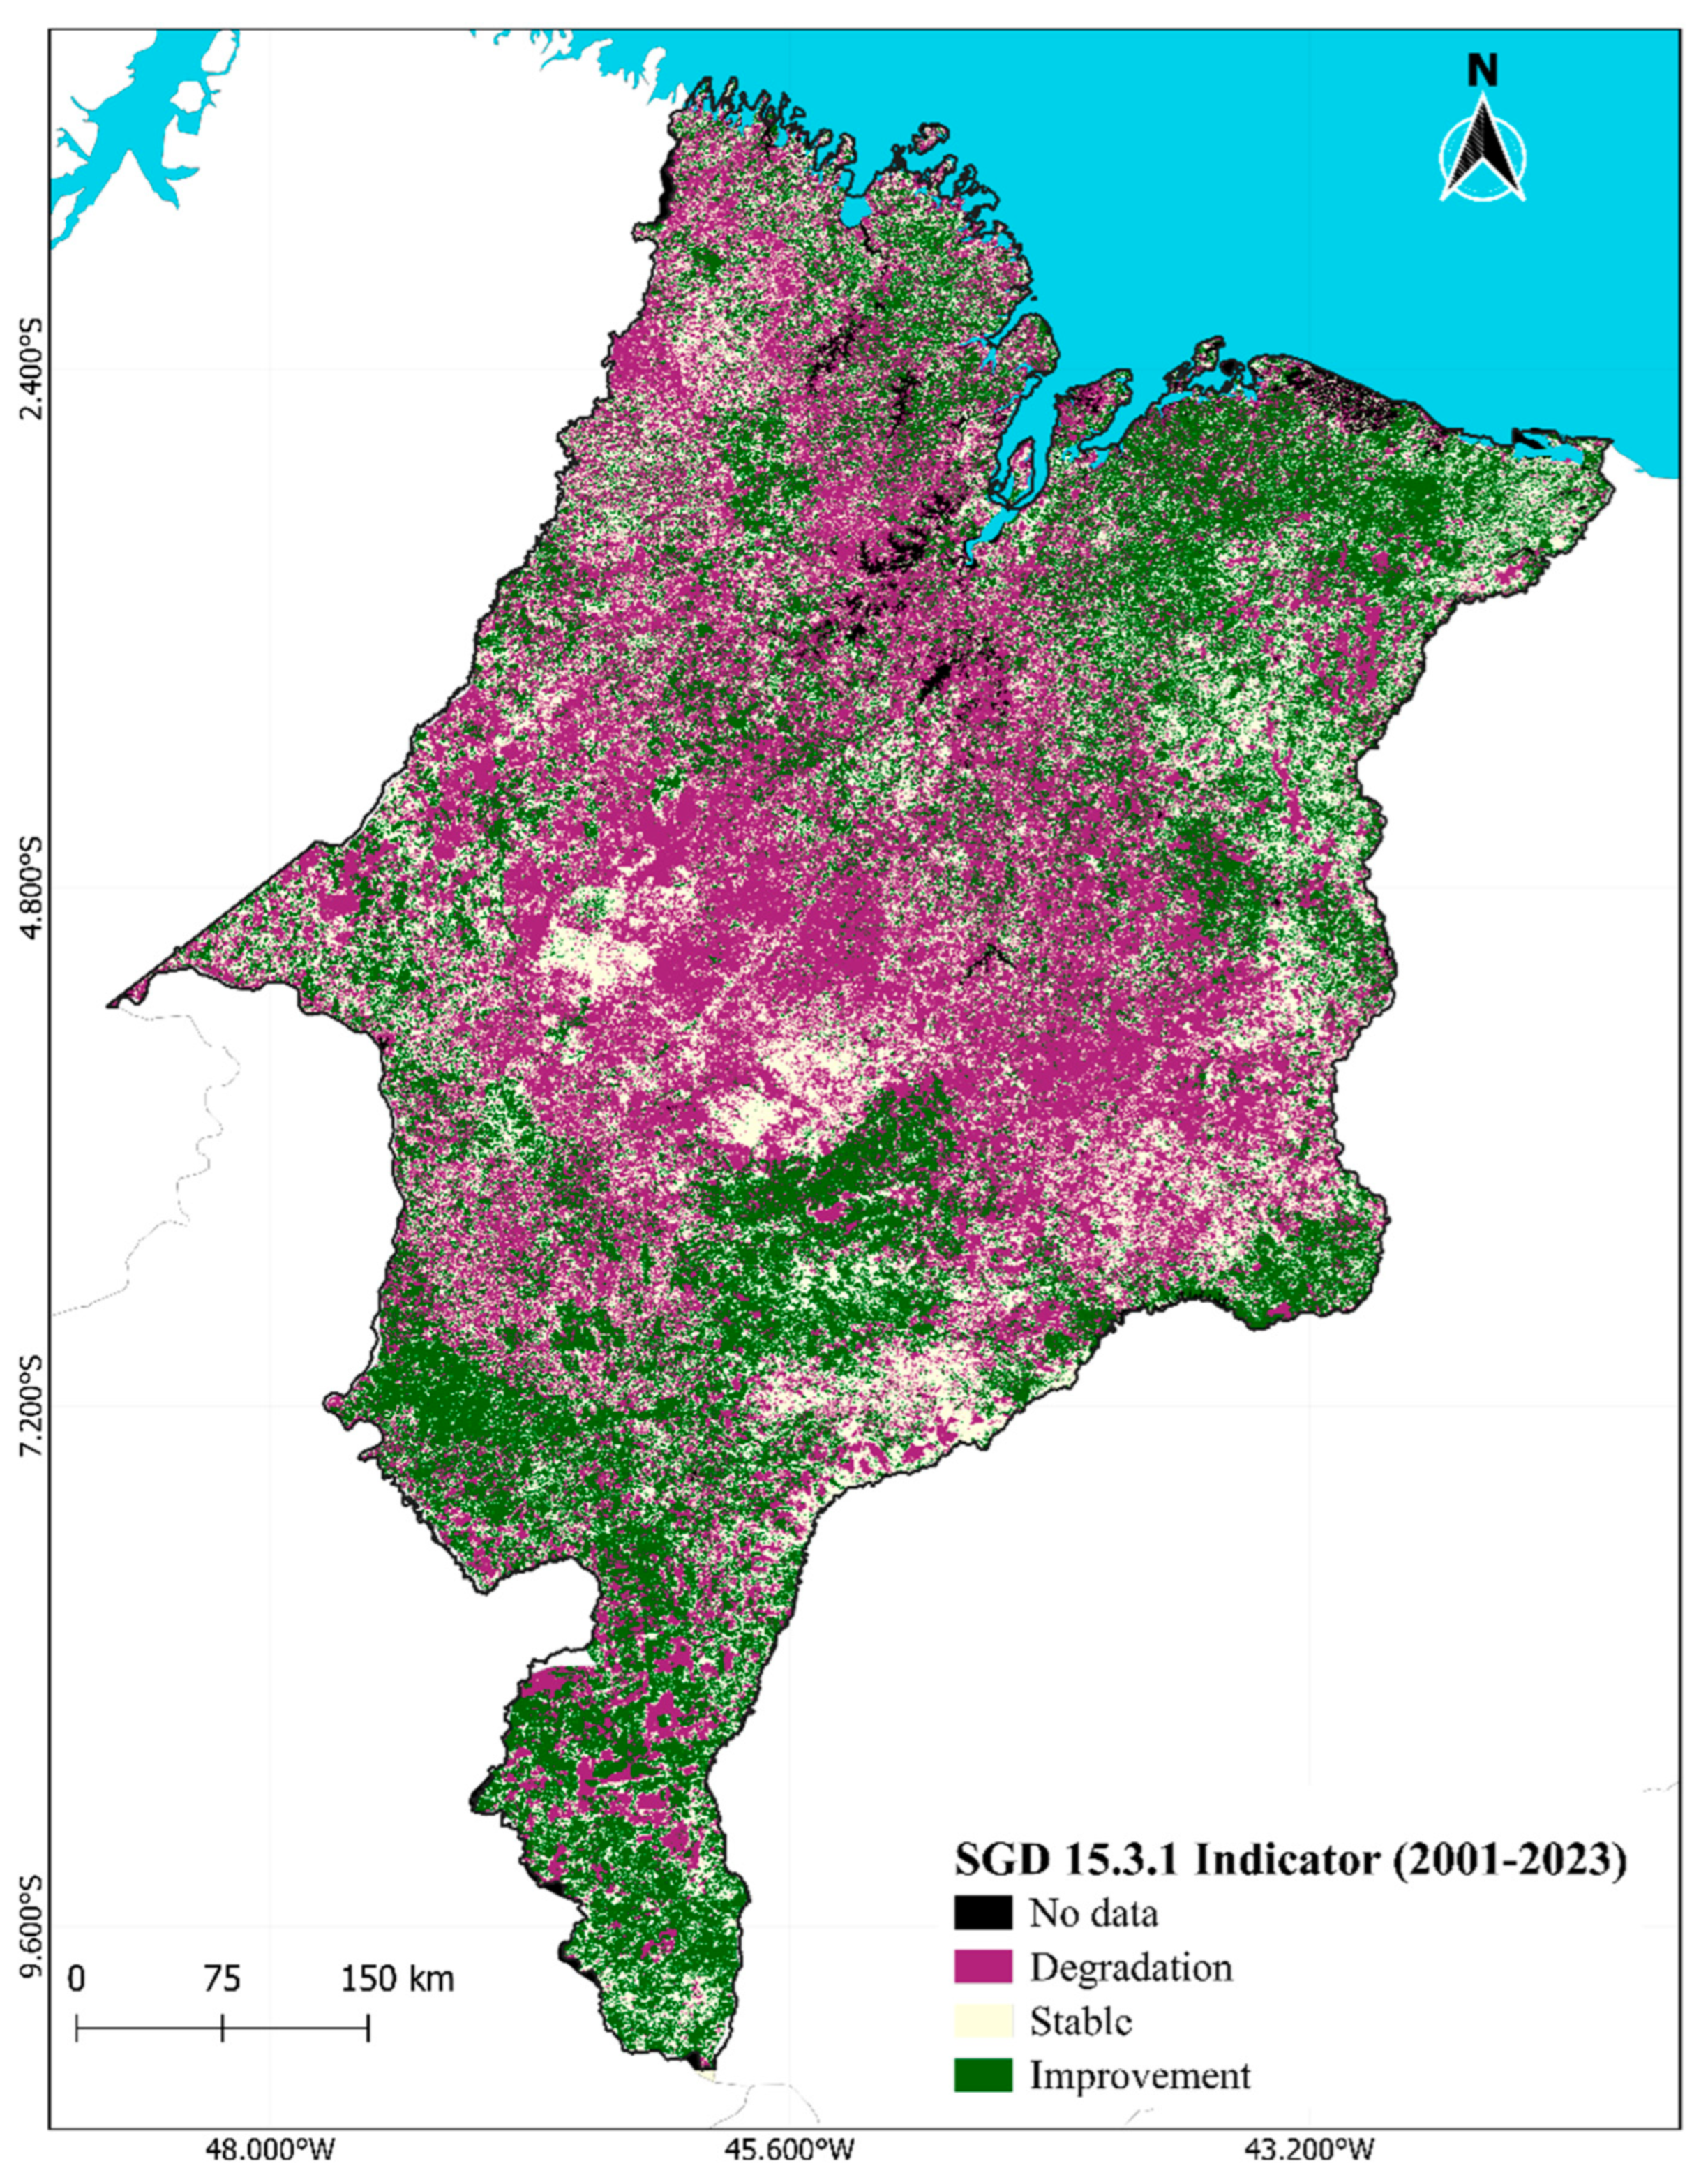
Figure 7 shows the spatial distribution of SDG Indicator 15.3.1, based on the integrated assessment of the three sub-indicators, in the state of Maranhão for the period 2001 to 2023. It was found that the majority of Maranhão’s territory, equivalent to 39.56%, exhibited signs of degradation. The degraded areas are distributed mainly with higher concentrations in the northwest (NW) and east-central regions, as well as scattered areas in the northeast (NE) and south (S) of the state. This degradation is largely associated with socioeconomic pressures on natural resources, which directly affect the analyzed indicators. On the other hand, 26.39% of the total area remained unchanged, indicating possible resilience in environments where the sub-indicators remained stable. These stable areas are dispersed, with significant presence in the central, NE, and southwest (SW) regions, along with localized spots in the S and NE of Maranhão. A total of 32.08% of the territory showed signs of improvement, while 1.97% could not be evaluated due to data unavailability. The areas showing improvement are predominantly concentrated in the S, southeast (SE), and parts of the NE regions, indicating vegetation recovery processes and reduced environmental pressure, supported by strategies for rational use of natural resources.

4. Discussion

4.1. Land Cover Dynamics

Land cover in the state of Maranhão has been historically dominated by forest formations. However, the results obtained (Table 3) indicate a continuous decline in these areas, with significant expansion of pasturelands and croplands. This trend is recurrent in various regions of Brazil and has been reported in multiple studies [11,53,56,57,58]. In Maranhão, the intensification of forest vegetation loss began primarily in the western portion (Amazon region), driven by occupation and development policies implemented during the military regime, such as road construction and incentives for large agricultural projects on public lands [59]. This infrastructure promoted the expansion of logging centers and railway construction aimed at mineral exports, notably the Carajás Project connected to the port of Maranhão [60].
Another factor related to vegetation suppression is the Japan–Brazil Cooperation Program for the Development of the Cerrado (PRODECER), which, starting in the 1990s, strongly encouraged mechanized agriculture in the southern mesoregion of Maranhão, especially focused on soybean monoculture [23,61,62,63,64]. Over time, this agricultural frontier expanded eastward, reaching municipalities such as Anapurus, Brejo, Buriti, and Chapadinha [64,65,66]. According to data from the Brazilian National Institute for Space Research (INPE) [67], Maranhão led Cerrado deforestation in 2023, with a loss of approximately 2927.52 km2 of native vegetation. However, Maranhão had already stood out in 2018 as the state with the largest deforested area in the country [68].
Vommaro et al. [33] highlighted that 29.3% of Maranhão municipalities exhibit low native vegetation indices. Silva Júnior et al. [10] reported that the Amazon forests in Maranhão have collapsed, with only 24% of their original coverage remaining. More recently, Santos et al. [69] reported advances in agriculture and livestock around the Ciríaco Extractive Reserve (RESEX). Similarly, conservation areas such as the Gurupi Biological Reserve (REBIO) and the Awá-Guajá, Caru, and Alto Turiaçu Indigenous Lands have also suffered from anthropogenic use, due to logging facilitated by access roads [70].
The study’s results indicated that approximately 20% of Maranhão’s territory was classified as degraded based on the land cover sub-indicator, reflecting the advance of anthropogenic activities over natural ecosystems and underscoring the need for public policies to halt environmental degradation and promote sustainable soil use. Changes in land cover and use directly impact biophysical, biochemical, and socioeconomic processes, leading to environmental degradation and social vulnerability [71,72,73,74]. Urbanization, for example, modifies natural cycles and degrades habitats [75]. Similarly, conventional agricultural practices and production intensification contribute to severe environmental impacts [76,77].
Overall, observed land cover changes are closely linked to economic activities, especially agricultural expansion, which drives the conversion of native areas. Transition matrix data reinforce that agriculture and livestock are the main drivers of native vegetation suppression. Between 1985 and 2017, pasture area increased by 46% and cropland by 172% in Brazil [53], directly related to the advance of the MATOPIBA agricultural frontier, one of the most active land conversion regions in the country [18,63,78,79,80]. Globally, agricultural expansion is one of the main causes of deforestation in tropical regions [81,82,83], often driven by a development model focused on economic growth that does not always translate into human well-being. In Maranhão, there is a disconnect between agricultural production growth and social indicators, as the state presents high poverty and inequality rates, as well as land conflicts [41,65].
Another relevant advance refers to artificial areas, which, although small in proportion, have shown significant growth over the last two decades, especially in municipalities on Maranhão Island, home to three of the state’s most populous cities, including the capital São Luís. This growth is driven by urbanization, real estate expansion, and industrial and tourism projects [41,84].

4.2. Changes in Soil Organic Carbon

SOC stocks are higher in forested areas and wetlands, as evidenced in this study (Table 5) and supported by other authors [23,85,86]. This pattern is related to a combination of ecological, physical, and biochemical factors that favor the accumulation and preservation of organic matter in these environments [87,88,89]. In forests, the high vegetation density contributes to intense biomass production and continuous deposition of organic residues such as leaves, branches, and roots, which feed soil carbon content [90]. Dense vegetation cover also protects the soil from erosion and reduces direct solar radiation exposure, limiting decomposition and mineralization rates of carbon [91]. As a result, natural ecosystems—especially well-preserved ones—act as important carbon sinks [85,86,92].
Changes in carbon are recognized as a key indicator for assessing overall soil quality, directly reflecting its dynamics in the nutrient cycle, structural stability, and degree of aggregation. These attributes have critical implications in processes such as water infiltration, vulnerability to erosion, and impacts on productivity [93]. They reflect how land use and management decisions are being made, contributing to the measurement of terrestrial ecosystem degradation or recovery [94,95].
In this study, the wetland and forest classes showed the highest average values per hectare throughout the evaluated period. However, conversion of these areas to agricultural use resulted in significant losses in total carbon stocks, highlighting the impact of land use and land cover changes on soil quality and SOC dynamics [19,23].
It is estimated that between 20% and 60% of SOC is lost after land use change compared to natural conditions [12]. This process releases large amounts of CO2 into the atmosphere, significantly contributing to global warming. In 2023, Maranhão ranked third among Brazilian states in net CO2 emissions, totaling about 110 million tons. Land use changes, particularly the replacement of forests with agricultural activities, were identified as the main source of these emissions [96].
In terms of stock per hectare, pasture areas showed relative stability, while croplands experienced the greatest losses. This pattern was also identified by Mendes et al. [85], using SoilGrids data, which indicated that after 10 years, average stocks in agricultural areas in Maranhão were significantly reduced, especially in the southern region dominated by soybean cultivation. This type of cropping, characterized by low deposition of plant residues into the soil, contributes to carbon loss. The conversion of forests to agricultural lands is particularly critical because it involves removal of litter and herbaceous vegetation, reducing organic matter inputs and increasing carbon effluxes [97,98]. Such systems exhibit an imbalance between carbon inputs and outputs, resulting in reduced soil organic carbon stocks [99].
Studies conducted in tropical forests and in the Amazon-Cerrado transition zone show that conversion to agriculture leads to SOC losses [85,100,101,102]. Overall, in Brazil, SOC losses in the 0–30 cm layer due to conversion of native vegetation to traditional crops over periods of 5, 10, 20, 30, and 40 years amount to approximately 7%, 9%, 14%, 19%, and 24%, respectively, relative to the initial SOC stock [103]. Despite these impacts, it is possible to mitigate carbon losses through sustainable management of production systems [104]. Adoption of integrated systems, such as crop-livestock integration, can diversify production, increase soil carbon stocks, and reduce pressure for new land conversion [105]. These practices offer both economic and environmental benefits, helping to offset the negative impacts of conventional agriculture [106]. In some cases, pasture areas may present similar or slightly higher stocks compared to forested areas [85,107,108].
Additionally, studies indicate that at the territorial level, SOC exhibits high temporal stability, reaching persistence levels up to 99% over 10 to 20-year time series, even under different management conditions [5,109]. This highlights the importance of policies aimed at soil conservation and adoption of sustainable practices to ensure essential ecosystem services and reduce greenhouse gas emissions.
In this context, national and global initiatives align food production with environmental resilience. In Brazil, the Low Carbon Agriculture Plan (Plano ABC) was approved in 2011, promoting practices and technologies in agriculture for greenhouse gas mitigation, achieving results that exceeded targets. It was later updated and enhanced for the 2020–2030 cycle as ABC+, aiming to expand mitigation targets to 1042.41 million Mg CO2eq [110,111]. These plans are directly linked to the international “4 per 1000” initiative, which encourages carbon capture and storage in soils, especially agricultural lands, considered crucial measures for reversing degradation [112].

4.3. Dynamics of Land Productivity

The analysis of trends in land productivity has proven to be an essential tool for understanding the health and productive capacity of terrestrial ecosystems. These trends reflect the net effects of changes in ecological functioning, such as vegetation growth and biomass generation, allowing for the identification of clear signs of degradation processes [52]. At the global scale, human appropriation of land productivity has grown significantly, altering ecosystem dynamics and interfering with their natural cycles [113].
In Maranhão, the study results indicated that 30.04% of the territory showed signs of land productivity degradation, while 35.28% demonstrated improvement and 34.34% remained stable. This pattern reflects a mixed scenario of productive intensification and degradation, common in regions undergoing agricultural expansion. Compared to the global scale, Yang et al. [114] found that 45% of land areas showed stable productivity, 34% experienced a significant increase, and 10% a significant decrease. The main predictors of these dynamics were climatic factors (precipitation and temperature), followed by changes in land use and land cover, and population growth.
In Maranhão, productivity degradation was most evident in forest and pasture cover classes. These same classes also represented the largest areas with improvement trends, highlighting the complex relationship between land use, management, and productivity dynamics. This duality suggests that changes in management and recovery practices of degraded pastures are underway. These actions likely result from the current production model, which has been adopting investments in sustainable plans such as the ABC+ Plan that includes programs like the National Crop–Livestock–Forest Integration (ILPF) and the recovery of degraded pastures using smart practices [105,115,116,117].
Practices from these programs have been considerably used and evaluated as strategies to increase production potential and food diversification sustainably, as well as to enhance economic gains [22,97,118,119]. However, many areas remain degraded due to the state’s extensive size, lack of technical assistance, and producers’ limited interest or investment. Gianetti and Ferreira Filho [120] highlight inefficiencies in ABC plan resource allocation among Brazilian regions, especially in priority areas like the North and Northeast regions.
Regarding forests, disturbances such as logging and fires contribute significantly to productivity loss. Zalles et al. [121] emphasize that such practices compromise the productive capacity of tropical ecosystems. Silva Júnior et al. [122] reported that between 2007 and 2012, approximately 50,345.10 km2 (23.33%) of Maranhão’s Cerrado were affected by recurrent fires, mainly in forest formations. Fire drastically alters vegetation structure, reduces biomass, and impairs regeneration capacity [26,123,124].
Concerning pastures, productivity in Brazil is far below its maximum potential. It is estimated that only 32% to 34% of productive potential is being utilized [125]. Approximately 109 million hectares of pastures in Brazil exhibit some level of degradation. This scenario is directly associated with inappropriate management practices, such as overgrazing, leading to environmental degradation and significant economic losses [126]. Pereira et al. [127], through NDVI time series, identified that 39% of pastures in the Cerrado showed negative productivity trajectories, with 65% of those areas concentrated in the MATOPIBA region, particularly Bahia, Maranhão, and Piauí. In Maranhão, the study indicated that about 75% of analyzed pastures were undergoing degradation [34]. According to Mendes et al. [34], MATOPIBA currently concentrates approximately 5.8 million hectares of degraded pastures in different stages of degradation.

4.4. SDG Indicator 15.3.1

The integrated analysis of land cover dynamics, soil organic carbon stocks, and land productivity in Maranhão, between 2001 and 2023, reveals a multifaceted landscape transformation process, strongly shaped by anthropogenic pressures. The assessment of SDG indicator 15.3.1 showed that more than one-third of the state of Maranhão exhibits signs of degradation, with emphasis on the central-eastern and northwestern regions.
This result highlights the intense pressure on natural resources and the intensive use of land, influenced by socioeconomic factors and unsustainable management practices. According to the results of this study, the loss of land productivity demonstrated the greatest influence on the state of degradation, showing values close (30.04) to the overall indicator (39.56). This finding is consistent with other studies that have also identified land productivity as the most sensitive determinant of SDG 15.3.1 [5,109].
The proportion of degraded land in the state of Maranhão is consistent with global estimates, which indicate that approximately one-third of the Earth’s surface is affected by land degradation [4]. This phenomenon primarily impacts developing countries and less developed regions, often driven by deforestation, unsustainable land use, and urban expansion [2,128]. In low- and middle-income countries, the expansion of agricultural areas has largely occurred through the conversion of natural ecosystems such as forests, wetlands, and other habitats [129]. This process primarily affects rural populations who rely heavily on natural resources for their subsistence [130].
Estimates of degraded land areas in the state reveal an alarming scenario and a significant concern, given the severe environmental, socioeconomic, and food security consequences caused by this process [7,14]. This concern is further intensified by the state’s high socioeconomic and environmental vulnerability [33,41,131,132].
On the other hand, 32.08% of the territory was classified as improving, indicating the occurrence of vegetation recovery processes and suggesting productive systems with more sustainable management practices and, possibly, efficiency gains in certain areas, especially in the southern, southeastern, and parts of the northeastern regions of the state. Additionally, it was found that 26.39% of the analyzed area remained unchanged, demonstrating a degree of resilience in ecosystems where the three sub-indicators remained stable over the assessed period (2001–2023).
The results highlight the complexity of environmental dynamics in Maranhão, marked by the coexistence of degradation and improvement processes. This scenario reinforces the importance of studies like this one, which monitor land degradation over time, as well as integrated public policies that reconcile agricultural production with environmental conservation, especially in more vulnerable areas within the Cerrado and the Amazon regions of Maranhão. These integrated policies involve coordinated actions across the environmental, agricultural, and social sectors, aiming to promote sustainable land use, restore degraded areas, and support local communities. In this context, the use of SDG indicator 15.3.1 proves to be a strategic tool for monitoring land degradation and formulating regional sustainability strategies aligned with the commitments of the United Nations 2030 Agenda.
By spatially delimiting degradation hotspots and identifying areas of stability and recovery, the results generated in this study can inform targeted interventions, such as ecological restoration, sustainable agricultural practices, and land use zoning. State-level environmental agencies, municipal governments, and rural development programs may benefit from integrating SDG 15.3.1 indicators into their monitoring frameworks, enabling more responsive and data-driven decision-making. Furthermore, the use of open-access platforms such as MapBiomas and Trends.Earth enhances the replicability of the methodology, allowing stakeholders to update assessments over time and evaluate the effectiveness of mitigation strategies. This alignment between scientific evidence and territorial governance can foster more resilient landscapes and contribute to the long-term sustainability of agro-environmental systems in Maranhão, such as within the current Maranhão 2050 plan.
The findings of this study are consistent with the Maranhão 2050 Plan, which prioritizes sustainability, territorial planning, and the integration of environmental and socioeconomic policies to foster balanced development in the state. The identification of degradation hotspots in central, northwestern, and southern Maranhão highlights priority zones for intervention, in line with Maranhão 2050’s objective of reducing environmental vulnerability and promoting resilient agro-environmental systems. At the same time, the observed recovery in southern and southeastern regions demonstrates the potential for expanding sustainable practices that contribute to the plan’s long-term vision of a productive, inclusive, and environmentally responsible territory. This research advances the scientific understanding of land degradation dynamics while offering actionable insights to support the implementation and monitoring of Maranhão 2050 state government plan.

4.5. Limitations

Despite the richness of the data and analytical framework, this study presents limitations that warrant acknowledgment and may be addressed through complementary approaches in future investigations. First, it is important to note that the analysis relied primarily on remote sensing data, whose validation through local ground-based information is essential for improving classification accuracy. However, this step remains particularly complex and costly, especially considering the vast territorial extent and ecological heterogeneity of the state of Maranhão. Future research should incorporate field campaigns and local observations to refine classification algorithms and improve the reliability of degradation assessments.
The use of spatial data with coarse resolution may have compromised the accuracy of the productivity analysis results. Specifically, productivity dynamics were evaluated using MODIS sensors with a spatial resolution of 250 m, in combination with RESTREND analysis based on CHIRPS precipitation data, which are derived from satellite imagery and interpolated observations at an approximate resolution of 5 km. Nonetheless, it is worth noting that CHIRPS precipitation data exhibit a high degree of agreement with INMET meteorological stations across various Brazilian regions [133,134], supporting their applicability in large-scale environmental assessments.
Another limitation concerns the estimation of soil organic carbon (SOC) for the final year of analysis, which was conducted indirectly by combining initial carbon maps with land cover data. This estimation method may introduce uncertainties, potentially underestimating or overestimating actual SOC changes. As a result, it can compromise the accuracy of soil organic carbon degradation values and lead to uncertainties in the final indicator [52,135].
While land use and land cover changes are primary drivers of land degradation, the independent influence of climatic factors, particularly precipitation and temperature, must also be considered [136]. In Maranhão, the pronounced seasonality and increasing variability in rainfall patterns can significantly affect vegetation productivity, even in areas with stable land use [30]. Prolonged dry spells and rising temperatures may reduce photosynthetic activity, impair biomass accumulation, and accelerate soil organic matter decomposition, thereby contributing to degradation signals in NDVI-based assessments. Moreover, variability remains sensitive to modeling choices, particularly due to the way a pixel is classified as degraded based on its NDVI value. The selection of threshold values can substantially influence classification outcomes, underscoring the need for sensitivity analyses and methodological transparency.
Conversely, regions experiencing more favorable climatic conditions may show productivity improvements unrelated to management practices. These dynamics underscore the importance of disentangling climatic effects from anthropogenic pressures when interpreting degradation trends. The application of RESTREND analysis in this study aimed to minimize such confounding effects, but further research integrating high-resolution climate models and ground-based observations could enhance the precision of future assessments.

5. Conclusions

The analysis of the sub-indicators: land cover change, soil organic carbon stocks, and land productivity trends; reveals significant transformations across Maranhão’s territory, particularly in the northwestern, central-eastern, and southern regions of the state. The conversion of natural ecosystems, especially forested areas, into pastures and croplands emerges as the main driver of environmental degradation, with considerable impacts on the integrity of ecological systems. The evaluation using SDG indicator 15.3.1 classifies a substantial portion of the territory as degraded, reflecting the intense socioeconomic pressures exerted on natural resources and the shortcomings of environmental governance in the face of unregulated agricultural expansion. Notably, Maranhão still falls short of the target set by this SDG, which aims to achieve land degradation neutrality. On the other hand, the study identifies environmentally stable areas showing signs of recovery and potential for the adoption of effective mitigation strategies, ecological restoration, and sustainable ecosystem management. In this context, the information generated by the study serves as a relevant basis for prioritizing territories that require intensive intervention, with the goal of building a more resilient, balanced scenario aligned with national and international environmental commitments, such as Brazil’s ABC+ Plan and the global “4 per 1000” initiative.

Author Contributions

Conceptualization, Antonia Mara Nascimento Gomes, Marcus Willame Lopes Carvalho, Marcos Vinícius da Silva and Nítalo André Farias Machado; Methodology, Antonia Mara Nascimento Gomes, Marcus Willame Lopes Carvalho and Andreza Maciel de Sousa; Validation, Antonia Mara Nascimento Gomes, Andreza Maciel de Sousa, Washington da Silva Sousa, Marcos Vinícius da Silva, Gustavo André de Araújo Santos, Aldair de Souza Medeiros, Jhon Lennon Bezerra da Silva, José Francisco de Oliveira-Júnior and Nítalo André Farias Machado; Formal analysis, Antonia Mara Nascimento Gomes; Investigation, Antonia Mara Nascimento Gomes and Andreza Maciel de Sousa; Data curation, Antonia Mara Nascimento Gomes, Andreza Maciel de Sousa, Marcus Willame Lopes Carvalho, Marcos Vinícius da Silva and Nítalo André Farias Machado; Writing—original draft preparation, Antonia Mara Nascimento Gomes; Writing—review and editing, Marcus Willame Lopes Carvalho, Washington da Silva Sousa, Marcos Vinícius da Silva, Gustavo André de Araújo Santos, Aldair de Souza Medeiros, Jhon Lennon Bezerra da Silva, José Francisco de Oliveira-Júnior and Nítalo André Farias Machado; Visualization, Antonia Mara Nascimento Gomes and Andreza Maciel de Sousa; Supervision, Marcos Vinícius da Silva and Nítalo André Farias Machado; Project administration, Nítalo André Farias Machado; Funding acquisition, Nítalo André Farias Machado. All authors have read and agreed to the published version of the manuscript.

Funding

This research was funded by the Fundação de Amparo à Pesquisa e ao Desenvolvimento Científico e Tecnológico do Maranhão (FAPEMA), process number ECOSSISTE-MA_INOVACAO-11929/22. The APC was not externally funded.

Data Availability Statement

This study analyzed publicly available datasets, all of which are accessible through the links provided within the manuscript.

Acknowledgments

The authors thank the Fundação de Amparo à Pesquisa do Estado do Maranhão (FAPEMA) for the support provided through the grants BEPP-03138/23 and ECOSSISTE-MA\_INOVACAO-11929/22.

Conflicts of Interest

The authors declare no conflicts of interest.

Abbreviations

The following abbreviations are used in this manuscript:
ABC+Low Carbon Agriculture Plan—Updated Cycle 2020–2030
CHIRPSClimate Hazards Group InfraRed Precipitation with Station Data
SOCSoil Organic Carbon
FAOFood and Agriculture Organization of the United Nations
GEEGoogle Earth Engine
IBGEBrazilian Institute of Geography and Statistics
ILPFIntegração Lavoura–Pecuária–Floresta (Crop–Livestock–Forest Integration)
IPCCIntergovernmental Panel on Climate Change
LPLand Productivity
LCLand Cover
MATOPIBAAcronym for the states of Maranhão, Tocantins, Piauí and Bahia
RESTRENDResidual Trends Model
SDGSustainable Development Goal
TRENDS.EARTHTool for monitoring land degradation and SDG 15.3.1

References

  1. Prăvălie, R. Exploring the Multiple Land Degradation Pathways across the Planet. Earth Sci. Rev. 2021, 220, 103689. [Google Scholar] [CrossRef]
  2. Xie, H.; Zhang, Y.; Wu, Z.; Lv, T. A Bibliometric Analysis on Land Degradation: Current Status, Development, and Future Directions. Land 2020, 9, 28. [Google Scholar] [CrossRef]
  3. Lal, R.; Safriel, U.; Boer, B. Zero Net Land Degradation: A New Sustainable Development Goal for Rio+20; Report Prepared for the Secretariat of the United Nations Convention to Combat Desertification (UNCCD): Bonn, Germany, 2012. [Google Scholar]
  4. AbdelRahman, M.A.E. An overview of land degradation, desertification and sustainable land management using GIS and remote sensing applications. Rend. Lincei Sci. Fis. Nat. 2023, 34, 767–808. [Google Scholar] [CrossRef]
  5. Cherif, I.; Kolintziki, E.; Alexandridis, T.K. Monitoring of Land Degradation in Greece and Tunisia Using Trends. Earth with a Focus on Cereal Croplands. Remote Sens. 2023, 15, 1766. [Google Scholar] [CrossRef]
  6. Pacheco, F.A.L.; Fernandes, L.F.S.; Junior, R.F.V.; Valera, C.A.; Pissarra, T.C.T. Land Degradation: Multiple Environmental Consequences and Routes to Neutrality. Curr. Opin. Environ. Sci. Health 2018, 5, 79–86. [Google Scholar] [CrossRef]
  7. Sutton, P.; Anderson, S.; Costanza, R.; Kubiszewski, I. The ecological economics of land degradation: Impacts on ecosystem service values. Ecol. Econ. 2016, 129, 182–192. [Google Scholar] [CrossRef]
  8. Gomiero, T. Soil Degradation, Land Scarcity and Food Security: Reviewing a Complex Challenge. Sustainability 2016, 8, 281. [Google Scholar] [CrossRef]
  9. Perović, V.; Kadović, R.; Đurđević, V.; Pavlović, D.; Pavlović, M.; Čakmak, D.; Mitrović, M.; Pavlović, P. Major Drivers of Land Degradation Risk in Western Serbia: Current Trends and Future Scenarios. Ecol. Indic. 2021, 123, 107377. [Google Scholar] [CrossRef]
  10. Junior, C.H.L.S.; Celentano, D.; Rousseau, G.X.; de Moura, E.G.; van Deursen Varga, I.; Martinez, C.; Martins, M.B. Amazon Forest on the Edge of Collapse in the Maranhão State, Brazil. Land Use Policy 2020, 97, 104806. [Google Scholar] [CrossRef]
  11. Lapola, D.M.; Pinho, P.; Barlow, J.; Aragão, L.E.O.C.; Berenguer, E.; Carmenta, R.; Liddy, H.M.; Seixas, H.; Silva, C.V.J.; Silva, C.H.L.; et al. The Drivers and Impacts of Amazon Forest Degradation. Science 2023, 379, eabp8622. [Google Scholar] [CrossRef] [PubMed]
  12. Intergovernmental Panel on Climate Change. Climate Change and Land: IPCC Special Report on Climate Change, Desertification, Land Degradation, Sustainable Land Management, Food Security, and Greenhouse Gas Fluxes in Terrestrial Ecosystems; Cambridge University Press: Cambridge, UK, 2022; ISBN 9781009157988. [Google Scholar]
  13. OECD; FAO. OECD-FAO Agricultural Outlook 2023–2032; OECD Publishing: Paris, France, 2023; ISBN 9789264619333. [Google Scholar]
  14. Ray, D.K.; West, P.C.; Clark, M.; Gerber, J.S.; Prishchepov, A.V.; Chatterjee, S. Climate Change Has Likely Already Affected Global Food Production. PLoS ONE 2019, 14, e0217148. [Google Scholar] [CrossRef]
  15. Kummu, M.; Heino, M.; Taka, M.; Varis, O.; Viviroli, D. Climate Change Risks Pushing One-Third of Global Food Production Outside the Safe Climatic Space. One Earth 2021, 4, 720–729. [Google Scholar] [CrossRef]
  16. FAO. Agricultural Production Statistics 2010–2023. FAOSTAT Analytical Briefs, 2024, n. 96. Rome. Available online: https://www.fao.org/statistics/highlights-archive/highlights-detail/agricultural-production-statistics-2010-2023/en (accessed on 28 August 2025).
  17. Maranhão, R.L.A.; Guimarães, R.F.; Hermuche, P.M.; Gomes, R.A.T.; Peripolli, V.; Tanure, C.B.; de Carvalho, O.L.F.; de Carvalho, O.A., Jr.; McManus, C. Growth and Acceleration Analysis of the Soybean, Sugar Cane, Maize and Cattle Production in Brazil. Environ. Dev. Sustain. 2025, 27, 11697–11742. [Google Scholar] [CrossRef]
  18. Lima, M.; da Silva Junior, C.A.; Rausch, L.; Gibbs, H.K.; Johann, J.A. Demystifying Sustainable Soy in Brazil. Land Use Policy 2019, 82, 349–352. [Google Scholar] [CrossRef]
  19. de Souza Medeiros, A.; Cesário, F.V.; dos Santos, T.C.; Maia, S.M.F. Differences in the Storage of Soil Organic Carbon in Brazil’s Agricultural Land: A Meta-Analysis. Catena 2025, 249, 108680. [Google Scholar] [CrossRef]
  20. Soterroni, A.C.; Ramos, F.M.; Mosnier, A.; Fargione, J.; Andrade, P.R.; Baumgarten, L.; Pirker, J.; Obersteiner, M.; Kraxner, F.; Câmara, G.; et al. Expanding the Soy Moratorium to Brazil’s Cerrado. Sci. Adv. 2019, 5, 7336–7353. [Google Scholar] [CrossRef] [PubMed]
  21. Cattelan, A.J.; Dall’Agnol, A. The Rapid Soybean Growth in Brazil. OCL—Oilseeds Fats Crops Lipids 2018, 25, D102. [Google Scholar] [CrossRef]
  22. Vogado, R.F.; de Souza, H.A.; Sagrilo, E.; de Brito, L.C.R.; Matias, S.S.R.; Neto, M.L.T.; de Oliveira Junior, J.O.L.; de Andrade, H.A.F.; Leite, L.F.C. Soil Organic Carbon Stocks and Fractions under Integrated Systems and Pasture in the Cerrado of Northeast Brazil. Catena 2024, 243, 108196. [Google Scholar] [CrossRef]
  23. Siqueira-Neto, M.; Popin, G.V.; Ferrão, G.E.; Santos, A.K.B.; Cerri, C.E.P.; Ferreira, T.O. Soybean Expansion Impacts on Soil Organic Matter in the Eastern Region of the Maranhão State (Northeastern Brazil). Soil Use Manag. 2022, 38, 1203–1216. [Google Scholar] [CrossRef]
  24. Polizel, S.P.; Vieira, R.M.d.S.P.; Pompeu, J.; da Cruz Ferreira, Y.; de Sousa-Neto, E.R.; Barbosa, A.A.; Ometto, J.P.H.B. Analysing the Dynamics of Land Use in the Context of Current Conservation Policies and Land Tenure in the Cerrado—MATOPIBA Region (Brazil). Land Use Policy 2021, 109, 105713. [Google Scholar] [CrossRef]
  25. Alvarenga, L.R.P.; Pompeu, P.S.; Leal, C.G.; Hughes, R.M.; Fagundes, D.C.; Leitão, R.P. Land-Use Changes Affect the Functional Structure of Stream Fish Assemblages in the Brazilian Savanna. Neotrop. Ichthyol. 2021, 19, e210035. [Google Scholar] [CrossRef]
  26. de Aquino Aragão, M.; Fiedler, N.C.; Ramalho, A.H.C.; Menezes, R.A.S.; da Silva, E.C.G.; Juvanhol, R.S.; Biazatti, L.D.; da Silva, E.F.; Pereira, R.S.; Guanaes, G.M.d.S.; et al. Risk of Forest Fires Occurrence on a Transition Island Amazon-Cerrado: Where to Act? For. Ecol. Manag. 2023, 536, 120858. [Google Scholar] [CrossRef]
  27. Pompeu, J.; Assis, T.O.; Ometto, J.P. Landscape Changes in the Cerrado: Challenges of Land Clearing, Fragmentation and Land Tenure for Biological Conservation. Sci. Total Environ. 2024, 906, 167581. [Google Scholar] [CrossRef]
  28. Pletsch, M.A.J.S.; Körting, T.S.; Morita, F.C.; Silva-Junior, C.H.L.; Anderson, L.O.; Aragão, L.E.O.C. Near Real-Time Fire Detection and Monitoring in the MATOPIBA Region, Brazil. Remote Sens. 2022, 14, 3141. [Google Scholar] [CrossRef]
  29. Silva Junior, C.H.L.; Alvarado, S.T.; Celentano, D.; Rousseau, G.X.; Hernández, L.M.; Ferraz, T.M.; Silva, F.B.; de Melo, M.H.F.; Rodrigues, T.C.S.; Viegas, J.C.; et al. Northeast Brazil’s Imperiled Cerrado. Science 2021, 372, 139–140. [Google Scholar] [CrossRef]
  30. Conceição, A.O.; de Andrade, H.A.F.; Rego, C.A.R.d.M.; Morais, P.A.d.O.; Pereira, R.Y.F.; de Sousa, A.M.; Santos, G.A.d.A.; Moraes, L.F.; Machado, N.A.F.; da Silva-Matos, R.R.S. New Organic Substrates for Seedling Production in the Transition Zone between the Amazon-Cerrado Biomes. Braz. J. Agric. Environ. Eng. 2024, 28, e279358. [Google Scholar] [CrossRef]
  31. Ottoni, F.P.; Filgueira, C.T.S.; Lima, B.N.; Vieira, L.O.; Rangel-Pereira, F.; Oliveira, R.F. Extreme Drought Threatens the Amazon. Science 2023, 382, 1253–1255. [Google Scholar] [CrossRef] [PubMed]
  32. Azevedo-Santos, V.M.; Daga, V.S.; Tonella, L.H.; Ruaro, R.; Arcifa, M.S.; Fearnside, P.M.; Giarrizzo, T. Brazil Undermines Flood Resilience. Science 2023, 282, 383. [Google Scholar] [CrossRef] [PubMed]
  33. Vommaro, F.; Menezes, J.A.; de Lima Barata, M.M. Contributions of Municipal Vulnerability Map of the Population of the State of Maranhão (Brazil) to the Sustainable Development Goals. Sci. Total Environ. 2020, 706, 134629. [Google Scholar] [CrossRef] [PubMed]
  34. Mendes, B.R.; Meirelles, M.S.P.; Benites, V.M.; Costa, R.O. The potential for recovery of degraded pastures in the Cerrado of MATOPIBA. Pedagog. J. 2024, 21, e11171. [Google Scholar] [CrossRef]
  35. Machado, R.B.; Aguiar, L.M.; Bustamante, M.M. Why Is It so Easy to Undergo Devegetation in the Brazilian Cerrado? Perspect. Ecol. Conserv. 2024, 22, 209–212. [Google Scholar] [CrossRef]
  36. United Nations (ONU). Global Indicator Framework for the Sustainable Development Goals and Targets of the 2030 Agenda for Sustainable Development; United Nations: New York, NY, USA, 2022. [Google Scholar]
  37. Guerra, J.B.S.O.A.; Hoffmann, M.; Bianchet, R.T.; Medeiros, P.; Provin, A.P.; Iunskovski, R. Sustainable Development Goals and Ethics: Building “the Future We Want”. Environ. Dev. Sustain. 2022, 24, 9407–9428. [Google Scholar] [CrossRef]
  38. Sims, N.C.; Barger, N.N.; Metternicht, G.I.; England, J.R. A Land Degradation Interpretation Matrix for Reporting on UN SDG Indicator 15.3.1 and Land Degradation Neutrality. Environ. Sci. Policy 2020, 114, 1–6. [Google Scholar] [CrossRef]
  39. Sims, N.C.; Newnham, G.J.; England, J.R.; Guerschman, J.; Cox, S.J.D.; Roxburgh, S.H.; Viscarra Rossel, R.A.; Fritz, S.; Wheeler, I. Good Practice Guidance. SDG Indicator 15.3.1, Proportion of Land That Is Degraded Over Total Land Area; United Nations: New York, NY, USA, 2021. [Google Scholar]
  40. Bari, E.; Chowdhury, M.A.; Hossain, M.I.; Rahman, M.M. Using Remote Sensing Data to Study Anthropogenic Land Degradation in Khulna Division, Bangladesh for SDG Indicator 15.3.1. Heliyon 2024, 10, e38363. [Google Scholar] [CrossRef]
  41. Instituto Brasileiro de Geografia e Estatística (IBGE). IBGE Cidades; IBGE: Rio de Janeiro, Brazil, 2023.
  42. Alvares, C.A.; Stape, J.L.; Sentelhas, P.C.; De Moraes Gonçalves, J.L.; Sparovek, G. Köppen’s Climate Classification Map for Brazil. Meteorol. Z. 2013, 22, 711–728. [Google Scholar] [CrossRef]
  43. Beck, H.E.; McVicar, T.R.; Vergopolan, N.; Berg, A.; Lutsko, N.J.; Dufour, A.; Zeng, Z.; Jiang, X.; van Dijk, A.I.J.M.; Miralles, D.G. High-Resolution (1 Km) Köppen-Geiger Maps for 1901–2099 Based on Constrained CMIP6 Projections. Sci. Data 2023, 10, 724. [Google Scholar] [CrossRef] [PubMed]
  44. Alvares, C.A.; Stape, J.L.; Sentelhas, P.C.; de Moraes Gonçalves, J.L. Modeling Monthly Mean Air Temperature for Brazil. Theor. Appl. Climatol. 2013, 113, 407–427. [Google Scholar] [CrossRef]
  45. Valverde, M.C.; Marengo, J.A. Extreme Rainfall Indices in the Hydrographic Basins of Brazil. Open J. Mod. Hydrol. 2014, 4, 10–26. [Google Scholar] [CrossRef]
  46. de Oliveira Aparecido, L.E.; de Meneses, K.C.; Lorençone, P.A.; Lorençone, J.A.; de Moraes, J.R.d.S.C.; de Souza Rolim, G. Climate Classification by Thornthwaite (1948) Humidity Index in Future Scenarios for Maranhão State, Brazil. Environ. Dev. Sustain. 2022, 25, 855–878. [Google Scholar] [CrossRef]
  47. Didan, K. MOD13Q1 MODIS/Terra Vegetation Indices 16-Day L3 Global 250m SIN Grid V006; NASA LP DAAC: Sioux Falls, SD, USA, 2015.
  48. Trends.Earth. Conservation International. 2025. Available online: http://trends.earth (accessed on 12 February 2025).
  49. QGIS Development Team. QGIS Geographic Information System 2024. Available online: https://www.qgis.org (accessed on 12 February 2025).
  50. Upadhyay, S.; Silwal, P.; Prajapati, R.; Talchabhadel, R.; Shrestha, S.; Duwal, S.; Lakhe, H. Evaluating Magnitude Agreement and Occurrence Consistency of CHIRPS Product with Ground-Based Observations over Medium-Sized River Basins in Nepal. Hydrology 2022, 9, 146. [Google Scholar] [CrossRef]
  51. Gonzalez-Roglich, M.; Zvoleff, A.; Noon, M.; Liniger, H.; Fleiner, R.; Harari, N.; Garcia, C. Synergizing Global Tools to Monitor Progress towards Land Degradation Neutrality: Trends. Earth and the World Overview of Conservation Approaches and Technologies Sustainable Land Management Database. Environ. Sci. Policy 2019, 93, 34–42. [Google Scholar] [CrossRef]
  52. Giuliani, G.; Chatenoux, B.; Benvenuti, A.; Lacroix, P.; Santoro, M.; Mazzetti, P. Monitoring Land Degradation at National Level Using Satellite Earth Observation Time-Series Data to Support SDG15—Exploring the Potential of Data Cube. Big Earth Data 2020, 4, 3–22. [Google Scholar] [CrossRef]
  53. Souza, C.M.; Shimbo, J.Z.; Rosa, M.R.; Parente, L.L.; Alencar, A.A.; Rudorff, B.F.T.; Hasenack, H.; Matsumoto, M.; Ferreira, L.G.; Souza-Filho, P.W.M.; et al. Reconstructing Three Decades of Land Use and Land Cover Changes in Brazilian Biomes with Landsat Archive and Earth Engine. Remote Sens. 2020, 12, 2735. [Google Scholar] [CrossRef]
  54. Paredes-Trejo, F.; Barbosa, H.A.; Daldegan, G.A.; Teich, I.; García, C.L.; Kumar, T.V.L.; Buriti, C.d.O. Impact of Drought on Land Productivity and Degradation in the Brazilian Semiarid Region. Land 2023, 12, 954. [Google Scholar] [CrossRef]
  55. Wessels, K.J.; van den Bergh, F.; Scholes, R.J. Limits to Detectability of Land Degradation by Trend Analysis of Vegetation Index Data. Remote Sens. Environ. 2012, 125, 10–22. [Google Scholar] [CrossRef]
  56. Alencar, A.; Shimbo, J.Z.; Lenti, F.; Balzani Marques, C.; Zimbres, B.; Rosa, M.; Arruda, V.; Castro, I.; Fernandes Márcico Ribeiro, J.; Varela, V.; et al. Mapping Three Decades of Changes in the Brazilian Savanna Native Vegetation Using Landsat Data Processed in the Google Earth Engine Platform. Remote Sens. 2020, 12, 924. [Google Scholar] [CrossRef]
  57. Caballero, C.B.; Biggs, T.W.; Vergopolan, N.; West, T.A.P.; Ruhoff, A. Transformation of Brazil’s Biomes: The Dynamics and Fate of Agriculture and Pasture Expansion into Native Vegetation. Sci. Total Environ. 2023, 896, 166323. [Google Scholar] [CrossRef] [PubMed]
  58. da Silveira, J.G.; de Oliveira Neto, S.N.; do Canto, A.C.B.; Leite, F.F.G.D.; Cordeiro, F.R.; Assad, L.T.; Silva, G.C.C.; Marques, R.d.O.; Dalarme, M.S.L.; Ferreira, I.G.M.; et al. Land Use, Land Cover Change and Sustainable Intensification of Agriculture and Livestock in the Amazon and the Atlantic Forest in Brazil. Sustainability 2022, 14, 2563. [Google Scholar] [CrossRef]
  59. Kohlhepp, G. Conflitos de interesse no ordenamento territorial da Amazônia brasileira. Estud. Avançados 2002, 16, 37–61. [Google Scholar] [CrossRef]
  60. Celentano, D.; Rousseau, G.X.; Muniz, F.H.; van Deursen Varga, I.; Martinez, C.; Carneiro, M.S.; Miranda, M.V.C.; Barros, M.N.R.; Freitas, L.; Narvaes, I.d.S.; et al. Towards Zero Deforestation and Forest Restoration in the Amazon Region of Maranhão State, Brazil. Land Use Policy 2017, 68, 692–698. [Google Scholar] [CrossRef]
  61. Pires, M.O. ‘Cerrado’, Old and New Agricultural Frontiers. Braz. Political Sci. Rev. 2020, 14, e0004. [Google Scholar] [CrossRef]
  62. Rocha, C.B.; de Majo, C.; Silva, S.D. A Geo-Historical Analysis of Expanding Soybean Frontiers in the Brazilian Cerrado. Hist. Ambient. Latinoam. Caribeña 2022, 12, 217–252. [Google Scholar] [CrossRef]
  63. Lopes, G.R.; Lima, M.G.B.; dos Reis, T.N.P. Maldevelopment Revisited: Inclusiveness and Social Impacts of Soy Expansion over Brazil’s Cerrado in Matopiba. World Dev. 2021, 139, 105316. [Google Scholar] [CrossRef]
  64. Pereira, P.R.M.; Bolfe, E.L.; Rodrigues, T.C.S.; Sano, E.E. Dynamics of agricultural expansion in areas of the brazilian savanna between 2000 and 2019. Int. Arch. Photogramm. Remote Sens. Spat. Inf. Sci. 2020, 43, 1607–1614. [Google Scholar] [CrossRef]
  65. Sodré, R.; Mattos, J. O Emaranhado Dos Conflitos de Terra No Campo Maranhense. GOT—J. Geogr. Spat. Plan. 2016, 10, 345–354. [Google Scholar] [CrossRef]
  66. Almeida, J.; Junior, J. The Struggle for Land in the Face of the Territorial Dynamics of Soy Agribusiness in Maranhão: The Case of the Chapadinha Microregion (1990–2015). J. Geogr. Spat. Plan. 2019, 16, 251–274. [Google Scholar] [CrossRef]
  67. Instituto Nacional de Pesquisas Espaciais (INPE) TerraBrasilis: PRODES (Desmatamento) 2024. Available online: https://terrabrasilis.dpi.inpe.br/app/dashboard/deforestation/biomes/legal_amazon/increments (accessed on 25 February 2025).
  68. Parente, L.; Nogueira, S.; Baumann, L.; Almeida, C.; Maurano, L.; Affonso, A.G.; Ferreira, L. Quality Assessment of the PRODES Cerrado Deforestation Data. Remote Sens. Appl. 2021, 21, 100444. [Google Scholar] [CrossRef]
  69. Santos, I.B.; da Silva, A.; de Carvalho, I.S.; Silva, T.L.d.A.; Schwingel, P.R. Anthropogenic Threats in the Border Zone of the Amazon Forest: A Case Study of Land Use and Land Cover in RESEX Ciriaco, Maranhão, Brazil. Pedagog. J. 2024, 21, e9242. [Google Scholar] [CrossRef]
  70. Paiva, P.F.P.R.; de Lourdes Pinheiro Ruivo, M.; da Silva Júnior, O.M.; de Nazaré Martins Maciel, M.; Braga, T.G.M.; de Andrade, M.M.N.; dos Santos Junior, P.C.; da Rocha, E.S.; de Freitas, T.P.M.; da Silva Leite, T.V.; et al. Deforestation in Protect Areas in the Amazon: A Threat to Biodiversity. Biodivers. Conserv. 2020, 29, 19–38. [Google Scholar] [CrossRef]
  71. Garcia, A.S.; Vilela, V.M.d.F.N.; Rizzo, R.; West, P.; Gerber, J.S.; Engstrom, P.M.; Ballester, M.V.R. Assessing Land Use/Cover Dynamics and Exploring Drivers in the Amazon’s Arc of Deforestation through a Hierarchical, Multi-Scale and Multi-Temporal Classification Approach. Remote Sens. Appl. 2019, 15, 100233. [Google Scholar] [CrossRef]
  72. Tiwari, S.; Singh, C.; Boudh, S.; Rai, P.K.; Gupta, V.K.; Singh, J.S. Land Use Change: A Key Ecological Disturbance Declines Soil Microbial Biomass in Dry Tropical Uplands. J. Environ. Manag. 2019, 242, 1–10. [Google Scholar] [CrossRef] [PubMed]
  73. Lal, R. Forest Soils and Carbon Sequestration. For. Ecol. Manag. 2005, 220, 242–258. [Google Scholar] [CrossRef]
  74. Lal, R. World Cropland Soils as a Source or Sink for Atmospheric Carbon. Adv. Agron. 2001, 71, 145–191. [Google Scholar] [CrossRef]
  75. Moradi, E.; Khosravi, H.; Rahimabadi, P.D.; Choubin, B.; Muchová, Z. Integrated Approach to Land Degradation Risk Assessment in Arid and Semi-Arid Ecosystems: Applying SVM and EDPSIR/ANP Methods. Ecol. Indic. 2024, 169, 112947. [Google Scholar] [CrossRef]
  76. Tilman, D. Global Environmental Impacts of Agricultural Expansion: The Need for Sustainable and Efficient Practices. Proc. Natl. Acad. Sci. USA 1999, 96, 5995–6000. [Google Scholar] [CrossRef]
  77. Kopittke, P.; Menzies, N.; Wang, P.; McKenna, B.; Lombi, E. Soil and the Intensification of Agriculture for Global Food Security. Environ. Int. 2019, 132, 105078. [Google Scholar] [CrossRef]
  78. Melo, L.F.d.S.; Júnior, P.L.P.; de Espindola, G.M. Analysis of Burns and Deforestation Resulting from Agricultural Practices in the Matopiba Region: Case Study in the Municipalities of Piauí. Obs. Econ. Latinoam. 2024, 22, e3223. [Google Scholar] [CrossRef]
  79. Ferraz-Almeida, R.; da Mota, R.P. Routes of Soil Uses and Conversions with the Main Crops in Brazilian Cerrado: A Scenario from 2000 to 2020. Land 2021, 10, 1135. [Google Scholar] [CrossRef]
  80. Zalles, V.; Hansen, M.C.; Potapov, P.V.; Stehman, S.V.; Tyukavina, A.; Pickens, A.; Song, X.; Adusei, B.; Okpa, C.; Aguilar, R.; et al. Near Doubling of Brazil’s Intensive Row Crop Area Since 2000. Proc. Natl. Acad. Sci. USA 2019, 116, 428–435. [Google Scholar] [CrossRef] [PubMed]
  81. Hansen, M.C.; Potapov, P.V.; Moore, R.; Hancher, M.; Turubanova, S.A.; Tyukavina, A.; Thau, D.; Stehman, S.V.; Goetz, S.J.; Loveland, T.R.; et al. High-Resolution Global Maps of 21st-Century Forest Cover Change. Science 2013, 342, 850–853. [Google Scholar] [CrossRef]
  82. Winkler, K.; Fuchs, R.; Rounsevell, M.; Herold, M. Global Land Use Changes Are Four Times Greater Than Previously Estimated. Nat. Commun. 2021, 12, 2501. [Google Scholar] [CrossRef] [PubMed]
  83. Radwan, T.M.; Blackburn, G.A.; Whyatt, J.D.; Atkinson, P.M. Global Land Cover Trajectories and Transitions. Sci. Rep. 2021, 11, 12814. [Google Scholar] [CrossRef]
  84. Rêgo, J.C.L.; Soares-Gomes, A.; da Silva, F.S. Loss of Vegetation Cover in a Tropical Island of the Amazon Coastal Zone (Maranhão Island, Brazil). Land Use Policy 2018, 71, 593–601. [Google Scholar] [CrossRef]
  85. Mendes, T.J.; Siqueira, D.S.; de Figueiredo, E.B.; Bordonal, R.d.O.; Moitinho, M.R.; Marques Júnior, J.; La Scala, N. Soil Carbon Stock Estimations: Methods and a Case Study of the Maranhão State, Brazil. Environ. Dev. Sustain. 2021, 23, 16410–16427. [Google Scholar] [CrossRef]
  86. Rovai, A.S.; Twilley, R.R.; Worthington, T.A.; Riul, P. Brazilian Mangroves: Blue Carbon Hotspots of National and Global Relevance to Natural Climate Solutions. Front. For. Glob. Change 2022, 4, 787533. [Google Scholar] [CrossRef]
  87. Prescott, C.E. Sustaining organic matter in forest soils: What we have learned and what is left. Soil Sci. Soc. Am. J. 2023, 87, 1–15. [Google Scholar] [CrossRef]
  88. Hatje, V.; Masqué, P.; Patire, V.F.; Dórea, A.; Barros, F. Blue carbon stocks, accumulation rates, and associated spatial variability in Brazilian mangroves. Limnol. Oceanogr. 2021, 66, 321–334. [Google Scholar] [CrossRef]
  89. Fu, C.; Li, Y.; Zeng, L.; Tu, C.; Wang, X.; Ma, H.; Xiao, L.; Christie, P.; Luo, Y. Climate and mineral accretion as drivers of mineral-associated and particulate organic matter accumulation in tidal wetland soils. Glob. Change Biol. 2023, 30, e17070. [Google Scholar] [CrossRef] [PubMed]
  90. Prescott, C.E.; Grayston, S.J. Continuous root forestry—Living roots sustain the belowground ecosystem and soil carbon in managed forests. For. Ecol. Manag. 2023, 532, 120848. [Google Scholar] [CrossRef]
  91. Yang, R.; Yang, S.; Chen, L.; Yang, Z.; Xu, L.; Zhang, X.; Liu, G.; Zhang, X.; Jiao, C.; Bai, R.; et al. Effect of vegetation restoration on soil erosion control and soil carbon and nitrogen dynamics: A meta-analysis. Soil Tillage Res. 2023, 230, 105705. [Google Scholar] [CrossRef]
  92. Pan, Y.; Birdsey, R.A.; Phillips, O.L.; Houghton, R.A.; Fang, J.; Kauppi, P.E.; Keith, H.; Kurz, W.A.; Ito, A.; Lewis, S.L.; et al. The enduring world forest carbon sink. Nature 2024, 631, 563–569. [Google Scholar] [CrossRef]
  93. Stumpf, F.; Keller, A.; Schmidt, K.; Mayr, A.; Gubler, A.; Schaepman, M. Spatio-temporal land use dynamics and soil organic carbon in Swiss agroecosystems. Agric. Ecosyst. Environ. 2018, 258, 129–142. [Google Scholar] [CrossRef]
  94. Cerretelli, S.; Poggio, L.; Yakob, G.; Boke, S.; Habte, M.; Coull, M.; Peressotti, A.; Black, H.; Gimona, A. The Advantages and Limitations of Global Datasets to Assess Carbon Stocks as Proxy for Land Degradation in an Ethiopian Case Study. Geoderma 2021, 399, 115117. [Google Scholar] [CrossRef]
  95. Xoxo, S.; Mantel, S.; De Vos, A.; Mahlaba, B.; Le Maître, D.; Tanner, J. Towards SDG 15.3: The biome context as the appropriate degradation monitoring dimension. Environ. Sci. Policy 2022, 136, 400–412. [Google Scholar] [CrossRef]
  96. SEEG—Greenhouse Gas Emissions and Removals Estimation System. SEEG Platform 2023. Available online: https://seeg.eco.br/english/home/ (accessed on 15 February 2025).
  97. Santos, R.S.; Zhang, Y.; Cotrufo, M.F.; Hong, M.; Oliveira, D.M.S.; Damian, J.M.; Cerri, C.E.P. Simulating soil C dynamics under intensive agricultural systems and climate change scenarios in the Matopiba region, Brazil. J. Environ. Manag. 2023, 347, 119149. [Google Scholar] [CrossRef]
  98. Rittl, T.F.; Oliveira, D.; Cerri, C.E.P. Soil Carbon Stock Changes under Different Land Uses in the Amazon. Geoderma Reg. 2017, 10, 138–143. [Google Scholar] [CrossRef]
  99. Guo, L.B.; Gifford, R.M. Soil Carbon Stocks and Land Use Change: A Meta Analysis. Glob. Change Biol. 2002, 8, 345–360. [Google Scholar] [CrossRef]
  100. Van Straaten, O.; Corre, M.D.; Wolf, K.; Tchienkoua, M.; Cuellar, E.; Matthews, R.B.; Veldkamp, E. Conversion of lowland tropical forests to tree cash crop plantations loses up to one-half of stored soil organic carbon. Proc. Natl. Acad. Sci. USA 2015, 112, 9956–9960. [Google Scholar] [CrossRef] [PubMed]
  101. Bonini, I.; Marimon-Junior, B.; Matricardi, E.; Phillips, O.; Petter, F.; Oliveira, B.; Marimon, B. Collapse of ecosystem carbon stocks due to forest conversion to soybean plantations at the Amazon-Cerrado transition. For. Ecol. Manag. 2018, 414, 64–73. [Google Scholar] [CrossRef]
  102. Ahirwal, J.; Kumari, S.; Singh, A.; Kumar, A.; Maiti, S. Changes in Soil Properties and Carbon Fluxes Following Afforestation and Agriculture in Tropical Forest. Ecol. Indic. 2021, 123, 107354. [Google Scholar] [CrossRef]
  103. Medeiros, A.d.S.; Santos, T.C.d.; Maia, S.M.F. Effect of long-term and soil depth on soil organic carbon stocks after conversion from native vegetation to conventional tillage systems in Brazil. Soil Tillage Res. 2022, 219, 105336. [Google Scholar] [CrossRef]
  104. Maia, S.M.F.; de Souza Medeiros, A.; dos Santos, T.C.; Lyra, G.B.; Lal, R.; Assad, E.D.; Cerri, C.E.P. Potential of No-till Agriculture as a Nature-Based Solution for Climate-Change Mitigation in Brazil. Soil Tillage Res. 2022, 220, 105368. [Google Scholar] [CrossRef]
  105. Molossi, L.; Hoshide, A.K.; de Abreu, D.C.; de Oliveira, R.A. Agricultural Support and Public Policies Improving Sustainability in Brazil’s Beef Industry. Sustainability 2023, 15, 4801. [Google Scholar] [CrossRef]
  106. Paul, B.K.; Epper, C.A.; Tschopp, D.J.; Long, C.T.M.; Tungani, V.; Burra, D.; Hok, L.; Phengsavanh, P.; Douxchamps, S. Crop-Livestock Integration Provides Opportunities to Mitigate Environmental Trade-Offs in Transitioning Smallholder Agricultural Systems of the Greater Mekong Subregion. Agric. Syst. 2022, 195, 103285. [Google Scholar] [CrossRef]
  107. Carvalho, J.L.N.; Raucci, G.S.; Cerri, C.E.P.; Bernoux, M.; Feigl, B.J.; Wruck, F.J.; Cerri, C.C. Impact of pasture, agriculture and crop-livestock systems on soil C stocks in Brazil. Soil Tillage Res. 2010, 110, 175–186. [Google Scholar] [CrossRef]
  108. Fujisaki, K.; Perrin, A.; Desjardins, T.; Bernoux, M.; Balbino, L.; Brossard, M. From forest to cropland and pasture systems: A critical review of soil organic carbon stocks changes in Amazonia. Glob. Change Biol. 2015, 21, 2773–2786. [Google Scholar] [CrossRef]
  109. Reith, J.; Ghazaryan, G.; Muthoni, F.; Dubovyk, O. Assessment of Land Degradation in Semiarid Tanzania—Using Multiscale Remote Sensing Datasets to Support Sustainable Development Goal 15.3. Remote Sens. 2021, 13, 1754. [Google Scholar] [CrossRef]
  110. Brazil—Ministério da Agricultura e Pecuária. Resultados do Plano ABC (2010–2020); Governo do Brasil: Brasília, Brazil, 2023.
  111. Brazil—Ministry of Agriculture, Livestock, and Supply. Sectoral Plan for Climate Change Adaptation and Low Carbon Emission in Agriculture for Sustainable Development (2020–2030): Strategic Vision for a New Cycle; MAPA: Brasília, Brazil, 2021.
  112. Minasny, B.; Malone, B.P.; McBratney, A.B.; Angers, D.A.; Arrouays, D.; Chambers, A.; Chaplot, V.; Chen, Z.-S.; Cheng, K.; Das, B.S.; et al. Soil carbon 4 per mille. Geoderma 2017, 292, 59–86. [Google Scholar] [CrossRef]
  113. Cui, Y.; Li, X. A New Global Land Productivity Dynamic Product Based on the Consistency of Various Vegetation Biophysical Indicators. Big Earth Data 2022, 6, 36–53. [Google Scholar] [CrossRef]
  114. Yang, Y.; Wang, S.; Bai, X.; Tan, Q.; Li, Q.; Wu, L.; Tian, S.; Hu, Z.; Li, C.; Deng, Y. Factors Affecting Long-Term Trends in Global NDVI. Forests 2019, 10, 372. [Google Scholar] [CrossRef]
  115. Souza Piao, R.; Silva, V.L.; Navarro del Aguila, I.; de Burgos Jiménez, J. Green Growth and Agriculture in Brazil. Sustainability 2021, 13, 1162. [Google Scholar] [CrossRef]
  116. Amaral, D.D.; Cordeiro, L.A.M.; Galerani, P.R. Sectoral Plan for Mitigation and Adaptation to Climate Change for a Consolidation Economy Low Carbon—ABC Plan. Braz. J. Phys. Geogr. 2011, 4, 1266–1274. [Google Scholar]
  117. Santos, C.O.D.; Mesquita, V.V.; Parente, L.L.; Pinto, A.d.S.; Ferreira, L.G., Jr. Assessing the Wall-to-Wall Spatial and Qualitative Dynamics of the Brazilian Pasturelands 2010–2018, Based on the Analysis of the Landsat Data Archive. Remote Sens. 2022, 14, 1024. [Google Scholar] [CrossRef]
  118. Reis, J.C.; Rodrigues, G.S.; Barros, I.; Rodrigues, R.A.R.; Garrett, R.D.; Valentim, J.F.; Kamoi, M.Y.T.; Michetti, M.; Wruck, F.J.; Rodrigues-Filho, S.; et al. Integrated crop-livestock systems: A sustainable land-use alternative for food production in the Brazilian Cerrado and Amazon. J. Clean. Prod. 2021, 283, 124580. [Google Scholar] [CrossRef]
  119. Calil, Y.C.D.; Ribera, L. Economic Feasibility of Crop-Livestock Integration System in Brazil. Agribusiness 2025, 1–11. [Google Scholar] [CrossRef]
  120. Gianetti, G.; Ferreira Filho, J.B.S. O Plano e Programa ABC: Uma análise da alocação dos recursos. Rev. Econ. Sociol. Rural 2021, 59, 1–15. [Google Scholar] [CrossRef]
  121. Zalles, V.; Hansen, M.C.; Potapov, P.V.; Parker, D.; Stehman, S.V.; Pickens, A.H.; Parente, L.L.; Ferreira, L.G.; Song, X.-P.; Hernandez-Serna, A.; et al. Rapid Expansion of Human Impact on Natural Land in South America since 1985. Sci. Adv. 2021, 7, eabg1620. [Google Scholar] [CrossRef]
  122. Junior, C.H.L.S.; Anderson, L.O.; de Aragão, L.E.O.e.C.; Rodrigues, B.D. Dynamics of Fires in the Cerrado of the State of Maranhão, Northeastern Brazi. Geogr. Dep. Univ. Sao Paulo 2018, 35, 1–14. [Google Scholar] [CrossRef]
  123. Silva, P.S.; Nogueira, J.; Rodrigues, J.A.; Santos, F.L.M.; Pereira, J.M.C.; DaCamara, C.C.; Daldegan, G.A.; Pereira, A.A.; Peres, L.F.; Schmidt, I.B.; et al. Putting Fire on the Map of Brazilian Savanna Ecoregions. J. Environ. Manag. 2021, 296, 113098. [Google Scholar] [CrossRef]
  124. Prestes, N.; Massi, K.; Silva, E.; Nogueira, D.; De Oliveira, E.; Freitag, R.; Marimon, B.; Marimon-Junior, B.; Keller, M.; Feldpausch, T. Fire effects on understory forest regeneration in Southern Amazonia. Front. For. Glob. Change 2020, 3, e00010. [Google Scholar] [CrossRef]
  125. Strassburg, B.B.N.; Latawiec, A.E.; Barioni, L.G.; Nobre, C.A.; da Silva, V.P.; Valentim, J.F.; Vianna, M.; Assad, E.D. When Enough Should Be Enough: Improving the Use of Current Agricultural Lands Could Meet Production Demands and Spare Natural Habitats in Brazil. Glob. Environ. Change 2014, 28, 84–97. [Google Scholar] [CrossRef]
  126. Bolfe, É.L.; Victoria, D.d.C.; Sano, E.E.; Bayma, G.; Massruhá, S.M.F.S.; de Oliveira, A.F. Potential for Agricultural Expansion in Degraded Pasture Lands in Brazil Based on Geospatial Databases. Land 2024, 13, 200. [Google Scholar] [CrossRef]
  127. Pereira, O.J.R.; Ferreira, L.G.; Pinto, F.; Baumgarten, L. Assessing Pasture Degradation in the Brazilian Cerrado Based on the Analysis of MODIS NDVI Time-Series. Remote Sens. 2018, 10, 1761. [Google Scholar] [CrossRef]
  128. Barbier, E.; Di Falco, S. Populações Rurais, Degradação de Terras e Padrões de Vida em Países em Desenvolvimento. Rev. Econ. Política Ambient. 2021, 15, 115–133. [Google Scholar] [CrossRef]
  129. Sousa, A.C.; Sousa, A.M.; Corrêa, W.C.; Marques, J.I.; Meneses, K.C.; Pandorfi, H.; Silva, T.G.F.; Silva, J.L.B.; Silva, M.V.; Machado, N.A.F. Bioclimatic Zoning and Climate Change Impacts on Dairy Cattle in Maranhão, Brazil. Animals 2025, 15, 1646. [Google Scholar] [CrossRef]
  130. Barbier, E.B.; Hochard, J.P. Does land degradation increase poverty in developing countries? PLoS ONE 2016, 11, e0152973. [Google Scholar] [CrossRef] [PubMed]
  131. Medeiros, R.B.; dos Santos, L.C.A.; Bezerra, J.F.R.; da Silva, Q.D.; de Melo, S.N. Environmental Vulnerability of the Buriticupu River Water Basin, Maranhão—Brazil: The Relief as a Key Element. Soc. Nat. 2023, 35, e66679. [Google Scholar] [CrossRef]
  132. Rorato, A.; Escada, M.; Câmara, G.; Picoli, M.; Verstegen, J. Environmental vulnerability assessment of Brazilian Amazon Indigenous Lands. Environ. Sci. Policy 2022, 129, 19–36. [Google Scholar] [CrossRef]
  133. Almeida, G.S.S.; da Silva, E.M.; da Silva, V.d.P.R.; Campos, J.H.B.d.C.; Silva, M.T. Performance of the Climate Hazards Group InfraRed Precipitation with Station Data (CHIRPS) Model in the Northeast Region of Brazil. Braz. J. Phys. Geogr. 2024, 17, 4117–4130. [Google Scholar] [CrossRef]
  134. Costa, J.C.; Pereira, G.; Siqueira, M.E.; Cardozo, F.; da Silva, V.V. Validation of precipitation data indicators estimated by CHIRPS for Brazil. Braz. J. Climatol. 2019, 24, 228–243. [Google Scholar] [CrossRef]
  135. Thomas, A.; Bentley, L.; Feeney, C.; Lofts, S.; Robb, C.; Rowe, E.; Thomson, A.; Warren-Thomas, E.; Emmett, B. Land degradation neutrality: Testing the indicator in a temperate agricultural landscape. J. Environ. Manag. 2023, 346, 118884. [Google Scholar] [CrossRef] [PubMed]
  136. De Medeiros, F.J.; De Oliveira, C.P. Dynamical Aspects of the Recent Strong El Niño Events and Its Climate Impacts in Northeast Brazil. Pure Appl. Geophys. 2021, 178, 2315–2332. [Google Scholar] [CrossRef]
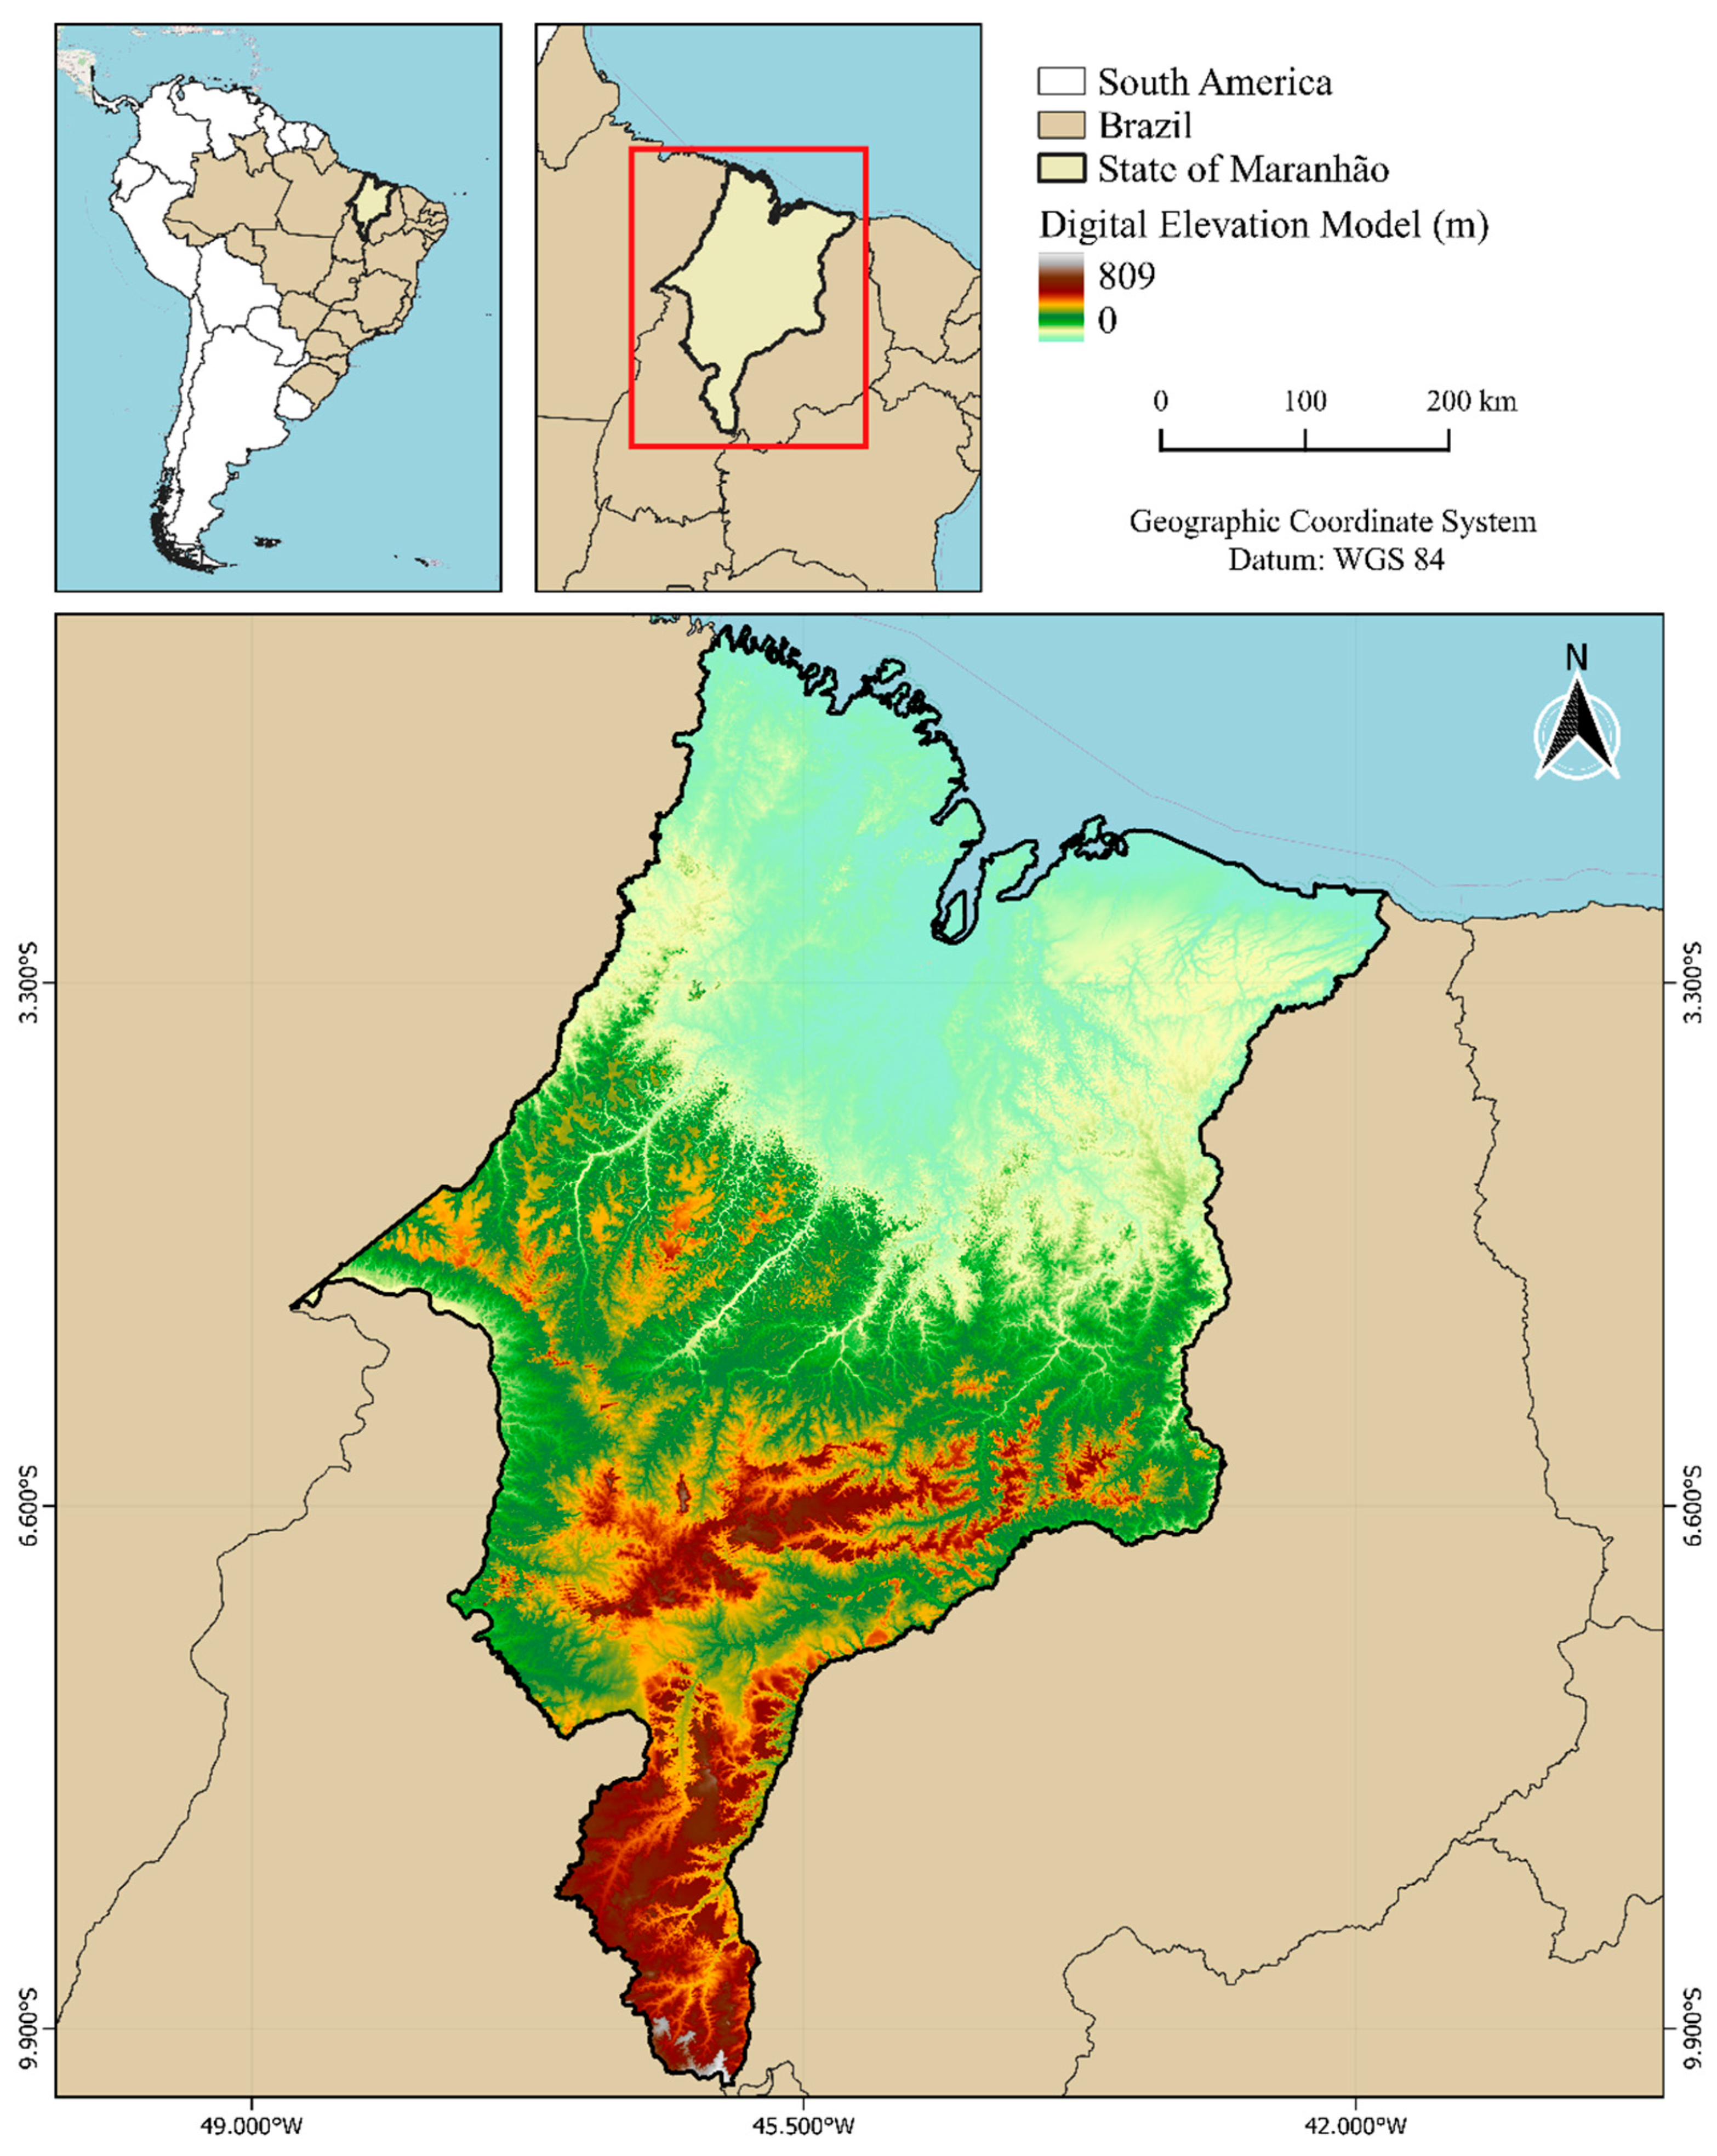
Figure 1. Location map of the study area, with corresponding digital elevation model (m).
Ijgi 14 00356 g001
Figure 2. Land cover of the state of Maranhão in 2001 (a) and 2023 (b).
Ijgi 14 00356 g002
Figure 3. Spatial distribution of land cover degradation in the state of Maranhão (2001−2023).
Ijgi 14 00356 g003
Figure 4. Soil organic carbon (SOC) stock in 2001 (a) and 2023 (b).
Ijgi 14 00356 g004
Figure 5. Spatial distribution of SOC degradation in the state of Maranhão (2001–2023).
Ijgi 14 00356 g005
Figure 6. Land productivity dynamics in the state of Maranhão (2001–2023).
Ijgi 14 00356 g006
Figure 7. SDG Indicator 15.3.1 in the state of Maranhão (2001–2023).
Ijgi 14 00356 g007
Table 1. Summary information of the dataset.
ItemSensor/DatasetResolutionCoverage
NDVIMOD-13Q1-Coll6250 mGlobal
PrecipitationCHIRPS5 kmGlobal
Land cover1 MapBiomas-Coll9250 mNational
Soil organic carbon1 MapBiomas-CollBeta250 mNational
1 Annual Land Use and Land Cover Mapping Platform.
Table 2. Land cover degradation typology matrix.
Land Cover 2023
Land Cover 2001 ForestGrassland formationCroplandPastureArtificial areaWetlandOther landWater bodies
Forest00
Grassland formation+00
Cropland++000
Pasture++00 0
Artificial area++++0++0
Wetland+00
Other land+++00
Water bodies00000000
Degradation: purple (−); Stable: yellow (0); Improvement: green (+).
Table 3. Estimated area of land cover classes during the period 2001 to 2023.
Land CoverArea in km2 (%)Change in km2 (%)
200120232001–2023
Forest248,590.89 (75.45)189,913.39 (57.62)−58,677.50 (−23.60)
Grassland formation6460.14 (1.96)5819.69 (1.77)−640.46 (−9.91)
Cropland7839.30 (2.38)22,918.99 (6.95)15,079.56 (192.36)
Pasture54,836.57 (16.64)96,710.60 (29.34)41,874.02 (76.36)
Artificial area1322.04 (0.40)2075.49 (0.63)753.45 (56.99)
Wetland5409.09 (1.64)6861.80 (2.08)1452.71 (26.86)
Other land1203.40 (0.37)1148.27 (0.35)−55.13 (−4.58)
Water bodies3947.66 (1.20)4160.88 (1.26)213.22 (5.40)
Table 4. Land cover change matrix for the period 2001 to 2023, areas in km2.
Land
Cover
ForGrlCrpPasArtWetOlWbTotal 2001
For184,275.76294.3816,022.4544,938.92524.032158.8110.93365.60248,590.89
Grl51.655429.55484.40433.5121.059.949.5720.496460.14
Crp538.8915.883869.223376.5529.003.600.006.157839.30
Pas4452.8134.492420.3247,497.08318.9858.870.1953.8354,836.56
Art29.014.3895.7733.511153.530.510.944.391322.04
Wet304.818.6824.15363.866.264348.284.51348.555409.09
Ol7.5810.850.575.8212.236.471091.4668.431203.40
Wb252.8921.492.1061.3410.40275.3230.693293.433947.66
Total 2023189,913.395189.6922,819.6996,710.602075.496861.801148.274160.88329,609.10
Forest (For); grassland formation (Grl); cropland (Crp); pasture (Pas); artificial area (Art); wetland (Wet); other land (Ol); and water bodies (Wb).
Table 5. Changes in SOC stocks during the period 2001 to 2023.
Land CoverSOC (Mg ha−1)Total SOC (Mg C)Change SOC (Mg C)
20012023200120232001–2023
Forest37.8038.12939,673,600723,949,800−215,723,700
Grassland formation28.0827.5218,140,07016,015,790−2,124,286
Cropland35.0728.4527,492,43065,204,53037,712,100
Pasture34.323584188,199,100346,610,800158,411,700
Artificial area19.0817.012,522,4523,530,4081,007,956
Wetland46.7746.1925,303,72031,694,6506,390,931
Other land5.906.66712,413764,74852,335
Total change 1,202,043,7851,187,770,726−14,272,964
Table 6. Land productivity dynamics trend for the state of Maranhão by land cover class.
Land CoverDegradationStableImprovementNo Data
DeclineEarly Signs of DeclineStableStable but Stressed
Forest12,919.7031,378.2765,431.5731.5079,699.11453.23
Grassland formation145.20272.14958.6228.194409.526.03
Cropland5150.843227.367425.781.697111.062.27
Pasture22,642.4718,570.4634,956.013.6520,472.9865.02
Artificial area1090.99270.50394.01951294.5915.88
Wetland427.871253.952292.879.362666.09211.66
Other land269.08153.27311.52152.58170.6291.19
Final km2
(%)
42,646.14
(13.10)
55,125.95
(16.94)
111,770.38
(34.34)
236.50
(0.07)
114,823.98
(35.28)
845.28
(0.26)
Disclaimer/Publisher’s Note: The statements, opinions and data contained in all publications are solely those of the individual author(s) and contributor(s) and not of MDPI and/or the editor(s). MDPI and/or the editor(s) disclaim responsibility for any injury to people or property resulting from any ideas, methods, instructions or products referred to in the content.