Article

Distribution, Dynamics and Drivers of Asian Active Fire Occurrences

1
School of Environment and Spatial Informatics, China University of Mining and Technology, Xuzhou 221116, China
2
The Hong Kong Polytechnic University-Shenzhen Technology and Innovation Research Institute (Futian), Shenzhen 518000, China
3
Otto Poon Charitable Foundation Smart Cities Research Institute, The Hong Kong Polytechnic University, Hong Kong, China
4
Department of Land Surveying and Geo-Informatics, The Hong Kong Polytechnic University, Hong Kong, China
5
School of Geosciences and Info-Physics, Central South University, Changsha 410083, China
*
Author to whom correspondence should be addressed.
ISPRS Int. J. Geo-Inf. 2025, 14(9), 349; https://doi.org/10.3390/ijgi14090349
Submission received: 14 July 2025 / Revised: 1 September 2025 / Accepted: 10 September 2025 / Published: 12 September 2025

Abstract

As the world’s most populous and geographically diverse continent, active fire occurrence in Asia exhibits pronounced spatiotemporal heterogeneity, driven by climactic and anthropogenic factors. However, systematic analyses of Asian fire occurrence characteristics are still scarce, the quantitative and spatial relationship between fire dynamics and drivers remain poorly understood. Here, utilizing active fire and land cover products alongside climate and human footprint datasets, we explored the spatiotemporal distribution and dynamics of active fire counts (FC) over 20 years (2003–2022) in Asia, quantifying the effects of climate and human management. Results analyzed over 10 million active fires, with cropland fires predominating (25.6%) and Southeast Asia identified as the hotspot. FC seasonal dynamics were governed by temperature and precipitation, while spring was the primary burning season. A continental inter-annual FC decline (mean slope: −8716 yr−1) was identified, primarily attributed to forest fire reduction. Subsequently, we further clarified the drivers of FC dynamics. Time series decomposition attributed short-term FC fluctuations to extreme climate events (e.g., 2015 El Niño), while long-term trends reflected cumulative human interventions (e.g., cropland management). The trend analysis revealed that woody vegetation fires in the Indochina Peninsula shifted to herbaceous fires, Asian cropland FC primarily increased but were restricted in eastern China and Thailand by strict policies. Spatially, hydrometeorological factors dominated 58.1% of FC variations but exhibited opposite effects between arid and humid regions, followed by human factor, where human activities shifted from fire promotion to suppression through land-use transitions. These driving mechanism insights establish a new framework for adaptive fire management amid escalating environmental change.

1. Introduction

Fire plays a crucial role in the Earth’s ecosystem, significantly impacting the global carbon cycle [1,2,3,4], climate change [5,6,7], and biodiversity [8,9,10]. In recent years, frequent extreme wildfires worldwide have posed serious threats to human safety and economic stability while causing irreversible damage to ecosystems [11,12]. To understand the wildfire occurrence patterns and reduce the losses caused, previous studies have explored the distribution and drivers of global fires [13,14,15], with particular attention given to extreme wildfire events in Australia, Europe, and North America [8,16,17,18,19]. Research indicates that global fire activity exhibiting significant spatiotemporal heterogeneity under various driving mechanism [20,21]. The fragmentation of fire-prone landscapes by agriculture has reduced the fire activity worldwide [22,23], while the frequency of climate-driving extreme wildfires continues to increase [17,24]. Over the past two decades, more than one billion people have been exposed to high levels of indoor PM2.5 resulting from wildfires [25]. Investigating the driving effects of multiple factors on fire activity is of great importance for exploring new mechanisms of wildfire occurrence in the era of environmental transformation [26,27].
As the most geographically diverse continent, Asia encompasses various ecosystems and climate zones, resulting in complex fire distribution and dynamics [28,29]. Asia is also the most populous continent, where its economic, demographic, and cultural diversity drives substantial various in human influence on fire regimes [30,31,32]. Distinct anthropogenic pressures—such as agricultural burning, deforestation, and unplanned urbanization—amplify fire-related complexities [33,34,35], a dimension frequently neglected in studies prioritizing climatic or regional geographic factors [36,37]. Comprehensively exploring the spatiotemporal characteristics of active fire occurrences across Asia is essential for understanding wildfire patterns and underlying driving mechanisms. However, current research on Asian fire regimes and driving mechanisms remains limited and often focuses on individual countries or regions [38,39,40], lacking a comprehensive analysis from continental to regional scales [41,42]. Given the complex interplay of natural and anthropogenic factors across Asia, differences and commonalities in fire characteristics among different regions remain challenging to compare, which hinders the sharing of wildfire management experience between countries and regions [43,44,45]. Therefore, it is necessary to systematically examine the spatiotemporal patterns of fire activity across Asia and establish a unified understanding of fire driving mechanisms under a consistent framework, which will facilitate informed decision-making and support adaptive fire management strategies.
Remote sensing, as a low-cost and large-scale surface observation method, has accumulated a large amount of available data and products over the years, providing an effective basis for observing and analyzing the spatiotemporal dynamics of fires [46,47,48]. The MODIS active fire products, providing near-real-time global fire observations, are widely used for global fire monitoring [14,49], with land cover products are useable for exploring the active fire characteristics within different vegetation classes [50,51]. Climate datasets, including temperature, evapotranspiration, precipitation, and soil moisture, are widely considered as natural drivers of fire occurrences [13,39,52]. Additionally, human footprint data, representing population density, activity regions, and development levels, has been utilized to assess the influence of human activities on fire occurrences [53,54].
Within this context, in this study, we focus on exploring the long-term (2003–2022) spatiotemporal distribution and dynamics of active fire occurrences in Asia and the driving factors behind these dynamics. First, we employed MODIS active fire and land cover products to construct the first 0.25°-resolution inventory of fire counts (FC) across Asia, enabling it to analyze the spatiotemporal distributions and dynamics of the five major fire types on a continental to regional scale under a consistent data framework. In this study, the term “fire type” refers to active fire occurrences identified within a specific land cover class (e.g., “cropland fires”, “grassland fires”). On this basis, we innovatively applied a Bayesian framework to decompose the monthly FC series into seasonal and trend components, analyzing the causes of short-term abrupt and long-term trends. Second, we used the Theil–Sen estimator and Mann–Kendall test to assess the interannual FC trends for each fire type within 0.25° cells and observed their increases or decreases across different regions. Finally, we considered 7 independent climatic variables and one composite human pressure variable as driving factors, applying Spearman’s rank correlation to evaluate each variable group’s contribution to the interannual FC trends within each 0.25° cell, thereby comprehensively dissecting the driving mechanisms of Asia’s spatiotemporal fire dynamics. This study aims to fill gaps in Asian fire research by analyzing fire spatiotemporal dynamics from continental to regional scales, enabling cross-regional comparisons and discussions, revealing the driving patterns of meteorological and anthropogenic influences on fire dynamics, and providing new insights for fire management practices in the era of environmental transformation.

2. Datasets and Methodology

2.1. Datasets

2.1.1. Active Fire Products

To investigate large scale fire occurrence patterns, active fire products and burned area products are widely employed in research, including MCD14ML, FireCCI51, GFED4 and MCD64A1 [11,14,37,55]. However, the pixel based burned area products could underestimate sub-pixel fires, such as agricultural or some forested landscape fires [56,57]. Considering that the fires in Asia are usually small-scaled and fragmented [38], point based active fire products are selected as fire observation data to investigate Asian fire activity in this study. Fire Information for Resource Management System (FIRMS) provides near-real-time active fire products from three sensors designed and launched by National Aeronautics and Space Administration (NASA): LANDSAT OLI (8 and 9), VIIRS (SUOMI NPP, NOAA-20, and NOAA-21), and MODIS (Terra and Aqua). Among these, only VIIRS (375 m resolution; available since January 2012) and MODIS (1 km resolution; available since November 2000) are globally applicable. Notably, MODIS offers superior temporal coverage, making it ideal for long-term fire trend analysis. Terra’s overpass times are at 10:30 and 22:30 (local time), with data available since November 2000, while Aqua’s overpass times are at 13:30 and 1:30 (local time), with data available since July 2002. To ensure comprehensive fire records for Asia, this study utilizes the Terra and Aqua combined MODIS Collection 6.1 active fire product.
MODIS C6.1 records latitude and longitude, brightness temperature, acquisition date and time, confidence level, fire radiative power, and inferred hot spot type for each 1 km cell containing fire or thermal anomalies, with a theoretical minimum detection area of 50 m2 [58]. To minimize the interference from non-vegetation hot sources (e.g., industrial, gas flares, and volcanoes) and improve data reliability, we only retained the records with inferred hot spot type 0 (presumed vegetation fire), and kept those with “High” or “Nominal” confidence levels (corresponding to confidence >80% and >30%, respectively) [58]. Here, the vegetation active fire records from 2003 to 2022 were applied to carry out the Asian active fire occurrences distribution and dynamics.

2.1.2. Land Cover Product

To maintain consistency with the MODIS fire data, the MODIS land cover product MCD12Q1 (Collection 6.1) was used to classify burned biomass types. Derived from MODIS Terra and Aqua reflectance data through supervised classification and enriched with prior knowledge and auxiliary information [50], MCD12Q1 provides global land cover types annually at 500 m resolution (2001–2023). In this study, annual MCD12Q1 datasets were mosaicked and clipped using Google Earth Engine (GEE) platform, adopting the International Geosphere-Biosphere Programme (IGBP) classification scheme formulated by International Council for Science (ICSU), which categorizes land cover into 17 types. Then, we employed ArcGIS 10.8 to spatially overlay MODIS C6.1 fire points with their corresponding MCD12Q1 land cover types.

2.1.3. Human Footprint Data

Human activities significantly influence fire occurrence and management [53]. To analyze this relationship, this study utilizes the annual terrestrial Human Footprint (HFP) Dataset produced by China Agricultural University (CAU) [59], which aggregates eight variables reflecting anthropogenic pressures: built environments, population density, nighttime lights, croplands, pastures, roads, railways, and navigable waterways. According to the preset scoring framework [60], each variable is weighted based on its contribution to human impact on the terrestrial surface, providing a quantifiable measure of global human influence ranging from 0 (minimal) to 50 (maximum). Validated through visual interpretation and cross-validation, annual HFP dataset is publicly available on figshare (https://doi.org/10.6084/m9.figshare.16571064, accessed on 10 September 2025) as 1 km resolution GEOTIFF files in Mollweide equal-area projection, covers the period from 2000 to 2022.

2.1.4. Climate Variables

Climate governs critical fire-conditioning variables such as temperature and fuel moisture, directly influencing fire occurrence probability and behavior. To investigate climate-fire dynamics, seven climate variables were considered, categorized into three groups: moisture deficit-related meteorological variables, moisture availability-related hydrological variables, and temperature variables (see Table 1). All climate data were sourced from the TERRACLIMATE dataset produced by University of California, Merced (UC Merced) [61], a global resource spanning from 1958 to 2024 (http://www.climatologylab.org/terraclimate.html, accessed on 10 September 2025), with a monthly temporal resolution and a spatial resolution of 1/24° (~4 km).
The moisture deficit-related meteorological variables include actual evapotranspiration (AET), potential evapotranspiration (PET) and vapor pressure deficit (VPD). AET is the evapotranspiration estimated under real-world moisture constraints. PET, calculated via the Penman-Monteith method, represents the maximum possible evapotranspiration of the underlying surface under unlimited water supply. VPD is the difference between saturated and actual vapor pressure at ambient temperature, quantifying the atmosphere’s evaporative potential. This group variables indicate fuel moisture deficit and, consequently, fire occurrence and spread [37].
The moisture availability-related hydrological variables are precipitation (PPT) and soil moisture (SM). PPT represents the monthly cumulative rainfall, estimated by combining historical normals with monthly anomalies. SM is derived from a water balance model and represents the end-of-month soil moisture condition. PPT and SM reflect the supply and storage of moisture in the surface and subsurface, regulating fuel moisture availability [62].
Temperature affects vegetation growth and is a fundamental driver of fire occurrence, the temperature variables in this study are monthly maximum (Tmax) and minimum (Tmin) temperatures. Tmax and Tmin temperatures represent the monthly average of daily highest and lowest 2 m surface temperatures, respectively, derived from interpolated climate normals adjusted for monthly temperature anomalies.

2.2. Methodology

This study comprehensively analyzed various vegetation fire occurrences in Asia from 2003 to 2022 with multisource data, including burning regions, burning seasons, dynamics, trends, and corresponding driving factors (Figure 1). The methods used are explained in subsequent sections.

2.2.1. Data Aggregation

In order to facilitate comparative and statistical analyses, all raster datasets (except for the MCD12Q1 product) were bilinearly interpolated and reprojected to a 0.25° spatial resolution in the WGS1984 coordinate system. For MODIS C6.1 data, a 0.25° × 0.25° fishnet grid was generated, and the number of active fire spot records within each grid cell were calculated using the spatial join tool in ArcGIS, denoted as fire counts (FC). To ensure direct comparability with existing studies [14,30,39,55], all statistical analyses in this study are based on individual active fire detections rather than on clustered fire events. Climate variables further underwent annual temporal aggregation: Tmax and Tmin were calculated as yearly mean values, while the rest were calculated as yearly cumulative values.

2.2.2. Time Series Decomposition

Under the influence of climate and phenology, fire occurrences exhibit clear seasonal dynamics. Meanwhile, due to environmental changes and human activities, fire occurrences also demonstrate long-term trends. The Bayesian Estimator of Abrupt change, Seasonal change, and Trend (BEAST) [63] could decompose a complex time series data into the sum of the trend and seasonality, Li et al. [64] employed BEAST to decompose the trend and seasonality, thereby reconstructing a gap-free land surface temperature time series. The general form of BEAST is defined as Equation (1):
Y t = T t + S t ,   t   =   1 , ,   n
where Y t (t denotes time) represents the time series, T t is the trend, S t is the seasonality, n is the number of time nodes in the time series. Abrupt changes (change points) may occur within the trend or seasonal components, altering the inherent patterns of the series. BEAST employs a Bayesian Model Averaging (BMA) to assign a probability to each potential change point, reflecting the likelihood of it being a true point of alteration.

2.2.3. Trend Analysis

The Theil-Sen slope estimator was employed to quantify the interannual trends of fire occurrences, mitigating the influence of outliers within the time series on trend analysis. The Theil-Sen approach first calculates the slopes between all possible pairs of data points in the time series, and then takes the median of these slopes to represent the overall trend [65]. This approach is highly insensitive to errors or outliers, capable of tolerating contamination from up to nearly 1/3 of the data without compromising parameter estimation, thereby ensuring robust results [43]. In this study, the interannual trend in fire occurrence was computed as follows:
β = M e d i a n x j x i j i   j > i
where x j and x i are the FC at j-th and i-th year, respectively, M e d i a n · represents the median function. The interannual trends of whole fires in Asia or any specific vegetation fires are all calculated using Equation (2). If β is greater than 0, it indicates the interannual trend is increasing.
The Mann–Kendall test is a widely used non-parametric statistical test designed to distinguish the significance of a trend. Combining the Mann–Kendall test and the Theil-Sen estimator is a common approach for time series trend analysis [66,67]. This test is based on the rank correlation of the time series rather than its actual values, eliminating the need for data to follow a specific distribution and highly resistant to outliers. To test the significance level of a trend, the test statistic S is first calculated as:
S = i = 1 n 1 j = i + 1 n s g n x j x i
where n is the number of values in the time series, x j and x i are the values at time j and i (j > i), respectively, s g n · is a sign function as followed:
s g n x j x i = 1 ,     i f   x j x i > 0 0 ,     i f   x j x i = 0 1 ,     i f   x j x i < 0
In cases where ties occur in the data, the variance of S is computed with adjustments for tied groups:
V A R S = 1 18 n n 1 2 n + 5 k = 1 p q k q k 1 2 q k + 5
where p is the number of tie groups, and q k is the number of data points in the k-th tie group.
The standardized test statistic Z is then derived and compared against critical values from the normal distribution:
Z = S 1 V A R S ,     i f   S > 0 0 ,                                         i f   S = 0 S + 1 V A R S ,     i f   S < 0
The two-tailed trend test was conducted at a significance level of α = 0.05 , with the corresponding critical value of ± 1.96 from the standard normal distribution table. If Z > 1.96, it indicates that the probability of the null hypothesis (no trend) being true is less than 0.05 (p < 0.05), thereby the null hypothesis is rejected, signifying the presence of a statistically significant trend. Furthermore, a positive Z value signifies an increasing trend, while a negative Z value indicates a decreasing trend.
In this study, we employed the combination of the Theil–Sen estimator and the Mann–Kendall test to compute the interannual Asia active fire trend on each 0.25° cell, and cells exhibiting significant trends (p < 0.05) were subsequently subjected to statistical analysis.

2.2.4. Driving Factor Analysis

To quantify the relationship between interannual FC variations and each driving factor while avoiding the multicollinearity issues inherent in multiple regression models for this context, we employed Spearman’s rank correlation coefficient (SRCC) analysis. SRCC is a non-parametric test that is computed based on the ranks of the data rather than their actual values, making it distribution-free and free from assumptions of linearity between variables. The simplified calculation is given by:
ρ = 1 6 i n d i 2 n n 2 1
where d i is the difference between the ranks of the i-th pair, and n is the sample size. A positive ρ indicates a positive correlation, while a negative value indicates a negative correlation, larger ρ value correspond to stronger correlation.
The analysis was performed on a per-pixel basis. For each 0.25° grid cell, we calculated the SRCCs between the annual FC time series and the annual time series of each of the eight driving factors. Only SRCCs that were statistically significant (p < 0.05) were retained for subsequent analysis. Then the absolute values of these SRCCs were compared, and the factor with the largest absolute value was identified as the strongest driver for that cell. In this way, the contributions of different drivers to the interannual variations in FC across Asia were quantified and mapped, providing deeper insights into the spatially heterogeneous influence of these factors on fire trends.

3. Results

3.1. Spatiotemporal Distribution of Asian Fires

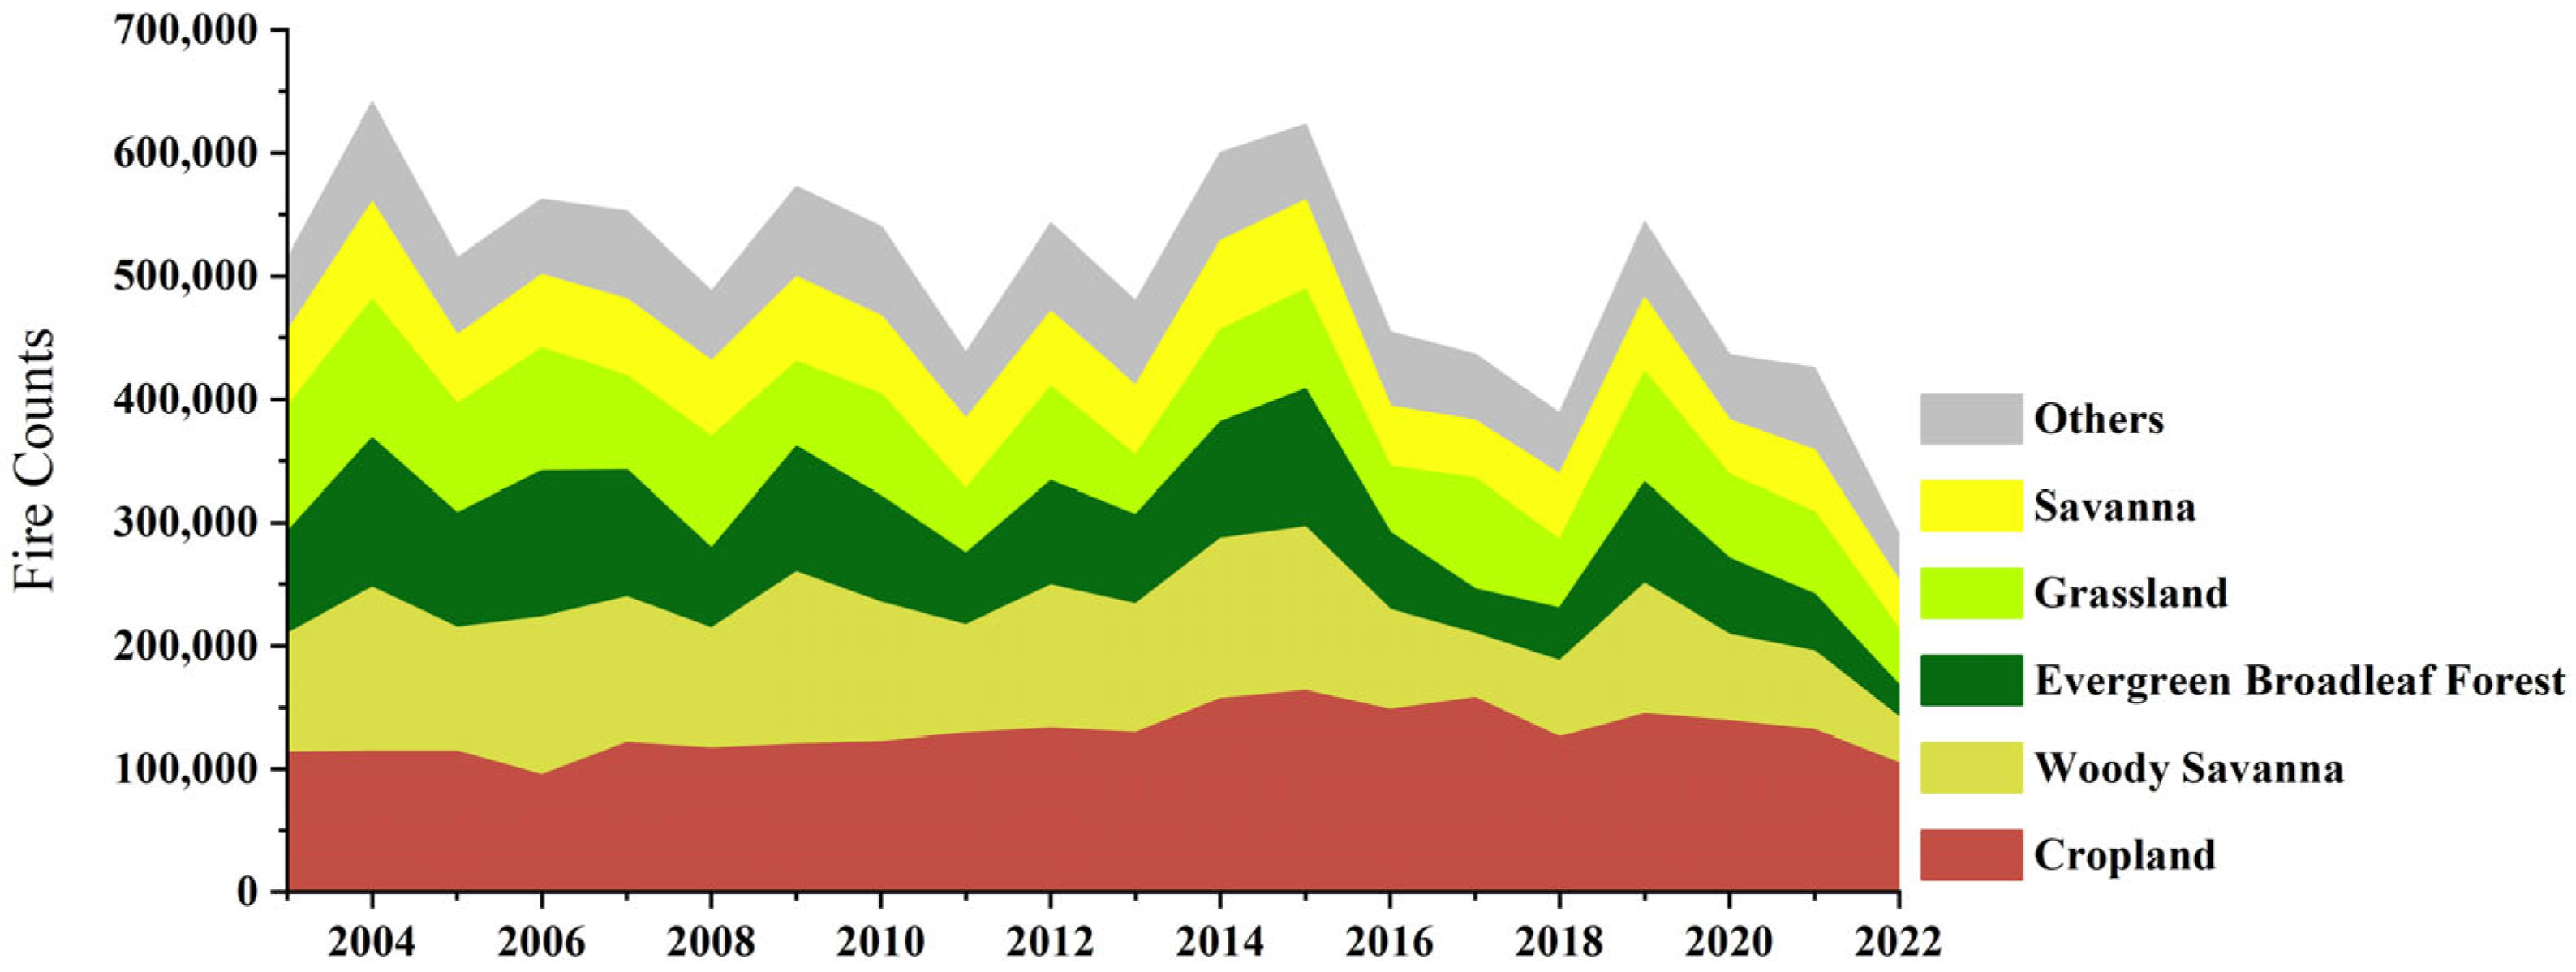
As mentioned, we assessed the MODIS C6.1 active fire product, from 2003 to 2022. After spatially joining the MODIS C6.1 fire records with the corresponding annual MCD12Q1 land cover classes, FC among different land cover types in Asia were analyzed at a 0.25° resolution for the period 2003–2022. Over the 20-year period, a total of 10.03 million active fires were recorded in Asia. The top five fire types, in descending order, were cropland, woody savanna (WS), evergreen broadleaf forest (EBF), grassland, and savanna, with FC of 2.57 million, 1.97 million, 1.55 million, 1.52 million and 1.17 million, corresponding to proportions of 25.63%, 19.63%, 15.45%, 15.18%, and 11.69%, respectively, and cumulatively accounting for 87.58% of the total records.
The sixth ranked type, deciduous broadleaf forest, with 0.47 million FC, representing 4.72%. Figure 2 shows a stacked bar chart illustrating the distribution of FC among the top five fire types and the others, where the size of each colored area corresponds to the proportion of FC in that category. It is evident that the top five fire types comprise the majority of FC in Asia, capturing the primary characteristics of fire regimes over the continent. Consequently, the subsequent analysis in this study focuses on these five major fire types for a more in-depth investigation.

3.1.1. Spatial Distribution of Asian Fires

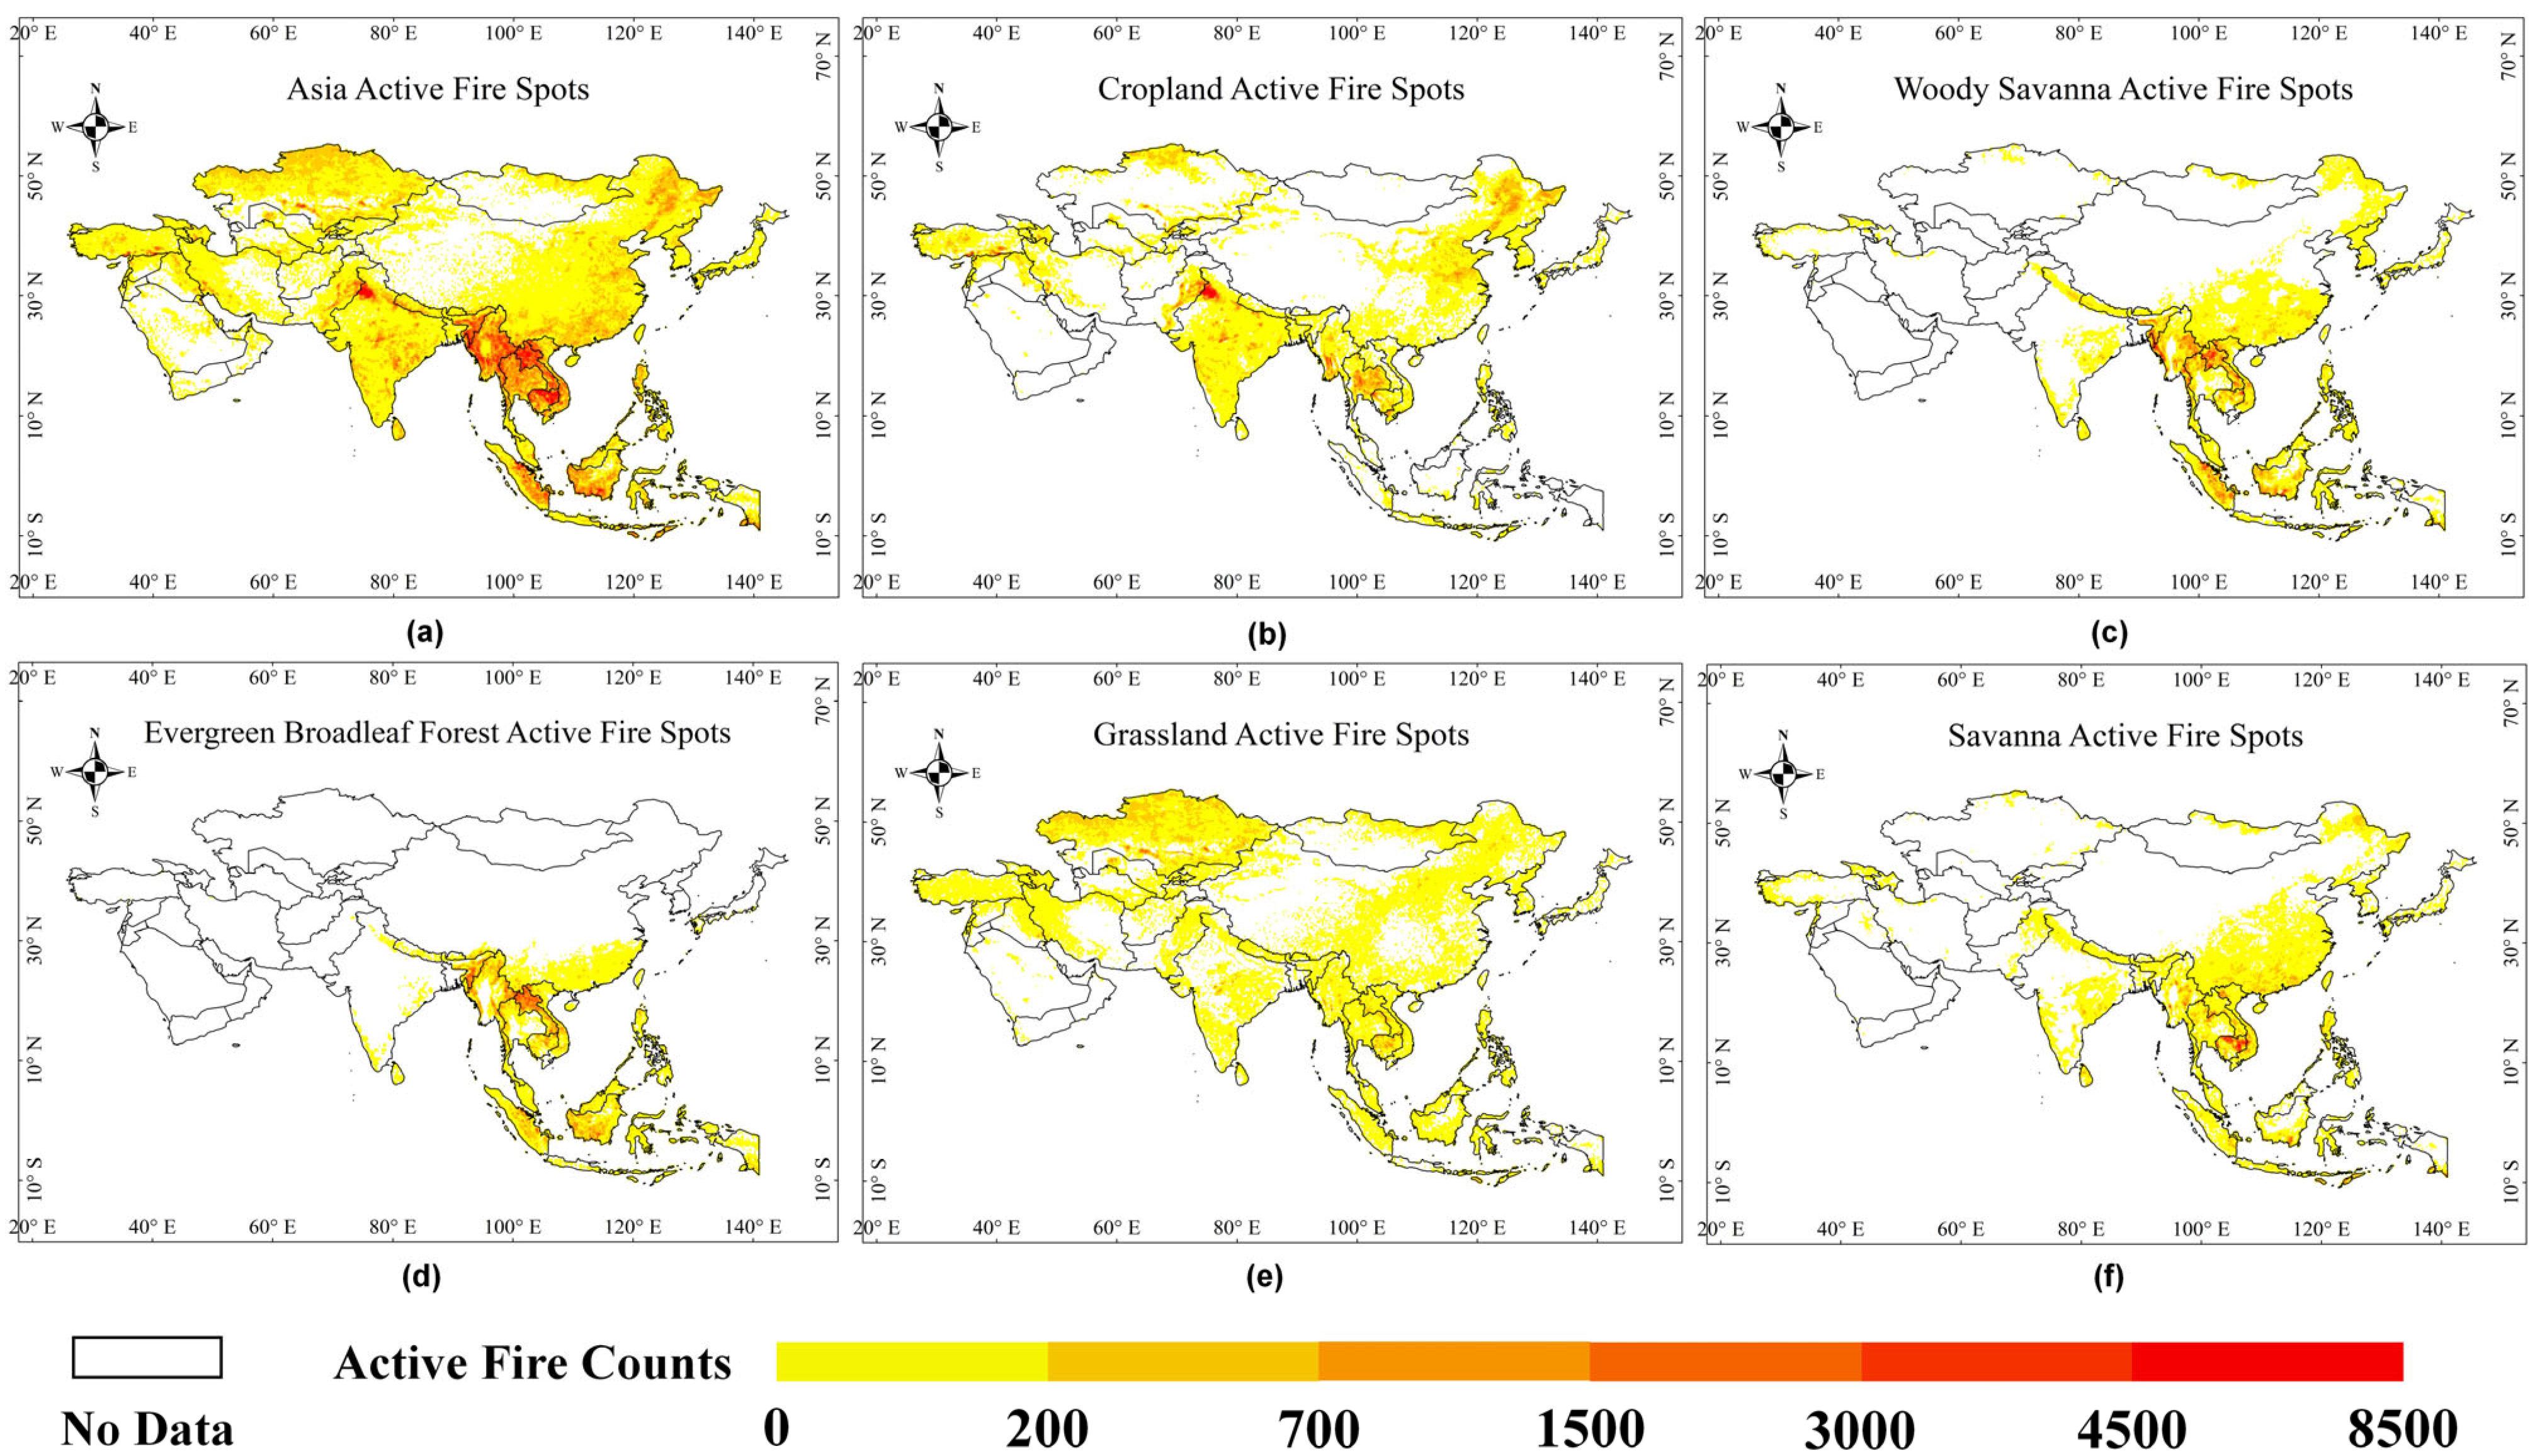
Figure 3 illustrates the spatial distribution of total FC in Asia and for the five major fire types during 2003–2022. Figure 3a shows that, on average, each 0.25° cell in Asia experienced 13.74 active fires annually. Regions such as the Indochina, Punjab in India, and the equatorial areas of Sumatra and Kalimantan are identified as fire hotspots, whereas the cold Qinghai-Tibetan Plateau and sparsely vegetated desert regions are scarcely or not affected by active fires. Notably, Punjab, northern Laos, and northern Cambodia are among the regions with the highest fire frequency. Punjab, India’s most agriculturally developed region [68], is the most concentrated area for cropland fires in Asia (Figure 3b). Figure 3c,d indicate that in northern Laos, WS and EBF fire types predominate, with EBF fires being particularly prominent. In northern Cambodia, savanna fires dominate, making it the most concentrated region for savanna fires in Asia (Figure 3f). The high-frequency fire zones in Southeast Asia largely coincide with national borders, especially at the intersection of China’s Yunnan Province with Myanmar and Lao. Despite sharing similar topographic, climatic, and vegetation characteristics, these regions exhibit stark differences in fire activity, the FC in Yunnan is considerably lower than that in the adjacent regions of Myanmar and Laos.
Among the five fire types, grassland fires are the most widely distributed, occurring in 72.73% of cells (considering only cells with data), yet they have the lowest average frequency, with only 2.87 fires per cell annually. Kazakhstan is the country with the highest number of grassland fires in Asia, accounting for 51.51% of the total. In contrast, EBF fires have the smallest spatial distribution (22.76%), limited to Southeast Asia and southern China, but they have the highest average frequency, with 9.33 fires per cell annually. Given that many Asian countries are predominantly agricultural, cropland fires make a substantial contribution to overall FC. Figure 3b indicates that over the 20-year period, India (30.15%), China (25.72%), and Thailand (8.70%) are the top three countries in terms of the proportion of cropland fires in Asia. In India, cropland fires are highly concentrated, with the number of cropland fires in Punjab accounting for 41.69% of the national total. In China, the Northeast Plain and North China Plain are the most active regions for cropland fires, while in Thailand, cropland fires frequently occur across all agricultural areas nationwide. Finally, the spatial distribution ranges of WS and savanna fires are relatively similar, but their active regions differ significantly.

3.1.2. Monthly Distribution of Asian Fires

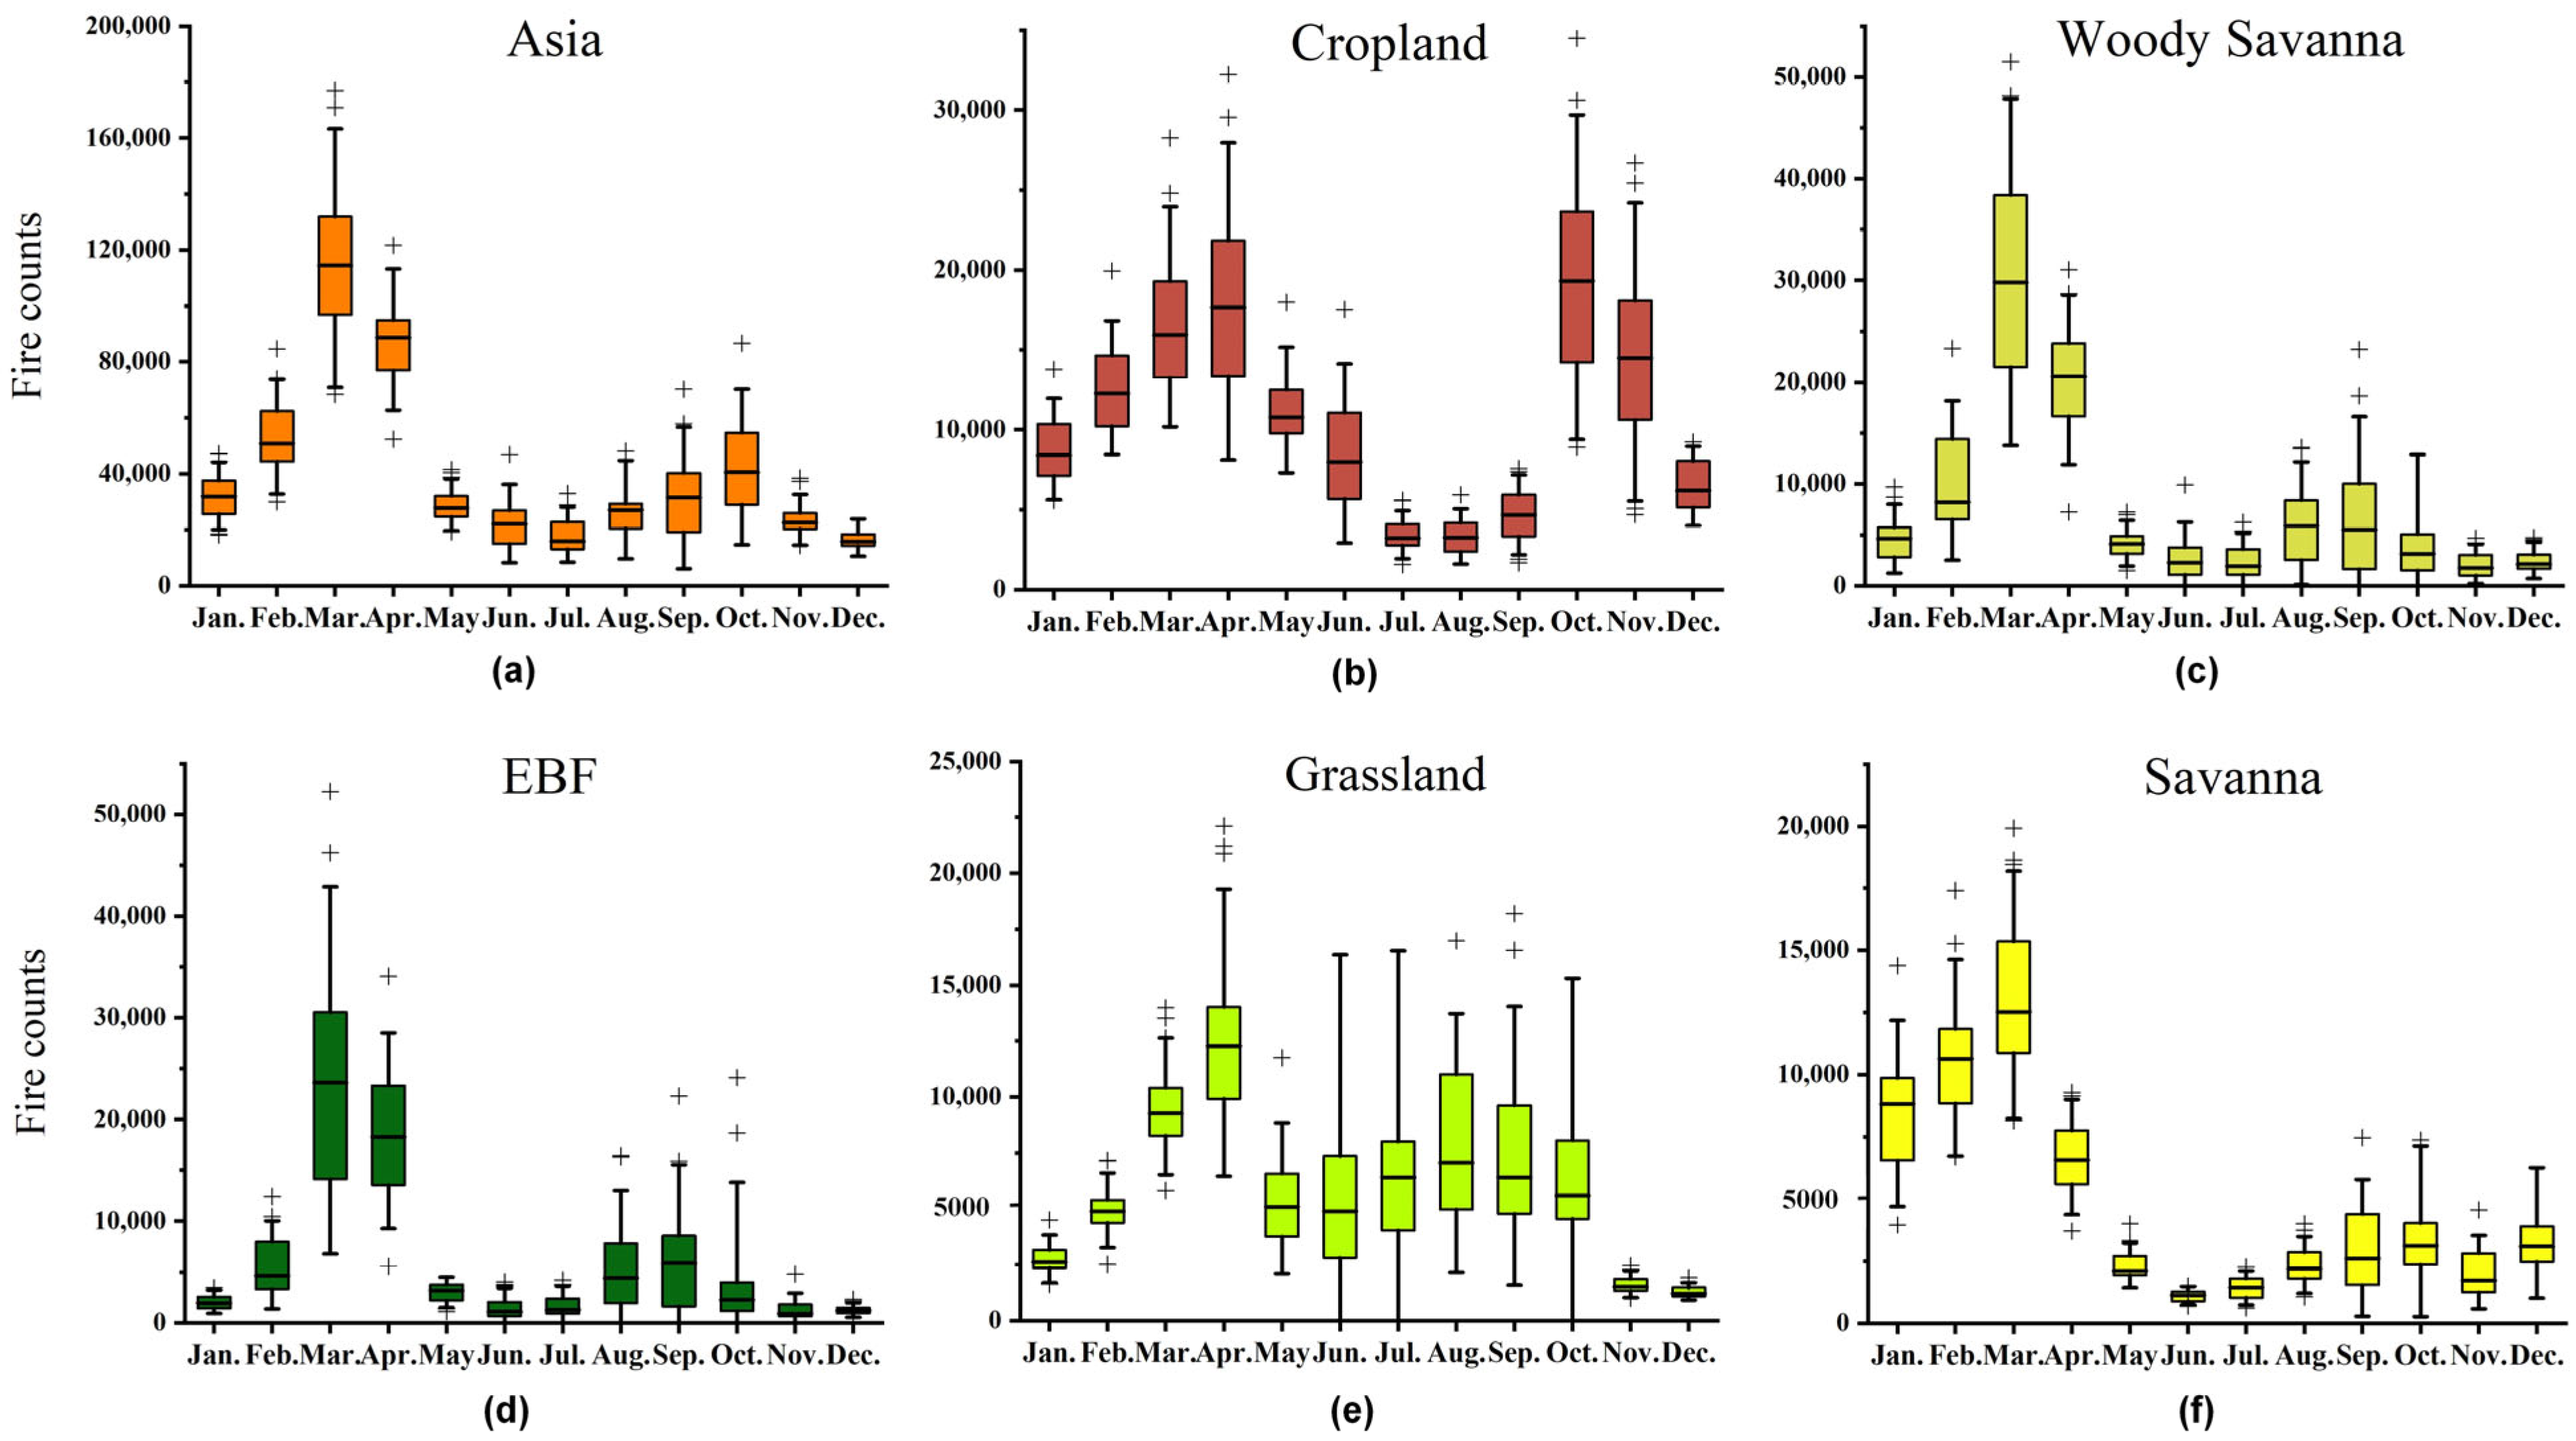
To analyze the fire seasonality of different vegetation types in Asia, making it helpful for seasonal fire management, Figure 4 presents the monthly FC for Asia and for the five major fire types from 2003 to 2022, displayed in the form of box plots. As shown in Figure 4a, March is the month with the highest frequency of fire occurrences over these 20 years, with 2.34 million occurrences, accounting for 23.34% of the annual total. Spring (March–April) is the most fire-prone season, 40.88% of annual fires concentrated during these two months. Other months exhibit relatively similar FC levels, July and December are the months with the fewest fires (0.37 million and 0.35 million, respectively).
Each vegetation type exhibited a distinct seasonal burning pattern (Figure 4b–f). Cropland fires were predominantly concentrated in spring (March–April) and autumn (October–November), contributing 27.29% and 26.76% of the annual total, respectively. October was the peak month for cropland fires, with 46% of fires in Asia occurring in croplands during this month. Similarly, for WS, EBF, and grassland fires (Figure 4c–e), the fire occurrences were also concentrated in spring. Aside from spring, the burning period for WS (Figure 4c) was less concentrated, while the FC in February, August, and September were slightly higher than in other months. The summer (June–August) had the lowest WS FC, accounting for only 11.59% of the annual total, and November was the lowest month at 2.18%. In EBF areas, fire occurrences usually rely on nearby vegetation communities, typically WS, due to the limited litter accumulation; thus, the monthly distribution of EBF fires (Figure 4d) closely resembles that of WS fires. Similarly to WS, EBF also exhibited higher fire frequencies in spring, while remaining relatively consistent across other seasons. 11.65% of EBF fires occurred during winter (December–February), totaling 0.18 million FC, representing the lowest EBF seasonal burning level. Grassland fires (Figure 4e) maintained high levels during spring (March–May), summer (June–August), and autumn (September–October). Similarly to EBF, winter (December–February) recorded the lowest grassland FC, contributing only 11.81% of the annual total. In contrast, savanna fires (Figure 4f) exhibited highest seasonal frequency in winter (December–February), with 0.46 million occurrences (38.79% of the annual total). March was the highest month for savanna fires, accounting for 22.52% of the annual total. A sharp decline is observed from March to June, and June became the lowest month at only 1.9% of the annual total. Savanna FC then remained relatively low until increasing again in winter.

3.2. Dynamic Analysis of Asian Fires

3.2.1. Interannual Variation

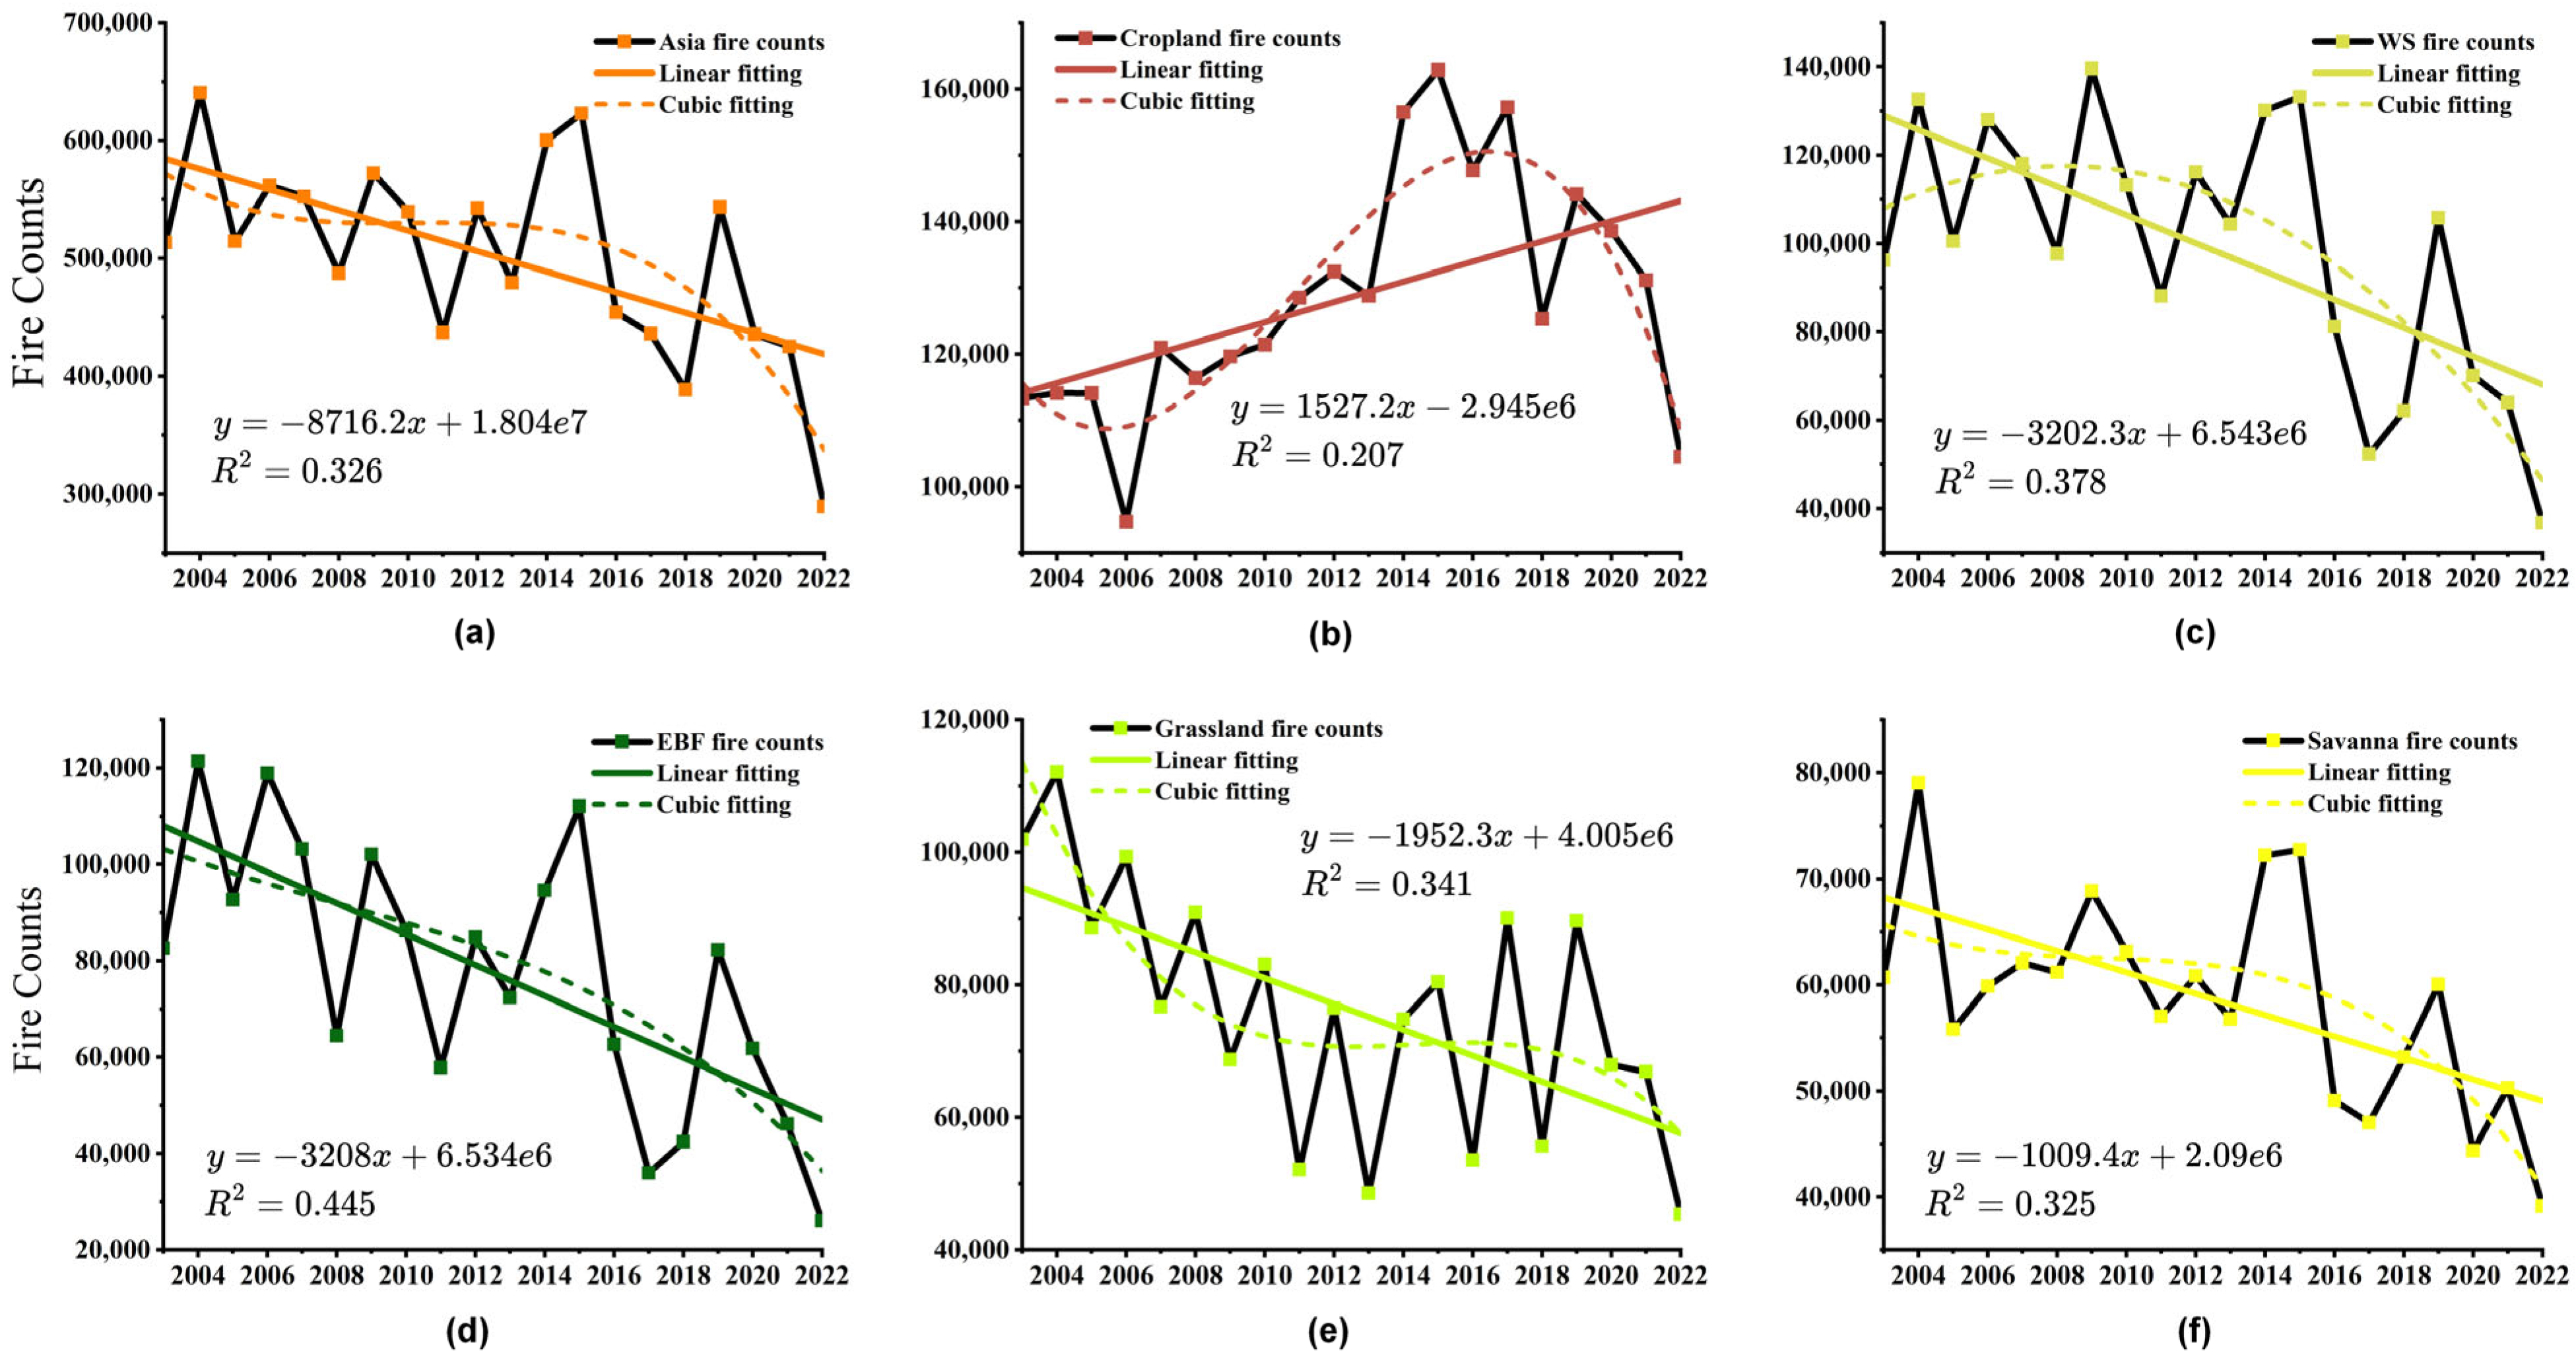
Figure 5 illustrates the annual FC in Asia from 2003 to 2022, in which linear fitting lines represent the long-term direction of variation over 20-years, while cubic fitting curves show the trajectory of interannual variation. All fitting results passed the significance test (p < 0.05). Figure 5a shows the variation in the total Asia annual FC, showing a persistent decline since 2004, with an average slope of −8716.2 yr−1. The average Asia annual FC was approximately 0.54 million during 2003–2015, decreasing to 0.42 million during 2016–2022. Notably, anomalous increases occurred during 2014–2015 and in 2019. During 2019–2022, fire levels dropped from 0.54 million to 0.29 million yr−1, reaching the lowest level in the 20-year period.
Figure 5b–f illustrate the variations in annual FC for the five fire types, each displaying distinct temporal characteristics. Among these fire types, cropland fires were the only type showing an overall increasing trend (Figure 5b), with an average slope of 1527.2 yr−1. The cropland FC kept increasing during 2006–2015, reached the peak in 2015, then showed an obviously decreasing from 2015 to 2022. The most significant decline is observed in EBF interannual FC, with an average slope of −3208 yr−1, followed by WS fires at −3202.3 yr−1. The number of grassland and savanna fires was lower and their decline was also more gradual. Over these 20 years, the variations in annual FC of WS, EBF, and savanna fires were highly coincident, always synchronously increasing or decreasing, especially during periods influenced by El Niño (2014–2015), extreme weather (2019), and the COVID-19 pandemic (2020–2022). The details of the FC variations will be more accurately characterized and discussed using the BEAST method in Section 3.2.2 (Figure 6). Notably, grassland annual FC exhibited a pronounced alternating pattern of increase and decrease. This phenomenon may be attributed to the short lag in response of grassland aboveground biomass to fire events, and their ability to quickly regenerate [69].

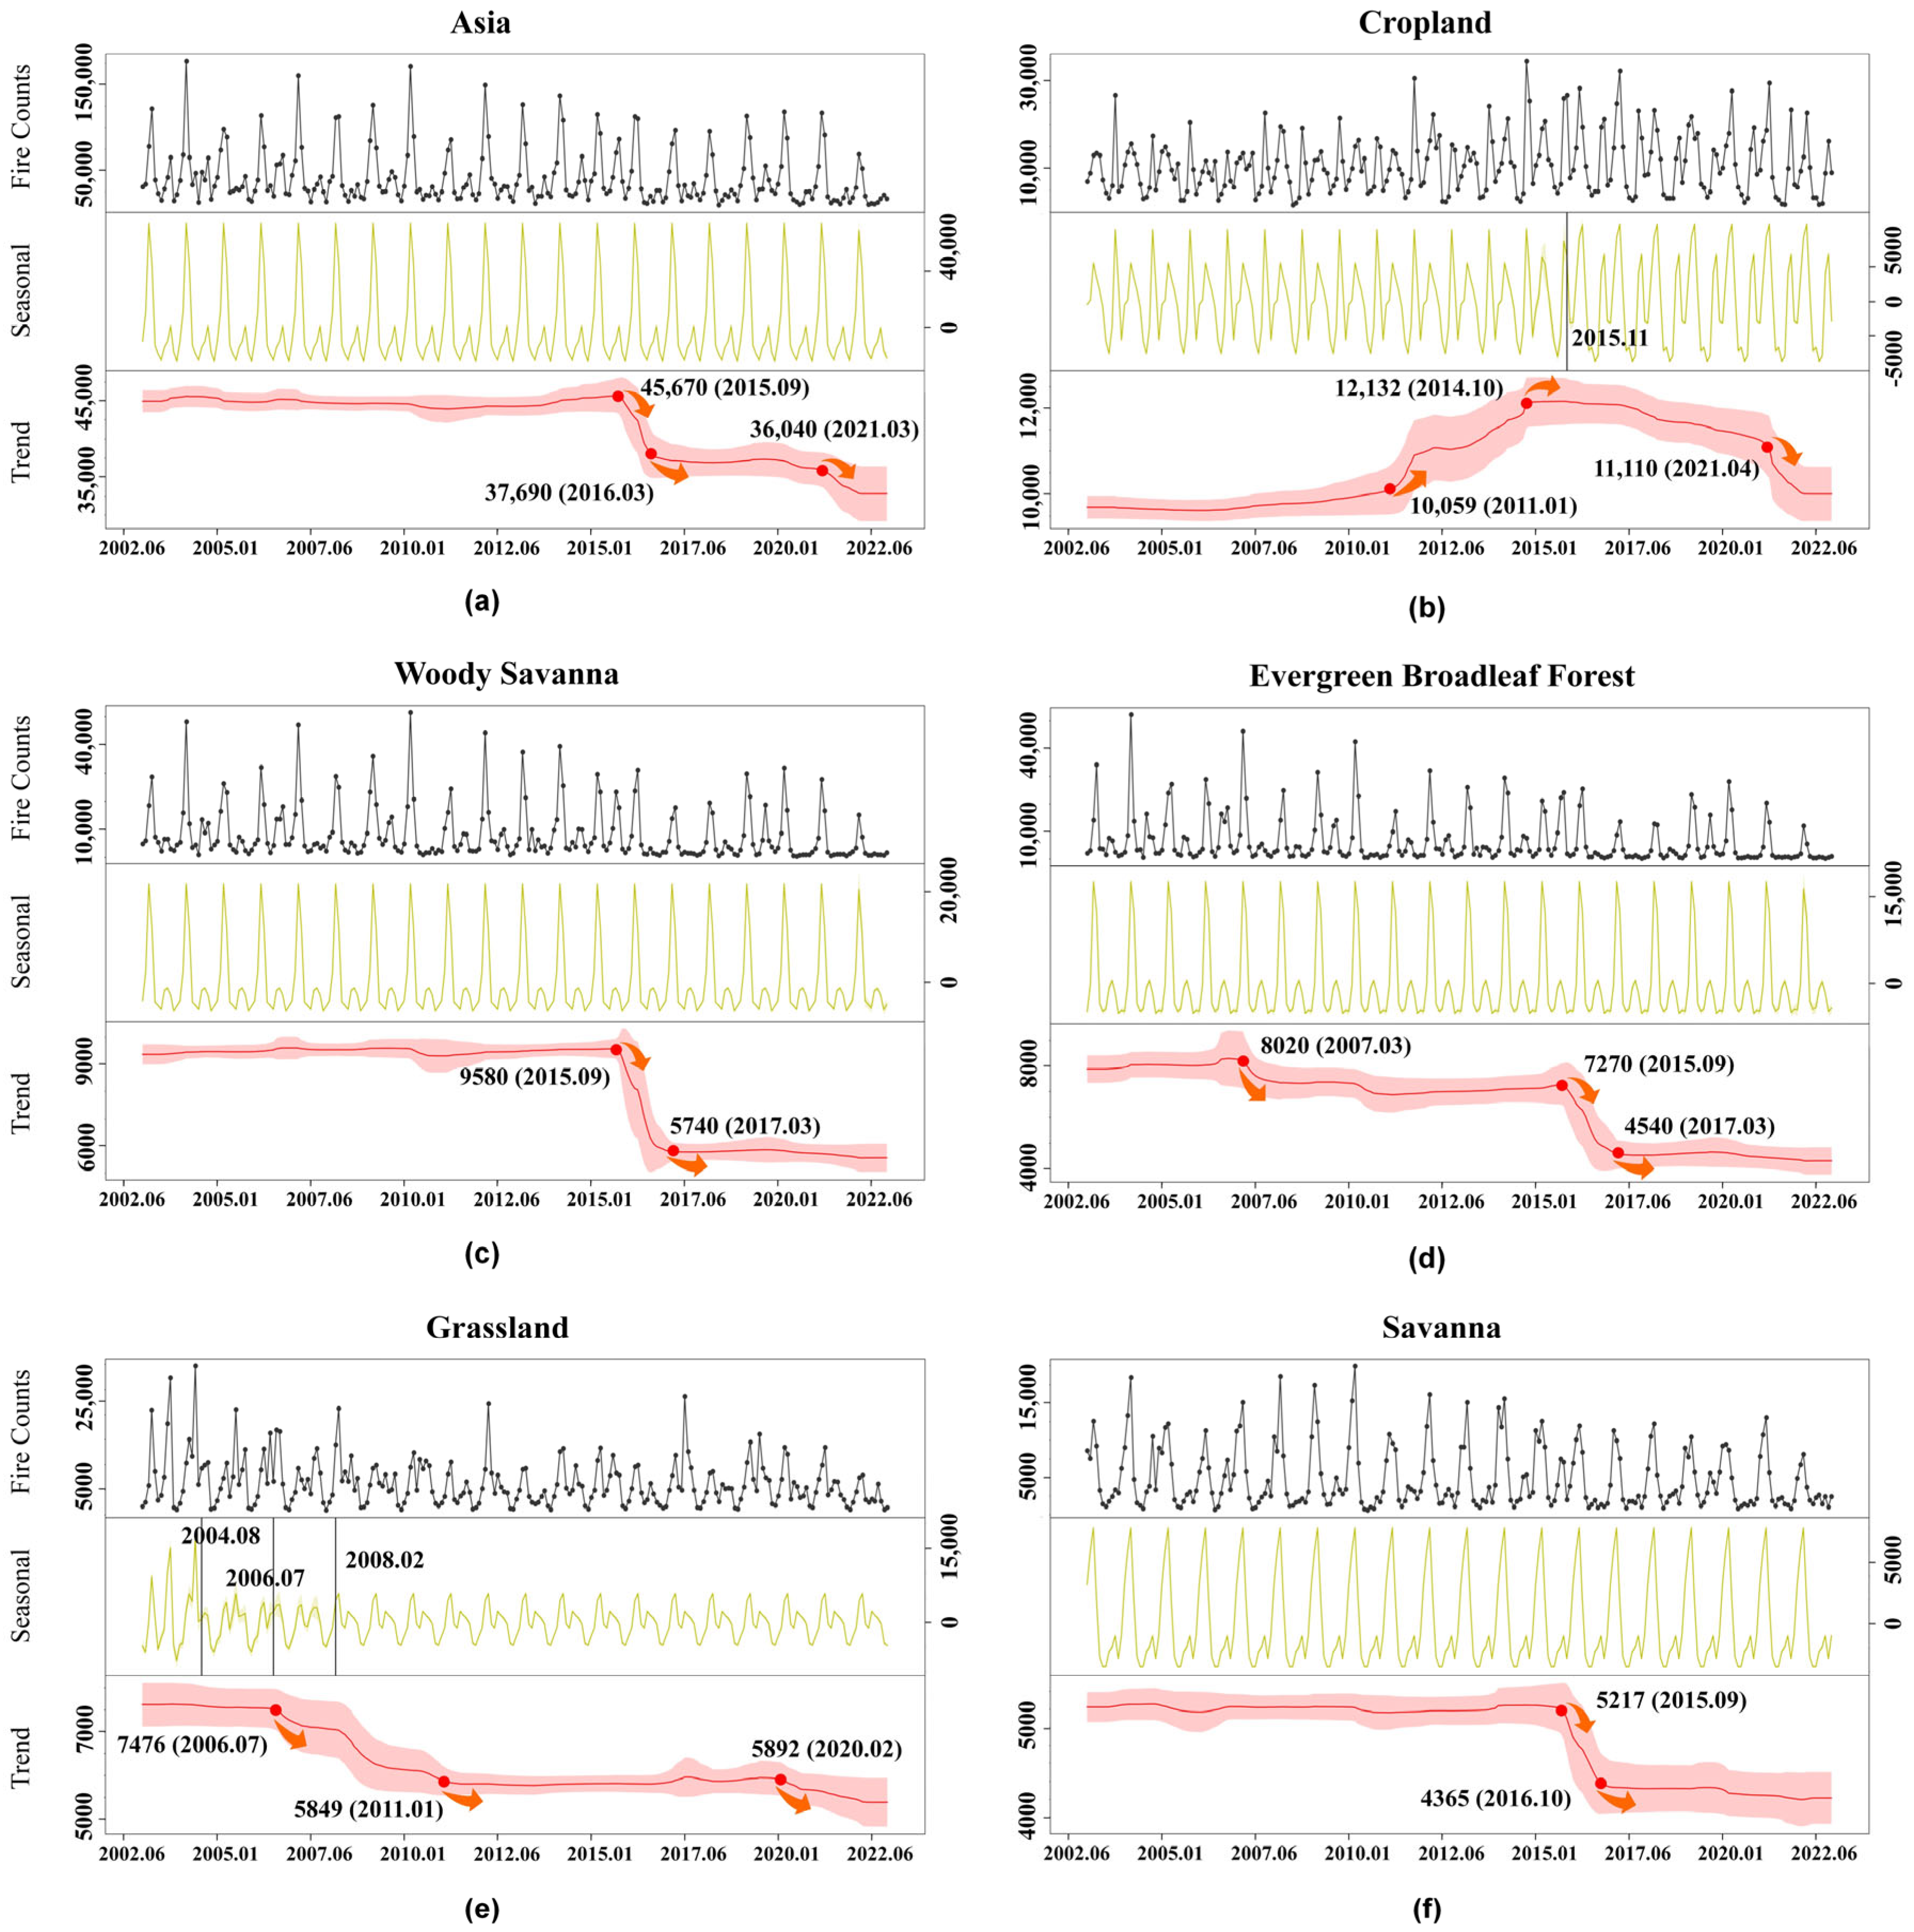
3.2.2. Seasonality and Trends

In addition to the interannual analysis, this study further plotted the monthly FC curves from 2003 to 2022. The BEAST was employed to decompose the original data into seasonal and trend components, showing the detailed variation process and critical time nodes (Figure 6). Figure 6a indicates that the monthly FC in Asia consistently maintained the seasonal pattern, with the trend beginning to decline in September 2015, stabilizing after March 2016, and showing a further decline in March 2021. Cropland fires were the only ones that experienced an increasing phase, starting around 2007 and accelerating in January 2011 until a sustained increase until October 2014, followed by a slow decline and then a rapid decline after April 2021 (Figure 6b). Although a slight alteration in the seasonal pattern of cropland fires occurred in November 2015, the bimodal (dual burning season) pattern was maintained. In contrast, the seasonal patterns for WS, EBF, and savanna fires were similar to the overall pattern observed in Asia, consistently exhibiting a unimodal (single burning season) pattern with no notable changes (Figure 6c,d,f). A declining trend in EBF FC emerged in March 2007, and both WS and EBF fire trends showed synchronous declines from September 2015 to March 2017. Similarly, a declining trend in savanna FC is observed from September 2015 to October 2016. Grassland fires experienced three shifts in seasonality (Figure 6e). Prior to August 2004, the fire season exhibited a distinct peak, followed by a stabilization period. Two minor changes occurred after which the seasonal pattern remained consistent. Since July 2006, grassland fires have been on a downward trend, maintained stability for 10 years after January 2011, and then began to decline again after February 2020.
Overall, the critical time nodes for seasonal or trend changes can be categorized into three periods: August 2004–January 2011, October 2014–March 2017, and February 2020–March 2021. The first period showed relatively weak changes, occurring only in grassland and EBF fires. The second period corresponded to an El Niño event; the feedback observed in the trends of different fire types indicated that the impact of the El Niño phenomenon on Asian fires continued for approximately one year after the presumed end of the El Niño period (October 2014 to April 2016). The third period suggested that the influence of COVID-19 pandemic on Asian fires may have begun in February 2020 and became most pronounced in March 2021.

3.2.3. Spatial Distribution of Interannual Trends

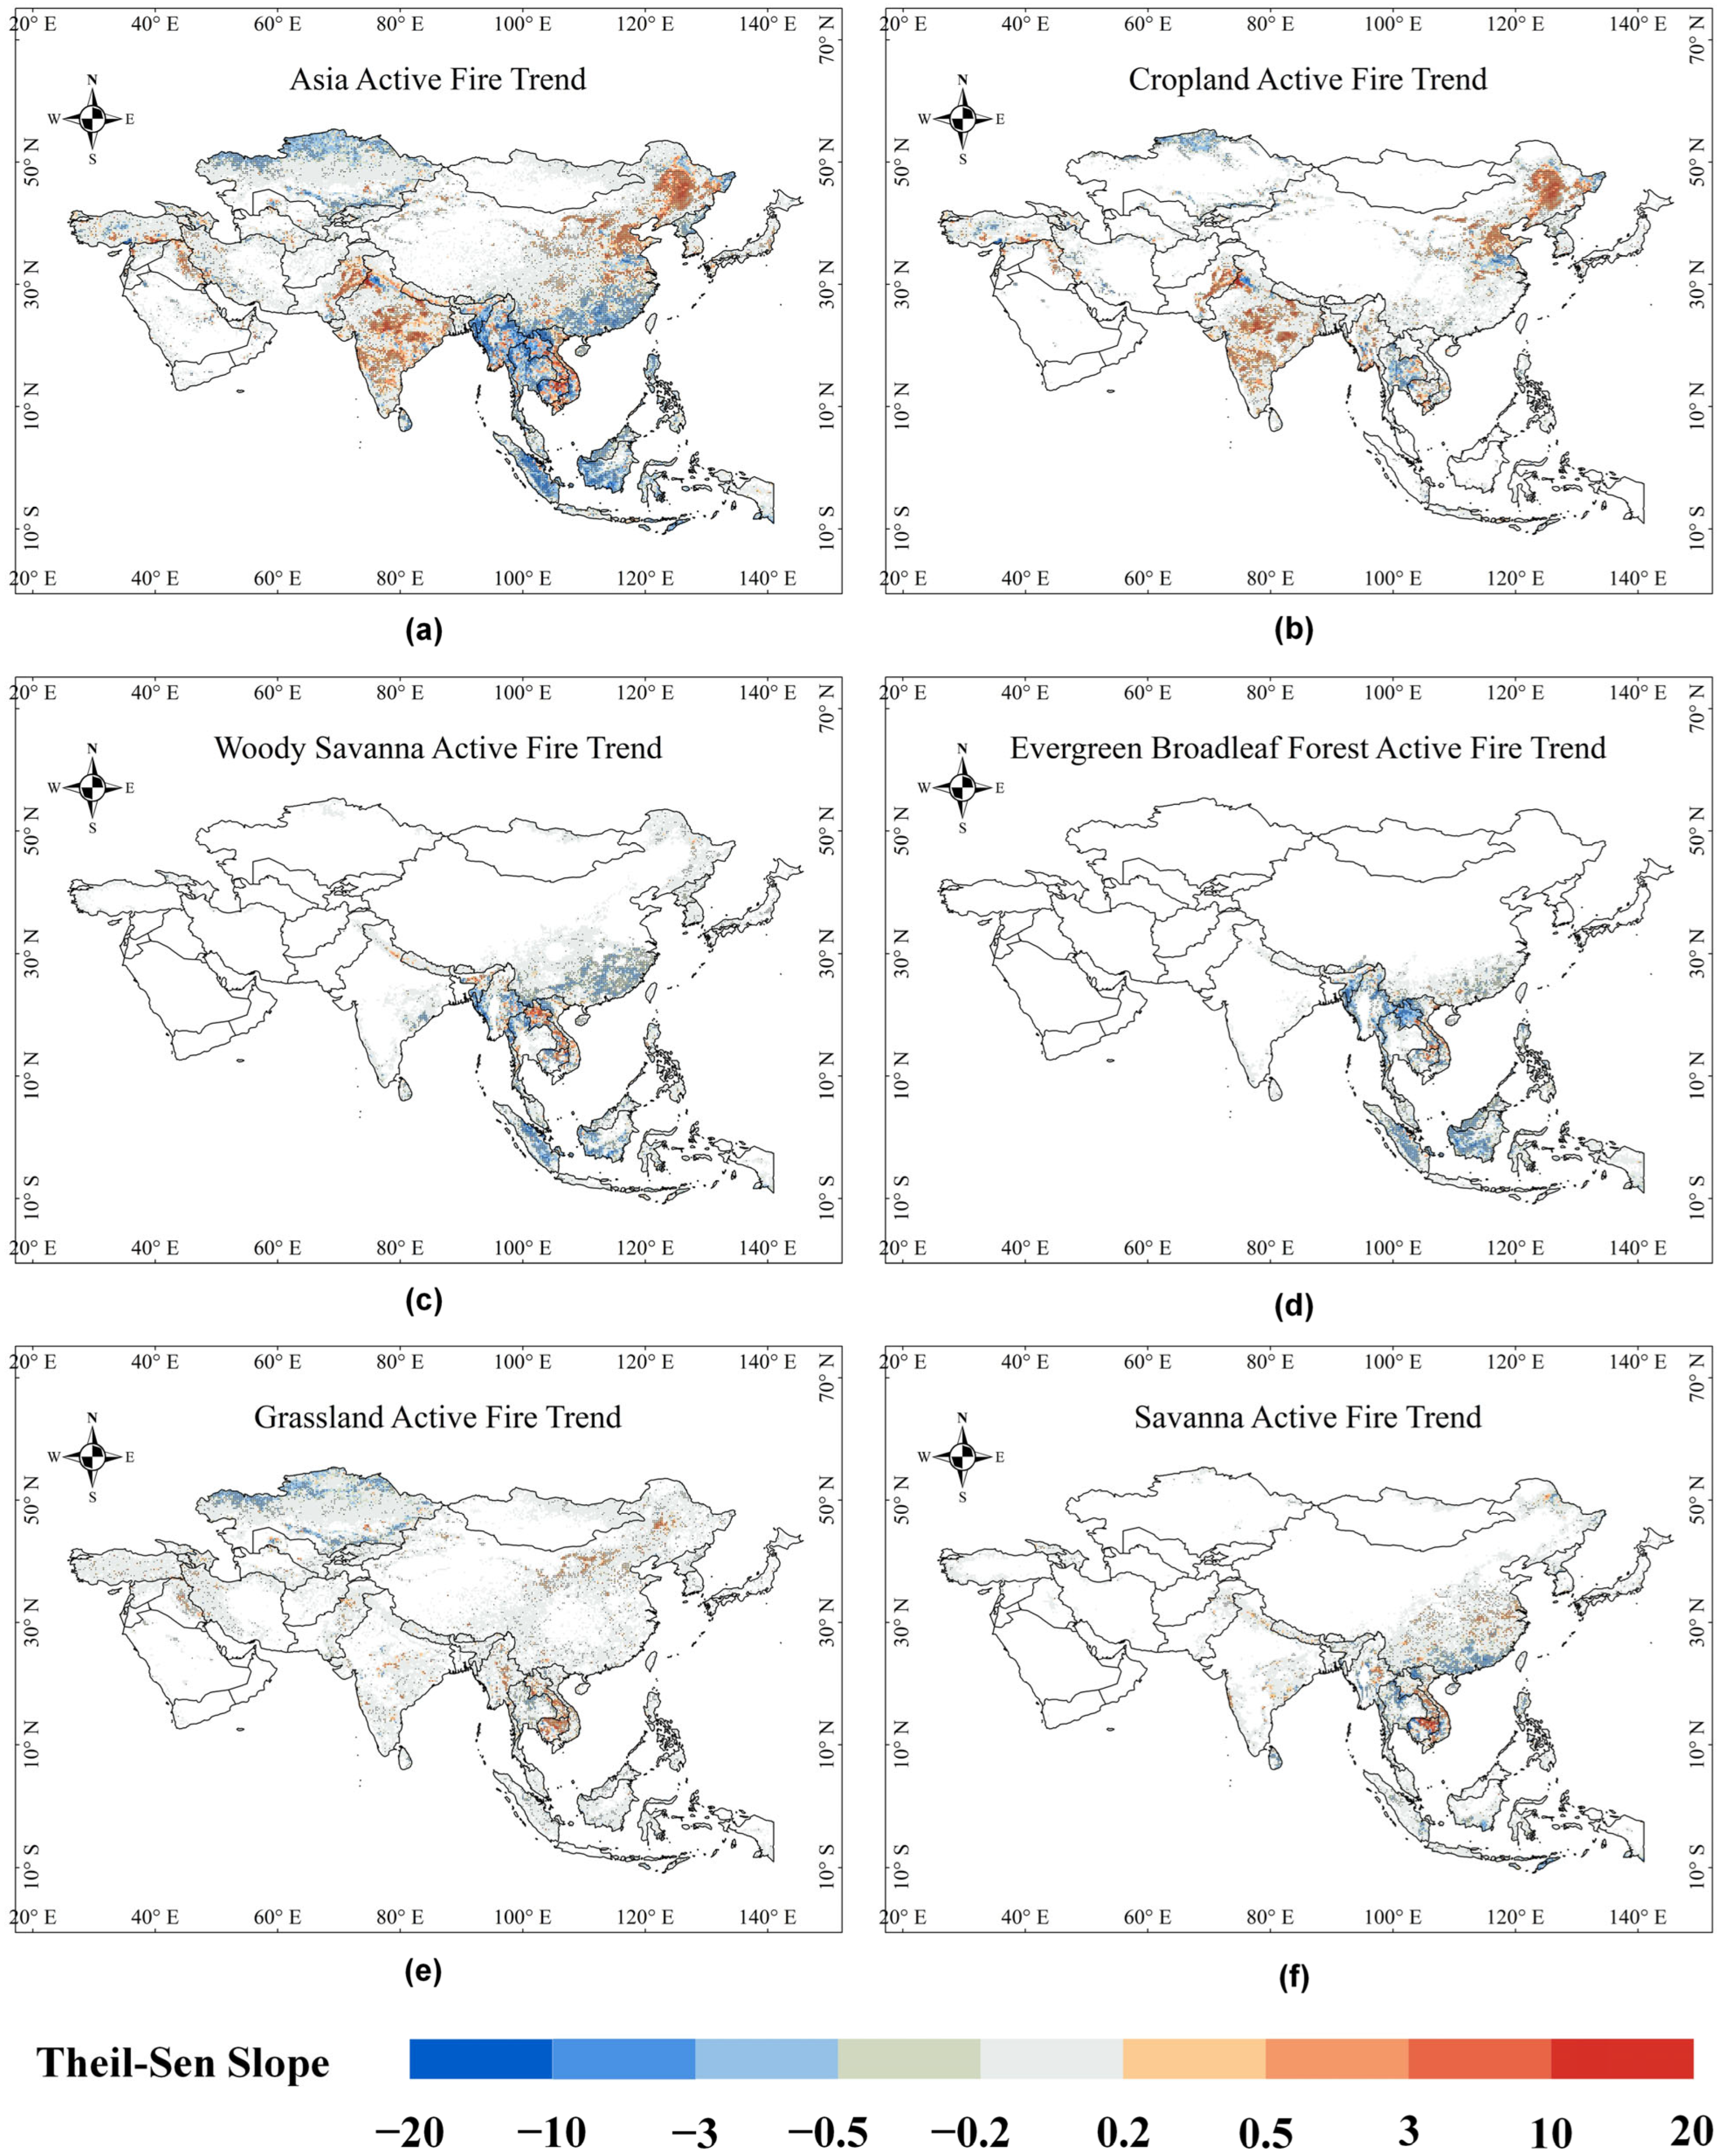
Using the Theil–Sen slope and Mann–Kendall test, the interannual trend in FC for each cell was calculated for the period 2003–2022, to analyze spatial differences in the trends. Figure 7a shows that among all cells with data across Asia, 28.24% exhibit significant trends in FC (marked by black dots), with 19.03% showing a declining trend and 9.21% showing an increasing trend. The slope for all cells with significance is −4057 yr−1, with the average slope per cell being −0.39 yr−1. A comparison between Figure 3 and Figure 7 revealed that regions with frequent fire occurrences also exhibited pronounced interannual variations, which was consistent with previous findings [18].
As illustrated in Figure 7, cropland fires were the only fire type in Asia that exhibited increasing trends. The average slope for cropland cells with significance was 0.29 yr−1, with increasing trends concentrated in cropland regions such as northern India, northern China, and Pakistan. Conversely, cropland fires in Thailand, eastern China, and north of Kazakhstan demonstrate declining trends (Figure 7b). The other four fire types exhibited statistically declining trends, with the decrease in fires in EBF and WS, which are dominated by woody vegetation, being more pronounced than that in savanna and grassland, which are predominantly composed of herbaceous vegetation.
Specifically, the average slopes for significant cells were −0.8 yr−1 for EBF fires and −0.59 yr−1 for WS fires, whereas the average slopes for savanna and grassland fires were −0.21 and −0.04 yr−1, respectively. Significant declines in FC are observed in western Indochina, the Malay Archipelago, southeastern China, and Kazakhstan. In western Indochina and the Malay Archipelago, the decline is driven by reductions in EBF and WS fires. In southeastern China, the decline is attributed to decreases in WS and savanna fires, while in Kazakhstan, it is due to reductions in grassland and cropland fires. Interestingly, in some regions, opposing trends among different fire types are observed. For example, northern Laos shows a decrease in EBF fires alongside an increase in WS fires (Figure 7c,d). Similarly, northern Cambodia exhibits declines in EBF and WS fires but increases in grassland and savanna fires (Figure 7c–f). These opposing trends may indicate transitions among vegetation types, leading to reciprocal changes in fire occurrence.

3.3. Analysis of Fire Driving Factors

3.3.1. Statistical Analysis of Driving Factors

As mentioned in this study, we calculated the SRCCs between FC and eight driving factors in each cell based on interannual data series. The upper portion of Table 2 presents the proportion of cells where each factor was dominant, reflecting the relative strength of their influence on interannual FC variations. The influence of the HFP was found to be the highest across all fire types in Asia, indicating that human activities played a major role in the occurrence of fires. SM was the next most influential factor on a continental scale (15.4%), while in WS, EBF, and grassland fires, SM was the second most influential factor after HFP. Another hydrological factor PPT, in contrast, showed a relatively lower influence (7.67%), possibly because annual PPT affects vegetation flammability less directly than SM does.
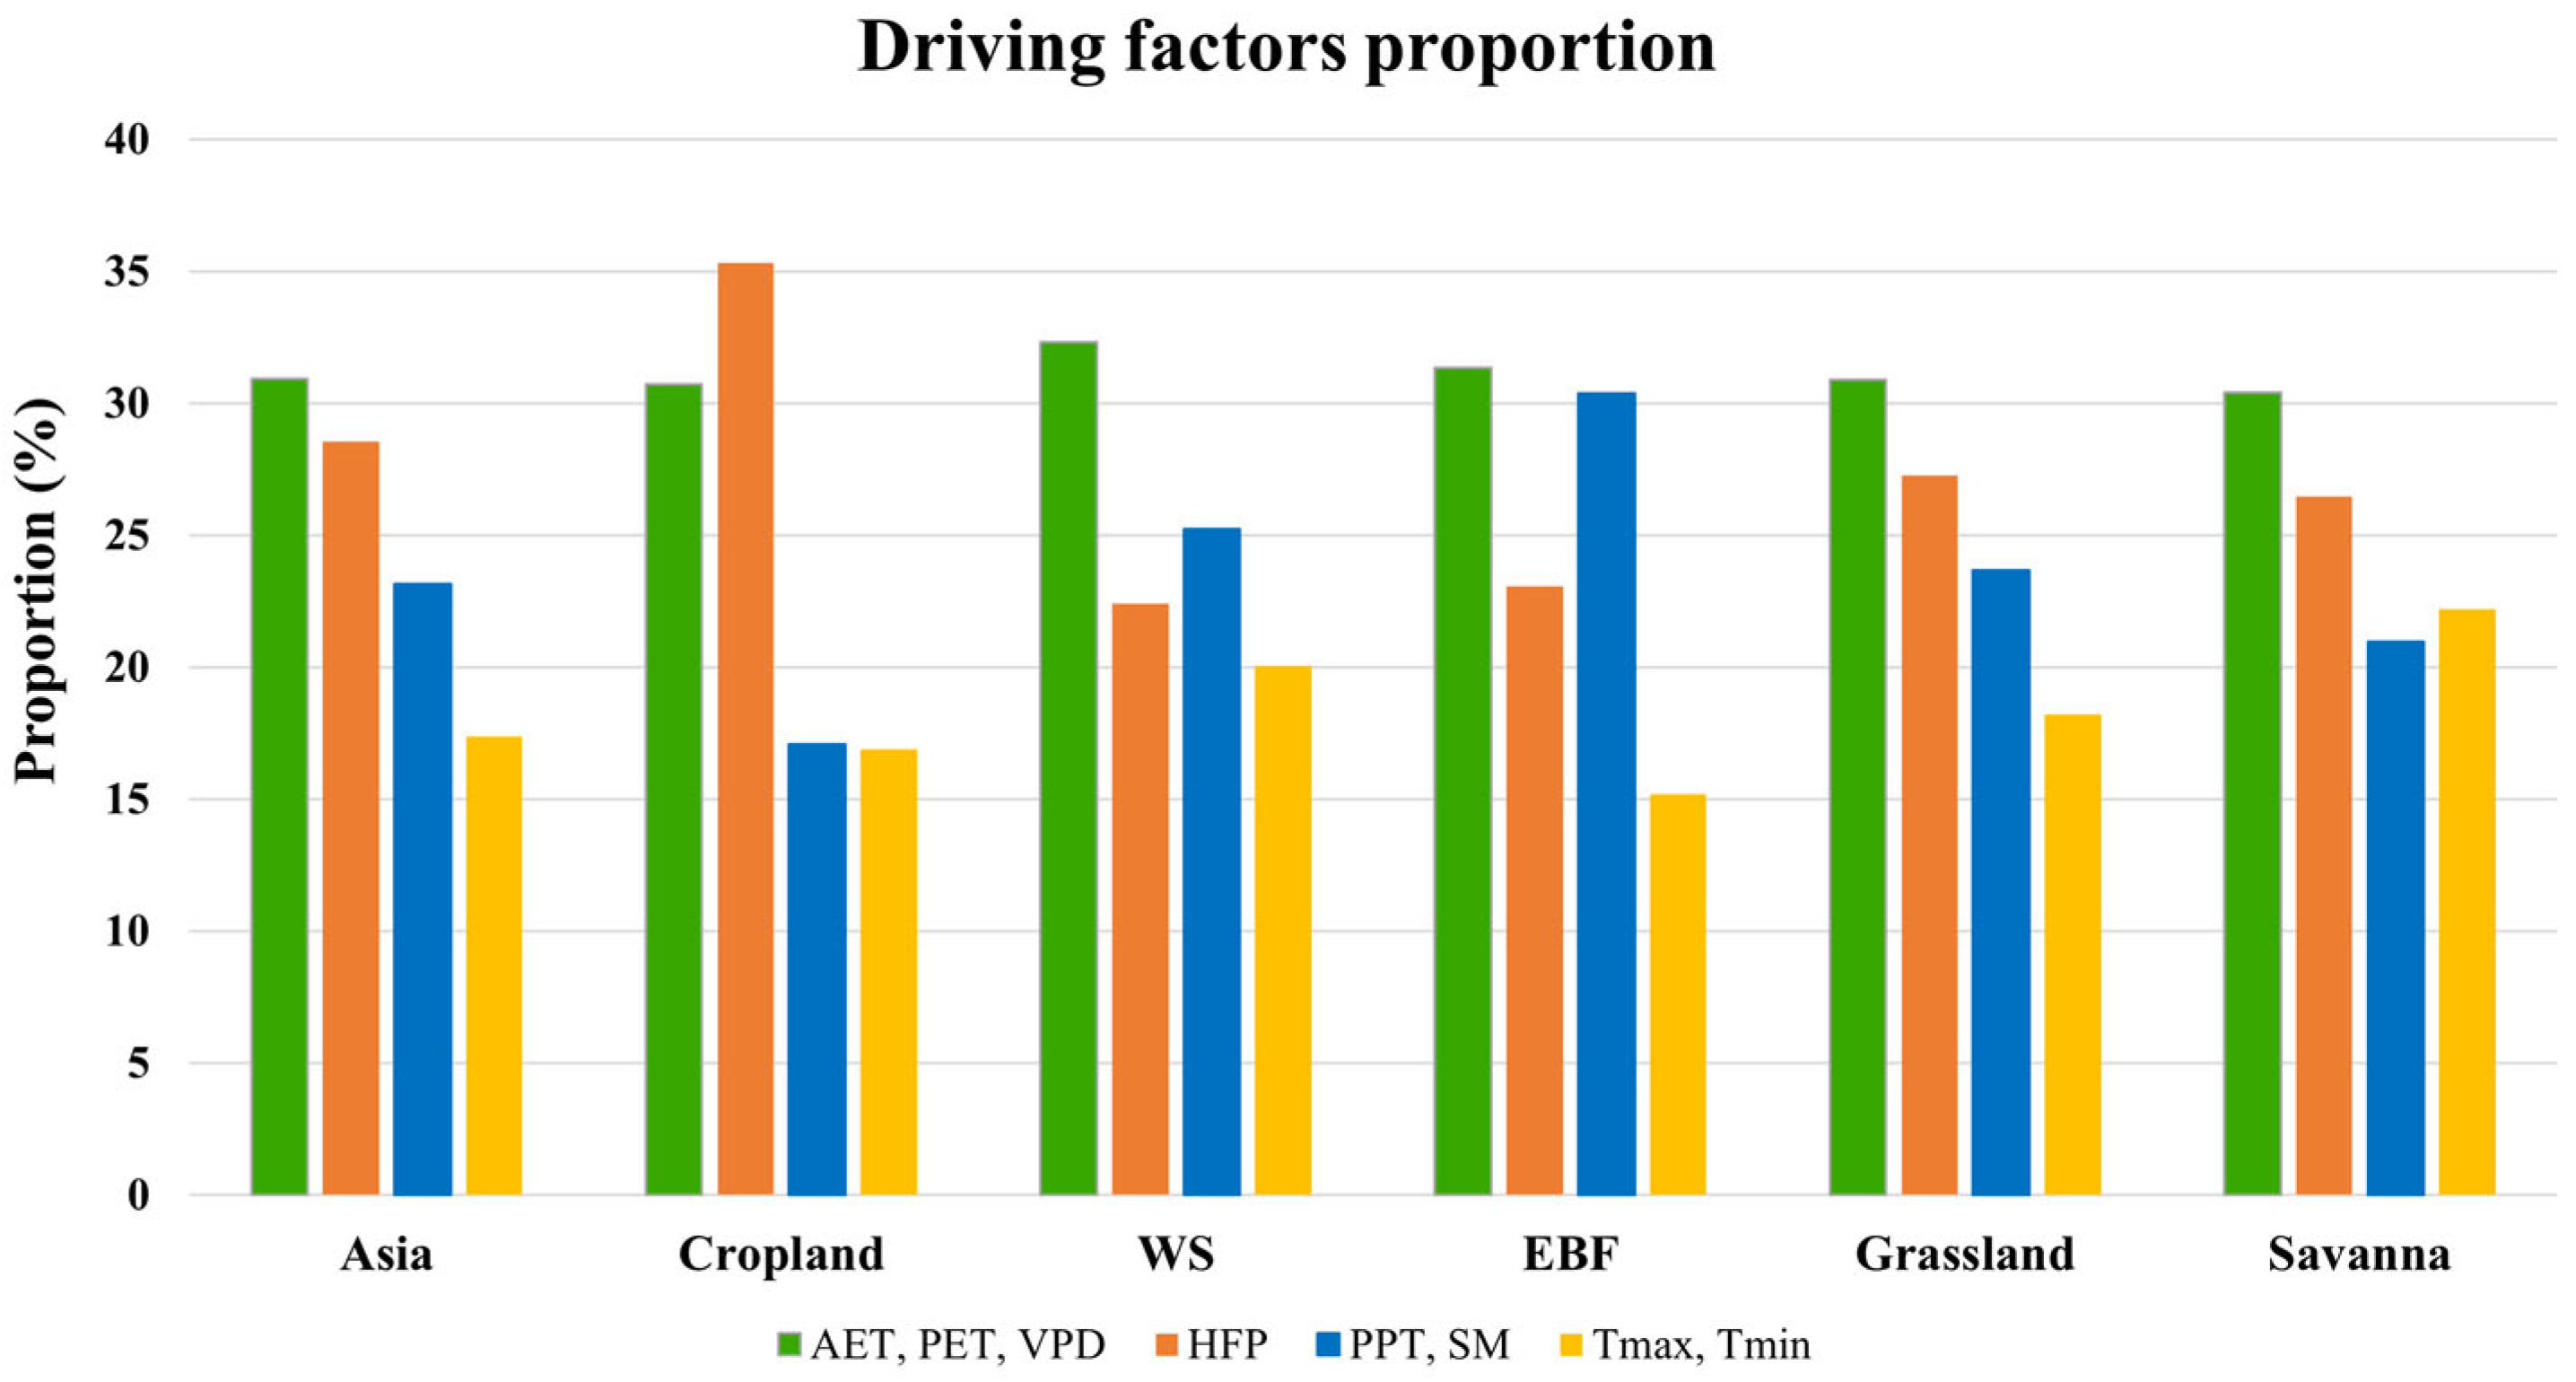
In the lower portion of Table 2, the driving factors were aggregated into four categories according to the variable types described in Section 2.1.4: (i) APV, representing moisture-deficit factors (AET, PET, VPD); (ii) HFP, representing human activity factor; (iii) PS, representing hydrological factors (PPT, SM); and (iv) TMP, representing temperature factors (Tmax, Tmin). Figure 8 presents a statistical chart of the dominant driver proportions in Asia and for the different fire types. The results indicate that APV account for the greatest proportion (30.92%) of influence on a continental scale, and are the dominant driver for all fire types except cropland fires. This highlights that atmospheric evapotranspiration has the strongest influence on Asian fire occurrence probabilities. Attributable to close association with human activities, cropland fires were most strongly influenced by HFP (35.32%). Additionally, HFP is the second most influential factor for grassland and savanna fires, ranked only after APV. PS has a secondary but notable impact on EBF and WS fires, signifying the strong dependence of fire occurrence in these vegetation types on moisture conditions. TMP exhibited the least driving effect on Asian fire occurrences, particularly with respect to Tmax. The statistical results suggest that interannual variations in Asia FC are predominantly driven by hydrometeorological conditions and human activities.

3.3.2. Spatial Distribution of Driving Factors

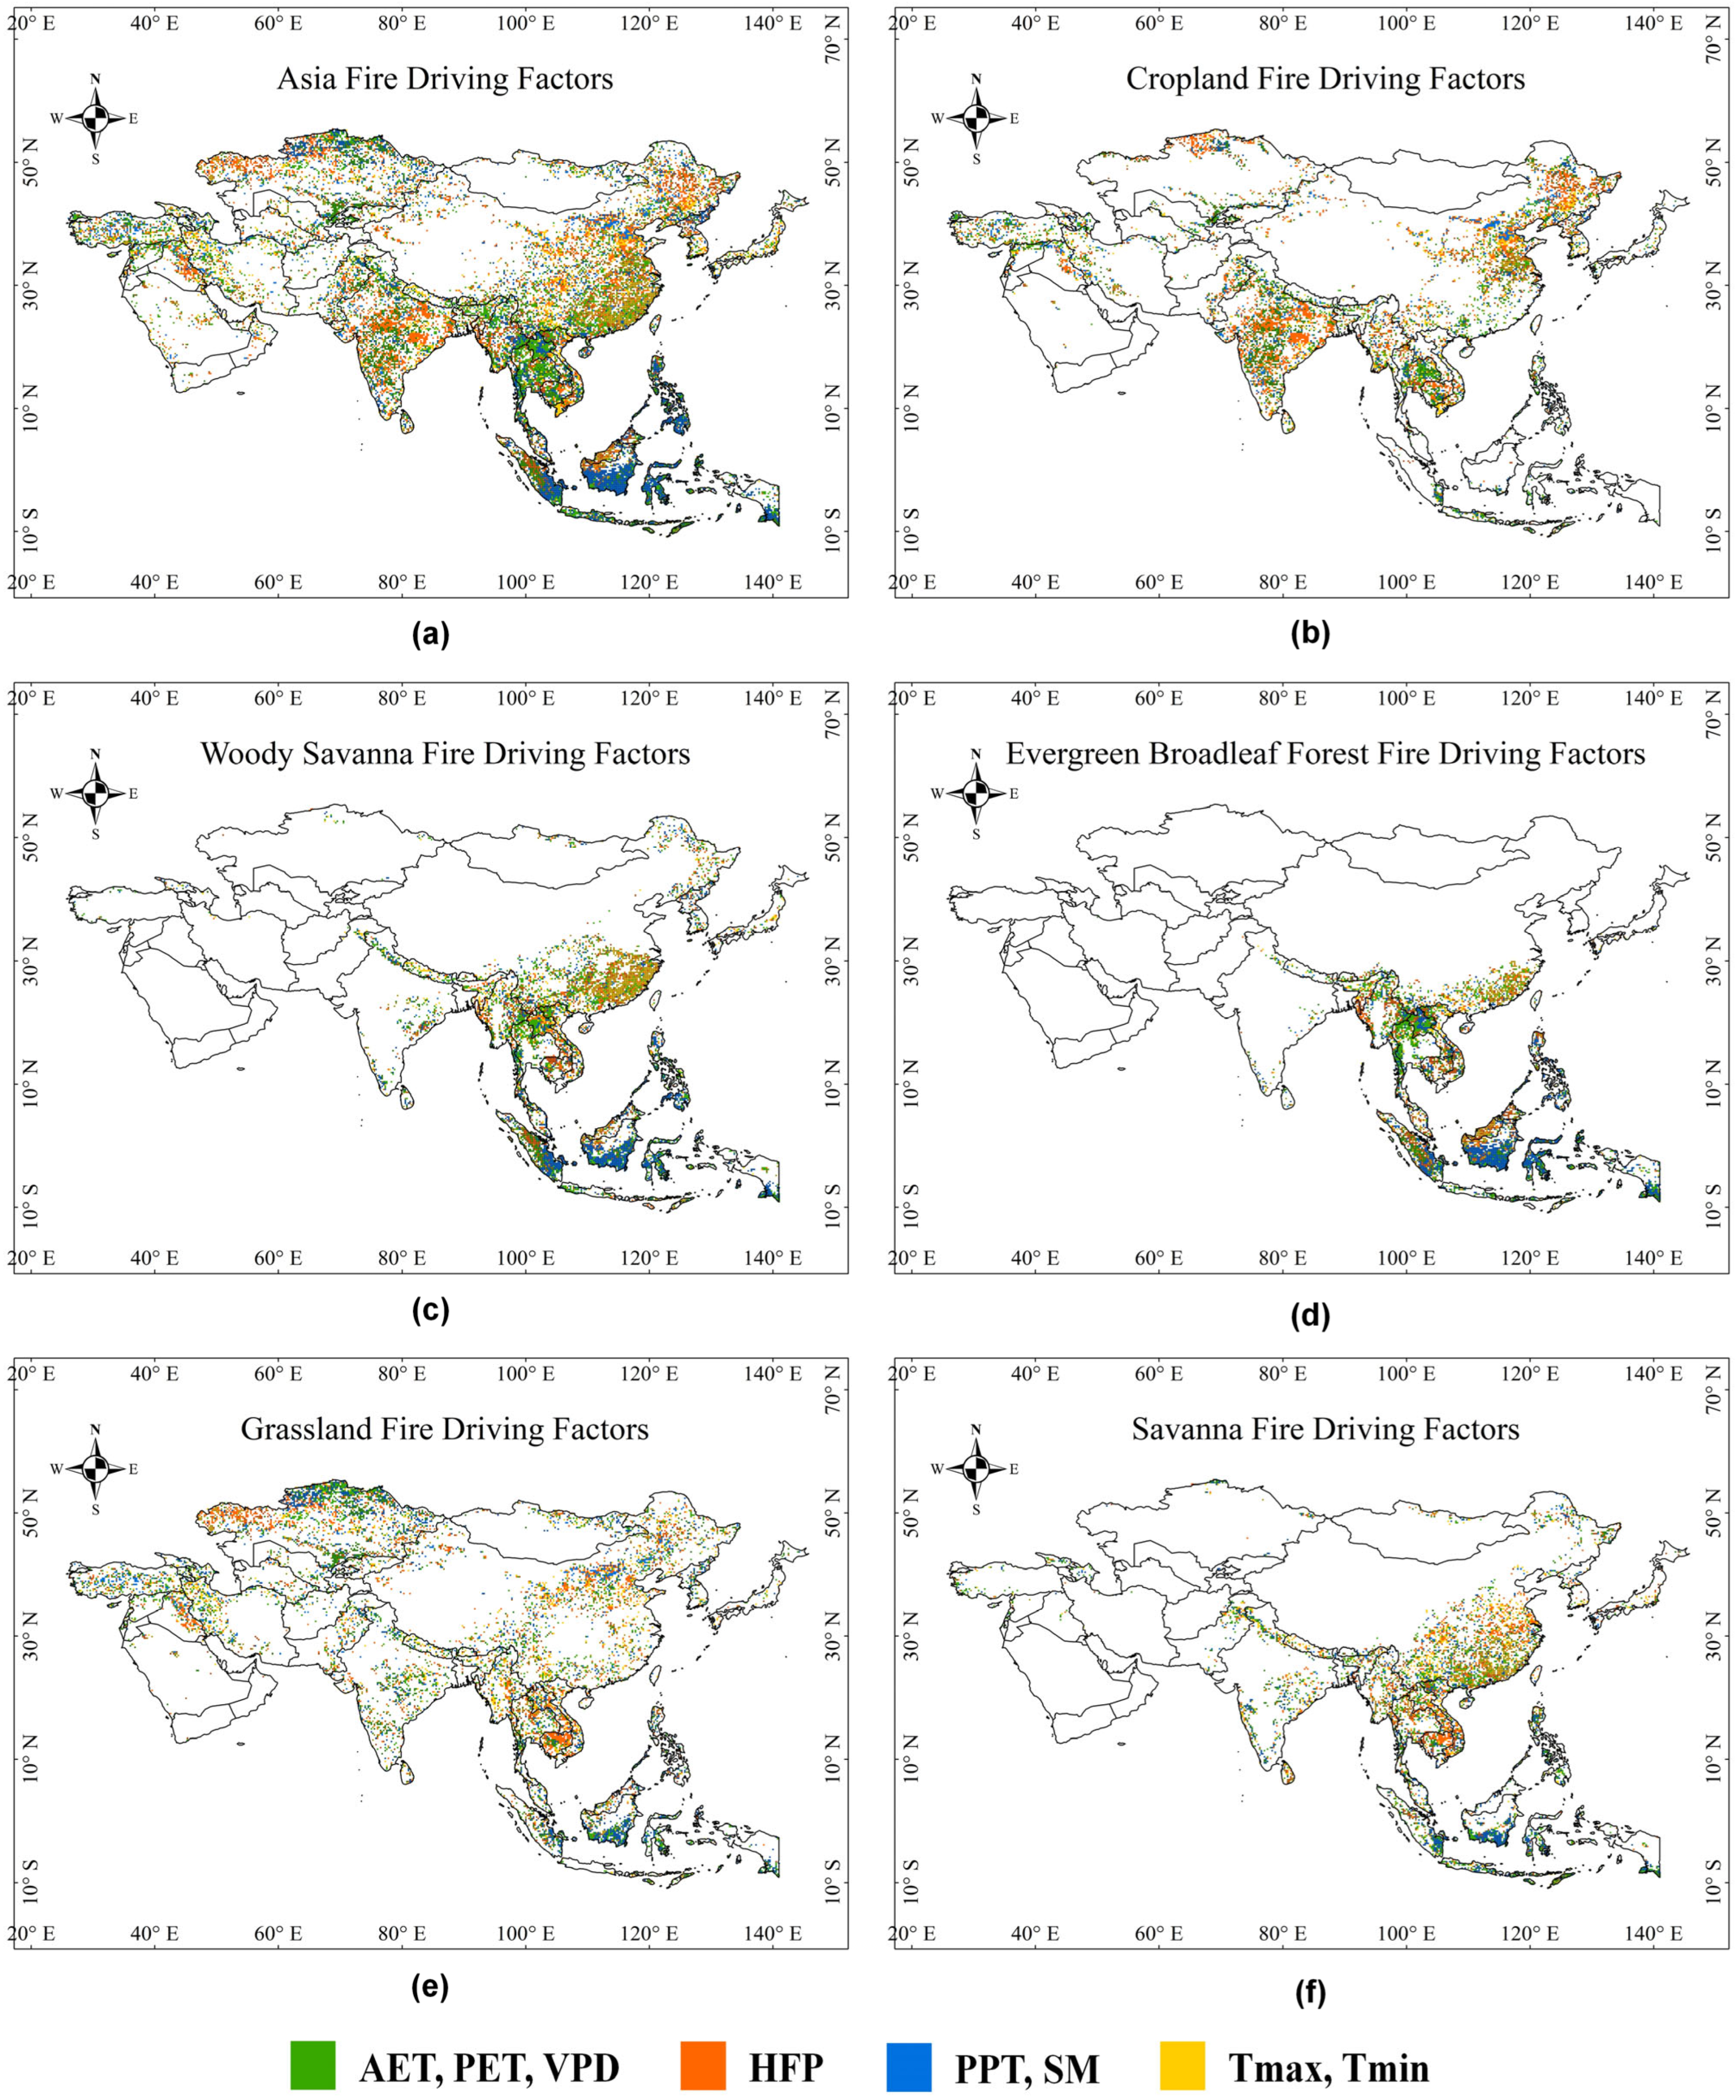
Figure 9 is the spatial distribution of the strongest driving factors for fire occurrences in each cell across Asia, with the results aggregated as described in Section 3.3.1. Black dots indicate cells where the dominant SRCC is negative, while unmarked cells indicate a positive correlation. Figure 9a reveals significant regional characteristics in the dominant drivers of FC variations across Asia. Among these, the spatial clustering of PS is the most pronounced. PS dominates the interannual FC variations in southern Sumatra, southern Kalimantan, Sulawesi, and the Philippine Islands. In these regions, years with reduced PPT and lower SM are associated with higher FC. TMP has the lowest proportion in Asia but dominate in southeastern China, where TMP (primarily Tmin) shows a negative correlation with FC, indicating that fires are more likely to occur in cooler years over there.
APV is the most widespread dominant driver in Asia but exhibits opposite effects in arid and humid regions. In arid regions of Kazakhstan and India, APV is negatively correlated with FC, whereas in humid regions such as Indochina and southeastern China, APV shows a positive correlation. Similarly, the effect of PS on FC also shows contrasting patterns between arid and humid regions: PS is positively correlated with FC in arid northern China and Middle East but negatively correlated in the humid Malay Archipelago and Indochina. The reason for this phenomenon may be related to the availability and flammability of the fuel, and the detailed discussion results are presented in Section 4.3.
In most regions of Asia, human activities exert a positive driving effect on FC, meaning that higher HFP values within a cell are associated with a greater number of fires. This is likely due to intensified human-initiated ignitions, including cropland fires, production-related fires, and wildland fires. However, in WS and EBF fire types (Figure 9c,d), cells dominated by HFP predominantly display negative correlations, supporting the observation that decreases in FC in these regions may be related to reduced forest cover resulting from human activities.

4. Discussion and Limitations

4.1. Spatiotemporal Characteristics of Asian Fires

Asia exhibited significant spatial differences and seasonal distributions of fire during 2003–2022. Spatially, abundant vegetation and high temperatures provided optimal conditions for biomass burning, making humid tropical regions the fire hotspots of Asia, particularly the Indochina and the Malay Archipelago. In forest-cropland interfaces, human activities increased the likelihood of fire occurrences. For instance, Laos recorded significantly higher FC in its northern EBF area, attributed to the traditional slash-and-burn agricultural practices, which often results in uncontrolled fire spreading into forests.
Seasonal analyses revealed that spring (March–May) was the peak season for fires across Asia. During spring, crops in both southern and northern Asia enter the sowing period sequentially. Farmers ignited fires to clear crop residues, resulting in surges in cropland fires. Concurrently, natural vegetations restored growth and elevated combustible fuels, wildland fires thus also reached their annual peaks. The monsoon climate—characterized by the concurrence of rainfall and high temperatures—brought substantial precipitation to Southeast Asia during summer [70], which significantly inhibited the occurrence of fires, making summer the season with the fewest fire events [71]. In autumn and winter (September–February), precipitation decreased markedly, leading to the withering of herbaceous vegetation. Concurrently, lower temperatures and lower dew point resulted in elevated fuel moisture levels in the withered vegetation. This combination of reduced fuel accumulation and suppressed flammability due to high fuel moisture collectively causing the seasonal decline in fire occurrence.
The spatiotemporal distribution of fires in Asia reveals the complex interplay between natural and anthropogenic factors, providing a basis for further understanding of fire dynamics.

4.2. Climate and Human Influences on Asian Fires

Climate change and human activities play key roles in shaping the trends of fire occurrences across Asia. Studies based on climate model-driven predictions of fire patterns indicate that climate change is strongly linked to global fire activity [11,72,73]. The 2015 El Niño event, which led to prolonged reductions in cumulative water balance in tropical regions [74], induced the anomalous peak in Asia FC during 2014–2015. The extreme heat and drought of 2019 resulted in significant fire damages globally, not only triggering unprecedented wildfires in Australia [8] and the Amazon rainforest [75] but also substantially increasing fires in countries such as Indonesia [31], Laos, Myanmar, and China [76], resulting in an abnormal surge in Asia during 2019. In 2023, the latest Intergovernmental Panel on Climate Change (IPCC) Sixth Assessment Report (AR6) explicitly highlighted that the frequency, intensity, and duration of extreme weather events such as heatwaves and droughts have increased significantly [77]. This suggests that anomalous fire events similar to those in 2015 and 2019 are likely to become more frequent in the future, making it urgent to adapt fire management policies to future climate conditions [36].
From 2019 to 2022, the outbreak of COVID-19 likely contributed to the sharp decline in FC [78], as lockdown measures reduced anthropogenic ignitions [79]. The influence of human activities was also reflected in the continued increasing FC in Asia cropland before 2016, which was attributed to the expansion of economic crops. With heightened environmental awareness and the implementation of management policies, cropland fires decreased after 2015.
The BEAST decomposition results of monthly FC further elucidated the responses of fire activity to both climate and human factors. Sharp declines in WS and EBF FC were observed during one year after the cessation of El Niño events, suggesting that intense fires exceed the resilience thresholds of these ecosystems [4]. In contrast, the rates of variations in cropland FC during both the increasing and decreasing phases were relatively gradual, yet the durations of these phases could extend to 6–7 years, reflecting the long-term effects of human intervention. Moreover, A downward trend was almost simultaneously observed in grassland FC with the COVID-19 outbreak, while the decline on Asia FC did not become apparent until about a year later, possibly due to differences in the timing and enforcement of lockdown measures across Asian countries [78].
Spatial analysis of interannual trends revealed that Asia has been generally “calming down” during 2003–2022, with the overall FC trend declining. This trend of change is consistent with the global scale [23], but there are obvious regional specificities. In global tropical regions, human-induced fires driven by agricultural expansion are still very typical in Africa and South America [14], while Southeast Asia FC has occurred significant reductions due to land-use saturation after years of expansion. Driven by economic development, forest areas were converted into economic resources, attributing an obvious decline in EBF and WS fires. For instance, forests in the northern hills of Laos experienced severe deforestation [33], while Cambodia, having undergone extensive forest exploitation over the past two decades, became the country with the highest deforestation rate in Southeast Asia [80]. In our results, fire types in northern Laos shifted from EBF to WS, while those in northern Cambodia gradually transitioned to grassland and savanna fires, both suggesting declines in forest areas. However, Sumatra and Kalimantan also experienced significant deforestation [33], with EBF and WS fires declining, no corresponding rise in other fire types, possibly due to the low population pressures in these regions [81]. Compared to other continents globally, Asia is the only continent where agricultural fires constitute the majority [14], profoundly shaping the overall fire trend. As population growth prompted the expansion of cropland, fires were increasing in most agricultural areas. Nevertheless, the Thai government implemented a series of crop residue management policies [44], thereby reducing the cropland fires; the Chinese government adopted measures such as straw-returning and recycling to replace straw-burning, leading to a sharp decline in cropland fires in eastern China since 2010 [43]. The results indicate that, during 2015–2022, effective agricultural management policies have successfully suppressed the total FC of Asia.
In summary, while extreme climatic conditions could trigger abrupt changes in FC, these shifts were short-lived. In contrast, the human influence on FC was not apparent in the short term, whether positive or negative, but these cumulative effects over several years could eventually produce significant outcomes.

4.3. Analysis of Dominant Fire Driving Factors

Statistical and spatial analysis revealed the impact mechanism of climate variables and human activities on fire dynamics across Asia. Statistically, HFP was found to be the dominant driver of all fire types. The increase in HFP signified higher anthropogenic pressures, usually leading to greater human-initiated ignitions. However, in some WS and EBF fire regions, increasing HFP values caused a decrease in FC. Combined with the discussion in Section 4.2, this further confirmed that in these regions, the reduction in FC was attributable to long-term human logging activities. Additionally, In most areas of the Malay Archipelago, PS significantly influenced the fire occurrences, showing negative effects on FC for natural vegetations. Thus, the increasing PPT or SM might be the reason for distinct FC declines in these areas.
Among all variables, APV exerted the most widespread influence on FC variations in Asia. Meanwhile, hydrometeorological factors (APV and PS) governed over half of Asian fire dynamics by influencing vegetation growth and flammability. However, these factors exhibited contrasting driving patterns in arid and humid regions. In arid regions such as Kazakhstan, India, and northern China, reduced APV or increased PS created conditions conducive to vegetation growth, making them more prone to combustion. In contrast, in humid regions such as Indochina, the Malay Archipelago, and southeastern China, the limiting factor for fire occurrences was not a deficiency of fuel but rather the excessive moisture in the fuel or environment, which reduces flammability. In these regions, fires can only sustain when APV increases or PS reduces.
These driving patterns reflected a shift in the factors limiting fire occurrences from fuel biomass to fuel flammability [37], which implied that the explanation of fire dynamics by driving factors was nonlinear and required consideration of regional attributes. Although these patterns were widely applicable across Asia, an increase in northern Kazakhstan PS corresponded to a decrease in FC. The reason for this anomaly remains unclear, but we hypothesized that it may be related to soil properties [67], as easily saturated soils are not able to completely absorb water, with excess moisture limiting combustion. It is also worth noting that, although PS markedly influenced Asian fire dynamics, the proportion of PPT was far lower than that of SM, possibly because the soil’s water-holding capacity determined the marginal effect of annual precipitation [62].

4.4. Implications for Asian Fire Management

The results indicated that, although the responses of FC to human activities were less immediate than that to extreme climate events, the cumulative impacts of human management over years were significant. The conversion of wildfires into managed burns through deforestation, as well as the success of policy interventions (e.g., burning bans), underscored the importance of long-term management strategies. Positive fire managements were crucial for reducing fire occurrences, but relied heavily on robust policy implementation. The success of straw-burning bans in eastern China and Thailand demonstrates that stringent policies can significantly reduce cropland fires, whereas in India’s Punjab, the persistent crop residue burning was continuing to drive an increasing FC.
Forest protection policies played a critical role in reducing fire occurrences. However, differences in national development levels or environmental awareness create significant disparities in forest protection. In regions where environmental policies were lacking or poorly enforced, fire management remained a substantial challenge, and uncontrolled fires may spread across borders. Future efforts should prioritize regional cooperation and the dissemination of successful management practices to mitigate cross-border fire risks.

4.5. Limitations and Future Outlook

This study utilized MODIS C6.1 active fire product to analyze the spatiotemporal dynamics of Asian fires during 2003–2022, the findings were cross-validated with related studies [14,22,28,37]. However, the coarse resolution of the fire product may neglect multiple adjacent fires or fail to capture small-scale burning activities, resulting in omission errors and affecting the accuracy of the results. Future studies could utilize higher-resolution remote sensing data (e.g., 10/20 m Sentinel or 30 m Landsat) to refine fire detection. Additionally, while long-term time series analyses contributed to understanding the temporal dynamics of Asian fires, the phase-specific variations are also worth exploring (Figure 6). Dividing the long-term period into multiple intervals could provide deeper insights into short-term drivers of fire changes and reveal shifts in driving mechanisms.
We also analyzed the driving mechanisms of meteorological and human factors on Asian fires. However, due to the uncertain quantitative relationships between the drivers and fires, the prediction of fire activity remains challenging. Based on the driving mechanisms concluded in this study, future works could employ structural equation models or machine learning approaches to investigate the causal relationships between fires and multiple drivers quantitatively.

5. Conclusions

This study represents the first systematic investigation of Asia’s five major fire types over the 20-year period (2003–2022), revealing the continent’s long-term spatiotemporal dynamics and dissecting the synergistic driving mechanisms of climatic and anthropogenic factors. Methodologically, the innovative integration of BEAST time series decomposition, 0.25°-resolution trend analysis, and spatially explicit driver attribution establishes a comprehensive framework for understanding complex fire-climate-human interactions. Through time series decomposition, we demonstrate that extreme weather events exert intense but short-lived influences on fire activity, whereas the long-term human impacts could accumulate. Trend analysis indicates that climate change combined with deforestation has led to a marked decline in woody vegetation fires in Southeast Asia. Quantitative assessment of driving effects shows that hydrometeorological drivers exhibit nonlinear relationships with FC—displaying opposite patterns in arid versus humid regions—while human activity correlates positively with FC in most areas. Cross-regional analysis underscores the importance of stringent management measures and international collaboration. These findings deepen our understanding of how natural and human factors jointly regulate Asian fire regimes and support the development or refinement of region-specific management policies. The principal conclusions are as follows:
  • The spatiotemporal distribution of FC in Asia exhibits significant regional and seasonal characteristics. Southeast Asia is identified as an Asian fire hotspot, attributed to high temperature, abundant vegetation, and slash-and-burn agriculture. Spring is the primary burning season, induced by vegetation growth and human ignitions. As the most prevalent fire type, cropland fires predominantly occur in spring and autumn, which are the key straw-burning periods. Natural vegetation fires display regular seasonal patterns induced by changes in biomass and moisture dynamics, governed primarily by temperature and precipitation.
  • The overall trend of Asian FC is declining over the 20-year period, with an average slope of −8716.2 yr−1. Temporally, the decomposition results indicate that the influence of extreme climate events is intense but short-lived, whereas the impacts of long-term human activities could accumulate. Spatially, higher fire frequency regions exhibit more significant change trends. In conjunction with the forest management history, the decline of woody vegetation fires in Southeast Asia is partly attributed to human deforestation. Cropland fires are the only type shown an increase, particularly in India and northern China, implying the expansion of straw-burning practices. Meanwhile, strict burning bans have successfully reduced cropland fires in regions like eastern China and Thailand.
  • The APV is the primary driver of interannual Asian FC variation, followed by HFP. The driving effects of hydrometeorological factors are worth noting: In arid regions, moisture deficit relief tends to promote vegetation growth, providing more fuel for fire occurrences; in humid regions, excessive moisture hinders combustion, and when moisture decreases, fire events will increase. Notably, PPT contributes much less than SM, suggesting that soil moisture storage is more critical in influencing fire occurrences. HFP usually contributes to the fire increase in most areas, but its increase reduced EBF and WS fire in some regions, reflecting the dual role of human intervention.
  • In summary, Asian fire regimes are jointly governed by climate and human management. Climatic influences exhibit periodicity, while human impacts are cumulative and multifaceted. The nonlinear nature of these regimes is mediated by regional and soil-related conditions. This research underscores the need for tailored fire management strategies that prioritize region, vegetation, and season. The findings provide a scientific basis for understanding fire variability and can inform regional fire management and climate adaptation policies in Asia.

Author Contributions

All of the authors made significant contributions to the manuscript. Conceptualization, Xu Gao; methodology, Xu Gao; software, Xu Gao; validation, Xu Gao and Wenzhong Shi; formal analysis, Xu Gao and Min Zhang; investigation, Xu Gao; resources, Xu Gao; data curation, Xu Gao; writing—original draft preparation, Xu Gao; writing—review and editing, Wenzhong Shi and Min Zhang; visualization, Xu Gao; supervision, Wenzhong Shi; project administration, Wenzhong Shi; funding acquisition, Wenzhong Shi and Min Zhang. All authors have read and agreed to the published version of the manuscripts.

Funding

This research was jointly funded by Shenzhen Park of Hetao Shenzhen-Hong Kong Science and Technology Innovation Cooperation Zone (Theories for Spatiotemporal Intelligence and Reliable Data Analysis, Project ID: HZOSWS-KCCYB-2024058); Otto Poon Charitable Foundation Smart Cities Research Institute, the Hong Kong Polytechnic University (Work Program: CD06); The Hong Kong Polytechnic University (U-ZECR).

Data Availability Statement

The original contributions presented in this study are included in the article. Further inquiries can be directed to the corresponding author.

Acknowledgments

The authors express their sincere gratitude to the academic editors and reviewers for their valuable comments and constructive suggestions.

Conflicts of Interest

The authors declare no conflicts of interest.

Abbreviations

The following abbreviations are used in this manuscript:
FCFire counts
HFPHuman Footprint
AETActual evapotranspiration
PETPotential evapotranspiration
VPDVapor pressure deficit
PPTPrecipitation
SMSoil moisture
TmaxMaximum temperature
TminMinimum temperature
BEASTBayesian Estimator of Abrupt change, Seasonal change, and Trend
SRCCSpearman’s rank correlation coefficients
WSWoody savanna
EBFEvergreen broadleaf forest
APVAET, PET and VPD
PSPPT and SM
TMPTmax and Tmin

References

  1. Byrne, B.; Liu, J.; Bowman, K.W.; Pascolini-Campbell, M.; Chatterjee, A.; Pandey, S.; Miyazaki, K.; van der Werf, G.R.; Wunch, D.; Wennberg, P.O.; et al. Carbon emissions from the 2023 Canadian wildfires. Nature 2024, 633, 835–839. [Google Scholar] [CrossRef]
  2. Xia, L.; Ren, C.; Yang, Y.; Li, J.; Fan, W.; Liu, R. Unravelling spatiotemporal heterogeneity of wildfire carbon dioxide emissions in Southeast Asia: Based on a high-resolution inventory. J. Environ. Manag. 2025, 385, 125634. [Google Scholar] [CrossRef]
  3. Pellegrini, A.F.A.; Ahlstrom, A.; Hobbie, S.E.; Reich, P.B.; Nieradzik, L.P.; Staver, A.C.; Scharenbroch, B.C.; Jumpponen, A.; Anderegg, W.R.L.; Randerson, J.T.; et al. Fire frequency drives decadal changes in soil carbon and nitrogen and ecosystem productivity. Nature 2018, 553, 194–198. [Google Scholar] [CrossRef]
  4. Hudiburg, T.; Mathias, J.; Bartowitz, K.; Berardi, D.M.; Bryant, K.; Graham, E.; Kolden, C.A.; Betts, R.A.; Lynch, L. Terrestrial carbon dynamics in an era of increasing wildfire. Nat. Clim. Change 2023, 13, 1306–1316. [Google Scholar] [CrossRef]
  5. Liu, Z.; Ballantyne, A.P.; Cooper, L.A. Biophysical feedback of global forest fires on surface temperature. Nat. Commun. 2019, 10, 214. [Google Scholar] [CrossRef]
  6. Chen, G.; Qiu, M.; Wang, P.; Zhang, Y.; Shindell, D.; Zhang, H. Continuous wildfires threaten public and ecosystem health under climate change across continents. Front. Environ. Sci. Eng. 2024, 18, 130. [Google Scholar] [CrossRef]
  7. Senande-Rivera, M.; Insua-Costa, D.; Miguez-Macho, G. Climate change aggravated wildfire behaviour in the Iberian Peninsula in recent years. Npj Clim. Atmos. Sci. 2025, 8, 19. [Google Scholar] [CrossRef]
  8. Driscoll, D.A.; Macdonald, K.J.; Gibson, R.K.; Doherty, T.S.; Nimmo, D.G.; Nolan, R.H.; Ritchie, E.G.; Williamson, G.J.; Heard, G.W.; Tasker, E.M.; et al. Biodiversity impacts of the 2019–2020 Australian megafires. Nature 2024, 635, 898–905. [Google Scholar] [CrossRef]
  9. Altman, J.; Fibich, P.; Trotsiuk, V.; Altmanova, N. Global pattern of forest disturbances and its shift under climate change. Sci. Total Environ. 2024, 915, 170117. [Google Scholar] [CrossRef]
  10. Qin, Y.; Xiao, X.; Wigneron, J.-P.; Ciais, P.; Canadell, J.G.; Brandt, M.; Li, X.; Fan, L.; Wu, X.; Tang, H.; et al. Large loss and rapid recovery of vegetation cover and aboveground biomass over forest areas in Australia during 2019–2020. Remote Sens. Environ. 2022, 278, 113087. [Google Scholar] [CrossRef]
  11. Senande-Rivera, M.; Insua-Costa, D.; Miguez-Macho, G. Spatial and temporal expansion of global wildland fire activity in response to climate change. Nat. Commun. 2022, 13, 1208. [Google Scholar] [CrossRef]
  12. Abatzoglou, J.T.; Kolden, C.A.; Cullen, A.C.; Sadegh, M.; Williams, E.L.; Turco, M.; Jones, M.W. Climate change has increased the odds of extreme regional forest fire years globally. Nat. Commun. 2025, 16, 6390. [Google Scholar] [CrossRef]
  13. Tang, R.; Mao, J.; Jin, M.; Chen, A.; Yu, Y.; Shi, X.; Zhang, Y.; Hoffman, F.M.; Xu, M.; Wang, Y. Interannual variability and climatic sensitivity of global wildfire activity. Adv. Clim. Change Res. 2021, 12, 686–695. [Google Scholar] [CrossRef]
  14. Xiang, M.; Xiao, C.; Feng, Z.; Ma, Q. Global distribution, trends and types of active fire occurrences. Sci. Total Environ. 2023, 902, 166456. [Google Scholar] [CrossRef]
  15. Zhang, G.; Wang, M.; Liu, K. Deep neural networks for global wildfire susceptibility modelling. Ecol. Indic. 2021, 127, 107735. [Google Scholar] [CrossRef]
  16. Rodrigues, M.; Camprubi, A.C.; Balaguer-Romano, R.; Coco Megia, C.J.; Castanares, F.; Ruffault, J.; Fernandes, P.M.; de Dios, V.R. Drivers and implications of the extreme 2022 wildfire season in Southwest Europe. Sci. Total Environ. 2022, 859, 160320. [Google Scholar] [CrossRef]
  17. Jain, P.; Barber, Q.E.; Taylor, S.W.; Whitman, E.; Castellanos Acuna, D.; Boulanger, Y.; Chavardes, R.D.; Chen, J.; Englefield, P.; Flannigan, M.; et al. Drivers and Impacts of the Record-Breaking 2023 Wildfire Season in Canada. Nat. Commun. 2024, 15, 6764. [Google Scholar] [CrossRef]
  18. Kganyago, M.; Shikwambana, L. Assessment of the Characteristics of Recent Major Wildfires in the USA, Australia and Brazil in 2018–2019 Using Multi-Source Satellite Products. Remote Sens. 2020, 12, 1803. [Google Scholar] [CrossRef]
  19. Hantson, S.; Andela, N.; Goulden, M.L.; Randerson, J.T. Human-ignited fires result in more extreme fire behavior and ecosystem impacts. Nat. Commun. 2022, 13, 2717. [Google Scholar] [CrossRef]
  20. Jones, M.W.; Abatzoglou, J.T.; Veraverbeke, S.; Andela, N.; Lasslop, G.; Forkel, M.; Smith, A.J.P.; Burton, C.; Betts, R.A.; van der Werf, G.R.; et al. Global and Regional Trends and Drivers of Fire Under Climate Change. Rev. Geophys. 2022, 60, e2020RG000726. [Google Scholar] [CrossRef]
  21. Abram, N.J.; Henley, B.J.; Sen Gupta, A.; Lippmann, T.J.R.; Clarke, H.; Dowdy, A.J.; Sharples, J.J.; Nolan, R.H.; Zhang, T.; Wooster, M.J.; et al. Connections of climate change and variability to large and extreme forest fires in southeast Australia. Commun. Earth Environ. 2021, 2, 8. [Google Scholar] [CrossRef]
  22. Earl, N.; Simmonds, I. Spatial and Temporal Variability and Trends in 2001–2016 Global Fire Activity. J. Geophys. Res. Atmos. 2018, 123, 2524–2536. [Google Scholar] [CrossRef]
  23. Teymoor Seydi, S.; Abatzoglou, J.T.; Jones, M.W.; Kolden, C.A.; Filippelli, G.; Hurteau, M.D.; AghaKouchak, A.; Luce, C.H.; Miao, C.; Sadegh, M. Increasing global human exposure to wildland fires despite declining burned area. Science 2025, 389, 826–829. [Google Scholar] [CrossRef]
  24. Wang, X.; Swystun, T.; Flannigan, M.D. Future wildfire extent and frequency determined by the longest fire-conducive weather spell. Sci. Total Environ. 2022, 830, 154752. [Google Scholar] [CrossRef]
  25. Han, D.; Guo, Y.; Wang, J.; Zhao, B. Global disparities in indoor wildfire-PM2.5 exposure and mitigation costs. Sci. Adv. 2025, 11, eads4360. [Google Scholar] [CrossRef]
  26. Zhao, J.; Yue, C.; Wang, J.; Hantson, S.; Wang, X.; He, B.; Li, G.; Wang, L.; Zhao, H.; Luyssaert, S. Forest fire size amplifies postfire land surface warming. Nature 2024, 633, 828–834. [Google Scholar] [CrossRef]
  27. Cunningham, C.X.; Williamson, G.J.; Bowman, D.M.J.S. Increasing frequency and intensity of the most extreme wildfires on Earth. Nat. Ecol. Evol. 2024, 8, 1420–1425. [Google Scholar] [CrossRef]
  28. Pan, Y.; Yang, J.; Chen, D.; Zhu, T.; Bao, Q.; Mahmoudi, P. Skillful seasonal prediction of summer wildfires over Central Asia. Glob. Planet. Change 2023, 221, 104043. [Google Scholar] [CrossRef]
  29. Wei, X.; Wang, G.; Chen, T.; Hagan, D.F.T.; Ullah, W. A Spatio-Temporal Analysis of Active Fires over China during 2003–2016. Remote Sens. 2020, 12, 1787. [Google Scholar] [CrossRef]
  30. Lian, C.; Xiao, C.; Feng, Z. Spatiotemporal Characteristics and Regional Variations of Active Fires in China since 2001. Remote Sens. 2022, 15, 54. [Google Scholar] [CrossRef]
  31. Grosvenor, M.J.; Ardiyani, V.; Wooster, M.J.; Gillott, S.; Green, D.C.; Lestari, P.; Suri, W. Catastrophic impact of extreme 2019 Indonesian peatland fires on urban air quality and health. Commun. Earth Environ. 2024, 5, 649. [Google Scholar] [CrossRef]
  32. Xiang, M.; Xiao, C. The neglected disproportionate contributions of active fires in greenhouse gas emissions globally. Resour. Environ. Sustain. 2025, 19, 100190. [Google Scholar] [CrossRef]
  33. Zeng, Z.; Estes, L.; Ziegler, A.D.; Chen, A.; Searchinger, T.; Hua, F.; Guan, K.; Jintrawet, A.; Wood, E.F. Highland cropland expansion and forest loss in Southeast Asia in the twenty-first century. Nat. Geosci. 2018, 11, 556–562. [Google Scholar] [CrossRef]
  34. Trang, P.T.; Andrew, M.E.; Chu, T.; Enright, N.J. Forest fire and its key drivers in the tropical forests of northern Vietnam. Int. J. Wildland Fire 2022, 31, 213–229. [Google Scholar] [CrossRef]
  35. Xiong, Q.; Luo, X.; Liang, P.; Xiao, Y.; Xiao, Q.; Sun, H.; Pan, K.; Wang, L.; Li, L.; Pang, X. Fire from policy, human interventions, or biophysical factors? Temporal–spatial patterns of forest fire in southwestern China. For. Ecol. Manag. 2020, 474, 118381. [Google Scholar] [CrossRef]
  36. Burton, C.; Lampe, S.; Kelley, D.I.; Thiery, W.; Hantson, S.; Christidis, N.; Gudmundsson, L.; Forrest, M.; Burke, E.; Chang, J.; et al. Global burned area increasingly explained by climate change. Nat. Clim. Change 2024, 14, 1186–1192. [Google Scholar] [CrossRef]
  37. Chuvieco, E.; Pettinari, M.L.; Koutsias, N.; Forkel, M.; Hantson, S.; Turco, M. Human and climate drivers of global biomass burning variability. Sci. Total Environ. 2021, 779, 146361. [Google Scholar] [CrossRef]
  38. Xu, Y.; Lin, Z.; Wu, C. Spatiotemporal Variation of the Burned Area and Its Relationship with Climatic Factors in Central Kazakhstan. Remote Sens. 2021, 13, 313. [Google Scholar] [CrossRef]
  39. Pan, J.; Wu, X.; Zhou, L.; Wei, S. Spatial and Temporal Distribution Characteristics of Active Fires in China Using Remotely Sensed Data. Fire 2022, 5, 200. [Google Scholar] [CrossRef]
  40. Wang, W.; Zhao, F.; Wang, Y.; Huang, X.; Ye, J. Seasonal differences in the spatial patterns of wildfire drivers and susceptibility in the southwest mountains of China. Sci. Total Environ. 2023, 869, 161782. [Google Scholar] [CrossRef]
  41. Vadrevu, K.P.; Lasko, K.; Giglio, L.; Schroeder, W.; Biswas, S.; Justice, C. Trends in Vegetation fires in South and Southeast Asian Countries. Sci. Rep. 2019, 9, 7422. [Google Scholar] [CrossRef]
  42. Resco de Dios, V.; Cunill Camprubi, A.; He, Y.; Han, Y.; Yao, Y. North-south antiphase of wildfire activity across the pyroregions of continental China driven by NAO and the Antarctic oscillation. Sci. Total Environ. 2022, 859, 160386. [Google Scholar] [CrossRef]
  43. Yin, S.; Guo, M.; Wang, X.; Yamamoto, H.; Ou, W. Spatiotemporal variation and distribution characteristics of crop residue burning in China from 2001 to 2018. Environ. Pollut. 2021, 268, 115849. [Google Scholar] [CrossRef]
  44. Kumar, I.; Bandaru, V.; Yampracha, S.; Sun, L.; Fungtammasan, B. Limiting rice and sugarcane residue burning in Thailand: Current status, challenges and strategies. J. Environ. Manag. 2020, 276, 111228. [Google Scholar] [CrossRef] [PubMed]
  45. Meier, S.; Strobl, E.; Elliott, R.J.R.; Kettridge, N. Cross-country risk quantification of extreme wildfires in Mediterranean Europe. Risk Anal. 2022, 43, 1745–1762. [Google Scholar] [CrossRef]
  46. Chen, Y.; Morton, D.C.; Randerson, J.T. Remote sensing for wildfire monitoring: Insights into burned area, emissions, and fire dynamics. One Earth 2024, 7, 1022–1028. [Google Scholar] [CrossRef]
  47. Li, X.; Li, J.; Haghani, M. Application of Remote Sensing Technology in Wildfire Research: Bibliometric Perspective. Fire Technol. 2024, 60, 579–616. [Google Scholar] [CrossRef]
  48. Wooster, M.J.; Roberts, G.J.; Giglio, L.; Roy, D.P.; Freeborn, P.H.; Boschetti, L.; Justice, C.; Ichoku, C.; Schroeder, W.; Davies, D.; et al. Satellite remote sensing of active fires: History and current status, applications and future requirements. Remote Sens. Environ. 2021, 267, 112694. [Google Scholar] [CrossRef]
  49. Mishra, M.; Guria, R.; Baraj, B.; Nanda, A.P.; Santos, C.A.G.; Silva, R.M.d.; Laksono, F.X.A.T. Spatial analysis and machine learning prediction of forest fire susceptibility: A comprehensive approach for effective management and mitigation. Sci. Total Environ. 2024, 926, 171713. [Google Scholar] [CrossRef] [PubMed]
  50. Yang, Y.; Xiao, P.; Feng, X.; Li, H. Accuracy assessment of seven global land cover datasets over China. ISPRS J. Photogramm. Remote Sens. 2017, 125, 156–173. [Google Scholar] [CrossRef]
  51. Lai, G.; Li, J.; Wang, J.; Wu, C.; Zhang, Y.; Zohner, C.M.; Peñuelas, J.; Ge, Q. Earlier peak photosynthesis timing potentially escalates global wildfires. Natl. Sci. Rev. 2024, 11, nwae292. [Google Scholar] [CrossRef]
  52. Lanet, M.; Li, L.; Ehret, A.; Turquety, S.; Le Treut, H. Attribution of summer 2022 extreme wildfire season in Southwest France to anthropogenic climate change. Npj Clim. Atmos. Sci. 2024, 7, 267. [Google Scholar] [CrossRef]
  53. Xu, H.; Chen, H.W.; Chen, D.; Wang, Y.; Yue, X.; He, B.; Guo, L.; Yuan, W.; Zhong, Z.; Huang, L.; et al. Global patterns and drivers of post-fire vegetation productivity recovery. Nat. Geosci. 2024, 17, 874–881. [Google Scholar] [CrossRef]
  54. Moi, D.A.; Lansac-Tôha, F.M.; Romero, G.Q.; Sobral-Souza, T.; Cardinale, B.J.; Kratina, P.; Perkins, D.M.; Teixeira de Mello, F.; Jeppesen, E.; Heino, J.; et al. Human pressure drives biodiversity–multifunctionality relationships in large Neotropical wetlands. Nat. Ecol. Evol. 2022, 6, 1279–1289. [Google Scholar] [CrossRef] [PubMed]
  55. Xu, W.; Cen, J.; Fan, L.; Liu, Y.; Janssen, T.A.J.; Liu, P.; Wu, W.; Wang, L.; Li, N.; Veraverbeke, S. Land use and climatic drivers of early 21st-century fire activity in the Amazon. Agric. For. Meteorol. 2025, 372, 110664. [Google Scholar] [CrossRef]
  56. Riet, M.; Veraverbeke, S. How Much of a Pixel Needs to Burn to Be Detected by Satellites? A Spectral Modeling Experiment Based on Ecosystem Data from Yellowstone National Park, USA. Remote Sens. 2022, 14, 2075. [Google Scholar] [CrossRef]
  57. Liu, P.; Liu, Y.; Guo, X.; Zhao, W.; Wu, H.; Xu, W. Burned area detection and mapping using time series Sentinel-2 multispectral images. Remote Sens. Environ. 2023, 296, 113753. [Google Scholar] [CrossRef]
  58. Giglio, L.; Schroeder, W.; Justice, C.O. The collection 6 MODIS active fire detection algorithm and fire products. Remote Sens. Environ. 2016, 178, 31–41. [Google Scholar] [CrossRef]
  59. Mu, H.; Li, X.; Wen, Y.; Huang, J.; Du, P.; Su, W.; Miao, S.; Geng, M. A global record of annual terrestrial Human Footprint dataset from 2000 to 2018. Sci. Data 2022, 9, 176. [Google Scholar] [CrossRef]
  60. Venter, O.; Sanderson, E.W.; Magrach, A.; Allan, J.R.; Beher, J.; Jones, K.R.; Possingham, H.P.; Laurance, W.F.; Wood, P.; Fekete, B.M.; et al. Global terrestrial Human Footprint maps for 1993 and 2009. Sci. Data 2016, 3, 160067. [Google Scholar] [CrossRef] [PubMed]
  61. Abatzoglou, J.T.; Dobrowski, S.Z.; Parks, S.A.; Hegewisch, K.C. TerraClimate, a high-resolution global dataset of monthly climate and climatic water balance from 1958–2015. Sci. Data 2018, 5, 170191. [Google Scholar] [CrossRef]
  62. Toledo, N.; Moulatlet, G.; Gaona, G.; Valencia, B.; Hirata, R.; Conicelli, B. Dynamics of meteorological and hydrological drought: The impact of groundwater and El Niño events on forest fires in the Amazon. Sci. Total Environ. 2024, 954, 176612. [Google Scholar] [CrossRef] [PubMed]
  63. Zhao, K.; Wulder, M.A.; Hu, T.; Bright, R.; Wu, Q.; Qin, H.; Li, Y.; Toman, E.; Mallick, B.; Zhang, X.; et al. Detecting change-point, trend, and seasonality in satellite time series data to track abrupt changes and nonlinear dynamics: A Bayesian ensemble algorithm. Remote Sens. Environ. 2019, 232, 111181. [Google Scholar] [CrossRef]
  64. Li, Y.; Liu, Y.; Bohrer, G.; Cai, Y.; Wilson, A.; Hu, T.; Wang, Z.; Zhao, K. Impacts of forest loss on local climate across the conterminous United States: Evidence from satellite time series observations. Sci. Total Environ. 2022, 802, 149651. [Google Scholar] [CrossRef] [PubMed]
  65. Sen, P.K. Estimates of the Regression Coefficient Based on Kendall’s Tau. J. Am. Stat. Assoc. 1968, 63, 1379–1389. [Google Scholar] [CrossRef]
  66. Yang, D.; Yang, Z.; Wen, Q.; Ma, L.; Guo, J.; Chen, A.; Zhang, M.; Xing, X.; Yuan, Y.; Lan, X.; et al. Dynamic monitoring of aboveground biomass in inner Mongolia grasslands over the past 23 Years using GEE and analysis of its driving forces. J. Environ. Manag. 2024, 354, 120415. [Google Scholar] [CrossRef] [PubMed]
  67. Peng, C.; Zeng, J.; Chen, K.-S.; Li, Z.; Ma, H.; Zhang, X.; Shi, P.; Wang, T.; Yi, L.; Bi, H. Global spatiotemporal trend of satellite-based soil moisture and its influencing factors in the early 21st century. Remote Sens. Environ. 2023, 291, 113569. [Google Scholar] [CrossRef]
  68. Vadrevu, K.; Lasko, K. Intercomparison of MODIS AQUA and VIIRS I-Band Fires and Emissions in an Agricultural Landscape—Implications for Air Pollution Research. Remote Sens. 2018, 10, 978. [Google Scholar] [CrossRef]
  69. Pelletier, F.; Cardille, J.A.; Wulder, M.A.; White, J.C.; Hermosilla, T. Inter- and intra-year forest change detection and monitoring of aboveground biomass dynamics using Sentinel-2 and Landsat. Remote Sens. Environ. 2024, 301, 113931. [Google Scholar] [CrossRef]
  70. Wang, J.; Ding, D.; Hu, P.; Chen, W.; Yang, R.; Wang, L.; Cai, Q.; Zhao, S.; Deng, J. Rainy season onset over the Southeast Asia low-latitude highlands: Objective definition and relation with spring drought. Clim. Dyn. 2024, 63, 12. [Google Scholar] [CrossRef]
  71. Hendrawan, V.S.A.; Mawandha, H.G.; Sakti, A.D.; Karlina; Andika, N.; Shahid, S.; Jayadi, R. Future exposure of rainfall and temperature extremes to the most populous island of Indonesia: A projection based on CORDEX simulation. Int. J. Climatol. 2024, 44, 3529–3547. [Google Scholar] [CrossRef]
  72. Lin, S.; Liu, Y.; Huang, X. Climate-induced Arctic-boreal peatland fire and carbon loss in the 21st century. Sci. Total Environ. 2021, 796, 148924. [Google Scholar] [CrossRef] [PubMed]
  73. Davies-Barnard, T.; Catto, J.L.; Harper, A.B.; Imron, M.A.; Frank van Veen, F.J. Future fire risk under climate change and deforestation scenarios in tropical Borneo. Environ. Res. Lett. 2023, 18, 024015. [Google Scholar] [CrossRef]
  74. Wigneron, J.-P.; Fan, L.; Ciais, P.; Bastos, A.; Brandt, M.; Chave, J.; Saatchi, S.; Baccini, A.; Fensholt, R. Tropical forests did not recover from the strong 2015–2016 El Niño event. Sci. Adv. 2020, 6, eaay4603. [Google Scholar] [CrossRef] [PubMed]
  75. Lizundia-Loiola, J.; Pettinari, M.L.; Chuvieco, E. Temporal Anomalies in Burned Area Trends: Satellite Estimations of the Amazonian 2019 Fire Crisis. Remote Sens. 2020, 12, 151. [Google Scholar] [CrossRef]
  76. Wang, S.S.; Huang, J.P.; Yuan, X. Attribution of 2019 Extreme Spring—Early Summer Hot Drought over Yunnan in Southwestern China. Bull. Am. Meteorol. Soc. 2021, 102, S91–S96. [Google Scholar] [CrossRef]
  77. IPCC. Climate Change 2023: Synthesis Report; Intergovernmental Panel on Climate Change (IPCC): Geneva, Switzerland, 2023; pp. 35–115. [Google Scholar]
  78. Vadrevu, K.; Eaturu, A.; Casadaban, E.; Lasko, K.; Schroeder, W.; Biswas, S.; Giglio, L.; Justice, C. Spatial variations in vegetation fires and emissions in South and Southeast Asia during COVID-19 and pre-pandemic. Sci. Rep. 2022, 12, 18233. [Google Scholar] [CrossRef]
  79. Poulter, B.; Freeborn, P.H.; Jolly, W.M.; Varner, J.M. COVID-19 lockdowns drive decline in active fires in southeastern United States. Proc. Natl. Acad. Sci. USA 2021, 118, e2105666118. [Google Scholar] [CrossRef] [PubMed]
  80. Botterill-James, T.; Yates, L.A.; Buettel, J.C.; Brook, B.W. The future of Southeast Asia’s biodiversity: A crisis with a hopeful alternative. Biol. Conserv. 2024, 296, 110641. [Google Scholar] [CrossRef]
  81. Zhuang, H.; Liu, X.; Li, B.; Wu, C.; Yan, Y.; Zeng, L.; Zheng, C. Mapping high-resolution global gridded population distribution from 1870 to 2100. Sci. Total Environ. 2024, 955, 176867. [Google Scholar] [CrossRef]
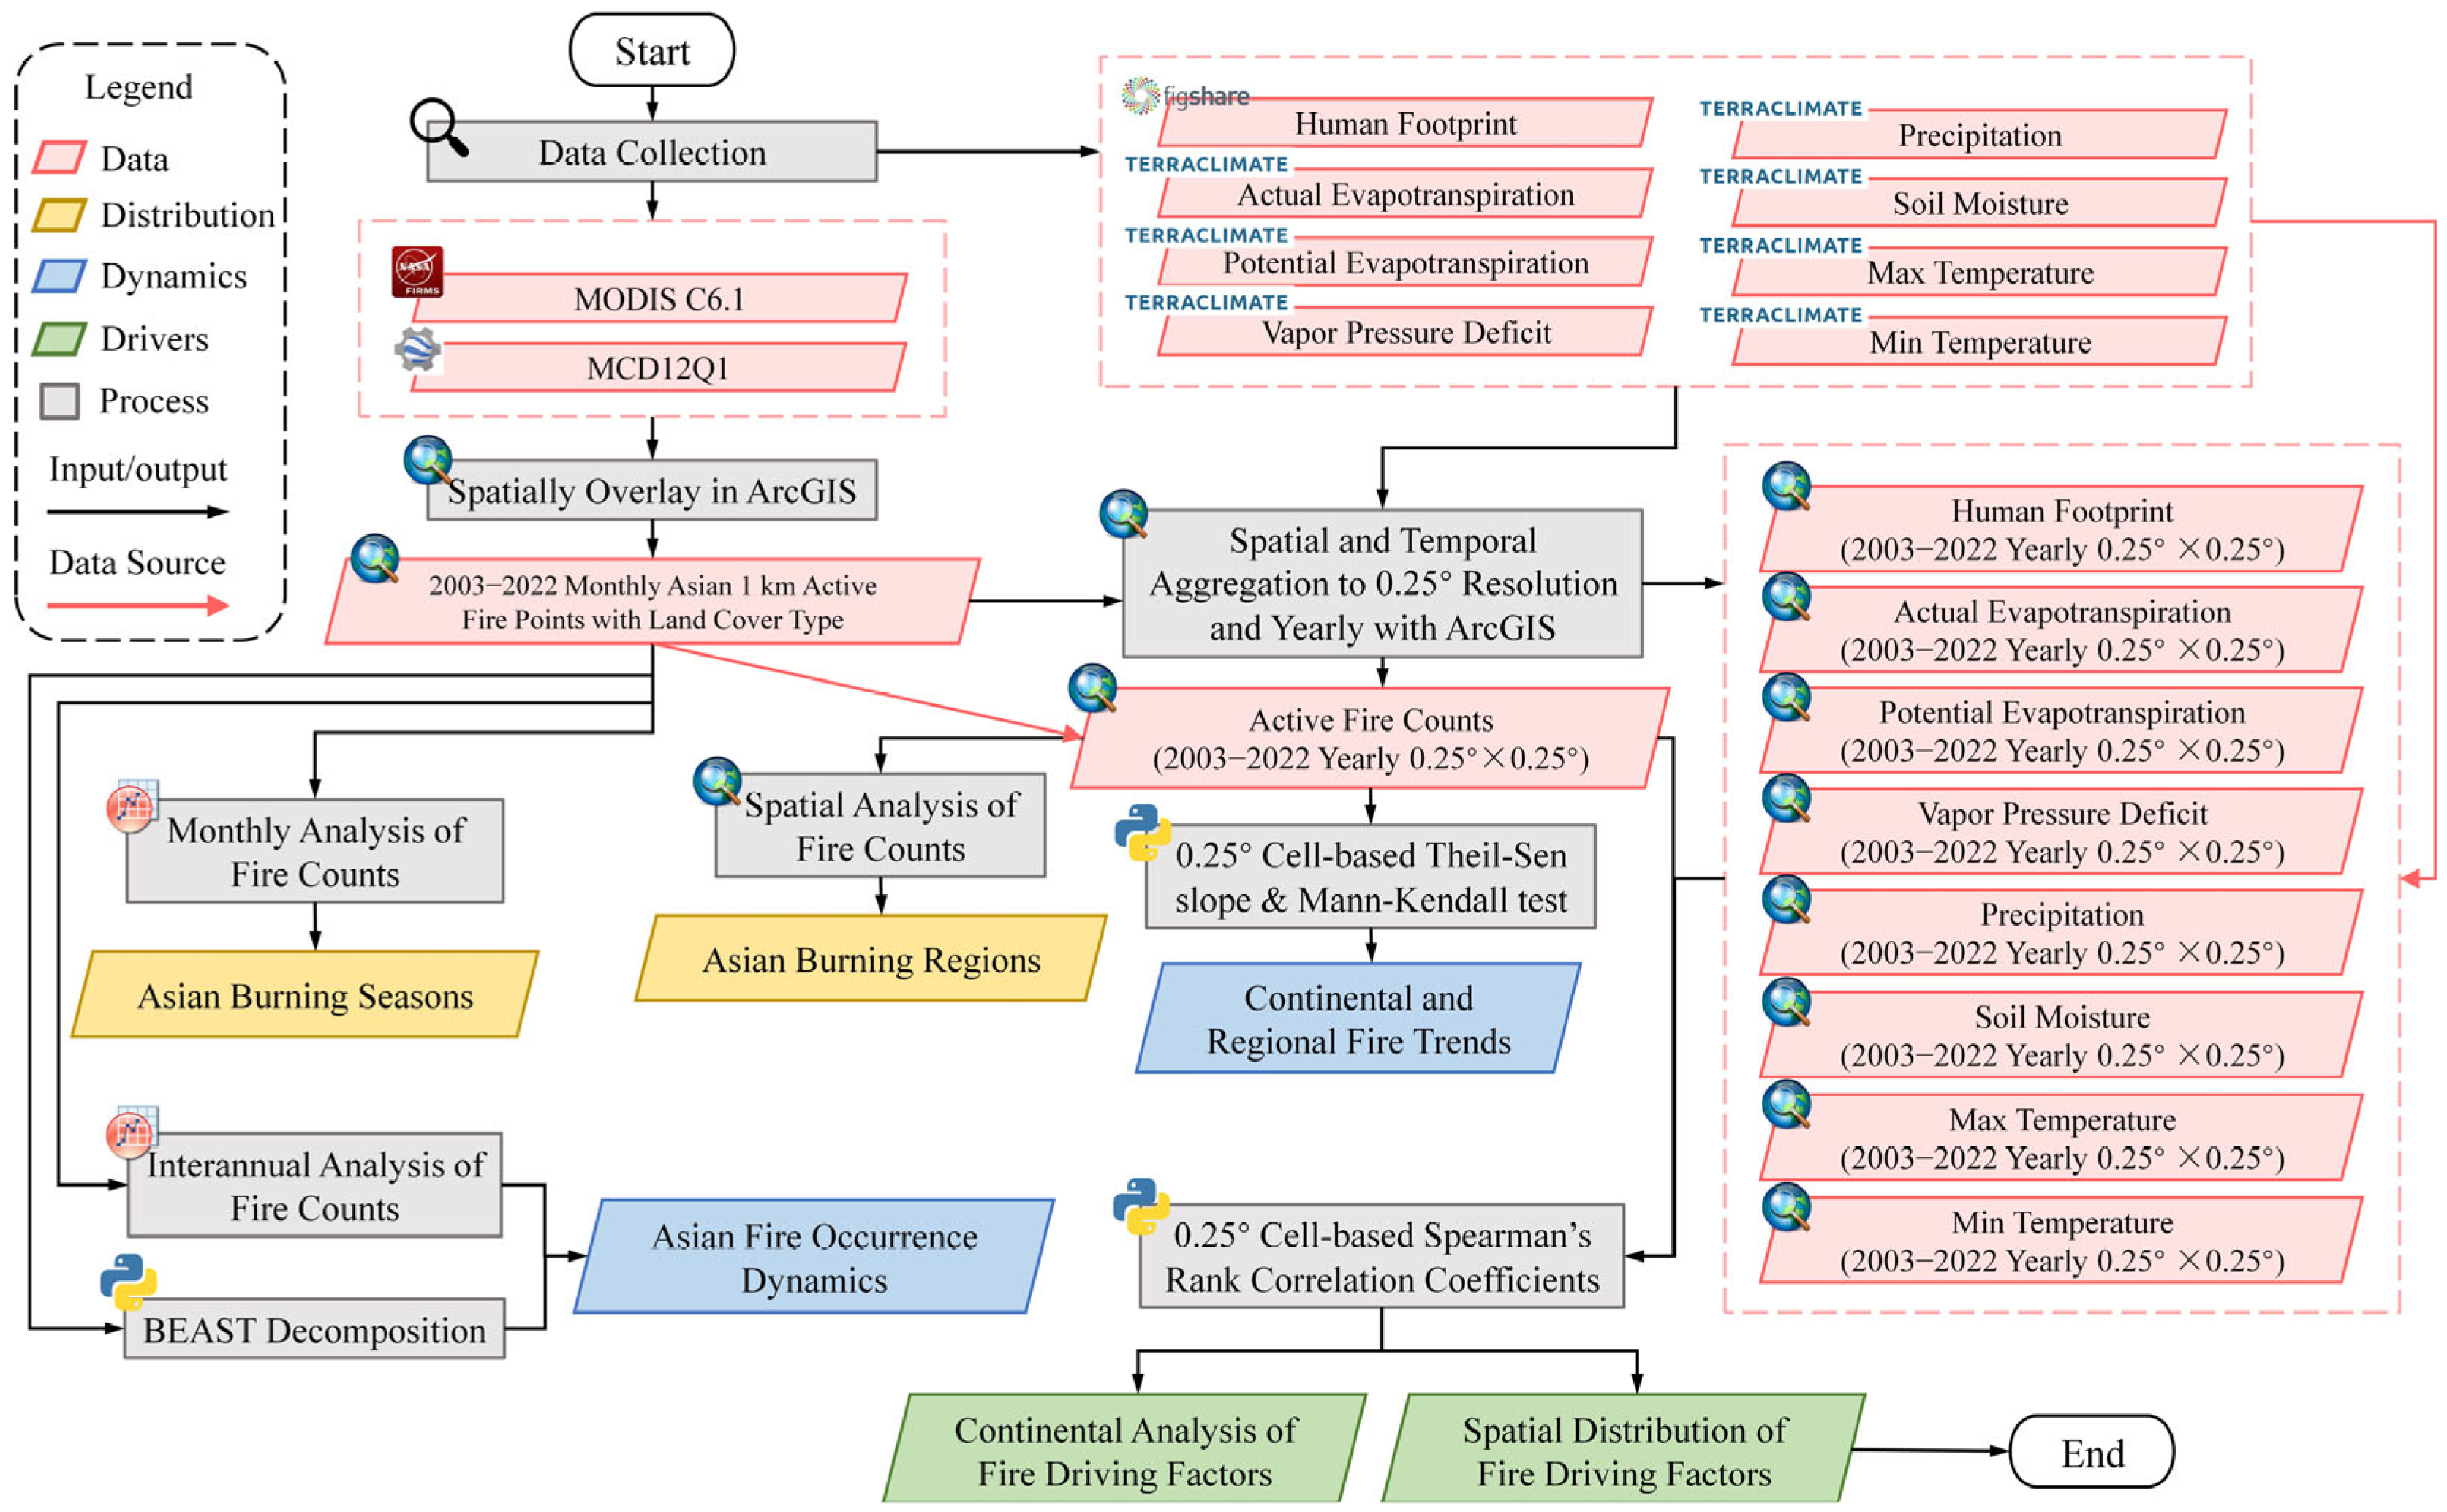
Figure 1. Multisource data and workflow in this study.
Ijgi 14 00349 g001
Figure 2. The number of active fire records in different land cover types in Asia from 2003 to 2022. The legend comprises 6 distinct colors, each color, except gray, respectively, represents the five major fire types, while gray represents a summary of other 12 IGBP land cover types.
Ijgi 14 00349 g002
Figure 3. Spatial distribution of FC across Asia from 2003 to 2022: (a) total FC for Asia, (bf) FC for cropland, woody savanna (WS), evergreen broadleaf forest (EBF), grassland, and savanna, respectively. The FC are categorized into six classes using the natural breaks (Jenks) method, with each color representing the total number of fires within a 0.25° cell.
Ijgi 14 00349 g003
Figure 4. Box plots of the monthly FC in Asia from 2003 to 2022: (a) total FC for Asia, (bf) monthly FC for cropland, woody savanna (WS), evergreen broadleaf forest (EBF), grassland, and savanna, respectively. Cross symbols (+) denote outliers, the whiskers on both sides of the box indicate the range of 1.5 times the standard deviation, and the solid line within each box represents the median value.
Ijgi 14 00349 g004
Figure 5. Interannual variations and trends in FC across Asia from 2003 to 2022: (a) total FC for Asia, (bf) annual FC for cropland, woody savanna (WS), evergreen broadleaf forest (EBF), grassland, and savanna, respectively. The nodes represent annual FC, the colored lines and dotted curves, respectively, indicate the linear and cubic fitting of FC over years. The linear fitting function and coefficient of determination (R2) are provided. All fitting results passed the significance test (p < 0.05).
Ijgi 14 00349 g005
Figure 6. Seasonality and trends in monthly FC across Asia from 2003 to 2022: (a) total FC for Asia, (bf) FC for cropland, woody savanna (WS), evergreen broadleaf forest (EBF), grassland, and savanna, respectively. Black nodes represent monthly FC, while the yellow and red curves denote the seasonal and trend components, respectively, derived from BEAST decomposition. Shaded areas around the curves indicate the 95% confidence intervals. Vertical lines mark the time points of significant changes in seasonality. Red dots highlight critical time points.
Ijgi 14 00349 g006
Figure 7. Distribution of interannual Theil-Sen slopes for FC across Asia from 2003 to 2022: (a) slopes for Asia; (bf) slopes for cropland, woody savanna (WS), evergreen broadleaf forest (EBF), grassland, and savanna, respectively. Cells that passed the Mann–Kendall significance test (p < 0.05) are marked with black dots.
Ijgi 14 00349 g007
Figure 8. Proportion of the strongest driving factors across Asia and within five fire types from 2003 to 2022, including meteorological factors associated with moisture deficit (actual evapotranspiration (AET), potential evapotranspiration (PET), vapor pressure deficit (VPD)), human activity factor (human footprint (HFP)), hydrological factors associated with moisture availability (precipitation (PPT), soil moisture (SM)), and temperature factors (monthly maximum temperature (Tmax), monthly minimum temperature (Tmin)).
Ijgi 14 00349 g008
Figure 9. Spatial distribution of the strongest driving factors across Asia from 2003 to 2022: (a) drivers for Asia; (bf) drivers for cropland, woody savanna (WS), evergreen broadleaf forest (EBF), grassland, and savanna, respectively. Green for APV (actual evapotranspiration (AET), potential evapotranspiration (PET) and vapor pressure deficit (VPD)), orange for human footprint (HFP), blue for PS (precipitation (PPT) and soil moisture (SM)), and yellow for TMP (monthly maximum temperature (Tmax), monthly minimum temperature (Tmin)). Cells marked with black dots indicate areas where the SRCC values are negative. All results passed the significance test (p < 0.05).
Ijgi 14 00349 g009
Table 1. Descriptions of climate variables.
CategoryVariableDefinition
Moisture deficit-related meteorological variablesAETThe actual evapotranspiration estimated under real-world moisture constraints.
PETThe maximum possible evapotranspiration of the underlying surface under un-limited water supply.
VPDThe difference between saturated and actual vapor pressure.
Moisture availability-related hydrological variablesPPTThe monthly cumulative rainfall.
SMThe end-of-month soil moisture condition.
Temperature variablesTmaxThe average highest 2 m surface temperature during a month.
TminThe average lowest 2 m surface temperature during a month.
Table 2. Proportion of dominant driving factors based on the result of SRCC analysis. The upper section presents the proportion of individual driving factors, while the lower section summarizes the proportions by data categories. The variables in the table are as follows: actual evapotranspiration (AET), potential evapotranspiration (PET), vapor pressure deficit (VPD), human footprint (HFP), precipitation (PPT), soil moisture (SM), monthly maximum temperature (Tmax), and monthly minimum temperature (Tmin).
AsiaCroplandWSEBFGrasslandSavanna
AET9.8%10.05%9.67%9.55%10.98%10.99%
PET9.16%9.02%11.52%10.18%9.27%10.95%
VPD11.96%11.64%11.12%11.63%10.63%8.45%
HFP28.55%35.32%22.42%23.07%27.27%26.45%
PPT7.67%6.83%6.79%7.92%9.42%7.58%
SM15.4%10.24%18.45%22.46%14.24%13.38
Tmax7.16%8.11%5.01%4.73%8.54%7.78%
Tmin10.20%8.79%15.03%10.47%9.66%14.12%
APV (AET, PET, VPD)30.92%30.71%32.31%31.33%30.88%30.39%
HFP28.55%35.32%22.42%23.07%27.27%26.45%
PS (PPT, SM)23.16%17.07%25.24%30.38%23.66%20.96%
TMP (Tmax, Tmin)17.36%16.9%20.04%15.2%18.2%22.2%
Bold values indicate the highest proportions, and underlined values represent the second-highest proportions. The lower portion aggregates the factors into four categories: APV (moisture deficit factors: AET, PET, VPD), HFP (human footprint), PS (moisture availability factors: PPT, SM), and TMP (temperature factors: Tmax, Tmin).
Disclaimer/Publisher’s Note: The statements, opinions and data contained in all publications are solely those of the individual author(s) and contributor(s) and not of MDPI and/or the editor(s). MDPI and/or the editor(s) disclaim responsibility for any injury to people or property resulting from any ideas, methods, instructions or products referred to in the content.