Article

An Analysis of the Spatiotemporal Evolution, Key Control Features, and Driving Mechanisms of Carbon Source/Sink in the Continental Ecosystem of China’s Shandong Province from 2001 to 2020

School of Civil Engineering and Geomatics, Shandong University of Technology, Zibo 255000, China
*
Author to whom correspondence should be addressed.
ISPRS Int. J. Geo-Inf. 2025, 14(9), 329; https://doi.org/10.3390/ijgi14090329
Submission received: 23 May 2025 / Revised: 21 August 2025 / Accepted: 22 August 2025 / Published: 26 August 2025

Abstract

Continental ecosystems are crucial constituents of the worldwide carbon process, and their carbon source and sink processes are highly sensitive to human-induced climate change. However, the spatiotemporal changes and principal determinants of carbon source/sink in Shandong Province remain unclear. This study constructs six dominant control modes of carbon sources/sinks based on three carbon sink indicators (gross primary production (GPP), net primary production (NPP), and net ecosystem productivity (NEP)) and three carbon source indicators (autotrophic respiration (Ra), heterotrophic respiration (Rh), and total ecosystem respiration (Rs)), revealing the main control characteristics of the spatiotemporal dynamics of carbon source/sink in the continental ecosystems of Shandong Province. Additionally, the principal determinants of carbon sources and sinks are quantitatively analyzed using cloud models. The research findings are as follows: (1) From 2001 to 2020, the continental ecosystem of Shandong Province demonstrated a weak carbon sink overall, with both carbon sinks and sources showing fluctuating growth trends (growth rate: GPP, NEP, NPP, Rs, Ra, and Rh consist of 15.55, 6.14, 6.09, 9.59, 9.47, and 0.07 gCm−2a−1). (2) The dominant control characteristics of carbon source/sink in Shandong Province exhibit significant spatial differentiation, which can be classified into absolute carbon sink cities (Jinan, Zibo, Rizhao, Jining, Liaocheng, Zaozhuang, Binzhou, Dezhou, Tai’an) and relative carbon source cities (Weifang, Yantai, Weihai, Linyi, Qingdao, Heze, and Dongying). GPP is the dominant control factor in carbon sink areas and is widely distributed across the province, while Rs and GPP are the dominant control factors in carbon source fields, focused on the eastern coastal and southwestern inland sites. (3) Landscape modification and rainfall are the main driving elements influencing the carbon sink and source variations in Shandong Province’s continental ecosystems. (4) The spatial differentiation of the driving factors of carbon producers and reservoirs is significant. In absolute carbon sink cities, land-use change and vegetation cover are the dominant factors for carbon sinks and sources, with significant changes in both range and spatial differentiation. In relative carbon source cities, land-use change is the leading factor for carbon source/sink, and the range of changes and spatial differentiation is most notable. The observations from this study supply scientific underpinnings and reference for enhancing carbon sequestration in continental ecosystems, urban ecological safety management, and achieving carbon neutrality goals.

1. Introduction

The carbon flux in continental ecosystems has long been a focal point of major international global change research initiatives, including the Global Carbon Project (GCP) and the Global Change and Continental Ecosystems Program (GCTE) [1,2]. The balance between carbon sources (processes releasing CO2 into the atmosphere) and carbon sinks (processes absorbing and storing CO2) is instrumental in the global climate system [3]. As a critical component of the carbon flux, the dynamics of terrestrial carbon sources and sinks significantly influence the global carbon balance. A comprehensive assessment of these dynamics is indispensable for investigating ecosystem dynamics within the framework of global warming, advancing regional carbon cycle research, and addressing global climate challenges [4].
In carbon source/sink studies, numerous models have been developed to estimate carbon fluxes, including process-based models (e.g., CASA, Biome-BGC) and remote sensing techniques, which provide valuable spatial and temporal data for carbon assessments [5,6]. These models enable the estimation of key carbon cycle parameters, such as gross primary production (GPP), net primary production (NPP), and net ecosystem productivity (NEP). GPP represents the total amount of carbon fixed by plants from the atmosphere through photosynthesis, NPP can be understood as the carbon stored by plants, and NEP refers to the amount of carbon accumulated by all organisms (plants, animals, microorganisms, etc.) in the entire ecosystem. These core indicators of assessing carbon sinks are widely used to evaluate terrestrial carbon dynamics, and they offer critical insights into ecosystem carbon uptake and storage capacity [7,8]. Conversely, key carbon source indicators include autotrophic respiration (Ra), heterotrophic respiration (Rh), and total ecosystem respiration (Rs). Ra reflects CO2 emissions from plant metabolism, while Rh represents CO2 emissions from the decomposition of organic matter; Rs is the total respiration, integrating both Ra and Rh processes [9,10]. These indicators are essential for understanding the carbon release mechanisms within ecosystems. Research in China and internationally suggests that the mechanisms driving carbon sources and sinks are diverse and multifaceted. It is affected by both climate change and human activities. Natural drivers like precipitation, temperature, and soil properties affect ecosystem carbon dynamics [11,12], while human-driven factors such as deforestation, urbanization, and agricultural practices can lead to significant changes in carbon fluxes [13,14,15]. Understanding these drivers is crucial for assessing regional contributions to the global carbon cycle and predicting future carbon sequestration potential.
As a critical ecological and economic hub in eastern China, Shandong Province serves as a biodiversity hotspot and ecological security barrier. Investigating the spatiotemporal patterns and driving mechanisms of continental carbon emitters and absorbers in this region is vital for systematically analyzing its carbon cycle functionality, supporting ecological conservation, urban ecological security, and sustainable development. However, existing studies in Shandong predominantly focus on isolated carbon metrics or single ecosystems [16,17,18], lacking integrated assessments of terrestrial carbon fluxes. A key unresolved challenge is quantifying and synthesizing the multifactorial drivers of carbon source and sink dynamics. To address this gap, our study employs three carbon sink indicators (GPP, NPP, and NEP) and three carbon source indicators (Rs, Ra, and Rh) to elucidate the spatiotemporal evolution of terrestrial carbon fluxes in Shandong. Using cloud modeling, we quantify the contributions and spatial heterogeneity of dominant drivers, thereby assessing the underlying mechanisms. This work aims to provide a scientific foundation for advancing research on Shandong’s terrestrial carbon cycle, urban ecological security, and environmental protection.

2. Materials and Methods

2.1. Study Area

Shandong Province (34°23′–38°24′ N, 114°48′–122°42′ E) is situated in eastern China along the coast of the Bohai Sea and the Yellow Sea. It features diverse land utilization patterns, including plowable land, woodland, grassy field, water bodies, building plots, and unimproved land (Figure 1). The research field has a temperate monsoonal zone with features hot, precipitation-heavy summers and cold, desiccated winters with a yearly mean temperature of 13–15 °C and precipitation spanning from 600 to 1000 mm. As a key province in China’s eastern ecological security strategy, Shandong provides an optimal environment for agricultural and forestry development due to its favorable climatic conditions. In terms of terrestrial carbon fluxes, the province’s diverse ecosystems play a significant role as a carbon sink due to its extensive forested area, agricultural land, and grassland. At the same time, the increase in construction land leads to an increase in carbon sources, all of which contribute to the carbon cycle. The role of continental ecosystems is critical in mitigating carbon emissions and carbon neutrality goals, ensuring regional ecological security while offering practical insights for nationwide ecological conservation and climate change mitigation strategies [19].

2.2. Data Origins and Preparation

(1)
Land utilization data: exhibiting a spatial detail of 1 km × 1 km.
(2)
Atmospheric data: temperature, precipitation, potential evapotranspiration, and sunshine duration exhibiting a spatial accuracy of 1 km × 1 km; atmospheric CO2 concentration data with a spatial resolution of 2° × 2.5°, stored in NC format and converted to raster format using MATLAB2016 software.
(3)
Socioeconomic data: population density and GDP data at a spatial scale of 1 km × 1 km; nighttime lighting data are composed of DMSP-OLS data (2000–2013) and VIIRS (2014–2020), together with spatial resolutions, respectively, is 2.7 km and 742 m.
(4)
Topographic data: exhibiting a spatial detail of 30 m.
(5)
Satellite imagery data: NDVI data were gathered from the MOD13Q product, exhibiting a spatial accuracy of 250 m. After format conversion and reprojection, the year-by-year NDVI data were obtained using the Maximum Synthesis Method (MVC), and the vegetation cover (FVC) was calculated by using the Image Element Dichotomous Model (IEDM). The GPP and NPP data came from the GPP, and the NPP data were obtained from the MOD17A3HGF product (source ibid.), exhibiting a spatial accuracy of 500 m × 500 m.
All the above data have been validated and are applicable to the research field (for complete data, please refer to the references [6,10,16,17,18]). Meanwhile, to ensure data consistency, all spatial data were consistently mapped to WGS_1984_UTM_Zone_50N; the spatial detail was reprocessed to 1 km × 1 km.

2.3. Research Techniques

2.3.1. Carbon Source and Sink Indicator Simulation

(1)
Rh was approximated using the model, and it is applicable to the entire terrestrial ecosystem of China, as follows [20,21]:
R h m , n = 0.22 × exp 0.0913 T ( m , n ) + ln 0.3145 R ( m , n ) + 1 × 30 × 46.5 %
T ( m , n ) denotes the average thermal level of image m in month n (°C); R ( m , n ) denotes the standard monthly rainfall of image m in month n (mm). The equation is established by applying the regression relationship between conventional meteorological data (temperature T and precipitation R ) and soil carbon emission.
(2)
Ra represents the amount of carbon consumed by the plant during its own respiration, and its value is the result of the subtraction of NPP from GPP:
R a m , n = G P P m , n N P P m , n
(3)
Rs represents the total ecosystem respiration, and its value is the sum of Ra and Rh:
R S m , n = R a m , n + R h m , n
where R a m , n represents R a for m image elements in year n, and R h m , n represents R h for m image elements in year n.
(4)
NEP simulation.
NEP is an important indicator for assessing regional vegetation carbon emitters/absorbers [22], without considering the influence of other disturbances; the vegetation NEP is the result of subtracting ecosystem respiration from vegetation NPP and Rh, which is calculated as follows:
N E P ( m , n ) = N P P ( m , n ) R h ( m , n )
where N E P ( m , n ) denotes the net carbon uptake by vegetation in the ecosystem in month n of image m in (gCm−2a−1), N P P ( m , n ) is the net biological productivity of vegetative cover in month n of image m in (gCm−2a−1), and R h ( m , n ) denotes the respiratory activity of soil microbes in month n of image m in (gCm−2a−1).

2.3.2. Sen Trend Analysis + MK Test

The Theil–Sen median regression method was implemented to calculate the inter-annual trend of each indicator of carbon sources/sinks, which can effectively avoid the interference of data anomalies or missing data for time series analysis [23], and the calculation is derived using the following formula:
θ = M e d i a n S j S i j i 2001 < i < j < 2020
where θ is the slope of change, j denotes the order of years, and Sj and Si are the independent variables corresponding to the j and i years. The MK test was designed to test the weightiness on the time series, and the trend of change was categorized into four classes according to the results: significant increase (θ > 0 ∩ α < 0.05), non-significant increase (θ > 0 ∩ α > 0.05), non-significant decrease (θ < 0 ∩ α > 0.05), and significant decrease (θ < 0 ∩ α < 0.05).

2.3.3. Carbon Source/Sink Master Characterization Model

(1)
Model setting.
In this paper, the continental ecosystems of Shandong Province were divided into carbon sinks (θNEP > 0) and carbon sources (θNEP < 0), based on the trend of NEP changes, and then six carbon source/sink master control models were constructed, based on the trends of GPP and Rs [23] (Table 1).
(2)
Identification of regional master control indicators.
In this paper, the main control indicators of carbon source/sink in continental ecosystems are recognized by spatial image superposition. The method compares the trend of each indicator on each spatial image in the carbon source/sink area, and the indicator with the largest absolute value of the trend is regarded as the main control indicator on the image.

2.3.4. Analysis of Carbon Source/Sink Driving Mechanisms Based on Cloud Modeling

(1)
Construction of cloud model for carbon source/sink distribution.
Modeled after the cloud model concept of academician Li, D.Y. [24], this study constructs the concept of cloud model of carbon source/sink indicator distribution: let P be a quantitative thesis of carbon source/sink indicator distribution expressed in precise numerical values, X P ; Q is a qualitative concept of carbon source/sink indicator distribution in space, and if the degree of certainty of the element x ( x X ) (a specific numerical value of the distribution of the carbon source/sink indicator) affiliation to the concept Q, C Q ( x ) 0 , 1 , is a stabilizing tendency of a random number (Equation (6)), then the distribution of the mapping of Q from the thesis domain P to the interval [0,1] in the space of number fields is called a cloud. The distribution of carbon source/sink indicators at each specific location is a “cloud droplet” of the cloud model.
C Q ( x ) : P 0 , 1 x X X P , x C Q x
The three key numerical traits of expectation (Ex), entropy (En), and hypermetropy (He) of the cloud model are used to characterize the overall properties of the distributional factors of carbon source and sink markers. Among them, Ex characterizes the overall situation of the dissemination of indicators for carbon sources and sinks, and it can characterize the general pattern of the dissemination of carbon source/sink indicators. En can be a comprehensive measure of the range of changes in the geographical dispersion of carbon source/sink indicators, reflecting the uncertainty of the geographic allocation range of carbon release and absorption entities indicators; the greater the majority of En, the more macro the concept, and the greater the ambiguity and randomness. He is implemented to measure the uncertainty of En, which can reflect the degree of variation of the distribution of carbon source/sink indicators; the larger the He, the less concentrated the distribution.
Using MATLAB software, the inverse cloud generator algorithm was used to calculate the quantitative characteristics of the cloud model, and the forward cloud generator algorithm was used to draw the cloud map according to the numerical features of the cloud model [25,26].
(2)
Cloud model of driving factor weights.
A total of 10 driving factors were selected, and the specific selection basis is shown in Table 2. With the aim of comparatively analyzing the geographical variation of the driving factors of carbon source/sink indicators on the role of carbon source/sink indicators, this paper constructs the weight coefficient cloud model of the driving factors of carbon source/sink indicators [27], and it establishes a multiple linear regression equation with each driving factor as the target variable and each driving factor as the independent variable. Taking the carbon source/sink indicators as the target variable and each driving factor as the causal variable, the multiple linear regression equation is established as follows:
y = D q 1 x 1 + D q 2 x 2 + + D q i x i + f
where y represents the carbon source/sink indicator, xi (i = 1, 2, …, n) represents n drivers, respectively, Dqi (i = 1, 2, …, n) is the estimated coefficient of the independent variable, and f is a constant term. Assuming that the sum of the influence of the n driving factors on the carbon source/sink indicator is 100%, according to the size of the standard regression coefficient, the size of the comparative weight of each driving factor to the carbon source/sink can be calculated, and the weight coefficient of the driving factor of the carbon source/sink indicator can be obtained as D = D q 1 , D q 2 , , D q i T , and so on, to obtain the weight coefficient matrix of the driving component of the carbon emitters/absorbers indicator of the m analyzing units, D = D 1 , D 2 , , D m . Based on the weight coefficient matrix of the driver determinant, the weight coefficient cloud model of the carbon emitter/absorber indicator driver factor is obtained as follows:
D = D 1 , D 2 , , D m = E x q 1 E n q 1 H e q 1 E x q 2 E n q 2 H e q 2 E x q i E n q i H e q i
where the following applies: qi is the i-th influence factor; Exqi, Enqi, Heqi are the expectation of the weight coefficient of the i-th driving factor, respectively; Exqi, Enqi, and Heqi are the expectation; En and He are the weight coefficient of the i-th driving factor, respectively; n is the total data of influencing factors; Ex characterizes the center of gravity of the driving factor’s role weight; En is a comprehensive measure of the range of changes in the driving factor’s role weight, reflecting the uncertainty of its impact on the carbon n emission/absorption indicators; and He reflects the spatial variance of the driving factor’s role weight. The smaller He is, the smaller is the spatial variance of the driving factor’s role weight, and the more stable is its impact on the carbon source/sink indicators.

3. Results

3.1. Spatiotemporal Evolution Trend of Carbon Source/Sink in Continental Ecosystems of Shandong Province

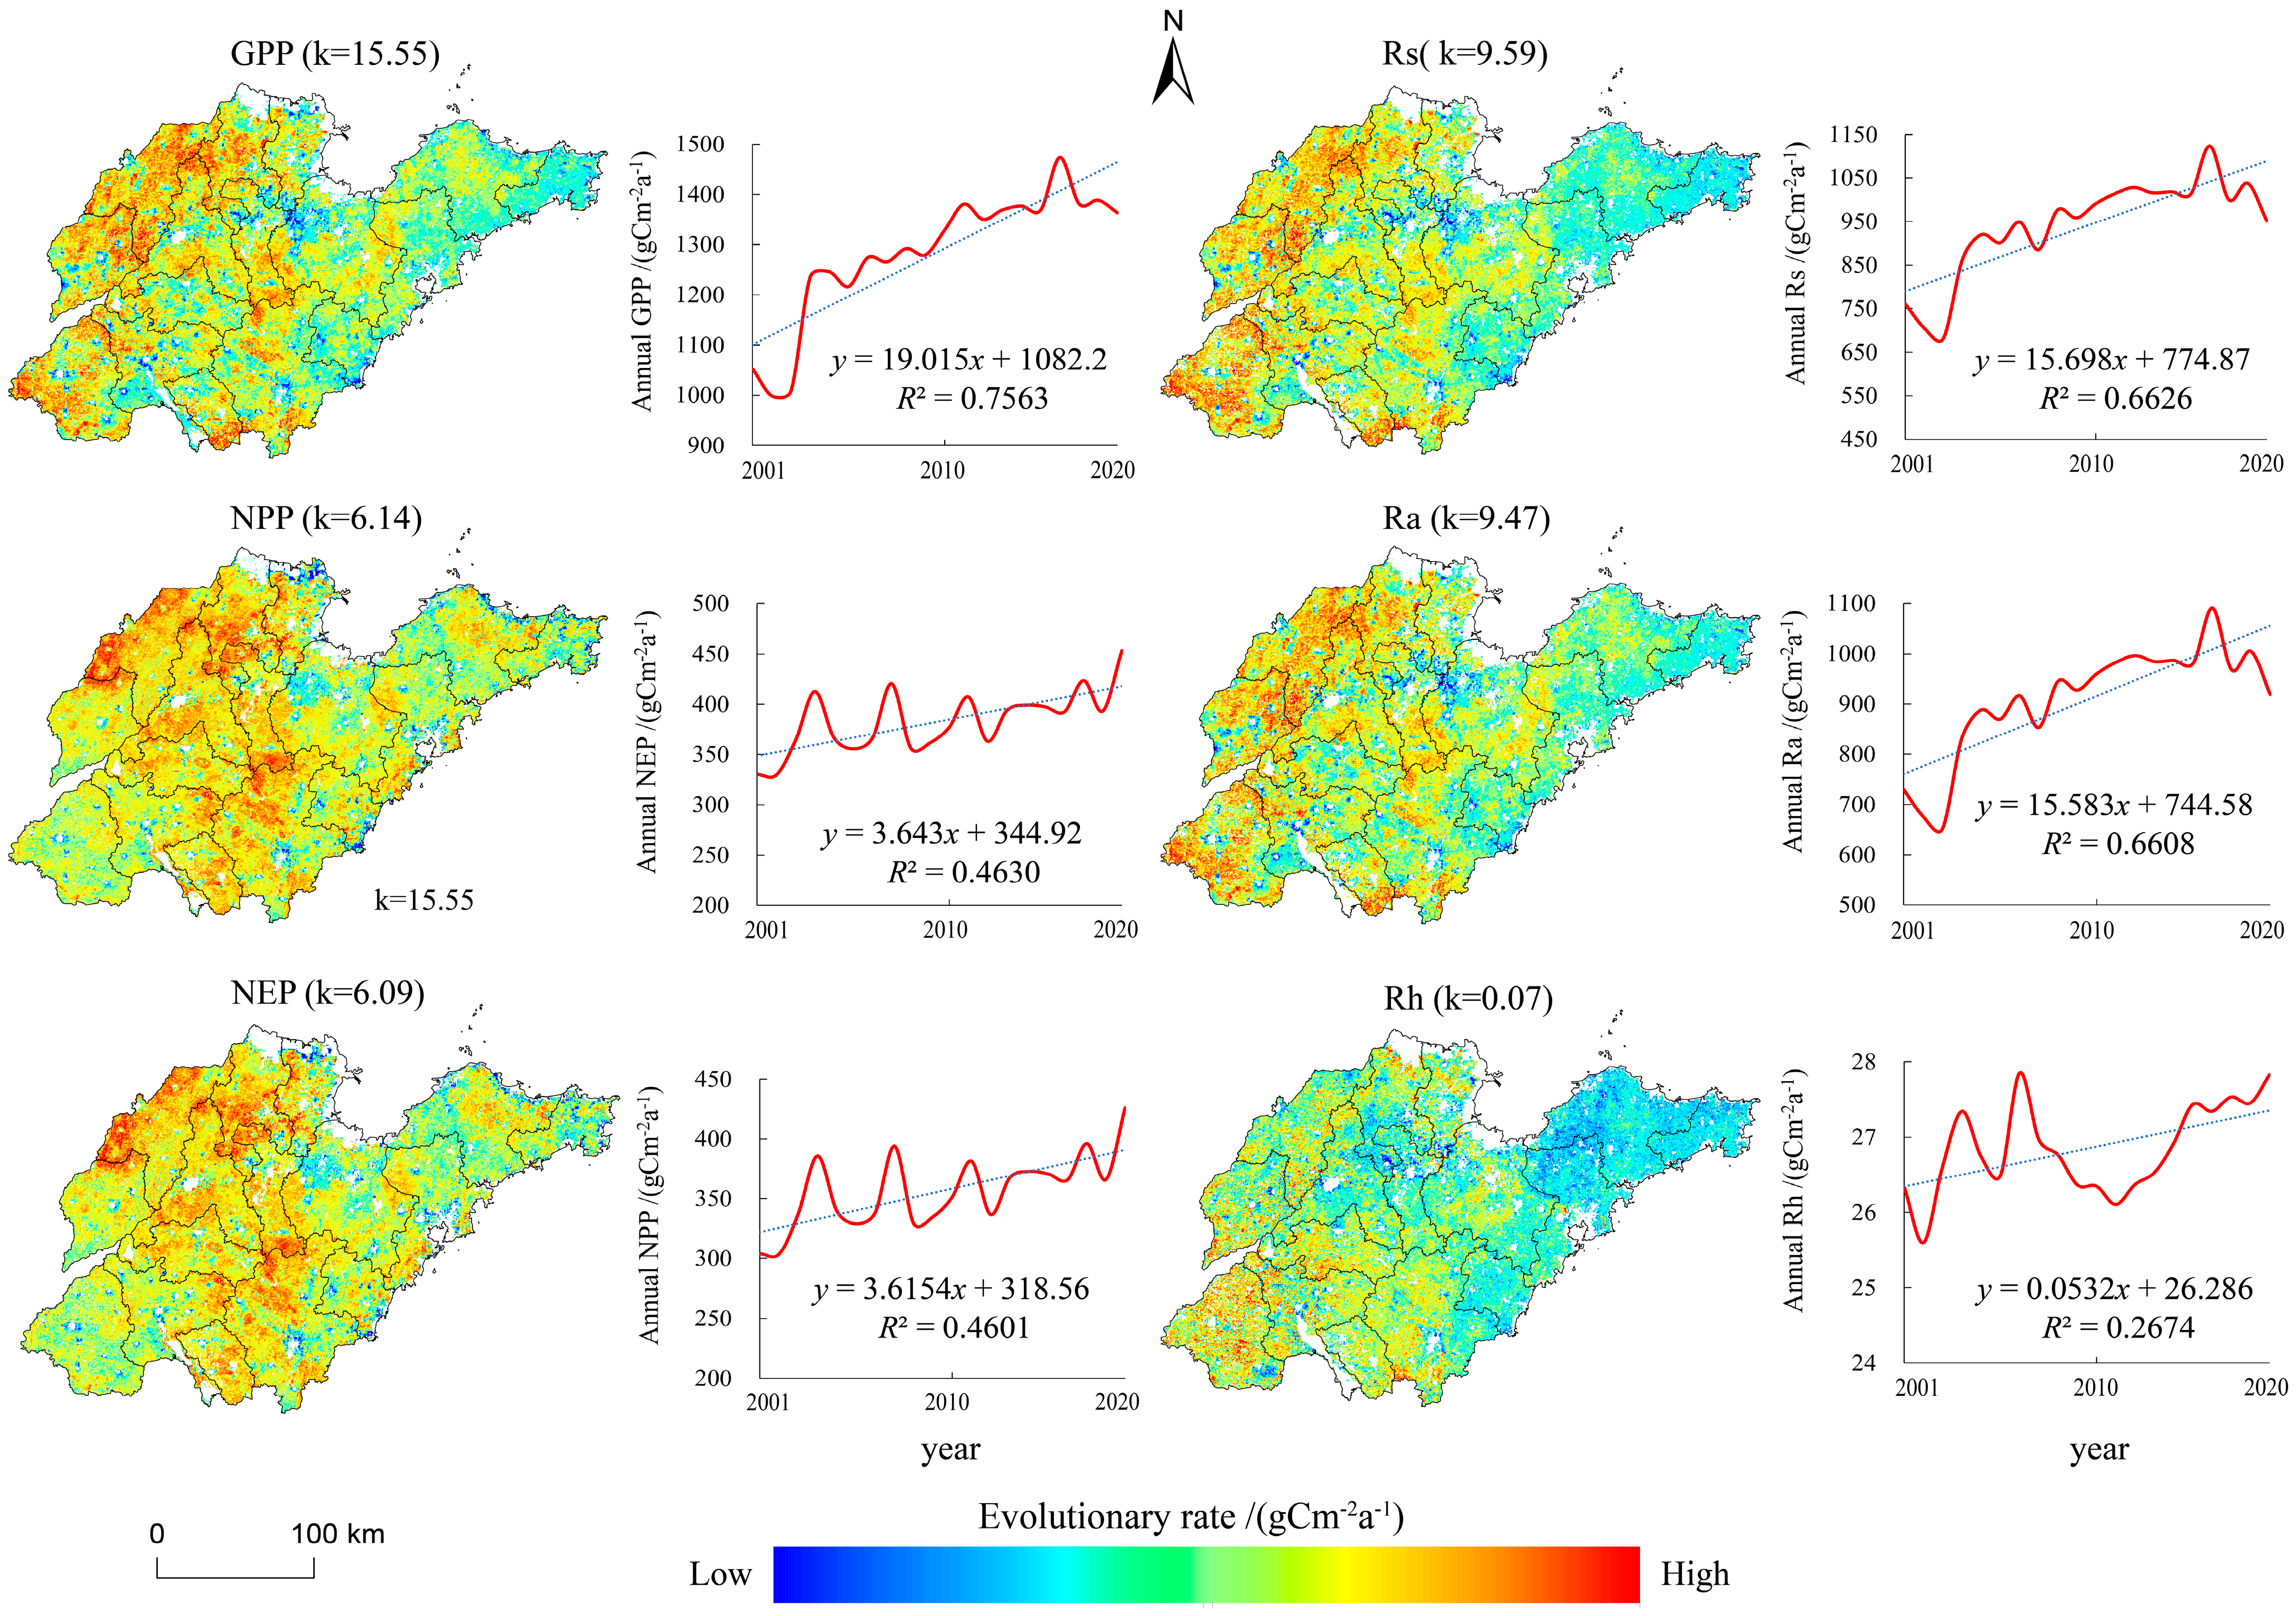
In the time span from 2001 to 2020, the carbon sequestration of continental ecosystems in Shandong Province exhibited a generally volatile increasing pattern. Carbon source and carbon sink indicators both show a decreasing trend from the southwest to the northeast. The development velocities of GPP, NEP, and NPP were 15.55, 6.14, and 6.09 gCm−2a−1, respectively. The carbon source, on the other hand, also demonstrated a volatile increasing pattern over the same duration, with development velocities of Rs, Ra, and Rh being 9.59, 9.47, and 0.07 gCm−2a−1, respectively. GPP exhibited a higher growth rate compared to Rs, but the growth rates of NEP and NPP were lower than those of Rs, Ra, and Rh, indicating that the dominance of respiration has weakened the carbon sink effect. Spatially, the areas where the growth rate of Rs exceeded that of GPP, NEP, and NPP accounted for 63.36%, 90.13%, and 89.73% of the total, respectively. This suggests that the strong respiration activity has resulted in a weak carbon sink for the overall terrestrial ecosystem of Shandong Province (Figure 2).
Within the duration of the study, the spatial variations in carbon sinks and sources of continental ecosystems in Shandong Province exhibited similar trends. Specifically, this manifests as “a significant increase in most areas, with scattered distribution in the rest.” The areas where both carbon sinks and sources increased were significantly greater than in cases where they decreased. The percentage of zones with significant increases in GPP, NEP, and NPP accounted for 72.01%, 59.65%, and 60.22%, respectively, while the proportion of areas with significant decreases was 2.90%, 1.83%, and 1.96%. Similarly, regions experiencing substantial increases in Rs, Ra, and Rh accounted for 72.24%, 65.75%, and 70.00%, respectively, while regions experiencing substantial decreases accounted for 1.81%, 2.99%, and 3.21%. The regions of increase were distributed across the entire province, whereas the regions experiencing a decline were primarily concentrated along the eastern coast, northeastern inland, and southwestern regions (Figure 3).
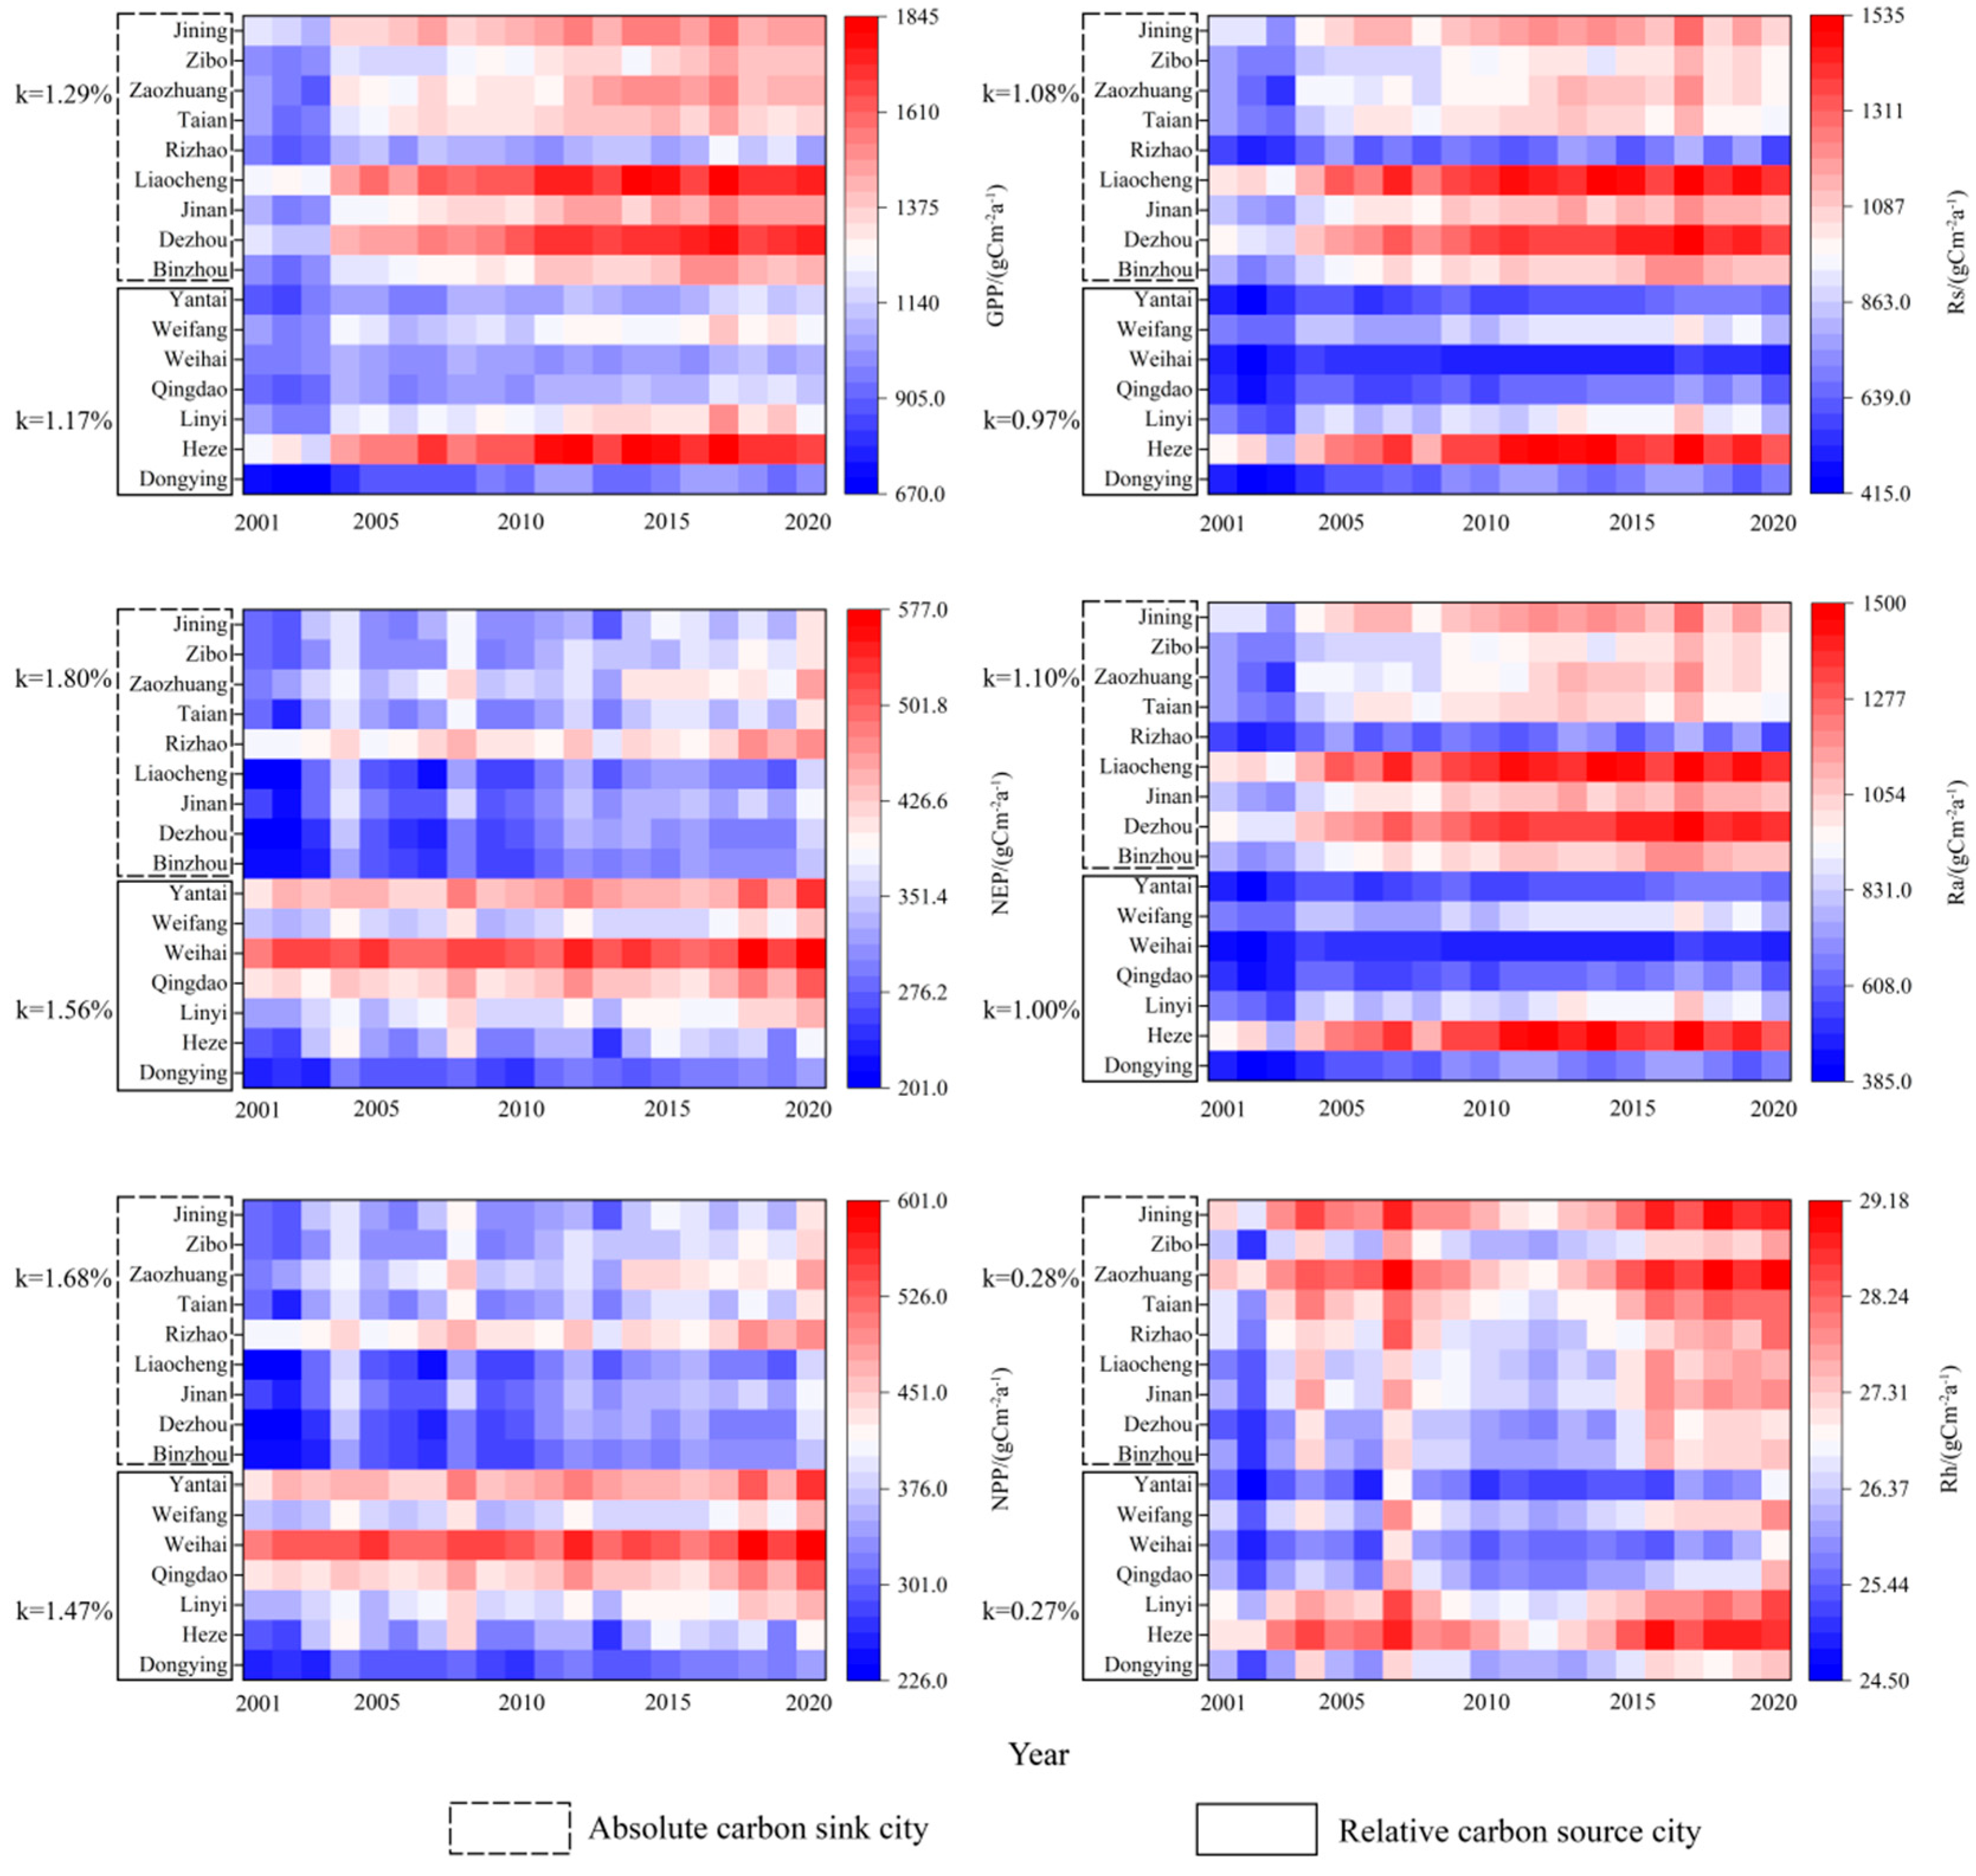
From an urban-scale analysis, the spatial pixel count of carbon source areas was classified using the standard deviation method. Shandong Province’s 16 cities were divided into absolute carbon sink cities (Jinan, Zibo, Rizhao, Jining, Liaocheng, Zaozhuang, Binzhou, Dezhou, and Tai’an) and relative carbon source cities (Weifang, Yantai, Weihai, Linyi, Qingdao, Heze, and Dongying). In relative carbon source cities, the growth rate of GPP was relatively low (an average growth rate of 1.17%), and the interannual variations in Rs and Rh were relatively stable (average growth rates of 0.97% and 0.27%, respectively). The annual averages of NEP and NPP demonstrated an upward trajectory (average growth rates of 1.56% and 1.47%, respectively), indicating that respiration influences the carbon retention capacity of these regions, which exhibits a relatively weak carbon source effect. In contrast, in absolute carbon sink cities, the growth rates of GPP, NEP, and NPP were higher (average growth rates of 1.29%, 1.80%, and 1.68%, respectively), and the interannual variations in Rs and Ra showed significant increases (average growth rates of 1.08% and 1.10%, respectively). However, the interannual variation of Rh was not significant (average growth rate of 0.28%), indicating that the carbon sink capacity in these regions is limited by respiration, but they still demonstrate a weak carbon sink effect (Figure 2 and Figure 4).

3.2. Dominant Control Patterns of Carbon Source/Sink in Continental Ecosystems of Shandong Province

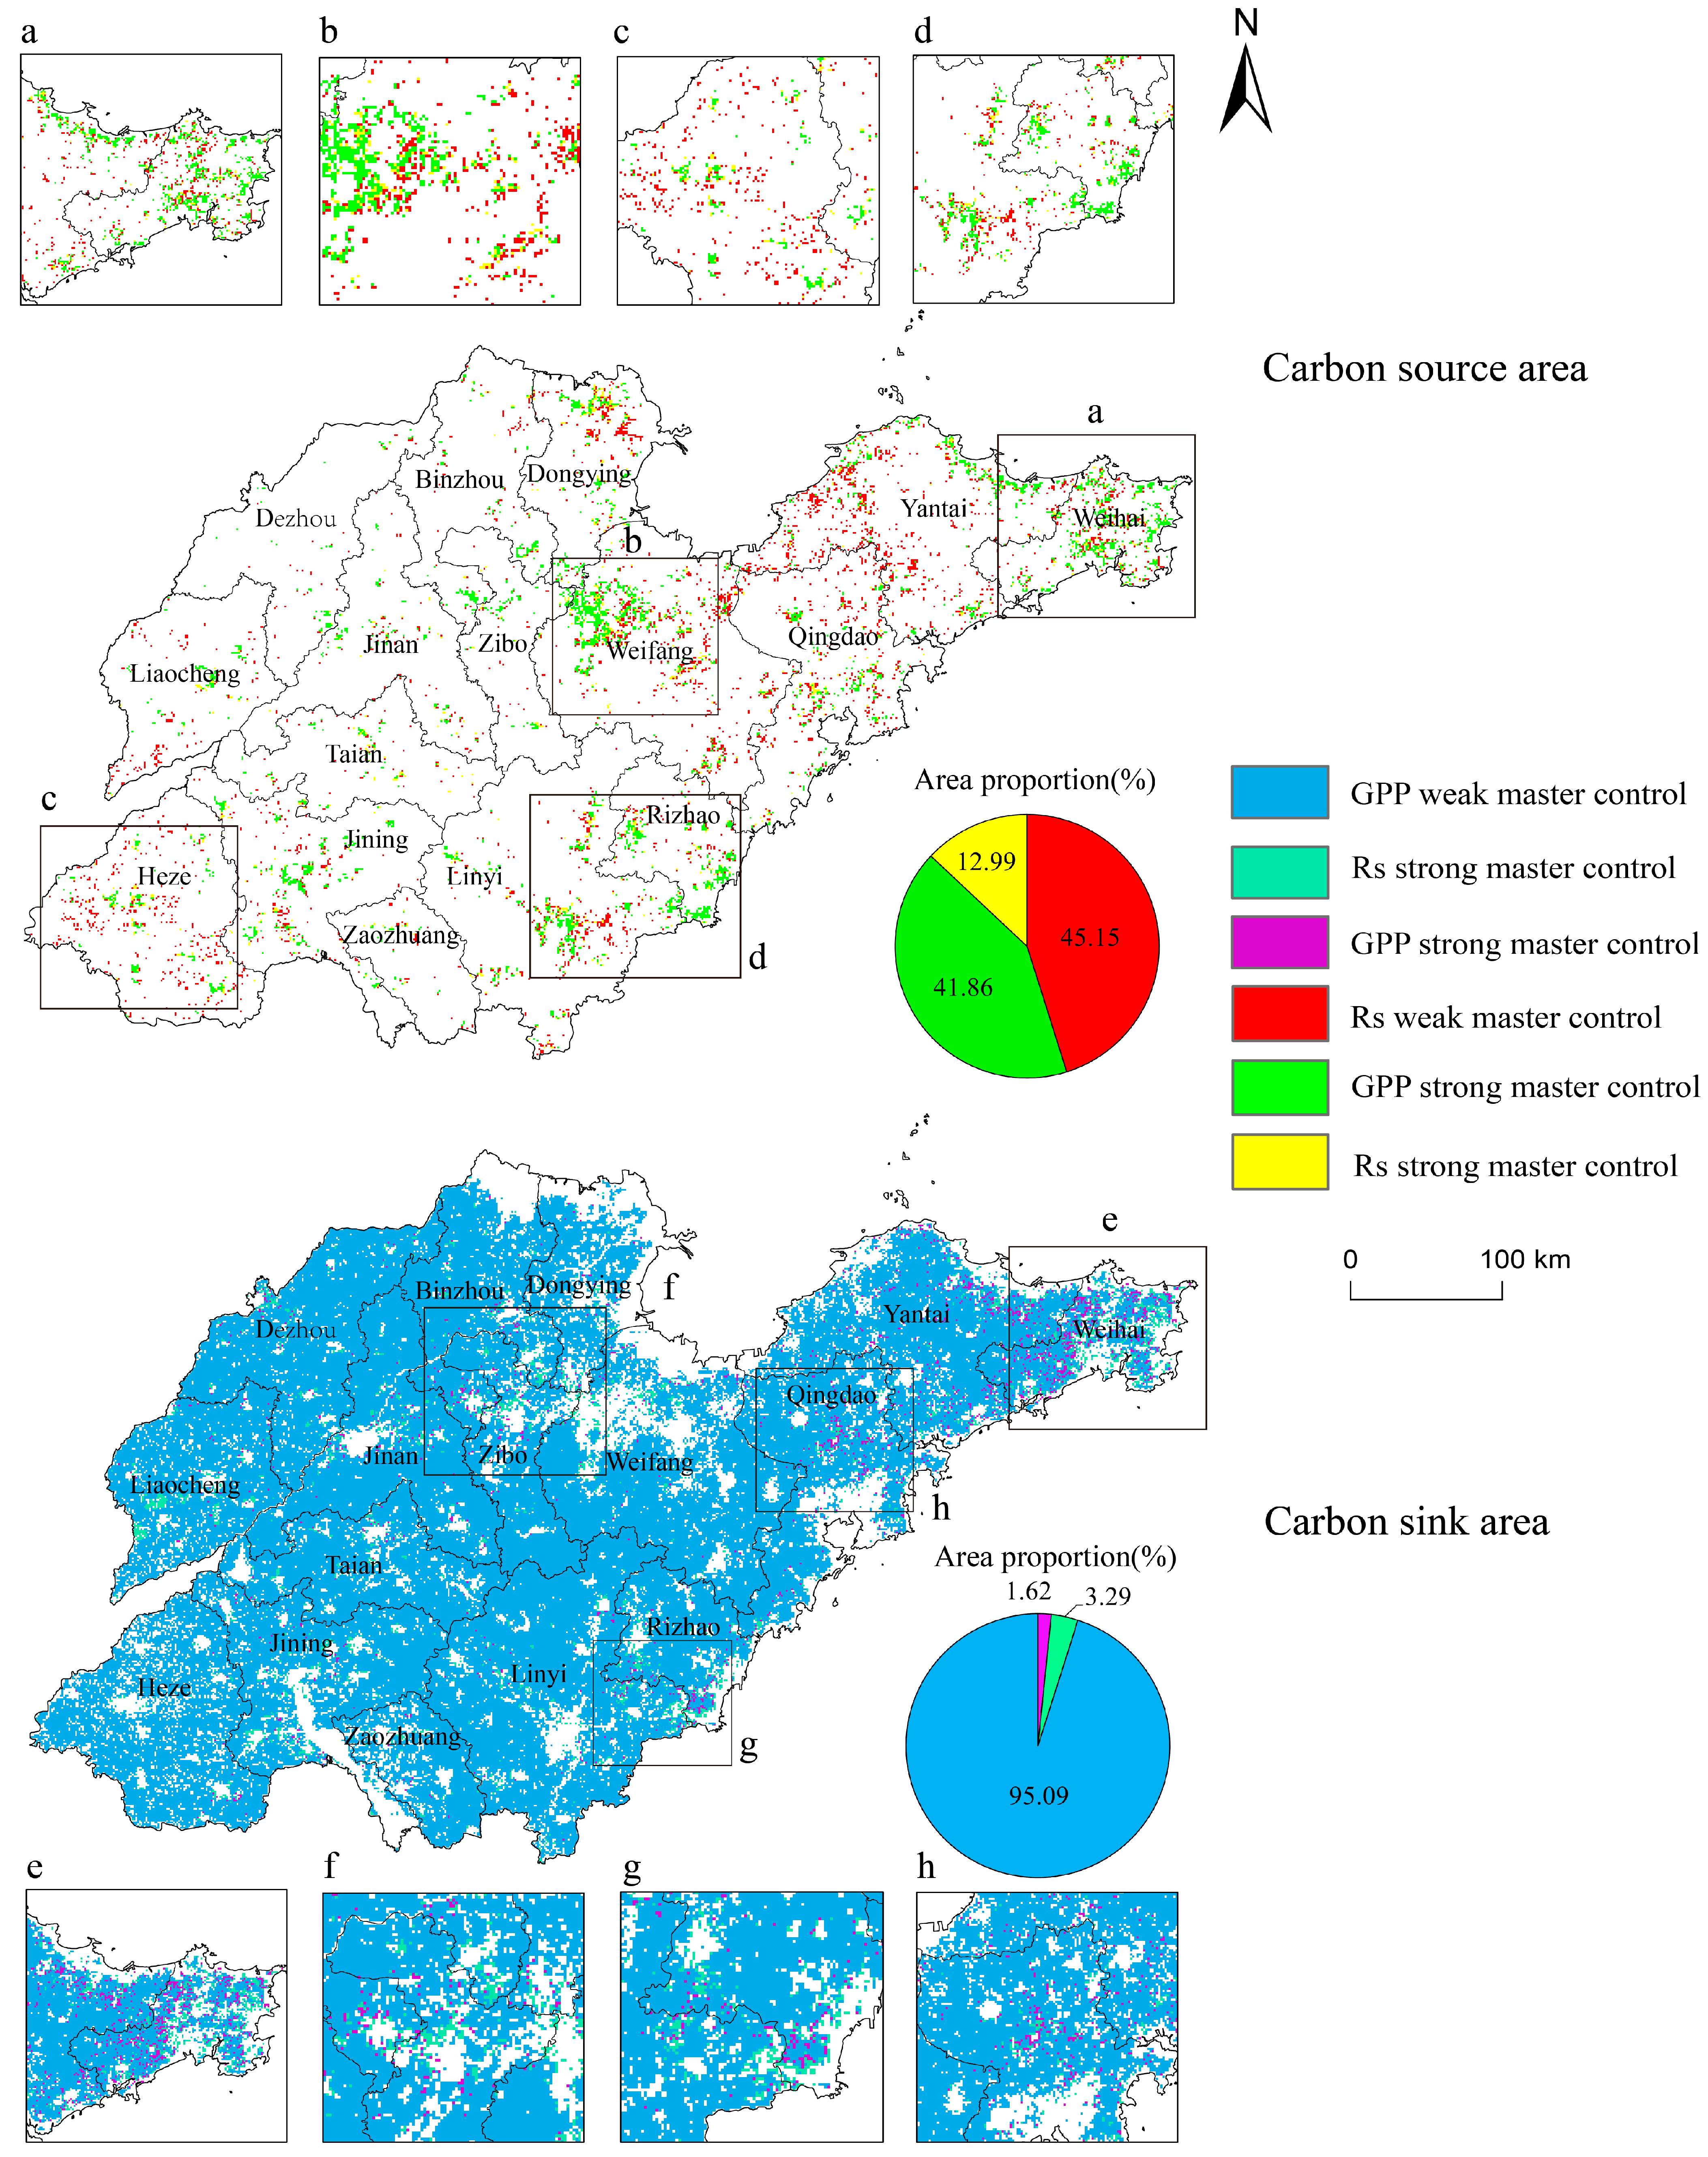
Shandong Province generally exhibits a distribution trend characterized by being a major carbon sink with some carbon sources. Carbon sink areas account for 92.46% of Shandong Province’s total area and are widely distributed throughout the province. Carbon source areas account for 7.54% of the total area and are mainly distributed in the southwestern inland and eastern coastal regions. Derived from the assessment of the dominant control patterns of carbon emitters/reservoirs, in carbon source areas (θNEP < 0), the area controlled by strong Rs was the smallest, accounting for 12.99%, and it was scattered across the province. Areas with weak Rs control and strong GPP control accounted for 45.15% and 41.86%, respectively, and they were distributed in the eastern coastal cities, the southwestern region, and northeastern cities (Figure 5a–d). Overall, in carbon sink areas, GPP was the dominant control factor, widely distributed throughout the province. In contrast, in carbon source areas, Rs and GPP jointly controlled the carbon dynamics, with a concentration in the eastern coastal and southwestern inland cities. In carbon sink areas (θNEP > 0), areas with weak GPP control accounted for 95.09%, followed by areas with strong Rs control, which accounted for 3.29%. These regions were mainly distributed in the eastern coastal and central areas, while areas with strong GPP control accounted for the smallest proportion, only 1.62%, and were scattered (Figure 5e–h).
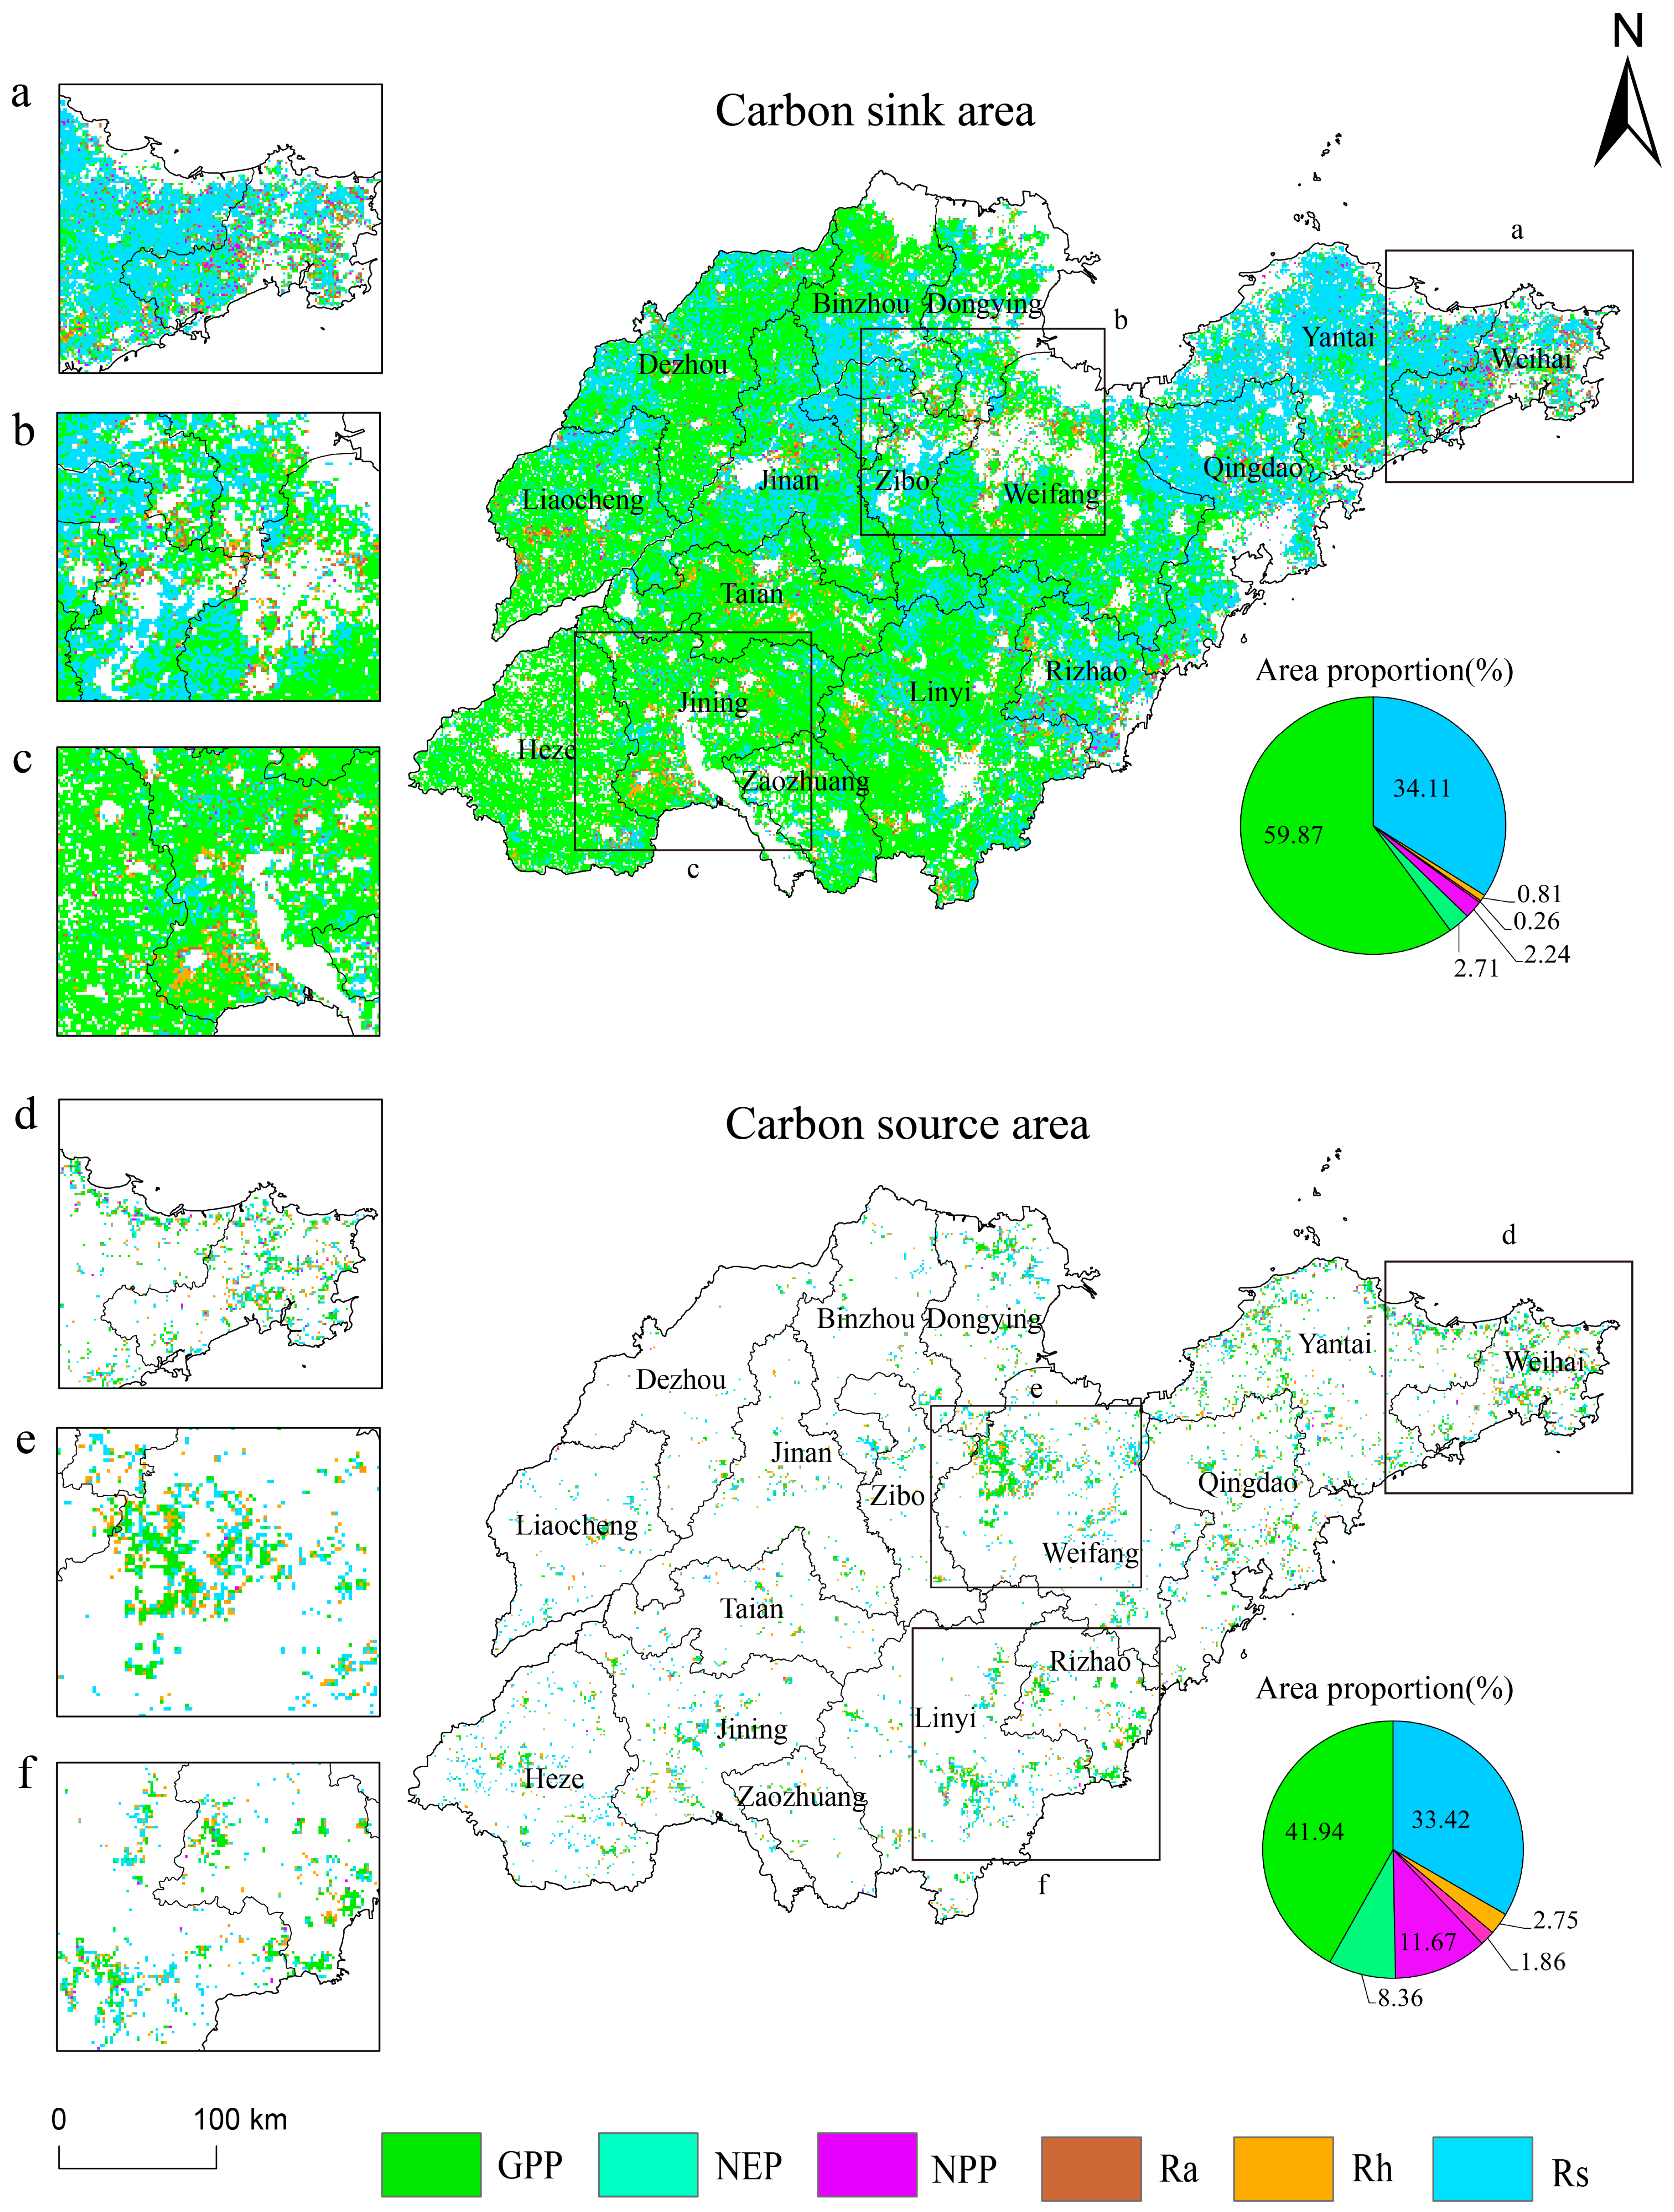
According to the findings from the primary governing patterns, this study further identified the dominant control indicators for carbon source/sink areas in the continental ecosystems of Shandong Province. The data support the notion that the largest proportion of areas is controlled by GPP, accounting for 59.87% in carbon sink areas and 41.94% in carbon source areas. The second largest proportion is controlled by Rs, accounting for 34.11% and 33.42%, respectively, in the two areas, with other factors having smaller proportions. GPP-controlled areas expand spatially from west to east, while Rs-controlled areas are concentrated in the eastern coastal and central zones (Figure 6a–c). In carbon sink areas, GPP- and Rs-controlled regions account for 64.82% and 35.18%, respectively, suggesting that vegetation carbon storage in these areas is constrained due to respiration under the dominance of photosynthesis. Rs is the most significant controlling factor in carbon source areas, covering 41.94% of the region, and it is scattered from the northwest to the southeast across the province. GPP is the second most dominant factor, covering 38.03%, and it is mainly distributed along the eastern coastal cities and the northwest part of Weifang. Ra and Rh cover 11.67% and 8.36%, respectively, and are scattered in areas where Rs dominates (Figure 6d–f). In carbon source areas, the regions controlled by carbon sink and carbon source indicators account for 38.03% and 61.97%, respectively, indicating that carbon storage in these areas is primarily dominated by respiration.

3.3. Spatial Heterogeneity of Carbon Fluxes Driving Factors in the Continental Ecosystems of Shandong Province

3.3.1. Spatial Variation of Carbon Source/Sink Driving Factors at the Provincial Scale

(1)
Dominant Driving Factors
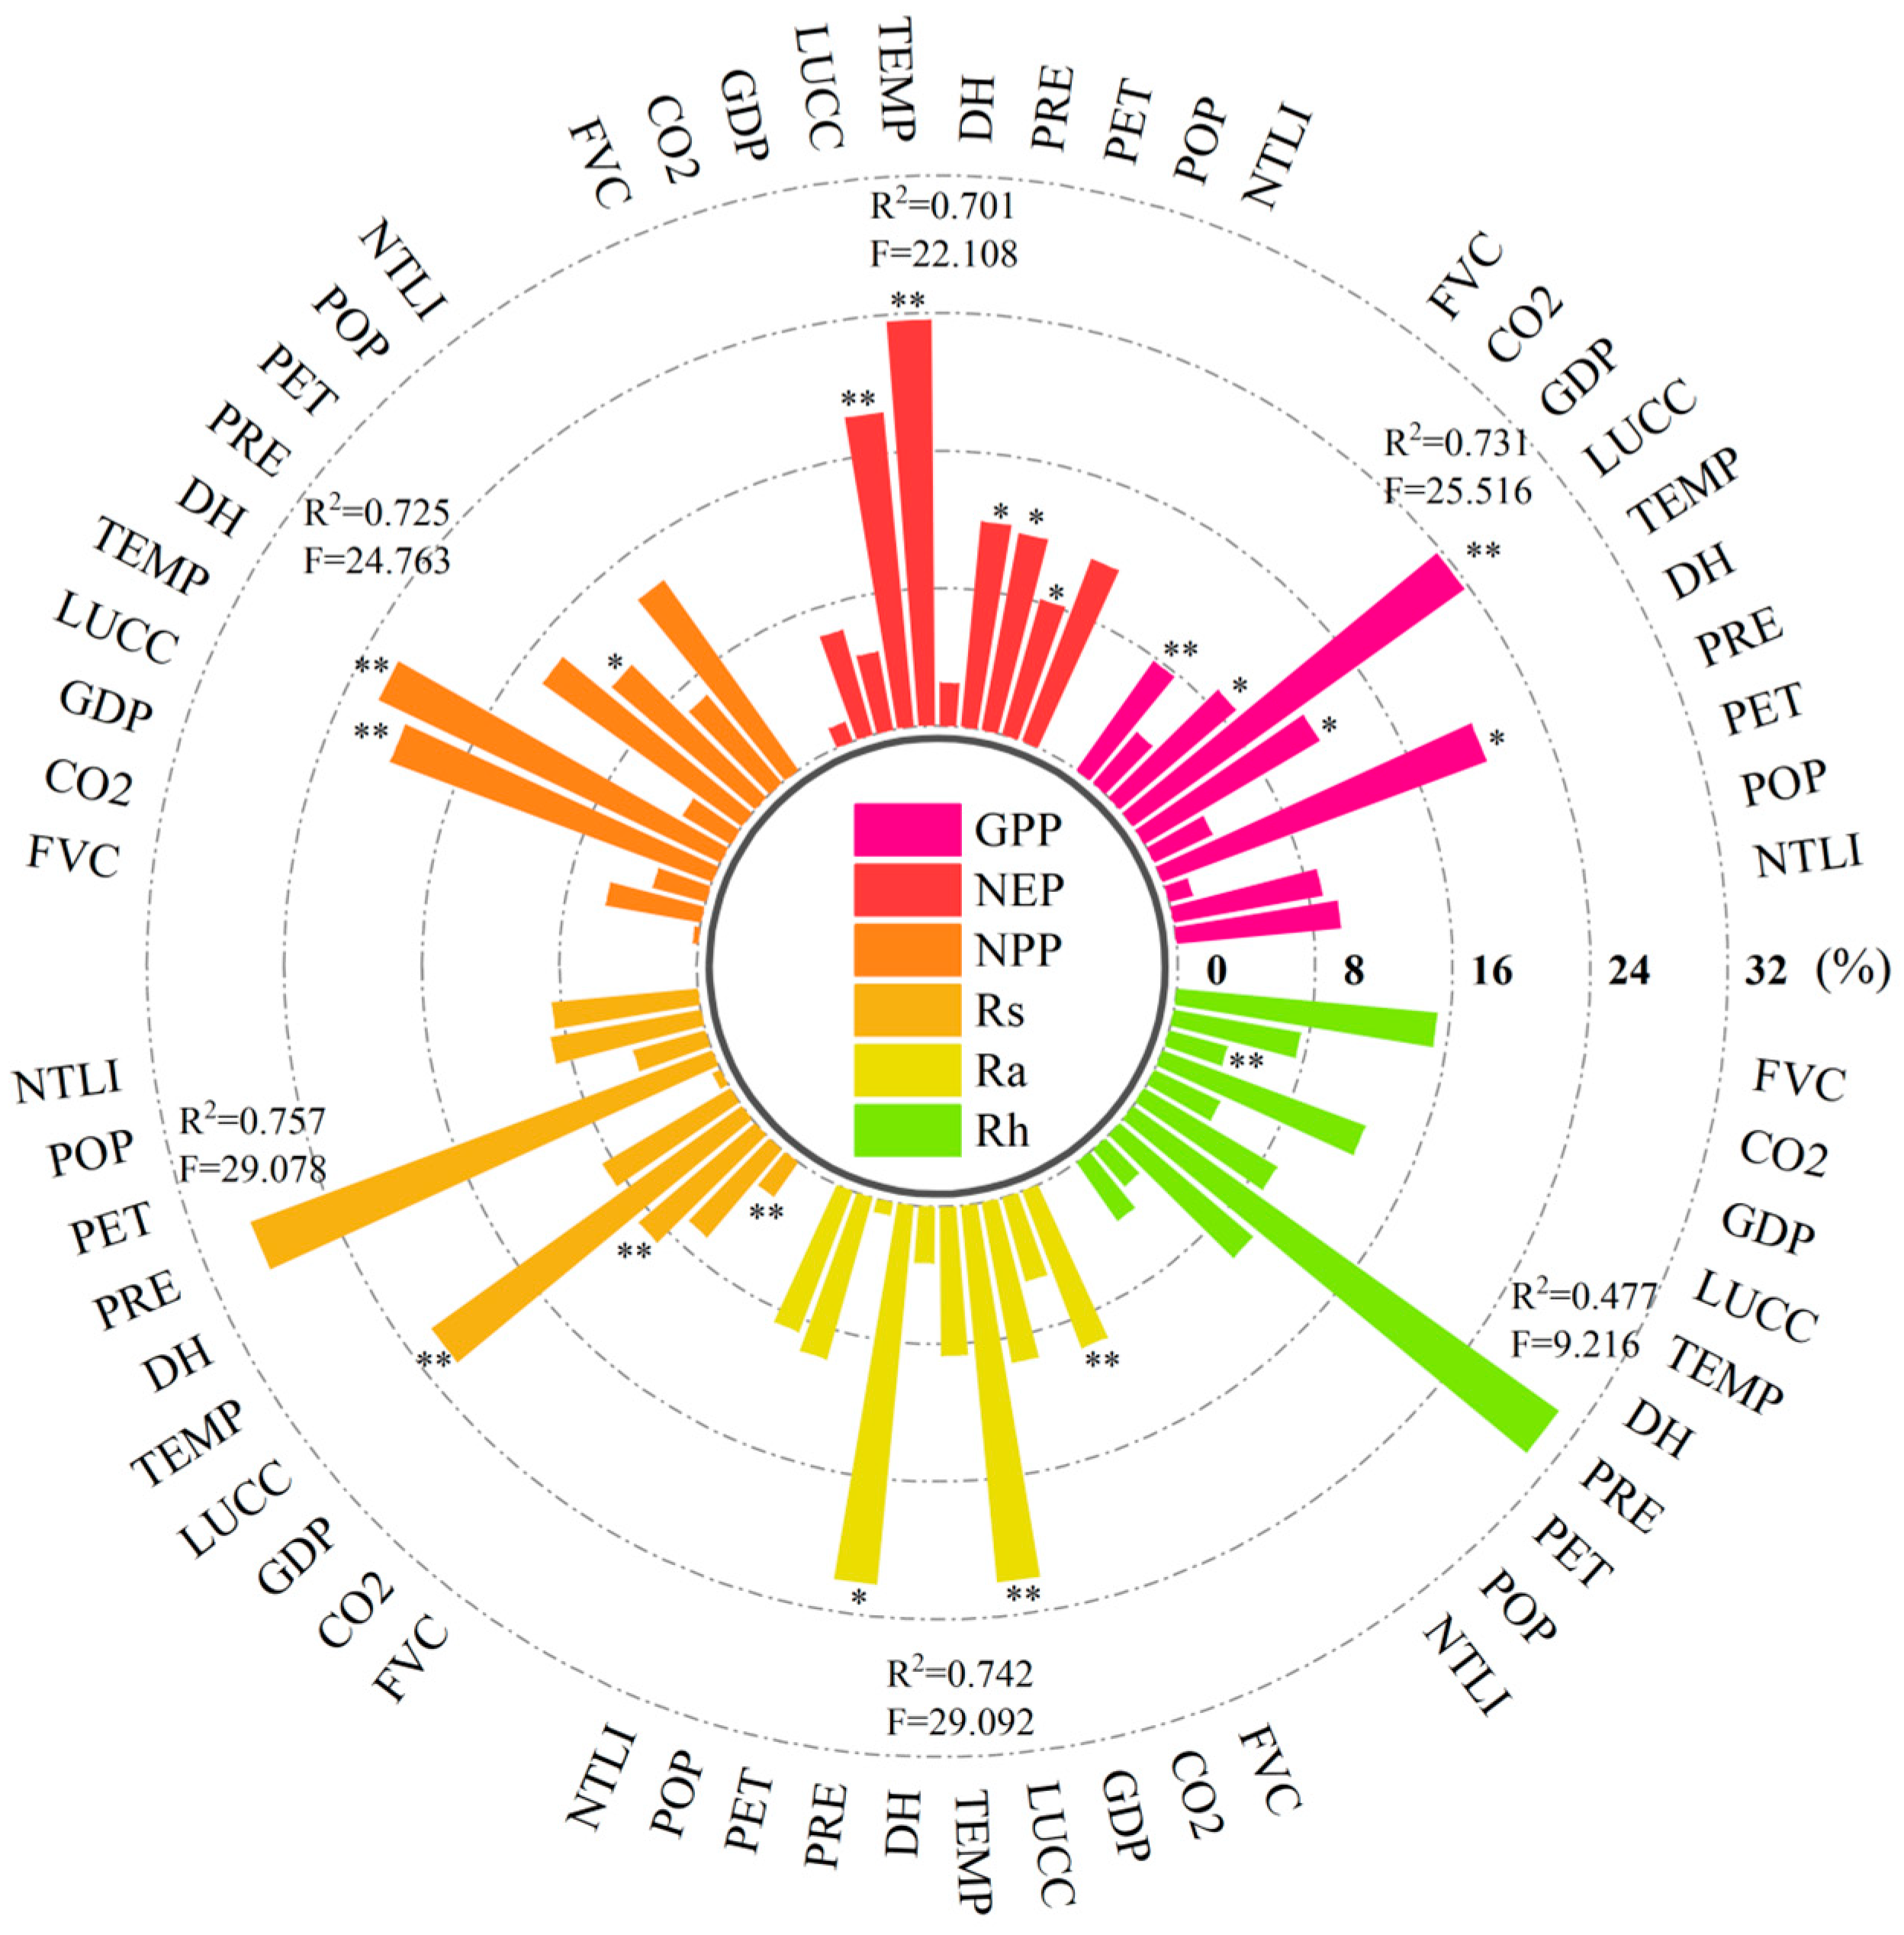
The regression equations between various indicators and driving factors yielded R2 values spanning from 0.477 to 0.757, with F-values spanning from 9.216 to 29.092 in the analysis of variance. These results indicate a good fit, with the regression equations being statistically significant. Among the carbon sink indicators, the dominant driving factors for GPP were land-use change and precipitation, contributing 23.71% and 20.15%, respectively. The dominant driving factors for NEP and NPP were temperature and land-use change, with contribution rates of 23.60% 22.01%, 18.39%, and 20.02%, respectively. For the carbon source indicators, the dominant driving factors for Rs and Ra were precipitation and land-use change, contributing 28.65%, 22.15%, 22.22%, and 22.00%, respectively. Precipitation was the dominant driving factor for Rh, with a contribution rate of 30.47% (Figure 7).
(2)
Ex, En, and He of Driving Factor Weights
Carbon sink indicators. The Ex-weight of landscape change is the largest among the driving factors, with contributions of 30.24%, 18.08%, and 18.06%, followed by vegetation coverage and atmospheric CO2 concentration. The contributions of other factors are relatively low. The En and He values for the driving factors are as follows: land-use change (12.01%, 7.78%, 8.29% and 2.58%, 2.99%, 3.18%), vegetation coverage (6.20%, 6.34%, 7.77% and 1.58%, 2.62%, 2.56%), and atmospheric CO2 concentration (4.94%, 6.24%, 6.43% and 0.94%, 2.30%, 1.76%). These results suggest that the larger the Ex-weight of a driving factor on the carbon sink indicators, the greater the range and spatial variation of the changes (Table 3).
Carbon source indicators. For carbon source indicators, vegetation coverage has the largest expected weight for Rs and Ra (19.73% and 22.35%, respectively), while land-use change has the largest expected weight for Rh (14.50%). The entropy and excess entropy values for the driving factors of Rs and Ra are as follows: population density (9.84%, 9.94% and 4.18%, 3.85%), land-use change (8.04%, 7.57% and 2.82%, 1.43%), and vegetation coverage (6.28%, 7.26% and 2.37%, 0.88%). For Rh, the entropy and excess entropy values for the driving factors are as follows: vegetation coverage (7.80% and 3.66%), atmospheric CO2 concentration (6.87% and 1.28%), and land-use change (6.66% and 0.66%). These results suggest that the smaller the expected weight of a driving factor on the carbon source indicators, the smaller the range and spatial variation of the changes (Table 3).

3.3.2. Spatial Variation of Carbon Source/Sink Driving Factors at the Urban Scale

(1)
Dominant Driving Factors
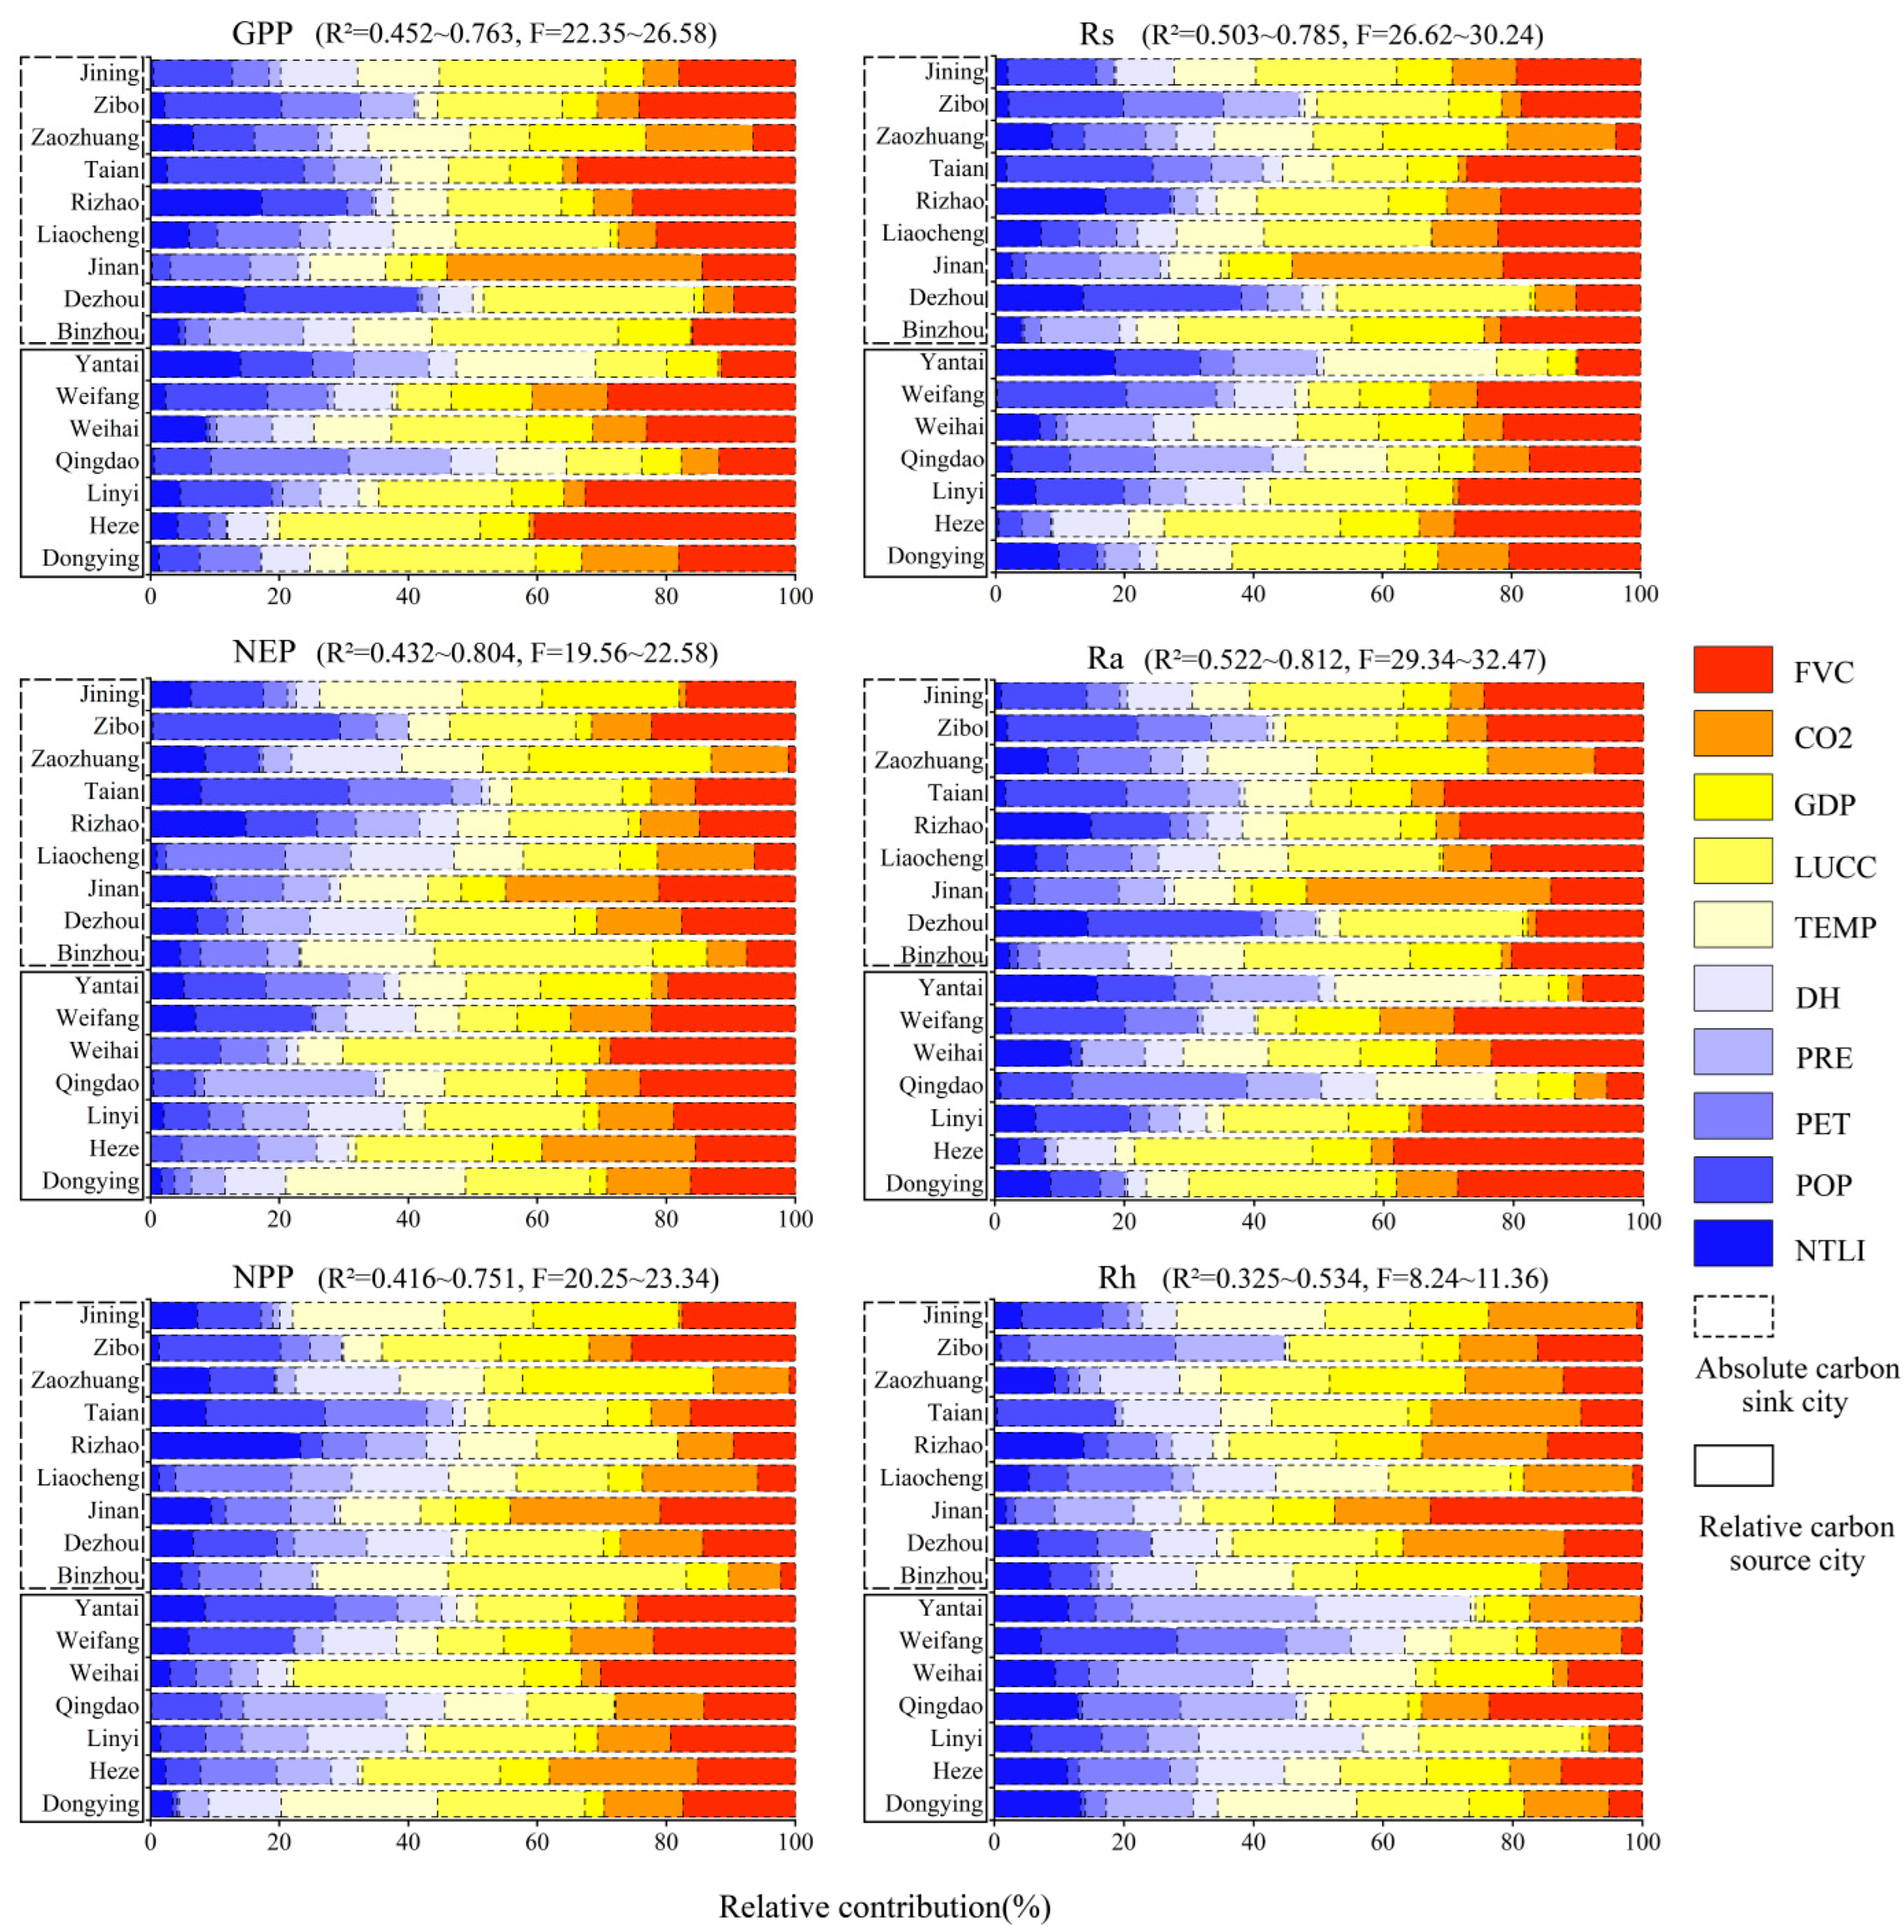
For different cities, the regression equations between various indicators and driving factors yielded R2 values ranging from 0.325 to 0.812, with F-values between 8.24 and 32.47, indicating the statistical significance of the regression equations. In cities with absolute carbon sinks, the dominant driving factor for all indicators in Binzhou and Dezhou was land-use change, with contribution rates ranging from 21.20% to 36.94%. In Rizhao and Tai’an, the carbon sink indicators were primarily driven by vegetation coverage and land-use change, while the carbon source indicators were driven by vegetation coverage and atmospheric CO2 concentration. In Jinan and Zaozhuang, each indicator was mainly controlled by a single factor, namely atmospheric CO2 concentration and GDP, contributing 23.26–36.59% and 17.83–29.61%, respectively.
In cities with relative carbon sources, the indicators in Weifang were primarily driven by vegetation coverage (21.93–29.09%). In Qingdao, the indicators were mainly influenced by precipitation and potential evapotranspiration, with contribution rates ranging from 18.25% to 26.99%. In Weihai and Linyi, carbon source indicators were driven by vegetation coverage and precipitation, while carbon sink indicators were influenced by land-use change and vegetation coverage. In Heze, both carbon source and carbon sink indicators were primarily driven by vegetation coverage and atmospheric CO2 concentration, with contribution rates ranging from 28.79% to 38.46% for carbon source indicators and 22.78% to 23.94% for carbon sink indicators. In Dongying, the carbon sink indicators were dominated by temperature (24.23–27.85%), while the carbon source indicators were controlled by land-use change (26.80–28.87%) (Figure 8).
(2)
Ex, En, and He of Driving Factor Weights
Absolute carbon sink cities. In absolute carbon sink cities, the Ex-weight of land-use changes for GPP, NEP, and NPP is higher than that of vegetation coverage. The En of the weight of vegetation coverage (6.37–8.82%) is relatively large across all indicators, with NPP having the highest value and Rs the lowest. The En of the weight of land-use changes for each indicator (4.54–9.91%) shows the most variation, with GPP having the highest value and Rh the lowest. For GPP, the En of atmospheric CO2 concentration weight (10.24%) is the largest, while for NEP, the En of atmospheric CO2 concentration weight (5.87%) is the smallest. Except for GPP, for the other indicators, the En of temperature weight (4.01–8.11%) is higher than that of precipitation (3.32–5.40%). The He for the weight of land-use changes in NPP and NEP (4.47% and 3.72%, respectively) is the largest. The He for the weight of vegetation coverage in Rh (5.68%) is the largest, while for NEP, it is the smallest (1.30%) (Table 4).
Relative carbon source cities. In relative carbon source cities, the Ex-weight of vegetation coverage is higher than that of land alteration. The En of the weight of land alteration (7.18–10.23%) is relatively large across all indicators, while the En of the weight of vegetation coverage (4.56–12.16%) shows the most variation. Except for Rh, the En of the weight for the other indicators is ranked as follows: temperature (7.33–9.70%) > precipitation (5.38–6.95%) > atmospheric CO2 concentration (3.71–6.76%). The excess entropy for the weight of land-use change and vegetation coverage is largest for Rs, at 4.06% and 2.32%, respectively (Table 4).

4. Discussion

4.1. Ramifications of Landscape Conversion on Carbon Release and Sequestration Variations in Shandong Province

This study thoroughly examined the characteristics and mechanisms of carbon source and sink changes in Shandong Province, confirming that land-use change is the main factor affecting carbon sources and sinks. However, when compared with other regions, it was found that Shandong Province, Henan Province, and Hebei Province, which share similar ecological backgrounds, exhibit the following characteristics in the mechanisms of carbon source and carbon sink changes. Coastal and inland regions differ in their carbon source and carbon sink characteristics due to variations in climate and soil conditions. As urbanization progresses and agricultural production methods evolve, changes in land use have a particularly significant impact on carbon sources and sinks [36,37]. Compared to inland regions such as Gansu Province and Chongqing Municipality, due to differences in geographical location and climate conditions, temperature and precipitation have the most significant impact on carbon source and sink changes [38,39]. This indicates that changes in carbon sources and sinks across different regions are not simply natural processes but the result of the interplay of multiple factors [33].
This study’s analysis further revealed that, between 2000 and 2020, land use in Shandong demonstrated notable spatial and temporal variations, particularly concerning agricultural land, urban expansion, and ecological restoration efforts [40]. On the one hand, industrial activities, dominated by coal-based energy consumption (e.g., power plants, steel, and petrochemical factories), constituted over 75% of provincial carbon emissions, with coal, coke, and electricity being the top three energy sources [41]. Agricultural production (10–15% of total emissions) was driven primarily by fertilizer application (56% of agricultural emissions) and diesel-powered machinery, while transportation and residential heating collectively contributed 10% of emissions due to urbanization-induced energy demand [42]. Land-use change directly amplified these emissions by enabling high-carbon activities; the rapid industrialization and urbanization in Shandong have led to the conversion of extensive farmland into industrial, mining, and residential areas, totaling approximately 11,200 km2. This shift has resulted in a decline in carbon density and the degradation of soil organic matter, such as humus [43]. The alteration of land use has compromised the original soil structure and its capacity to store carbon, thereby diminishing the soil’s carbon sequestration potential. While long-term agricultural lands typically absorb carbon dioxide through photosynthesis, contributing to biomass accumulation, the conversion of these lands into urban spaces severely limits their ability to sequester carbon. As green areas are replaced with impervious surfaces, the overall carbon sequestration capacity of the region is significantly weakened, contributing to higher carbon emissions.
Conversely, since the early 2000s, Shandong has made strides in forest conservation and afforestation initiatives. Efforts to revert cropland to forest and grassland have improved the biological environment, resulting in an increase in forest cover to 18.24% [44]. The expansion of forested areas, totaling 485 km2, has enhanced carbon density and facilitated the prolonged sequestration of carbon in soil organic compounds [45,46]. Through photosynthesis, trees capture substantial amounts of carbon in their leaves, trunks, and roots, thereby bolstering carbon storage. Furthermore, mature forests are particularly effective carbon sinks; as trees grow and die, they continue to sequester carbon over time [47]. Thus, the increase in forested areas and sustained ecological protection contributes to long-term carbon storage, moving beyond mere short-term carbon absorption.

4.2. Impact of the Dominant Drivers of Carbon Source/Sink Dynamics on Urban Ecological Security in Shandong Province

Land-use changes have had a significant impact on carbon sources/sinks in Shandong Province. On the urban scale, however, the dominant driving factors vary due to the rapid development of urbanization and differences in local climate characteristics. Shandong Province has a notably high per capita urbanization rate, which has accelerated carbon emissions and altered vegetation growth, ultimately impacting urban ecological security [48]. The results indicate that the dominant drivers of carbon sources/sinks vary across different spatial scales. In cities classified as absolute carbon sinks, such as Jinan and Zaozhuang, the dynamics of carbon sources and sinks are primarily driven by atmospheric CO2 levels and GDP growth. An increase in atmospheric CO2 enhances photosynthesis [49], boosting vegetation’s capacity to absorb carbon. However, economic growth also leads to increased industrialization and energy consumption, which heightens carbon emissions [50], resulting in a net increase in carbon sources.
In contrast, cities like Binzhou and Dezhou experience significant impacts from land-use changes on carbon dynamics. The transformation of farmland into urban development and the degradation of natural ecosystems reduce carbon sinks, especially when high-carbon storage environments, such as wetlands and forests, are transformed for construction [40,51]. This transformation leads to a markedly higher rate of carbon release in these areas.
In relative carbon source cities like Weifang, vegetation coverage is the key factor influencing carbon dynamics. The instability of forest shrubs and wetlands means that any reduction in vegetation cover not only weakens carbon sink functions but also exacerbates ecological issues such as soil erosion and water loss, threatening urban ecological security [17]. In Qingdao, the dynamics of carbon sources and sinks are influenced by precipitation and potential evapotranspiration. As a coastal city, fluctuations in precipitation directly affect vegetation growth, impacting carbon absorption and release [16]. Additionally, potential evapotranspiration affects water availability and plant growth; during drought conditions, this exacerbates carbon emissions and environmental stress [30]. In Dongying, temperature changes and landscape modifications are the primary drivers of carbon dynamics. Variations in temperature directly influence plant growth cycles and carbon absorption capabilities. While higher temperatures can promote vegetation growth, prolonged heat may lead to ecosystem degradation [52].

4.3. Research Gaps and Prospects

This study analyzes the spatiotemporal evolution of carbon sources/sinks in the terrestrial ecosystems of Shandong Province, focusing on the dominant characteristics and driving mechanisms. However, uncertainties remain in the research. On the one hand, as an important ecological barrier in eastern China, the diverse and overlapping ecosystem structures in Shandong increase the uncertainty in regional carbon sequestration assessments and the lack of sensitivity assessments, especially under the dual influence of climate change and human activities, which complicate the driving mechanisms of carbon sequestration [53]. On the other hand, the lack of field observation data for accuracy verification introduces potential errors in the results [54]. While this study employed a cloud model to quantify the contribution weights of various carbon emission drivers, it remains limited in capturing the interactive dynamics and cascading effects among these factors. Future research should prioritize examining the complex interdependencies between socioeconomic development, natural environmental shifts, and land-use transformations.
Therefore, future research should not only delve deeper into the mechanisms through which factors such as climate change and human activities affect regional carbon balance but also perform a sensitivity assessment, aiming to enhance the precision and accuracy of ecosystem carbon source/sink assessments. Such an exploration is essential to holistically unravel the systemic mechanisms governing carbon emissions and better decipher the inherent complexity of carbon emission processes.

5. Conclusions

(1)
From 2001 to 2020, carbon sources and carbon sinks in Shandong Province showed a fluctuating upward trend. The values decreased from the southwest to the northeast. In terms of spatial variation, it manifests as “significant increases in most areas, with scattered occurrences in the remaining areas.” The growth rates of GPP, NEP, and NPP were 15.55, 6.14, and 6.09 gCm−2a−1, respectively, while the growth rates of Rs, Ra, and Rh were 9.59, 9.47, and 0.07 gCm−2a−1, respectively. Due to significant respiratory activities, the overall terrestrial ecosystem in Shandong is characterized as a weak carbon sink.
(2)
The spatial dispersion of the dominant carbon source/sink characteristics in Shandong Province shows significant regional differentiation. It generally exhibits a distribution trend characterized by being a major carbon sink with some carbon sources. The province is mainly divided into absolute carbon sink cities (Jinan, Zibo, Rizhao, Jining, Liaocheng, Zaozhuang, Binzhou, Dezhou, and Tai’an) and relative carbon source cities (Weifang, Yantai, Weihai, Linyi, Qingdao, Heze, and Dongying). GPP is the dominant characteristic factor for carbon sink areas, widely distributed across the province, while Rs and GPP are the main driving factors for carbon source areas, concentrated along the eastern coast and southwestern inland.
(3)
Land-use modification is the key determinant driving changes in terrestrial ecosystem carbon sinks, with an average contribution rate of 21.90%. The variation in the driving force of land conversion shows the least spatial differentiation. Precipitation and land-use change are the main drivers influencing changes in carbon sources, with average contribution rates of 27.06% and 20.93%, respectively. Among these, the variation in the driving weight of land-use changes shows the smallest spatial differentiation.
(4)
The mechanisms underlying carbon source/sink changes vary significantly across cities. In absolute carbon sink cities, land-use changes and vegetation cover are the primary factors influencing carbon sinks; whereas in relative carbon source cities, vegetation cover and landscape changes have a more pronounced impact on carbon source variations. Particularly in absolute carbon sink cities, the scope and spatial variability of land-use changes are most pronounced, highlighting the influence of regional development disparities on carbon sinks.

Author Contributions

Conceptualization, writing—original draft, methodology, Xiaolong Xu; data, Junxin Zhao, Youheng Li and Ziqiang Lei; investigation, supervision, Shan Zhang and Hui Han; project administration, and funding acquisition, Fang Han. All authors have read and agreed to the published version of the manuscript.

Funding

This work is supported by Monitoring and Evaluation of Carbon Sinks in Natural Ecosystems of Shandong Province (Research and Construction of Carbon Measurement Model for Forest Land in Shandong Province) 2024, the Natural Science Foundation of Shandong Province (grant number: ZR2021MD080), and the National Natural Science Foundation of China (NSFC) Youth Program: Mechanistic Analysis of Consistency and Difference in the Distribution Patterns of Forest and Snow Lines on the Tibetan Plateau (grant number: 41401111).

Data Availability Statement

The data is contained within the article.

Conflicts of Interest

The authors declare no conflicts of interest.

Abbreviations

The following abbreviations are used in this manuscript:
GPPGross Primary Production
NPPNet Primary Production
NEPNet Ecosystem Productivity
RsTotal Ecosystem Respiration
RaAutotrophic Respiration
RhHeterotrophic Respiration
ExExpectation
EnEntropy
HeHypermetropy

References

  1. Church, J.; Clark, P.; Cazenave, A.; Gregory, J.; Jevrejeva, S.; Levermann, A.; Merrifield, M.; Milne, G.; Nerem, R.; Nunn, P.; et al. Climate Change 2013: The Physical Science Basis. Contribution of Working Group I to the Fifth Assessment Report of the Intergovernmental Panel on Climate Change; Sea Level Change; Cambridge University Press: Cambridge, UK; New York, NY, USA, 2013; pp. 1138–1191. [Google Scholar]
  2. Schimel, D.; House, J.; Hibbard, K.; Bousquet, P.; Ciais, P.; Peylin, P.; Braswell, B.H.; Apps, M.J.; Baker, D.; Bondeau, A.; et al. Recent patterns and mechanisms of carbon exchange by terrestrial ecosystems. Nature 2001, 414, 169–172. [Google Scholar] [CrossRef]
  3. Piao, S.L.; Yue, C.; Ding, J.; Guo, Z. Perspectives on the role of terrestrial ecosystems in the “carbon neutrality” strategy. Sci. China Earth Sci. 2022, 65, 1178–1186. [Google Scholar] [CrossRef]
  4. Liu, K.; Zhang, H.; Kong, L.H.; Qiao, Y.J.; Hu, M.T. An overview of terrestrial ecosystem carbon sink assessment methods towards achieving carbon neutrality in China. Acta Ecol. Sin. 2023, 43, 4294–4307. [Google Scholar] [CrossRef]
  5. Houghton, R.A.; Hackler, J.; Lawrence, K.T. The U.S. carbon budget: Contributions from land- use change. Science 1999, 285, 574–578. [Google Scholar] [CrossRef]
  6. Kumar, J.I.N.; Patel, K.; Kumar, R.N. An assessment of carbon stock for various land use system in Aravally mountains, western India. Mitig. Adapt. Strateg. Glob. Change 2010, 15, 811–824. [Google Scholar] [CrossRef]
  7. Lu, W.K.; Li, M.; Cheng, J.X.; Dou, X.D. Spatio-temporal characteristics and applicability of carbon source/sink in Yunnan Province based on BEPS model. Acta Ecol. Sin. 2024, 44, 1441–1455. [Google Scholar]
  8. Tu, H.Y.; Jiapaer, G.; Yu, T.; Li, X.; Chen, B.J. Analysis of spatio-temporal variation characteristics and influencing factors of net primary productivity in terrestrial ecosystems of China. Acta Ecol. Sin. 2023, 43, 1219–1233. [Google Scholar]
  9. Zhao, N.; Zhou, L.; Zhuang, J.; Wang, Y.L.; Zhou, W.; Chen, J.J.; Song, J.; Ding, J.X.; Chi, Y.G. Integration analysis of the carbon sources and sinks in terrestrial ecosystems, China. Acta Ecol. Sin. 2021, 41, 7648–7658. [Google Scholar] [CrossRef]
  10. Chen, Z.; Yu, G.R.; Zhu, X.J.; Zhang, L.M.; Wang, Q.F. A dataset of carbon flux component of typical terrestrial ecosystems in Asian region (1990–2015). Sci. Data Bank 2021, 6, 123–130. [Google Scholar] [CrossRef]
  11. Hao, L.; Zhai, Y.G.; Qi, W.C.; Lan, Q.Q. Spatial-temporal Dynamics of Vegetation Carbon Sources/sinks in Inner Mongolia from 2001 to 2020 and Its Response to Climate Change. Ecol. Environ. 2023, 32, 825–834. [Google Scholar]
  12. Wang, F.; Cao, Y.Q.; Zhou, S.H.; Fan, S.B.; Jiang, X.M. Estimation of vegetation carbon sink in the Yellow River Basin ecological function area and analysis of its main meteorological elements. Acta Ecol. Sin. 2023, 43, 2501–2514. [Google Scholar] [CrossRef]
  13. Li, Y.Y.; Zhang, S. Spatio-temporal evolution of urban carbon emission intensity and spatiotemporal heterogeneity of influencing factors in China. China Environ. Sci. 2023, 43, 3244–3254. [Google Scholar]
  14. Zhan, S.Q.; Zhang, X.Y.; Chen, X.Y.; Zhou, Y.Z.; Long, L.L.; Xu, Y.F. Eeffects of landuse change on spatial and temporal patterns of carbon sources/sinks in Huainan mining area from 2000 to 2020. Bull. Soil. Water Conserv. 2023, 43, 310–319. [Google Scholar]
  15. Sharma, P.; Rai, S.C. Carbon sequestration with land-use cover change in a Himalayan watershed. Geoderma 2007, 139, 371–378. [Google Scholar] [CrossRef]
  16. Liu, Y.H.; Zhang, J.; Zhang, C.H.; Xiao, B.; Liu, L.; Cao, Y. Spatial and temporal variations of vegetation net primary productivity and its responses to climate change in Shandong Province from 2000 to 2015. Chin. J. Ecol. 2019, 38, 1464–1471. [Google Scholar]
  17. Xiao, L.; Zhao, X.G.; Xu, H.X. Dynamic changes and driving factors analysis of carbon source and carbon sink in Shandong province. J. Shaanxi Norm. Univ. (Nat. Sci. Ed.) 2013, 41, 82–87. [Google Scholar]
  18. Su, H.; Li, J.K.; Liu, K.; Chen, X.; Yang, Y.; Shao, Z.L. Relationship between net carbon sequestration change and cultivated land use benefit of cultivated land use in Shandong Province. Sci. Geogr. Sin. 2024, 44, 864–873. [Google Scholar]
  19. Department of Natural Resources of Shandong Province. Notice on Strengthening the Management of the Red Line of Ecological Protection. Available online: https://www.shanghai.gov.cn/202509bgtwj/20250508/6ec84d7ac84949e2bb471b967ac300d6.html (accessed on 6 January 2023).
  20. Pei, Z.Y.; Zhou, C.P.; Ouyang, H.; Yang, W.B. A carbon budget of alpine steppe area in the Tibetan Plateau. Geogr. Res. 2010, 29, 102–110. [Google Scholar]
  21. Wei, H.; Wu, L.H.; Yang, D.N.; Chen, D.; Xiong, L.S. Spatiotemporal dynamic characteristics and driving impact mechanisms of carbon sources and sinks in Chinese cropland ecosystem. Acta Ecol. Sin. 2025, 45, 7277–7296. [Google Scholar]
  22. Christopher, B.F.; Michael, J.B.; James, T.R.; Paul, F. Primary Production of the Biosphere: Integrating Terrestrial and Oceanic Components. Science 1998, 281, 237–240. [Google Scholar] [CrossRef]
  23. Jia, Y.Y.; Qi, X.X.; Huang, R.; Zhou, Y. Spatiotemporal variation and driving factors of vegetation coverage in Shanxi Province, China. Chin. J. Appl. Ecol. 2024, 35, 1073–1082. [Google Scholar]
  24. Li, D.Y.; Liu, C.Y. Study on the Universality of the Normal Cloud Model. Eng. Sci. 2004, 6, 28–34. [Google Scholar]
  25. Wang, Z.; Han, F.; Li, C.R.; Shen, W.X.; Yang, Z.J.; Li, K.; Yao, Q. Analysis of vertical differentiation of vegetation in Taishan World Heritage site based on cloud model. Sci. Rep. 2024, 14, 10948. [Google Scholar] [CrossRef]
  26. Mu, H.X.; Han, F.; Tang, X.M.; Wang, Z.Y.; Wang, Z. Comparison and analysis of timberline and treeline distribution height and influencing factors of Baima Snow Mountain and Bogda Mountain based on cloud model. Geogr. Res. 2023, 42, 1941–1956. [Google Scholar]
  27. Wang, Z.Y.; Han, F.; Li, C.R.; Li, K.; Mu, H.X.; Wang, Z. Distribution characteristics and geographical interpretation of the upper limit of montane deciduous broad-leaved forests in the eastern monsoon region of China. Acta Geogr. Sin. 2024, 79, 240–258. [Google Scholar]
  28. Elvidge, C.D.; Baugh, K.E.; Kihn, E.A.; Kroehl, H.W.; Davis, E.R.; Davis, C.W. Relation between satellite observed visible-near infrared emissions, population, economic activity and electric power consumption. Int. J. Remote Sens. 1997, 18, 1373–1379. [Google Scholar] [CrossRef]
  29. Du, H.B.; Yang, S.; Li, Z.Y.; Guo, Z.C.; Fan, Q.Y. Spatio-temporal Characteristics and Influencing Factors of Carbon Sources/Sinks in the Yangtze River Delta Under Carbon Neutrality Target. Environ. Sci. 2024, 45, 6848–6857. [Google Scholar]
  30. Zhang, X.Q.; Chen, Y.N.; Zhang, Q.F.; Xia, Z.H.; Hao, H.C.; Xia, Q.Q. Potential evapotranspiration determines changes in the carbon sequestration capacity of forest and grass ecosystems in Xinjiang, Northwest China. Glob. Ecol. Conserv. 2023, 48, 2351–9894. [Google Scholar] [CrossRef]
  31. Dai, E.F.; Huang, Y.; Wu, Z.; Zhao, D.S. Spatial-temporal features of carbon source-sink and its relationship with climate factors in Inner Mongolia grassland ecosystem. Acta Geogr. Sin. 2016, 71, 21–34. [Google Scholar]
  32. Yang, Z.L.; Feng, Y.S.; Zhang, T.B.; Wu, H.; Zhang, C.; Xie, H.J.; Li, J. Spatiotemporal Variation Characteristics of Vegetation Carbon Use Efficiency and Its Driving Factors in Southwest China over the Past 20 Years. Clim. Environ. Res. 2024, 29, 267–280. (In Chinese) [Google Scholar]
  33. Ma, X.Z.; Wang, Z. Progress in the study on the impact of land-use change on regional carbon sources and sinks. Acta Ecol. Sin. 2015, 35, 5898–5907. [Google Scholar]
  34. Yang, Y.H.; Shi, Y.; Sun, W.J. Terrestrial carbon sinks in China and around the world and their contribution to carbon neutrality. Sci. China Life Sci. 2022, 52, 534–574. [Google Scholar]
  35. Liu, C.G.; Sun, W.; Zhang, L.C. Spatio-temporal pattern of coupling coordination degree between carbon emissions and vegetation cover and its influencing factors of the Yangtze River Delta. Sci. Geogr. Sin. 2023, 43, 142–151. [Google Scholar]
  36. Zhao, Y.X.; Qie, X.; Yang, Q.F. Spatiotemporal Evolution of Ecosystem Carbon Sources/Sinks in Hebei Province from 2000 to 2020. J. Change River Sci. Res. Inst. 2025, 42, 77–85. [Google Scholar]
  37. Zhang, M.Y.; Wei, H.T.; Xu, Q.; Chai, Z.L. Spatio-temporal Evolution Characteristics and Driving Factors of Carbon Sources/Sinks in Henan Province. Geospat. Inf. 2025, 23, 51–56. [Google Scholar]
  38. Liu, H.; Wei, X.P. Spatial-temporal Evolution of Carbon Source/Sink and Its Influencing Factors in Chongqing Functional Area. Environ. Sci. 2025, 1–22. [Google Scholar] [CrossRef]
  39. Li, D.W.; Li, L. Driving factors and decoupling effects of agricultural carbon emission in Gansu Province under the background of ‘double carbon’. Anhui Agric. Sci. Bull. 2023, 29, 171–178. [Google Scholar]
  40. Wei, H.; Zhao, W.W.; Zhang, X.; Wang, X.Z. Regional ecosystem service value evaluation based on land use changes: A case study in Dezhou, Shandong Provience, China. Acta Ecol. Sin. 2017, 37, 3830–3839. [Google Scholar] [CrossRef]
  41. Hu, Y.F.; Ming, T.; Chai, C.F. Effects of Land Use Change on Spatial and Temporal Evolution Pattern of Carbon Emissions in Shandong Province. China Transp. Rev. 2024, 46, 167–174. [Google Scholar]
  42. Gong, W.F.; Qi, X.H.; Wang, Y. Effects of the Driving Factors of Carbon Emission in Shandong Province. J. Southwest Pet. Univ. (Soc. Sci. Ed.) 2020, 22, 11–20. [Google Scholar]
  43. Wang, C.L.; Liu, H.F.; Wang, H.J.; Zhao, X.Q.; Cui, Y.J.; Wang, Z.H.; Zhan, J.C. Spatial and Temporal Changes in Soil Carbon Storage in the Lower Yellow River Basin, Shangdong Province. Earth Environ. 2014, 42, 228–237. [Google Scholar]
  44. Department of Natural Resources of Shandong Province. Notice on the Issuance of the “14th Five-Year” Forestry Protection and Development Plan of Shandong Province. Available online: http://www.shandong.gov.cn/art/2022/1/5/art_98993_10331552.html (accessed on 31 December 2021).
  45. Zhu, J.H.; Tian, Y.; Li, Q.; Liu, H.Y.; Guo, X.Y.; Tian, H.L.; Liu, C.F.; Xiao, W.F. The current and potential carbon sink in forest ecosystem in China. Acta Ecol. Sin. 2023, 43, 3442–3457. [Google Scholar] [CrossRef]
  46. Yang, J.; Xie, B.P.; Zhang, D.G. Spatio-temporal evolution of carbon stocks in the Yellow River Basin based on InVEST and CA-Markov models. Chin. J. Eco-Agric. 2021, 29, 1018–1029. [Google Scholar]
  47. Zhang, Y.; Meng, N.; Jiang, Y.F. Coupling and long-term change characteristics analysis of forest carbon sequestration and forestry economic development in China. J. Beijing For. Univ. 2022, 44, 129–141. [Google Scholar]
  48. Wang, Y.Q.; Tan, D.M.; Zhang, J.T.; Meng, N.; Han, B.L.; Ouyang, Z.Y. The impact of urbanization on carbon emissions: Analysis of panel data from 158 cities in China. Acta Ecol. Sin. 2020, 40, 7897–7907. [Google Scholar] [CrossRef]
  49. Liu, J.J.; Jiang, T.L.; Yang, X.Y.; Sun, J.; Liu, G.F. Analysis of CO2 Column Concentration in Shandong Province Based on OCO-2/OCO-3 Data. J. Hebei Univ. Environ. Eng. 2023, 33, 74–78. [Google Scholar]
  50. Jiang, J.K.; Zhu, S.L.; Cao, J.C.; Li, X.D.; Xue, Y.W. Analysis of Coupling Coordination between New Urbanization and Carbon Emission Level: A Case Study of Shandong Province. Ecol. Econ. 2023, 39, 76–82. [Google Scholar]
  51. Song, G.; Han, F.; Xu, J.W.; Yang, Z.J.; Mu, H.X.; Wang, Z.Y.; Wang, Z. Distribution suitability analysis of the tree species of shelter forest in coastal area of Shandong based on LandUSEM model. J. Nanjing For. Univ. (Nat. Sci. Ed.) 2022, 47, 42–50. [Google Scholar]
  52. Roy, S.; Kapoor, R.; Mathur, P. Revisiting Changes in Growth, Physiology and Stress Responses of Plants under the Effect of Enhanced CO2 and Temperature. Plant Cell Physiol. 2024, 65, 4–19. [Google Scholar] [CrossRef]
  53. Zhao, L.; Zhang, C.; Wang, Q. Climate extremes and land use carbon emissions: Insight from the perspective of sustainable land use in the eastern coast of China. J. Clean. Prod. 2024, 452, 142219. [Google Scholar] [CrossRef]
  54. Liu, X.Y.; Zhao, Y.C.; Qin, F.L.; Shi, X.S. Study on uncertainty sources of century model for simulating soil organic carbon dynamics of typical cinnamon soil in Shandong province. Quat. Sci. 2014, 34, 865–872. [Google Scholar]
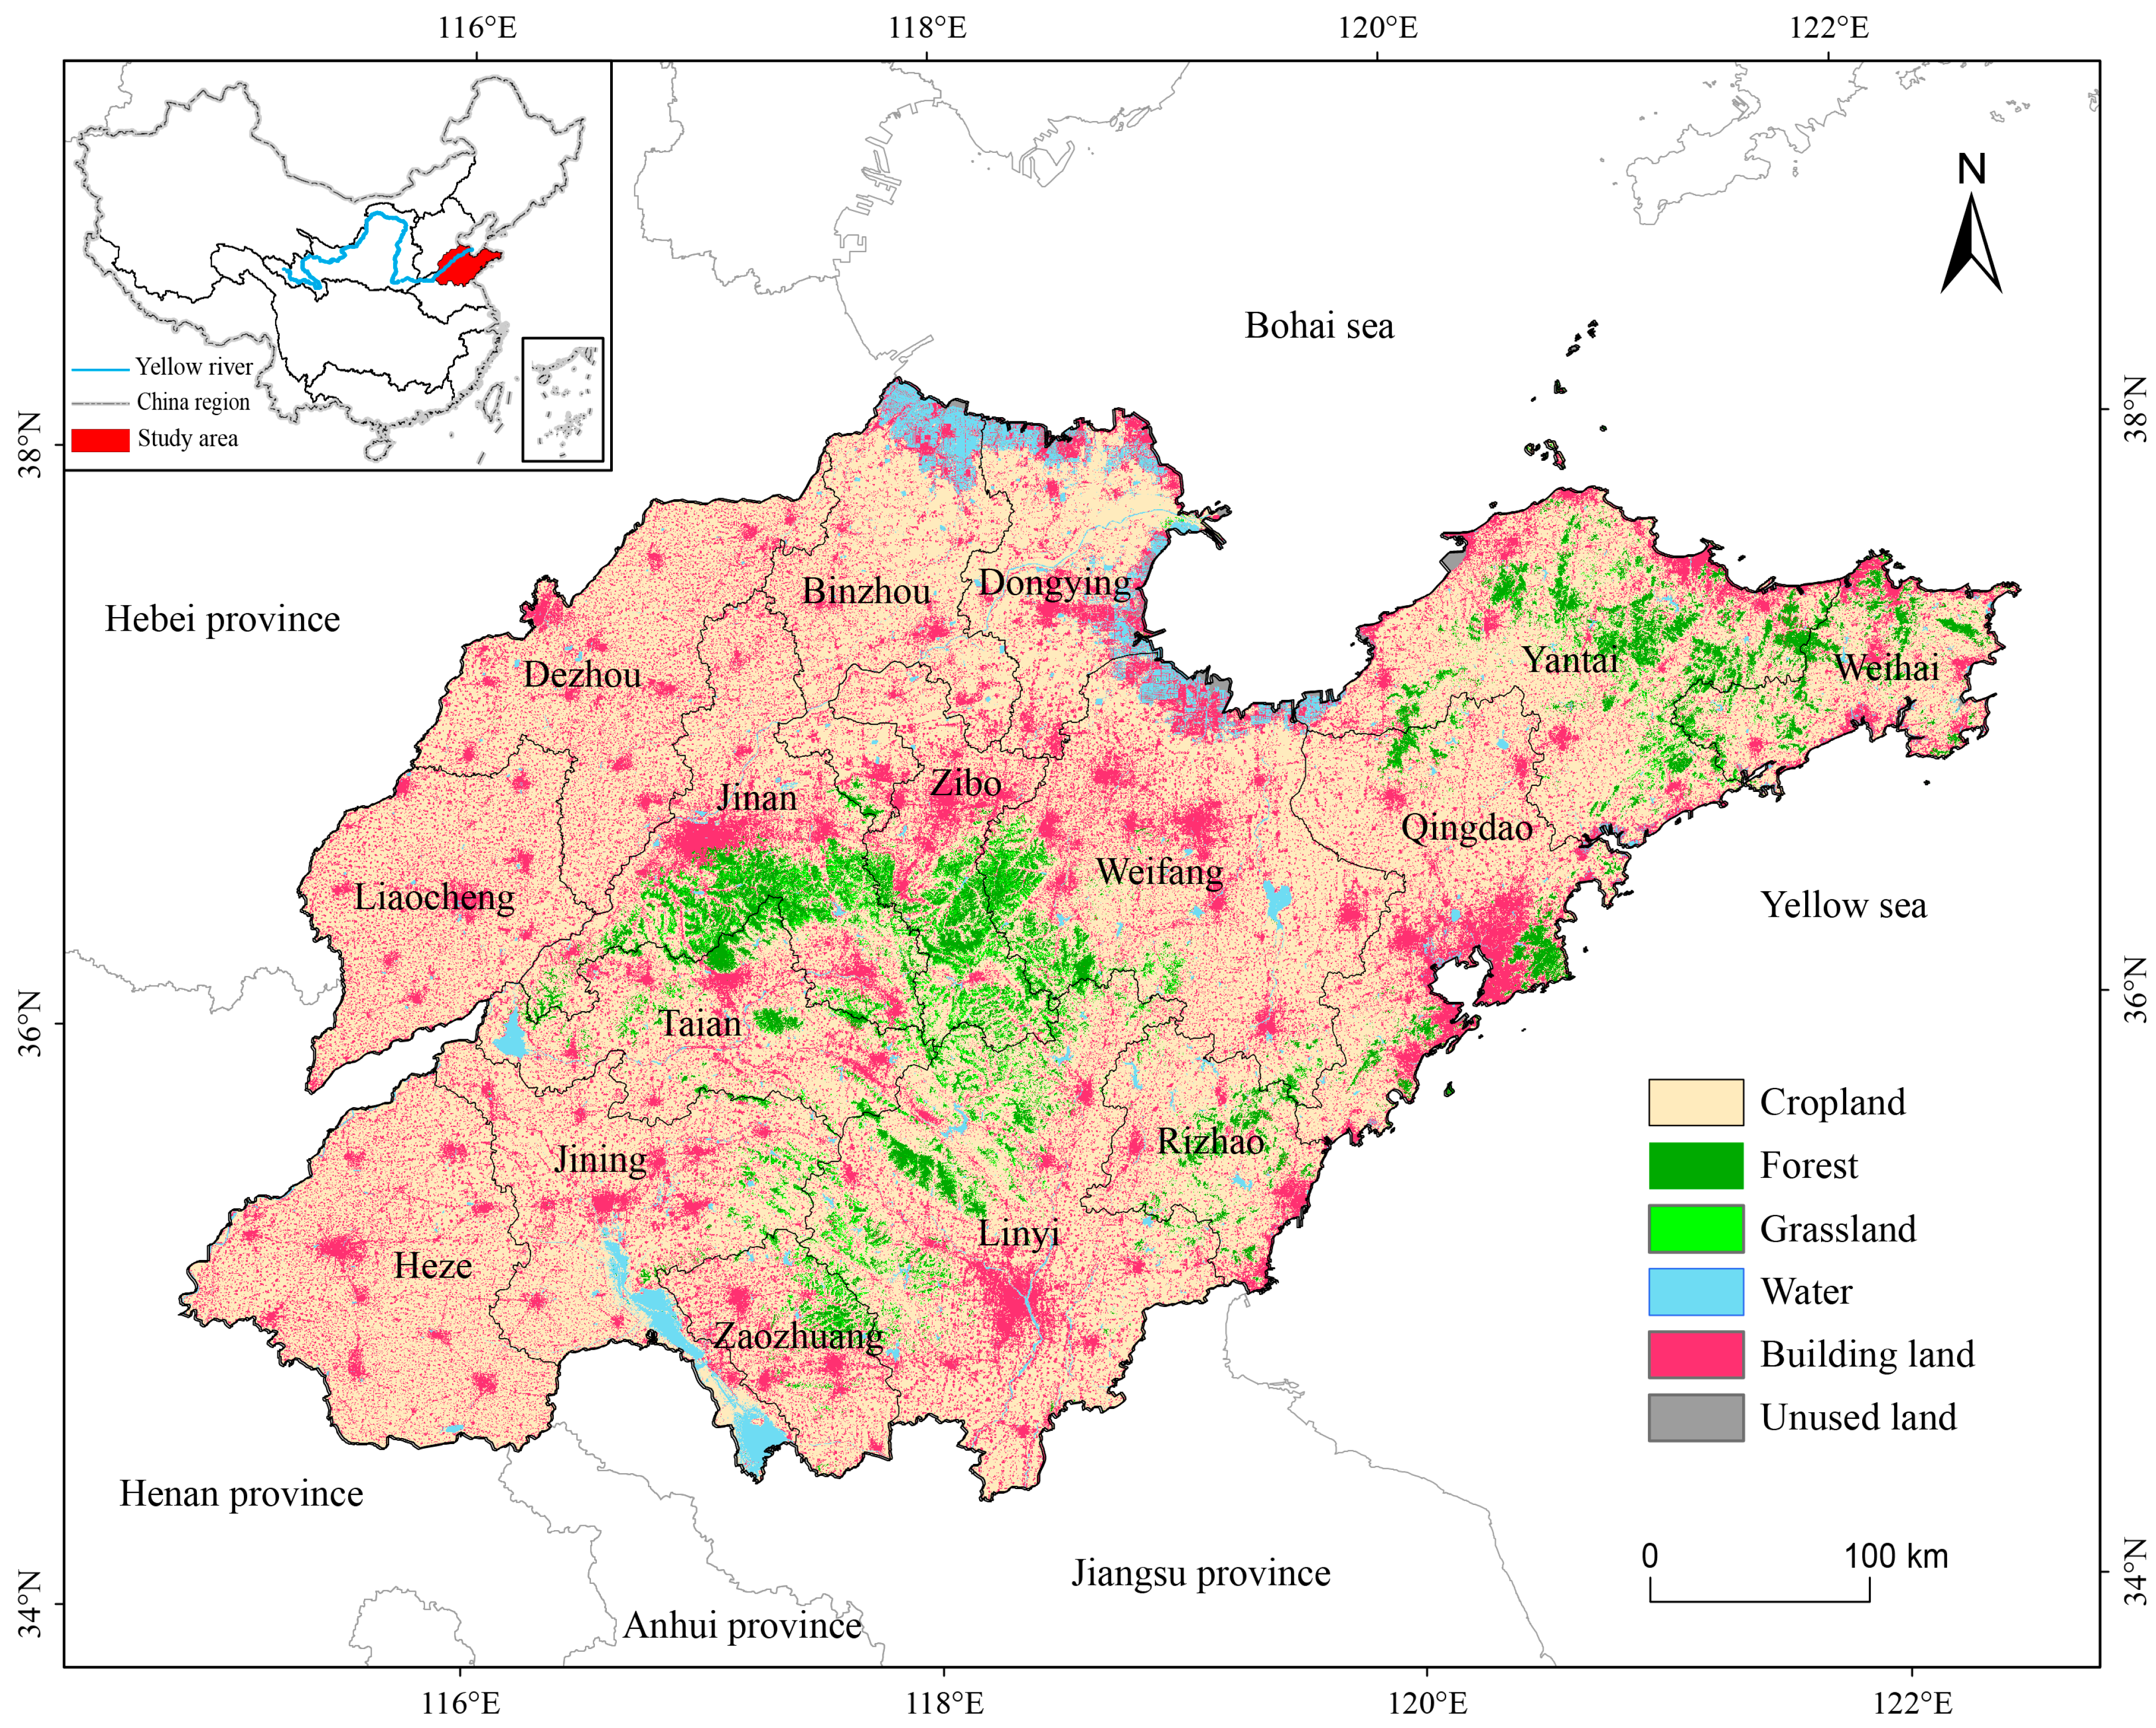
Figure 1. Schematic of the study area.
Ijgi 14 00329 g001
Figure 2. Shifts in the spatiotemporal allocation of carbon flux sources and storage zones in land ecosystems of Shandong Province, 2001–2020. Note: k denotes the average growth rate in gCm−2a−1.
Ijgi 14 00329 g002
Figure 3. Significant characteristics of carbon source/sink variations in continental ecosystems in Shandong Province, 2001–2020.
Ijgi 14 00329 g003
Figure 4. Statistics on inter-annual variation of carbon sources/sinks in continental ecosystems in Shandong Province, 2001–2020. Note: k denotes the average growth rate in %.
Ijgi 14 00329 g004
Figure 5. Characteristic patterns of carbon source/sink master control in continental ecosystems of Shandong Province.
Ijgi 14 00329 g005
Figure 6. Regional master indicators of carbon sources/sinks in continental ecosystems of Shandong Province.
Ijgi 14 00329 g006
Figure 7. Relative contribution of carbon source/sink drivers in continental ecosystems of Shandong Province. Note: * and ** represent significance tests passing 0.05 and 0.001, respectively.
Ijgi 14 00329 g007
Figure 8. Contribution of carbon source/sink drivers in urban continental ecosystems.
Ijgi 14 00329 g008
Table 1. Carbon source/sink master control model for Shandong Province.
RegionGenreParadigm
Carbon sink areaGPP strong master controlθNEP > 0θGPP > 0θRs < 0
RS strong master controlθNEP > 0θGPP < 0θRs < 0
GPP weak master controlθNEP > 0θGPP > 0θRs > 0
Carbon source areaGPP strong master controlθNEP < 0θGPP < 0θRs < 0
RS weak master controlθNEP < 0θGPP < 0θRs > 0
RS strong master controlθNEP < 0θGPP > 0θRs > 0
Table 2. Method and basis for driver selection.
Driving FactorBasis of Selection
Night LightsCorrelation between nighttime light levels and carbon emissions [28].
Population DensityHigh population density distribution is a key factor contributing to the increasing disparity between carbon output and carbon absorption [29].
Potential EvapotranspirationPotential evapotranspiration is a key natural factor influencing ecosystem carbon use efficiency [30].
Precipitation Precipitation effects on plant metabolism are directly related [31].
Daylight HoursSignificant correlation between sunshine duration and vegetation carbon utilization rate [32].
TemperaturesThe effect of temperature on plant metabolism is directly related [31].
Land UseThe transformation of land use has a profound impact on the carbon cycle within continental ecosystems, functioning as both a carbon emitters/absorber [33].
GDPRapid economic growth is a key factor in widening the gap between carbon emissions and carbon sinks [29].
Atmospheric CO2 ConcentrationRising atmospheric CO2 concentration and other important factors affecting the strength of terrestrial carbon sinks [34].
Fractional Vegetation CoverCoupling harmonization is generally higher in areas where the combined vegetation cover rating is higher than the combined carbon emissions rating [35].
Table 3. Ex, En, and He of the importance coefficients of carbon source/sink drivers in continental ecosystems of Shandong Province.
Weights (%)Driving Factors
NTLIPEOPETPREDHTEMPLUCCGDPCO2FVC
ExGPP6.811.44.615.756.866.5530.246.636.6914.48
NEP4.819.657.237.626.6210.2818.088.3210.6416.75
NPP6.079.116.617.417.099.6718.608.6310.8615.94
Rs6.4610.676.567.325.029.5617.578.918.2219.73
Ra6.4710.867.436.385.009.2816.427.917.9022.35
EnGPP6.542.924.077.371.314.7112.014.334.946.20
NEP4.407.555.774.776.797.197.786.576.246.34
NPP4.807.025.554.226.568.048.296.606.437.77
Rs5.739.845.235.423.506.568.045.096.336.28
Ra5.499.946.444.743.576.417.574.656.917.26
Rh4.515.956.718.736.917.856.667.606.877.80
HeGPP2.374.421.912.380.372.432.582.380.941.58
NEP1.052.561.513.272.712.612.993.712.302.62
NPP2.822.340.922.452.992.033.184.221.762.56
Rs0.774.181.891.580.960.812.822.374.682.37
Ra1.553.852.040.271.352.221.431.245.650.88
Rh1.181.501.252.391.751.990.661.571.283.66
Table 4. Ex, En, and He of the weighting factors of carbon source/sink drivers in absolute/relative carbon source cities.
Weights (%)Absolute Carbon Sink CitiesRelative Carbon Source Cities
GPPNEPNPPRsRaRhGPPNEPNPPRsRaRh
ExNTLI6.066.708.026.525.955.725.132.393.576.397.1410.2
POP12.1710.289.0011.3711.717.098.838.859.249.769.766.33
PET7.328.197.736.847.587.477.406.005.166.197.259.48
PRE5.486.446.416.486.304.836.189.148.698.396.4914.65
DH5.246.746.143.904.349.116.656.478.316.465.8511.66
TEMP9.3310.9811.538.238.758.767.999.387.2911.279.9610.06
LUCC19.0017.0717.3418.8017.0216.6319.0119.3920.2215.9815.6611.77
GDP6.909.2210.669.357.9611.088.547.166.018.347.847.51
CO29.7410.7210.6310.189.3817.026.5310.5311.165.696.009.60
FVC18.7613.6612.5218.3321.0212.3023.7520.7120.3421.5324.068.73
EnNTLI5.694.035.175.715.624.364.442.682.615.765.342.93
POP8.629.227.029.309.025.195.295.387.076.385.756.87
PET5.016.276.275.114.756.836.435.074.225.248.486.28
PRE4.393.323.544.273.375.406.286.595.386.956.508.29
DH4.007.747.232.603.904.871.325.614.973.892.889.91
TEMP4.246.976.564.684.018.117.336.978.037.969.707.60
LUCC9.917.978.339.139.374.549.277.187.979.7910.237.43
GDP4.708.679.466.015.008.442.074.324.074.014.226.06
CO210.245.876.468.169.866.175.576.766.193.714.085.51
FVC8.237.288.826.377.157.3711.024.565.526.3212.167.61
EnNTLI2.121.803.960.911.260.651.650.431.042.850.090.65
POP1.593.351.942.842.001.571.040.631.060.840.722.70
PET2.091.411.011.442.173.002.991.081.330.594.262.75
PRE0.521.031.021.241.501.821.244.693.422.382.030.87
DH0.372.852.770.301.180.990.631.911.430.380.952.36
TEMP1.621.532.620.881.972.011.055.302.903.102.591.72
LUCC1.613.724.471.331.660.222.163.192.984.063.013.41
GDP2.203.182.093.532.542.500.672.661.501.661.361.53
CO26.372.642.015.305.952.030.883.123.401.261.520.68
FVC1.781.302.493.041.335.681.610.781.132.322.111.96
Disclaimer/Publisher’s Note: The statements, opinions and data contained in all publications are solely those of the individual author(s) and contributor(s) and not of MDPI and/or the editor(s). MDPI and/or the editor(s) disclaim responsibility for any injury to people or property resulting from any ideas, methods, instructions or products referred to in the content.