1. Introduction
Nowadays, the digital humanities (DH) are using cutting-edge tools and technologies to answer age-old questions, posed within their various disciplinary traditions. The study of chronological and spatial variation is the very essence of disciplines such as history and geography, which have always taken advantage of various visualisation techniques to analyse information and communicate knowledge in more efficient ways.
Traditional narratives in the humanities are mostly qualitative, based on historical sources, be they textual or material, which often pose significant challenges in their translation into computable data [
1,
2]. Many times, they use terminology that is laden with ideological connotations or categories and concepts that change across time and borders. Precision can vary hugely among conflicting versions or interpretative traditions. These idiosyncrasies of historical studies can hardly be avoided, since they are part of their deepest core.
In order to address them, it is essential to consider the contributions of some studies that have explored this topic from a number of perspectives.
Maximilian Schich has discussed the challenge of developing a systematic science of art and culture and argues for a multidisciplinary approach that integrates qualitative research and observation with methods from computation, natural science, and information design. This approach allows for a deeper and more holistic understanding of AH and culture, transcending the boundaries of specialised disciplines. Schich stresses the importance of using visualisations and figures as a means of communication between different communities of practice. He also emphasises that the growth of the field of AH is exponential, due to the rapid increase in the number of cultural artefacts and the size of the creative industry. This poses significant challenges for the discipline, which must evolve to handle the increasing complexity and volume of cultural data, adopting a variety of approaches, both qualitative and quantitative [
3]. This integrated and interdisciplinary approach is essential to address the challenges posed by the complexity and exponential growth of cultural data.
Fabio Mariani focuses on the challenges of representing “VISU” complexity (vagueness, incompleteness, subjectivity, and uncertainty), especially concerning art provenance data, in the case of Linked Open Data (LOD). He identifies and classifies VISU factors that complicate provenance records, analysing current community standards for provenance data and proposing solutions for representing VISU provenance information. The researcher emphasises the importance of preserving the nuances of such information, including insecure data, by converting it into a computer-readable format. Mariani also stresses that vagueness and incompleteness are intrinsic characteristics of historical data, which complicates their representation and analysis. Subjectivity and uncertainty are inevitable limitations of historical sources and subsequent interpretations. To address these challenges, the author proposed a framework that allows for the inclusion of these features in LOD, ensuring that nuances and uncertainties remain intact. His approach guarantees the accuracy, reliability and ethical use of cultural heritage (CH) data [
4]. As we will explain below, for the ClioViz project, the VISU concepts are closely related to the three problems at the core of our work: heterogeneity, ambiguity, and variable granularity. Addressing the complexities of provenance data is a significant contribution to the ongoing discussion on the challenges of data representation in DH. Mariani thus provides a framework for developing more robust and nuanced approaches to handling historical information in digital formats.
Alejandro Benito-Santos addresses the visualisation of uncertainty in the field of HD, focusing specifically on the challenges of name normalisation in historical datasets. By developing a visualisation panel to assist in the task of name normalisation and incorporating the uncertainty induced by a linguistic algorithm, he highlights the importance of incorporating and visualising imperfections in the data to avoid misinterpretations and biases. He also emphasises the need for a balance between algorithmic techniques and user interface design in DH systems. This balance is essential to ensure that visualisations are accurate and accessible to users, allowing for a more accurate and nuanced interpretation of historical data. In addition, Benito-Santos identifies several inherent problems with historical data that make it difficult to analyse and interpret. Among these complexities are gaps, errors, and misspellings in historical documents, variability in the spelling of proper names, and the incompleteness of datasets. These inconsistencies can arise from various stages of processing, such as digitisation, curation, or annotation, and must be carefully considered when working with historical data [
5]. He advocates for the importance of visualisation techniques that explicitly represent these imperfections to avoid misinterpretations and ensure a more accurate historical analysis. By integrating these approaches into the project’s line of research, ClioViz aims to develop a more robust and nuanced framework for handling historical information in digital formats, ensuring the accuracy, reliability and ethical use of CH data.
Finally, Patricia Martin-Rodilla and Cesar Gonzalez-Perez introduce a conceptual framework utilising the ConML modelling language to address ontological and epistemic vagueness within digital humanities. Recognising the shortcomings of existing modelling methods in depicting ambiguous information, particularly in historical settings, the authors offer implementation guidelines for nonrelational databases. Their framework was tested through the DICTOMAGRED project, which involved the examination of Arabic historical documents. Significant findings indicate that ConML’s features, such as certainty qualifiers and abstract enumerated items, successfully capture vagueness, thereby improving data-querying capabilities without major performance drawbacks. The study highlights the importance of explicitly representing vagueness in humanities research to further knowledge development [
6].
The research team from which the ClioViz project was born originated with the SILKNOW project [
7], funded by the European Commission, whose objective was the conservation and promotion of silk textile heritage through computer systems. The main contribution of the group in SILKNOW was the development of STMaps [
8], a cross-platform visualisation tool based on ontologies for spatio-temporal data, which uses ring representations, interactive timelines, and layered visualisations to analyse temporal evolutions. Subsequently, the SeMap project [
9] focused on optimising access to the CER.es digital catalogue through spatio-temporal maps with semantic features. Through the refinement of CER.es data using the CIDOC-CRM ontology, SeMap simplified complex terminologies and efficiently geolocated objects [
10].
However, during the SeMap research, multiple challenges were identified in the visualisation of historical data aggregated to the CER.es repository. ClioViz was born to extract and synthesise information from large CH datasets into visual forms that combine scientific visualisations and interactive maps. Focused on the visualisation of complex multi-spatial and multi-temporal variables, it studies the application of geographic information system (GIS) visualisation strategies and scientific visualisations specific to DV and DS. The application of DV techniques and tools in the GLAM field is postulated as a fundamental element for improving the understanding, appreciation, and protection of CH [
11].
For all these reasons, the objectives of this article are to present the challenges posed when geocoding spatial data from AH data; to present the methodology used to deal with these challenges (ambiguity or uncertainty, granularity, and heterogeneity); to compare the variable accuracy or efficiency of geocoding by comparing Nominatim, ArcGIS, and GeoNames APIs; and the visualisation of spatial data with multidimensional maps and interactive graphics, taking the data on the Museo de América as a case study.
To achieve our goals, we formulated the following five questions: RQ1. How accurate is the Nominatim API when applied to Museo de América data subset? RQ2. How accurate is the ArcGIS API for the same subset? RQ3. How accurate is the GeoNames API for the same subset? RQ4. When comparing the accuracy of the Nominatim, ArcGIS, and GeoNames APIs, which one is most appropriate for georeferencing the spatial data in the subset? RQ5. Which countries are those cultural objects originally from, as registered at CER.es?
These research questions are crucial for advancing the digital humanities and enhancing cultural heritage management for several reasons. First, they help address methodological challenges. The digitisation of cultural heritage and integration of dispersed spatial data pose significant technical and methodological hurdles. These questions specifically address issues such as the ambiguity, uncertainty, granularity, and heterogeneity of historical spatial data, which are common challenges for GLAM institutions and researchers. Second, the questions improve the evaluation of the geocoding tools. By assessing the accuracy of various geocoding APIs (Nominatim, ArcGIS, and GeoNames), this study offers critical insights into the performance and suitability of these tools for cultural heritage datasets. This evaluation is essential for selecting the most appropriate technology for precise georeferencing. Furthermore, this aspect of the questions contributes to potential enhancements in data quality and accessibility. Accurate geocoding is fundamental to the effective documentation and conservation of and public access to cultural assets. Understanding the strengths and weaknesses of different APIs aids in improving the quality and interpretability of spatial data, making collections more accessible and useful to diverse audiences. Consequently, the research questions facilitate deeper historical and cultural understanding. Precisely georeferenced data enable a more profound comprehension of cultural circulation, artistic influences, and historical patterns. By identifying the origins of cultural objects and visualising their spatial distribution, this research opens new analytical possibilities within art history and related disciplines. Finally, the research questions developed in this study provide valuable methodological experience based on a specific case study (Museo de América), which can serve as a guide for other researchers and professionals working with similar historical datasets. This contributes to the development of best practices in this field.
The text is organised into several sections: an introduction to the research topic, a methodology for data preprocessing and treatment, a methodology for geocoding spatial data in the historical–artistic field, the results of the geocoding presented through interactive maps based on five research questions, a discussion that includes the study’s limitations and future research directions, and a conclusion with hypotheses concerning the treatment of the specific case study.
2. Methodology
In the Methodology section, this study employs an interdisciplinary research design framework that integrates approaches from the digital humanities (DH), Data Science (DS), data visualisation (DV), and art history (AH). This framework centres on proposing an optimised methodology for handling historical spatial data, focusing on three primary challenges: ambiguity or uncertainty, granularity, and heterogeneity. Utilising a dataset provided by the Ministry of Culture of Spain, this study selects the Museum of America’s collection as its case for analysis, applying preprocessing techniques, geocoding via APIs (Nominatim, ArcGIS, and GeoNames), and interactive visualisation. This methodological design facilitates the evaluation of georeferencing tool accuracy and proposes replicable strategies for other heritage datasets, thereby establishing a robust and transferable approach within the DH field.
2.1. Historical Data Challenges for Spatial Data
Digital catalogues of GLAM collections usually provide descriptive information (such as the author, period, or materials of a particular cultural artefact), including spatial data linked to the objects [
12]. In the present database, under the common standard of the DOMUS software (version 2.0), we find a large corpus of historical data: the records of more than 384,242 objects from 123 Spanish museums and cultural institutions participating in CER.es [
13]. Despite sharing this common system, it is logically very heterogeneous information, with multiple complexities and challenges derived from its great diversity and peculiar idiosyncrasy.
In ClioViz, we propose a framework optimised with DS methodologies, specifically DV, which, coupled in an interdisciplinary way with AH, allow for broader and more global approaches, such as the analysis of large-scale artistic patterns and the visualisation of cultural circulations [
14]. Although in the project we address the ambiguity or uncertainty, variable granularity, and heterogeneity of both temporal and spatial data, in this article, we will only deal with spatial data. By evaluating the accuracy of three APIs (Application Programming Interfaces) in processing the spatial data available in the CER.es database, we want to provide an experience that may be useful for other researchers working with the same dataset or with other historical datasets.
The term geodata, or geospatial data, in the context of CH, refers to information describing the location of heritage objects. However, in the documentation of these assets, there is no single geographical reference: since they are objects of a certain age, it is important to document their location at different points in time throughout their history, without being limited to one. The most important information for this case of study, based on the data from CER.es and according to the instructions of the MCLT for the Documentary Standardisation of Museums, is
Associated with the object’s safeguarding institution; this refers to the museum that contains it. We can find multiple levels of granularity, from precise references (detailing the exact area in which it is kept in a deposit or the room it is on display in) to others with less specific granularity, in which only the name of the museum is indicated. In other words, this information refers to the current location of the piece (and, where appropriate, historical information on its previous locations) within the museum.
Place of production: This is linked to the place where the work was produced or originated. We can find differences in granularity, with specific references (such as sites, mints, or specific names) but also general references of geographical hierarchy (such as localities, regions, countries, or continents). Likewise, within the general references, we can find heterogeneity in the toponyms indicated, highlighting historical toponyms and current toponyms. On some specific occasions, we also find cultural contexts.
Place of provenance: This refers to information regarding the place and circumstances of the recovery of the object. In addition, it is specified that “Provenance” is the geographical place of the recovery of the object, within the levels included in the geographical thesaurus, as well as details on historical toponymy, which may not be included; “Specific place/site” is a geographical entity of lower rank, a toponym lower than those mentioned in the previous section, or the particular name of an archaeological site [
15]. In other words, the place of provenance provides us with information associated with the biography of the object. It refers to the place from which it was incorporated into the collection. It can be referenced in the same way as the place of production, except for the different idiosyncrasies of the general references. In some cases, cataloguers do not provide general provenance information and simply reference the specific place/site. In other cases, the reverse is true.
Additionally, the geographic reference can be associated with a direct geographic reference (through coordinates) or an indirect one (such as a postcode) [
16]. However, in the CER.es dataset, the spatial data of “Place of provenance” are indirectly referenced through text strings with geographical or administrative hierarchy. For example, in the string “Quito; Pichincha; Ecuador; América del Sur”, we observe that it is composed of hierarchical administrative toponyms with the structure “district, province, country, continent”. It starts with the smallest administrative unit (administrative district of Quito) and expands to larger geographical units (province: Pichincha; country: Ecuador; continent: South America).
However, text strings present several challenges due to their heterogeneous, granular, and often uncertain nature. Some of the spatial data characteristics in historical data identified by the research group [
17] are as follows:
Spatial heterogeneity: This can be indicated by old place names (e.g., “Murviedro”) or current place names (e.g., “Sagunto”). We also find the use of different languages (in CER.es, we have found spatial data expressed in Catalan and Galician, not only in Spanish). The different ways of representing location and chronology can complicate the visualisation and analysis of the data. Although, to a large extent, this has been solved with API processing, the solution generates uncertainties of representation, as discussed below.
Spatial granularity: The location may appear in a very precise form, with different degrees of information (e.g., “Necrópolis de La Puerta Norte, Linares (t.m.) = Cástulo (Linares, Campiña del Norte (comarca)”), or in a more imprecise form, as terms without administrative hierarchy, covering large regions of different levels (e.g., “Spain”). We can also find specific places referring to deposits, mints, or productive sites, which may or may not exist today. Variability in the accuracy of spatial data can make it difficult to create consistent and comparable visualisations.
Spatial uncertainty/ambiguity: Uncertainty or ambiguity can occur in different forms. An object may have multiple locations due to uncertainty or diversity of opinion (e.g., “Spain-Italy”); these locations may appear as cultural contexts referring to mixed meanings (historical or spatio-temporal), such as “Spanish Renaissance”, with historical toponymy (e.g., “Castilla la Vieja”), or with historically recognised names which are believed to have existed in a specific area but for which the current reference is approximate, because scientifically we do not know it or because we are uncertain about it (e.g., “Damaniu”). In addition, text strings may appear with complementary words that make processing difficult (e.g., “colonia Caesar Augusta”). Ambiguity in the data can lead to misinterpretation if it is not adequately represented in the visualisations.
Having identified the challenges of historical spatial data, we now turn to discuss the strategies proposed for their visualisation through multidimensional maps and interactive graphics.
2.2. Challenges Addressed by the ClioViz Project
ClioViz is based on an existing dataset, which we call Version 0, used in the first collaboration between the Subdirección General de Museos Estatales (SGME, from now on) of the MCLT and the Universitat de València, in the framework of a previous research project.
However, in the framework of the ClioViz project, we have worked with an updated version of this dataset, provided by the MCLT in May 2024, which we call Version 1. It consists of 291,396 CH records, mainly those that can be consulted interactively on CER.es, as of the reference date. Note that museums are adding new records and updating existing ones in the DOMUS software, the content management system (CMS) behind CER.es. Therefore, the corpus of data is never finished but is dynamic and constantly growing, which will force us to update our analysis in future research.
Although this information, with the addition of images of each piece, is available online, the MCLT provided us with an Excel file (.xlsx) containing a dump with which to work on a set of data belonging to the Museum Collections section from a total of 123 museums, centres, and institutions with museum collections in Spain. We have not included the data from Documentary Collections, which also form an important part of CER.es.
We decided to look at Version 1 to see which of the museums that provide data to CER.es have the largest number of works from disparate geographies. Among the 123 collections, the Museo de América stands out in this regard, with a total of 17,594 cultural objects of very diverse origins. For this reason, it became our data subset and case study.
Another relevant question was what type of spatial data we wanted to preprocess, geo-reference, and visualise. From the different possibilities according to the fields provided in the dataset, we opted for the “Place of provenance”. It should not be confused with the original “Place of production” or the current “Location”, as explained above: it is information about the places which an object has passed through after its production and before arriving at the current museum. In other words, it is useful for tracing or reconstructing the “biography of the object” [
18]: its provenance, successive owners, and circulation routes. The integration of this data into multidimensional maps and interactive graphics expands the possibilities for analysis, allowing for a spatial visualisation of the geographical course of a work to discern possible artistic influences and establish cross-cultural connections, historical patterns or dynamics, trade routes or centres, and so on. In fact, projects such as the Getty Provenance Index [
19], PLEIADES [
20], or Pelagios Commons [
21] demonstrate how digital mapping contributes to a greater understanding of DH.
Before the geocoding process, we carried out a “cleaning” of the data, including processes such as the elimination of special characters, the standardisation of abbreviations, or the correction of typographical errors.
Let us now delve into our choice of APIs. Among all the geocoding software currently available on the market, ClioViz (
https://cliovis.com/) has selected three APIs that allow addresses to be geocoded in a free, accessible, interoperable, and reusable way for any other research that wishes to apply our methodology. These are Nominatim [
22], ArcGIS [
23], and GeoNames [
24]. Some reasons led us to choose these APIs. We utilised the Nominatim API, which operates as a search engine using OSM, an open-source database maintained by a community of users. The main reasons for selecting this API include its cost-free nature, the availability of structured text search (e.g., “street, city, county, etc.”), and its ability to incorporate additional information about the search, such as address hierarchy. Subsequently, we employed the ArcGIS API geocoding service developed by ESRI [
25]. Unlike Nominatim, ArcGIS relies on proprietary data from official sources like national geographic institutes and commercial data. Although there is a cost for commercial or large-scale use, we opted for a free plan with request limits for this study. Lastly, we also used the GeoNames API, which features a database of over 25 million geographic locations and supports alternative names for diverse searches. Similarly to ArcGIS, it offers a service with a free limit. A distinguishing feature of this API is its fuzzy search capability, which simplifies the search for non-exact names. Additionally, it efficiently returns the geographic hierarchy for each search. For an in-depth analysis of the geocoding process employed, please refer to the Discussion section.
After identifying the data subset, determining the type of spatial data, and clarifying the API selection, we delve into a detailed discussion of how to address each of its challenges.
2.2.1. Addressing Spatial Data Granularity and Heterogeneity
Noting the disparate levels of granularity of the spatial data available (through the hierarchy “continent”, “country”, “county”, “province”, “municipality”, etc.), we were forced to sift through the number of objects in the subset that would allow us to obtain information at the “country” level. The resulting sifting indicated that, of the 17,594 total records in the Museo de América’s subset of CH data, only 61.4% (10,801) were useful for our analysis, as they had some information in the “Place of Provenance” text string. In other words, 6793 records were eliminated from our subset of data because they did not include any text string in that field.
For the 10,801 that did have some information on the “Place of provenance”, we obtained the country of reference for each of the records from the administrative hierarchy mentioned above using Admin 0—Countries dataset from the 10m Cultural Vectors section of Natural Earth (version 5.1.1). In this way, for each record, the geometry corresponding to the reference country was obtained.
However, as a consequence of the variable granularity and heterogeneity of the data, not all of the remaining records have information at the “country” level and they therefore give errors when geocoded. The following were therefore removed from the subset:
Records with a single spatial data level other than country. Examples of these are continent spatial data (e.g., “América del Norte”) or sets of regions (e.g., “Antillas Centroamérica”, “Costa noroeste América del Norte”, “Área andina”).
Records mentioning standardised administrative levels included in the Geographical Dictionary which, however, are not interoperable with the corresponding terminology in some APIs. An example would be the “departments” in South America (correctly incorporated and named in the Dictionary), which do not always find homologous correspondences in the administrative demarcations incorporated in all APIs.
Taking these particularities into account, the subset of data we will use from now on has 10,200 records (57.97% of the total records of the Museo de América) that can be georeferenced. See
Figure 1 to visualise the process used to obtain this dataset.
Considering that the museum’s collection consists of approximately 25,000 items, this subset of 10,200 records is reasonably representative of the whole [
26]. Unfortunately, however, it is quite possible that important parts of the collection are among the nearly 15,000 records that we were not able to incorporate into our analysis.
As mentioned above (
Section 2.1), the spatial data of “Place of provenance” in the dataset are referenced indirectly by means of text strings, following a geographical or administrative hierarchy. These data may be standardised according to the MCTL Geographical Dictionary or not, at the discretion of each cataloguer. Once the spatial data that could be visualised had been screened, it was necessary to obtain their equivalent geographical coordinates. To do this, we resorted to the use of three APIs that allow us to geocode the records, enabling us to collect the geographic coordinates from an address or text string provided by the dataset. This whole process is explained in
Section 2.3, providing a comparison of the different degrees of effectiveness of these APIs in correctly specifying and visualising the exact location with respect to the text strings indicated in the records.
2.2.2. Addressing Spatial Data Uncertainty or Ambiguity
After processing the text strings, we found some in our dataset that can be considered ambiguous or uncertain. The string “Ecuador-Colombia América del Sur” shows uncertainty on the part of the cataloguer, who limited themself to giving a diffuse indication: two different countries within an even wider continental set. It is worth considering that another example of uncertainty associated with this type of data could occur when finding unique terms such as “Valencia”, since there are cities with the same toponym in different countries (Valencia, Spain, and Valencia, Venezuela).
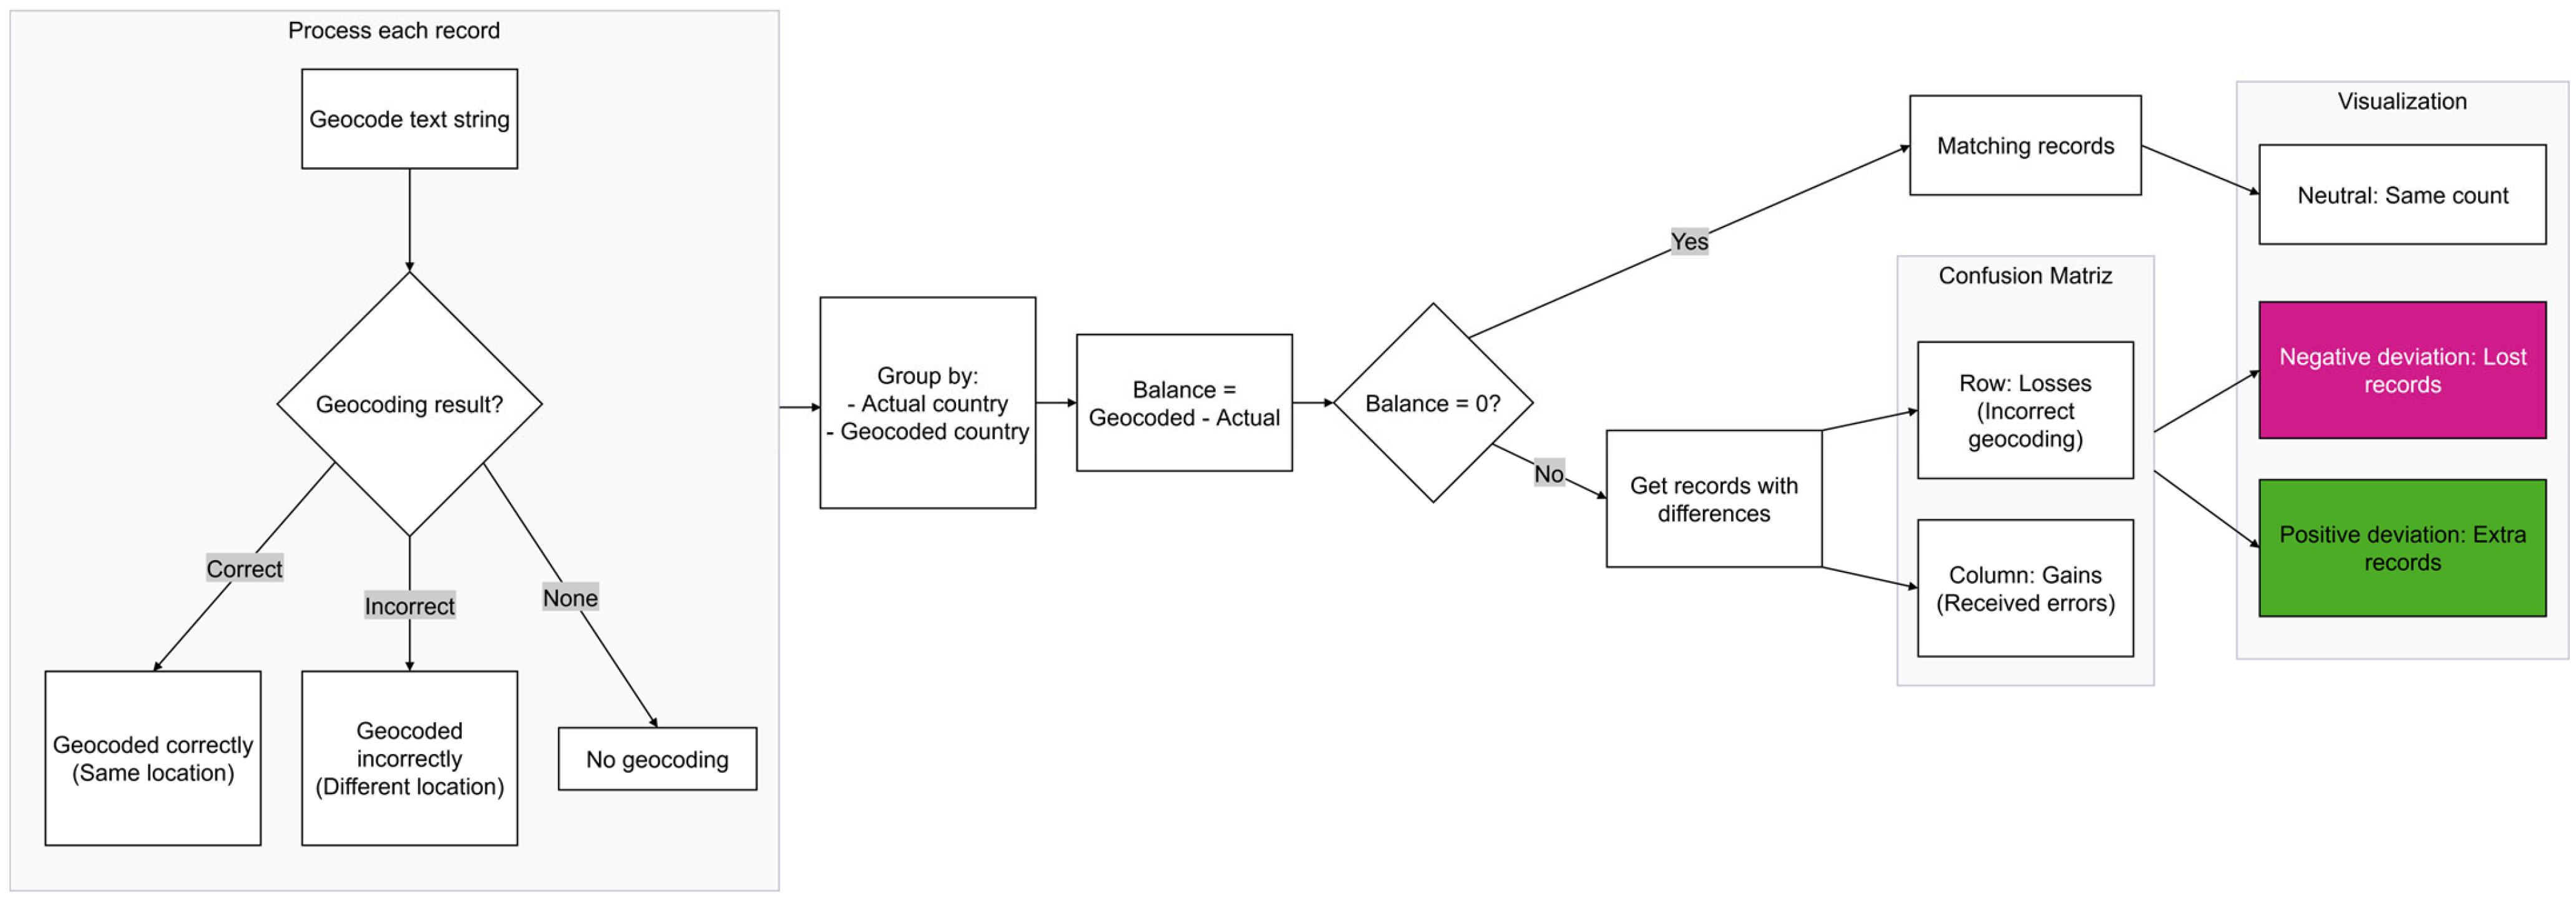
The geocoding process, regardless of the API used, returns results of varying quality (see
Figure 2 for the whole process). These can be
Right geocoding: returns the same location that the string references.
Wrong geocoding: returns a place other than the one referenced by the string.
No geocoding: no result is obtained for the referenced string.
The second and third options are considered uncertainties, as they are geocoding errors and lead to distortions in the representation of the results. To quantify these errors, we have decided to use a “balance sheet” that combines gains and losses in each country.
Losses are objects that belong to one country but were wrongly assigned to another. For example, if Chile has 178 records that should be assigned to it but are coded as belonging to Peru, this is considered a loss for Chile. On the other hand, gains are foreign objects that, by mistake, have been attributed to a country other than the correct one. In the example above, the 178 Chilean objects would be a gain for Peru.
We calculated the bottom line for each country by subtracting the losses from the gains, thus arriving at the impact of country representation for an API. This impact can have three outcomes:
A positive result, indicating that the country is over-represented, i.e., it receives more objects than it loses, distorting the number of objects in one region over another and thus distorting those in the dataset.
A negative result, indicating that the country is under-represented and loses more objects than it gains, minimising its appearance in the dataset or making it invisible.
A neutral result, indicating that the geocoding did not make any errors and all objects belonging to a country were correctly placed in relation to the original text string, in alignment with the dataset.
To represent this balance, ClioViz has decided to use two approaches, which are explained in detail in
Section 2.3.
2.3. Strategies in the Implementation of Visualisations
The large number of records used (please remember that we are dealing with more than 10,000 objects) makes it necessary to face “processing challenges” [
27]. In this case, a suitable programming language such as Python (version 3.11.5) was used both for the analysis (geocoding) and the representation of the results (visualisations).
Thanks to DV, we can answer the research questions posed with visual aesthetics (colour, size, or shape) using filtering and aggregations. Thus, we solve a scalability problem related to the perception of the human eye through data reduction techniques [
28].
Data processing was made possible thanks to libraries such as Pandas (version 2.2.3), Numpy (version 1.24.4), and Re (version 2.2.1). The visualisations were created using Matplotlib[M1] (version 3.10.1) or Seaborn (version 0.13.2) for static visualisations, while interactive ones were created using Plotly (version 5.9.0). Plotly combines Python (version 3.11.5) and the Django (version 4.2) framework to create interactive visualisations and is open-source [
29].
We would like to clarify that our ground truth is the text string provided as the “Place of provenance.” It is important to remember that our dataset comprises data from the museum’s online digital catalogue, prepared by specialists. For this research, which is not intended to predict the data but to crosscheck it, subsequent manual verification is unnecessary, in our opinion. It should be noted that we performed an automated validation of the geocoding of APIs, as illustrated in
Figure 1 and
Figure 2.
Before showing the results, it is worth explaining the strategies used in the implementation of the visualisations based on the research questions mentioned in the Introduction section. The three strategies are as follows:
RQ 1 to 3: In principle, the strategy proposed was to use multidimensional choropleth maps, that is, where the aesthetics of colour is used to represent the balance of the countries and whose geometry is the territory of these countries. We decided to use a colour palette suitable for people with visual anomalies such as colour blindness (colourblind-safe), with a divergent colour scale with three main colours: pink, white, and green. With this scale, provided by the Branca library, we intend to visualise whether there are fewer (pink), more (green), or an equal number of (white) records than the reference number in each of the countries. However, after analysing the results and wishing to facilitate the visualisation of the results, we decided to create spatial visualisations that would avoid a large distortion of the regions while compensating for the different sizes of the countries [
30]. For a more in-depth consideration of this aspect, please refer to the Discussion section. Complementarily, we created a confusion matrix showing the significant discrepancies in the error balance (see
Figure 2) between the actual source countries (rows) and the misallocations generated by the system (columns). We obtained two results from this strategy: a confusion matrix that allows for a deeper analysis of the errors and an interactive graph called a “cartogram”.
RQ 4: For the comparative question on the effectiveness of APIs, the selected strategy is representation in percentage values by means of a bar chart.
RQ 5: To answer the question on “Place of provenance” in the collection of the Museo de América, the relevant strategy was cartographic representation by means of a choropleth map. In this, we decided to use a legend with a divergent colour scale of yellows, oranges, and reds, grouping the clusters according to the number of records to be assessed, based on the data obtained by the most effective API.
3. Results
Using the national geometries mentioned above, after preprocessing the subset of data, we obtained a total of 41 base reference countries. All these countries appear in the original text strings of our dataset. However, we detected that the number of countries that appear after processing by the APIs may be higher than this number. The reason for this are the unavoidable but inexplicable errors of geocoding processing by the API itself: if there are countries that are not counted (or considered) as a reference, the software returns them as georeferenced in a completely random place in the world and without taking into account any other relation to any other data in the records. Therefore, the number of assets located in the counted countries will always be higher than their actual number. Below, we show the number of countries obtained in each API:
Nominatim: 44 countries (3 countries more than the benchmarks).
ArcGIS: 47 countries (6 countries more than the reference countries).
GeoNames: 42 countries (1 country more than the benchmarks).
With this in mind, we then applied the preprocessing treatment developed in the Methodology section to the resulting subset of data belonging to the collection of the Museo de América. The application was defined through five research questions, the development and results of which provide us with the keys to generate the conclusion of this article.
3.1. Accuracy Results for RQ1
The first research question corresponds to the level of accuracy of the Nominatim API in geocoding the spatial data of “Place of provenance” in the collection of the Museo de América.
Table 1 presents a comparative analysis between the geocoded records in this study and the reference records, classifying the results into three main categories: positive, negative, and neutral.
Out of a total of 41 georeferenced countries, Nominatim provides 40.91% neutrality (i.e., it geocodes 18 countries in the exact location, concerning the text string). However, it has a 59.09% error level. Nominatim shows a positive accuracy of 34.09% (including those three extra countries), i.e., it geocodes more records in a country than we find in the text strings, whether or not this is the exact location indicated in the text string. On the other hand, the remaining 25% have a negative accuracy (geocoding fewer records in their exact location than those found in the text strings).
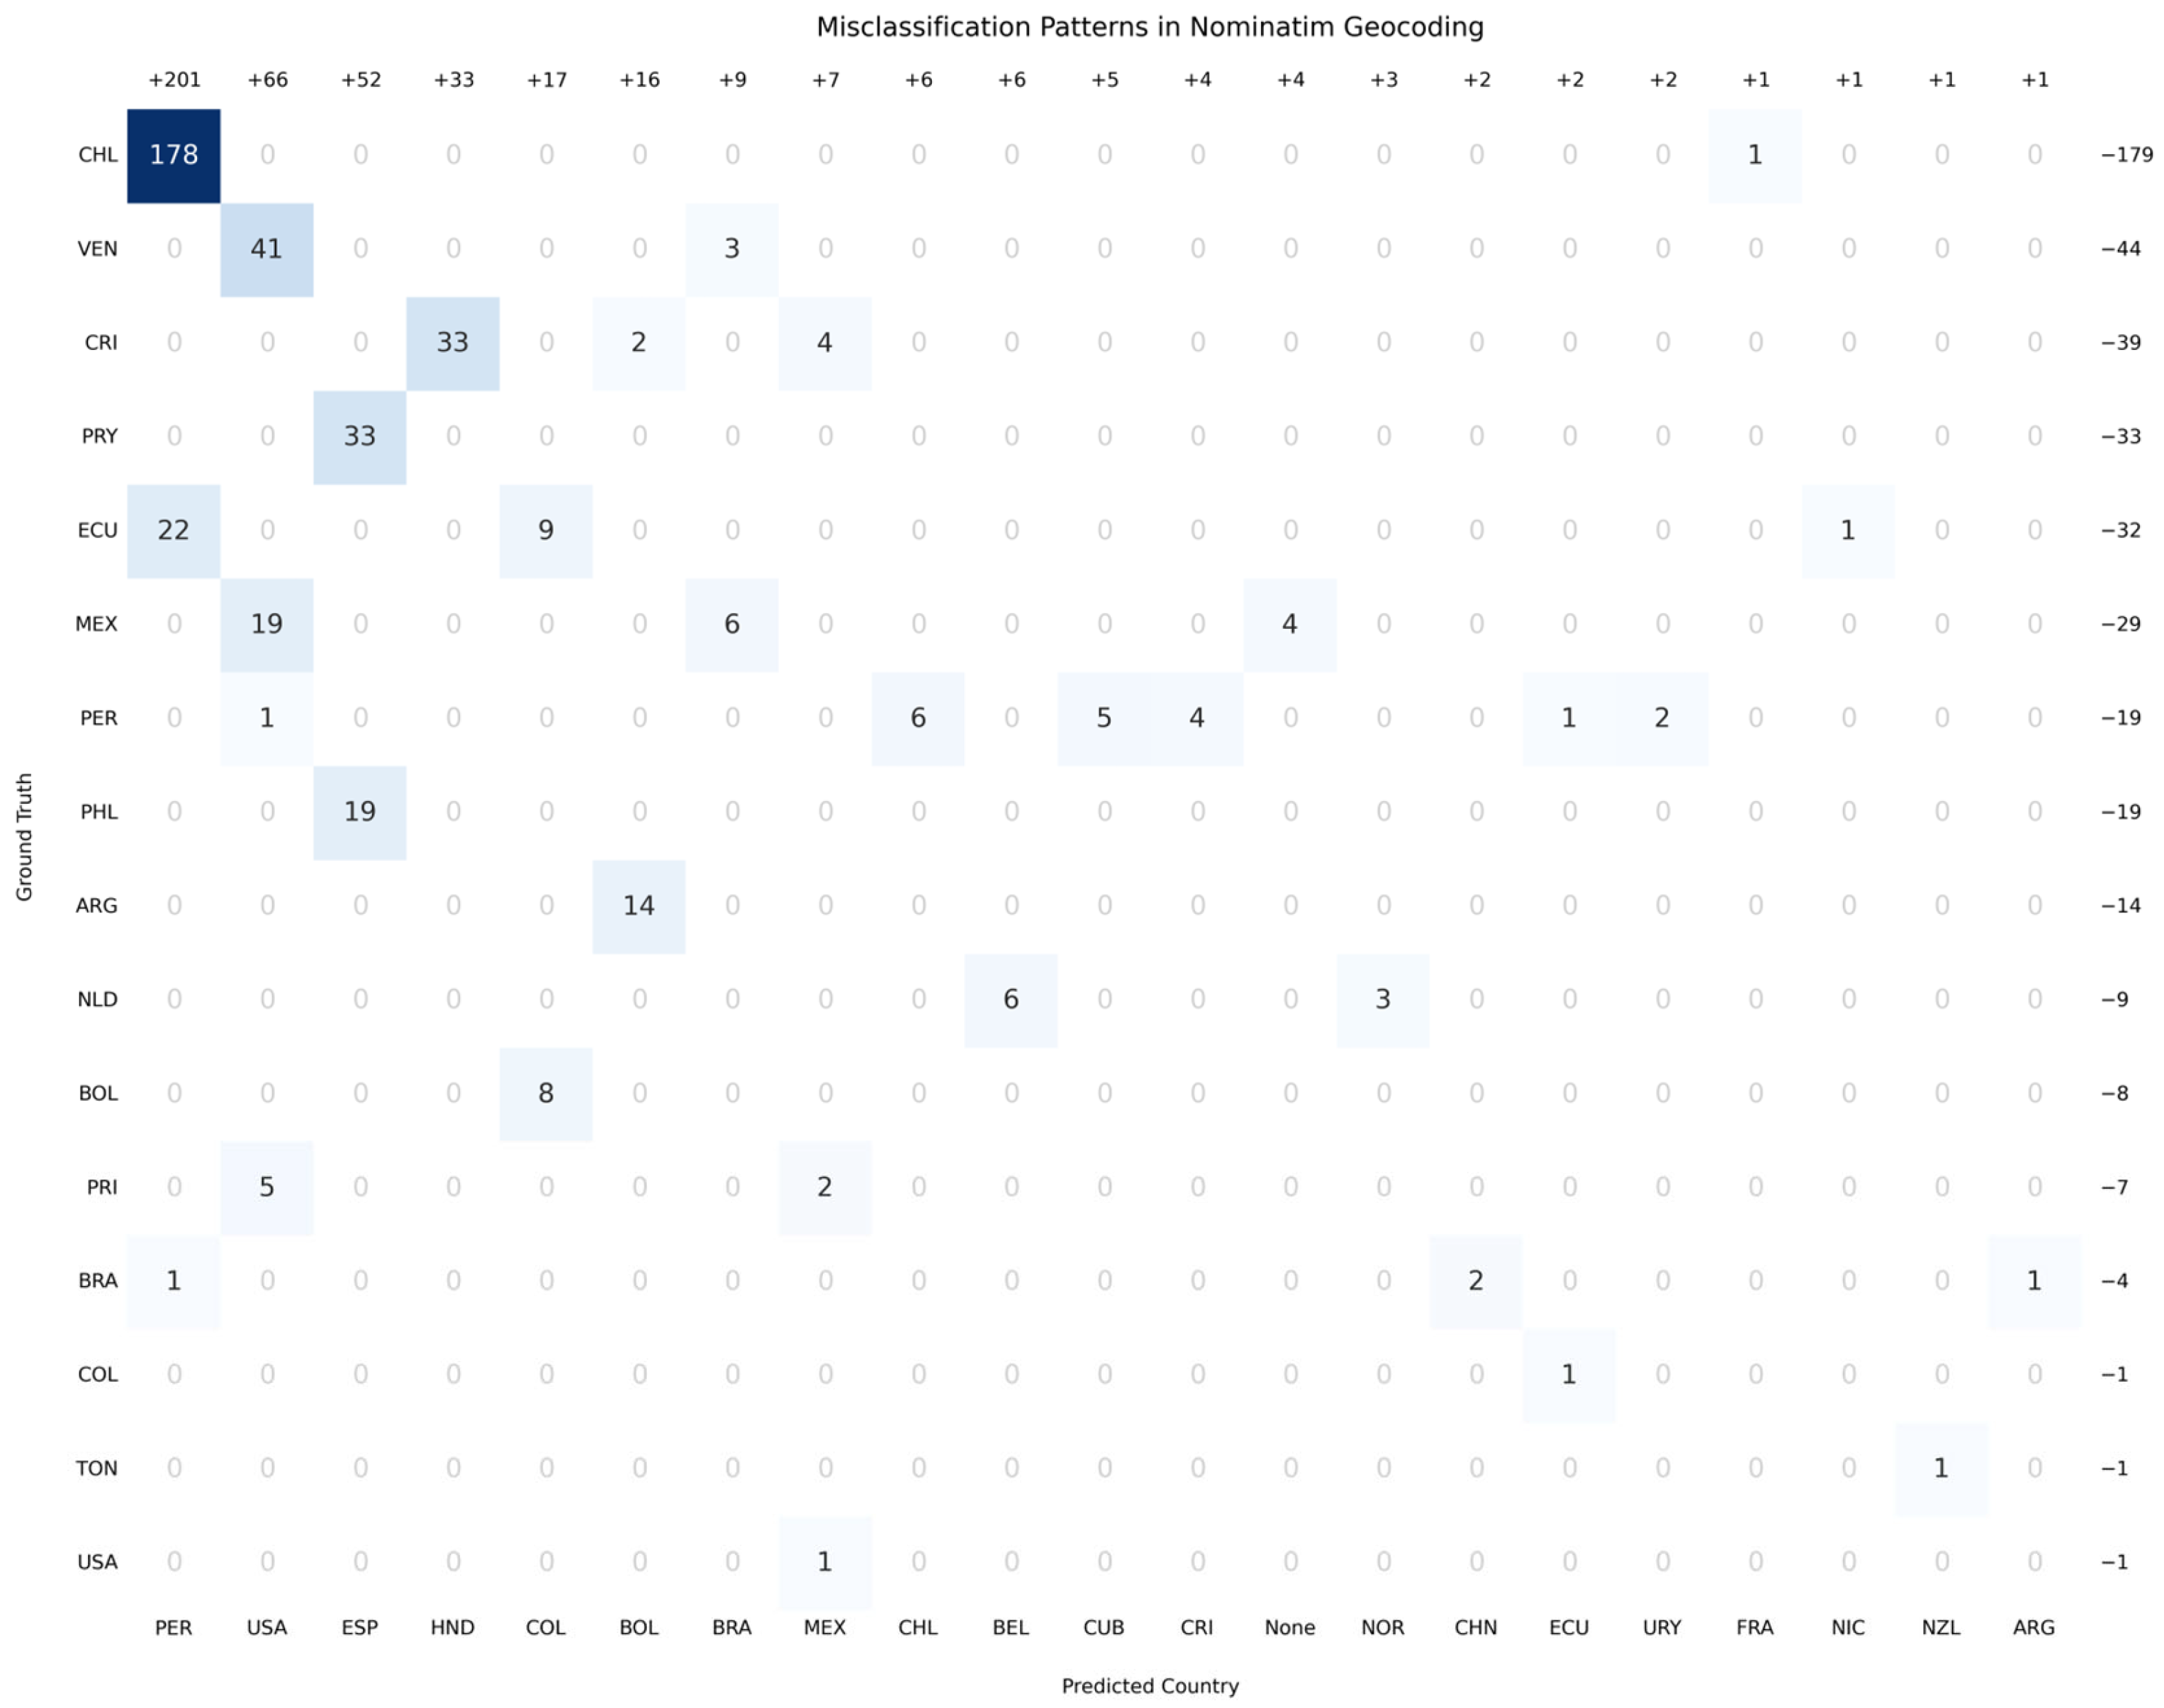
After assessing the overall geocoding results, it is useful to examine the nature and origin of the errors using a confusion matrix. This tool allows for the identification of systematic patterns in discrepancies, classifying records according to their origin (reference source) and destination (geocoding result).
For this case, the confusion matrix (see
Figure 3) focuses only on errors. Cases with no errors are numbered in grey, lowering their opacity to make them less conspicuous.
The confusion matrix generated from Nominatim errors reveals systematic patterns in the geocoding of records, highlighting significant discrepancies between the actual countries of provenance (rows) and system-generated mismatches (columns). Unlike a traditional square matrix, this representation focuses only on problematic cases, eliminating correct matches to prioritise fault analysis. Moreover, for ease of understanding, the total number of records for each country has been added.
The most critical error is observed in the Chilean records (CHL), where 178 cases were incorrectly assigned to Peru (PER). This massive flow suggests a recurrent confusion between the two countries, possibly linked to toponymic similarities or the presence of ambiguous geographical references in the historical records. In addition, Chile shows minor errors, such as the assignment of a record to France (FRA). Using the example of Chile,
Figure 3 shows a balance of −173 objects. This value is obtained by subtracting the 179 original Chilean objects located in different countries (as shown in the row) and adding the 6 objects located in Chile but belonging to others (as shown in the column).
However, Argentina (ARG) presents a different pattern, with 14 records erroneously assigned to Colombia (COL). On the other hand, Venezuela (VEN) shows a problem of considerable magnitude: 41 “Venezuelan” records were geocoded as coming from the United States (USA), a transcontinental error that points to possible failures in the interpretation of historical contexts or the presence of repeated names in different regions.
In Central America and the Caribbean, errors take various forms. Costa Rica (CRI) shows 33 entries erroneously assigned to Honduras (HND), 4 to Mexico (MEX) and 2 to Colombia (COL), while Ecuador (ECU) shows a combination of 22 entries erroneously assigned to Peru, 9 to Honduras, and 1 to Nicaragua (NIC). A particularly striking case is that of Mexico (MEX), which in addition to receiving foreign entries, shows 19 of its own entries assigned to the United States, possibly reflecting confusion in border regions or bilingual contexts.
The recurrent presence of Peru (PER) as an erroneous destination for multiple countries indicates a structural bias in the algorithm. This phenomenon contrasts with the relative accuracy observed in countries such as Bolivia (BOL) or Colombia (COL), whose errors are minimal and sporadic.
The matrix also reveals limitations in the handling of records without a clear location, represented by the column labelled None. In this case, there are four unassigned records belonging to Mexico.
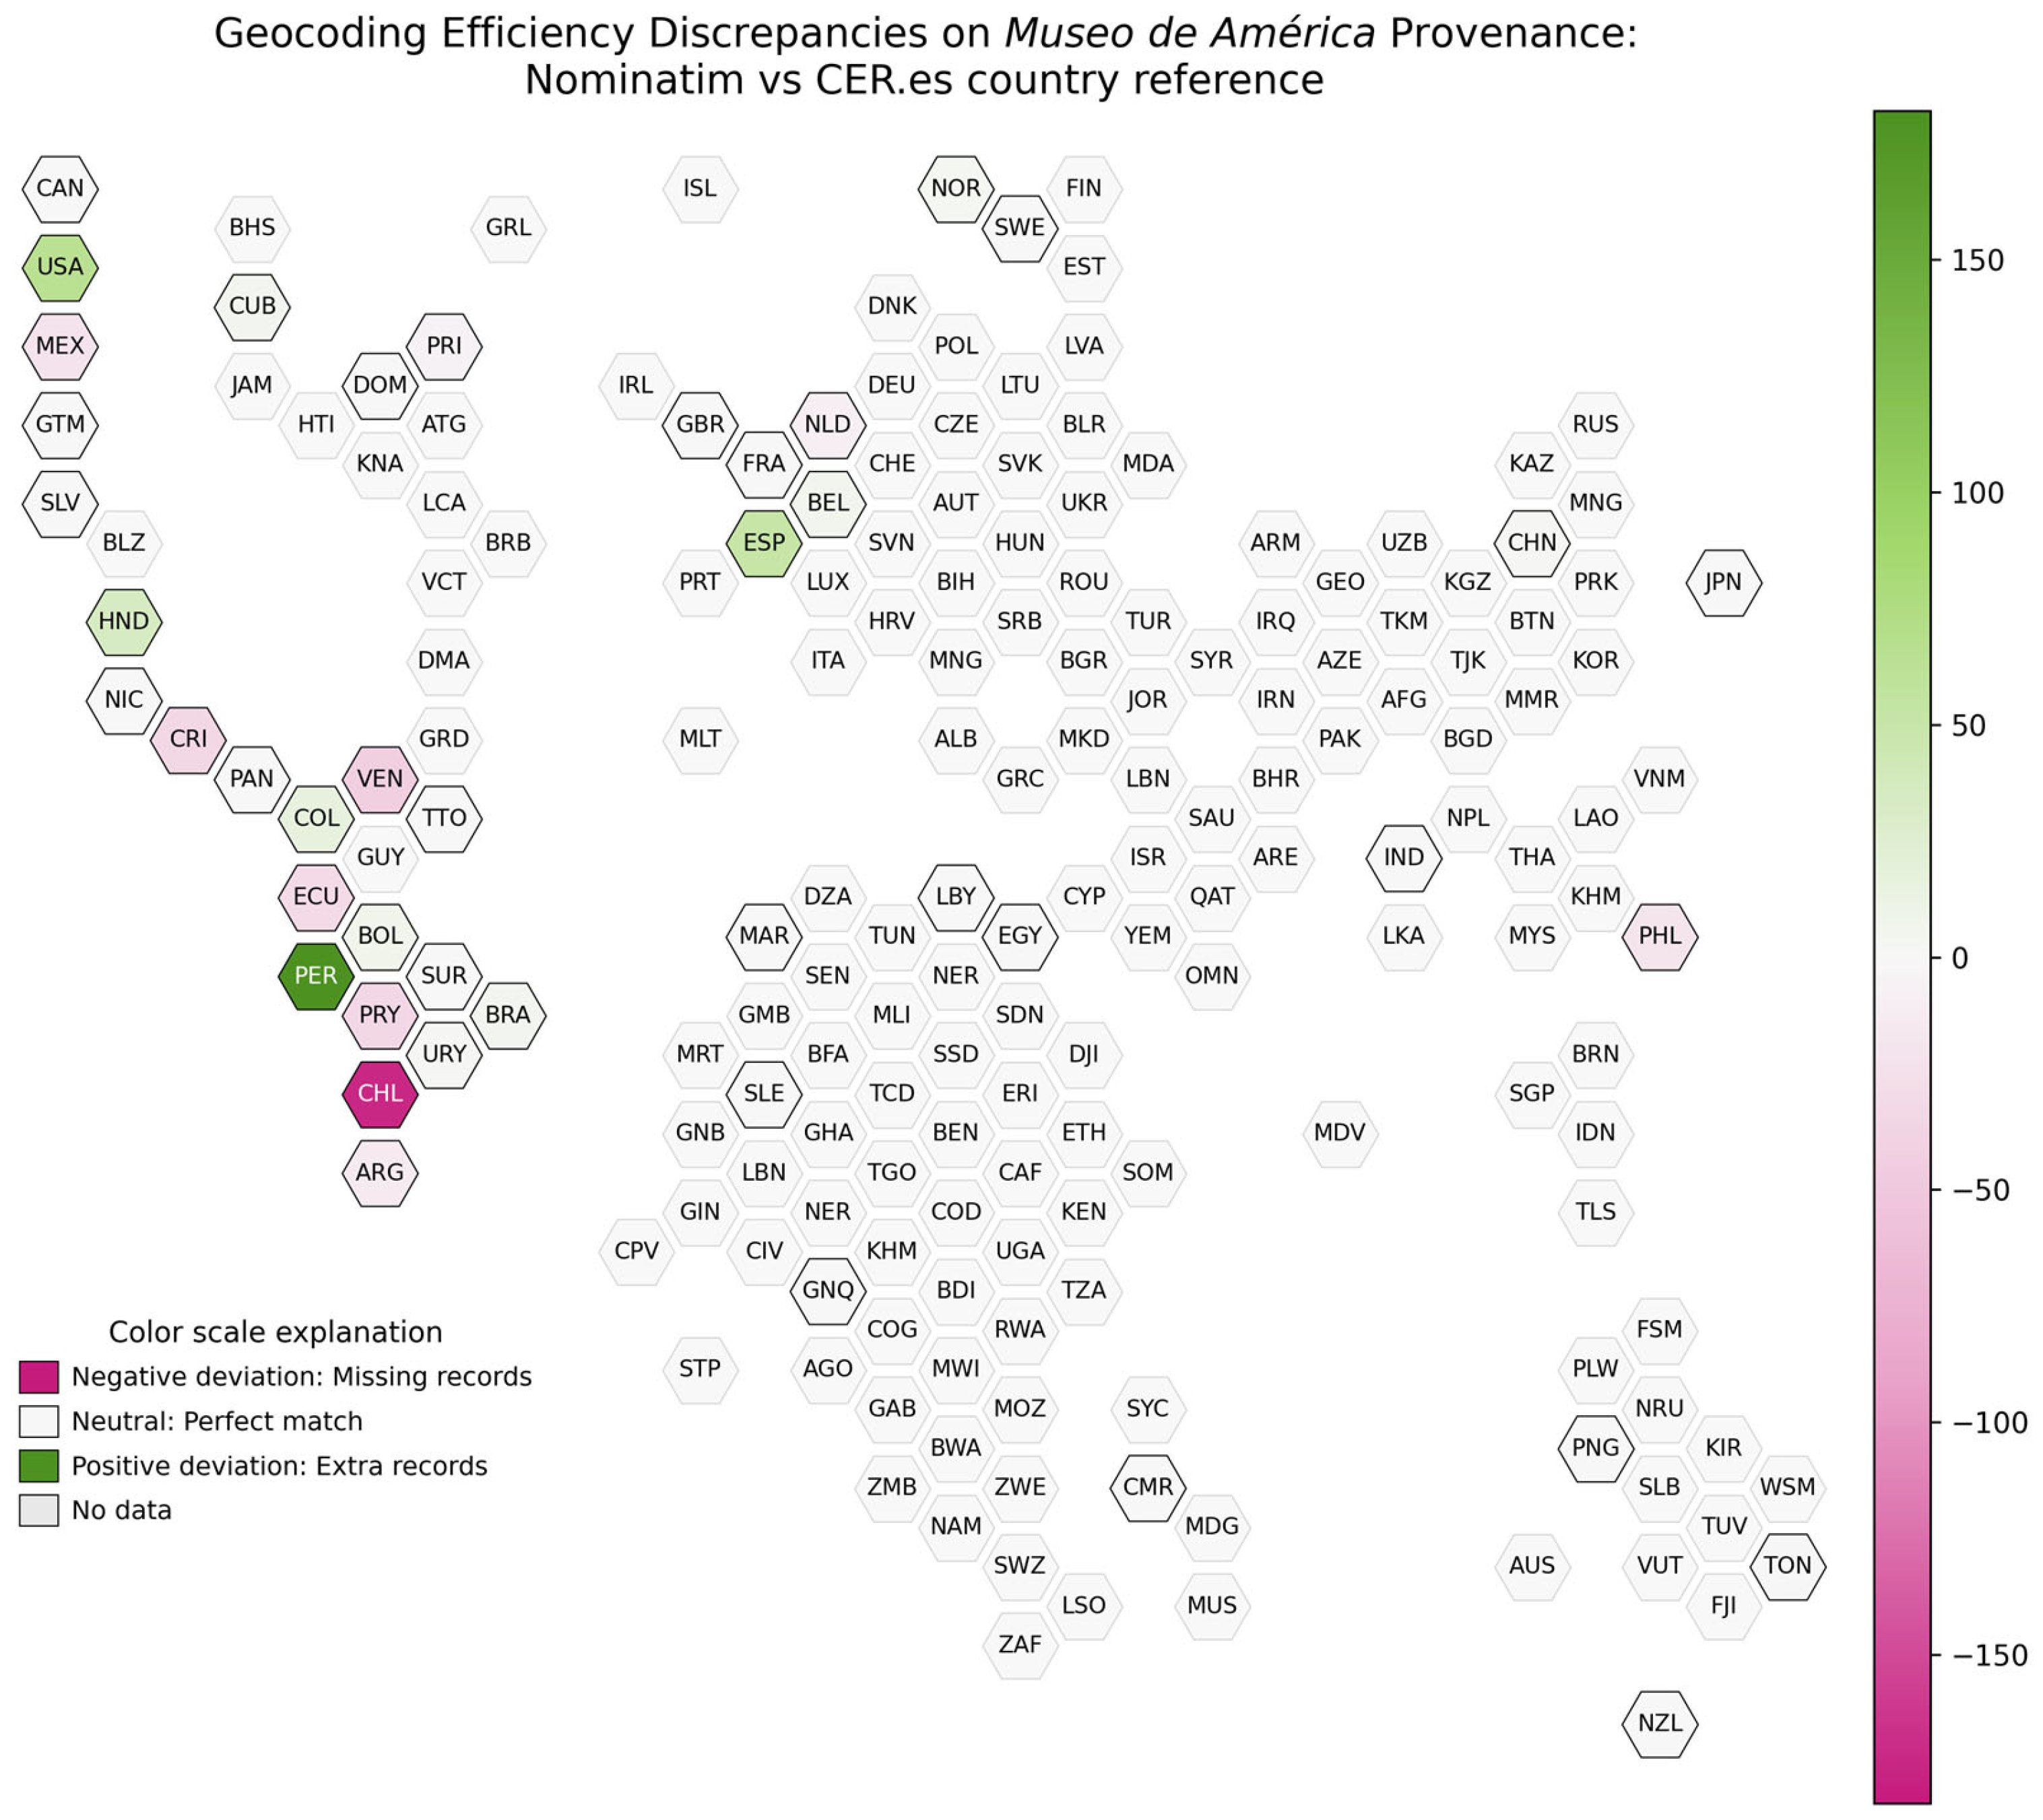
Finally, thanks to the implementation of the confusion matrix balance in a “cartogram” graph, we can more intuitively appreciate the same results (see
Figure 4). The reference country obtained from the text string is what is known as ground truth (information that is absolutely true or correct and serves as a reference standard for evaluating the accuracy or effectiveness of a visualisation or analysis system).
The analysis of the effectiveness of the Nominatim API shows, among the most notable cases, Peru, with an increase of 182, followed by the United States (+65) and Spain (+52). Honduras presents a striking variation, with an increase of thirty-three records, considering that there is only one object located in this country in the reference chain. However, other countries such as Colombia (+16), Bolivia (+8), and Uruguay (+2) show smaller increases. On the other hand, there is an increase in several of the countries that did not appear in the original chain, reflecting part of the errors explained above. These countries are Belgium, Norway, and New Zealand.
In terms of countries with decreases, Chile recorded the largest decrease, with 173 losses. Other significant reductions are seen for Venezuela (−44), Costa Rica (−35), Paraguay (−35), and Ecuador (−33). There are also countries that lose all their records, such as Puerto Rico and Tonga, and therefore have a loss of objects (−7 and −1, respectively).
There are several countries that maintain the same number of objects, such as Canada, Guatemala, or Sweden, as well as several African and Asian countries.
3.2. Accuracy Results for RQ2
For the next research question, we repeated the same process as in question 1, this time using the ArcGIS API. To facilitate the understanding of the following explanation, we have generated a table with the comparative analysis between the geocoded records in this study and the reference records (see
Table 2).
Thus, we find that, out of a total of 47 georeferenced countries, the ArcGIS API provides a neutral accuracy level of 29.79% (i.e., 14 countries are geocoded in the exact location, regarding the text string). In contrast, georeferencing with the ArcGIS API has a 70.21% error level. The ArcGIS API shows a positive accuracy of 34.04% because of the six countries that have appeared in the geocoding. The remaining 36.17% has a negative accuracy (the API geocodes fewer countries recorded in their exact location than those found in the text strings).
Analysing the corresponding confusion matrix (see
Figure 5), the most significant and perhaps the most surprising error corresponds to 284 Peruvian records (PER) incorrectly assigned to the United States (USA).
Chile (CHL) emerges as another focus of recurrent errors, with 178 records misassigned to Peru (PER). This pattern, also observed in other APIs but with greater intensity in ArcGIS, points to persistent challenges in distinguishing between countries with intertwined colonial histories or linguistic similarities. Additionally, Chile shows minor but revealing errors: two unassigned records, one assigned to Italy (ITA), and one to Mexico (MEX).
A particularly striking finding is the assignment of 20 Cuban (CUB) records to South Africa (ZAF), a transcontinental error that lacks immediate geographic logic. Similarly, seven Canadian (CAN) records were erroneously geocoded as Chilean (CHL), a discrepancy that could be explained by homonymous island names, such as “Vancouver” in Chile and Canada, which the system fails to distinguish properly.
In Central America, the errors take specific forms. Costa Rica (CRI) shows four records assigned to Venezuela (VEN), while Panama (PAN) shows six records misclassified as Italy (ITA).
The column labelled “None”, representing unassigned records, is evidence of limitations in the processing of incomplete data.
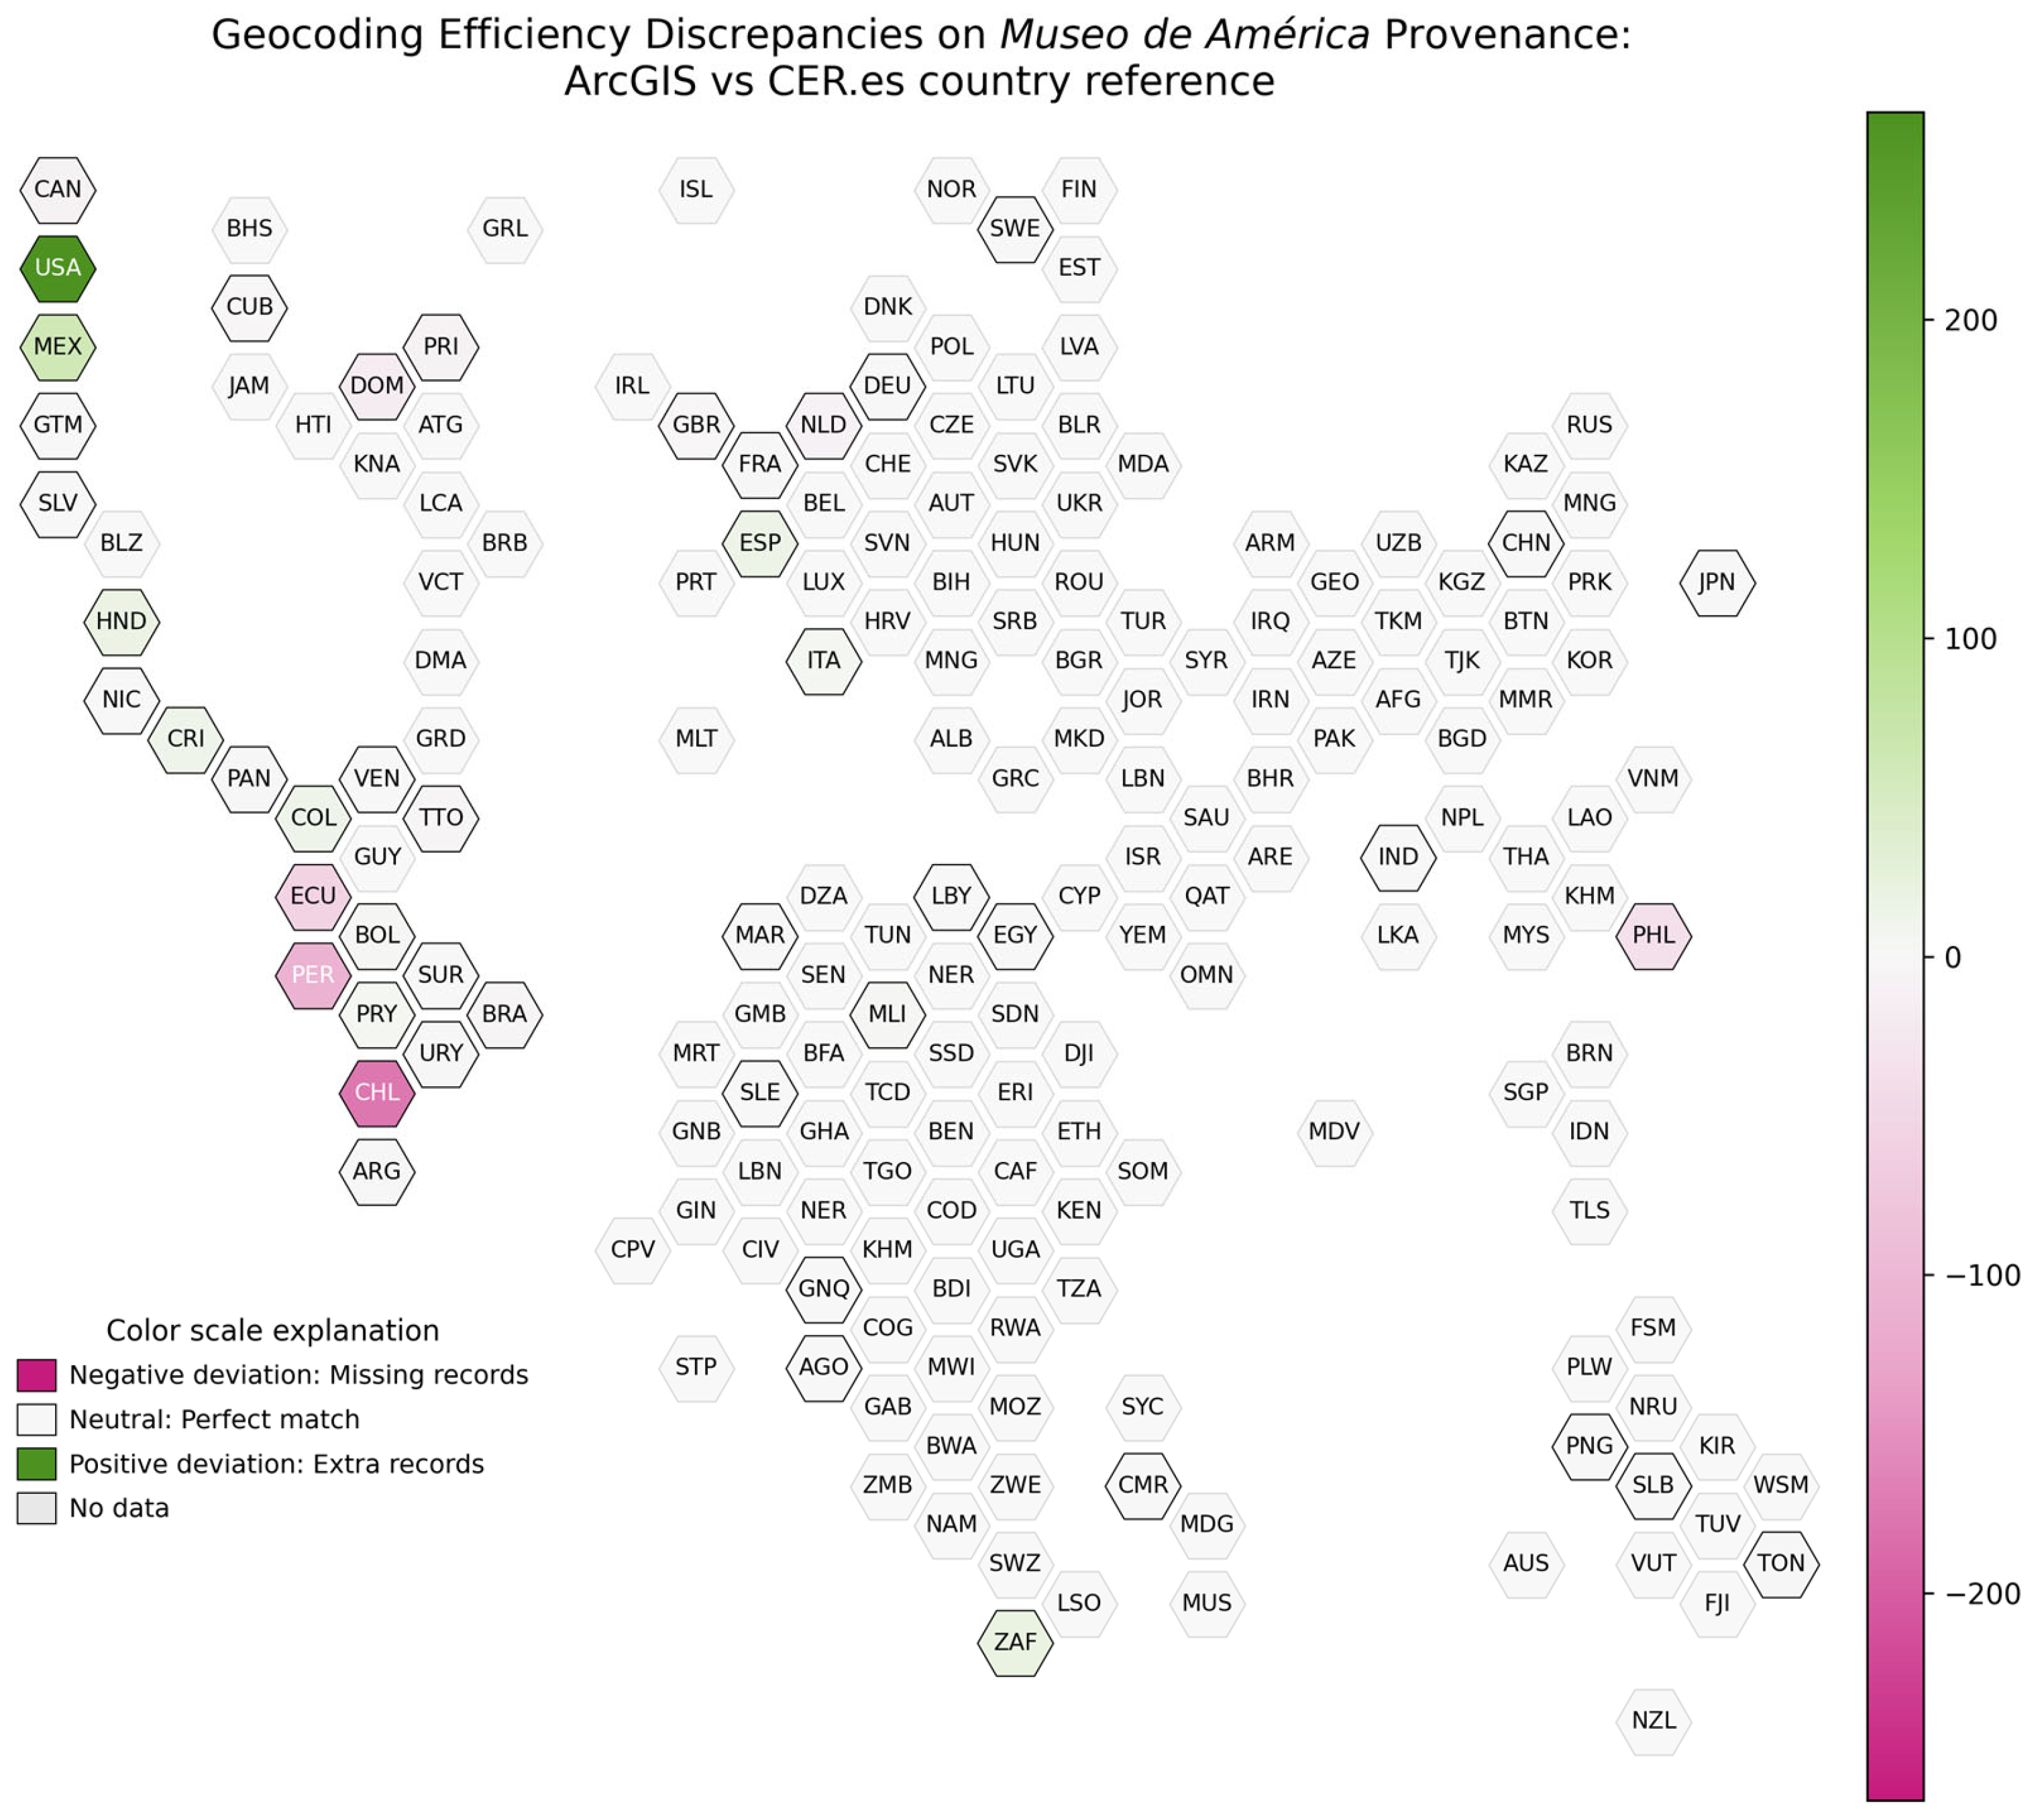
All the above is easily visible through the cartogram graph (see
Figure 6).
Ultimately, the analysis of the effectiveness of the ArcGIS API shows extreme differences, such as the United States of America (+265) and Chile (−175), which represent the widest variations among all countries. Other relevant cases include Mexico (+61), with a positive difference, and Peru (−108), with a negative one. Countries such as Bolivia (+3), Honduras (+18), and South Africa (+20) show moderate increases, while the Dominican Republic (−18) and Trinidad and Tobago (−5) register losses. Again, several countries such as Cameroon, Egypt, and Guatemala show no change. In sum, the results show an increase in the number of countries (six more than the baseline), indicating errors in geocoding. These countries are Angola, Germany, Italy, Mali, Solomon Islands, South Africa, and Germany.
3.3. Accuracy Results for RQ3
The last experiment was carried out with the GeoNames API, repeating the same process as above.
In order to facilitate the comparative analysis between the geocoded records in this study and the reference records, we generated the third table (see
Table 3).
Thus, we find that, out of a total of 42 georeferenced countries, the GeoNames API provides a neutral accuracy level of 78.57% (i.e., 33 countries are geocoded correctly, in agreement with the text string). On the other hand, georeferencing with the GeoNames API has a 21.43% error rate. The API shows a positive accuracy of 4.79% (geocodes in one more country than those found in the text strings, which may or may not be the exact location indicated in the text string), while the remaining 16.67% has a negative accuracy (geocodes fewer records in their exact location than those found in the text strings).
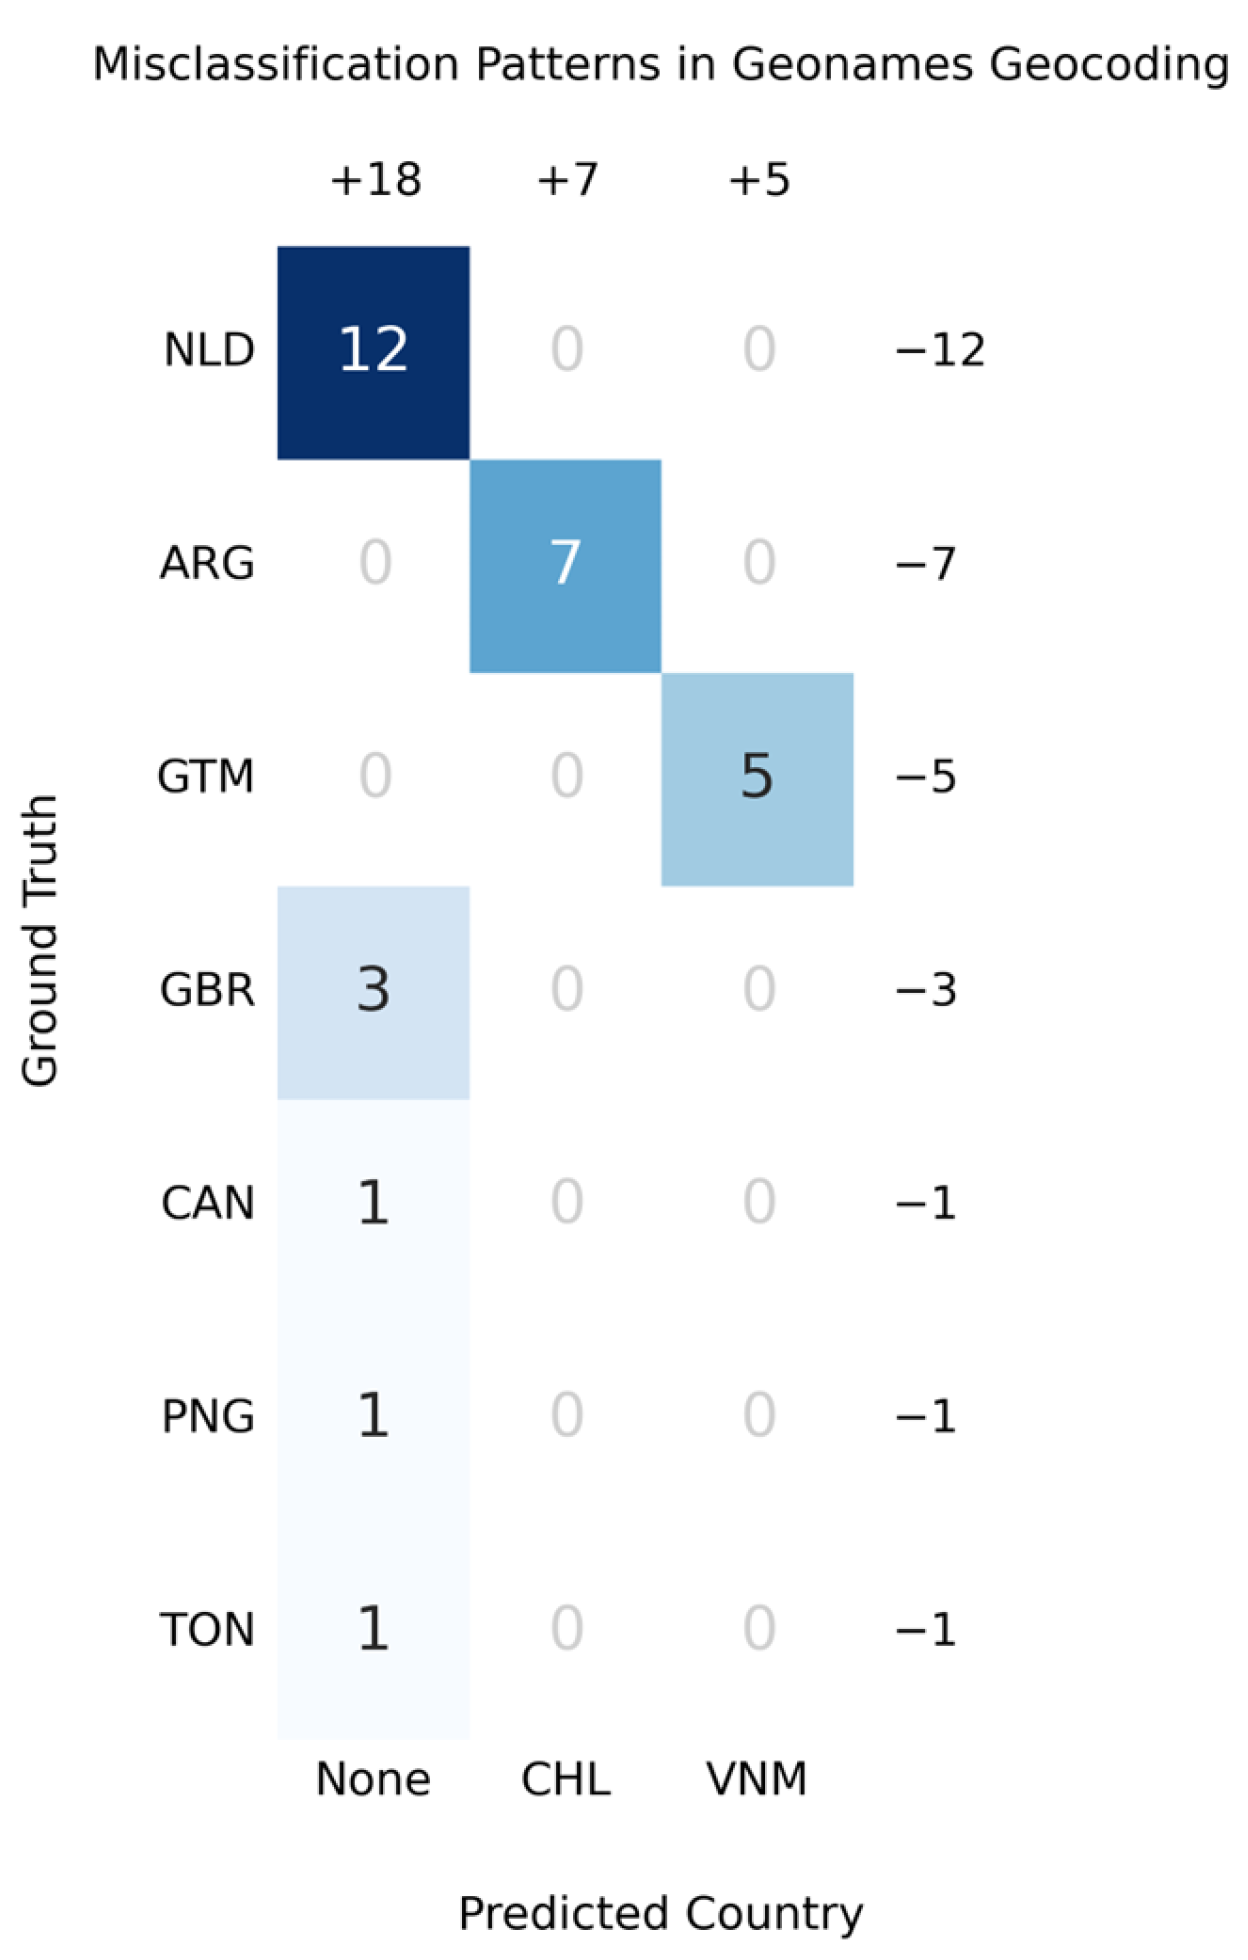
Next, we turn to the confusion matrix of the errors generated in GeoNames (see
Figure 7). Given its much higher level of precision than the previous ones, the matrix is much smaller.
The GeoNames confusion matrix, focusing on geocoding errors, reveals a narrower but equally significant pattern of discrepancies compared to other APIs analysed. With only three erroneous destination columns (including the empty category), the matrix shows a clear trend towards specific misassignments and a high incidence of unclassified records, suggesting limitations in processing ambiguous or fragmented data.
The first error corresponds to Argentina (ARG), with seven records incorrectly assigned to Chile (CHL). This flow points to a recurrent confusion between neighbouring countries, possibly linked to similarities in toponyms or shared geographical references in the Southern Cone region. The absence of errors from Argentina to other locations reinforces the idea of a specific regional bias in the GeoNames algorithm. A particularly striking finding is the assignment of five records from Guatemala (GTM) to Vietnam (VNM).
The category labelled “None”, representing unassigned records, emerges as a critical problem in this matrix. The Netherlands (NLD), which represents the largest discrepancy in the matrix, leads this phenomenon, with 12 unclassified records, followed by the United Kingdom (GBR), with 3 unassigned records, and Papua New Guinea (PNG), Tonga (TON), and Canada (CAN), with 1 case in each.
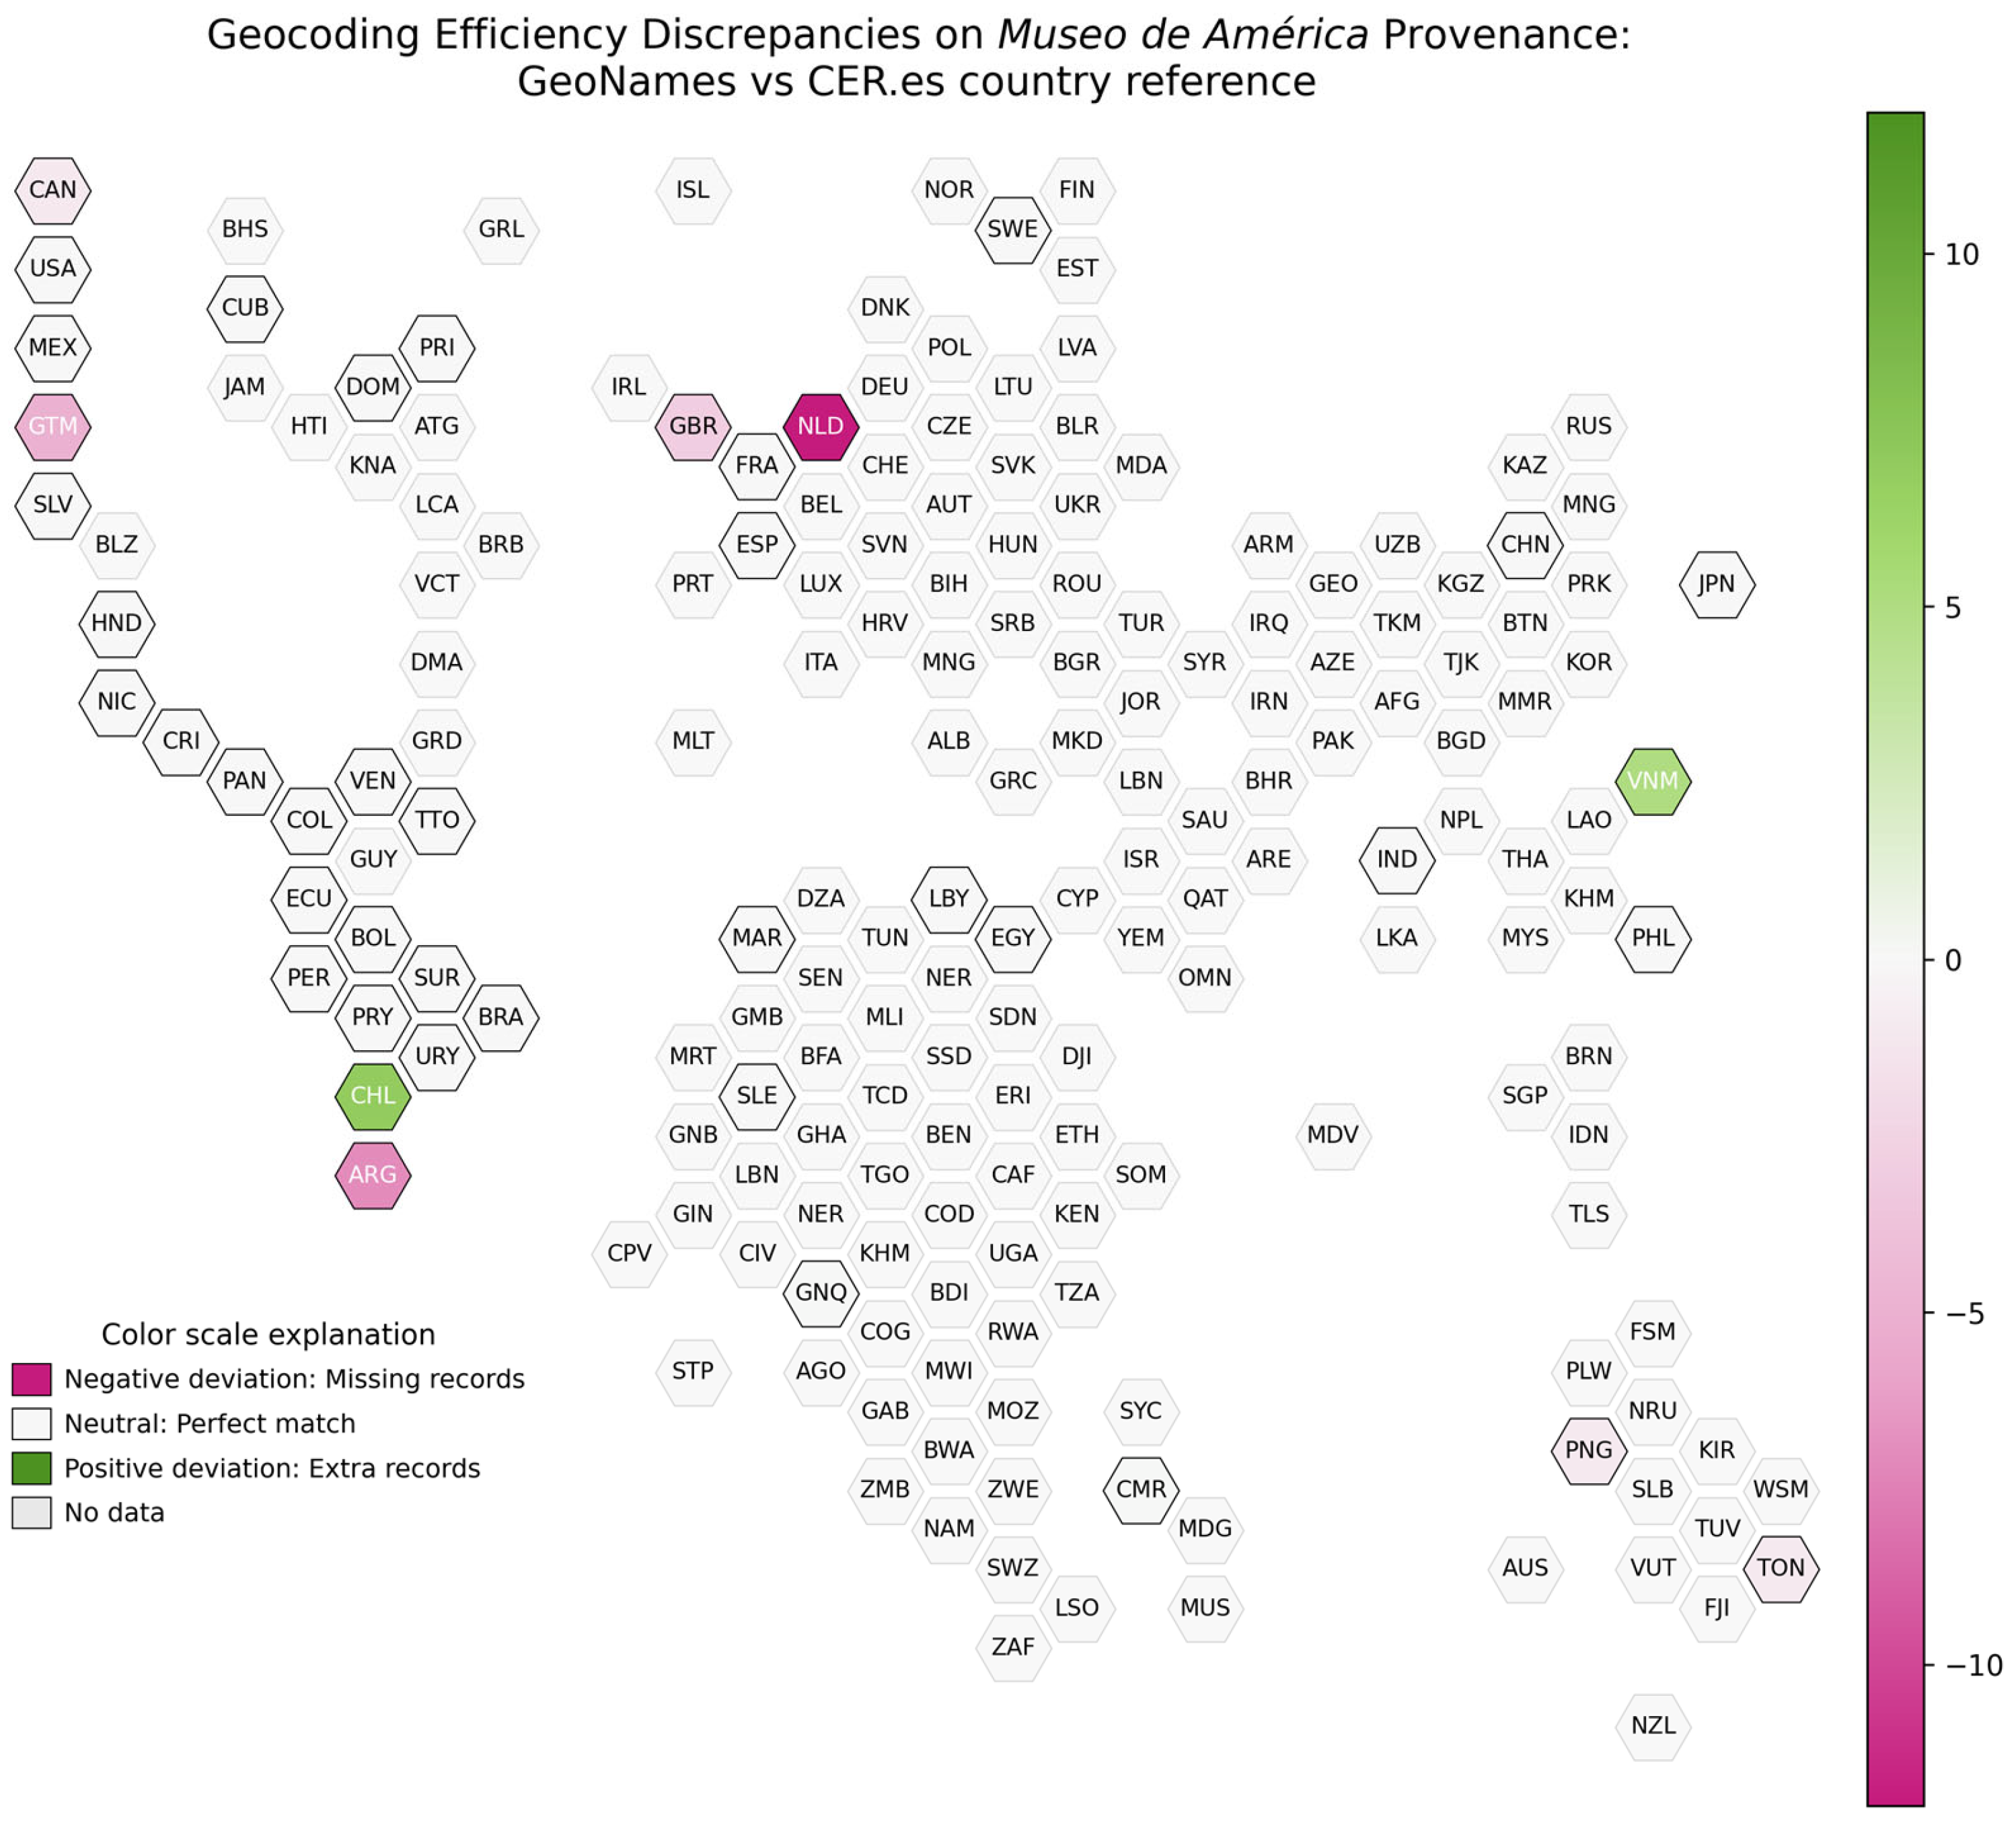
We also provide a “cartogram” graphic for a more comprehensive visualisation of the above (see
Figure 8).
In summary, the visualisation associated with GeoNames is characterised by a predominance of neutral differences (difference of 0 records), as in Brazil, Ecuador, and Mexico, indicating a high consistency between the original and geocoded data. The most notable exceptions are the Netherlands (−12), Argentina (−7), and Guatemala (−5), with negative differences, and Chile (+7) and Vietnam (+5), with significant increases.
3.4. Accuracy Results for RQ4
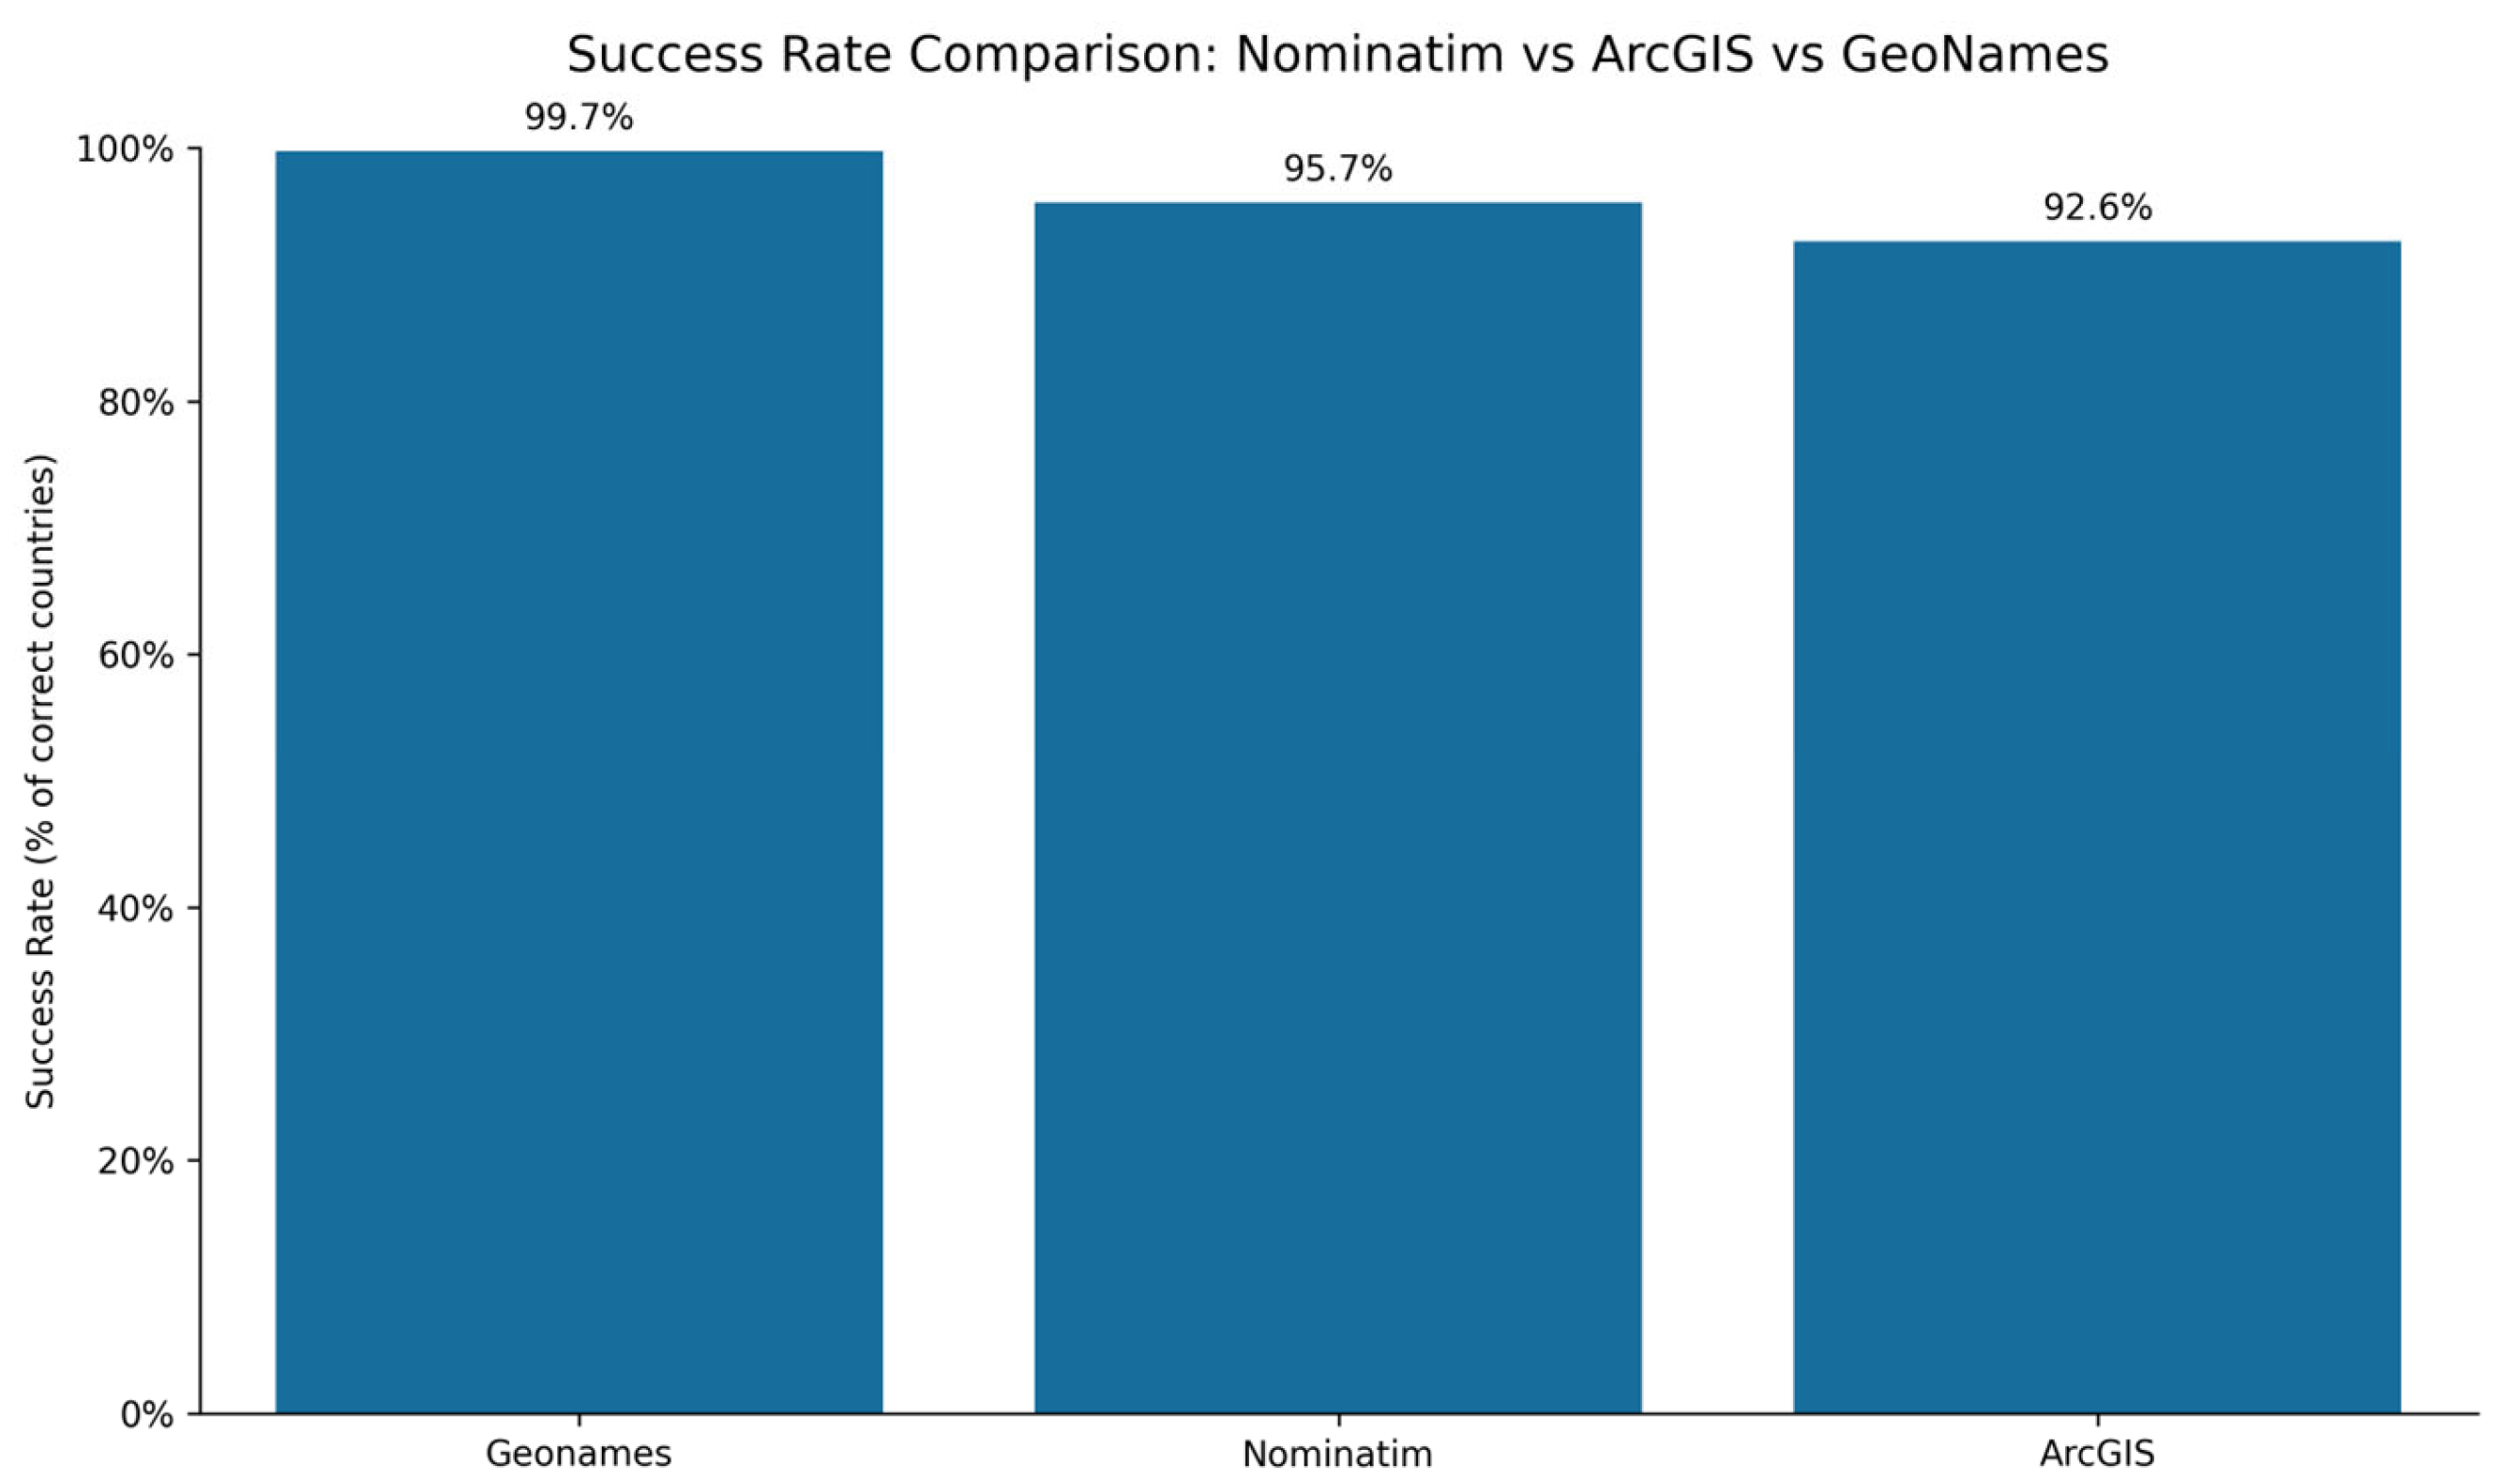
Having used and analysed the different software environments (Nominatim, ArcGIS, and GeoNames), we compared their level of accuracy in georeferencing the spatial data of the 10,200 selected records. The comparison, employing a bar chart, shows the different percentages of success rates of each API (see
Figure 9).
Figure 9 shows small differences in the overall performance of each API; GeoNames stands out, with 99.7% accuracy, closely followed by Nominatim (95.7%) and ArcGIS (92.6%). However, these high percentages are consistent with the data previously analysed in the confusion matrices, where systematic errors were identified in specific cases.
3.5. Accuracy Results for RQ5
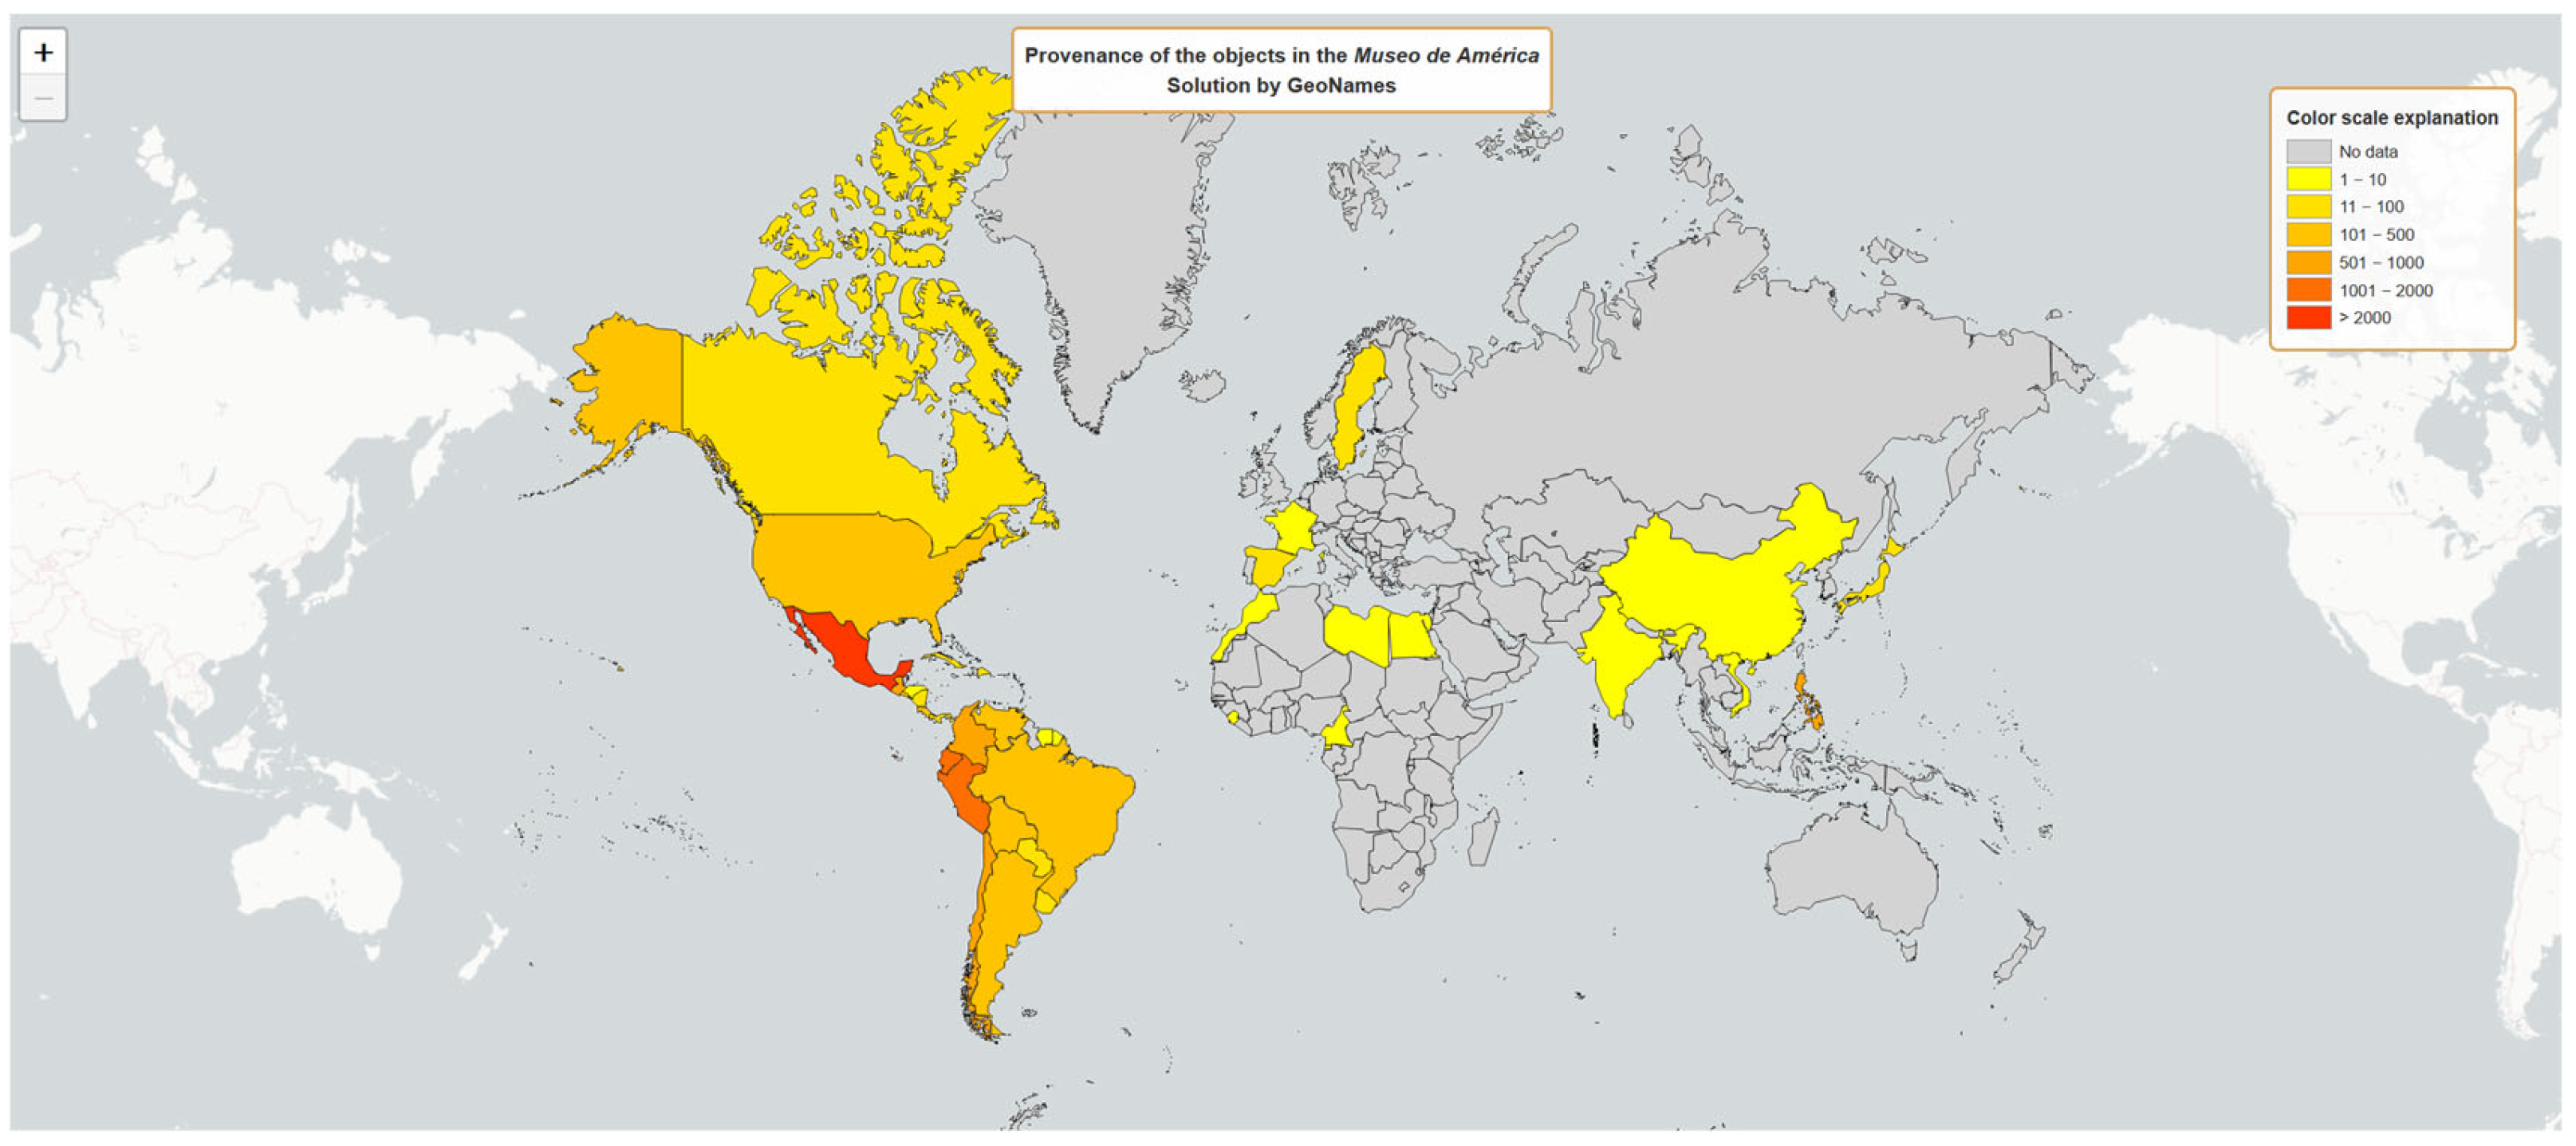
The last research question corresponds to the visualisation of the “Place of provenance” of the pieces belonging to the collection of the Museo de América. Using a choropleth map (see
Figure 10), we found the geographical distribution of the assets based on the processing of their spatial data using the GeoNames API, which we chose due to it having the highest success rate.
As might be expected, the results indicate a marked geographical concentration on Latin America as the place of provenance, with Mexico (2065 objects), Peru (1852), and Ecuador (1754) as the most represented provenances. This is not surprising, considering that some of the museum’s founding collections come from archaeological excavations made during the Enlightenment (such as those carried out in the Mayan city of Palenque or in Huaca de Tantalluc, Peru) or from donations by collectors such as Rafael Larco Herrera or Juan Larrea [
19]. Other well-represented countries are Chile (650), Colombia (600), the Philippines (527), Guatemala (520), and Argentina (495). There is also a smaller but significant number of records from other South American countries, namely Brazil (267) and Venezuela (196), as well as Central American nations such as Costa Rica (318), El Salvador (169), and Panama (75). The United States (172) is another place of origin worth mentioning. Outside the American continent, the figures are notably lower, with specific cases such as Sweden (85) or some Asian countries (China, Japan, India) and African countries (Cameroon, Equatorial Guinea), all with fewer than 15 registered objects. Spain appears with only 32 pieces, which would indicate that very few pieces have come to the Museum from Spanish collections or intermediaries. This is a strikingly low figure, if we take into account the origin of the Museum’s collection in the Royal Cabinet of Natural History [
26], in the successive scientific expeditions to America, and in the National Archaeological Museum, or the strong historical relationship between the Spanish metropolis and its former overseas colonies, so present in this museum. It is conceivable that many of these objects bequeathed to the Museum from Spain itself may have been hidden among those whose place of origin we have not been able to geocode or which are not yet part of the CER.es data.
4. Discussion
Despite the methodological rigour and comprehensive scope of this study, several limitations should be acknowledged, and they also open avenues for future research.
The exclusion of a substantial number of records from the Museo de América’s dataset due to incomplete provenance information raises important considerations for the study’s methodology and results. This omission, while necessary for maintaining consistency in geocoding, potentially introduces selection bias that could skew the representation of provenance clusters. The excluded records may contain valuable information about lesser-known or under-represented regions, which could alter the overall understanding of the collection’s geographical distribution. Additionally, this data gap might inadvertently reinforce existing biases in historical narratives by overemphasising well-documented areas at the expense of less-recorded regions. To address these limitations, future research could employ a multi-faceted approach. This might involve collaborating with museum curators and historians to supplement missing metadata through archival research or cross-referencing with other collections. Advanced computational techniques, such as natural language processing or machine learning algorithms, could be developed to infer missing provenance information based on patterns in existing data or related historical records. However, such methods would require careful validation to ensure accuracy and avoid introducing new biases. Alternatively, researchers might consider developing a statistical framework to account for the uncertainty introduced by missing data, potentially using techniques like multiple imputation or sensitivity analyses to assess the robustness of findings to different assumptions about the missing records.
The use of cartograms in spatial visualisations represents a significant improvement over traditional choropleths, particularly in addressing distortions related to varying country sizes. However, this approach still has limitations in fully resolving spatial misrepresentation issues. While cartograms equalise country areas, they do not completely eliminate area-based distortions or a potential over-representation of certain regions. The concept of “error density” remains an important consideration that was not explicitly quantified or normalised in the presented maps, leaving room for further refinement in future research. To enhance the interpretability and accuracy of geocoded maps in cultural heritage visualisation, future studies could incorporate more sophisticated metrics. For instance, implementing error density calculations or distortion indices could provide a more nuanced understanding of spatial relationships and data distribution. These advanced techniques could help researchers and viewers better interpret the visualised data, accounting for potential biases or misrepresentations that may persist even with the use of cartograms. Such enhancements would contribute to more robust and reliable spatial analyses in cultural heritage studies, offering a more comprehensive view of geographical patterns and relationships in historical and cultural data.
While manual verification could have enhanced the robustness of the dataset by providing a benchmark for accuracy, the decision to forgo this step was guided by both practical and methodological considerations. The scale of the dataset, combined with the study’s focus on evaluating the relative performance of different geocoding services rather than establishing a definitive historical geolocation, made a full manual audit impractical. Moreover, the reliance on the CER.es digital catalogue—an authoritative source maintained by domain experts—provides a reasonable level of confidence in the baseline data quality, reducing the necessity for additional manual cross-checks. The automated internal validation process served as a pragmatic alternative, enabling the researchers to systematically detect and quantify discrepancies between geocoding outputs. By analysing patterns of divergence among the APIs, this study was able to highlight areas of inconsistency and potential error without the need for labour-intensive manual verification. This approach aligns with the study’s overarching goal of assessing geocoding reliability and interoperability, rather than verifying the historical accuracy of each individual record.
Geographic information systems (GISs) and geocoding services play a crucial role in modern spatial analysis and location-based applications. This study focuses on comparing three widely used geocoding APIs: ArcGIS, Nominatim, and GeoNames. Each of these APIs employs different approaches to handle and process geographic information, particularly in relation to toponyms and address data. The research aims to explore the nuances in how these APIs manage and interpret geographic information, with a particular emphasis on their handling of place names and hierarchical data structures. By examining the strengths and limitations of each API, this study seeks to provide insights into their suitability for various geocoding tasks and applications.
Although all three APIs use toponyms, the difference between the three lies in how they handle the information. ArcGIS, which uses a hierarchical search model, benefits from well-defined fields (street, number, city, country). This means that, when performing a search, it is expected to provide values for these fields. Although it works with place names, country information is a standard and necessary component within its search structure, which helps to reduce ambiguity from the outset. It does not solely rely on the place name. In contrast, Nominatim, by relying on OpenStreetMap [
35] (OSM) data, has more flexibility, with free formats. Place names are part of the information it contains but are not necessarily the sole or main identifier in all searches. Geographic information is contained in the labels of objects in OSM but may be inconsistent if the address does not match them exactly. GeoNames, on the other hand, focuses primarily on cataloguing and linking toponyms worldwide. Its database contains millions of place names (cities, towns, mountains, rivers, etc.) and organises them within an administrative hierarchy (country, region, province, etc.). Because of this specialisation, its main identifier is the place name. If there are multiple places with the same name in different parts of the world, GeoNames needs additional information to disambiguate them correctly. Precisely because its focus is on the name, the repetition of that name at the global level generates more confusion if the wider geographic context is not specified.
This research seeks to enhance the understanding of geocoding methodologies and their practical applications in various GIS contexts by examining three distinct geocoding approaches. It is important to clarify that the focus of this study is on comparing the accuracy of different geocoding APIs—Nominatim, ArcGIS, and GeoNames—rather than exploring their internal mechanisms. While this study offers a structured and quantifiable comparison of their performance, it does not aim to explain or evaluate the underlying algorithms, data sources, or potential biases inherent in these APIs.
The decision to limit the scope of the investigation to API performance rather than internal functioning is partly due to practical constraints. Many of these APIs operate as “black boxes,” with their internal processes not publicly documented or accessible. A comprehensive analysis of their algorithms and data sources would require a more extensive investigation, potentially involving proprietary or non-transparent information. Such an in-depth examination was deemed beyond the feasible scope of this particular study, which primarily aimed to assess and compare the practical outcomes of these geocoding services rather than their technical underpinnings.
The dynamic nature of the CER.es dataset presents a complex landscape for researchers and data analysts. As museums continually update and enrich their records, the dataset evolves, potentially altering the representation of provenance information and the associated geocoding landscape. This ongoing evolution necessitates a flexible and adaptive approach to data analysis. Researchers must be prepared to reassess their findings periodically and adjust their methodologies to accommodate new information. The snapshot of data obtained in May 2024 serves as a baseline, but future updates may reveal new patterns or challenge existing conclusions about geospatial distributions and provenance trends. To address this challenge, implementing a system for longitudinal analysis becomes crucial. Regular reassessments of the dataset can help track changes over time, identifying emerging trends and shifts in geospatial patterns. This approach not only ensures the continued relevance and accuracy of research findings but also provides valuable insights into the evolving nature of museum collections and their documentation practices. Additionally, monitoring the performance of geocoding methods over time can lead to refinements in these techniques, potentially improving their robustness and reliability in the face of changing data. By embracing the dynamic nature of the CER.es dataset, researchers can transform this challenge into an opportunity for ongoing discovery and methodological innovation in the field of cultural heritage studies.
Future research in geocoding methodologies for historical datasets could explore several promising avenues. The integration of hybrid geocoding strategies that combine rule-based and probabilistic models may enhance accuracy and flexibility. This approach could leverage the strengths of both methods, allowing for a more nuanced interpretation of ambiguous or incomplete location data. Additionally, the development of semi-automated validation protocols incorporating expert feedback and artificial intelligence could streamline the verification process while maintaining high standards of accuracy. Such protocols could potentially reduce the time and resources required for manual validation while still benefiting from human expertise. Further areas of investigation may include refining visualisation strategies to incorporate error metrics directly into map representations. This could provide users with a more immediate and intuitive understanding of the reliability of geocoded data points, enhancing the interpretability of spatial analyses. Applying the proposed methodology to other institutions and data sources would be valuable for testing its generalisability beyond the Museo de América case study. This expansion could reveal potential limitations or adaptations needed for different types of historical collections or geographical contexts, ultimately contributing to a more robust and widely applicable geocoding framework for cultural heritage data.
5. Conclusions
This study has addressed the challenges inherent in geocoding historical spatial data, focusing on the complexities of ambiguity, granularity, and heterogeneity present in CH data. Through a detailed case study of the Museo de América and the application of three geocoding APIs (Nominatim, ArcGIS, and GeoNames), a comparative view of the accuracy and errors associated with each tool has been provided.
The results reveal that while each API offers valuable capabilities, they also have limitations in handling the particularities of historical data. GeoNames demonstrated the highest overall accuracy, but all APIs exhibited geocoding errors that highlight the need for careful preprocessing and consideration of the specific characteristics of the historical data.
The steps carried out in this study provide a useful framework for GLAM researchers and practitioners working with CH spatial data. The visualisation of the results through interactive maps and graphics facilitates the understanding of object provenance patterns and highlights the importance of addressing geocoding errors to avoid distorted interpretations.
In future research, it is necessary to explore the integration of multiple APIs or the development of hybrid approaches to improve the accuracy of geocoding. In addition, the application of artificial intelligence and machine learning techniques could contribute to the automation and optimisation of the historical spatial data handling process.
In this framework, the preservation of historical data in open and standardised formats ensures their long-term availability and facilitates their use in various fields of knowledge. Interoperability between museum management systems and digital repositories of historical documents is key to maximise the value of heritage data, allowing their linkage with geographical studies and spatial analysis. The evolution of data digitisation and structuring methodologies continues to enrich the field of digital humanities, providing new tools for the exploration of historical and geographical phenomena from a quantitative and critical perspective [
36].


