Article

Evaluation of Urban Street Historical Appearance Integrity Based on Street View Images and Transfer Learning

1
State Key Laboratory of Climate System Prediction and Risk Management, Nanjing Normal University, Nanjing 210023, China
2
School of Geography, Nanjing Normal University, Nanjing, 210023, China
3
Key Laboratory of Virtual Geographic Environment (Ministry of Education of PRC), Nanjing Normal University, Nanjing 210023, China
4
Jiangsu Center for Collaborative Innovation in Geographical Information Resource Development and Application, Nanjing Normal University, Nanjing 210023, China
*
Author to whom correspondence should be addressed.
ISPRS Int. J. Geo-Inf. 2025, 14(7), 266; https://doi.org/10.3390/ijgi14070266
Submission received: 12 May 2025 / Revised: 29 June 2025 / Accepted: 3 July 2025 / Published: 7 July 2025
(This article belongs to the Special Issue Spatial Information for Improved Living Spaces)

Abstract

The challenges of globalization and urbanization increasingly impact the Historic Urban Landscape (HUL), yet fine-grained and quantitative methods for evaluating HUL remain limited. Adopting a human-centered perspective, this study introduces a novel framework to quantitatively evaluate HUL through the lens of Historical Appearance Integrity (HAI). An evaluation system comprising four key dimensions (building materials, building colors, decorative details, and streetscape morphology) was constructed using the Analytic Hierarchy Process (AHP). An Elo rating system was subsequently applied to quantify the scores of the indicators. A prediction model was developed based on transfer learning and feature fusion to estimate the scores of the indicators. The model achieved accuracies above 93% and loss values below 0.2 for all four indicators. The framework was applied to the Inner Qinhuai Historical Character Area in Nanjing for validation. Results show that the spatial distribution of HAI in the area exhibits significant spatial heterogeneity. On a 0–100 scale, the average HAI scores were 23.17 for primary roads, 27.73 for secondary roads, and 46.93 for branch roads. This study offers a fine-grained, automated approach to evaluate HAI along urban streets and provides a quantitative reference for heritage conservation and urban renewal strategies.

1. Introduction

The urban built environment reflects layers of material representation from different historical periods, and it retains traces of the past while continually acquiring new meanings through ongoing transformation. In many cities worldwide, the tension between urban development and heritage conservation has intensified [1], leading to the deterioration of the Historic Urban Landscape (HUL) integrity [2]. HUL, including its tangible and intangible components, is strategically significant in shaping national, ethnic, and cultural identities [3]. In many instances, it has become a defining feature of cities [4]. Cities that preserve the integrity of HUL are often more successful in expressing distinctive cultural values, thereby gaining a competitive edge in the global urban arena [5]. Additionally, HUL represents a valuable local asset. Its conservation and revitalization can foster heritage tourism and stimulate economic growth [6,7,8,9]. However, the effectiveness of HUL preservation and revitalization and their outcomes remain matters of ongoing concern in the academic community [2].
Evaluating the effectiveness of preservation and revitalization is essential for the informed management of HUL. It serves as a critical foundation for developing targeted strategies [9,10]. The evaluation of HUL is a multifaceted topic, encompassing elements such as visual character, cultural meaning, and historical value. Traditionally, the evaluation of HUL has often considered the entire historic districts as the basic units of assessment, serving as key carriers of HUL and representing concentrated and representative areas of cultural heritage in cities [11]. Evaluation objectives typically include the integrity of architectural heritage, the authenticity of spatial form and layout, the continuity of cultural values, and the effectiveness of renewal and preservation efforts [8,10,12,13]. In terms of methodology, data are primarily collected through field investigations and questionnaire-based surveys, which are relatively costly and inefficient, causing difficulty in maintaining pace with the accelerating speed of urban development [8,10,12,13]. In recent years, with the support of Geographic Information Systems (GIS) and multi-source data, some studies have attempted to adopt more advanced approaches to evaluate HUL. However, most research still relies on commonly used evaluation metrics in the field of urban studies, such as street visual quality, street vitality, and tourism resources [11,14,15]. Only a limited number of studies have considered the unique characteristics of historic districts, focusing on the integrity of the historical landscape and the diversity of historical culture within these areas [16,17]. Although GIS-based approaches have offered valuable insights into the evaluation of HUL, they often neglect residents’ perceptions of the visual expression and aesthetic imagery embodied in historical landscapes. As an integration of visual expression and aesthetic imagery, historical appearance inherently depends on individual experiences and perceptions, and understanding such perceptions is essential for the effective evaluation and protection of historical landscapes [18]. While some traditional evaluation frameworks have acknowledged the importance of historical appearance, scientifically grounded criteria for its accurate evaluation remain limited. Moreover, due to their reliance on field-based investigations, traditional methods face significant challenges in enabling large-scale quantitative evaluation of historical appearance.
Recent advancements in spatial big data, computer vision, and deep learning technologies offer potential solutions to these challenges. Among various data sources, street view images (SVIs) stand out for their broad coverage, low acquisition cost, and ability to capture the built environment from the pedestrian perspective. SVIs have become a valuable resource in geographic and urban studies. With rapid deep learning and computer vision advances, SVI-based urban analysis has expanded significantly [19]. Recent studies have demonstrated that combining SVIs with deep learning enables the large-scale, automated evaluation of human perception of urban landscape [20]. Meanwhile, some researchers have extracted building façade colors from SVIs and evaluated the color harmoniousness of buildings in historic districts [21,22], underscoring the potential of SVIs in evaluating perceived historical appearance at scale.
Therefore, this study aims to construct a quantitative and fine-grained evaluation framework for HUL by leveraging SVIs and transfer learning based on residents’ perception of historical landscapes, which, similar to human perception of urban landscape, is regarded as an intervention or mediation between physical features and human behavior [20]. Through this framework, we address the current gap in fine-grained historical landscape evaluation from the perspective of human perception. Guided by the HUL principles and local heritage management practices, we propose the concept of Historical Appearance Integrity (HAI) and evaluate it from four key dimensions: building materials, building colors, decorative details, and streetscape morphology. We then design a multimodal convolutional neural network tailored to the visual characteristics of historical appearance and apply transfer learning to address limited training data scenarios. This framework is used to evaluate the HAI of the Inner Qinhuai Area in Nanjing, producing a detailed spatial map of its distribution. The key contributions of this study include: (1) developing a quantitative and fine-grained HAI evaluation framework grounded in residents’ perception of urban landscape, offering a new perspective for evaluating HUL; (2) applying feature fusion and transfer learning to support the quantitative measurement of urban perception under small-sample conditions; (3) uncovering fine-grained spatial distribution of the HAI across Nanjing’s Inner Qinhuai Area, offering actionable implications for planners and policymakers.

2. Literature Review

2.1. Relevant Studies on the Conservation and Evaluation of Historic Urban Landscape

The concept of environmental respect began to take shape in the early 20th century and was formally articulated in the Athens Charter of 1931 [23], which emphasized the importance of preserving historically significant buildings and urban areas rather than demolishing them. This charter laid a conceptual foundation for the protection of HUL [24]. As global urbanization and modernization accelerated, the safeguarding of urban heritage has faced increasing challenges [4]. In response, the Vienna Memorandum (2005) introduced the HUL concept [25], which was subsequently formalized in the UNESCO Recommendation on the HUL (2011). HUL is defined as “the result of a historic layering of cultural and natural values and attributes,” [3] underscoring the intrinsic connection between HUL conservation and sustainable urban development [16]. Accurate evaluation of HUL is essential for its protection, adaptive reuse, and integration into contemporary urban renewal processes [9,10,16]. Over the past decades, numerous studies have been conducted to assess HUL, including traditional fieldwork-based methods and GIS-based approaches that integrate multi-source data. Traditional methods primarily construct evaluation systems using the Analytic Hierarchy Process (AHP), which typically include subjective and objective, as well as qualitative and quantitative indicators [8,10,12,13]. In some field-based assessments of historic districts in China, the importance of historical appearance has received attention [12]. However, due to the lack of a scientific definition and clear evaluation criteria, these assessments have relied primarily on the investigators’ judgment. As a result, the outcomes are highly susceptible to the investigators’ qualifications and the conditions under which the assessments are conducted, leading to limited reliability and consistency. At present, a clear gap remains in scientifically and accurately evaluating the perception of historical appearance. In addition, these traditional approaches typically rely on labor-intensive data collection methods such as field surveys and questionnaires. This technique not only limits efficiency but also hinders the ability to conduct fine-grained evaluations or scale the methods to larger urban areas, especially in the face of rapidly evolving urban development demands [26]. With the development of GIS technologies, recent research has increasingly focused on the integration of multiple data sources, such as field surveys, point-of-interest datasets, remote sensing imagery, and online textual information, to build structured data frameworks, enabling the management and integrity evaluation of HUL [16,27]. Compared with traditional approaches, GIS-based methods are generally more efficient and cost-effective. Nevertheless, they present notable limitations. Most of these methods rely on highly abstracted and structured datasets to conduct top-down, large-scale evaluations, often overlooking the perceptions of urban residents, particularly lacking quantitative tools to capture perception-related dimensions of historical appearance, such as visual consistency and aesthetic imagery. Furthermore, some other GIS-based studies have evaluated aspects such as vitality, visual quality, and tourism-related factors of historic districts [11,14,15]. Although these studies take historic districts as their target of evaluation, their focus remains on general indicators commonly used in urban studies, with relatively little attention provided to the unique heritage and cultural attributes embodied in historical landscapes.
To better understand historical appearance, we must initially understand the concept of the historical townscape. Historical townscape refers to the distinctive image and character a city develops over time, reflecting its physical form and its cultural and social context. It encompasses the visual forms and aesthetic expressions presented by the historical landscape, as well as the intangible cultural meanings embedded within, such as historical continuity, local identity, and collective memory [28,29]. In more specific terms, the historical townscape consists of tangible and intangible elements [30]. The intangible dimension refers to non-material cultural attributes such as social customs, local traditions, and oral histories, an experiential quality that permeates the lived space of the city. In contrast, the tangible dimension pertains to the overall visual appearance and aesthetic impression of the urban landscape, reflected in its natural and built environments [31]. In this study, we regard historical appearance as the tangible dimension of the historical townscape. A review of current urban historical townscape planning and control practices in China suggests that two main elements comprise the tangible elements of historical townscape [32,33]. The first includes apparent elements with purely visual attributes, such as building materials, color schemes, decorative details, and roof styles. The second consists of volumetric elements that reflect the streetscape morphology, such as street frontages, building height, and building skyline. Some studies have highlighted building materials [10,34] and building façade color [35,36] as key visual components of historical appearance, emphasizing their importance in preserving the integrity of HUL.

2.2. Relevant Studies on the Use of SVIs in Examining Urban Built Environments

SVIs have emerged as a valuable data source in urban studies, offering a novel perspective and analytical dimension due to their extensive spatial coverage, relatively low acquisition cost, and fine-grained visual representation of street-level environments [19,37,38]. Currently, SVIs are accessible in over 100 countries and cover nearly half of the world’s population [39]. In contrast to remote sensing imagery, point-of-interest data, or textual records, SVIs present a pedestrian-like perspective and are rich in visual cues of urban scenes, making them particularly effective for characterizing the built environment [40]. In parallel, advances in artificial intelligence, particularly in deep convolutional neural networks (CNNs), have revolutionized the field of computer vision and significantly improved performance in image segmentation, object recognition, and classification tasks [41]. An urban visual intelligence framework that integrates SVIs and artificial intelligence is reshaping the way researchers perceive and measure cities [42]. A growing number of urban researchers have adopted SVIs as a primary data source and applied deep learning techniques to extract multidimensional features of the built environment. These works include classification of land-use types and street types [43,44], recognition of facade colors and visual labels [21,45], and measurement and evaluation of urban greenery quality [46,47]. Some studies have also recognized the value of historical SVIs in exploring changes in the urban built environment over time [48]. Another growing area of research focuses on modeling residents’ perceptions of urban landscape using SVIs and deep learning. A pioneering effort in this direction is the Place Pulse project, initiated by the Massachusetts Institute of Technology (MIT) in 2010, which crowdsourced paired comparisons of Google Street Views to construct a dataset of perception ratings based on visual environmental features. Place Pulse 1.0 included images from four cities and focused on three perceptual dimensions: safety, liveliness, and beauty [49]. Subsequent studies applied CNNs to predict these perceptual attributes across urban scenes [50]. Place Pulse 2.0 expanded the dataset to 56 cities and added new dimensions, such as wealth, gloominess, and boredom. Building on this expanded resource, Chinese researchers selected four key perceptual factors—safety, oppressiveness, vitality, and aesthetics—to generate spatial perception maps of Shanghai’s urban landscape [20]. Longitudinal studies have further employed SVIs collected over 10 years to assess temporal changes in the visual quality of public housing environments in cities, including Singapore and New York [51].
In addition to the Place Pulse initiative, several studies have constructed custom datasets to investigate perceptions of urban walkability [52], building color harmoniousness [22], perceived urban stress [53], and overall street quality [54], demonstrating the connection between the visual elements contained in SVIs and intangible urban perceptions. Although human perception is inherently subjective, these works collectively demonstrate the feasibility of employing SVIs and CNNs for large-scale perceptual assessment of urban environments. This feasibility stems from two key factors: First, SVIs simulate the natural visual experience of pedestrians, thereby offering more realistic data, representative of human-scale perception [40]; second, CNNs possess robust visual feature-learning capabilities, enabling accurate extraction and interpretation of subtle cues within urban scenes [55]. Previous studies have enhanced our understanding of urban landscape from the perspective of residents’ perception. However, historical landscapes, as distinctive outcomes of long-term urban transformation, have not received focused attention regarding their perceptual value. The way urban residents perceive historical landscapes serves as a crucial link between individuals and the history of the city, fostering cultural identity and a sense of historical belonging. Therefore, it is necessary to establish an evaluation framework dedicated to the perception of historical landscapes.

3. Materials and Methods

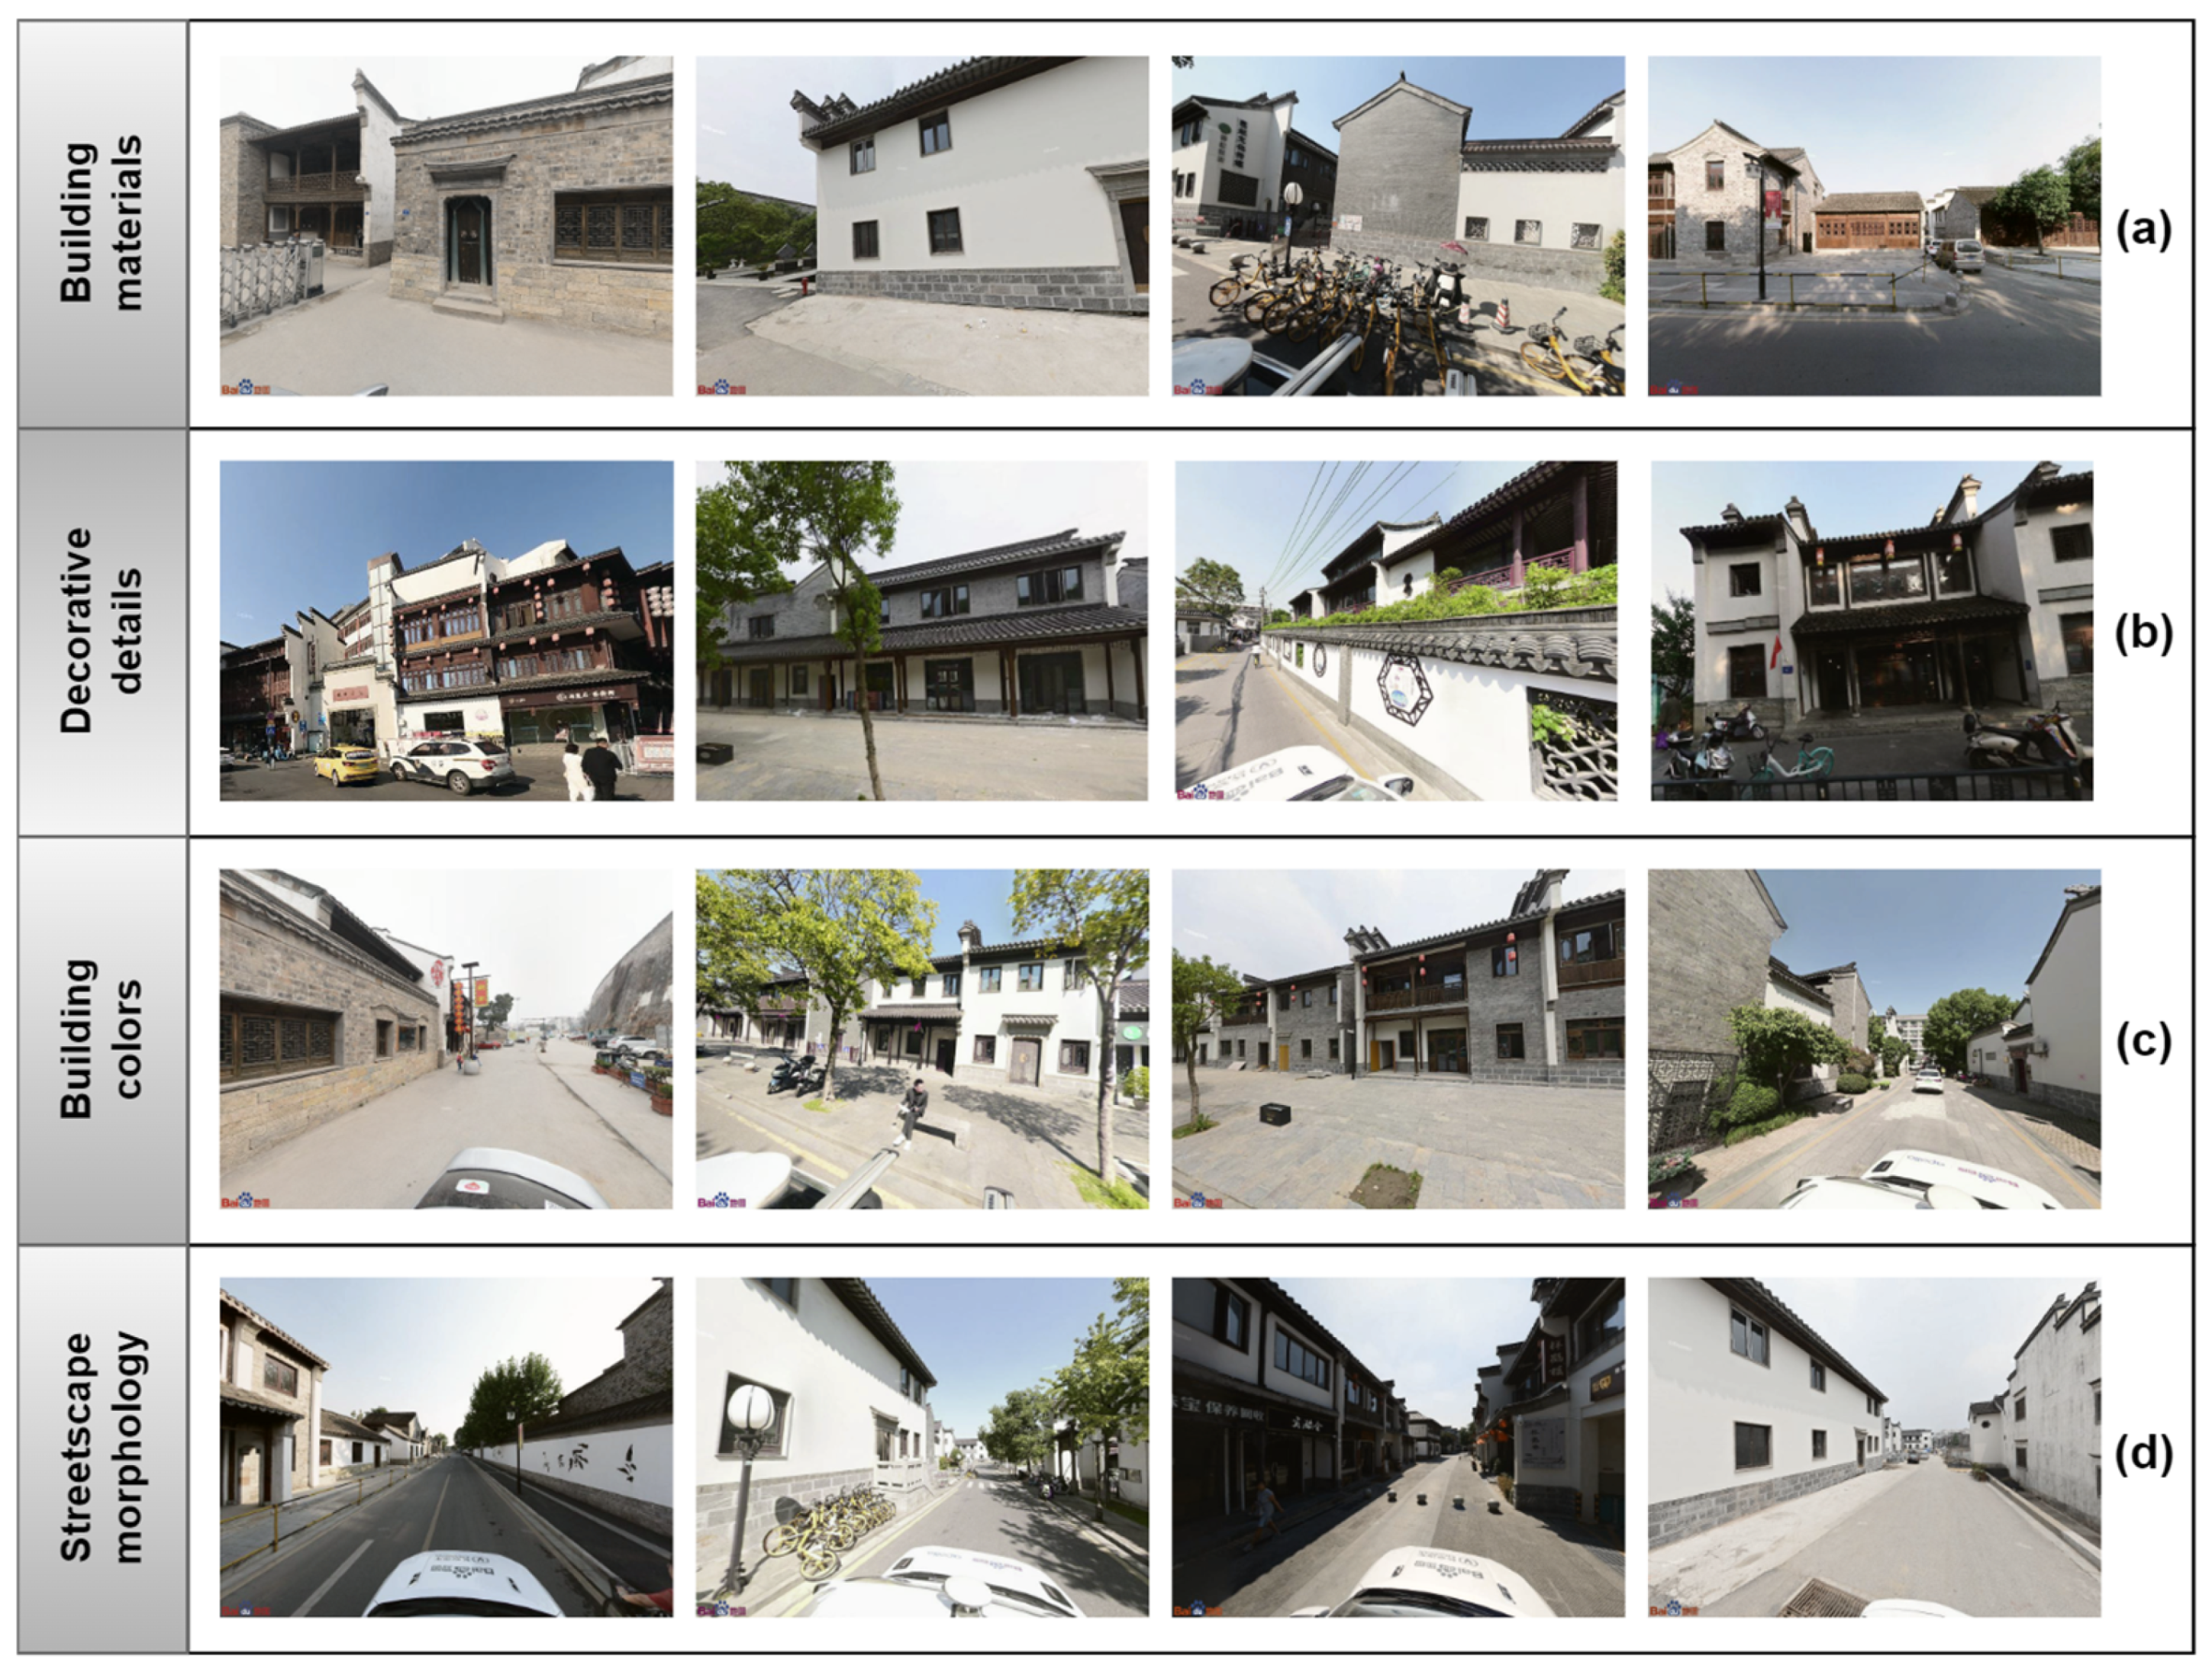
3.1. Conceptual Definition and Research Framework
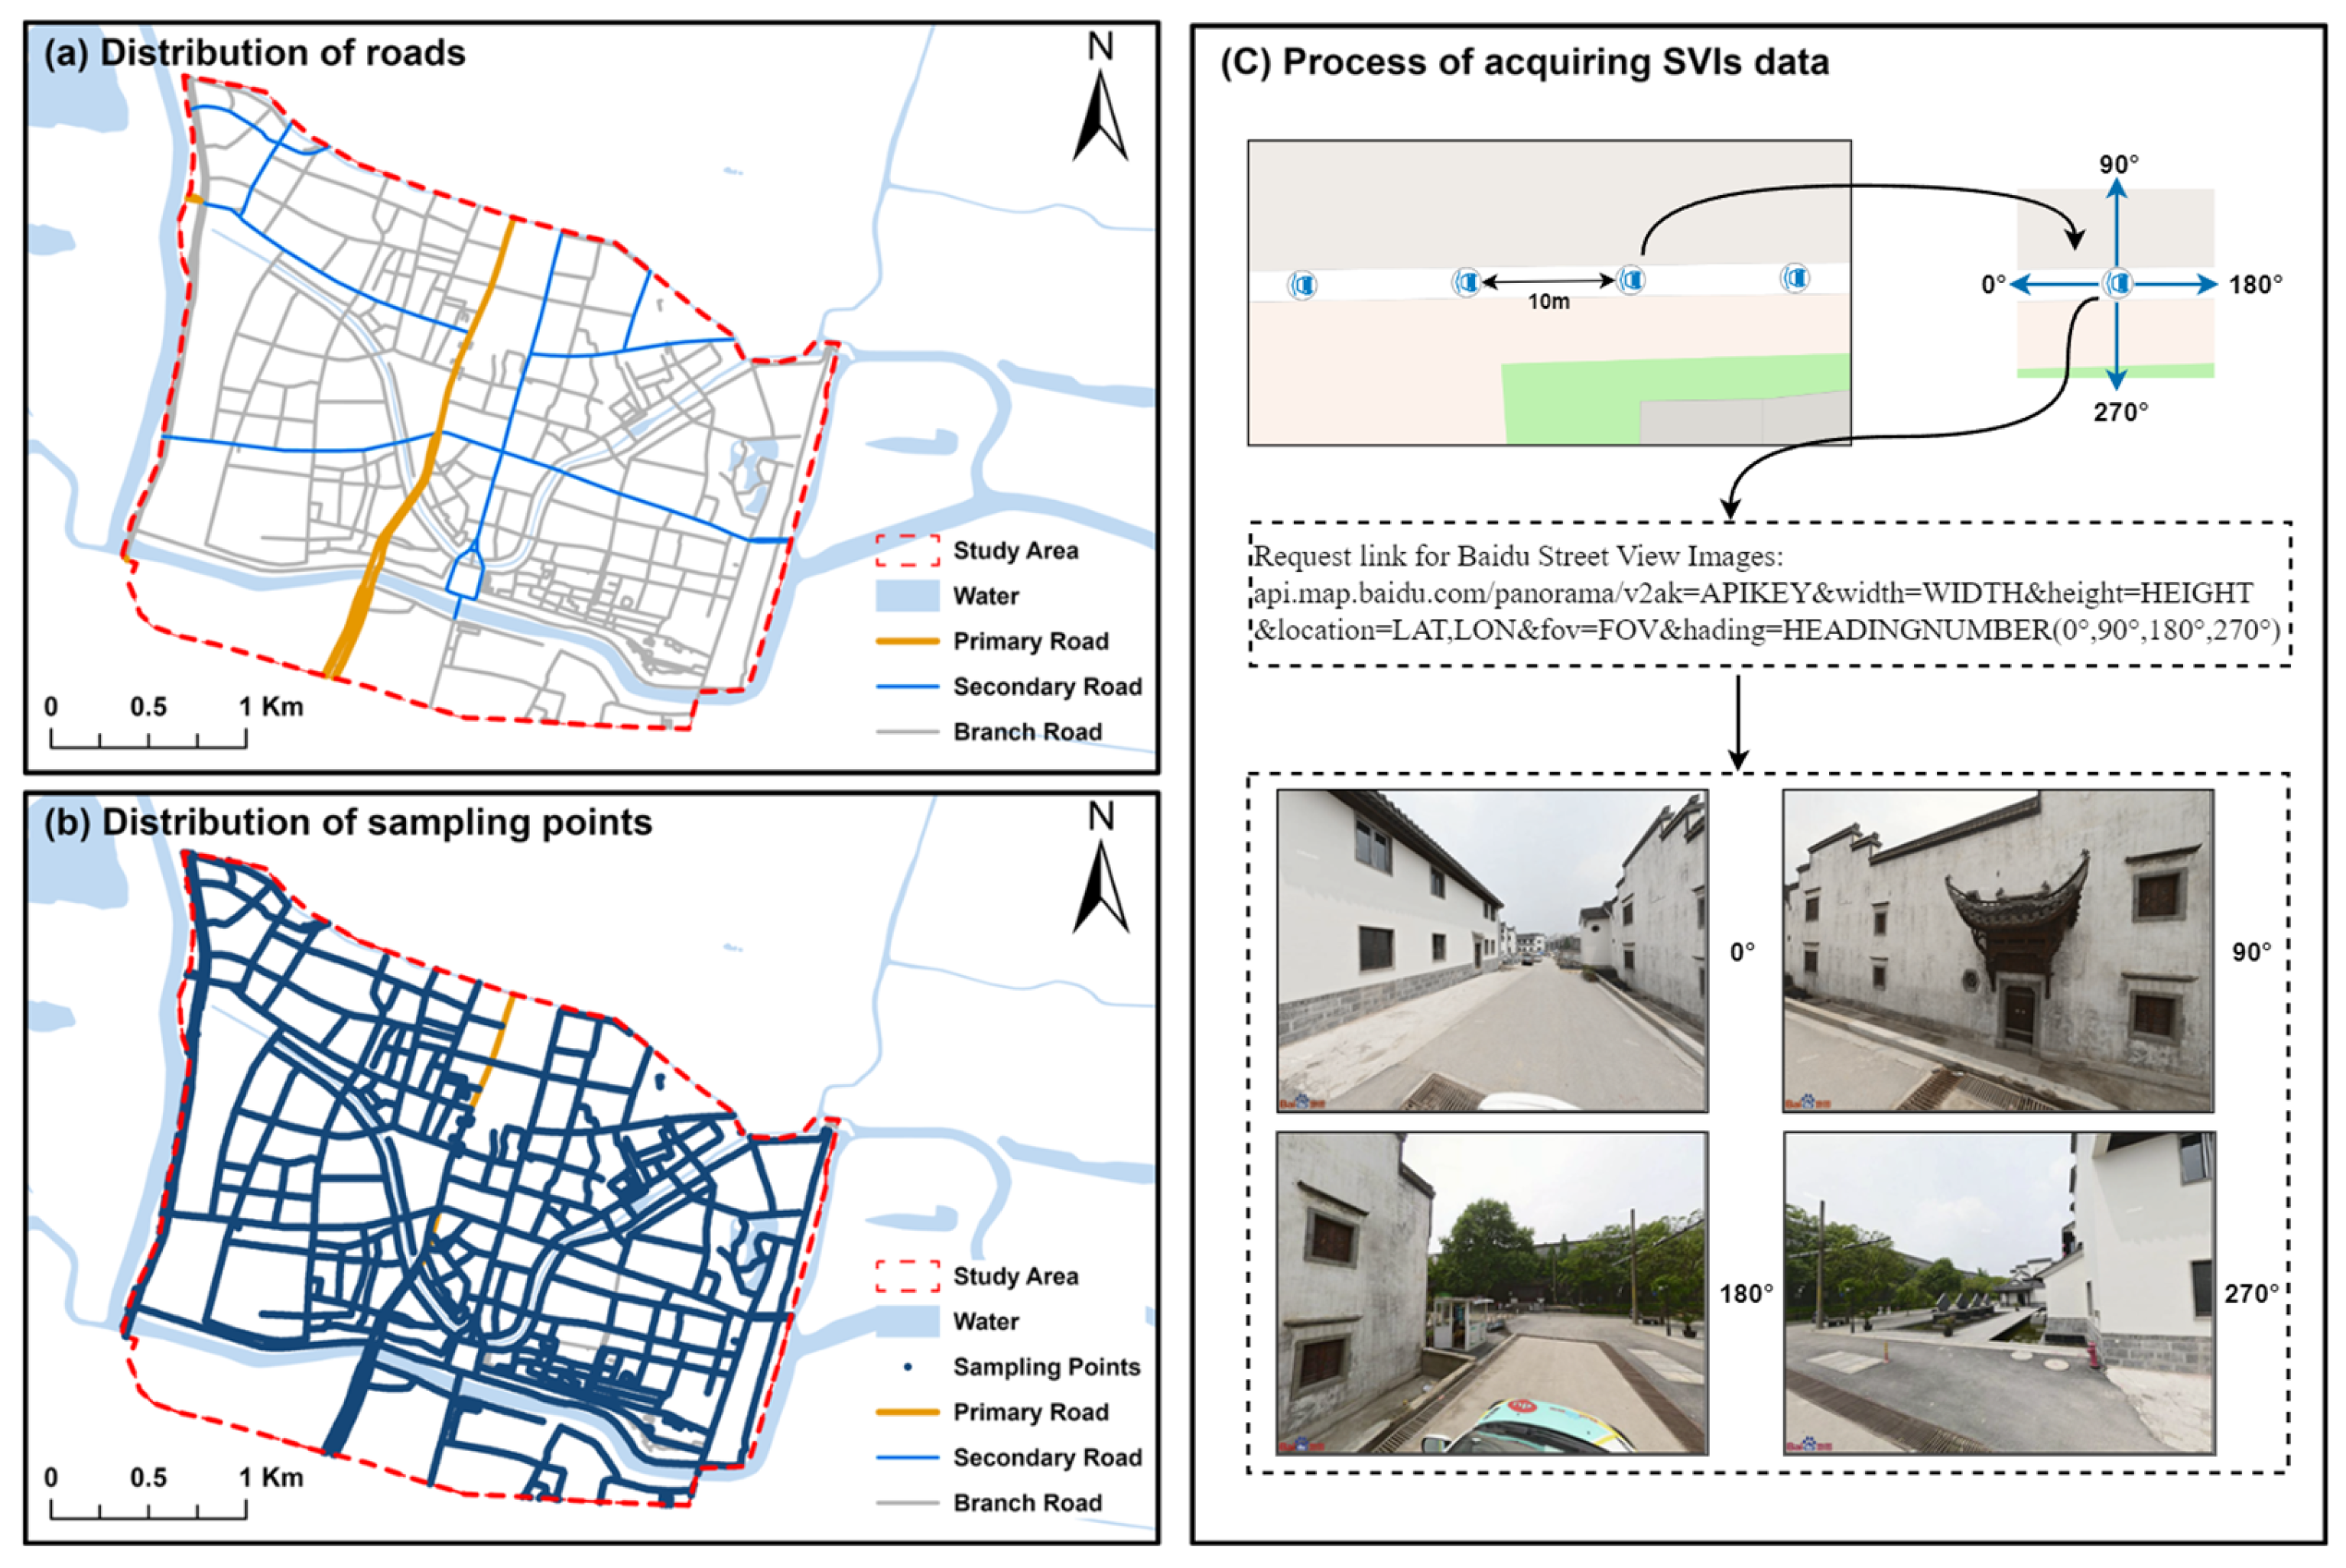
This study adopts a human-centered approach and introduces the concept of HAI as an indicator for measuring how fully a street or urban area reflects local cultural characteristics or historical typologies through its visible features. We develop an HAI evaluation system based on current urban historical townscape planning and control practices in China to ensure an objective and structured evaluation [32,33]. The system comprises four indicators: authenticity of building materials, decorative details, building colors, and streetscape morphology, which together provide a relatively comprehensive reflection of the historical landscape characteristics of the Jiangnan water-town style in the Inner Qinhuai River area, where Ming and Qing architecture is integrated with a water-based street and alley network.
Figure 1a illustrates typical building materials found in the study area, such as gray bricks, tiled roofs, timber frames, and stone carvings. Building materials that more accurately reflect the original texture, visual quality, and craftsmanship of the historical environment receive higher scores for building materials authenticity. Figure 1b presents representative decorative elements, including wooden and stone carvings, dougong (bracket sets), ornate window lattices, and floral grilles. Decorative elements that better preserve the historical style, detailing, and artisanal techniques receive higher scores for decorative details authenticity. Figure 1c illustrates characteristic architectural color palettes, such as warm reds and subdued tones of gray and white. Building facades that more accurately reflect traditional color schemes associated with specific historical periods or regional aesthetics are rated higher in building colors authenticity. Figure 1d depicts the typical streetscape morphology of traditional street blocks in the study area, characterized by moderate road widths, appropriate building heights, and a coherent architectural rhythm. Streetscape morphology that more closely resembles traditional urban forms and spatial organization receives higher scores in streetscape morphology authenticity.
SVIs, captured from a pedestrian perspective, provide accurate information on the urban built environment, including building materials, decorative details, building colors, and streetscape morphology. In this study, deep learning methods are used to extract relevant visual features from SVIs. Combined with expert annotations and Elo rating, this approach supports a scalable approach for evaluating HUL from the perspective of perceived historical appearance. The overall framework is illustrated in Figure 2. In Step 1, data collection and processing, SVIs of the study area were obtained using the Baidu API, followed by white balance adjustment to minimize the impact of weather conditions on color perception. In Step 2, semantic segmentation and dominant color extraction, the preprocessed images were fed into a semantic segmentation model, which identified and filtered images based on pixel proportion corresponding to building-related semantics. The semantic segmentation model generated segmentation maps and extracted building parts. The segmentation maps and the dominant colors identified from the building parts will be used in the subsequent feature fusion process of the HAI evaluating model. In Step 3, expert judgment and Elo rating, representative samples were selected from the filtered images, and the relative scores of the four evaluation indicators were determined using expert judgment combined with the Elo rating. In Step 4, HAI evaluation, an evaluation model was developed based on transfer learning and multi-modal feature fusion to address the limited size of the training dataset. Each indicator’s dataset was used to train the model independently, yielding optimal parameters for each aspect. The trained model predicted the scores of the four indicators for each street view, which were further weighted using the AHP to derive a final HAI score.

3.2. Study Area

The Inner Qinhuai Historical Character Area in Nanjing was selected as our study area. As shown in Figure 3, the area is primarily located in the central–western part of Qinhuai District, Nanjing, Jiangsu Province. According to the Revised Protection Plan for the Inner Qinhuai Historical Character Area, the site extends from the West Water Pass, through Zhonghua Gate, and reaches the East Water Pass. It is structured along the V-shaped Inner Qinhuai River, with the outer edges of the existing road network serving as the northern and southern boundaries, covering approximately 47.63 hectares. Developed along the Inner Qinhuai River, the historical character area is characterized by its iconic riverside guild halls and traditional residential buildings. It integrates multiple functions, including historical exhibition, folk culture, handicraft display, tourism, commerce, and leisure, reflecting the rich cultural heritage of Nanjing’s renowned “Ten-Mile Qinhuai”.

3.3. Data Collection and Preprocessing

The road network data were obtained from OpenStreetMap. In ArcGIS Pro, the dataset was clipped using the polygon boundaries of the study area. The resulting network was refined through filtering and projection, then systematically sampled at 10 m intervals, producing 8782 sampling points. We developed a Python 3.13.5 script to retrieve SVIs from the Baidu Maps API. At each sampling point, SVIs were collected from four directions (0°, 90°, 180°, and 270°), yielding a total of 31,395 valid SVIs across the study area. The SVI acquisition workflow is illustrated in Figure 4. Due to variations in acquisition time and weather conditions, the collected SVIs exhibited inconsistencies in color and brightness. A deep learning-based white balance adjustment was employed to mitigate these effects [56], ensuring that most processed SVIs were normalized under approximately consistent lighting conditions (Figure 5b).

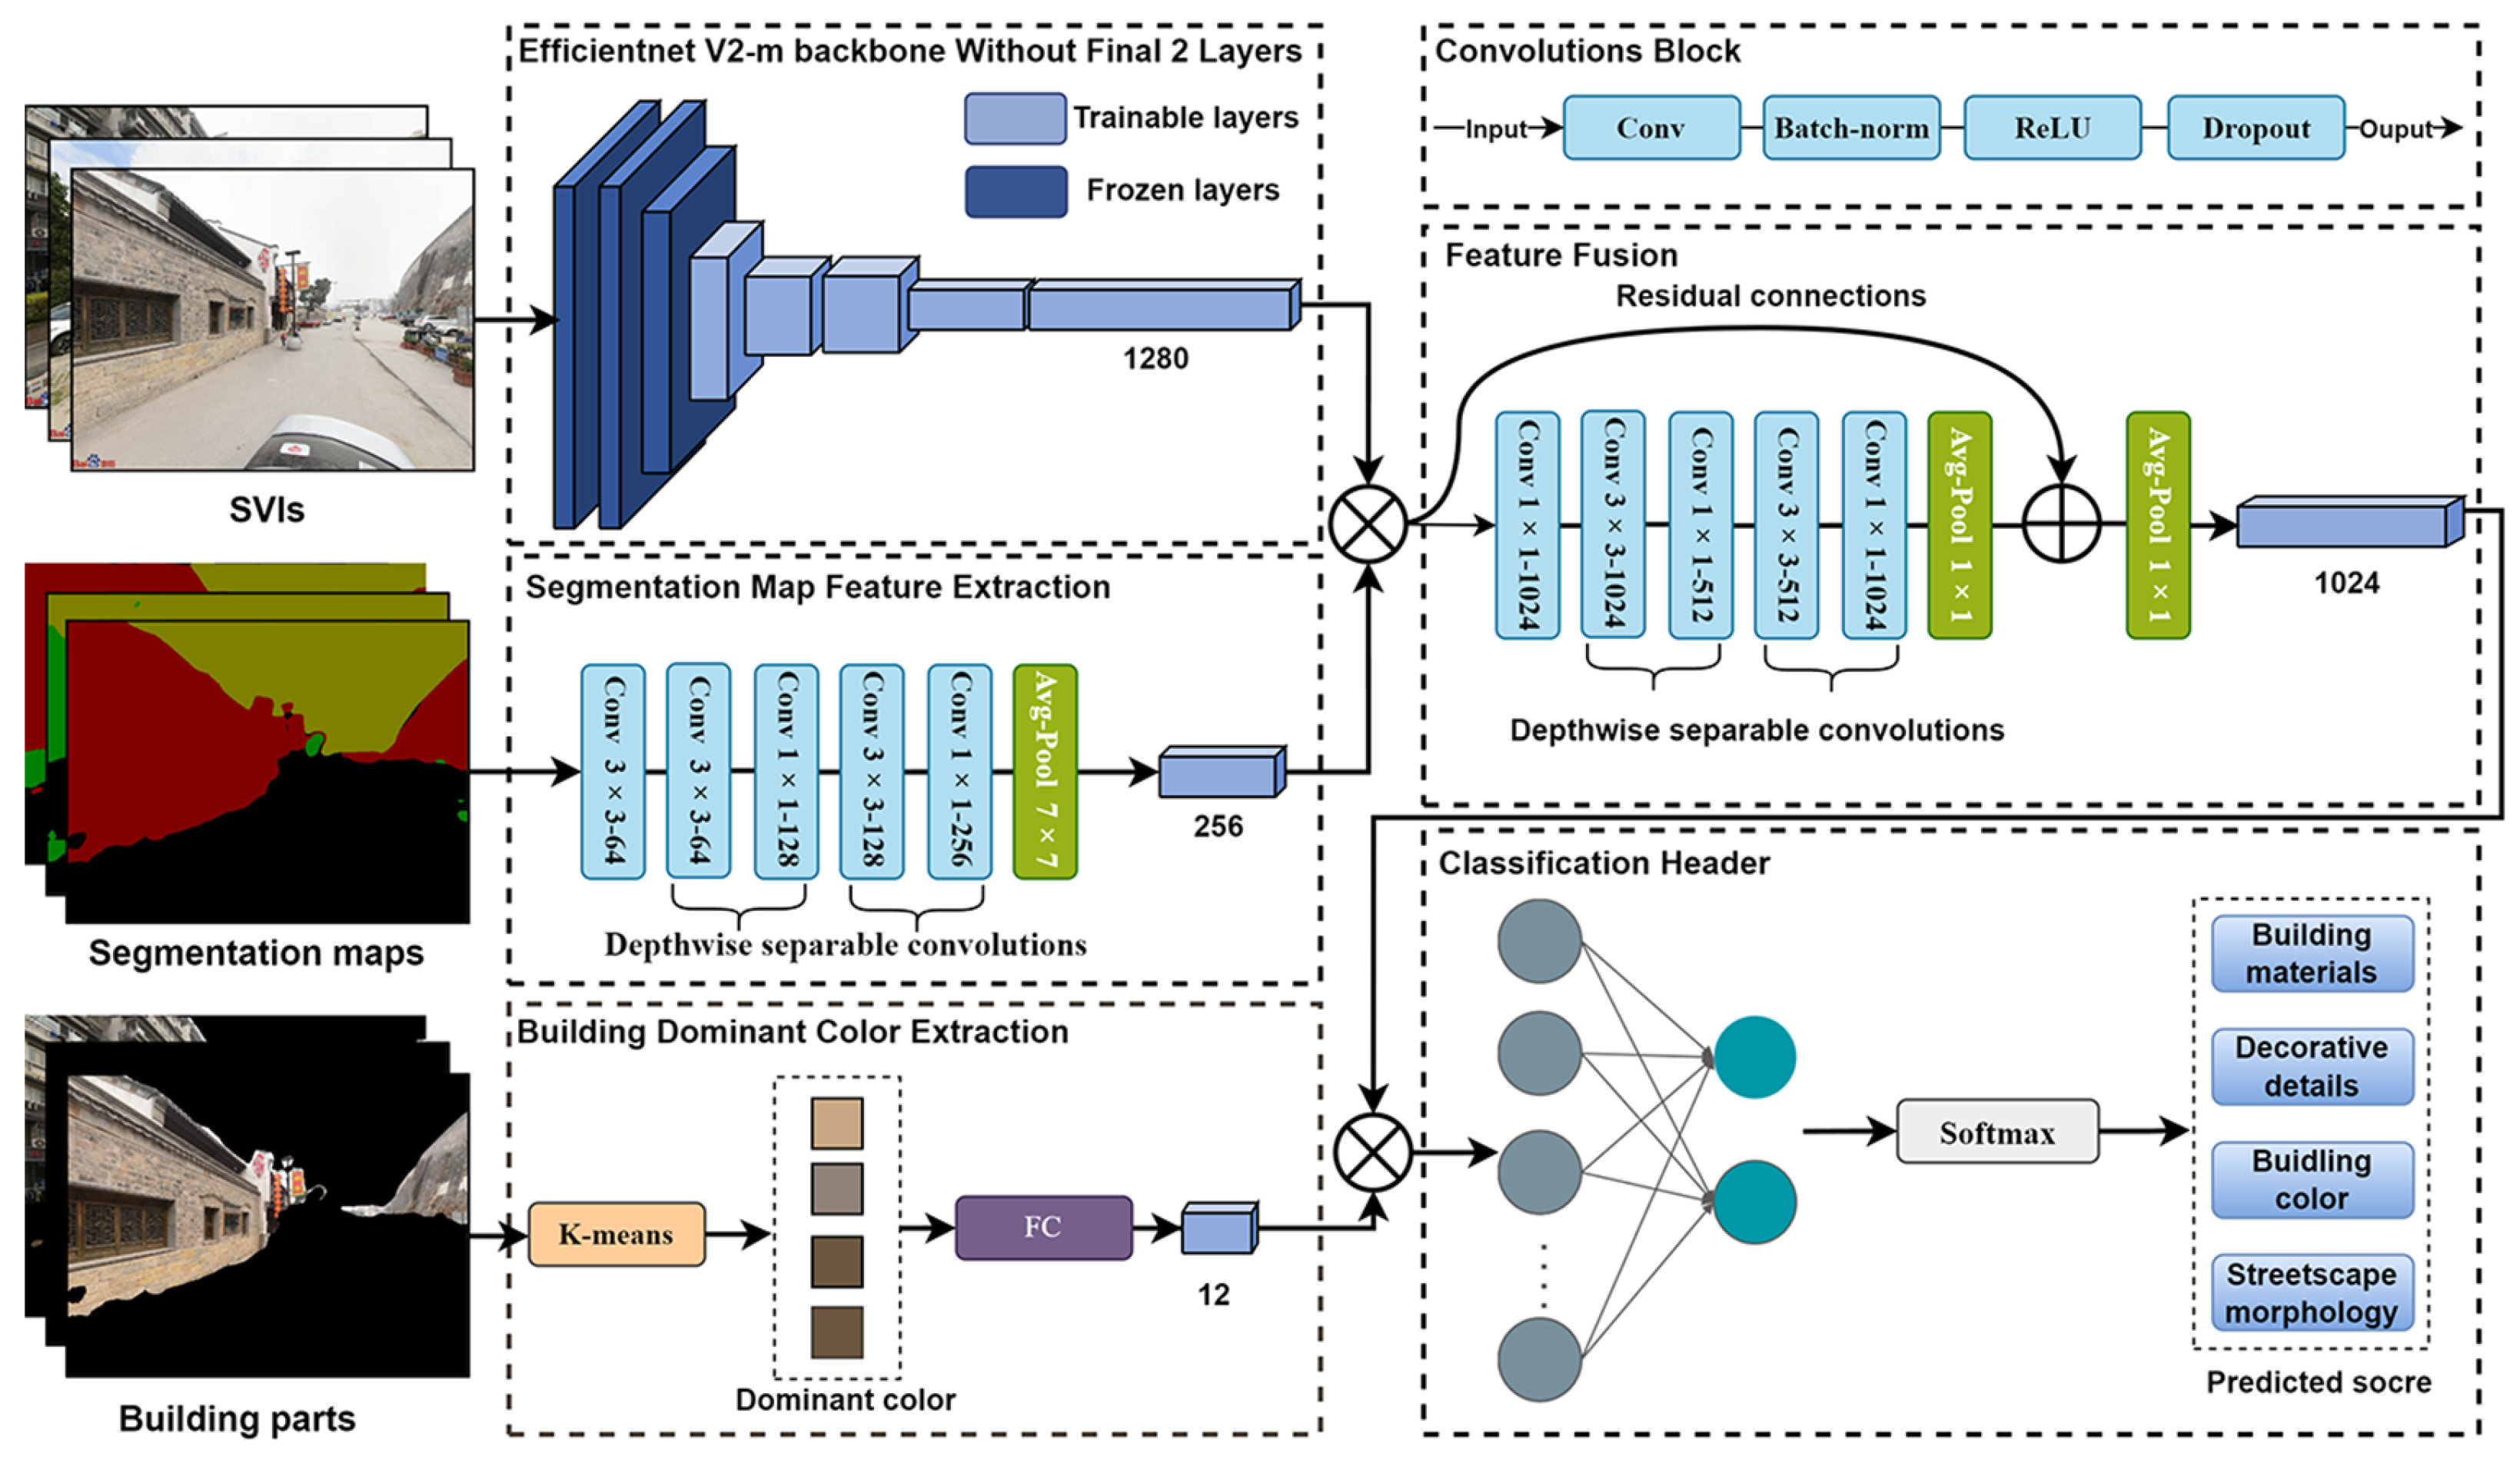
3.4. Semantic Segmentation and Building Dominant Color Extraction

Semantic segmentation and dominant façade color extraction are designed to capture semantic and visual features indicative of historical appearance. Building structures, as the core carriers of historical heritage, have long been central in evaluating historical appearance [10,12,32,33]. Among the key physical features of buildings, facade color plays a critical role, closely associated with elements such as style, materials, and decorative details [36]. In addition, the sky and greenery are important components of urban landscape [57], and street types tend to exhibit different canyon patterns, which are evident in the semantic segmentation map [44]. Therefore, in this study, we perform semantic segmentation on SVIs to extract three key semantic elements: buildings, sky, and greenery. By filtering based on the pixel count of the building semantic class, we generate segmentation maps and isolate the building parts, from which we further extract the dominant façade colors.
In this study, 514 SVIs featuring multiple scenes from the study area were selected as the base dataset. Using LabelMe software (version 3.16.2), pixels in each image were manually annotated into four categories: buildings, sky, vegetation, and background. To enhance the model’s generalization capability, various data augmentation techniques were applied, including random horizontal flipping, mirror reflection, and Gaussian noise injection. This process yielded an expanded training dataset comprising 2204 image–label pairs, which were used to train the semantic segmentation model. DeepLab V3+ was adopted as the semantic segmentation architecture, with MobileNet serving as the backbone network. It was initialized with weights pre-trained on ImageNet, a large-scale image classification dataset containing over 1 million labeled images across 1000 object categories. For the extracted building parts, the K-means clustering algorithm was applied in the HSV color space to identify four dominant colors. These colors were stored as PyTorch 2.7.1 tensor files for subsequent feature fusion in the HAI evaluation model. The preprocessing results of SVIs and extracted building parts are presented in Figure 5. To address the issue of insufficient building pixels in some segmentation outputs, we applied a filtering step to exclude SVIs with minimal or no building presence from further analysis. SVIs that did not satisfy the conditions specified in Equation (1) were filtered out, along with their corresponding segmentation results and original images. The threshold used in Equation (1) was based on a previous study [58]. In addition, we experimented with various thresholds and compared the segmentation outcomes, ultimately determining that 20% was the optimal threshold for this experimental area.
p i x e l b u i l d i n g p i x e l i m a g e   T
In this equation, p i x e l b u i l d i n g represents the number of pixels of the building semantics in a street view, while p i x e l i m a g e denotes the total number of pixels in a street view. T is the predefined threshold, we set T = 20 % for this study.

3.5. Expert Judgment and Elo Rating

Quantifying visual perception variables of specific urban historical landscapes is inherently challenging, whereas relative comparisons are more feasible [59]. The Elo rating is a dynamic, relative scoring method widely used in evaluation scenarios where directly quantifying absolute values is difficult [60]. It assigns an initial rating to each street view. When two street views are compared, their ratings are adjusted based on expert judgment. Specifically, for two street views, A and B, with current ratings of R A and R B , the Elo rating calculates each view’s expected win rate using the following equations:
E A = 1 1 + 10 R B R A / 400
E B = 1 1 + 10 R A R B / 400
where E A represents the expected win rate of street view A against B, and E B denotes the expected win rate of street view B against A. Based on the actual comparison results, the score of each street view is adjusted according to its expected win rate and the actual outcome. The updated score is computed using the following equation:
R A = R A + K × S A E A
where S A represents the outcome of the comparison between street view images A and B. If A is judged superior, then S A = 1 ; in a draw, S A = 0.5 ; if A is judged inferior, then S A = 0 . The updated rating is denoted as R A , with K as the adjustment factor.
In our study, 1200 SVIs representing typical urban scenes, such as traditional residences, commercial districts, and historical building complexes, were selected from the filtered dataset as the Elo rating dataset. We developed custom Elo rating software, setting the initial rating of each street view to 1500, with K set to 32. A total of 7000 random comparisons were conducted across the 1200 street views. Three experts with over 15 years of professional experience in architecture and in-depth research related to the historical appearance of the study area were invited to conduct the evaluations. Guided by the evaluation framework developed in this study, each expert was presented with random pairs of SVIs and asked to select the one that performed better for a particular indicator. This process was repeated independently for each of the four indicators defined in the framework. The Elo rating was then applied to derive the relative scores. Based on the annotation results, the top 400 images with the highest scores were labeled as positive samples, and the bottom 400 with the lowest scores as negative samples, forming the labeled dataset.

3.6. Historical Appearance Integrity Evaluation

The dataset used for HAI model training consists of 800 labeled SVIs introduced in Section 3.5, along with their associated semantic segmentation maps and dominant façade colors derived in Section 3.4. Due to the limited size of the training dataset, it does not meet the data demands typically required for large-scale deep neural network training. To address this limitation, we employed transfer learning, leveraging knowledge from pre-trained models on large-scale source tasks [61]. This strategy reduces dependence on extensive labeled data and enhances learning efficiency in small-sample environments. We also adopted a multi-feature fusion approach to strengthen the model’s ability to learn historical appearance features from the SVIs. To mitigate overfitting and enhance the model’s generalization capability, we applied data augmentation techniques, including random flipping, cropping, and noise injection. Furthermore, L2 regularization was incorporated to constrain the magnitude of model parameters, preventing excessive complexity and improving robustness. Ultimately, we constructed a deep learning framework for evaluating the HAI of urban streets. The model architecture is presented in Figure 6. During training, each of the four HAI indicators was used to train the model independently, resulting in four optimized models for predicting the respective indicator scores.
EfficientNetV2-M, introduced by Google Research in 2021, achieves a top-1 accuracy of 85.1% on the ImageNet dataset, significantly surpassing traditional models such as ResNet-152 (approximately 78.3%) while maintaining a lower parameter count and reduced computational complexity [62]. Its robust performance across various resource-constrained scenarios makes it particularly suitable for transfer learning tasks. This study employs the EfficientNetV2-M model, pretrained on ImageNet, as the backbone for HAI evaluation, with the final two layers (the global average pooling and classification layers) removed. In deep convolutional networks, lower layers typically capture general features applicable across diverse visual tasks, whereas higher layers focus on task-specific characteristics. We implement a layer-wise fine-tuning strategy to preserve the general feature extraction capabilities of the pretrained model while enhancing its learning capacity for the specific task [63]. Specifically, the parameters of the stem convolutional layers and the first two building blocks are frozen to retain the general visual features learned from ImageNet, whereas fine-tuning is applied exclusively to the deeper layers using a low learning rate.
In image understanding tasks, deep convolutional layers extract multi-level visual features from SVIs. However, the underlying semantic relationships are implicitly captured by the deep network. Semantic segmentation maps, on the contrary, explicitly encode the spatial distribution, boundary contours, and structural layout of objects within an image through pixel-wise annotations. These structured features complement the original image features and improve the model’s performance. We propose a semantic segmentation feature enhancement module to leverage the semantic information provided by the segmentation maps. This module consists of one standard convolution layer and two depth-wise separable convolution layers, followed by adaptive average pooling to produce a feature map of dimensions (256, 7, 7), aligning with the (1280, 7, 7) feature map generated by the EfficientNetV2-M backbone. A feature fusion module is further developed to effectively integrate the semantic segmentation features with the original image features. Specifically, the segmentation feature map is initially concatenated with the backbone’s output along the channel dimension; subsequently, a residual connection (Equation (5)) is introduced to facilitate gradient propagation and reinforce information flow [64]. In this equation, C o n v 1 × 1 X represents a point-wise convolution layer that reduces the channel dimension to 1024, whereas F X comprises one pointwise convolution, two depth-wise separable convolutions, and adaptive average pooling, yielding a 1024-channel visual feature vector, denoted as F u s i o n X . Moreover, each convolution operation is accompanied by batch normalization, a ReLU activation function, and dropout regularization (with a dropout rate of 0.5) to alleviate the risk of overfitting.
F u s i o n X = C o n v 1 × 1 X + F X
In Section 3.4, the four dominant colors extracted from building parts form a 12-dimensional color vector. We apply a two-layer fully connected network that performs a nonlinear transformation to enhance the representation capacity of the color features. The transformed 16-dimensional color features are combined with the pooled 1024-dimensional visual features, resulting in a 1040-dimensional feature vector that serves as input to the classification head. This classification head consists of a single fully connected layer (input: 1040 dimensions, output: 2 dimensions). During training, each indicator is classified into one of two categories based on the output of this layer. After training, we append a Softmax Transformation Layer to the classification head. This layer converts the classification probabilities into a continuous score mapped onto the HAI scale, realizing smooth score outputs.
The weights of each indicator are determined using the AHP. In this study, HAI is established as the overall objective (A). Relative to this objective, four evaluation criteria are defined: authenticity of building materials, decorative details, building colors, and streetscape morphology (F). The relative importance of these criteria is represented by a judgment matrix derived from expert evaluations. The weight values of the evaluation indicators are obtained by calculating the eigenvector W. We consulted an expert in architecture to assess the relative importance of the four evaluation indicators. The expert’s judgments are summarized in Table 1. The maximum eigenvalue (λ) is approximately 4.00, the consistency index (CI) of the judgment matrix is approximately 0.0001, and the average random consistency index (RI) is 0.90. The consistency ratio (CR) is approximately 0.0001, which is less than 0.10, indicating that the matrix exhibits satisfactory consistency. These criteria collectively reflect the historical integrity of urban landscape from different perspectives. Based on the weights assigned to each criterion, a weighted summation is performed to derive the final HAI score (Formula (6)). M represents the HAI score, I i denotes the score of the i - t h indicator, and W i represents the weight of the i - t h indicator.
M = i = 1 4 I i × W i
As described earlier, SVIs were collected from four directions: front, back, left, and right at each sampling point. During semantic segmentation, images with limited building coverage were discarded. Subsequently, the model predicted scores for four indicators using the remaining SVIs. The final HAI score was computed as a weighted sum of these indicator scores. To minimize potential scoring errors, the score for each indicator, and the final integrity score for each sampling point, were calculated by averaging the scores of the remaining images at that point.

4. Results

4.1. Results of Semantic Segmentation Model Training and SVIs Filtering

In this study, we trained the DeepLabV3+ model using the semantic segmentation training set described in Section 3.4. The training and validation sets were divided in a 9:1 ratio, with the model training parameters illustrated in Table 2. We evaluated the model’s performance using three metrics: pixel accuracy (PA), precision, and intersection over union (IoU). For each semantic class, pixel accuracy is the ratio of accurately classified pixels to the total number of pixels in the dataset (Equation (7)). Precision refers to the proportion of pixels that truly belong to a specific semantic class among all pixels predicted as that class (Equation (8)). Intersection over Union measures the proportion of accurately predicted pixels of a specific semantic class to the total number of pixels belonging to either the predicted or ground truth regions (Equation (9)). In these equations, T P i is the number of pixels accurately predicted as belonging to class i , F P i is the number of pixels incorrectly predicted as belonging class i , F N i is the number of pixels that belong to class i but were not predicted as such, and T N i refers to the number of pixels that do not belong to class i but were predicted as such.
P A i = T P i T P i + F N i
P r e c i s i o n i = T P i T P i + F P i
I o U i = T P i T P i + F P i   + F N i
The final training results demonstrated an average pixel accuracy of 92.50%, an average precision of 91.59%, and an average IoU of 85.36%. The evaluation metrics for individual classes are presented in Table 3.
In this study, a total of 8782 sampling points were collected, and 31,395 valid SVIs were acquired via web scraping. The SVIs were filtered based on the proportion of pixels classified as buildings in the semantic segmentation results, yielding 16,225 SVIs that satisfied the selection criteria. In addition, 6185 sampling points retained at least one street view image satisfying the criteria.

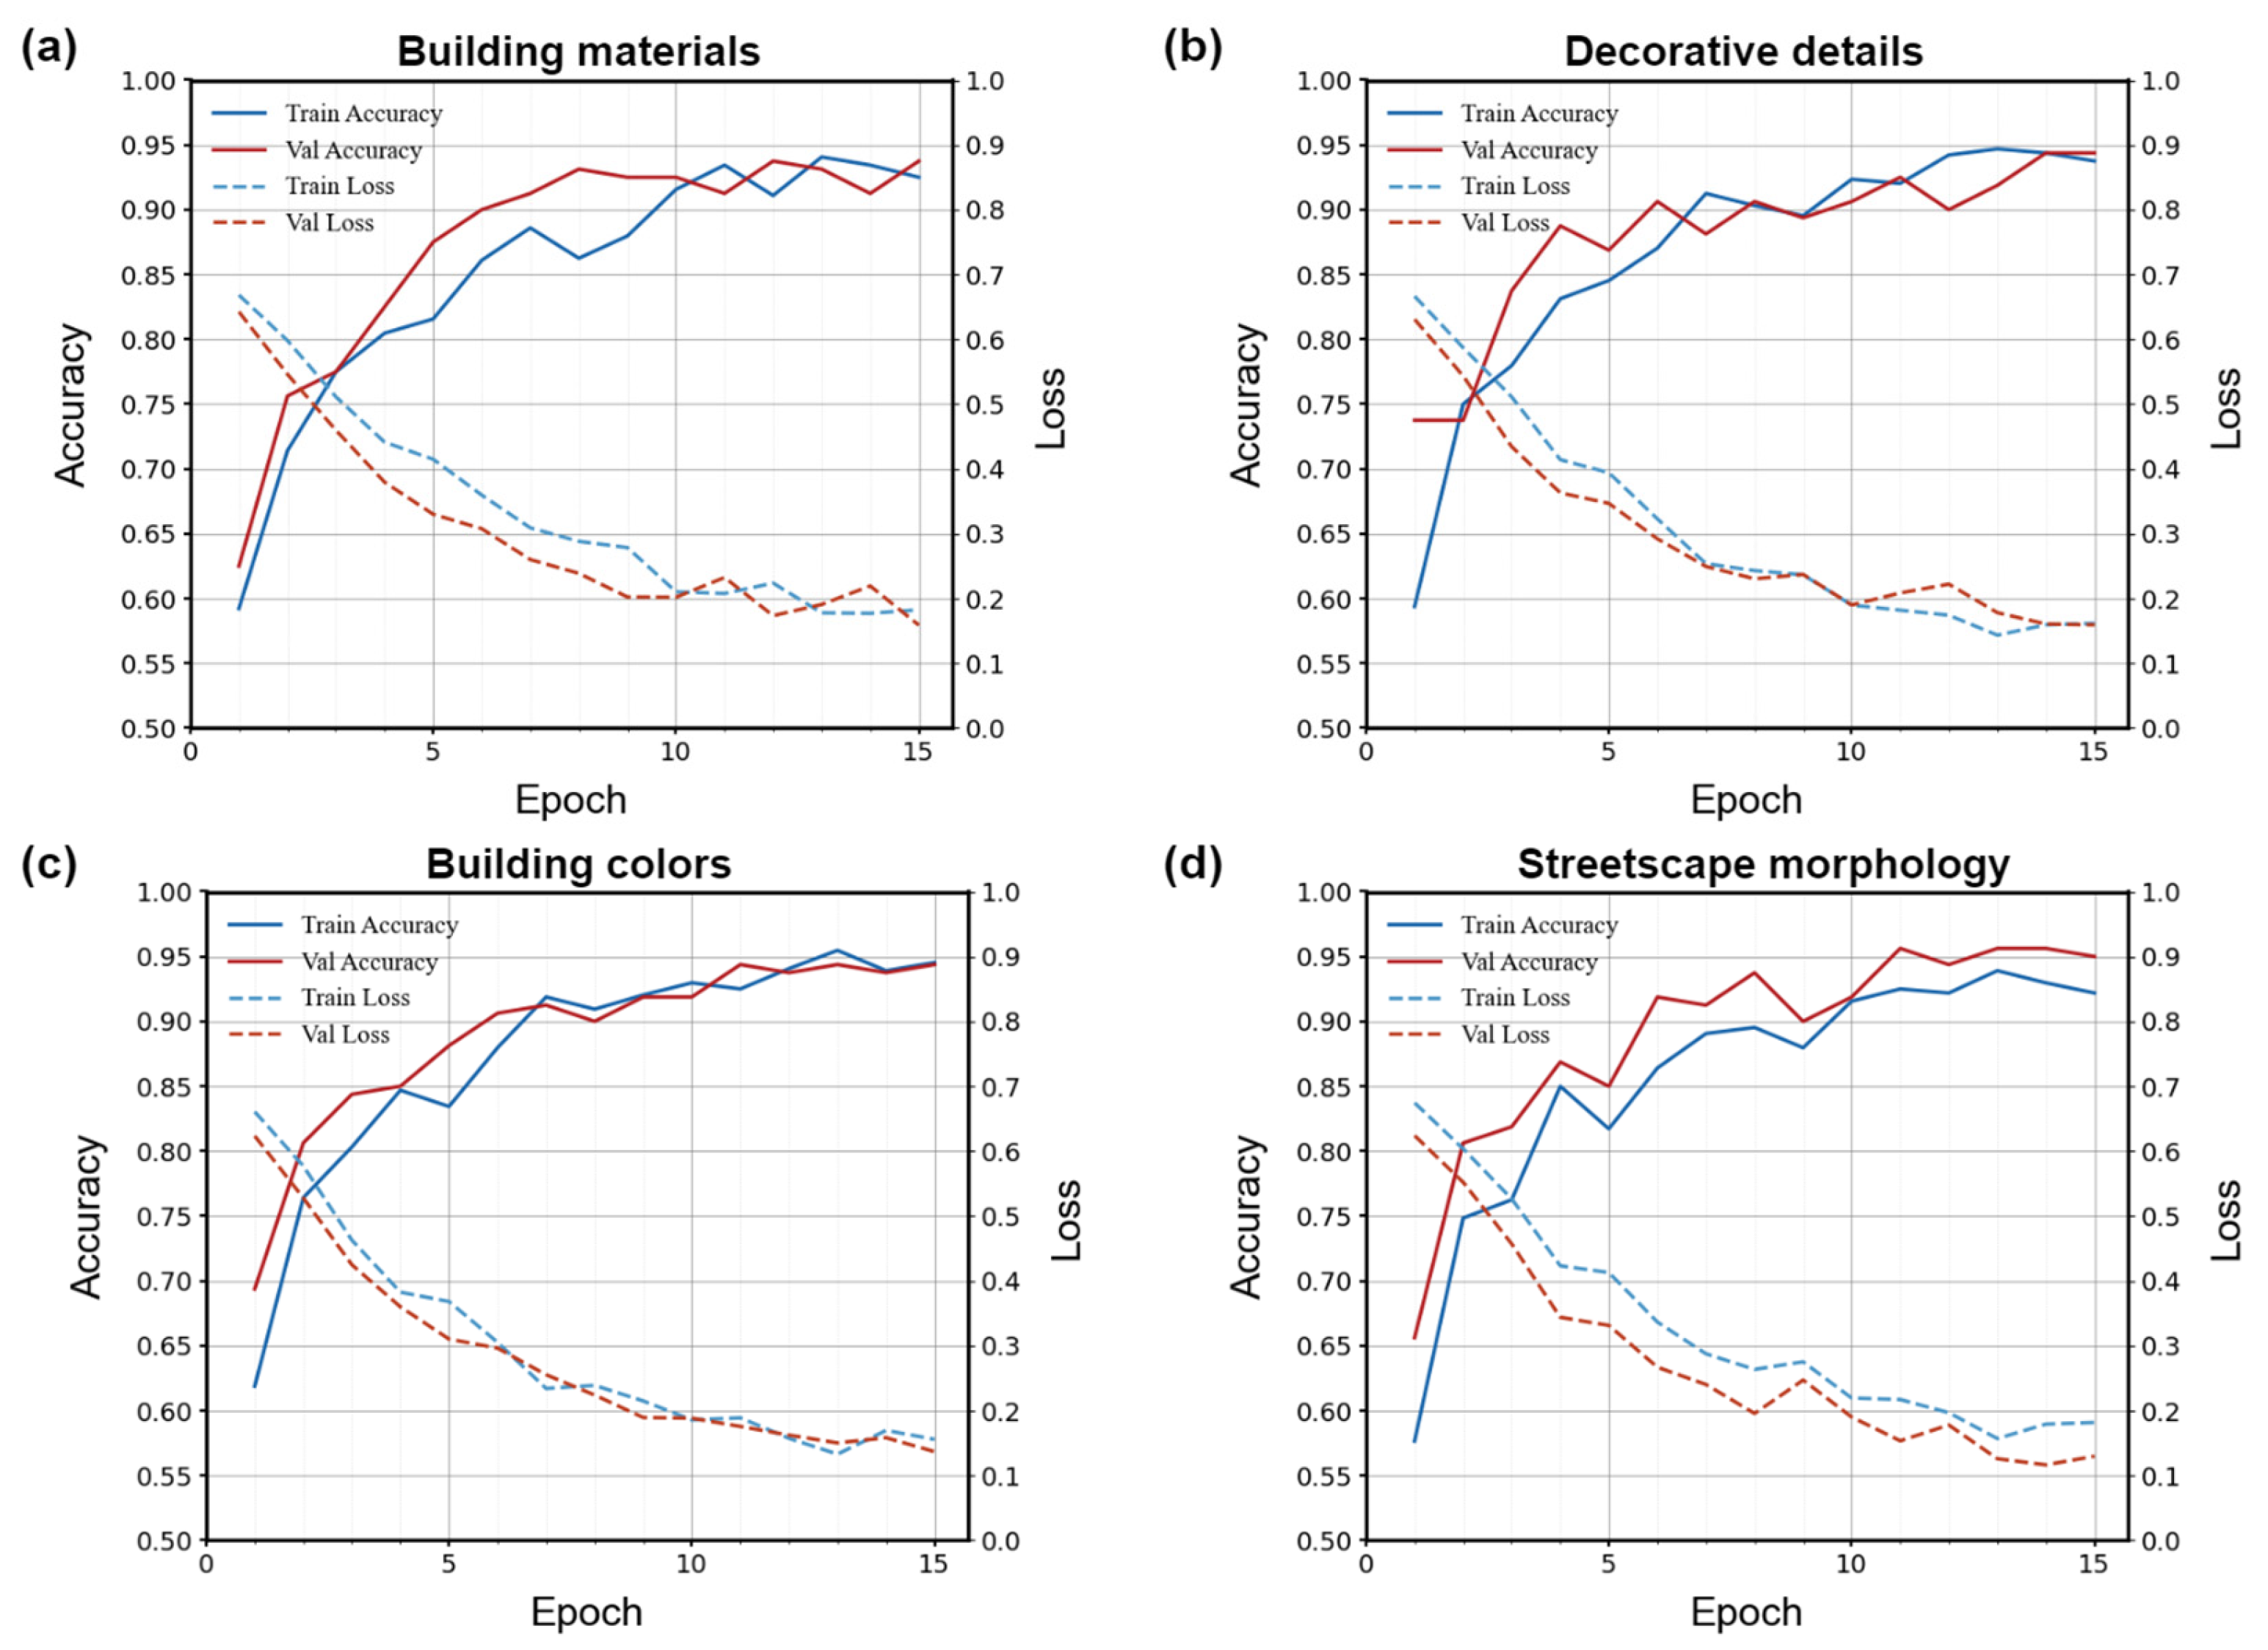
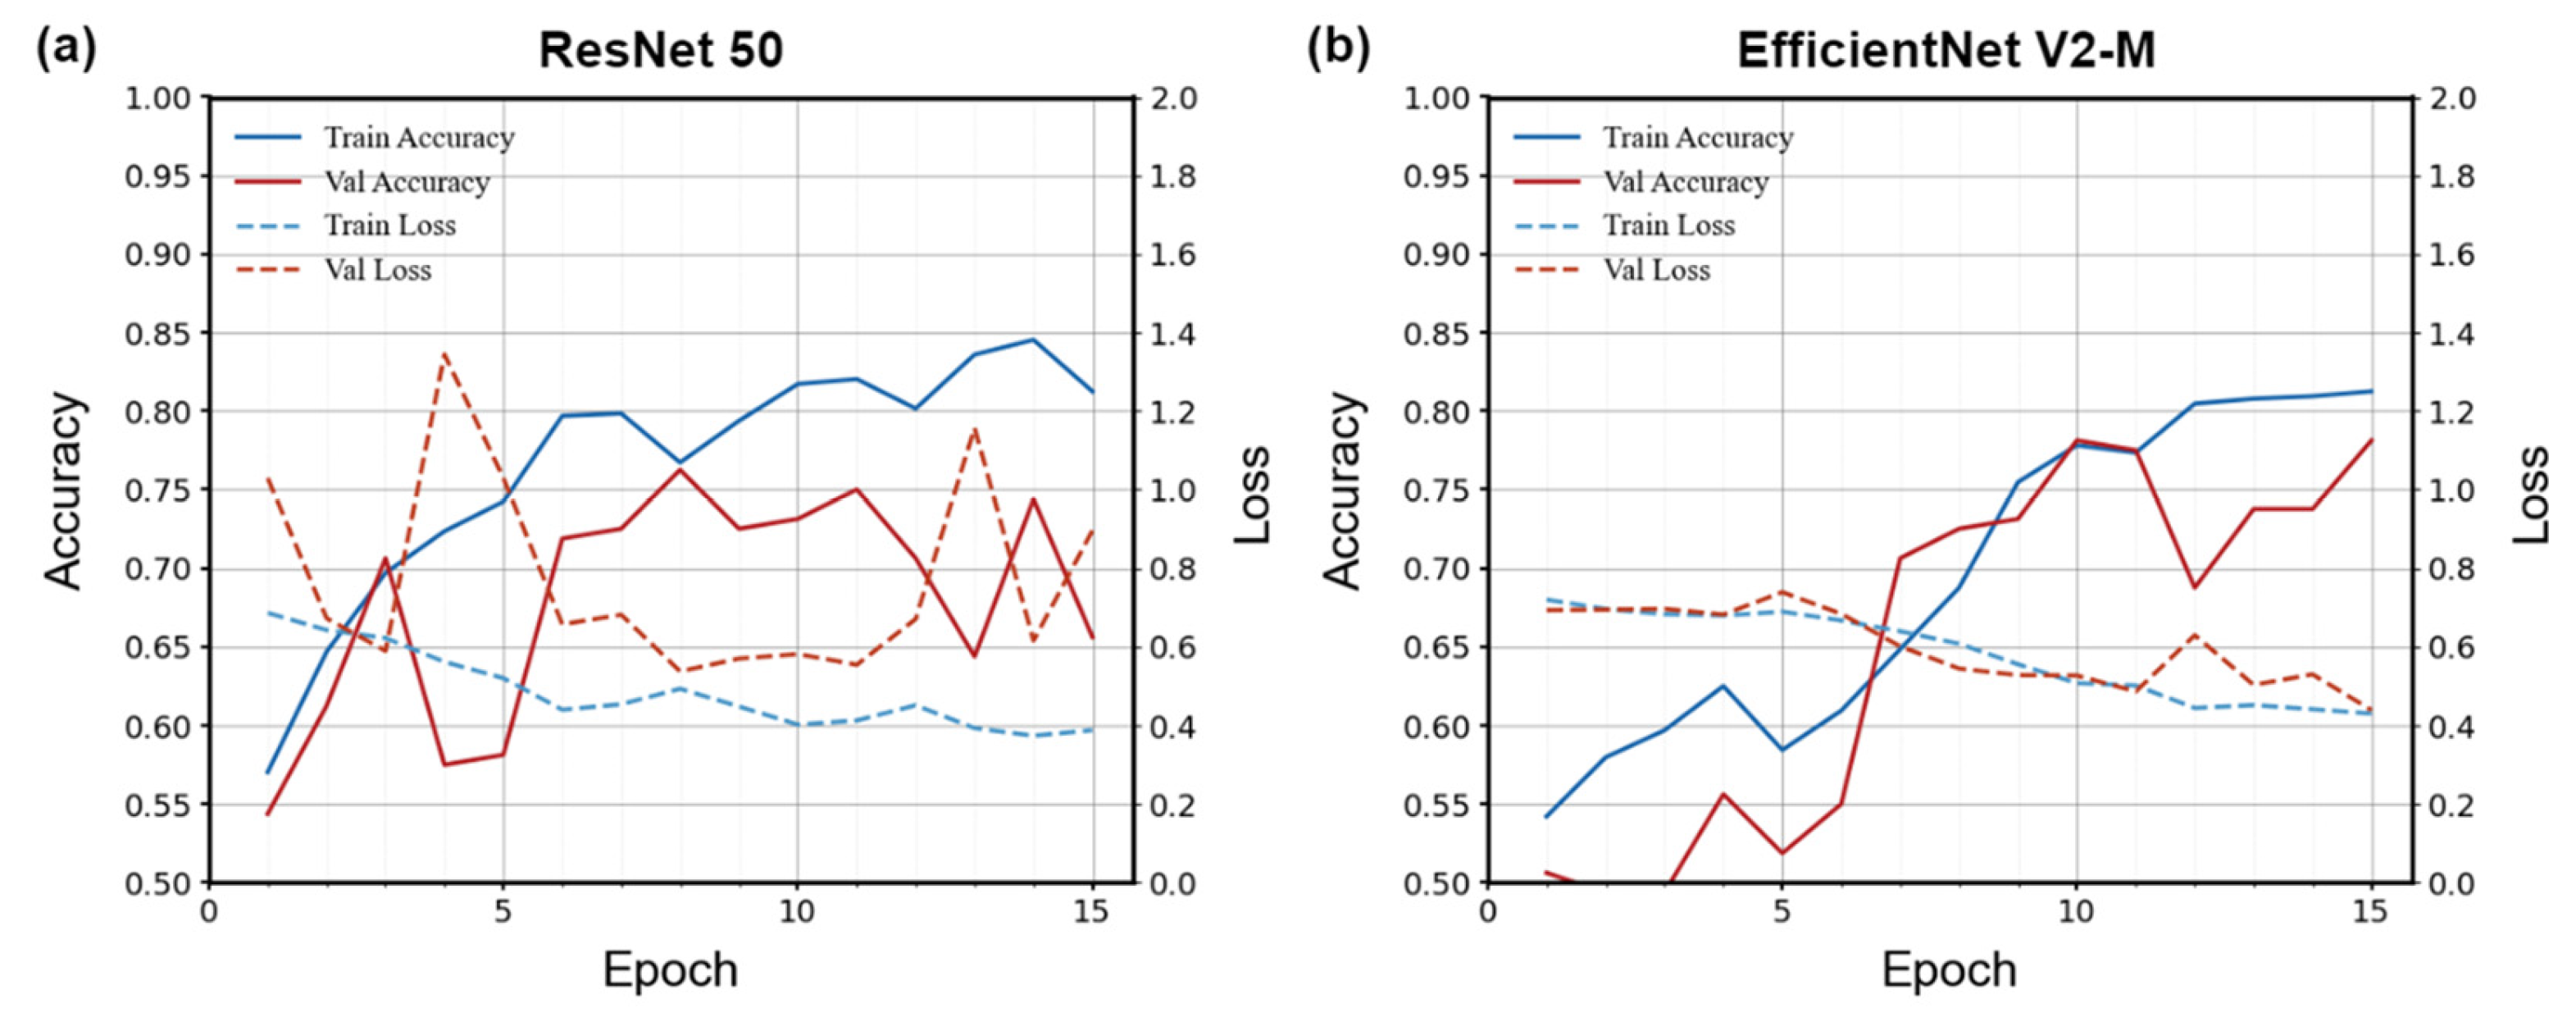
4.2. Results of the HAI Evaluation Model Training

We trained the HAI evaluation model using the training set described in Section 3.5, obtaining the optimal model parameters for each of the four evaluation indicators. The training and validation sets were divided in an 8:2 ratio, and the parameters used during model training are provided in Table 4. The model was evaluated using overall accuracy, precision, recall, and F1 score. Overall accuracy refers to the proportion of accurately classified samples to the total number of samples (Equation (10)). Recall indicates the proportion of pixels accurately predicted as belonging to a specific semantic class among all the pixels that truly belong to that class (Equation (11)). Precision is calculated using Equation (8), and the F1 score represents the harmonic mean of precision and recall (Equation (12)).
O v e r a l l   A c c u r a c y = T P + T N T P + F P + T N + F N
R e c a l l i = T P i T P i + F N i
F 1 S c o r e = 2 × P r e c i s i o n × R e c a l l P r e c i s i o n + R e c a l l
The results of the model training are summarized as follows: for the building materials authenticity index, the overall accuracy of the model was 92.50% on the training set and 93.75% on the validation set; for the decoration details authenticity index, 93.75% on the training set and 94.38% on the validation set; for the building colors authenticity index, 94.53% on the training set and 94.38% on the validation set; and for the streetscape morphology authenticity index, 92.50% on the training set and 95.62% on the validation set. The variations in accuracy and loss for each index during training are shown in Figure 7. Detailed validation performance metrics for each index are presented in Table 5. Considering the building materials index, as the number of training epochs increased, the training and validation accuracies exhibited an upward trend, eventually stabilizing above 0.90. Meanwhile, the training and validation losses gradually decreased, with the validation loss stabilizing below 0.2 after approximately the 10th epoch. This finding indicates that the model has successfully learned effective features and exhibits strong generalization on the validation set. Furthermore, we used the building materials authenticity index as a case study and trained EfficientNetV2-M and ResNet50 with the same training set and parameters to evaluate the effectiveness of transfer learning and feature fusion. During training, EfficientNetV2-M achieved a peak accuracy of 78.125% on the validation set, whereas ResNet50 reached 81.25%. The variations in accuracy and loss throughout the training process are shown in Figure 8.

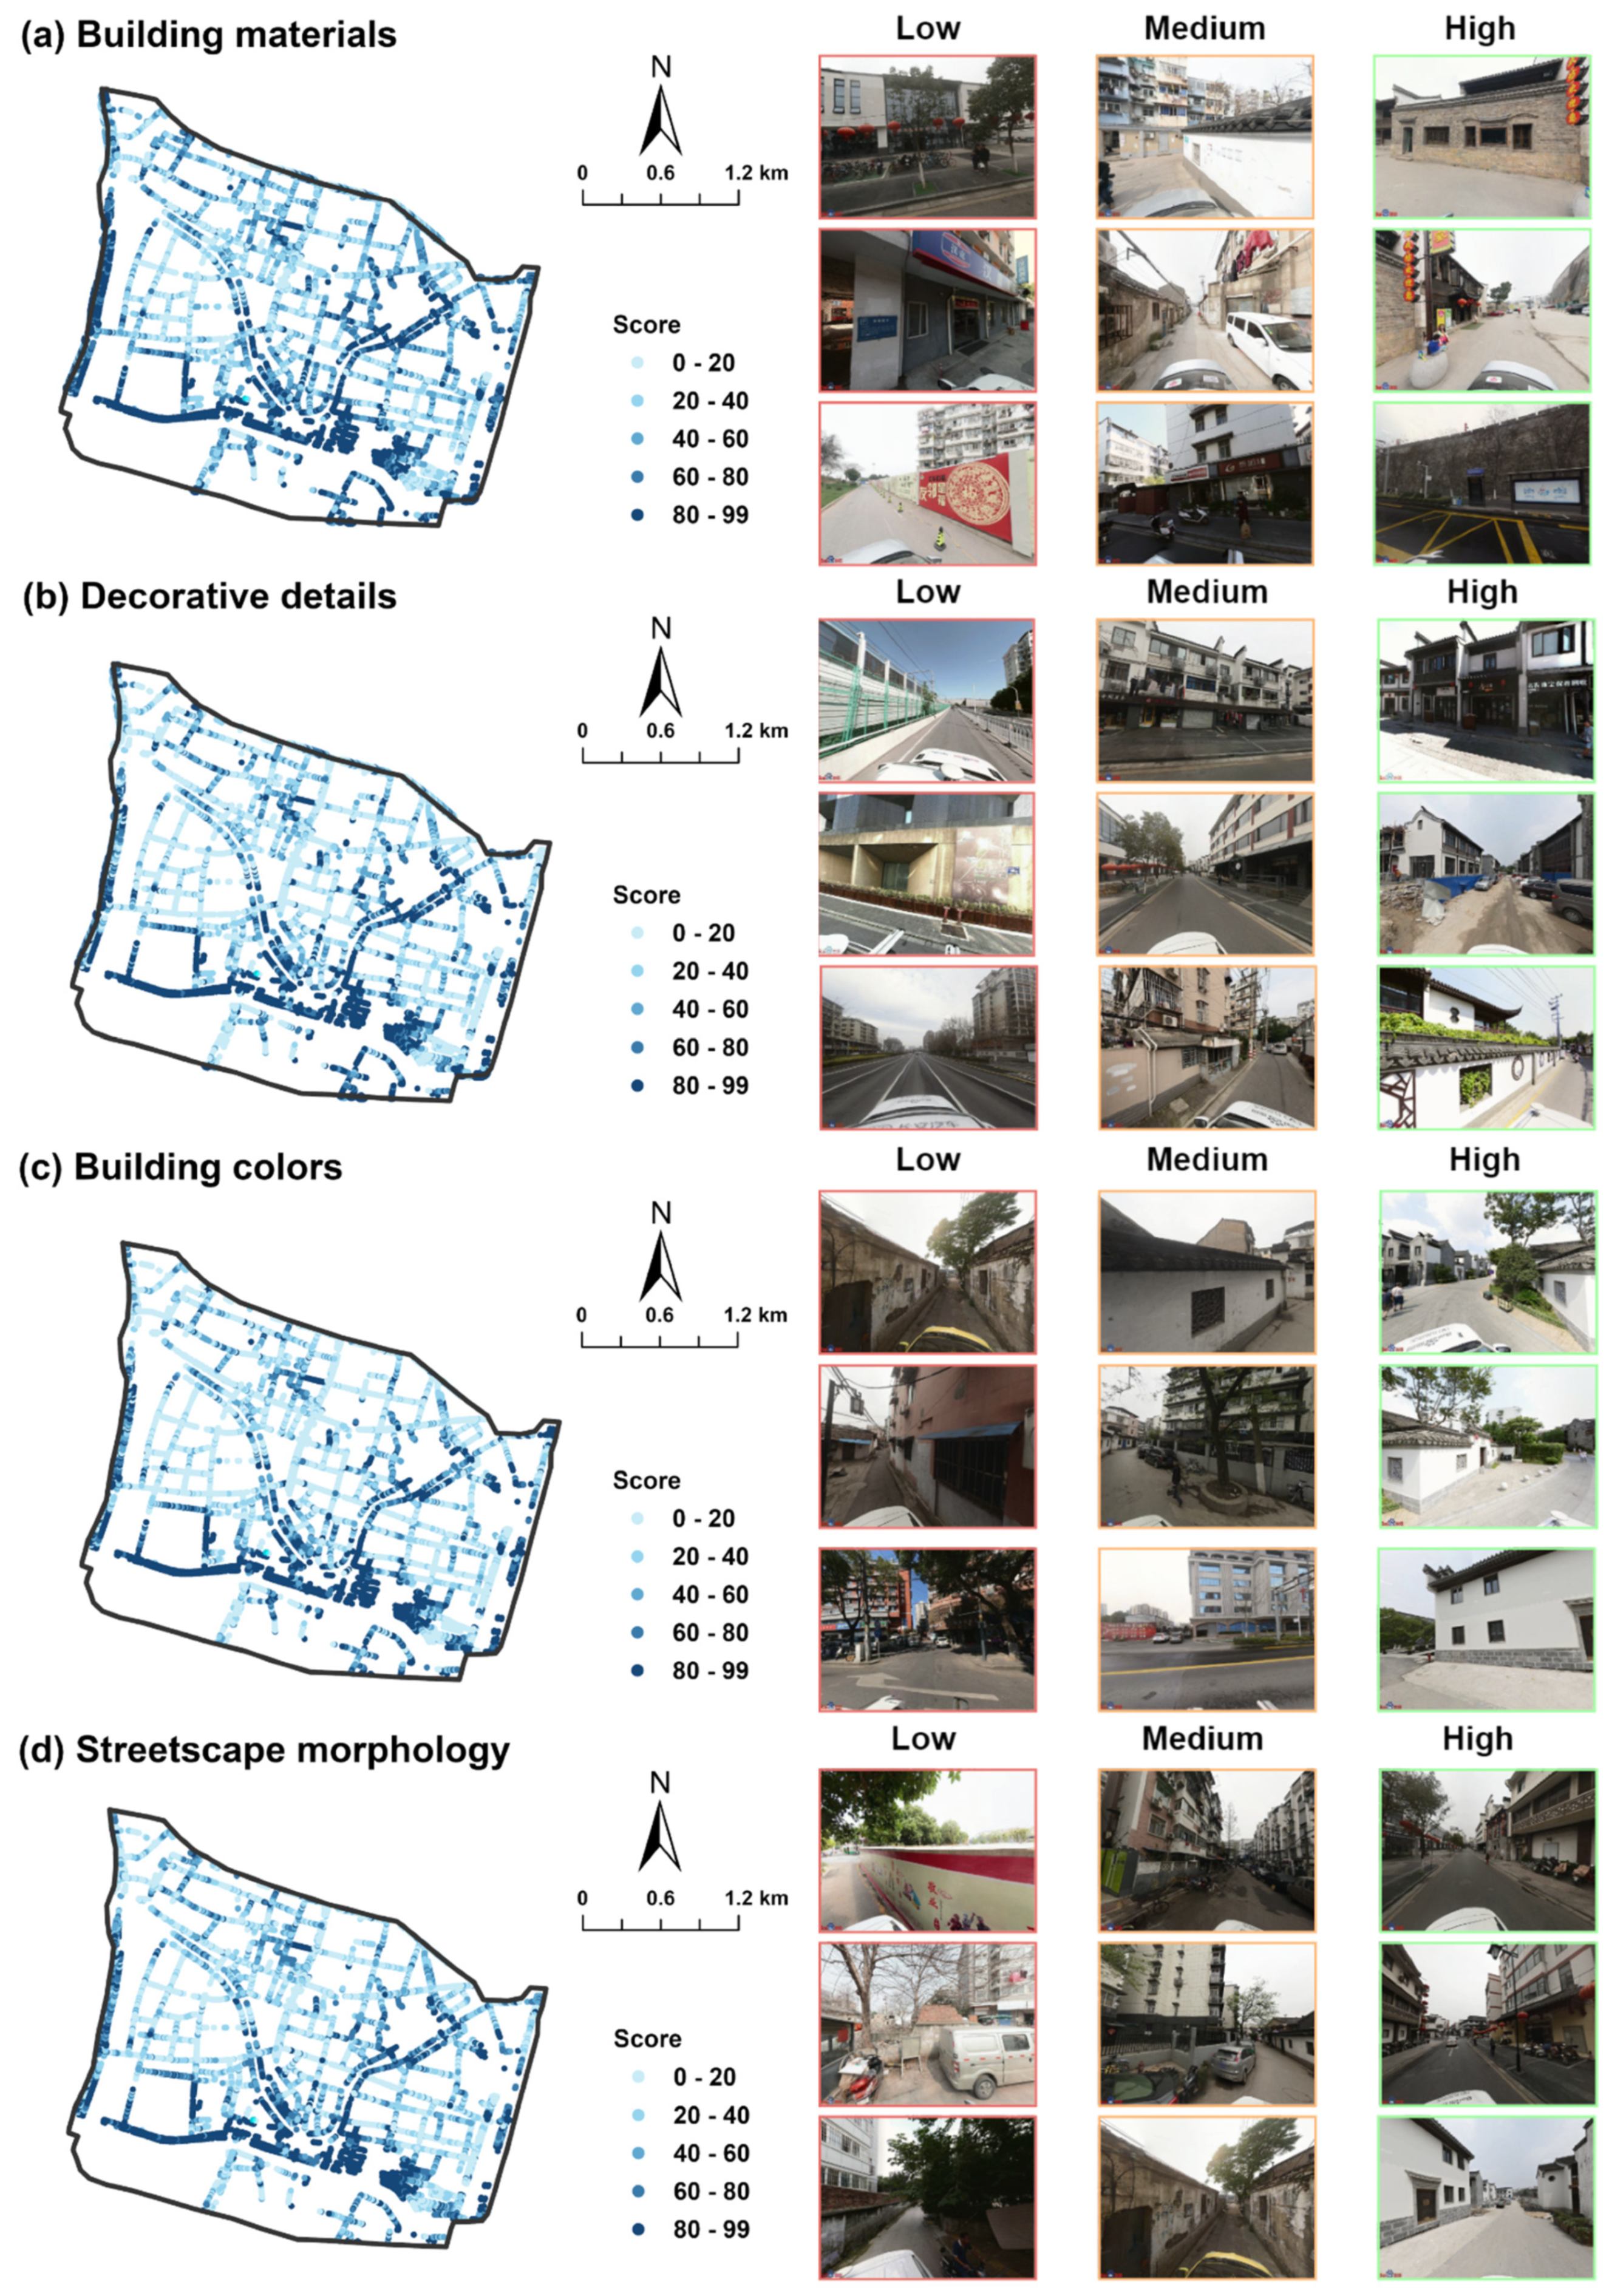
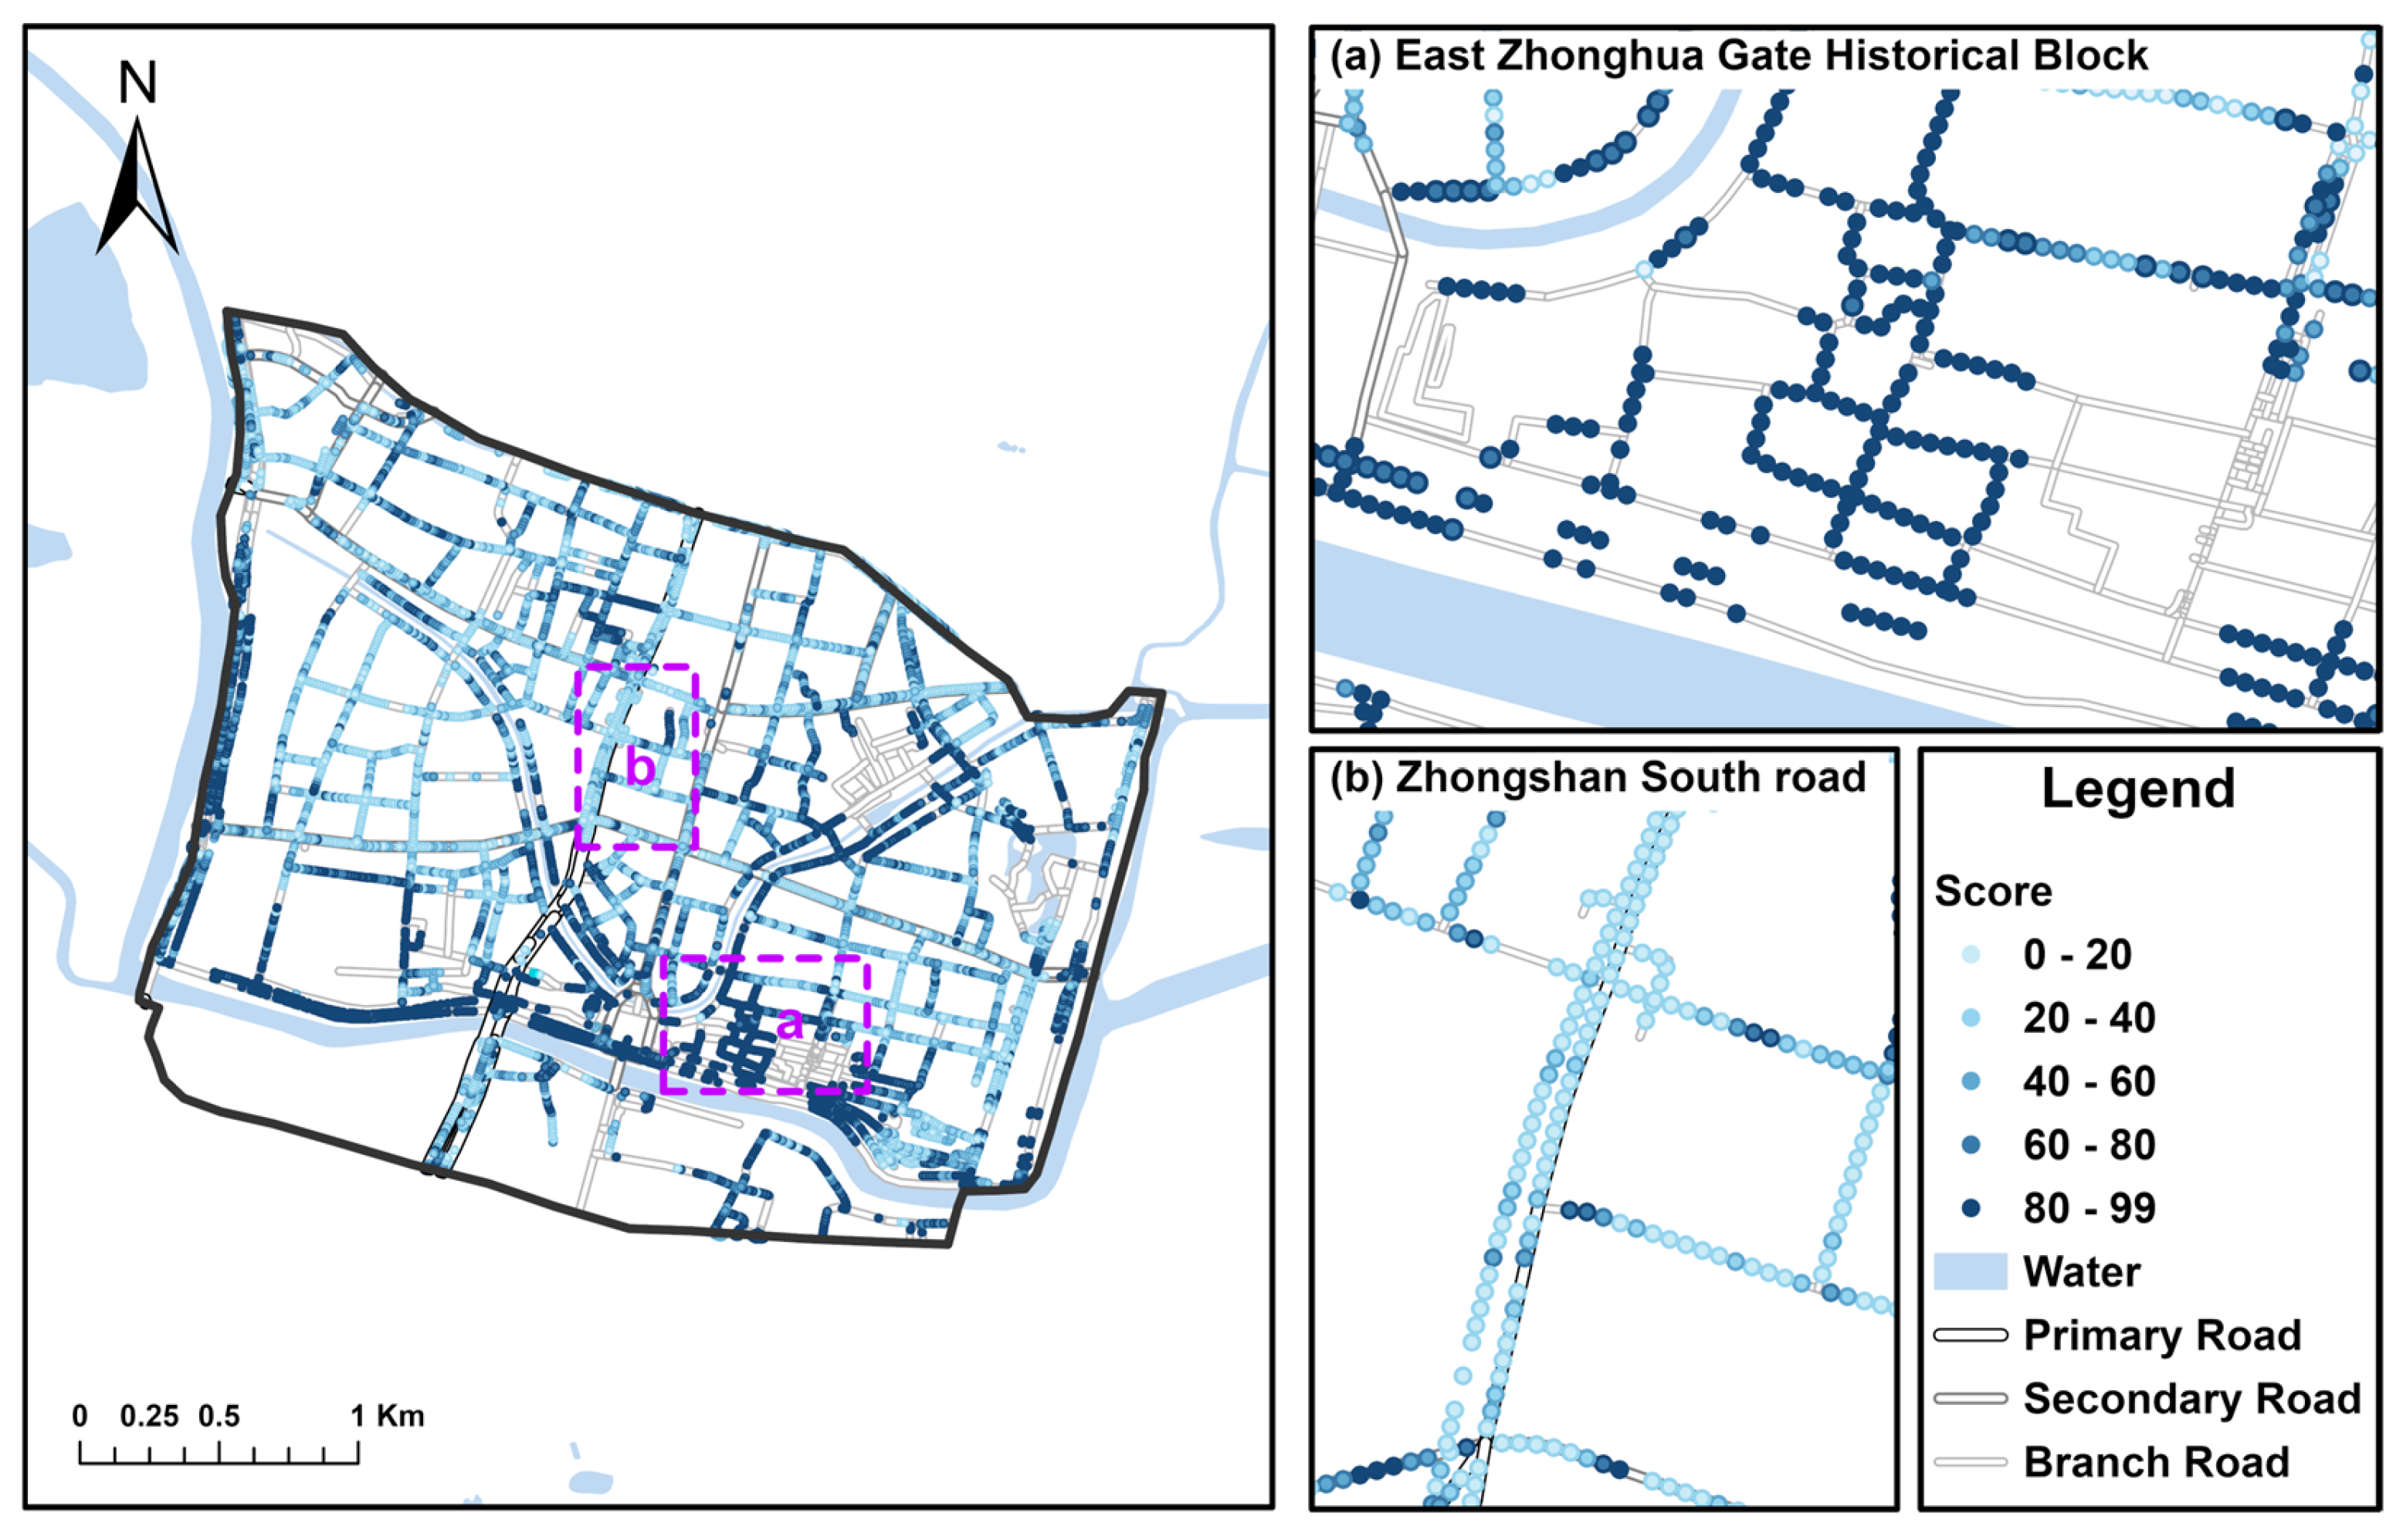
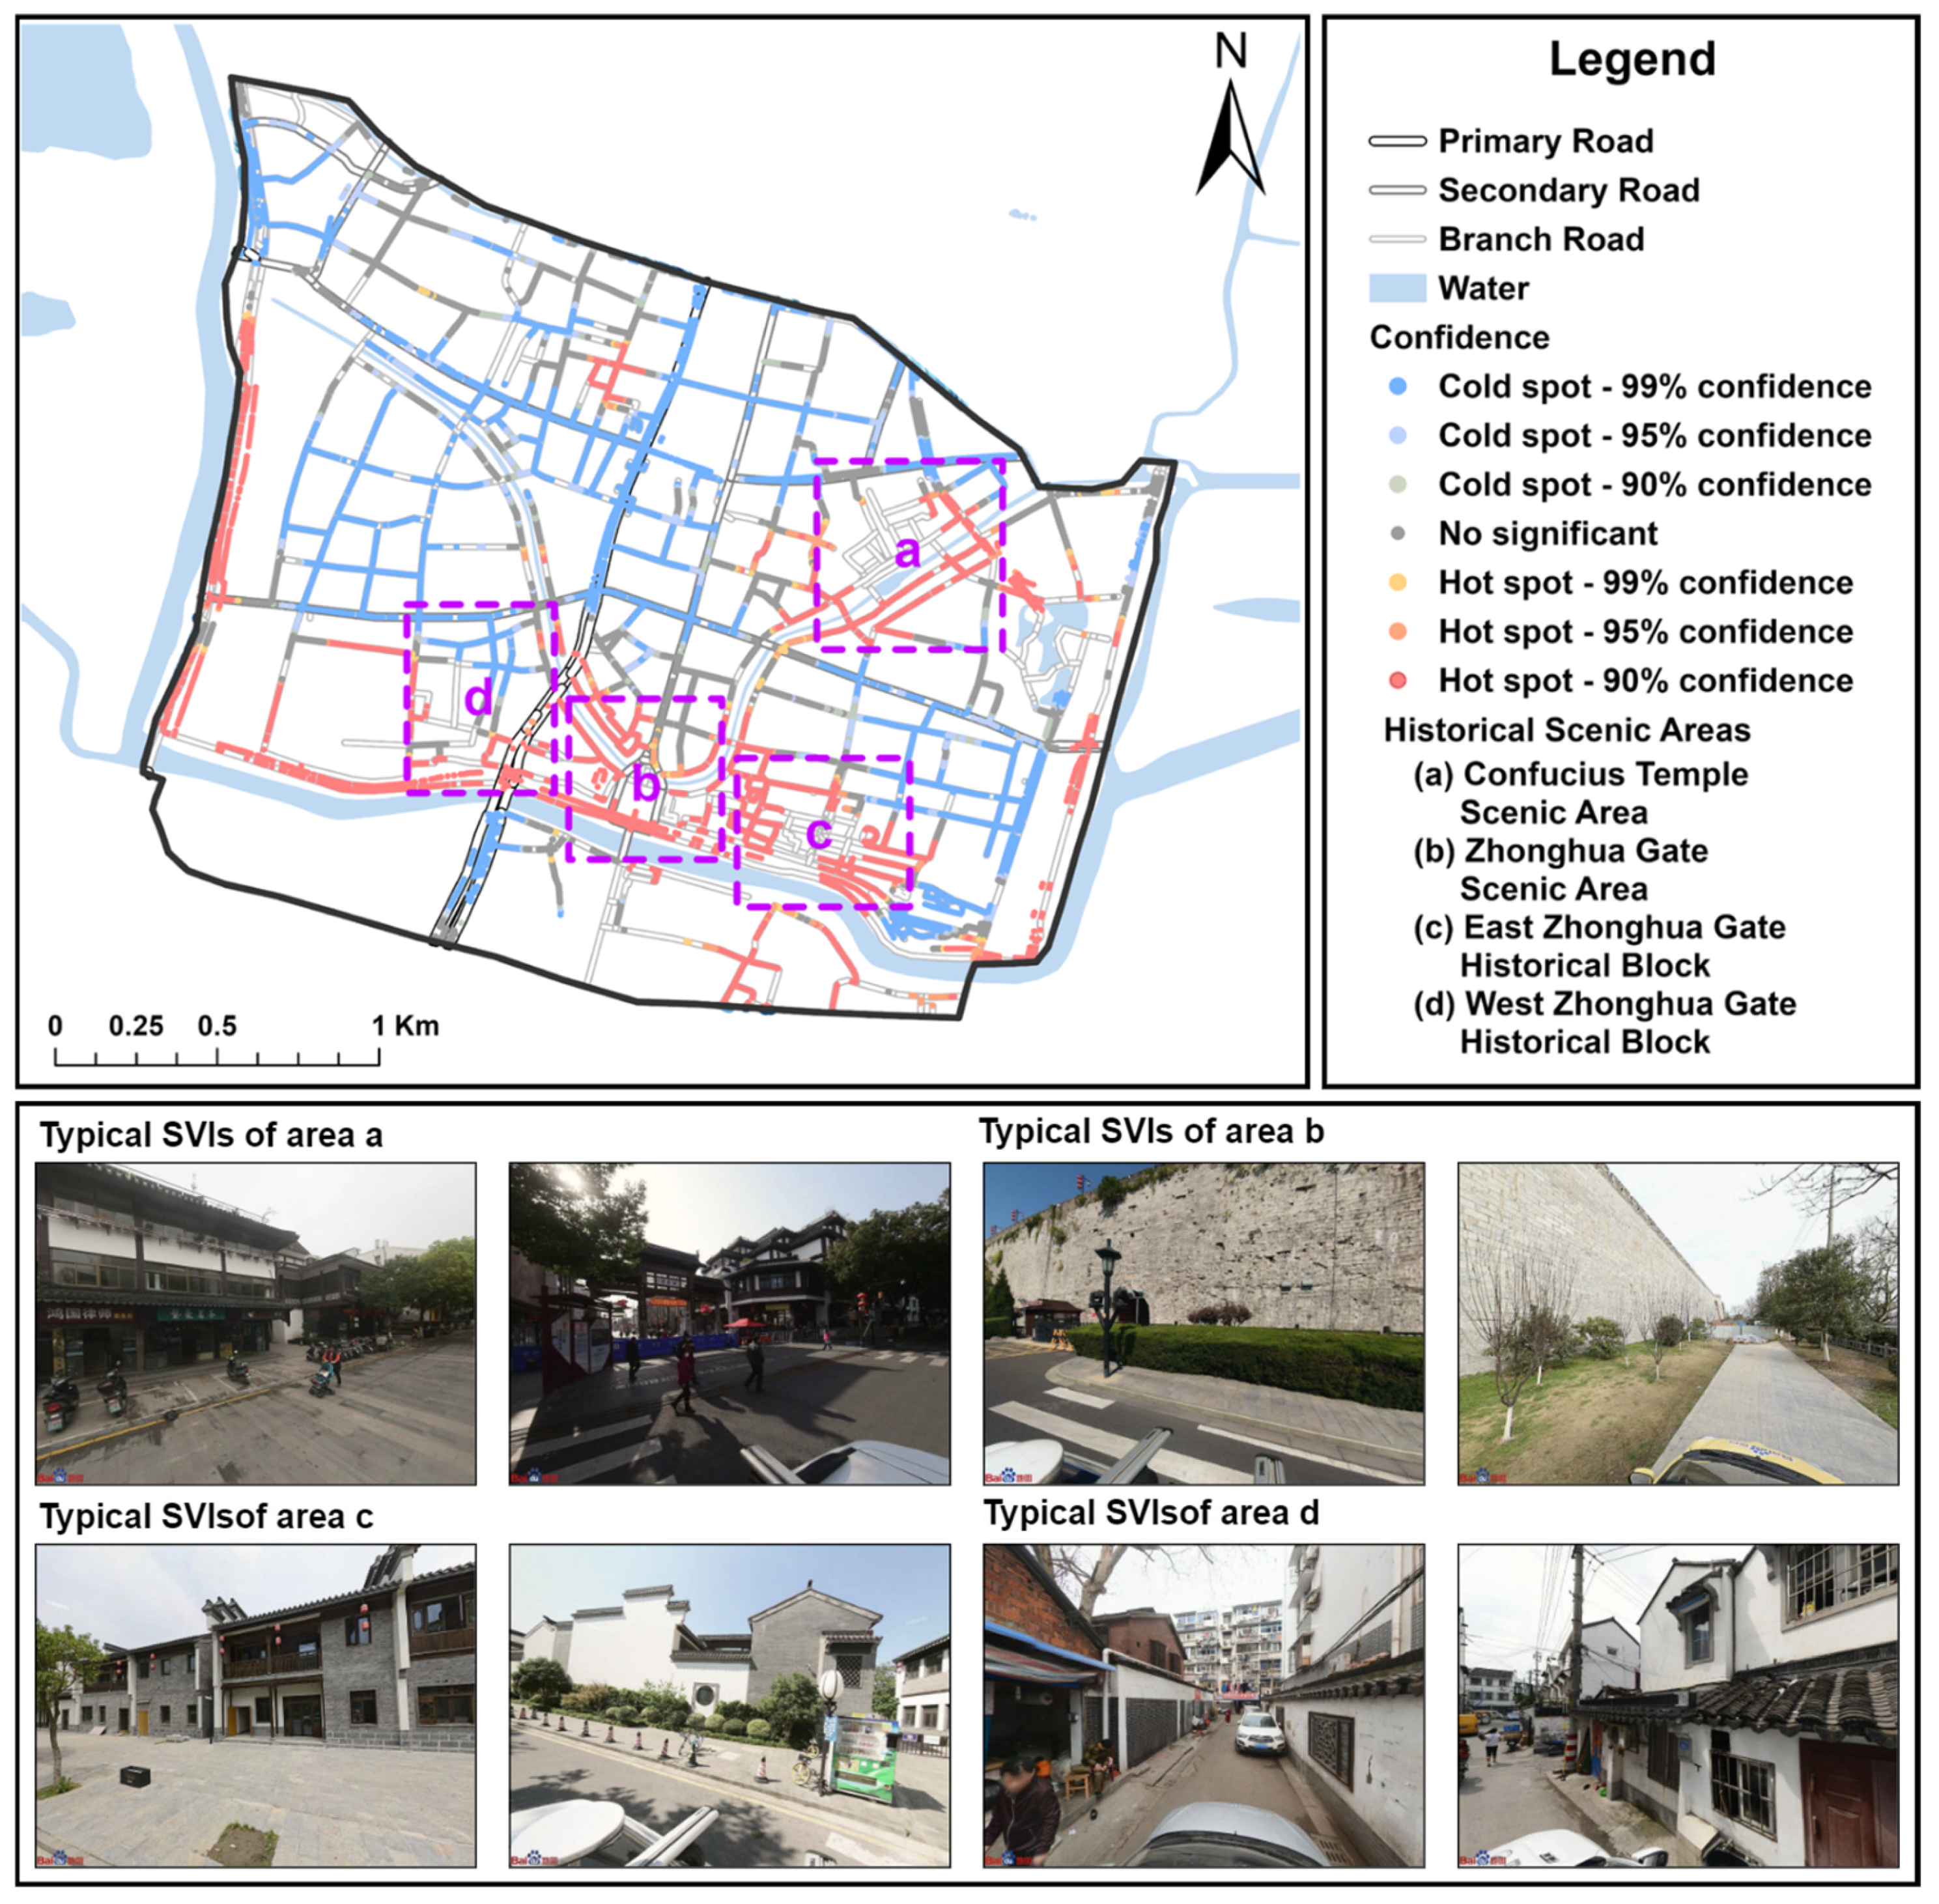
4.3. Spatial Distribution of Historical Appearance Integrity

As shown in Figure 9, the four indicators of HAI exhibit similar spatial distribution patterns, demonstrating clear spatial heterogeneity. Figure 10 illustrates HAI distribution in the Inner Qinhuai Area. The findings indicate that points with high HAI scores are mainly concentrated in two regions: one is along the Ming City Wall in the southern part of the study area, which includes the Zhonghua Gate Scenic Area, the East Zhonghua Gate Historical Block, and the West Zhonghua Gate Traditional Residential Area; another is within and around the Confucius Temple Scenic Area along the Qinhuai River. These zones have served as the historical core of Nanjing’s urban development since the Ming and Qing Dynasties, accumulating abundant historical buildings, street patterns, and cultural landscapes. Moreover, they have been prioritized in recent years under the city’s historic preservation initiatives, resulting in relatively well-maintained historical landscapes. In contrast, points with low HAI scores are primarily distributed along the main roads of the city, particularly in areas surrounding major traffic routes such as Zhongshan South Road and Jiqing Road. These regions have experienced extensive modern development and frequent urban renewal, which has severely damaged the historical landscape and erased the historical appearance. However, low-scoring points can still be observed within certain historical preservation zones, suggesting that even in protected areas, issues such as the encroachment of modern buildings and inappropriate renovation of historical structures persist. The scattered distribution of these low-scoring points reflects the spatial patterns of the ongoing tension between historical preservation and urban renewal.
We computed the Global Moran’s I and performed a hot-spot analysis using the Getis-Ord Gi* statistic to further examine the spatial patterns of HAI. The Global Moran’s I is commonly used to assess the overall spatial autocorrelation of a random variable, whereas the Getis-Ord Gi* statistic determines whether a point and its surrounding area exhibit significant spatial clustering, identifying areas with high or low values of clustering. The results of the Moran’s I calculation are presented in Table 6. The p-values for the four indicators and HAI are nearly zero, indicating positive spatial autocorrelation, with adjacent sampling points generally exhibiting similar scores. As shown in Figure 11, the hotspot analysis results demonstrate that the Confucius Temple scenic area, Zhonghua Gate, and East Zhonghua Gate Historical Block exhibit strong positive spatial autocorrelation with high-value clustering. This finding indicates that these areas have been systematically developed and well-preserved through restoration efforts. In contrast, while the West Zhonghua Gate Traditional Residential Area also contains some high-value clusters, low-value clustering is more prominent. West Zhonghua Gate Traditional Residential Area, a traditional ecological heritage district, has retained many historical architectural features compared with sites such as East Zhonghua Gate Historical Block and the Confucius Temple scenic area. However, due to the lack of effective restoration and planning, its spatial structure strongly favors low-value clustering.
We further quantified the distribution of HAI scores across different road classifications. The road network data downloaded from the OpenStreetMap platform contains an fclass field, which specifies the type of each road. In this study, we categorized all roads in the study area into primary roads, secondary roads, and branch roads. We performed a proximity analysis to associate each sampling point with its nearest road using ArcGIS Pro and then analyzed the HAI scores of sampling points along different road classifications. The statistical results are presented in Table 7. The figure shows a clear inverse relationship between road levels and the HAI score. As areas of intensive urban development, the surroundings of primary roads have undergone frequent urban renewal. A high proportion of modern buildings and the severe disruption of traditional street block scales have contributed to the lowest average HAI score, only 23.17, with only 9.70% of locations scoring above 60. Secondary roads perform slightly better but still reflect relatively low levels of historical character retention. In contrast, branch roads, which often weave through traditional neighborhoods and historic quarters, serve as vital repositories of the city’s historical landscape. These streets demonstrate considerably better preservation, with an average HAI score of 46.93 and 34.87% of segments scoring above 60. This result indicates that lower-grade roads tend to preserve a greater amount of historical and cultural heritage, serving as crucial spatial carriers for urban heritage conservation. Therefore, in future urban renewal and historical appearance preservation efforts, attention should be paid to identifying and protecting historical resources along lower-grade roads. Simultaneously, historical elements along primary roads should also be identified and appropriately preserved to ensure the continuity and coherence of the city’s overall historical character.

4.4. Validation of Model Accuracy and the Effect of Overexposure on Model Performance

In the white balance preprocessing described in Section 3.3, we found that the method was only moderately effective in correcting overexposure caused by extreme lighting conditions. We designed a control experiment to investigate its impact on model accuracy and validate the model’s performance since overexposure-induced color distortion could introduce systematic bias in model performance evaluation. We randomly selected 25 overexposed and 25 non-overexposed street scenes from those with high building colors authenticity, as well as 25 overexposed and 25 non-overexposed scenes from those with lower authenticity, considering the building colors authenticity index as an example. The same three architecture experts who previously performed the Elo rating independently classified the 100 images as either “High Authenticity” or “Low Authenticity” categories. These expert labels served as the ground truth for evaluating model performance. The model’s predictions with scores greater than 50 were classified as “High,” and those below 50 as “Low.” We constructed a confusion matrix by comparing the model’s predictions with these expert classifications. Table 8 presents the results of this accuracy assessment. The results indicate that overexposure in street scenes significantly affects model performance. In the non-overexposed group, the model achieved higher precision, recall, and F1 score, further confirming its effectiveness.

5. Discussion

5.1. Uncover Deep Features of the Urban Built Environment Using SVIs

SVIs provide a comprehensive and direct representation of the urban built environment, whereas deep learning algorithms enable the automatic extraction of latent visual features from large-scale SVI datasets. Due to the rapid proliferation of SVI data, researchers have recognized their potential for assessing urban built environment characteristics [65]. Existing studies primarily focus on two directions: one emphasizes explicit feature extraction of physical elements, such as building facades, vegetation coverage, and street facilities, whereas the other explores implicit features of the built environment, including urban vitality, walkability, and urban landscape perception. Compared with explicit physical features, implicit features based on human–environment interactions provide deeper insights into urban development patterns. Building on this foundation, this study integrates SVIs and transfer learning to quantify HAI, a previously unmeasurable attribute. Specifically, HAI reflects the extent to which the urban built environment retains visual coherence representative of a particular historical period, ethnic characteristics, or regional styles. This study selects four key indicators and employs the Elo rating and AHP for HAI quantification, drawing on established evaluation frameworks. A large-scale fine-grained quantitative evaluation and HAI analysis were conducted, leveraging SVIs and transfer learning.

5.2. Fine-Grained Evaluation of Historical Appearance at the Street Level

This study presents the first fine-grained, street-level quantitative evaluation of HUL through the lens of historical appearance, offering refined guidance for HUL conservation. While traditional evaluation of urban heritage is typically conducted at broader spatial scales, it often neglects the nuanced variations within neighborhoods. In addition, prior research has largely overlooked the subjective experiences of city residents, particularly their perceptions of visual continuity, aesthetic coherence, and historical ambiance, all of which are critical to the lived experience of heritage landscapes. This study leverages SVIs to conduct a detailed evaluation of HAI at each sampling location. Spatial heterogeneity in historical appearance is mapped across the study area, and HAI “hotspots” and “cold spots” are identified, providing targeted insights for strategic urban conservation and renewal. In high-HAI areas, stricter protective measures should be prioritized to preserve their historical significance and prevent value erosion due to uncoordinated redevelopment. Conversely, in areas with low HAI, revitalization strategies should be explored with careful consideration of historical context and current spatial dynamics, striving for a balanced approach between preservation and modernization. Furthermore, the frequent update capability of SVI enables continuous monitoring of variations in historical appearance, allowing planners to identify areas where historical character is either deteriorating or improving. This dynamic feedback loop offers practical decision support for adaptive urban heritage management and planning.

5.3. Limitations and Prospects

A large-scale, automated quantitative framework for evaluating HAI is introduced, and the spatial distribution of HAI in the Inner Qinhuai Area in Nanjing is analyzed. However, some limitations still exist. First, the training set for the HAI evaluation model was annotated based on expert opinions. However, these evaluations may not always align with the preferences of residents. To address this constraint, we plan to develop an application to collect residents’ perceptions of HAI in historic districts. Second, the white balance algorithm used during the image preprocessing phase has limitations. Specifically, it cannot accurately amend the color of SVIs affected by strong sunlight and overexposure. We aim to develop color correction algorithms tailored for SVIs to enhance the model’s accuracy in color processing. Third, this study trained the model using a street view dataset from the Inner Qinhuai Area in Nanjing. Since different cities and regions possess unique historical characteristics, the method may not apply to other regions or cities in China at this stage. However, the proposed approach can be adapted to other areas by incorporating new datasets. We aim to construct a larger-scale or even nationwide dataset on historical appearance. We aim to enhance its generalization capability and enable historical appearance evaluation across broader geographic areas by training the model on such large-scale data. To address potential hardware limitations when using large-scale datasets, we plan to explore distributed training methods, such as federated learning. By independently training on local data in different locations and sharing model parameters, we can achieve collaborative model optimization without centralizing data, thereby obtaining a generalized model. Finally, this study serves as a preliminary effort to apply digital technologies to the conservation and revitalization of HUL. While SVI data offer notable advantages such as ease of access and intuitive visual representation, relying solely on this data source presents certain limitations. In future work, we aim to incorporate more diverse data types, including UAV-based oblique imagery, LiDAR point clouds, remote sensing imagery, and historical documents. By leveraging digital twin technologies, we hope to achieve precise modeling and real-time synchronization of historical landscapes in virtual environments, thereby supporting more dynamic and comprehensive evaluations.

5.4. Conclusions

Many cities in developing countries have undergone rapid development and transformation, resulting in the continuous deterioration of HUL. In response, policymakers and urban planners have increasingly prioritized efforts to preserve and revitalize HUL. However, large-scale, quantitative evaluations of HUL remain underdeveloped. This study aims to construct a human-centered, large-scale, and quantitative evaluation framework for HUL, grounded in urban residents’ perception of the historical landscapes. Specifically, we use SVIs as the data source and apply Elo rating and transfer learning to assess the perceived attributes of historical appearance. Furthermore, we map the spatial distribution of the HAI within the Inner Qinhuai River area of Nanjing. The results demonstrate that the proposed framework effectively captures perceived historical appearance and offers high-resolution insights into the spatial variation of HAI. Factors such as road hierarchy, historical–cultural zones, and local planning policies significantly influence perceived integrity. Overall, this framework provides more refined guidance and decision-making support for the protection and revitalization of HUL.

Author Contributions

Conceptualization, Teng Zhong; methodology, Jiarui Xu and Yunxuan Dai; software, Jiarui Xu and Haoliang Qian; validation, Jiarui Xu, data curation, Jiarui Xu, Yunxuan Dai, Jiatong Cai, Haoliang Qian and Zimu Peng; writing—original draft preparation, Jiarui Xu, Yunxuan Dai and Jiatong Cai; writing—review and editing, Teng Zhong; funding acquisition, Teng Zhong. All authors have read and agreed to the published version of the manuscript.

Funding

This research was funded by the National Key R&D Program of China (2024YFC3808904) and Open Research Fund Program of MNR Key Laboratory for Geo-Environmental Monitoring of Great Bay Area (GEMlab-2023006).

Data Availability Statement

The data presented in this study are available from the corresponding author upon reasonable request.

Acknowledgments

We would like to thank the editors and anonymous referees for their constructive suggestions and comments that helped improve this paper’s quality.

Conflicts of Interest

The authors declare no conflict of interest.

Abbreviations

The following abbreviations are used in this manuscript:
HULHistorical Urban Landscape
HAIHistorical Appearance Integrity
AHPAnalytic Hierarchy Process
GISGeographic Information Systems
CNNsConvolutional Neural Networks

References

  1. Been, V.; Ellen, I.G.; Gedal, M.; Glaeser, E.; McCabe, B.J. Preserving History or Restricting Development? The Heterogeneous Effects of Historic Districts on Local Housing Markets in New York City. J. Urban Econ. 2016, 92, 16–30. [Google Scholar] [CrossRef]
  2. Li, M.; Liu, J.; Lin, Y.; Xiao, L.; Zhou, J. Revitalizing Historic Districts: Identifying Built Environment Predictors for Street Vibrancy Based on Urban Sensor Data. Cities 2021, 117, 103305. [Google Scholar] [CrossRef]
  3. UNESCO. Recommendation on the Historic Urban Landscape; UNESCO: Paris, France, 2011. [Google Scholar]
  4. Yeoh, B.S.; Huang, S. The Conservation-Redevelopment Dilemma in Singapore. Cities 1996, 13, 411–422. [Google Scholar] [CrossRef]
  5. Özyavuz, M. (Ed.) “Theories, Techniques, Strategies” for Spatial Planners & Designers; Peter Lang D: Lausanne, Switzerland, 2021; ISBN 978-3-631-85438-9. [Google Scholar]
  6. Shipley, R.; Snyder, M. The Role of Heritage Conservation Districts in Achieving Community Economic Development Goals. Int. J. Herit. Stud. 2013, 19, 304–321. [Google Scholar] [CrossRef]
  7. Wang, M.; Liu, J.; Zhang, S.; Zhu, H.; Zhang, X. Spatial Pattern and Micro-Location Rules of Tourism Businesses in Historic Towns: A Case Study of Pingyao, China. J. Destin. Mark. Manag. 2022, 25, 100721. [Google Scholar] [CrossRef]
  8. Du, J.; Miao, C.; Xu, J.; Yu, Z.; Li, L.; Zhang, Y. Evaluation and enhancement of historic district regeneration effectiveness in the context of cultural-tourism integration: A case study of three historic districts in Kaifeng. J. Nat. Resour. 2025, 40, 164. (In Chinese) [Google Scholar] [CrossRef]
  9. Wang, J.; Fan, W.; You, J. Evaluation of Tourism Elements in Historical and Cultural Blocks Using Machine Learning: A Case Study of Taiping Street in Hunan Province. npj Herit. Sci. 2025, 13, 30. [Google Scholar] [CrossRef]
  10. İpekoğlu, B. An Architectural Evaluation Method for Conservation of Traditional Dwellings. Build. Environ. 2006, 41, 386–394. [Google Scholar] [CrossRef]
  11. Fu, J.-M.; Tang, Y.-F.; Zeng, Y.-K.; Feng, L.-Y.; Wu, Z.-G. Sustainable Historic Districts: Vitality Analysis and Optimization Based on Space Syntax. Buildings 2025, 15, 657. [Google Scholar] [CrossRef]
  12. Yang, L.; Long, H.; Liu, P.; Liu, X. The Protection and its evaluation system of traditional village: A case study of traditional village in Hunan province. Hum. Geogr. 2018, 33, 121–128. (In Chinese) [Google Scholar] [CrossRef]
  13. Kou, H.; Zhou, J.; Chen, J.; Zhang, S. Conservation for Sustainable Development: The Sustainability Evaluation of the Xijie Historic District, Dujiangyan City, China. Sustainability 2018, 10, 4645. [Google Scholar] [CrossRef]
  14. Gao, X.; Wang, H.; Zhao, J.; Wang, Y.; Li, C.; Gong, C. Visual Comfort Impact Assessment for Walking Spaces of Urban Historic District in China Based on Semantic Segmentation Algorithm. Environ. Impact Assess. Rev. 2025, 114, 107917. [Google Scholar] [CrossRef]
  15. Lyu, Y.; Abd Malek, M.I.; Ja’afar, N.H.; Sima, Y.; Han, Z.; Liu, Z. Unveiling the Potential of Space Syntax Approach for Revitalizing Historic Urban Areas: A Case Study of Yushan Historic District, China. Front. Archit. Res. 2023, 12, 1144–1156. [Google Scholar] [CrossRef]
  16. Yang, X.; Shen, J. Integrating Historic Landscape Characterization for Historic District Assessment through Multi-Source Data: A Case Study from Hangzhou, China. npj Herit. Sci. 2025, 13, 33. [Google Scholar] [CrossRef]
  17. Lan, W.; Li, J.; Wang, J.; Wang, Y.; Lei, Z. Cultural Diversity Conservation in Historic Districts via Spatial-Gene Perspectives: The Small Wild Goose Pagoda District, Xi’an. Sustainability 2025, 17, 2189. [Google Scholar] [CrossRef]
  18. Yang, X. The True Nature and the Preservation Principles for the Historic Blocks. Hum. Geogr. 2005, 20, 48–50. (In Chinese) [Google Scholar] [CrossRef]
  19. Biljecki, F.; Ito, K. Street View Imagery in Urban Analytics and GIS: A Review. Landsc. Urban Plan. 2021, 215, 104217. [Google Scholar] [CrossRef]
  20. Wei, J.; Yue, W.; Li, M.; Gao, J. Mapping Human Perception of Urban Landscape from Street-View Images: A Deep-Learning Approach. Int. J. Appl. Earth Obs. Geoinf. 2022, 112, 102886. [Google Scholar] [CrossRef]
  21. Zhong, T.; Ye, C.; Wang, Z.; Tang, G.; Zhang, W.; Ye, Y. City-Scale Mapping of Urban Façade Color Using Street-View Imagery. Remote Sensing. 2021, 13, 1591. [Google Scholar] [CrossRef]
  22. Zhou, Z.; Zhong, T.; Liu, M.; Ye, Y. Evaluating Building Color Harmoniousness in a Historic District Intelligently: An Algorithm-Driven Approach Using Street-View Images. Environ. Plan. B Urban. Anal. City Sci. 2023, 50, 1838–1857. [Google Scholar] [CrossRef]
  23. International Council on Monuments and Sites (ICOMOS). The Athens Charter for the Restoration of Historic Monuments; Adopted at the First International Congress of Architects and Technicians of Historic Monuments; International Council on Monuments and Sites (ICOMOS): Athens, Greece, 1931. [Google Scholar]
  24. Azpeitia Santander, A.; Azkarate Garai-Olaun, A.; De La Fuente Arana, A. Historic Urban Landscapes: A Review on Trends and Methodologies in the Urban Context of the 21st Century. Sustainability 2018, 10, 2603. [Google Scholar] [CrossRef]
  25. UNESCO. Vienna Memorandum on World Heritage and Contemporary Architecture—Managing the Historic Urban Landscape; UNESCO: Paris, France, 2005. [Google Scholar]
  26. Wu, C.; Liang, Y.; Zhao, M.; Teng, M.; Yue, H.; Ye, Y. Perceiving the Fine-Scale Urban Poverty Using Street View Images through a Vision-Language Model. Sustain. Cities Soc. 2025, 123, 106267. [Google Scholar] [CrossRef]
  27. Huang, T.; Dang, A.; Zhang, P.; Yang, Y.; Wu, S. Conversation and Management of Hutong-Historical and Cultural District of Beijing Inner City Supported by GIS. In Proceedings of the 2009 17th International Conference on Geoinformatics, Fairfax, VA, USA, 12–14 August 2009; pp. 1–5. [Google Scholar] [CrossRef]
  28. Yu, K.; Xi, X.; Wang, S. Urban Landscape Planning Based on Ecological Infrastructure: A Case Study of Weihe City, Shandong Province, China. Urban Plan. 2008, 3, 87–92. (In Chinese) [Google Scholar]
  29. Zhang, S.; Zhen, X. From Historical Features Protection to Urban Landscape Management- Based on the Historic Urban Landscape Approach. Landsc. Archit. 2017, 6, 14–21. (In Chinese) [Google Scholar] [CrossRef]
  30. Hu, Y.; Meng, Q.; Li, M.; Yang, D. Enhancing Authenticity in Historic Districts via Soundscape Design. Herit. Sci. 2024, 12, 396. [Google Scholar] [CrossRef]
  31. Xu, Y.; Wang, Z.; Han, D.; Yi, Y. Urban Overall Architectural Landscape Planning and Control Methods. Urban Plan. Forum 2022, 5, 81–89. (In Chinese) [Google Scholar] [CrossRef]
  32. Shanghai Municipal Bureau of Planning and Natural Resources. Notice on Issuing the Guidelines for the Conservation of Shanghai’s Historical Urban Features [EB/OL]. Available online: https://ghzyj.sh.gov.cn/zcwj/cxgh/20241212/5216da83ad6142598247d9d6357cfdcb.html (accessed on 22 June 2025).
  33. Shenzhen Municipal Bureau of Planning and Natural Resources. Notice on Issuing the Measures for the Conservation of Shenzhen Historical Urban Features and Historic Buildings [EB/OL]. Available online: https://www.sz.gov.cn/zfgb/zcjd/content/post_11998589.html (accessed on 22 June 2025).
  34. Brusaporci, S. (Ed.) Handbook of Research on Emerging Digital Tools for Architectural Surveying, Modeling, and Representation; Advances in Geospatial Technologies; IGI Global: Hershey, PA, USA, 2015; ISBN 978-1-4666-8379-2. [Google Scholar]
  35. Miao, M.; Feng, L.; Wu, Y.; Zhu, R.; Xu, D. Color Authenticity for the Sustainable Development of Historical Areas: A Case Study of Shiquan. Sustainability 2024, 16, 2417. [Google Scholar] [CrossRef]
  36. Xue, X.; Tian, Z.; Yang, Y.; Wang, J.; Cao, S.-J. Sustaining the Local Color of a Global City. Nat. Cities 2025, 2, 400–412. [Google Scholar] [CrossRef]
  37. He, N.; Li, G. Urban Neighbourhood Environment Assessment Based on Street View Image Processing: A Review of Research Trends. Environ. Chall. 2021, 4, 100090. [Google Scholar] [CrossRef]
  38. Ito, K.; Kang, Y.; Zhang, Y.; Zhang, F.; Biljecki, F. Understanding Urban Perception with Visual Data: A Systematic Review. Cities 2024, 152, 105169. [Google Scholar] [CrossRef]
  39. Goel, R.; Garcia, L.M.T.; Goodman, A.; Johnson, R.; Aldred, R.; Murugesan, M.; Brage, S.; Bhalla, K.; Woodcock, J. Estimating City-Level Travel Patterns Using Street Imagery: A Case Study of Using Google Street View in Britain. PLoS ONE 2018, 13, e0196521. [Google Scholar] [CrossRef] [PubMed]
  40. Long, Y.; Ye, Y. Measuring Human-Scale Urban Form and Its Performance. Landsc. Urban Plan. 2019, 191, 103612. [Google Scholar] [CrossRef] [PubMed]
  41. Berman, M.G.; Hout, M.C.; Kardan, O.; Hunter, M.R.; Yourganov, G.; Henderson, J.M.; Hanayik, T.; Karimi, H.; Jonides, J. The Perception of Naturalness Correlates with Low-Level Visual Features of Environmental Scenes. PLoS ONE 2014, 9, e114572. [Google Scholar] [CrossRef] [PubMed]
  42. Zhang, F.; Salazar-Miranda, A.; Duarte, F.; Vale, L.; Hack, G.; Chen, M.; Liu, Y.; Batty, M.; Ratti, C. Urban Visual Intelligence: Studying Cities with Artificial Intelligence and Street-Level Imagery. Ann. Am. Assoc. Geogr. 2024, 114, 876–897. [Google Scholar] [CrossRef]
  43. Fang, F.; Zeng, L.; Li, S.; Zheng, D.; Zhang, J.; Liu, Y.; Wan, B. Spatial Context-Aware Method for Urban Land Use Classification Using SVIs. ISPRS J. Photogramm. Remote Sens. 2022, 192, 1–12. [Google Scholar] [CrossRef]
  44. Hu, C.-B.; Zhang, F.; Gong, F.-Y.; Ratti, C.; Li, X. Classification and Mapping of Urban Canyon Geometry Using Google Street View Images and Deep Multitask Learning. Build. Environ. 2020, 167, 106424. [Google Scholar] [CrossRef]
  45. Noorian, S.S.; Psyllidis, A.; Bozzon, A. ST-Sem: A Multimodal Method for Points-of-Interest Classification Using Street-Level Imagery. In Web Engineering; Bakaev, M., Frasincar, F., Ko, I.-Y., Eds.; Lecture Notes in Computer Science; Springer International Publishing: Cham, Switzerland, 2019; Volume 11496, pp. 32–46. ISBN 978-3-030-19273-0. [Google Scholar]
  46. Yang, L.; Liu, J.; Lu, Y.; Ao, Y.; Guo, Y.; Huang, W.; Zhao, R.; Wang, R. Global and Local Associations between Urban Greenery and Travel Propensity of Older Adults in Hong Kong. Sustain. Cities Soc. 2020, 63, 102442. [Google Scholar] [CrossRef]
  47. Xia, Y.; Yabuki, N.; Fukuda, T. Development of a System for Assessing the Quality of Urban Street-Level Greenery Using Street View Images and Deep Learning. Urban For. Urban Green. 2021, 59, 126995. [Google Scholar] [CrossRef]
  48. Kim, J.H.; Ki, D.; Osutei, N.; Lee, S.; Hipp, J.R. Beyond Visual Inspection: Capturing Neighborhood Dynamics with Historical Google Street View and Deep Learning-Based Semantic Segmentation. J. Geogr. Syst. 2024, 26, 541–564. [Google Scholar] [CrossRef]
  49. Salesses, P.; Schechtner, K.; Hidalgo, C.A. The Collaborative Image of The City: Mapping the Inequality of Urban Perception. PLoS ONE 2013, 8, e68400. [Google Scholar] [CrossRef]
  50. Porzi, L.; Rota Bulò, S.; Lepri, B.; Ricci, E. Predicting and Understanding Urban Perception with Convolutional Neural Networks. In Proceedings of the 23rd ACM International Conference on Multimedia, Brisbane, Australia, 13 October 2015; pp. 139–148. [Google Scholar] [CrossRef]
  51. Wang, Z.; Ito, K.; Biljecki, F. Assessing the Equity and Evolution of Urban Visual Perceptual Quality with Time Series Street View Imagery. Cities 2024, 145, 104704. [Google Scholar] [CrossRef]
  52. Kang, Y.; Kim, J.; Park, J.; Lee, J. Assessment of Perceived and Physical Walkability Using Street View Images and Deep Learning Technology. ISPRS Int. J. Geo-Inf. 2023, 12, 186. [Google Scholar] [CrossRef]
  53. Le, Q.H.; Kwon, N.; Nguyen, T.H.; Kim, B.; Ahn, Y. Sensing Perceived Urban Stress Using Space Syntactical and Urban Building Density Data: A Machine Learning-Based Approach. Build. Environ. 2024, 266, 112054. [Google Scholar] [CrossRef]
  54. Wang, R.; Huang, C.; Ye, Y. Measuring Street Quality: A Human-Centered Exploration Based on Multi-Sourced Data and Classical Urban Design Theories. Buildings 2024, 14, 3332. [Google Scholar] [CrossRef]
  55. Surendran, R.; Jude Hemanth, D. Scene Understanding Using Deep Neural Networks—Objects, Actions, and Events: A Review. In Proceedings of the International Conference on Innovative Computing and Communications, Delhi, India, 21–23 February 2020; Khanna, A., Gupta, D., Bhattacharyya, S., Snasel, V., Platos, J., Hassanien, A.E., Eds.; Advances in Intelligent Systems and Computing. Springer: Singapore, 2020; Volume 1087, pp. 223–231, ISBN 978-981-15-1285-8. [Google Scholar]
  56. Afifi, M.; Brown, M.S. Deep White-Balance Editing. In Proceedings of the IEEE/CVF Conference on Computer Vision and Pattern Recognition (CVPR), Seattle, WA, USA, 14–19 June 2020. [Google Scholar]
  57. Biljecki, F.; Zhao, T.; Liang, X.; Hou, Y. Sensitivity of Measuring the Urban Form and Greenery Using Street-Level Imagery: A Comparative Study of Approaches and Visual Perspectives. Int. J. Appl. Earth Obs. Geoinf. 2023, 122, 103385. [Google Scholar] [CrossRef]
  58. Zhang, J.; Fukuda, T.; Yabuki, N. Development of a City-Scale Approach for Façade Color Measurement with Building Functional Classification Using Deep Learning and Street View Images. ISPRS Int. J. Geo-Inf. 2021, 10, 551. [Google Scholar] [CrossRef]
  59. Nasar, J.L. Perception, Cognition, and Evaluation of Urban Places. In Public Places and Spaces; Altman, I., Zube, E.H., Eds.; Human Behavior and Environment; Springer: Boston, MA, USA, 1989; Volume 10, pp. 31–56. [Google Scholar] [CrossRef]
  60. Elo, A.E. The Rating of Chessplayers, Past and Present; Arco Publishing: New York, NY, USA, 1978. [Google Scholar]
  61. Amin, A.A.; Sajid Iqbal, M.; Hamza Shahbaz, M. Development of Intelligent Fault-Tolerant Control Systems with Machine Learning, Deep Learning, and Transfer Learning Algorithms: A Review. Expert. Syst. Appl. 2024, 238, 121956. [Google Scholar] [CrossRef]
  62. Tan, M.; Le, Q.V. EfficientNetV2: Smaller models and faster training. In Proceedings of the 38th International Conference on Machine Learning, Virtual, 18–24 July 2021; pp. 10096–10106. [Google Scholar]
  63. Yosinski, J.; Clune, J.; Bengio, Y.; Lipson, H. How Transferable Are Features in Deep Neural Networks? arXiv 2014, arXiv:1411.1792. [Google Scholar]
  64. He, K.; Zhang, X.; Ren, S.; Sun, J. Deep Residual Learning for Image Recognition. In Proceedings of the IEEE Conference on Computer Vision and Pattern Recognition (CVPR), Las Vegas, NV, USA, 27–30 June 2016; pp. 770–778. [Google Scholar]
  65. Kelly, C.M.; Wilson, J.S.; Baker, E.A.; Miller, D.K.; Schootman, M. Using Google Street View to Audit the Built Environment: Inter-Rater Reliability Results. Ann. Behav. Med. 2013, 45, 108–112. [Google Scholar] [CrossRef]
Figure 1. Typical forms of the four key indicators in the study area. (a) Building materials; (b) decorative details; (c) building colors; (d) streetscape morphology.
Ijgi 14 00266 g001
Figure 2. Overall framework of this study. (a) Data collection and processing; (b) semantic segmentation and extraction of building dominant colors; (c) expert judgment and Elo rating; (d) HAI evaluation.
Ijgi 14 00266 g002
Figure 3. Study area. (a) Jiangsu Province; (b) Nanjing; (c) Inner Qinhuai Historical Character Area.
Ijgi 14 00266 g003
Figure 4. Data preprocessing and SVI collection. (a) Distribution of roads; (b) distribution of sampling points; (c) SVI data acquisition.
Ijgi 14 00266 g004
Figure 5. Results of preprocessing SVIs and extracting building parts. (a) Original SVIs; (b) white-balanced SVIs; (c) segmentation maps; (d) building parts.
Ijgi 14 00266 g005
Figure 6. Simplified architecture of the HAI evaluation model.
Ijgi 14 00266 g006
Figure 7. Variations in accuracy and loss throughout the four key indicators training process. (a) Building materials; (b) decorative details; (c) building colors; (d) streetscape morphology.
Ijgi 14 00266 g007
Figure 8. Variations in accuracy and loss throughout the building materials indicator training process. (a) ResNet 50; (b) EfficientNet V2-M.
Ijgi 14 00266 g008
Figure 9. Spatial distribution of the four HAI indicators and their representative SVIs. (a) Building materials authenticity; (b) decorative details authenticity; (c) building colors authenticity; (d) streetscape morphology authenticity.
Ijgi 14 00266 g009
Figure 10. Spatial distribution of HAI in the Inner Qinhuai Historical Character Area.
Ijgi 14 00266 g010
Figure 11. Spatial relationship between HAI hotspots and historical scenic areas with typical SVIs.
Ijgi 14 00266 g011
Table 1. Expert judgment matrix of the Historical Appearance Integrity evaluation system.
A F 1 (Building Materials) F 1 (Decorative Details) F 1 (Building Colors) F 1 (Streetscape Morphology) W i
F 1 11320.35
F 2 11320.35
F 3 1/31/312/30.12
F 4 1/21/23/210.18
Table 2. Training parameters for the semantic segmentation model.
ParameterValue
Learning Rate0.007
Epochs40
Loss FunctionCross-Entropy Loss
Backbone Neural NetworkMobileNet
Batch Size8
OptimizerSGD
Table 3. Evaluation metrics for the semantic segmentation model.
Semantic ClassPixel AccuracyPrecisionIoU
Buildings0.960.960.93
Greenery 0.910.840.77
Sky0.920.930.86
Background0.910.930.85
Table 4. Training parameters for the Historical Appearance Integrity evaluation model.
ParameterValue
Learning Rate0.0001
Epochs15
Loss FunctionCross-Entropy Loss
Batch Size8
OptimizerAdam
Table 5. Evaluation metrics for the HAI evaluation model.
IndicatorClassPrecisionRecallF1 Score
Building
materials
Negative0.910.960.94
Positive0.960.910.94
Decorative
details
Negative0.930.960.94
Positive0.960.930.94
Building
color
Negative0.930.960.95
Positive0.960.940.95
Streetscape
morphology
Negative0.930.990.96
Positive0.990.930.96
Table 6. Moran’s I of Historical Appearance Integrity and its indicators.
IndexBuilding
Materials
Decorative
Details
Building
Colors
Streetscape
Morphology
Historical
Appearance
Moran’s I0.130.130.120.120.12
z-score31.4129.8129.5929.6330.20
p-value0.000.000.000.000.00
Table 7. Statistical analysis of the Historical Appearance Integrity scores for different road levels.
Road LevelNumber of Sampling PointsAverage ScoreProportion of Scores Above 50
Primary26823.179.70%
Secondary76927.7312.90%
Branch514846.9334.87%
Table 8. Validation metrics of the model in overexposed and non-overexposed groups.
SVI QualityClassPrecisionRecallF1-Score
OverexposureNegative0.580.780.67
Positive0.840.670.74
Non-overexposureNegative0.900.910.91
Positive0.920.910.91
Disclaimer/Publisher’s Note: The statements, opinions and data contained in all publications are solely those of the individual author(s) and contributor(s) and not of MDPI and/or the editor(s). MDPI and/or the editor(s) disclaim responsibility for any injury to people or property resulting from any ideas, methods, instructions or products referred to in the content.

