Article

A Multi-Semantic Feature Fusion Method for Complex Address Matching of Chinese Addresses

1
Faculty of Geomatics, Lanzhou Jiaotong University, Lanzhou 730070, China
2
National-Local Joint Engineering Research Center of Technologies and Applications for National Geographic State Monitoring, Lanzhou 730070, China
3
Key Laboratory of Science and Technology in Surveying & Mapping, Lanzhou 730070, China
4
Faculty of Geosciences and Engineering, Southwest Jiaotong University, Chengdu 610031, China
5
Research Center of Geospatial Big Data Application, Chinese Academy of Surveying and Mapping, Beijing 100830, China
*
Author to whom correspondence should be addressed.
ISPRS Int. J. Geo-Inf. 2025, 14(6), 227; https://doi.org/10.3390/ijgi14060227
Submission received: 7 April 2025 / Revised: 26 May 2025 / Accepted: 5 June 2025 / Published: 9 June 2025

Abstract

Accurate address matching is crucial for the analysis, integration, and intelligent management of urban geospatial data and is also a key step in achieving geocoding. However, due to the complexity, diversity, and irregularity of address expression, address matching becomes a challenging task. This paper proposes a multi-semantic feature fusion method for complex address matching of Chinese addresses that formulates address matching as a classification task that directly predicts whether two addresses refer to the same location, without relying on predefined similarity thresholds. First, the address is resolved into address elements, and the Word2vec model is trained to generate word vector representations using these address elements. Then, multi-semantic features of the addresses are extracted using a Text Recurrent Convolutional Neural Network (Text-RCNN) and a Graph Attention Network (GAT). Finally, the Enhanced Sequential Inference Model (ESIM) is used to perform both local inference and inference composition on the multi-semantic features of the addresses to achieve accurate matching of addresses. Experiments were conducted using Points of Interest (POI) address data from Baidu Maps, Tencent Maps, and Amap within the Chengdu area. The results demonstrate that the proposed method outperforms existing address matching methods, with precision, recall, and F1 values all exceeding 95%. In addition, transfer experiments using datasets from five other cities including Beijing, Shanghai, Xi’an, Guangzhou, and Wuhan show that the model maintains strong generalization ability, achieving F1 values above 84% in cities such as Xi’an and Wuhan.

1. Introduction

With the advancement of urbanization and digitalization, the accumulation and application of urban data have become the core elements of modern smart city governance and planning [1,2,3]. Urban geospatial data, as a crucial component of urban data, serves as a link between physical cities and digital systems [4]. Urban geospatial data is widely applied in smart city construction, geographic navigation, location services, emergency management, and other fields [5,6,7]. Currently, the location information in most urban geospatial data is stored and expressed as unstructured text, lacking precise linkage to geographic coordinates [8]. This limitation hinders the efficient management and application of geospatial information within urban digital systems. To solve this problem, geocoding technology is used to establish the connection between textual location information and geographic coordinates [9,10], thereby converting textual location information into coordinate points that can be accurately located on the map.
Address matching, as a critical step in geocoding, compares an input address with a reference address database to find the most similar address, thereby converting the input address into geographic coordinates [11]. In general, the process consists of three major steps: address element resolution, address semantic feature extraction, and matching algorithm construction. In address element resolution, the address is segmented into geographic entities such as administrative divisions, roads, and house numbers [12]. Address semantic feature extraction involves extracting features related to geographic locations, geographical characteristics, or other semantic information from the address text [13]. The matching algorithm construction focuses on leveraging these semantic features and selecting suitable algorithms to match text addresses with corresponding entries in a standard address database [14]. However, due to the complexity, diversity, and irregularity of address expressions [15,16,17], the process of address matching is particularly challenging. Existing methods often rely on the similarity of common substrings within addresses, which fails to effectively capture the key semantic information of the address. Additionally, the cost and difficulty of setting up manual matching rules are significant.
This paper addresses the following research question: How can a deep learning-based, multi-semantic feature fusion method overcome the limitations of substring-based address matching and reduce reliance on manually defined matching rules, particularly for complex Chinese addresses? Therefore, this paper proposes a multi-semantic feature fusion method for complex address matching of Chinese addresses, focusing on their unique structural and semantic characteristics. The main contributions are as follows:
(1)
This study considers both the textual semantic features and hierarchical semantic features of addresses. Textual semantic features are used to capture the keywords and contextual information of address expressions, while hierarchical semantic features are used to capture the hierarchical nesting information between address elements.
(2)
This study proposes an address matching method based on an ESIM. This method reformulates the address matching task as a classification problem, thereby eliminating the need for predefined manual rules.
(3)
The proposed address matching method is designed to enhance key evaluation metrics such as precision, recall, and F1 score, which are crucial for applications like geocoding.
The rest of this article is organized as follows: Section 2 provides an overview of existing methods for extracting addresses’ semantic features and designing matching algorithms. Section 3 introduces the proposed address matching method, including address element word embedding vector generation, address multi-semantic feature extraction, and address matching. Section 4 discusses the experiments and analyzes the experimental results, and Section 5 concludes the paper.

2. Related Work

Among the various components involved in address matching systems, semantic feature extraction and matching algorithm construction are the two most critical. Semantic features serve as the foundation for understanding and comparing address content, while matching algorithms leverage these features to determine whether two addresses refer to the same location. Therefore, this section reviews related work from both aspects to provide a comprehensive understanding of recent developments in the field.

2.1. Address Semantic Feature Extraction

Address semantic feature extraction is a part of textual semantic feature extraction and serves as a fundamental step in address matching. By eliminating textual ambiguities, handling synonyms, and understanding the contextual environment [18], address semantic feature extraction improves the performance of address matching. Existing methods for address semantic feature extraction can be categorized as follows:
  • Statistical methods: These methods primarily rely on word frequency statistics within text to extract semantic features of words or phrases. The main methods include Term Frequency–Inverse Document Frequency (TF-IDF), n-gram, and Bag of Words [19,20,21]. These methods are simple and efficient, capable of handling large-scale text data. However, they overlook word order and contextual information, limiting their ability to capture complex semantic relationships and contextual features.
  • Word embedding methods: These methods map words to a continuous vector space, where semantically similar words have closer spatial distances, thereby capturing semantic relationships. For example, Word2Vec trains word embeddings using the Contiguous Bag of Words or Skip-gram model on the input text corpus [22,23]. GloVe captures semantic relationships between words by constructing word co-occurrence matrices and generates word embeddings with enhanced semantic features [24]. The FastText model treats each word as a word sequence of n-gram sub-words, constructing a word embedding vector by learning sub-word vectors [25]. While word embedding methods effectively capture semantic relationships, they require large amounts of training data, and static models cannot handle polysemy.
  • Contextual embedding methods: These methods learn word representations based on varying contextual environments to capture different semantic expressions of a word, overcoming the limitations of word embedding methods in handling polysemy. For example, ELMo learns word embeddings in different contexts using a Bi-directional Long Short-Term Memory network (Bi-LSTM) [26]. BERT generates dynamic and context-sensitive word embedding vectors through two pre-training tasks: the Masked Language Model (MLM) and Next Sentence Prediction (NSP) [27]. GPT, as an autoregressive model, generates context-dependent word embedding vectors through a pre-trained, unidirectional Transformer architecture [28]. Additionally, models like RoBERTa [29], XLNet [30], and T5 [31] further optimize Transformer-based methods, enhancing the ability to process long-distance dependencies and improve generalization capabilities.

2.2. Matching Algorithm Construction

An address matching algorithm utilizes natural language processing (NLP) techniques and geographic information system (GIS) technologies to handle the diversity and irregularity of address expressions [32]. The existing address matching algorithms can be categorized as follows:
  • String similarity-based matching algorithms: These algorithms quantify the similarity between two addresses using string-similarity metrics and determine matches based on a predefined similarity threshold. The main string similarity metrics include Levenshtein distance, cosine similarity, Jaccard similarity coefficient, and n-gram similarity [33,34,35]. These methods are simple to implement and efficient, making them suitable for large-scale data processing. However, their limited understanding of address structure and semantics leads to a decrease in matching performance.
  • Rule-based matching algorithms: These algorithms focus on specific address datasets, implementing address resolution and matching by defining rules that conform to structural characteristics and semantic relationships of address expression. For example, dictionary-tree matching uses tree data structures to effectively store and retrieve information, thereby accurately extracting and matching addresses [36,37]. Regular-expression matching methods define address expressions and matching rules using regular expressions that combine Chinese characters, English letters, numbers, and specific terms [38]. Although rule-based matching algorithms achieve high matching accuracy and efficiency for address data with specific structures, rule definition is complex, maintenance costs are high, and flexibility is limited.
  • Machine learning and deep learning-based matching algorithms: These algorithms require large, labeled datasets for training to capture structural and semantic features of address data. Machine learning-based algorithms typically rely on feature engineering to train classifiers or regression models for matching. For example, Random Forests (RF), Support Vector Machines (SVM), and Conditional Random Fields (CRF) have been used for address matching [39,40]. Deep learning-based algorithms automatically extract address features through multi-layer neural networks, enabling efficient matching. For example, Convolutional Neural Networks (CNNs) capture local features of addresses [18,41]. Long Short-Term Memory (LSTM) captures contextual relationships in address sequences [42,43]. BERT captures deep semantics and global dependencies of addresses [44,45,46]. Graph structures capture hierarchical relationships of addresses [47,48]. Additionally, there are also address matching methods based on multi-task joint learning and region proposal [14,49]. These models can deal with the complexity, diversity, and irregularity of addresses and improve the accuracy and efficiency of address matching. However, they require large, labeled datasets and substantial computational resources, and the processes of model training and optimization are relatively complex.
Compared with the existing address matching methods described above, the proposed method introduces several key innovations. First, unlike traditional string similarity and rule-based approaches, our model does not rely on handcrafted rules or predefined similarity thresholds, which improves flexibility and scalability. Second, the method integrates multiple types of semantic information by combining Text-RCNN for capturing contextual textual semantics and GAT for modeling hierarchical address structures. This multi-semantic feature fusion enables better handling of complex, diverse, and irregular address expressions. Third, by leveraging the ESIM model for fine-grained semantic inference, the method can effectively compare address pairs at both local and global levels. These combined capabilities allow the proposed framework to outperform existing machine learning and deep learning models in both accuracy and generalization, as demonstrated in the experimental evaluations.

3. Method

Figure 1 illustrates the proposed the address matching method based on multi-semantic feature fusion. The main steps include address element word embedding vector generation, address multi-semantic features extraction, and address matching. To illustrate the proposed method more clearly, we give a step-by-step example based on the following address pairs.
Address 1: 长寿路成都市科华中路小学 (Changshou Road, Chengdu Kehua Zhonglu Primary School).
Address 2: 四川省成都市武侯区长寿路2号科华中路小学 (No. 2, Changshou Road, Wuhou District, Chengdu City, Sichuan Province, Kehua Zhonglu Primary School).
In Phase 1, both addresses are segmented into structured address elements. Address 1 is resolved into elements such as “Changshou Road” and “Chengdu Kehua Zhonglu Primary School”, while Address 2 includes “No. 2”, “Changshou Road”, “Wuhou District”, “Chengdu City”, “Sichuan Province”, and “Kehua Zhonglu Primary School”. Word2Vec is used to convert each element into a corresponding word embedding vector.
In Phase 2, these vectors are passed into Text-RCNN to capture contextual semantics and into the GAT to extract their hierarchical semantic features. This process yields rich multi-semantic features for each address.
In Phase 3, the ESIM performs semantic inference between the two addresses, comparing their representations at the element level and aggregating them to produce a matching decision. For this example, the model correctly determines that both addresses refer to the same real-world location, thus outputting a positive match.

3.1. Address Element Word Embedding Vector Generation

Due to its natural language characteristics, Chinese address representation exhibits significant complexity, diversity, and irregularity. Specifically, Chinese addresses are composed of elements such as province, city, district, and house number, which often lack obvious separators and are prone to ambiguity. Additionally, Chinese addresses are influenced by regional culture, customary expressions, and historical changes, which increase the irregularity of addresses. Therefore, address element resolution can ensure that each address element can be correctly identified and compared in subsequent matching algorithms, thereby improving the accuracy of matching. Our method adopts the address element resolution method based on Bi-GRU proposed by Li et al. [12]. This method first uses Jieba for word segmentation, then uses BERT word embedding and Bi-GRU for label feature extraction, and finally uses Viterbi algorithm for label sequence inference to achieve Chinese address resolution. Table 1 provides examples of Chinese address element resolution. The above method is mainly designed for address element resolution in Chinese addresses. If address element resolution is required for addresses in other languages or countries, international standards such as ISO 19160-1:2015 may serve as a useful reference [50], as they define a conceptual model for structuring address components in a standardized and language-independent manner.
After completing the address element resolution, the proposed approach further employs the Word2vec model to generate word embedding vectors for the address elements, as shown in Figure 2. Specifically, we construct a vocabulary of 20,941 unique address elements extracted from the training dataset, including administrative regions, roads, building numbers, and POI names. These are used to generate a word embedding matrix of size 20,941 × 200, where each row corresponds to a distinct address element.
First, the resolved address elements are used as the training corpus, and an index lookup table containing all address elements is constructed. Next, the Word2vec model is applied to generate a word embedding vector matrix M D × d for all address elements in the input training corpus (where |D| denotes the total number of address elements in the corpus, and d denotes the dimensionality of the word embeddings). Finally, for any given address, its corresponding word embedding vector matrix E L × d can be retrieved from matrix M using the index lookup table (where |L| denotes the number of address elements in the address).

3.2. Address Multi-Semantic Feature Extraction

Addresses often contain rich semantic information, including place names, administrative levels, and road information. The effective extraction of this information is crucial for subsequent address matching tasks. Therefore, this study proposes a multi-semantic feature extraction strategy that aims to comprehensively capture the semantic features of addresses. First, Text-RCNN is employed to extract textual semantic features, and second, GAT is utilized to extract hierarchical semantic features. The following sections provide a detailed explanation of these two methods.

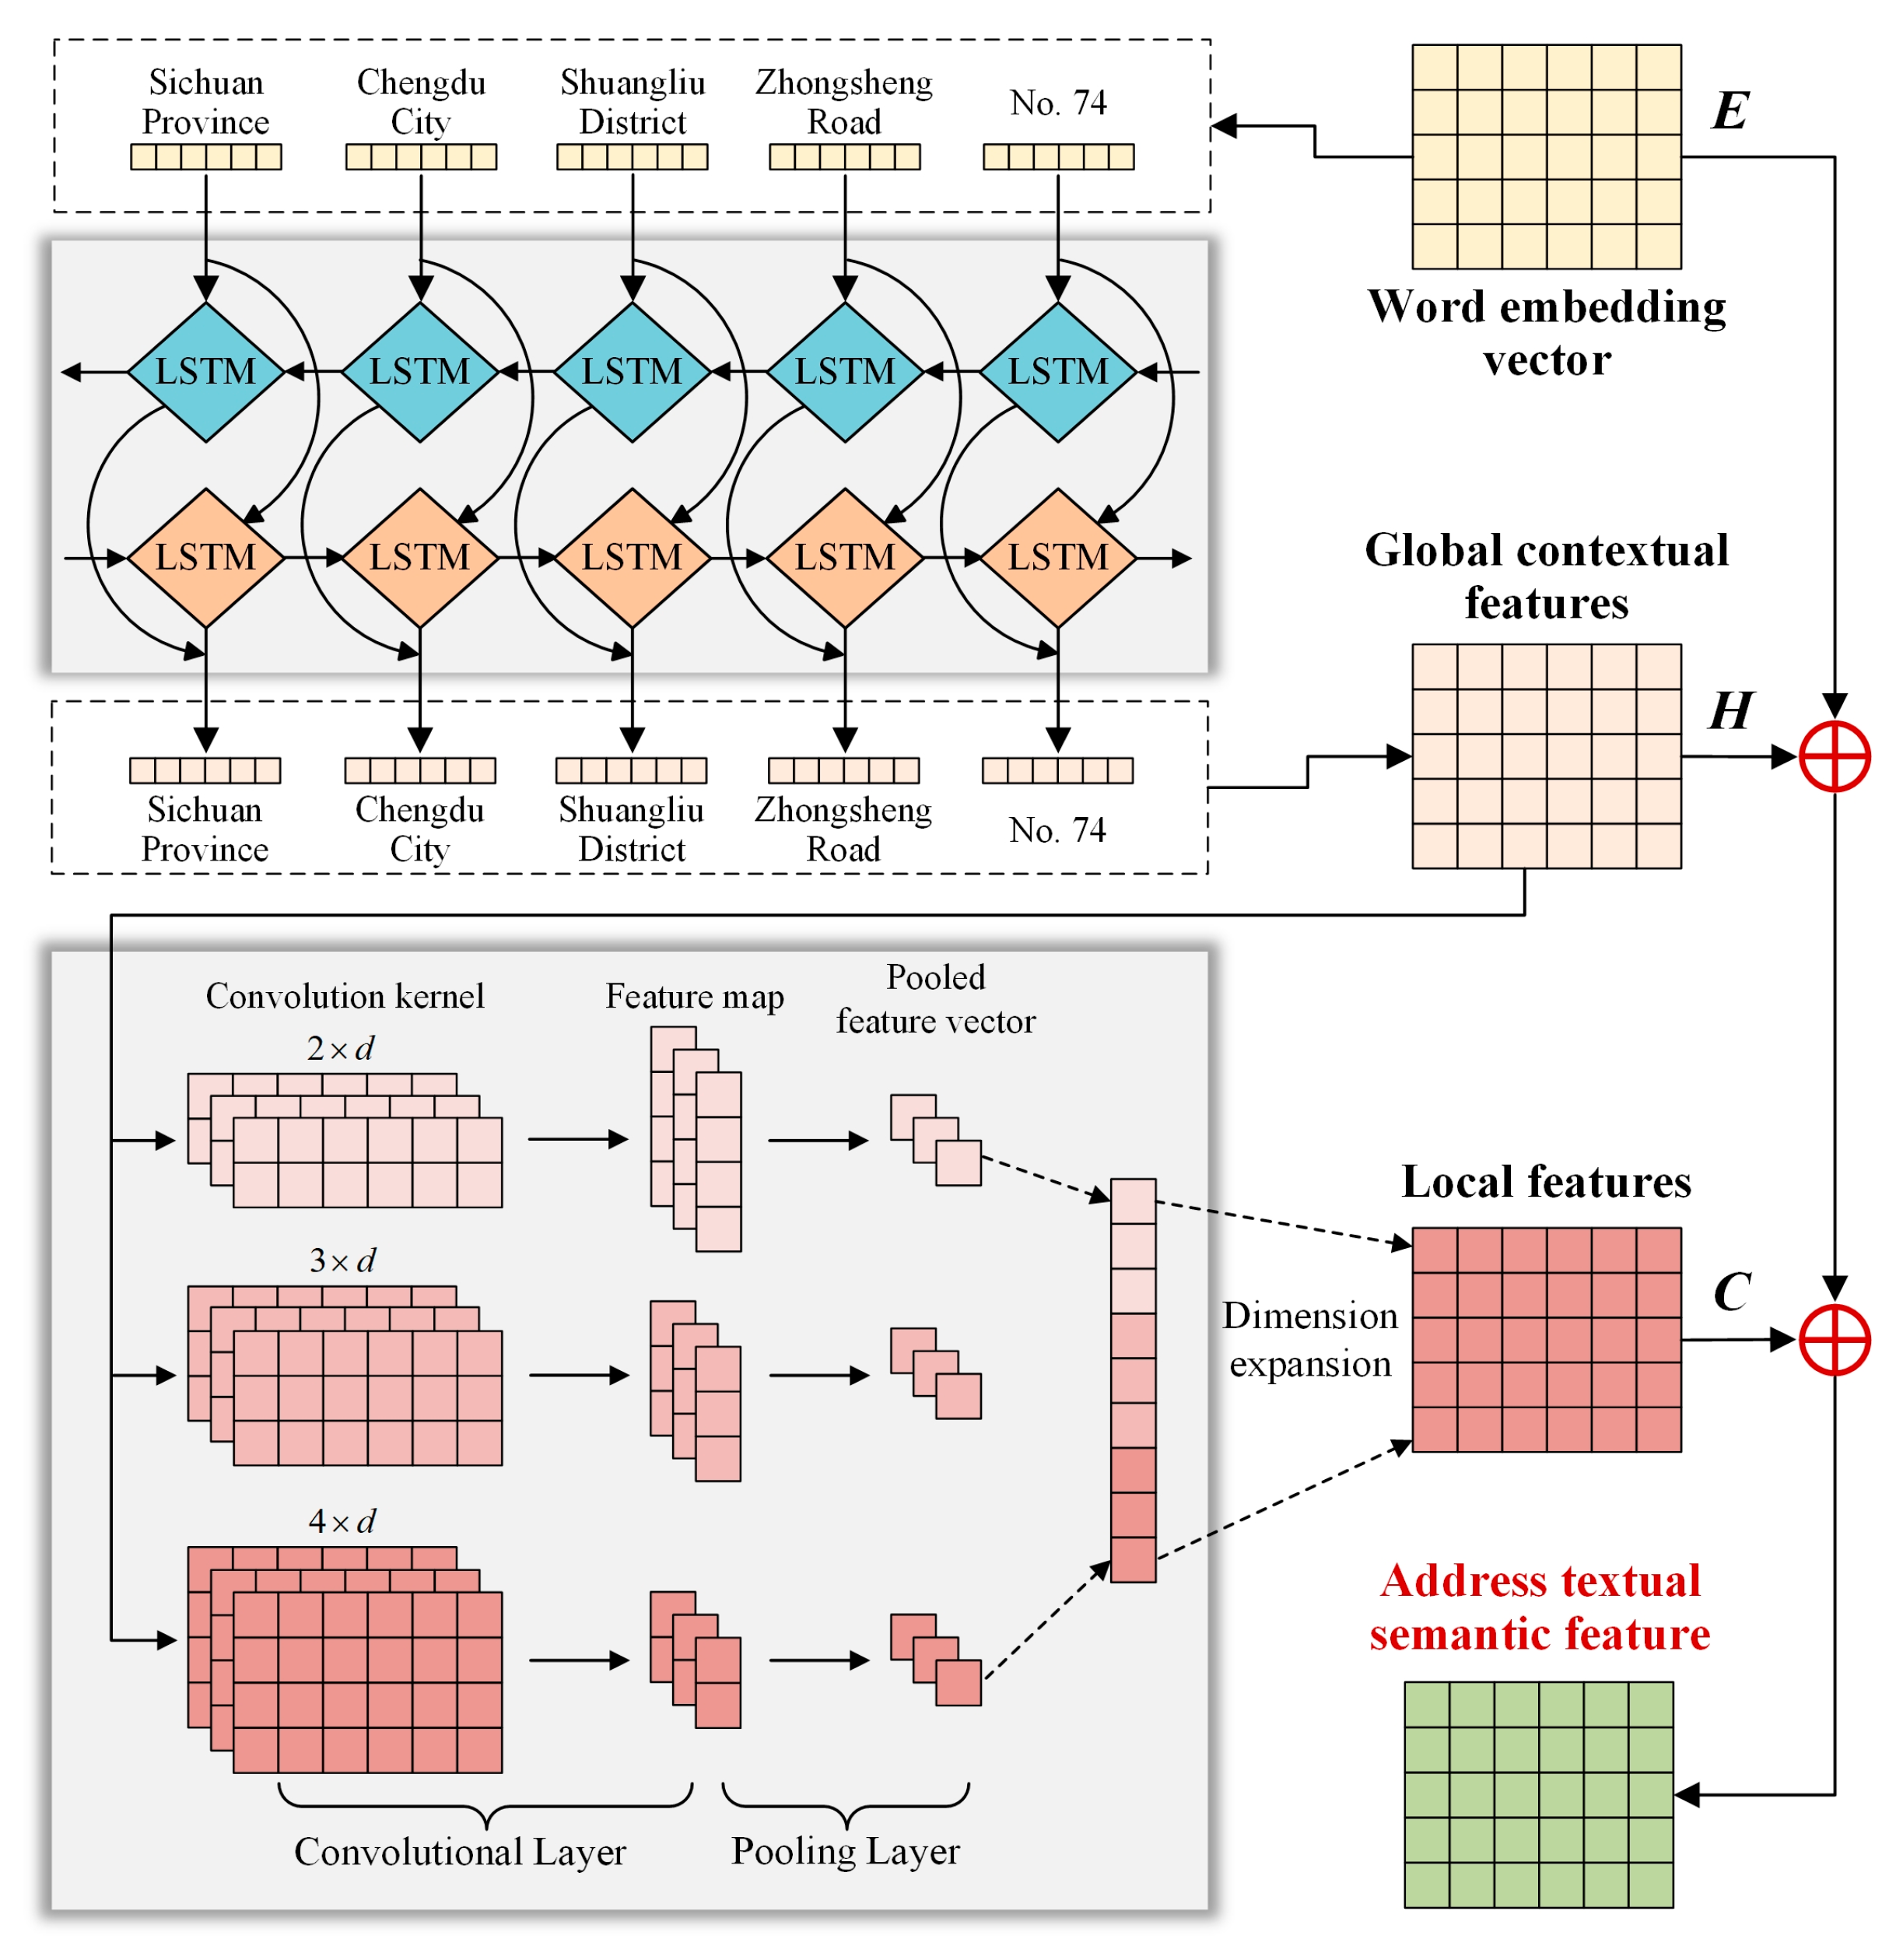
3.2.1. Address Textual Semantic Feature Extraction Based on Text-RCNN

Text-RCNN combines the advantages of Recurrent Neural Network (RNN) and CNN to generate rich textual semantic features of addresses by extracting and integrating both global contextual features and local features. The process of address textual semantic feature extraction using Text-RCNN is illustrated in Figure 3.
  • Global contextual feature extraction
The Text-RCNN inputs the word embedding vector matrix E L × d of the address elements into a Bi-LSTM network, which consists of two independent LSTM networks: a forward LSTM (from left to right) and a backward LSTM (from right to left). First, for each address element at time step 1 t L , the forward LSTM starts from the first address element and calculates the forward hidden state h t at the current time step. The backward LSTM calculates the backward hidden state h t starting from the last address element. Then, Bi-LSTM concatenates these hidden states to form a bidirectional hidden state h t , which is stacked over time steps to create a global contextual feature matrix H L × d . The calculation formula for the hidden state ht of the LSTM at time step t in either direction is as follows:
f t = σ W f h t 1 , x t + b f
i t = σ W i h t 1 , x t + b i
c ˜ t = tanh W c h t 1 , x t + b c
c t = f t c t 1 + i t c ˜ t
o t = σ W o h t 1 , x t + b o
h t = o t tanh c t
where ft denotes the forget gate, it denotes the input gate, ot denotes the output gate, c ˜ t denotes the candidate cell state, xt denotes the word embedding vector, ct denotes the cell state at the current time step, ht−1 denotes the hidden state at the previous time step, ct−1 denotes the cell state at the previous time step, σ and tanh() denote activation functions, W and b denote the trainable weight matrices and bias vectors, and ⊙ denotes the element-wise (Hadamard) product.
  • Local feature extraction
To extract the local features of the input address, Text-RCNN applies convolution, max-pooling, and dimensional expansion on the global contextual feature matrix. In the convolution step, multiple convolution filters with different window sizes are applied to generate feature maps ci. As shown in Figure 3, convolutional filters with heights of 2, 3, and 4 and a width of d are used. Since the width of the convolutional filters is the same as the dimensionality of the global contextual features, the convolution operation is only performed in the height direction. Then, the Max-pooling extracts the most salient features from each feature map and combines and expands these features to form a local feature vector C L × d . The specific calculation formula is as follows:
c i = f W h H i : i + h 1 + b h
c ^ h = max c 1 , c 2 , c n h + 1
v = [ c ^ h 1 ; c ^ h 2 ; c ^ h k ]
C = expand f W f c v + b f c
where Hi:i+h−1 denotes the submatrix of the global contextual feature H L × d from row i to row i + h − 1, c ^ h denotes the pooled feature vector corresponding to the convolutional filter with height h, v denotes the combination of pooled feature vectors corresponding to convolutional filters with k different window sizes, expand() denotes the dimensional expansion function, f() denotes the activation function, and W and b denote the trainable weight matrices and bias vectors.
  • Generation of textual semantic features
Finally, Text-RCNN performs element-wise addition on the word embedding vector matrix E, the global contextual feature H, and the local feature C to generate the textual semantic features of the address. This step integrates all available feature information to enhance the model’s understanding of address semantics. The final textual semantic feature vector is represented as
T = E H C
where T L × d denotes the address textual semantic features.

3.2.2. Address Hierarchical Semantic Feature Extraction Based on GAT

Addresses not only contain rich textual semantic features but also exhibit specific hierarchical semantic features between address elements. These hierarchical semantic features reflect the spatial topological relationships between address elements. For example, administrative divisions have relationships such as containment and adjacency, administrative divisions and roads have relationships such as containment, intersection, or adjacency, and roads and landmarks have relationships such as containment and adjacency. To capture this, we adopt GAT to extract hierarchical semantic features. The specific steps are as follows:
  • Graph structure construction and initialization
First, all address elements in the address element corpus are taken as nodes of GAT, where each address element is regarded as an independent node. Then, the edges of the GAT are constructed based on the sequential order of address elements in each address expression. For example, in the address expression “No. 2, Changshou Road, Wuhou District, Chengdu City, Sichuan Province, Kehua Zhonglu Primary School”, the graph structure can be represented by the following edges: Sichuan Province → Chengdu City, Chengdu City → Wuhou District, Wuhou District → Changshou Road, Changshou Road → No. 2 and No. 2 → Kehua Zhonglu Primary School. Finally, the word embedding vector of each address element is used to initialize the graph node features. While the examples above illustrate the graph structure of a single address, the actual graph is built by aggregating elements from all addresses, allowing the model to capture a variety of structural patterns such as hierarchical, parallel, and intersecting relationships.
  • Graph node feature update and hierarchical semantic feature extraction
The steps for updating the feature of each graph node ni are as follows: First, the attention coefficient eij is calculated between node ni and its first-order neighboring node nj, as well as between node ni and itself. This attention coefficient represents the importance of node nj to node ni. Then, the attention coefficient eij is normalized to obtain the attention weight aij. Finally, the attention weights are used to compute a weighted sum of the first-order neighboring node features and the self-node features, thereby updating the feature of node ni. This process iteratively updates the hierarchical semantic features of the address elements. The specific calculation formula is as follows:
e i j = LeakyReLU a T [ W f i | | W f j ]
a i j = exp e i j k N ( i ) exp e i k
f i = σ j N ( i ) a i j W f j
where fi and fj denote the features of node ni and node nj, f i denotes the updated feature of node ni, aT denotes the trainable attention vector, || denotes vector concatenation, W denotes the trainable weight matrix, LeakyReLU and σ denote activation functions, and N(i) denotes the set of first-order neighboring nodes of node ni and the node itself.
To enhance the model’s ability to extract hierarchical semantic features of addresses, our method employs a multi-head attention mechanism. Each attention head independently calculates attention coefficients, updates node features, and concatenates the results. The concatenated node features represent the hierarchical semantic features of the corresponding address elements. The specific calculation formula is as follows:
f i = k = 1 h σ j N ( i ) a i j k W k f j
where h denotes the number of attention heads, a i j k and W k represent the attention weights and weight matrix of the k-th attention head, and || denotes vector concatenation.

3.3. Address Matching Based on ESIM

Based on the textual and hierarchical semantic features extracted in the previous sections, the proposed method employs ESIM for address matching [51]. ESIM consists of an input encoding layer, a local inference layer, an inference combination layer, and a result prediction layer, as shown in Figure 4.
  • Input encoding layer: For the two addresses A and B to be matched, first, concatenate the textual and hierarchical semantic features of the two addresses to form multi-semantic feature vectors SA and SB. Then, Bi-LSTM is used to encode these feature vectors to generate the context-dependent representation HA and HB, capturing the contextual relationships of address elements. The specific calculation formula is as follows:
    H A = Bi - LSTM ( S A ) , H B = Bi - LSTM ( S B )
  • Local inference layer: This layer calculates the local inference relationships between the two addresses using an attention mechanism. First, based on the context-dependent representations HA and HB, the attention matrix e is computed between each address element in addresses A and B. Then, the attention matrix is used to perform soft alignment on addresses A and B, generating the aligned representations H ˜ A and H ˜ B . Finally, the context-dependent representations and aligned representations perform difference and dot product operations, followed by concatenation, to generate the enhanced representations MA and MB. The specific calculation formulas are as follows:
    e = H A T H B
    H ˜ A = softmax ( e ) H B , H ˜ B = softmax ( e T ) H A
    M A = [ H A ; H ˜ A ; H A H ˜ A ; H A H ˜ A ] , M B = [ H B ; H ˜ B ; H B H ˜ B ; H B H ˜ B ]
  • Inference combination layer: This layer integrates local inference information to generate a global inference representation. First, a Bi-LSTM encodes the enhanced representations MA and MB, capturing sentence-level inference relationships. Then, the encoded results are processed through pooling operations (average pooling and max pooling) to obtain fixed-length vectors. Finally, all pooling results are concatenated to generate the final matching vector vmatch. The specific calculation formulas are as follows:
    v A = Bi - LSTM ( M A ) , v B = Bi - LSTM ( M B )
    v A max = Maxpooling ( v A ) , v A ave = Avgpooling ( v A )
    v B max = Maxpooling ( v B ) , v B ave = Avgpooling ( v B )
    v m a t c h = [ v A max ; v A ave ; v B max ; v B ave ]
  • Result prediction layer: The concatenated matching vector vmatch is input into a multi-layer perceptron (MLP) to predict the address matching result, and softmax activation is applied to obtain the matching probability. The specific calculation formula is as follows:
    y = σ ( w v m a t c h + b )
    where y 2 denotes the matching result, σ denotes the activation function, and W and b denote the trainable weight matrices and bias vectors.

4. Experiments

To verify the effectiveness of the proposed method, we conducted a series of experiments and analyzed the results, covering the experimental environment, dataset, evaluation metrics, hyperparameter settings, and result analysis.

4.1. Experimental Environment and Dataset

The experimental environment includes PyTorch 2.1.0, Python 3.10, 13th Gen Intel Core i9-13900K CPU, 128GB RAM, and an NVIDIA GeForce RTX 4090 GPU. The experimental dataset used is the sample dataset created by Li et al. [41], which contains 439,780 pairs of POI addresses along with their corresponding labels. These POI address pairs include 190,231 from Baidu Maps, 246,317 from Tencent Maps, and 160,823 from Amap, all within the Chengdu area. These address pairs were labeled with a positive-to-negative ratio of 1:1, ensuring a balanced dataset for binary classification tasks. Table 2 lists some examples from this dataset.

4.2. Evaluation Metrics

To comprehensively evaluate the performance of the proposed method, we use three evaluation metrics: precision (P), recall (R), and F1 value (F1). Precision measures the proportion of actual matches among all predicted matches, reflecting the ability of the model to avoid mismatches. Recall measures the proportion of predicted matches among all actual matches, reflecting the ability of the model to identify all true matches. The F1 value is the harmonic mean of precision and recall, reflecting the overall performance of the model in balancing accuracy and recognition ability in the address matching task. The confusion matrix used for calculating these metrics is shown in Table 3, and the formulas for these metrics are as follows:
P = T P T P + F P ,   R = T P T P + F N ,   F 1 = 2 P R P + R

4.3. Hyperparameter Settings

To improve the performance of the address matching model, we conducted hyperparameter tuning experiments. By optimizing these hyperparameters, the model was able to achieve optimal performance. Specifically, we focused on four hyperparameters: Hidden Size, attention heads, Dropout Rate, and Batch Size (as shown in Figure 5), and selected the optimal parameter combination, which is detailed in Table 4.
Figure 5a,b show the F1 value performance of the model on the training and validation sets under different Hidden Size settings. On the training set, all four Hidden Size models (64, 128, 256, 384) exhibited a rapid convergence rate in the early training stages (epochs 1-5), with the F1 value rising quickly. After the 5th epoch, all models stabilized, with F1 values ranging between 0.82 and 0.84, demonstrating similar learning capabilities. On the validation set, the performance of all models closely mirrored their performance on the training set. Notably, the model with Hidden Size = 64 showed slightly weaker performance in the early stages on the validation set, but its F1 value gradually converged with the other models during subsequent training. This indicates that for this task and dataset, a smaller Hidden Size achieved a good balance between computational efficiency and final performance. Therefore, considering computational resources and the actual needs of the model, we selected Hidden Size = 64.
Figure 5c,d show the F1 performance of the model on the training and validation sets under different attention heads settings. On the training set, models with various attention heads (4, 8, 16, 24) all exhibited a rapid convergence rate in the early stages of training (epochs 1-5), with the F1 value of the model with attention heads = 4 improving the fastest. As training progressed, the F1 values of all models gradually stabilized and converged around 0.83. This indicates that the number of attention heads has minimal impact on the final F1 value on the training set, primarily influencing the convergence rate in the early stages. The validation set results further support this conclusion. The models with attention heads = 4 and 8 achieved the fastest improvement in F1 value on the validation set, with F1 values stabilizing around 0.94. In contrast, the models with attention heads = 16 and 24 exhibited slower initial convergence and slightly lower F1 values throughout training, though the differences were not significant. Therefore, it is evident that increasing the number of attention heads does not significantly improve model performance, while a smaller number of attention heads can achieve good performance with higher computational efficiency. Thus, we selected attention heads = 4.
Figure 5e,f show the F1 performance of the model on the training and validation sets under different Dropout Rate settings. On the training set, the different Dropout Rate settings had a significant impact on the training performance of the model. As the Dropout Rate increased, the F1 value on the training set significantly decreased. Specifically, the model with Dropout Rate = 0.1 performed the best, with the F1 value stabilizing around 0.95, while the model with Dropout Rate = 0.7 performed the worst, with an F1 value of only about 0.73. This indicates that a higher Dropout Rate leads to excessive regularization, limiting the performance of the model on the training set. On the validation set, lower Dropout Rates (such as 0.1 and 0.3) also showed higher F1 values, stabilizing above 0.95. In comparison, the model with Dropout Rate = 0.7 had a lower F1 value on the validation set, only around 0.93. This indicates that a moderate Dropout Rate can effectively prevent overfitting, while an excessively high Dropout Rate reduces the model’s generalization ability. Therefore, we selected Dropout Rate = 0.1.
Figure 5g,h show the F1 performance of the model on the training and validation sets under different Batch Size settings. On the training set, the model with Batch Size = 512 showed a rapid increase in F1 value during the early stages of training (epochs 1-6) but a significant decrease after the 7th epoch, indicating unstable training. In contrast, the models with Batch Sizes = 1024 and 2048 demonstrated more stable performance, maintaining higher F1 values. The model with Batch Size = 4096 consistently showed lower F1 values due to insufficient training. On the validation set, the model with Batch Size = 512 showed a similar trend, with the F1 value decreasing significantly after reaching a high value in the early stages (epochs 1-8). In contrast, the models with Batch Sizes = 1024 and 2048 performed more stably and maintained higher F1 values, indicating that these settings better ensured the model’s generalization ability. The model with Batch Size = 4096 performed poorly, indicating that an excessively large Batch Size is detrimental to effective model training. In summary, models with Batch Sizes of 1024 or 2048 can better balance training stability and generalization ability while ensuring model performance. Therefore, we selected Batch Size = 2048.

4.4. Experiment Results and Analysis

4.4.1. Comparison and Ablation Experiments

To verify the effectiveness of the proposed Chinese address matching method, we designed comparison experiments and ablation experiments. In the comparison experiments, we selected various baseline methods for comparison, including string similarity calculation methods, machine learning methods, and deep learning methods. Specifically, the string similarity calculation methods included Levenshtein distance [52], Jaccard similarity [53], and cosine similarity [54]; the machine learning methods included SVM [55] and RF [56]; the deep learning methods included Word2Vec + ESIM [16], ABLC [18], AMGCN + node2vec [47], and StructAM [48]. In the ablation experiments, we removed the Text-RCNN and GAT modules separately to observe the changes in model performance on the Chinese address matching task. This experimental setup allows us to better understand the contribution of each module to the overall model. The results of the comparison experiment and ablation experiment are shown in Table 5.
In the string similarity calculation methods, the precision of Levenshtein distance, Jaccard similarity, and cosine similarity all reached 100%. This is because these methods rely on strict character-level similarity measures, where two addresses are considered a match only if they are completely identical or highly similar at the character-level. Therefore, when these methods produce a positive match, it can almost be guaranteed that the match is accurate, resulting in a precision of 100%. However, this strict matching criterion shows significant limitations when dealing with slight variations in address expressions, such as character reordering or word substitutions. For example, when the input addresses are “四川省成都市武侯区升华路6号 (No. 6 Shenghua Road, Wuhou District, Chengdu City, Sichuan Province)” and “成都市武侯区升华路6号CPECC大厦 (CPECC Building, No. 6 Shenghua Road, Wuhou District, Chengdu City)”, even though these two addresses are highly similar in actual semantics, the character-level differences cause them to be considered mismatches. Consequently, this leads to a large number of actual matching addresses being missed, significantly lowering the recall (all below 19%) and thereby affecting the F1 value. Overall, while these methods achieve very high precision, they are unable to effectively capture deeper semantic information when handling the diversity and complexity of Chinese addresses, resulting in many actual matches being missed.
In the machine learning methods, RF and SVM effectively captured address features and classification boundaries by introducing feature engineering and classification strategies, significantly improving matching performance. Specifically, RF achieved a precision of 89.24%, recall of 85.81%, and F1 value of 87.49%, showing significant improvement across all evaluation metrics compared to string similarity calculation methods. This improvement is primarily due to RF’s ability to learn across different feature dimensions by integrating multiple decision trees, thereby fully leveraging the diversity of the data to capture the relationships between complex address features. Furthermore, by combining word embedding features generated by Word2vec, RF could better understand the semantic information of Chinese addresses in higher dimensions, reducing both mismatches and missed detections. For instance, RF correctly matched the address pair “锦江区东大街138号 (No. 138, East Street, Jinjiang District)” and “成都市锦江区东大街138号 (春熙路地铁站附近) (No. 138, East Street, Jinjiang District, Chengdu City (near Chunxi Road Subway Station))”, while traditional string similarity methods such as Levenshtein and Jaccard failed due to the added landmark expression in parentheses. SVM achieved a precision of 89.52%, recall of 86.58%, and F1 value of 88.02%, with each evaluation metric slightly higher than those of RF. This advantage is largely due to SVM’s ability to maximize the classification margin, allowing it to more precisely capture address feature boundaries, especially when handling highly similar addresses. Additionally, by combining Word2vec word embedding features, SVM was able to construct a more refined classification hyperplane in the feature space, effectively handle complex address expressions. For example, SVM correctly matched the address pair “成都市武侯区一环路南一段20号附1号 (No. 1 with No. 20, South Section 1, First Ring Road, Wuhou District, Chengdu City)” and “武侯区一环路南一段20号1栋 (Building 1, No. 20, South Section 1, First Ring Road, Wuhou District)”, which traditional character-based methods failed to recognize due to lexical differences. Overall, compared to string similarity calculation methods, machine learning methods performed well in handling the diversity and complexity of Chinese addresses, with significant improvements in precision, recall, and F1 value.
In the deep learning methods, Word2Vec + ESIM, ABLC, AMGCN + node2vec, and StructAM further improved the performance of Chinese address matching. Specifically, Word2Vec + ESIM achieved a precision of 93.57%, recall of 94.40%, and F1 value of 93.98%. This model reduces the limitations of traditional methods caused by strict character matching by vectorizing and performing semantic reasoning on Chinese addresses. Although the precision is slightly lower, the higher recall effectively avoids missed matches, improving overall matching performance. ABLC achieved a precision of 94.89%, recall of 94.63%, and F1 value of 94.76%. The model extracts and learns the semantic similarity between address pairs through contrast learning strategy and Attention-Bi-LSTM-CNN network and optimizes the model’s ability to distinguish between similar and dissimilar addresses, thereby improving the matching performance. AMGCN + node2vec achieved a precision of 94.55%, recall of 95.24%, and F1 value of 94.89%. This model improves the recognition of complex addresses by modeling the graph structure, allowing it to capture deeper connections between address elements. StructAM has a precision of 95.97%, recall of 94.86%, and F1 value of 95.41%. This model utilizes Large Language Model (LLM) and the GraphSAGE module to better understand the structure and semantics of addresses, excelling in handling irregular address expressions. Overall, deep learning methods demonstrated significant advantages in the Chinese address matching task. Compared to the previous two types of methods, deep learning models show superior performance in handling word order changes, redundant information, and capturing deep semantic relationships. For example, this type of method successfully identifies the address pair “四川大学望江校区北门 (North Gate of Wangjiang Campus, Sichuan University)” and “川大望江北门 (North Gate of Wangjiang Campus, SCU)” as a match by recognizing the semantic equivalence between “四川大学 (Sichuan University)” and its common abbreviation “川大 (SCU)”.
The proposed Chinese address matching method (Text-RCNN + GAT + ESIM) achieved the best matching performance, with a precision of 95.85%, a recall of 95.83%, and an F1 value of 95.84%, achieving the best overall performance among the comparison methods. The main reasons are as follows:
First, Text-RCNN combines the advantages of RNN and CNN, effectively capturing both global contextual features and local features within addresses. This combination allows the model to excel in handling mixed long and short sentences, redundant information, and word-order changes, ensuring matching accuracy. For example, when dealing with addresses containing different word orders or redundant descriptions, Text-RCNN can identify subtle changes and maintain semantic consistency by capturing contextual information. This was validated in the ablation experiment, where the performance of the model (GAT + ESIM) significantly decreased after removing the Text-RCNN module, with precision, recall, and F1 value decreasing by 2.24%, 2.00%, and 2.12%, respectively. This demonstrates that Text-RCNN plays a crucial role in extracting rich semantic information from addresses and handling complex expressions.
Secondly, GAT accurately extracts hierarchical semantic features from addresses by constructing a graph structure among address elements and dynamically assigning weights using the attention mechanism. This enables the model to effectively capture the hierarchical relationships between address elements and perform well when processing multi-level address descriptions. For example, in addresses with complex hierarchical relationships, GAT can capture fine-grained semantic dependencies between elements such as administrative divisions, streets, and house numbers. In the ablation experiments, removing the GAT module (Text-RCNN + ESIM) resulted in a decrease in precision, recall, and F1 value by 1.05%, 1.72%, and 1.39%, respectively, highlighting the importance of GAT in hierarchical semantic feature extraction.
Finally, the ESIM module plays a crucial role in semantic integration and inference within the overall model. By encoding the multi-semantic features of addresses through Bi-LSTM and combining local inference with global semantic integration, ESIM is better able to capture complex semantic dependencies. This enables ESIM to maintain high matching accuracy when handling the diversity and irregularity of addresses, thereby enhancing the overall matching performance of the model.
In summary, the proposed method effectively combines the Text-RCNN, GAT, and ESIM modules to extract and model the textual semantic features, hierarchical semantic features, and multi-semantic relationships of addresses. The ablation experiments demonstrate that each module complements the others within the overall model, and the removal of any module results in a significant decline in matching performance. Based on the results of both the comparison and ablation experiments, the proposed method demonstrates clear advantages in the Chinese address matching task, achieving optimal matching performance. However, despite these advantages, the proposed method still faces limitations when handling certain ambiguous or underspecified address expressions. For example, in Table 2, the third address pair, “No. 131 with No. 7, Yihu East Road, Qingbaijiang District” and “No. 137, Yihu East Road, 20 m east, next to Dawan Police Station,” is labeled as a match, yet our method failed to recognize it. This failure is primarily due to the complexity and vagueness of the second address, which contains non-standard expressions such as “20 m east” and “next to Dawan Police Station”. These phrases introduce spatial and contextual references that are difficult to interpret using purely textual or structural semantic features. Additionally, such expressions often lack explicit, structured address elements, making it harder for the model to align the address pair correctly. This example illustrates that the proposed model is less effective when dealing with descriptions that rely on local knowledge, directional cues, or landmark-based references.

4.4.2. Transfer Experiment

In Chinese address matching tasks, the generalization ability of the model is an important indicator for evaluating its practical application performance. Due to the diversity of addresses across different cities, the training data may not cover all possible address expression forms. Therefore, we designed transfer experiments to verify the adaptability and generalization ability of the model on data from other cities.
In this transfer experiment, we used a model trained on the Chengdu dataset and tested it on datasets from five cities: Beijing, Shanghai, Xi’an, Guangzhou, and Wuhan. The main reasons for selecting these cities are as follows: First, these cities have different geographical and cultural backgrounds, and their address formats and expressions have certain differences, which can effectively test the stability and adaptability of the model when processing addresses in different regions. Second, these cities represent different geographical regions of China, including Shanghai in the east, Xi’an in the west, Guangzhou in the south, Beijing in the north, and Wuhan in the center. These cities are highly representative and can provide a comprehensive evaluation of the model’s generalization ability. The address datasets for these five cities were collected from Baidu Maps, Tencent Maps, and Amap, using the same POI query and labeling process as described in Section 4.1. Each city contains 10,000 POI address pairs with corresponding labels, and the dataset has a 1:1 ratio of positive-to-negative samples. The results of the transfer experiment are shown in Table 6.
In the machine learning methods, RF and SVM have the lowest F1 values in this transfer experiment. Specifically, RF exhibits low F1 values across all cities, with especially poor performance in Shanghai (F1 value of 31.97%) and Xi’an (F1 value of 39.93%). This indicates that RF struggles with handling complex and diverse address data and is unable to effectively adapt to the address expression differences between cities. In contrast, SVM performs slightly better, with F1 values exceeding 60% in all cities, but the overall F1 value remains relatively low. This shows that although SVM can better capture address features, it has difficulty in fully coping with the differences in address format and expression in different cities due to its reliance on feature engineering.
In deep learning methods, Word2Vec + ESIM has the lowest F1 value, particularly in Xi’an and Guangzhou, where the F1 values did not exceed 60%. The main reason is that Word2Vec struggles to effectively capture the semantic features of unseen words, low-frequency words, and new address expressions, leading to poor generalization ability. ABLC achieved F1 values above 70% across all cities, with an exceptional F1 value of 82.48% in Xi’an. This excellent performance is due to ABLC enhancing the mode’s ability to distinguish between positive and negative samples through contrastive learning, enabling better identification and matching of semantically similar addresses in complex and diverse matching tasks. AMGCN + node2vec exhibited F1 values around 70% across all cities, demonstrating relatively stable matching performance. However, its F1 values were consistently lower than those of ABLC and StructAM. This shows that although this method can provide consistent matching results in different cities, its performance is still limited when dealing with complex address matching tasks. Compared with other deep learning methods, StructAM achieved the highest F1 value in all cities, especially Shanghai (F1 value of 79.79%), which outperformed all the compared methods. This shows that this method can not only effectively adapt to the address matching tasks of different cities but also maintain high matching performance in complex and diverse address expressions.
The proposed Chinese address matching method (Text-RCNN + GAT + ESIM) achieved the highest F1 values among all comparison methods in cities such as Beijing (F1 value of 81.34%), Xi’an (F1 value of 84.36%), Guangzhou (F1 value of 75.22%), and Wuhan (F1 value of 84.05%). In particular, the F1 values in Xi’an and Wuhan both exceeded 84%, indicating that the method still maintains high matching performance in address matching tasks across different cities. Although the performance in Shanghai (F1 value of 77.52%) is slightly lower than that of StructAM (F1 value of 79.79%), it still demonstrates high performance. This result shows that although the address expressions of some cities may differ from the Chengdu dataset, this method can still provide accurate and stable matching performance in most cities, reflecting its strong cross-regional adaptability and generalization ability.
In summary, the Text-RCNN + GAT + ESIM model demonstrated significant advantages in the transfer experiment. In contrast, the machine learning methods performed poorly in the transfer experiment. While deep learning methods performed better, they were still affected by address expression differences in some cities and did not achieve the outstanding performance of the proposed method.
In addition to accuracy, we also evaluated the inference efficiency of the proposed model. On the Chengdu test set, which contains 10,996 address pairs, the total inference time was approximately 1.5 s on a workstation equipped with an NVIDIA GeForce RTX 4090 GPU. This corresponds to a throughput of over 7330 address pairs per second. Based on this performance, matching a single address against a database of 100,000 candidate addresses using a naive one-to-many strategy would take approximately 14 s. However, in practical applications, this process can be further optimized by incorporating candidate retrieval techniques, such as rule-based filtering (e.g., filtering by administrative region or road name), approximate nearest neighbor (ANN) search based on embedding similarity, or hybrid retrieval methods that combine lexical and semantic cues, to reduce the number of address pairs to be compared. These results demonstrate that the proposed method not only exhibits strong generalization ability but also offers practical efficiency for large-scale deployment.

5. Conclusions

This study proposes a Chinese address matching method based on multi-semantic feature fusion, which successfully addresses the complexity, diversity, and irregularity of address expressions. By integrating Text-RCNN, GAT, and ESIM models, the proposed method captures both textual and hierarchical semantic features, improving matching performance significantly. Compared with traditional string similarity calculations and existing machine learning and deep learning methods, the framework reduces the need for manual feature engineering and demonstrates superior results, with precision, recall, and F1 values of 95.85%, 95.83%, and 95.84%, respectively. Additionally, transfer experiments show strong generalization across multiple cities, with particularly outstanding performance in Xi’an and Wuhan, where F1 exceeded 84%. In response to the research question raised in the introduction, our study demonstrates that the proposed multi-semantic feature fusion method effectively addresses the limitations of substring-based address matching and reduces the reliance on manually defined matching rules.
Although the proposed method performs well in Chinese address matching, it still has certain limitations. First, the model relies on labeled data, requiring significant effort in data annotation, which can limit its scalability and practical application in scenarios where labeled data is scarce. Additionally, the method struggles with extremely complex or ambiguous address expressions, such as those containing vague references or omitted details (e.g., “the road next to XX residential area” or “XX building near the center of Chengdu”). In these cases, the absence of a clear hierarchical structure or standardized expression makes the model more prone to errors, leading to a decline in matching performance. Lastly, performance may vary across geographic regions due to differences in address formats and naming conventions, potentially leading to inconsistent outcomes across datasets.
To address these limitations, future research will focus on several critical areas. First, to reduce the reliance on labeled data, semi-supervised and unsupervised learning approaches will be explored, aiming to alleviate the need for extensive manual data annotation. Techniques such as transfer learning and active learning may also be investigated to improve the model’s scalability and adaptability in scenarios where labeled data is limited. Second, to enhance the model’s capability in handling complex or ambiguous address expressions, the integration of richer contextual information and multimodal data (e.g., map data, street view images) will be considered. This approach can provide a more comprehensive understanding of address semantics and improve matching accuracy in cases where addresses are vague or incomplete. Lastly, to address performance variability across different geographic regions and countries, future work will explore methods to account for variations in address formats and naming conventions. This may include the incorporation of region-specific training data or the development of more flexible and language-agnostic matching strategies. Although the current method was developed using Chinese address data, its architecture is not inherently language dependent. The core components such as Text RCNN, GAT, and ESIM can be trained on address data from other countries if sufficient labeled samples are available. Future research will also consider integrating international standards like ISO 19160-1:2015 and evaluating the model on multilingual or country-specific datasets in order to assess its adaptability and generalizability across diverse geospatial contexts [50]. Collectively, these improvements are expected to significantly enhance the robustness, adaptability, and generalizability of the proposed method, further extending its applications in geospatial data integration and urban management.

Author Contributions

Data curation, Shuangtong Liu and Ping Du; methodology, Pengpeng Li and Yuting Zhang; project administration, Pengpeng Li; resources, Jiping Liu and Qing Zhu; writing—original draft, Pengpeng Li and Tao Liu; writing—review and editing, Yuting Zhang and Qing Zhu. All authors have read and agreed to the published version of the manuscript.

Funding

The research was supported by the Postdoctoral Fellowship Program of CPSF (GZC20231020), China Postdoctoral Science Foundation (2023M741496), the National Natural Science Foundation of China (42401564), Gansu Youth Science and Technology Fund (24JRRA275), the Joint Innovation Fund Project of Lanzhou Jiaotong University and Corresponding Supporting University (LH 2024019), and Young Talent Project of Gansu Provincial Organization Department (Individual Project) (2025QNGR14).

Data Availability Statement

The corresponding author will provide the data supporting the findings of this study upon reasonable request.

Acknowledgments

The authors would like to thank the anonymous reviewers and the editor for their constructive comments and suggestions for this paper.

Conflicts of Interest

The authors declare no conflicts of interest.

References

  1. Hashem, I.A.T.; Chang, V.; Anuar, N.B.; Adewole, K.; Yaqoob, I.; Gani, A.; Ahmed, E.; Chiroma, H. The role of big data in smart city. Int. J. Inf. Manag. 2016, 36, 748–758. [Google Scholar] [CrossRef]
  2. Lau, B.P.L.; Marakkalage, S.H.; Zhou, Y.; Hassan, N.U.; Yuen, C.; Zhang, M.; Tan, U.X. A survey of data fusion in smart city applications. Inf. Fusion 2019, 52, 357–374. [Google Scholar] [CrossRef]
  3. Kandt, J.; Batty, M. Smart cities, big data and urban policy: Towards urban analytics for the long run. Cities 2021, 109, 102992. [Google Scholar] [CrossRef]
  4. Ying, S.; Van Oosterom, P.; Fan, H. New techniques and methods for modelling, visualization, and analysis of a 3D city. J. Geovis. Spat. Anal. 2023, 7, 26. [Google Scholar] [CrossRef]
  5. Zhang, C.; Zhao, T.; Li, W. Automatic search of geospatial features for disaster and emergency management. Int. J. Appl. Earth Obs. 2010, 12, 409–418. [Google Scholar] [CrossRef]
  6. Esmaelian, M.; Tavana, M.; Santos Arteaga, F.J.; Mohammadi, S. A multicriteria spatial decision support system for solving emergency service station location problems. Int. J. Geogr. Inf. Sci. 2015, 29, 1187–1213. [Google Scholar] [CrossRef]
  7. Li, W.; Batty, M.; Goodchild, M.F. Real-time GIS for smart cities. Int. J. Geogr. Inf. Sci. 2020, 34, 311–324. [Google Scholar] [CrossRef]
  8. Liu, J.; Wang, Y.; Hu, Y.; Luo, A.; Che, X.; Li, P.; Cao, Y. A review of web-based ubiquitous geospatial information discovery and integration technology. Acta Geod. Cartogr. Sin. 2022, 51, 1618–1628. [Google Scholar]
  9. Goldberg, D.W.; Wilson, J.P.; Knoblock, C.A. From text to geographic coordinates: The current state of geocoding. URISA J. 2007, 19, 33–46. [Google Scholar]
  10. Melo, F.; Martins, B. Automated geocoding of textual documents: A survey of current approaches. Trans. GIS 2017, 21, 3–38. [Google Scholar] [CrossRef]
  11. Harada, Y.; Shimada, T. Examining the impact of the precision of address geocoding on estimated density of crime locations. Comput. Geosci. 2006, 32, 1096–1107. [Google Scholar] [CrossRef]
  12. Li, P.; Luo, A.; Liu, J.; Wang, Y.; Zhu, J.; Deng, Y.; Zhang, J. Bidirectional gated recurrent unit neural network for Chinese address element segmentation. ISPRS Int. J. Geo-Inf. 2020, 9, 635. [Google Scholar] [CrossRef]
  13. Xu, L.; Du, Z.; Mao, R.; Zhang, F.; Liu, R. GSAM: A deep neural network model for extracting computational representations of Chinese addresses fused with geospatial feature. Comput. Environ. Urban Syst. 2020, 81, 101473. [Google Scholar] [CrossRef]
  14. Li, F.; Lu, Y.; Mao, X.; Duan, J.; Liu, X. Multi-task deep learning model based on hierarchical relations of address elements for semantic address matching. Neural Comput. Applic. 2022, 34, 8919–8931. [Google Scholar] [CrossRef]
  15. Peng, M.; Li, Z.; Liu, H.; Meng, C.; Li, Y. Weighted geocoding method based on Chinese word segmentation and its application to spatial positioning of COVID-19 epidemic prevention and control. Geomat. Inf. Sci. Wuhan Univ. 2020, 45, 808–815. [Google Scholar]
  16. Lin, Y.; Kang, M.; Wu, Y.; Du, Q.; Liu, T. A deep learning architecture for semantic address matching. Int. J. Geogr. Inf. Sci. 2020, 34, 559–576. [Google Scholar] [CrossRef]
  17. Li, P.; Wang, Y.; Liu, J.; Luo, A.; Xu, S.; Zhang, Z. Enhanced semantic representation model for multisource point of interest attribute alignment. Inf. Fusion 2023, 98, 101852. [Google Scholar] [CrossRef]
  18. Chen, J.; Chen, J.; She, X.; Mao, J.; Chen, G. Deep contrast learning approach for address semantic matching. Appl. Sci. 2021, 11, 7608. [Google Scholar] [CrossRef]
  19. Zhao, R.; Mao, K. Fuzzy bag-of-words model for document representation. IEEE Trans. Fuzzy Syst. 2017, 26, 794–804. [Google Scholar] [CrossRef]
  20. Kaur, G.; Sharma, A. A deep learning-based model using hybrid feature extraction approach for consumer sentiment analysis. J. Big Data 2023, 10, 5. [Google Scholar] [CrossRef]
  21. Semary, N.; Ahmed, W.; Amin, K.; Pławiak, P.; Hammad, M. Enhancing machine learning-based sentiment analysis through feature extraction techniques. PLoS ONE 2024, 19, e0294968. [Google Scholar] [CrossRef] [PubMed]
  22. Mikolov, T.; Chen, K.; Corrado, G.; Dean, J. Efficient estimation of word representations in vector space. arXiv 2013, arXiv:1301.3781. [Google Scholar]
  23. Mikolov, T.; Sutskever, I.; Chen, K.; Corrado, G.S.; Dean, J. Distributed representations of words and phrases and their compositionality. Neural Inf. Process. Syst. 2013, 26, 3111–3119. [Google Scholar]
  24. Pennington, J.; Socher, R.; Manning, C.D. Glove: Global vectors for word representation. In Proceedings of the 2014 Conference on Empirical Methods in Natural Language Processing, Doha, Qatar, 25–29 October 2014; pp. 1532–1543. [Google Scholar]
  25. Joulin, A.; Grave, E.; Bojanowski, P.; Mikolov, T. Bag of tricks for efficient text classification. arXiv 2016, arXiv:1607.01759. [Google Scholar]
  26. Peters, M.; Neumann, M.; Iyyer, M.; Gardner, M.; Clark, C.; Lee, K.; Zettlemoyer, L. Deep contextualized word representations. arXiv 2018, arXiv:1802.05365. [Google Scholar]
  27. Devlin, J.; Chang, M.W.; Lee, K.; Toutanova, K. Bert: Pre-training of deep bidirectional transformers for language understanding. arXiv 2018, arXiv:1810.04805. [Google Scholar]
  28. Radford, A.; Narasimhan, K.; Salimans, T.; Sutskever, I. Improving Language Understanding by Generative Pre-Training. 2018. Available online: https://api.semanticscholar.org/CorpusID:49313245 (accessed on 8 July 2024).
  29. Liu, Y. Roberta: A robustly optimized bert pretraining approach. arXiv 2019, arXiv:1907.11692. [Google Scholar]
  30. Yang, Z. XLNet: Generalized Autoregressive Pretraining for Language Understanding. arXiv 2019, arXiv:1906.08237. [Google Scholar]
  31. Raffel, C.; Shazeer, N.; Roberts, A.; Lee, K.; Narang, S.; Matena, M.; Zhou, Y.; Li, W.; Liu, P.J. Exploring the limits of transfer learning with a unified text-to-text transformer. J. Mach. Learn. Res. 2020, 21, 1–67. [Google Scholar]
  32. Xu, L.; Mao, R.; Zhang, C.; Wang, Y.; Zheng, X.; Xue, X.; Xia, F. Deep Transfer Learning Model for Semantic Address Matching. Appl. Sci. 2022, 12, 10110. [Google Scholar] [CrossRef]
  33. Xia, P.; Zhang, L.; Li, F. Learning similarity with cosine similarity ensemble. Inf. Sci. 2015, 307, 39–52. [Google Scholar] [CrossRef]
  34. Zhang, S.; Hu, Y.; Bian, G. Research on string similarity algorithm based on Levenshtein Distance. In Proceedings of the 2017 IEEE 2nd Advanced Information Technology, Electronic and Automation Control Conference, Chongqing, China, 25–26 March 2017; pp. 2247–2251. [Google Scholar]
  35. Costa, E.; Mali, V.S. Tetun Language Plagiarism Detection with Text Mining Approach Using N-gram and Jaccard Similarity Coefficient. Timor-Leste J. Eng. Sci. 2021, 2, 11–20. [Google Scholar]
  36. Jiang, Y.; Ding, X.; Ren, Z. A suffix tree based handwritten Chinese address recognition system. In Proceedings of the Ninth International Conference on Document Analysis and Recognition, Curitiba, Parana, Brazil, 23–26 September 2007; pp. 292–296. [Google Scholar]
  37. Kang, M.; Du, Q.; Wang, M. A new method of Chinese address extraction based on address tree model. Acta Geod. Cartogr. Sin. 2015, 44, 99–107. [Google Scholar]
  38. Ling, G.; Xu, A.; Wang, C.; Wu, J. REBDT: A regular expression boundary-based decision tree model for Chinese logistics address segmentation. Appl. Intell. 2023, 53, 6856–6872. [Google Scholar] [CrossRef]
  39. Comber, S.; Arribas-Bel, D. Machine learning innovations in address matching: A practical comparison of word2vec and CRFs. Trans. GIS 2019, 23, 334–348. [Google Scholar] [CrossRef]
  40. Lee, K.; Claridades, A.R.C.; Lee, J. Improving a street-based geocoding algorithm using machine learning techniques. Appl. Sci. 2020, 10, 5628. [Google Scholar] [CrossRef]
  41. Li, P.; Liu, J.; Luo, A.; Wang, Y.; Zhu, J.; Xu, S. Deep learning method for Chinese multisource point of interest matching. Comput. Environ. Urban Syst. 2022, 96, 101821. [Google Scholar] [CrossRef]
  42. Shan, S.; Li, Z.; Qiang, Y.; Liu, A.; Xu, J.; Chen, Z. DeepAM: Deep semantic address representation for address matching. In Proceedings of the Web and Big Data: Third International Joint Conference, Chengdu, China, 1–3 August 2019; pp. 45–60. [Google Scholar]
  43. Shan, S.; Li, Z.; Yang, Q.; Liu, A.; Zhao, L.; Liu, G.; Chen, Z. Geographical address representation learning for address matching. World Wide Web 2020, 23, 2005–2022. [Google Scholar] [CrossRef]
  44. Zhang, H.; Ren, F.; Li, H.; Yang, R.; Zhang, S.; Du, Q. Recognition method of new address elements in Chinese address matching based on deep learning. ISPRS Int. J. Geo-Inf. 2020, 9, 745. [Google Scholar] [CrossRef]
  45. Gupta, V.; Gupta, M.; Garg, J.; Garg, N. Improvement in semantic address matching using natural language processing. In Proceedings of the 2021 2nd International Conference for Emerging Technology, Belagavi, India, 21–23 May 2021; pp. 1–5. [Google Scholar]
  46. Duarte, A.V.; Oliveira, A.L. Improving Address Matching using Siamese Transformer Networks. In Proceedings of the EPIA Conference on Artificial Intelligence, Faial Island, Portugal, 5–8 September 2023; pp. 413–425. [Google Scholar]
  47. Liu, C.; He, X.; Su, S.; Kang, M. A graph-based method for Chinese address matching. Trans. GIS 2023, 27, 859–876. [Google Scholar] [CrossRef]
  48. Zhang, Z.; Balsebre, P.; Luo, S.; Hai, Z.; Huang, J. StructAM: Enhancing Address Matching through Semantic Understanding of Structure-aware Information. In Proceedings of the 2024 Joint International Conference on Computational Linguistics, Language Resources and Evaluation (LREC-COLING 2024), Torino, Italia, 20–25 May 2024; pp. 15350–15361. [Google Scholar]
  49. Quan, Y.; Chang, Y.; Liang, L.; Qiao, Y.; Wang, C. A Novel Address-Matching Framework Based on Region Proposal. ISPRS Int. J. Geo-Inf. 2024, 13, 138. [Google Scholar] [CrossRef]
  50. ISO 19160–1:2015; Addressing Part 1: Conceptual Model. International Organization for Standardization: Geneva, Switzerland, 2015.
  51. Chen, Q.; Zhu, X.D.; Ling, Z.; Wei, S.; Jiang, H.; Inkpen, D. Enhanced LSTM for Natural Language Inference. In Proceedings of the 55th Annual Meeting of the Association for Computational Linguistics (Volume 1: Long Papers), Vancouver, BC, Canada, 30 July–4 August 2017; pp. 1657–1668. [Google Scholar]
  52. Levenshtein, V. Binary codes capable of correcting deletions, insertions, and reversals. Sov. Phys. Dokl. 1966, 10, 707–710. [Google Scholar]
  53. Jaccard, P. Nouvelles recherches sur la distribution florale. Bull. Soc. Vaud. Sci. Nat. 1908, 44, 223–270. [Google Scholar]
  54. Tata, S.; Patel, J.M. Estimating the selectivity of tf-idf based cosine similarity predicates. ACM Sigmod Rec. 2007, 36, 7–12. [Google Scholar] [CrossRef]
  55. Lilleberg, J.; Zhu, Y.; Zhang, Y. Support vector machines and word2vec for text classification with semantic features. In Proceedings of the 2015 IEEE 14th International Conference on Cognitive Informatics & Cognitive Computing, Beijing, China, 6–8 July 2015; pp. 136–140. [Google Scholar]
  56. Hitesh, M.S.R.; Vaibhav, V.; Kalki, Y.A.; Kamtam, S.H.; Kumari, S. Real-time sentiment analysis of 2019 election tweets using word2vec and random forest model. In Proceedings of the 2019 2nd International Conference on Intelligent Communication and Computational Techniques, Jaipur, India, 28–29 September 2019; pp. 146–151. [Google Scholar]
Figure 1. An address matching method based on multi-semantic feature fusion.
Ijgi 14 00227 g001
Figure 2. Address element word embedding vector generation.
Ijgi 14 00227 g002
Figure 3. Address textual semantic feature extraction based on Text-RCNN.
Ijgi 14 00227 g003
Figure 4. Address matching based on ESIM.
Ijgi 14 00227 g004
Figure 5. Experimental results of hyperparameter tuning.
Ijgi 14 00227 g005
Table 1. Examples of address element resolution in Chinese addresses.
Address 1Address 2
1长寿路成都市科华中路小学
(Changshou Road, Chengdu Kehua Zhonglu Primary School)
长寿路/成都市科华中路小学
(Changshou Road, Chengdu Kehua Zhonglu Primary School)
2四川省成都市武侯区长寿路2号科华中路小学
(No. 2, Changshou Road, Wuhou District, Chengdu City, Sichuan Province, Kehua Zhonglu Primary School)
四川省/成都市/武侯区/长寿路/2号/科华中路小学
(No. 2, Changshou Road, Wuhou District, Chengdu City, Sichuan Province, Kehua Zhonglu Primary School)
3金牛区一环路北二段32号附4号
(No. 32 with No. 4, North Section 2 of First Ring Road, Jinniu District)
金牛区/一环路北二段/32号附4号
(No. 32 with No. 4, North Section 2 of First Ring Road, Jinniu District)
4府通路与春桂路交叉口西100米
(Futong Road, Chungui Road, intersection, 100 m west)
府通路/与/春桂路/交叉口/西100米
(Futong Road, Chungui Road, intersection, 100 m west)
Note: Address 2 shows the result of address element resolution, with each element separated by slashes (“/”).
Table 2. Examples from Chinese address matching sample dataset.
Address 1Address 2Label
1长寿路成都市科华中路小学
(Changshou Road, Chengdu Kehua Zhonglu Primary School)
四川省成都市武侯区长寿路2号科华中路小学
(No. 2, Changshou Road, Wuhou District, Chengdu City, Sichuan Province, Kehua Zhonglu Primary School)
1
2长寿路成都市科华中路小学
(Changshou Road, Chengdu Kehua Zhonglu Primary School)
四川省成都市双流区月星路
(Yuexing Road, Shuangliu District, Chengdu City, Sichuan Province)
0
3青白江区怡湖东路131号附7号
(No. 131 with No. 7, Yihu East Road, Qingbaijiang District)
怡湖东路137正东方向20米大弯派出所旁
(No. 137, Yihu East Road, 20 m east, next to Dawan Police Station)
1
4青白江区怡湖东路131号附7号
No. 131 with No. 7, Yihu East Road, Qingbaijiang District
四川省成都市邛崃市大东街187号
(No. 187, Dadong Street, Qionglai City, Chengdu City, Sichuan Province)
0
Table 3. Confusion matrix.
Actual Match (Positive)Actual Mismatch (Negative)
Predicted Match (Positive)True Positive (TP)False Positive (FP)
Predicted Mismatch (Negative)False Negative (FN)True Negative (TN)
Table 4. Address matching model hyperparameter settings.
HyperparameterDescriptionValue
Hidden SizeNumber of neurons in the hidden layer (LSTM)64
Attention HeadsNumber of attention heads in the multi-head attention mechanism4
Dropout RateProportion of neurons randomly dropped during training0.1
Batch SizeNumber of samples processed in each update of model parameters2048
Size of FiltersSize of the convolutional filters[2, 3, 4]
Learning RateStep size used for updating model parameters during training0.001
Embedding DimensionDimension of word embedding vectors200
EpochsThe total number of passes of the training dataset30
Number of FiltersNumber of convolutional filters100
Sequence LengthLength of the input Chinese address sequences10
Table 5. The results of comparison experiment and ablation experiment.
Experiment TypeMethodPRF1
1Comparison
experiments
Levenshtein Distance100.00%18.35%31.01%
2Jaccard Similarity100.00%15.02%26.12%
3Cosine Similarity (IF-IDF)100.00%14.24%24.93%
4RF (Word2vec)89.24%85.81%87.49%
5SVM (Word2vec)89.52%86.58%88.02%
6Word2Vec + ESIM93.57%94.40%93.98%
7ABLC94.89%94.63%94.76%
8AMGCN + node2vec94.55%95.24%94.89%
9StructAM95.97%94.86%95.41%
10Ablation
experiments
Text-RCNN + ESIM94.80%94.11%94.45%
11GAT + ESIM93.61%93.83%93.72%
12 Text-RCNN + GAT + ESIM95.85%95.83%95.84%
Table 6. F1 values of the compared methods in the transfer experiment.
MethodBeijingShanghaiXi’anGuangzhouWuhan
1RF (Word2vec)49.40%31.97%39.93%49.52%54.96%
2SVM (Word2vec)60.47%63.74%63.56%63.16%63.94%
3Word2Vec + ESIM61.63%65.85%55.46%58.42%68.35%
4ABLC76.73%71.75%82.48%70.40%73.12%
5AMGCN + node2vec70.56%69.57%70.89%68.63%70.05%
6StructAM78.78%79.79%76.96%74.78%77.25%
7Text-RCNN + GAT + ESIM81.34%77.52%84.36%75.22%84.05%
Disclaimer/Publisher’s Note: The statements, opinions and data contained in all publications are solely those of the individual author(s) and contributor(s) and not of MDPI and/or the editor(s). MDPI and/or the editor(s) disclaim responsibility for any injury to people or property resulting from any ideas, methods, instructions or products referred to in the content.

