Article

Revealing Spatiotemporal Urban Activity Patterns: A Machine Learning Study Using Google Popular Times

by
Mikel Barrena-Herrán
*,
Itziar Modrego-Monforte
and
Olatz Grijalba
CAVIAR (Quality of Life in Architecture) Research Group, Department of Architecture, University of the Basque Country UPV/EHU, Plaza Oñati 2, 20018 Donostia-San Sebastián, Spain
*
Author to whom correspondence should be addressed.
ISPRS Int. J. Geo-Inf. 2025, 14(6), 221; https://doi.org/10.3390/ijgi14060221
Submission received: 20 March 2025 / Revised: 9 May 2025 / Accepted: 29 May 2025 / Published: 3 June 2025

Abstract

:
Extensive scientific evidence underscores the importance of identifying spatiotemporal patterns for investigating urban dynamics. The recent proliferation of location-based social networks (LBSNs) facilitates the measurement of urban rhythms through geotemporal information, providing deeper insights into the underlying causes of urban vibrancy. This study presents a methodology for analyzing the spatiotemporal use of cities and identifying occupancy patterns taking into consideration urban form and function. The analysis relies on data obtained from Google Popular Times (GPT), transforming the relative occupancy of a large number of points of interest (POI) classified into five categories, for estimating the number of people aggregated within urban nodes during a typical day. As a result, this research assesses the utility of this data source for evaluating the changing dynamics of a city across both space and time. The methodology employs geographic information system (GIS) tools and artificial intelligence techniques. The results demonstrate that by analyzing geotemporal data, we can classify urban nodes according to their hourly activity patterns. These patterns, in turn, relate to city form and urban activities, showing a certain spatial concentration. This research contributes to the growing body of knowledge on machine learning (ML) methods for spatiotemporal modeling, laying the groundwork for future studies that can further explore the complexity of urban phenomena.

1. Introduction

1.1. General Overview

The relationship between the spatial characteristics of a city and human behavior has been studied for many decades. Traditionally, the scientific approach has been sectoral: morphological or urban studies have been conducted within the more technical or architectural fields, while analyses of human behavior and dynamics traditionally originated from humanistic perspectives such as sociology and psychology. However, the continuous advancement of geographic information system (GIS) tools, the proliferation of geolocated data, and emerging artificial intelligence (AI) techniques are opening up a new field of research.
In this context, location-based social networks (LBSNs) provide information about human activity within geo-referenced digital environments. Specifically, Google Popular Times (GPT), whose spatiotemporal data are openly accessible in real time and available globally, offers extensive geolocated data from points of interest (POI) that capture the occupancy levels of establishments and public spaces. However, while the use of this source in urban studies has seen considerable progress, significant methodological advancements are still required to ensure that the results are both representative and valid for strategic urban design.
In this regard, machine learning (ML) emerges as an indispensable tool. It develops algorithms and statistical models that allow computer systems to learn from and process large volumes of data, enabling a more comprehensive understanding of human activity patterns.
Therefore, new techniques associated with the proliferation of LBSNs, combined with the enhanced capabilities of AI in big data analysis, are driving significant advancements in the methodological development of spatiotemporal analysis of urban life. These new methods will foster a deeper understanding of urban dynamics and facilitate more informed decision making in urban planning.
This paper introduces an innovative methodology for the spatiotemporal analysis of occupancy patterns, integrating the unique urban form and the various activities that unfold within fine-grained urban units of analysis. By employing this approach, we can identify urban rhythms throughout time periods for each urban node, allowing us to evaluate the dynamics of areas with varying levels of urban vibrancy and ultimately inform strategic urban planning decisions. The methodology is applied to the case study of Donostia-San Sebastián.

1.2. Literature Review

The study of human daily activity routines through space and time in urban settings began in the late 1960s, leading to the development of a new field of research: time geography. This made it possible to analyze human behavioral patterns integrating both spatial and temporal dimensions though spatiotemporal prisms [1]. Other classical approaches in sociology and human geography, such as time-use surveys and spatiotemporal diaries, allowed urban planners in the 1970s to better understand the functioning of cities and reveal socio-spatial dynamics by introducing the variable of time. As such, the urban fabric is understood as a context for behavior [2] influencing large-scale time organization and the rhythms of human activity in everyday life [3]. In this context, the Theory of Natural Movement and Space Syntax further emphasizes how the configuration of the urban grid privileges certain spaces for through movement [4], thereby shaping these socio-spatial dynamics and reinforcing the rhythms of daily activity. Cities are thus composed of multiple timeframes and fluid temporalities of events [5].
From an ecological perspective, characterizing the daily flows of different communities within a city’s spatial structure [6,7] led to the conclusion that similar urban contexts often share temporal regularities [8]. For instance, Goodchild’s spatiotemporal analyses, combining social data and cartography, showed that the primary organizing dimension of urban space is the relationship between residence and work [9], while socio-economic status is also a critical variable, influencing the time spent on various activities [10].
Additionally, activity censuses in large cities demonstrate rhythms of social behavior [11], akin to the “mechanical periods” of social life, shaped not only by the urban context but also by shared work schedules, habits, and traditions that create a rhythm and sense of place. Routine human activities often take place in proximate, small spaces and are linked to short periods of time [12]. Consequently, the relevance of a place is tied to its temporal rhythm, and vice versa; certain rhythms tend to spatialize [13].
Over the last decade, a new paradigm has emerged in which urban rhythm data are linked to locations rather than individuals [14], highlighting a significant association between built environment factors and urban vibrancy [15]. This makes it possible to identify the movement, meeting, and resting patterns of people in cities, giving each place a distinctive, inherently rhythmic character [16]. For instance, by combining Jane Jacobs’ parameters of urban vitality [17] with observations of pedestrian flows at urban intersections, polyrhythms—patterns created by routines, social interactions, and transport systems—can be detected [18]. Thus, each activity chronotype [19] establishes a temporal connection between spatially separated places [20].
In this context, numerous studies have analyzed cities from this spatiotemporal dimension, linking the characteristics of the built environment to the dynamics generated within it. For instance, lifestyle changes brought about by globalization and increased time use demands [21] manifest as extreme urban vitality and socio-cultural identity in 24/7 city centers. These environments extend beyond traditional working hours, revealing multiple divisions in visitation intensity and activities [22], leading to both spatial and temporal segregation [23]. This lack of inclusivity stems from the limited variety of services that meet the needs of different social groups [24]. Additionally, the rise in the nighttime economy transforms cities into spaces of standardized consumption, attracting homogeneous groups of consumers, tourists, and entrepreneurs [25], which results in challenges for residents as gentrification and the exclusion of certain social groups [26]. In response, urban strategies are emerging that seek to integrate and manage the daytime, evening, and nighttime economies based on customer experience and perception in city centers [27].
Moreover, the exposure of people to heterogeneous social contexts depends on their individual characteristics and the activity spaces they frequent [28]. Observing these spaces helps identify behavioral patterns, the physical characteristics of streets that encourage stationary and persistent activities [29], as neighborhood character and dynamics are shaped by urban form [30], and activity distributions that reflect socio-spatial characteristics [31]. Even in the most intimate spaces, like streets and squares, there is a diversity and fluidity in the encounters and movements that constitute the urban fabric [32].
Urban dynamics, as evidenced through levels of activity, commercial availability, and household contributions to the economy, shape both public life and the socio-spatial organization of cities [33]. The scale and size also play a crucial role, as patterns of socialization differ by urban density, with stronger connections in compact cities, due to physical and design factors like public spaces, building typologies, and visual spaciousness [34]. The qualitative experience of urban environments can thus be described through temporal, spatial, visual, and connectivity metrics of urban form [35].
With the advancement of information technologies and the increasing spatiotemporal resolution of data, integrating space and time into GIS environments presents a challenge, especially when trying to visualize a city’s multi-functionality [36]. Interestingly, these technologies have altered the timing and location of activities [37], reshaping socio-economic patterns in urban areas. Computational improvements and GIS advancements [38] have played a crucial role in transport planning [39] and have revived the study of socio-urban dynamics [40].
Recent research on urban dynamics has increasingly adopted spatiotemporal perspectives and big data sources, reflecting a growing interest in understanding the complexity of city life through digital traces [41], where ML enhances spatial analysis by identifying complex patterns, integrating diverse data sources, and adapting dynamically to urban challenges.
A wide variety of data sources have been explored, including mobile phone records [42,43,44,45], social media content [46,47,48,49], transit smart card data [50,51], bike sharing systems [52,53,54], taxi GPS trajectories [55,56,57], and financial transactions [58]. These studies address diverse thematic angles—such as urban vibrancy [15,53,59], functional land use and POIs detection [46,47,48,60], commuting and mobility patterns [50,51,61], congestion analysis [55,56], and resilience to disruptions [62]—demonstrating the richness and potential of spatiotemporal urban research.
In terms of analytical techniques, recent contributions showcase an evolving methodological landscape. Clustering methods remain central, with k-means frequently used to uncover land use patterns or mobility dynamics [48,51,53,57], while other studies adopt more sophisticated approaches such as Dynamic Time Warping (DTW) combined with k-medoids to delineate functional zones based on building-level social media activity [46], or hierarchical DTW to identify cyclical behavioral patterns in bicycle usage [52]. Modified DBSCAN and fuzzy clustering algorithms have been employed to detect commuting flows and congestion dynamics with greater temporal nuance [50,54,55]. Neural networks have also been integrated for hourly population density estimation [48] and vitality area classification [59], while gravity-based models [42] and spatiotemporal flow clustering strategies [61] have emerged to capture interaction intensities and mobility trends.
Beyond technique, the thematic focus on urban rhythms is particularly relevant. Multiple studies examine intra-urban variations in activity intensity, temporality, and function—highlighting the co-dependence between land use, mobility, and built environment structures [15,59,60,63]. Others explore the resilience of urban systems under external shocks, such as extreme weather, by leveraging temporally rich datasets like GPT to detect shifts in daily routines [62].
Despite these advances, important gaps remain. First, few studies rely on publicly accessible and globally consistent datasets, such as GPT, which offer scalable and replicable insights into human activity while avoiding many privacy issues inherent to mobile or financial data. Second, while advanced clustering and modeling techniques are widespread, there is a lack of methodological standardization, which hinders comparative analysis across cities or regions. Third, relatively few contributions offer integrated spatial and temporal granularity, which is essential to understand the fine-scale rhythms of urban life, particularly at the intra-neighborhood level.
In this context, the present study contributes a replicable and lightweight methodology that leverages GPT and unsupervised ML techniques to classify occupancy patterns across urban space and time. By focusing on functional urban rhythms and their spatial manifestation, it addresses both the methodological fragmentation and data accessibility limitations identified in prior work.

2. Materials and Methods

2.1. Study Area

In pursuit of applying the methodology to a local context, the selected case study for validating the method is the municipality of Donostia-San Sebastián (Figure 1), a coastal city in northern Spain.
The city originated as a walled medieval settlement, and its growth over time extended across the wetlands of the Urumea River and along the coastal edge. Today, it presents a clear morphological stratification: the historical medieval core, the 19th-century and postmodern urban expansions that characterize the lowland districts, and more recent peripheral neighborhoods and suburbs located on surrounding hillsides and sloped terrain.
Despite the city’s moderate size—174,529 inhabitants within the urban area [64]—its high population density of 13,073 inhabitants/km2 exhibits a “Mediterranean” lifestyle. This, along with its functional characteristics, reflects sociospatial dynamics where balancing work and life can be challenging [65].
As of 2022, in the Basque Country, 99% of individuals aged 16 to 74 regularly use smartphones [66]. Additionally, 56.5% of internet users engage with social networks, and 55.2% of companies use social networks for business purposes [67]. This widespread adoption supports the potential of LBSNs for urban studies in this context.
Street-level urban uses in Donostia-San Sebastián consist of a variety of activities with differing operating hours throughout the day [68]. The majority of these businesses include retail, hospitality, and auxiliary professional services, followed by public services. This commercial diversity is highly concentrated in the denser neighborhoods located in the flatter areas of the city, making it a prime area for studying urban dynamics.

2.2. Methodology

To address this study’s objective of identifying and classifying functional urban rhythms, a combination of temporal, spatial, and morphological dimensions was required. The first step involved aggregating POIs within a morphological grid that captures the physical structure of the city. Unlike conventional administrative boundaries, the use of morphologically homogeneous units allows for a more consistent comparison of activity across urban space, aligning with previous research that emphasizes the importance of the built environment in shaping behavior. Moreover, weighting each unit by the legal capacity of its POIs enables the identification of areas not simply by the count of establishments, but by their potential intensity of use.
For temporal clustering, we selected the k-shape algorithm, which is specifically designed for normalized time series. Unlike classical clustering techniques such as k-means, k-shape accounts for both the shape and alignment of temporal patterns, making it particularly suitable for capturing characteristic activity profiles while being robust to differences in amplitude. This was crucial to distinguish usage patterns that follow similar rhythms even if their absolute magnitudes differ. This type of unsupervised ML is particularly useful in revealing latent spatiotemporal patterns that are not easily captured by conventional GIS or statistical techniques, allowing for a more nuanced and data-driven classification of urban activity profiles.
Finally, heatmaps were used to explore the spatial distribution of the resulting clusters. This spatial smoothing technique highlights concentrations and dispersions of activity types across the city, offering an intuitive visualization of functional zones and their morphological context. This integrative approach supports both analytical rigor and spatial interpretability, laying the groundwork for linking usage patterns to planning considerations.
Figure 2 illustrates the five stages in which the methodology is structured: (a) collection of raw data and processing, (b) definition of the unit of analysis, (c) aggregation of capacity-weighted POIs occupancy rates, (d) application of time series clustering techniques, and (e) spatial analysis of the occupancy trends.
This approach integrated two types of spatial data: (1) an LBSN, (2) the administrative registry of urban real estate.
Regarding LBSNs, Google Places is currently one of the most comprehensive global databases for urban studies, offering valuable insights into land use attributes and urban dynamics. However, Google Places lacks temporal data, as POIs are static in nature. The introduction of GPT has significantly changed this scenario. GPT calculates occupancy patterns by analyzing visit data, aggregated and anonymized, collected over the previous four to six weeks. The peak hour is used as the reference, with other estimates displayed in relation to this peak [69]. GPT has thus become an increasingly popular tool in research related to urban dynamics.
(a)
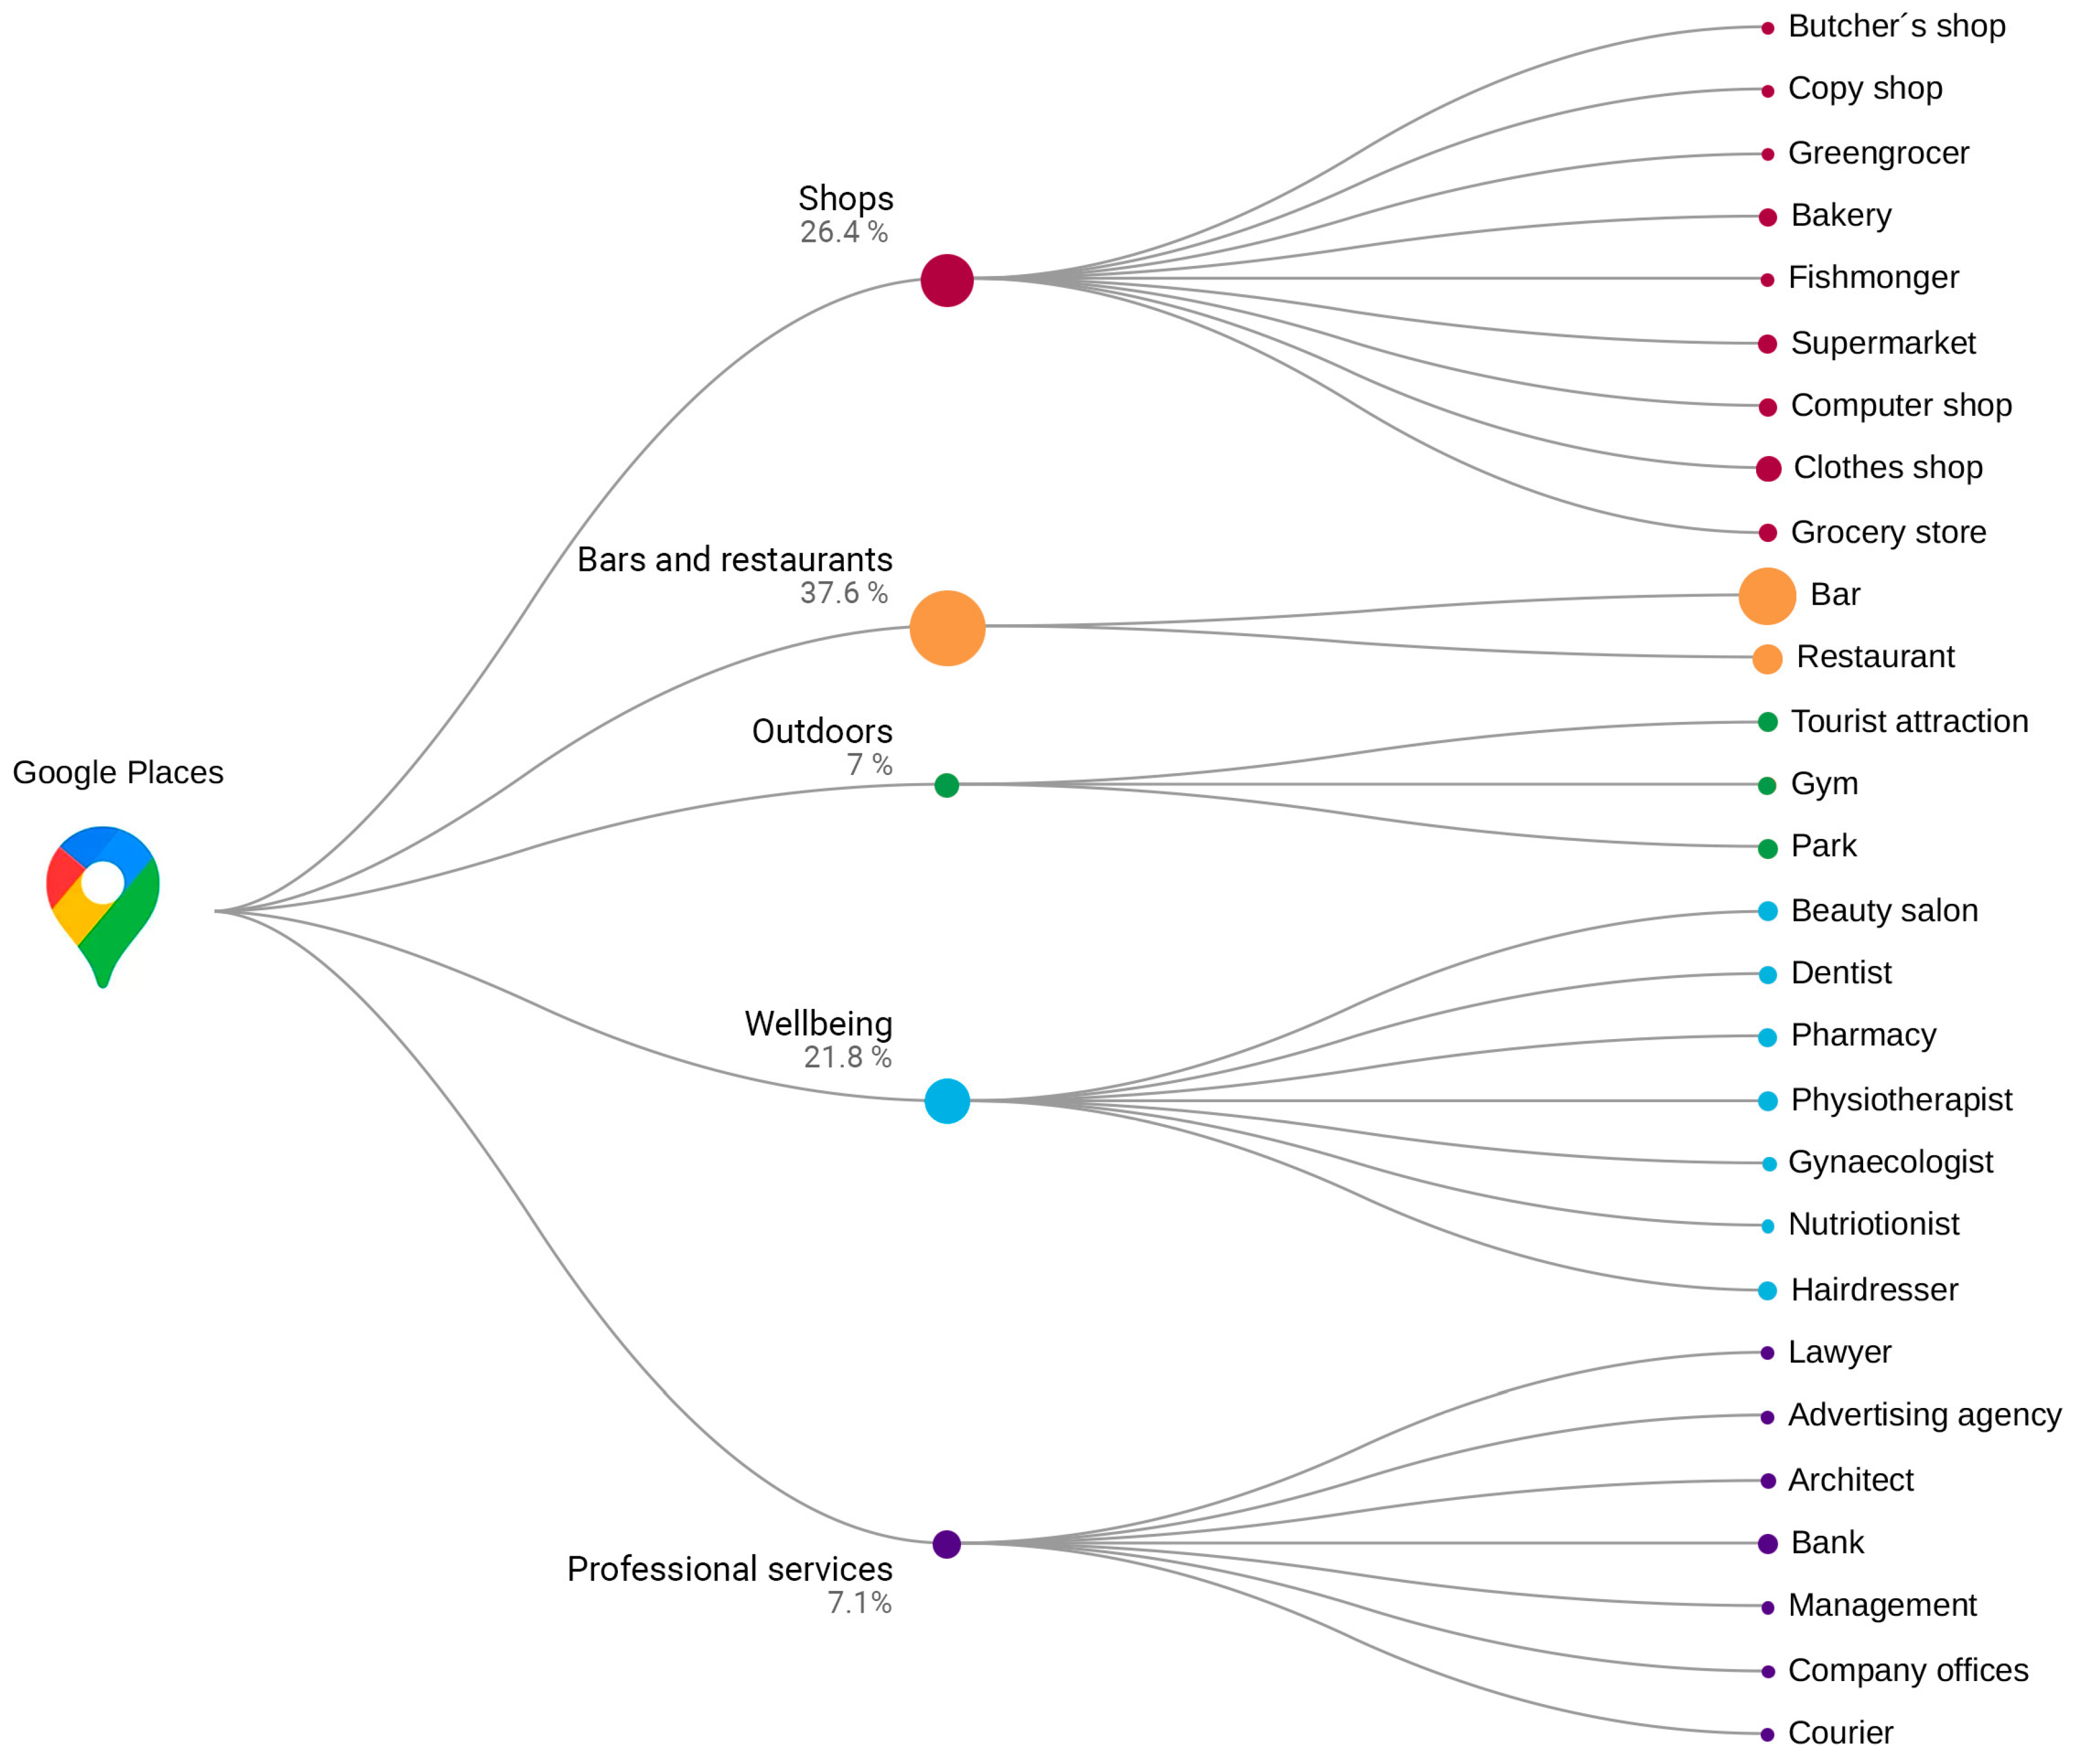
Collection and Processing of Cartographic and GPT Data
To collect and process the necessary POIs attributes, we employed the crawler-google-places tool available on GitHub, using commit 12c124f [70]. Data extraction was conducted via an unofficial API, which automated the retrieval of POIs attributes by entering links obtained through a combination of selected Google Places categories and desired geographic locations. The dataset includes a variety of fields related to each POI, whose key attributes of interest —obtained after a series of preprocessing steps to organize the data into the corresponding fields—are:
-
Popular times: Hourly average occupancy as a percentage relative to the peak occupancy.
-
Category: The main category declared by the owner on Google My Business.
-
Geolocation: Geographical coordinates.
-
Address: Street name and door number.
For this study, data were collected from 1378 POIs located in Donostia-San Sebastián on a Friday during April and May 2022, allowing us to capture both routine and leisure-driven urban dynamics within a single day
Figure 3 shows a branched diagram that categorizes the searches carried out using Google Places, grouped into five main classes. This classification—bars and restaurants, shops, wellbeing, professional services, and outdoors—was defined to synthesize the multitude of highly specific categories provided by Google Places into broader functional groups, allowing for a more coherent and interpretable analysis of urban activity. The diagram also displays the number of POIs within each class and their percentage relative to the total.
Additionally, we collected the cadastral database for urban properties in the municipality [71], which uniquely identifies each property and provides detailed urban characteristics, including address, built-up area, and the intended use of each property.
After both datasets were prepared, they were linked through their standardized addresses to associate the cadastral floor area with the POIs data. In cases where no direct match existed between the two datasets, the POIs were assigned the average floor area of its respective sub-category to ensure consistency in the analysis and avoid missing values that could impact the interpretation of spatial distribution patterns.
To estimate the number of people occupying each POI, we referenced the Spanish Technical Building Code (CTE), particularly the Basic Document on Fire Safety (CTE DB SI). This regulation defines the maximum occupancy density for different property types, measured in square meters per person. Using this standard, each POI is assigned a maximum occupancy value (capacity), which serves as a weighting factor. This allows us to transform the relative GPT occupancy values into an absolute number of estimated people per hour.
(b)
Unit of Analysis: the Morphological Grid
The unit of analysis for this research, the elaboration steps for which are shown in Figure 4, is based on a grid system adapted to the city’s urban morphology. This irregular grid was generated using Voronoi polygons originating from street intersections, which are the strategic points of connection and decision for people in motion [72]. Thus, such clear visual joints provide a fine-grained delimitation of functional nodes, maintaining relative spatial homogeneity rather than relying on a delimitation based on urban blocks, which would consider only a single facade for each street they encompass.
(c)
Weighted Occupancy Calculation
The POIs are spatially linked to the corresponding cells within the morphological grid. As multiple POIs may coexist within a single cell, their weighted contribution to the hourly occupancy calculation is determined by their relative capacity in proportion to the total capacity of all POIs within that cell. To estimate the capacity of each POI, a category-dependent occupancy density ratio (Table 1) was applied to its cadastral floor area.
P j = i = 1 n A i δ c , i
  • P = capacity (maximum number of people);
  • A = floor area (m2);
  • δ = density (m2/person);
  • j = cell;
  • i = POIs;
  • c = category.
Table 1. Ratio of the number of occupants to the floor area of a habitable unit. Source: Código Técnico de la Edificación. Documento Básico Seguridad en caso de Incendio (CTE DB SI). Own elaboration.
Intended Use According to CTEOccupation
(m2/Person)
POI Category
Administrative10Lawyer
Advertising agency
Architect
Bank
Management
Company offices
Commercial2Butcher’s shop
Beauty salon
Clothes shop
Grocery
Bakery
Hairdresser
Fishmongers
Pharmacy
Greengrocer’s
3Copy shop
Courier service
Computer shop
5Supermarket
Public1Bars
0.5Pub
Dance club
Disco club
1.5Restaurant
5Gym
10Square
Tourist attraction
25 1Park
Hospital10Dentist
Nutritionist
15Gynaecologist
Physiotherapist
1 According to urban standards for open spaces (parks) in a medium fabric at neighborhood-city scale.
Subsequently, the hourly calculation of weighted occupancy was determined by combining the relative weight of each POI within the cell and its corresponding occupancy value from GPT. For each cell and hourly interval, it was calculated as follows:
O t , j = i = 1 n P i P j G P T t , i
  • O = weighted occupancy rate (%);
  • P = capacity (number of people);
  • GPT = relative occupancy data of Google Popular Times (%);
  • j = cell;
  • i = POIs;
  • t = time interval (h).
From these calculations, weighted time series were constructed and normalized to standardize the occupancy patterns by adjusting the maximum value of each time series in each cell to a scale of 100.
(d)
Urban Cell Time Series Clustering and Occupancy Pattern Definition
An ML algorithm was employed to identify occupancy patterns or trends throughout the day in each cell. Once the unique behaviors of each cell were defined, the cells were grouped into clusters based on similar occupancy patterns. This classification, using clustering techniques, is independent of the urban hierarchy of each cell, as it analyzes only the normalized, weighted occupancy percentage, rather than the total number of people. Each cluster, therefore, represents a distinct pattern or trend.
In this case, the time series classification followed an unsupervised learning process, meaning the underlying nature of the data is unknown prior to analysis. Clusters were defined based on the similarity and distance between data points.
For this study, the tslearn package, a Python (v3.11.1) ML library designed for time series analysis, was used. Specifically, the k-shape method for time series clustering [73] creates homogeneous and well-separated clusters, using a normalized version of the cross-correlation measure in order to consider the shapes of time series while comparing them.
Furthermore, two techniques were employed to determine the optimal number of clusters:
-
The elbow method, which identifies the point at which the variance within clusters stabilizes. This is based on the average distance of each centroid to all observations in its cluster.
-
The silhouette score, which is maximized to identify the optimal number of clusters for the dataset. This score measures the distance between clusters and assesses how closely each observation in a cluster is to the nearest neighboring cluster.
The designed algorithm was then applied to the weighted and normalized hourly occupancy dataset. This process generated a label that identifies the temporal cluster to which each cell belongs.
(e)
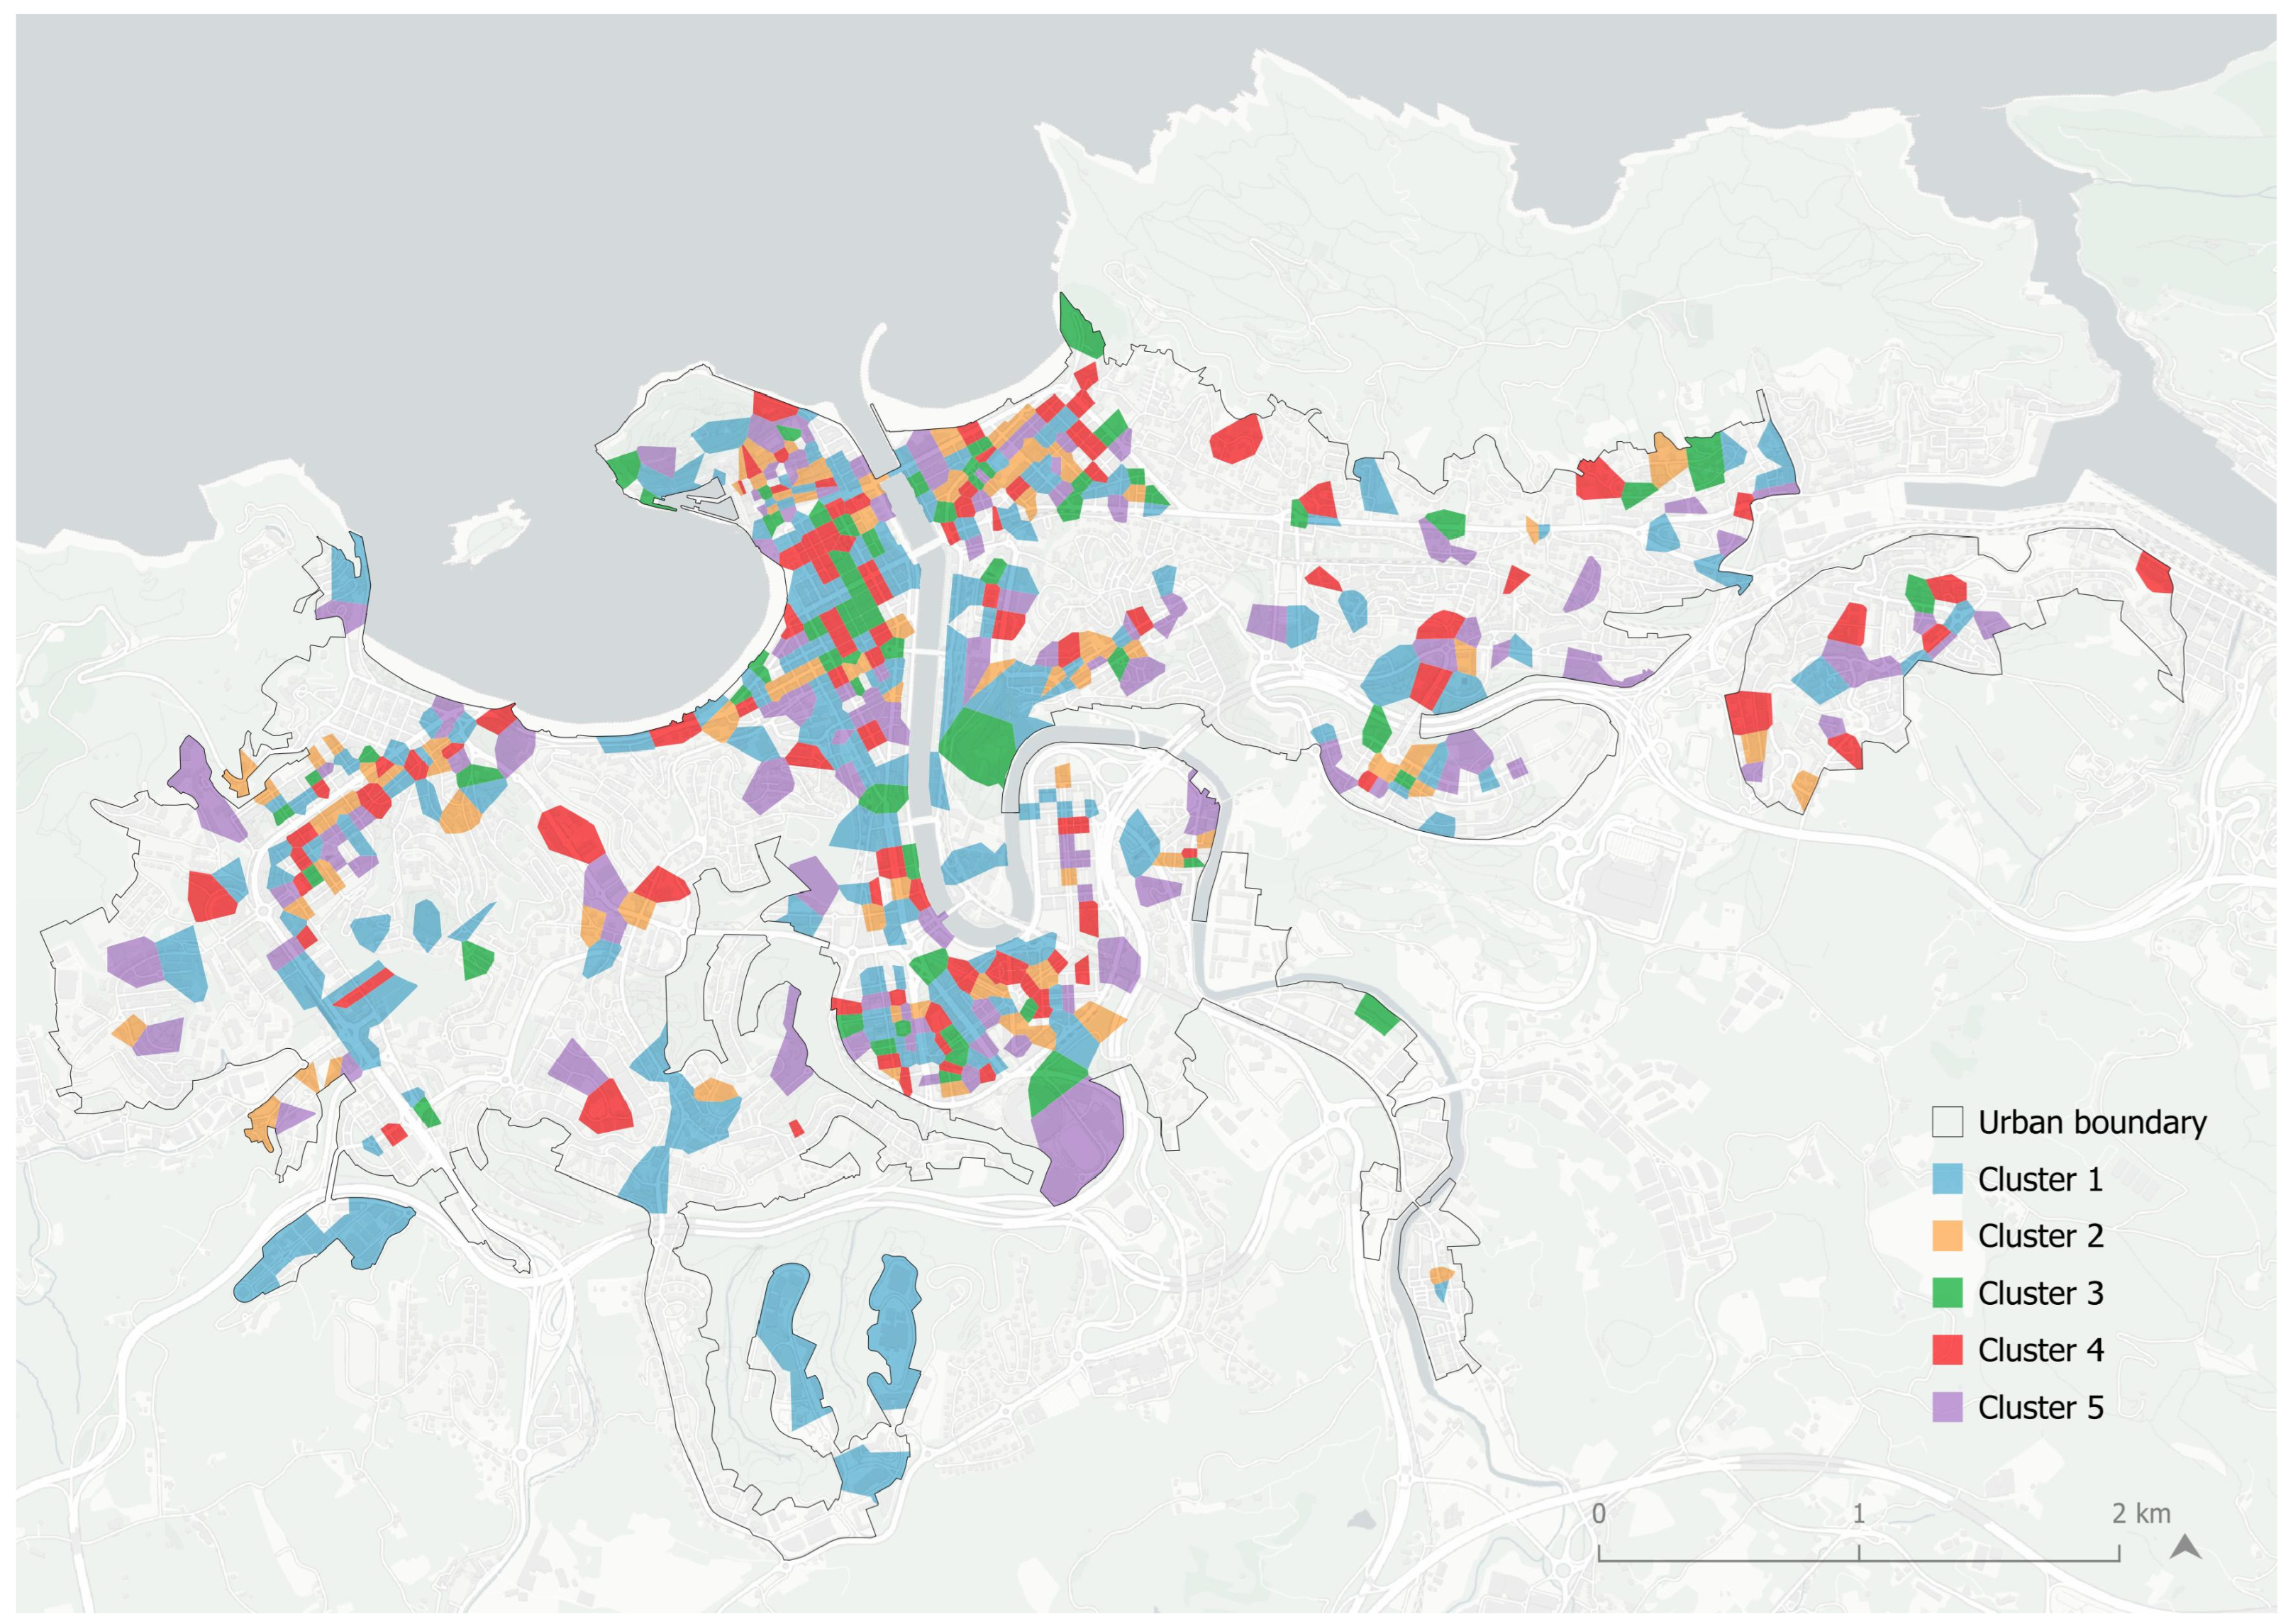
Spatial Analysis of Spatiotemporal Clusters
Finally, the spatial analysis was conducted using a combination of Nearest Neighbor Analysis (NNA) and Kernel Density Estimation (KDE) to investigate the spatial distribution and density patterns of the study area.
The observed mean nearest neighbor distance for each spatiotemporal cluster pattern was calculated to determine the degree of clustering or dispersion, providing initial insights into the spatial structure.
This observed mean distance was then used as the bandwidth in KDE, ensuring that the density estimation reflected the underlying spatial pattern identified by NNA. Additionally, a weighting factor representing the capacity of each cell was applied in KDE to emphasize significant areas.
This approach combined the strengths of NNA and KDE, ensuring the density estimation accurately reflected the spatial structure identified by NNA while highlighting areas of importance through capacity-based weighting.

3. Results

The application of the described methodology to the case study enables the analysis of the spatial distribution of each spatiotemporal cluster type, as well as a representation of the rhythms of these occupancy trends reflecting the urban flows and dynamics on the selected study day. This makes it possible to determine the relationship between these trends and the structure and urban form of the studied case

3.1. Spatial Distribution and Temporal Occupancy Patterns of POIs Categories

Figure 5 illustrates the spatial heterogeneity of the POIs within the municipality of Donostia-San Sebastián. Although bars and restaurants (518), shops (364), and wellbeing (301) venues are distributed across all neighborhoods in a capillary manner, their capacities vary considerably. Bars and restaurants are particularly concentrated in the Parte Vieja, the medieval core characterized by narrow streets and party wall buildings with small ground-floor premises. In contrast, wellbeing and shopping POIs are more prominent along the city’s main axes and central squares, with retail activity especially concentrated in the dense central area that corresponds to the city’s flat terrain. Professional services (98) are almost exclusively located in the Centro district, within the orthogonal grid of the 19th-century urban extension, whereas outdoor-related POIs (97) show a more homogeneous distribution across the entire urban fabric.
The overlay analysis of all POIs layers reveals a clear differentiation between the lower, central parts of the city and the more peripheral, hillside neighborhoods. Of note is the low density of POIs in the eastern areas of the city—Altza, Intxaurrondo, and Bidebieta—despite their high population density.
This results in a hierarchical spatial organization of urban capacity, both in quantitative and locational terms. The Parte Vieja emerges as the most prominent area in terms of the potential for human concentration, followed by Gros, Centro, and Amara—likely due to the dense clustering of POIs in these zones. Other smaller sub-centers are identifiable in districts adjacent to the center, such as Egia, Amara, and Antiguo. In contrast, upper peripheral neighborhoods such as Bidebieta, Altza, and Intxaurrondo exhibit significantly lower POIs concentrations and, consequently, lower capacities for accommodating activity.
Figure 6 illustrates the overall daily activity of the city, split into general and specific categories, showing the total number of people per hour. In general, most categories exhibit two peaks during the busiest times of the day—both in the morning and afternoon—with a moderate decrease in intensity during midday, although this period varies slightly between categories. Overall, the activity spans from 8 a.m. to 11 p.m. The categories driving morning activity are mainly commerce, professional services, and wellbeing. Afternoon activity increases in a staggered fashion, starting with outdoor activities, followed by shopping, and concluding with bars and restaurants. However, when examining the detailed breakdown by category, variations in these time slots can be observed.

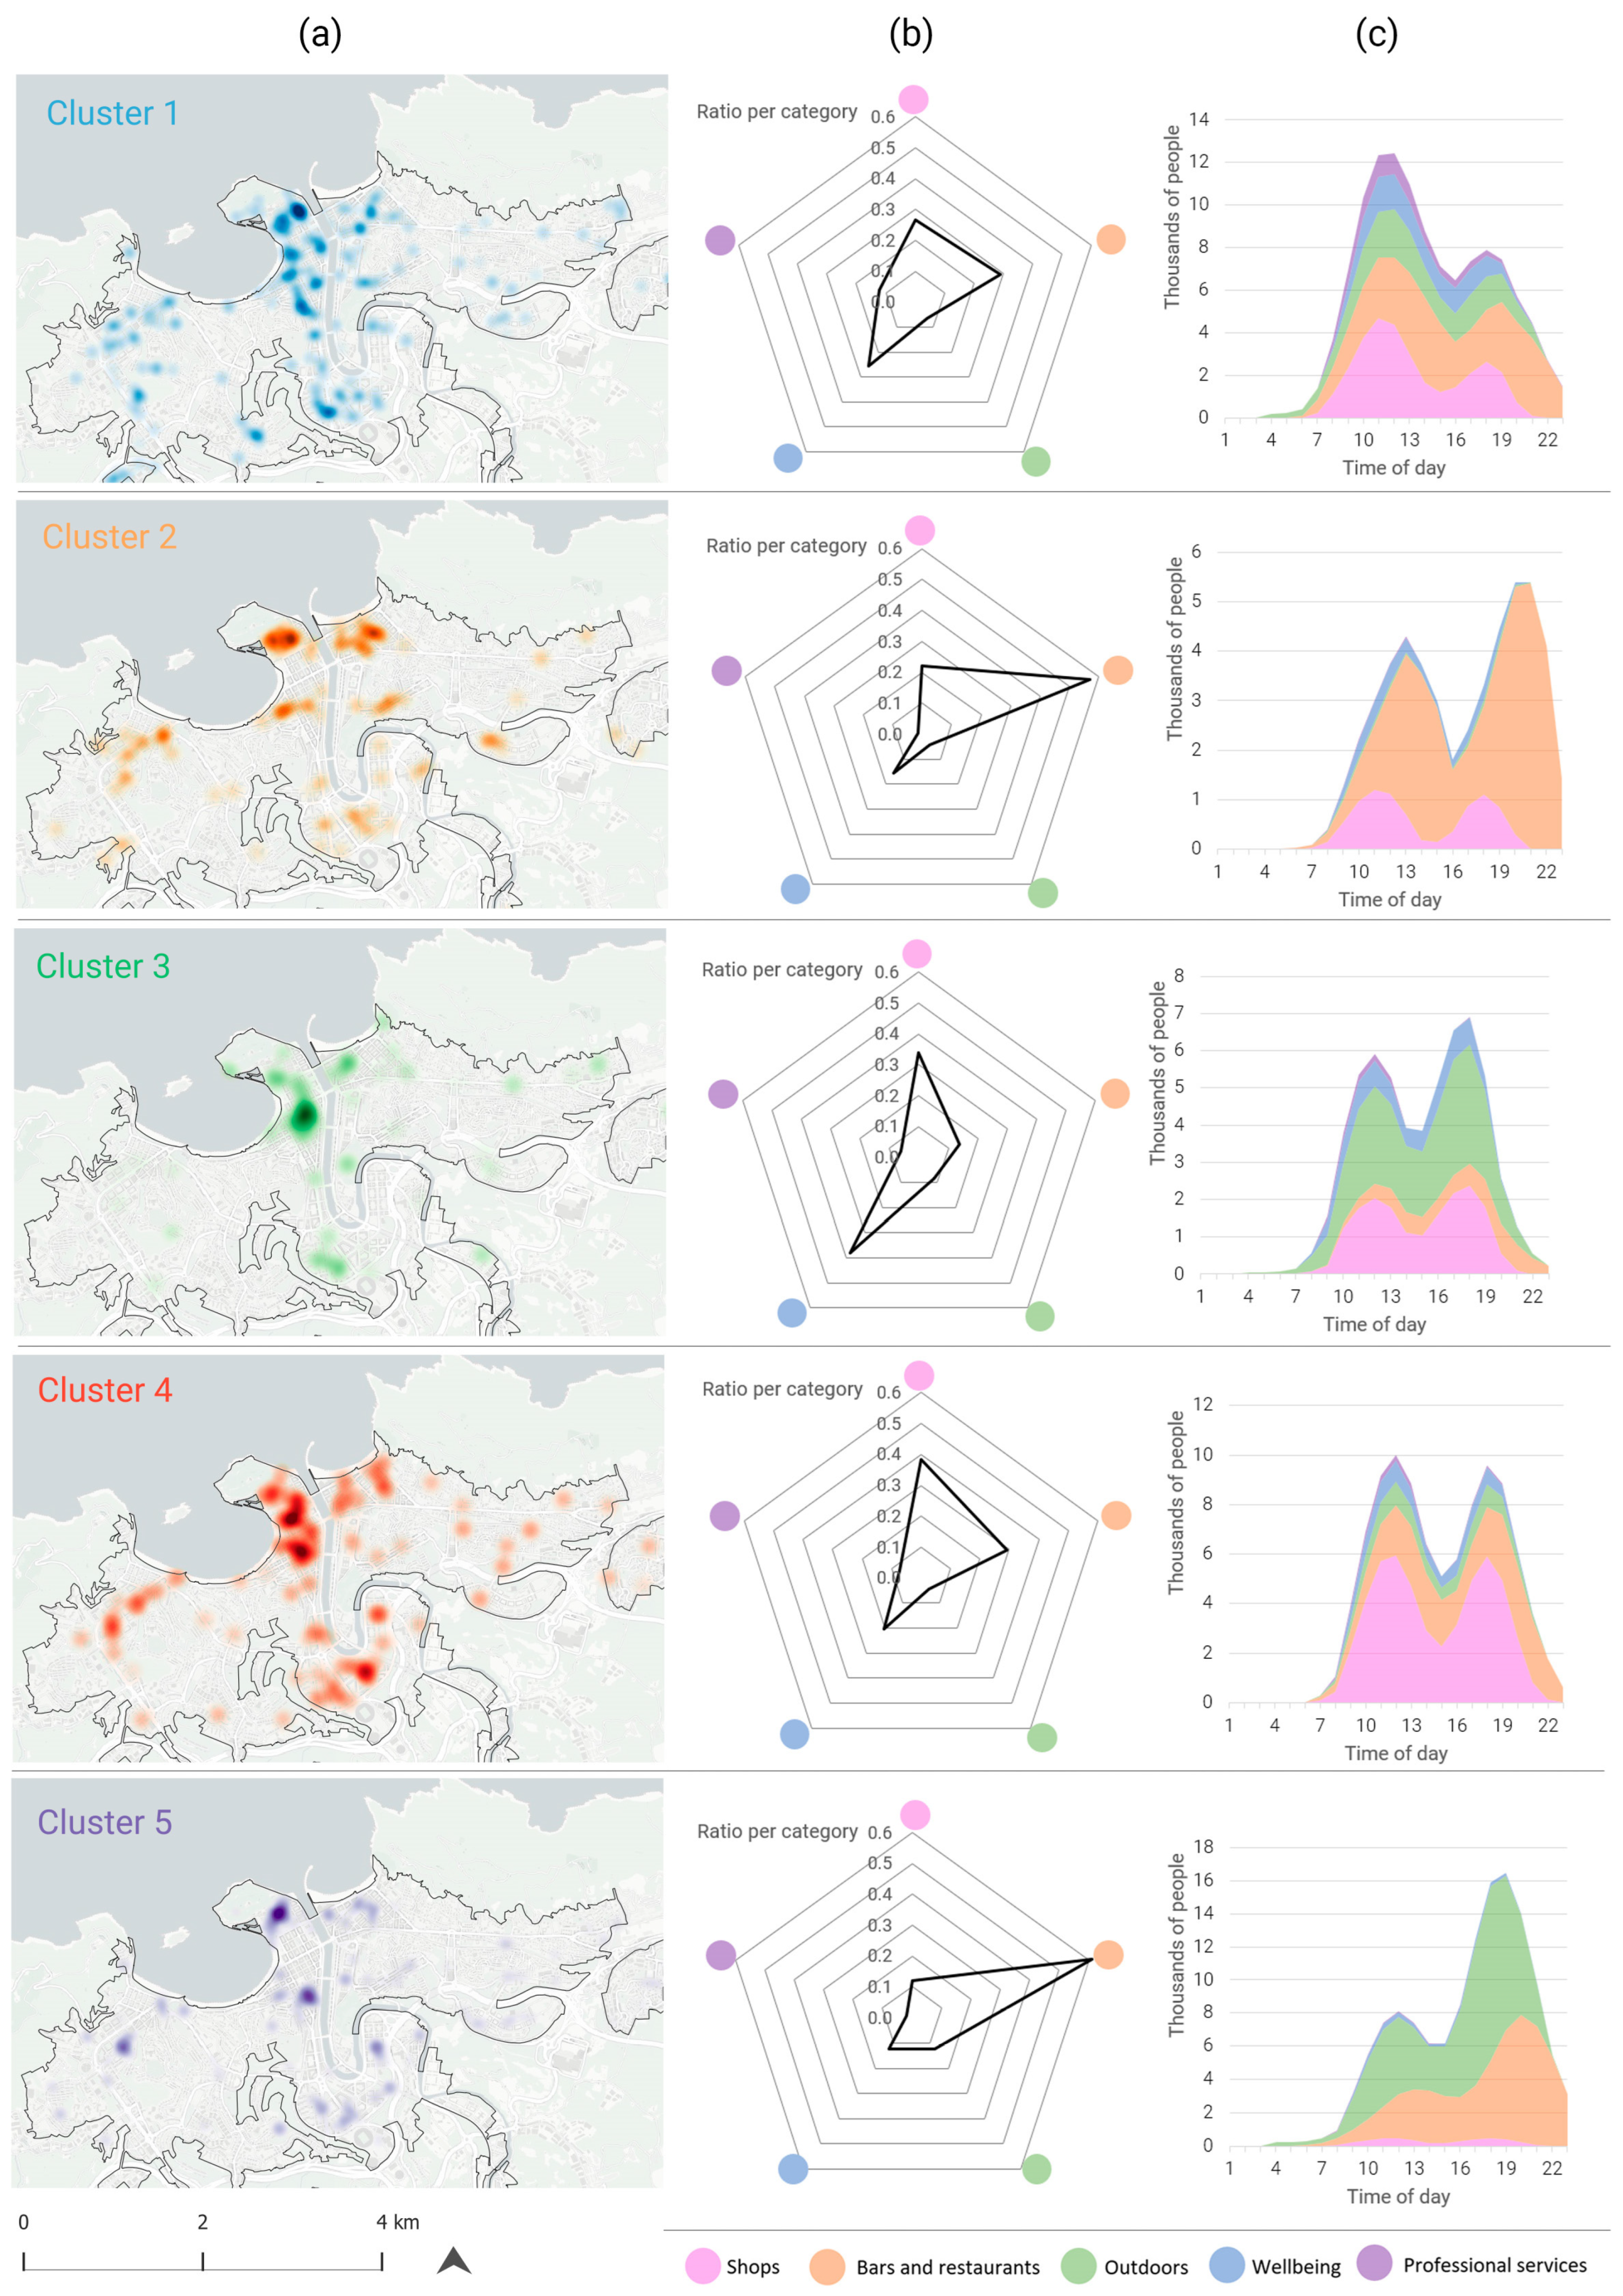
3.2. Description of Spatiotemporal Clusters

As described in the Section 2.2, after the POIs capacities were estimated and aggregated into their corresponding cells, the hourly weighted occupancy percentages for each cell were calculated. These time series were normalized to allow for a more consistent analysis of occupancy patterns. Based on these, we grouped similar time series to classify spatiotemporal patterns into clusters.
To determine the optimal number of clusters for our dataset, we initially applied the elbow method. We identified the point at which the reduction in variance between cluster numbers diminished, determining this “elbow point” to be five clusters, ensuring that we avoided overfitting. Moreover, the silhouette score exhibited a local maximum at five, further corroborating the optimal choice.
Figure 7 shows graphs for each cluster with an averaged time series and a shaded uncertainty interval (standard deviation), while Table 2 provides the number and percentage of POIs linked to each cluster, split by category.

3.2.1. Temporal Analysis

Each cluster is analyzed based on these data, with both a qualitative description of the trend for each pattern and a quantitative assessment of the predominance of each category in each case.
-
Cluster 1 (C1)
C1 is the most represented, accounting for one-third of the total cells in the city and covering 475 POIs. There is a balanced distribution across different categories, with none significantly outweighing the others. This cluster shows a marked increase in activity, starting earlier than the other clusters and reaching a maximum occupancy rate of 78.3%. After midday, activity declines and remains stable throughout the afternoon, with a gradual decrease toward the evening.
The temporal distribution is the most homogeneous among all the clusters, with the contribution of the people associated with the categories being fairly balanced, although commerce leads the morning activity while during the night period only the concentration of people in bars is maintained.
-
Cluster 2 (C2)
C2 includes 218 POIs. Activity grows gradually throughout the morning, peaking later than in the other clusters (around 1 p.m.). A notable spike occurs in the early afternoon (4 p.m.), intensifying during the later part of the day and reaching an occupancy rate of 71.2%. This high level of activity continues until the evening. Bars and restaurants dominate this cluster (57%), although shops (22%) are also active during the morning and midday hours.
In this case, the abundance of pubs associated with this cluster determines the hourly behavior as can be seen due to the similarity between this cluster and the one corresponding to this category in Figure 6.
-
Cluster 3 (C3)
C3 is the least represented, covering one-tenth of the sample. Activity increases sharply early in the morning, stabilizing around midday. The trend is steadier, with less of a midday drop. However, from a peak in the evening at 6 p.m., when occupancy reaches 84.3%, there is a sharp decline toward the night. The dominant activities in this cluster are commercial and wellbeing related, accounting for 72% of the total.
In this case, despite the low number of outdoors cells, there is a large number of people in this cluster due to their size. It should be noted that the category of bars is of little relevance. In this case, the low capacity of the wellbeing establishments becomes apparent, as their high proportion of POIs is not reflected in the number of people.
-
Cluster 4 (C4)
This cluster represents the typical pattern of symmetrical peak activity, with a dip in the middle of the day. Activity intensifies in the morning, peaking at 86.4%, followed by a sharp decrease during midday. It rises again in the afternoon, reaching 81.8%, before gradually declining toward the evening. This pattern reflects the commercial nature of the cluster, which also has the highest density of POIs per surface area, with 2.8 POIs per cell.
-
Cluster 5 (C5)
C5 stands out due to its lack of morning and midday activity, followed by a strong peak in the late afternoon and evening (around 8 p.m.), with an occupancy rate of 77.7%. The predominant activity is in the bars and restaurants sector, which accounts for 61% of the total. This cluster exhibits a mono-functional behavior, with other categories being underrepresented.
In this case, there is a symbiosis between bars and squares, which causes socializing to take place jointly in this cluster, with activity intensifying in the late afternoon and continuing into the evening.

3.2.2. Spatial Analysis

While the spatial distribution of the clusters may appear random throughout the city in Figure 8, a closer analysis of each cluster individually using KDE reveals notable differences in Figure 9. These differences can help us to understand the phenomenon associated with urban form and function.
C1 exhibits a polycentric and balanced profile across the categories of bars and restaurants, shops, and wellbeing, with focal points homogeneously distributed throughout the neighborhoods. Nevertheless, it is predominantly located in the flat and central areas of the city, which encompass a variety of morphologies—from the medieval core of the Parte Vieja to the orthogonal grid of the 19th-century expansion in Centro, and the postmodern blocks with wide public courtyards typical of Antiguo and Amara.
In contrast, C2 reveals a more fragmented spatial pattern, highly concentrated in specific points of the city. Notably, the Parte Vieja stands out for its intensity, characterized by a dense medieval layout with a large number of small premises packed into a compact area. Additional, albeit less intense, concentrations appear in Gros and Centro, within the orthogonal expansion grid.
C3 shows a strong focus around the central pedestrian shopping streets, largely populated by franchise retail outlets. These streets also register a marked presence of wellbeing-related POIs, suggesting a commercial environment oriented toward both consumption and personal care services.
C4 is mainly concentrated along several pedestrian corridors in Centro and the Parte Vieja, combining high levels of commercial activity with the presence of small bars. In the surrounding neighborhoods—Gros, Amara, and Antiguo—the pattern becomes more diffuse, although it still aligns with the central commercial axes. In contrast, in the peripheral areas, the distribution diverges, forming smaller, more isolated concentrations with lower intensity.
Finally, C5 is strongly localized around emblematic squares within the city center, particularly the Cathedral Square, as well as key plazas in the Parte Vieja and Antiguo. This cluster is virtually absent in peripheral neighborhoods, reinforcing its association with centrality and symbolic urban spaces.

4. Discussion

The ML-based methodology applied in this study enabled the classification of urban space into five distinct temporal clusters, each reflecting characteristic occupancy patterns derived from GPT data. These clusters reveal both daily rhythms of activity and their spatial distribution, highlighting the differentiated roles that neighborhoods play within the functional structure of the city.
Although all cluster types are represented across the city’s neighborhoods—consistent with the multifunctional character of a compact, mixed-use, and complex city such as Donostia-San Sebastián—the KDE reveals distinct spatial distributions for each functional cluster. This allows for the association of occupancy dynamics with the city’s morphological and structural characteristics. As shown in the results, this case study enables the identification of key axes or hotspots for each occupancy pattern.
Overall, the central part of the city and the adjacent neighborhoods—mainly located in flat areas with more homogeneous urban structures—host higher levels of activity across all cluster types. In contrast, more peripheral and topographically elevated areas show significantly lower activity levels, with certain residential neighborhoods—developed during the 1970s and 1980s or in more recent years—showing an almost complete absence of concentrated urban functions. This confirms a clear center–periphery gradient in the city’s potential to attract people.
At a finer scale, deeper analysis within individual neighborhoods reveals that the most intense locations for each cluster tend to align with pedestrian corridors, public squares, or main transportation routes. As demonstrated in Section 3.2.2, the proposed method enables the identification of distinct spatial patterns based on both the type of cluster and the existing urban fabric. These findings could form the basis for future, more detailed studies on the relationship between occupancy patterns and urban morphology and functions at the neighborhood scale.
The temporal fluctuations of each cluster also differ markedly, offering insight into the functional drivers of human agglomeration. For example, bar-oriented clusters (C2 and C5) have the highest contrast of agglomeration ratios and show a high spatial concentration. On the one hand, C5 has the absolute highest evening peak but was preceded by really low morning activity. On the other hand, C2 shows a deep valley in the afternoon. The more evenly distributed mixed-use cells represented in C1 have a characteristic morning peak. Meanwhile, the shopping-oriented cells of C4 are dispersed throughout the city, although higher intensities clearly manifest in central areas. Its multifunctional character allows for a continuous activity pattern, similar to C3, which instead shows the highest spatial concentration and a different offering of activities that tend toward wellbeing and free spaces.
These patterns differ in timing, intensity, and functional composition. Clusters with pronounced evening peaks driven by bars and restaurants (e.g., C5) contrast with those that show symmetrical morning and afternoon activity linked to retail (e.g., C4). Spatially, these patterns correspond to established urban hierarchies, echoing Christaller’s central place theory by identifying key centers in the historic core and structured expansion areas. However, unlike static spatial models, our data-driven approach captures emergent functional hierarchies based on real-time usage, aligning with recent theoretical updates that incorporate temporal specialization into urban hierarchy models [20].
Our results are in line with recent studies highlighting temporal specialization in urban environments. For instance, the divergence between midday and nighttime check in behaviors across neighborhoods [64], suggesting time-specific functionality independent of categorical diversity. In our findings, the areas with strong evening activity (e.g., C5) are not necessarily the most functionally diverse but are the most intense in one category (bars and restaurants), reaffirming that spatial specialization and temporal rhythm do not always align with land use variety.
From a methodological perspective, our approach builds on the advances in urban pattern mining through time series clustering. While prior work has applied this to single domains—such as bike sharing systems [74] or nightlife recovery [75]—our multi-categorical perspective captures the coexistence and layering of urban functions, a defining trait of compact cities like Donostia-San Sebastián.
Our decision to aggregate the POIs within morphologically homogeneous urban units also improves spatial granularity. In contrast to studies that rely on administrative boundaries or uniform grids [15], our irregular morphological grid aligns more closely with the street network and built form. This enhances spatial relevance and interpretability. Moreover, by weighting the occupancy based on POIs category and cadastral surface, we convert GPT’s relative metrics into estimated counts of people, addressing a major shortcoming of studies using purely relative indicators [62].
The proposed framework was developed using open-source tools, including Python and QGIS for spatial processing, ensuring transparency and reproducibility. Given the lightweight nature of the algorithms and the localized scope of the analysis, the computational cost and environmental impact remain minimal compared with more intensive AI frameworks.
That said, the methodology has limitations. The multisource strategy requires harmonizing data from different providers, particularly matching Google Places POIs with cadastral premises. This process involves address standardization, and is subject to geolocation errors, mismatches, or absent records. In such cases, we assigned average category surface values, which introduces some uncertainty into the spatial analysis.
Estimating maximum occupancy also assumes that the highest GPT-recorded value reflects the legal capacity of each venue, which may not align with actual peak activity or compliance [76]. Furthermore, GPT’s rolling average is sensitive to exceptional events (e.g., holidays, closures), potentially skewing the baseline of normal behavior.
We also recognize the dependency on a proprietary platform. Although GPT provides fine-grained, publicly accessible data, changes in its access policies or data architecture could affect future research continuity. More fundamentally, Google Places and GPT may overrepresent commercial activity while underrepresenting sectors like education, healthcare, or informal uses. Despite the widespread use of smartphones and LBSNs, digital behavior is still shaped by sociodemographic biases, meaning some population groups are underrepresented [77].
Finally, while this study segments urban space based on morphological structure, it does not directly quantify urban form through variables like block size, density, or connectivity. Future work should build on this framework by integrating spatial indicators into correlation models [59,63], to more clearly articulate how urban form influences usage dynamics.

5. Conclusions

This paper presents a method for the spatiotemporal analysis of urban dynamics, focusing on the concentration of people within a city. It evaluates the effectiveness of using Google Maps and land use data, combined with ML techniques to measure fine-grained urban occupancy patterns.
The availability of geosocial data through LBSNs offers new opportunities for detailed studies of the spatiotemporal concentration of people within cities. As the usage of these platforms grows across various population groups, the potential and representativeness of these data are expected to increase, provided that public access to such data remains available. However, previous studies have not considered either the capacity or the interaction between POIs.
So, the integration of static data and publicly accessible geotemporal data with ML represents a significant advancement in the study of urban dynamics. This methodology not only standardizes data analysis for people agglomeration but also enables scalability to other urban contexts.
The findings demonstrate that by analyzing geolocated, time-stamped big data, it is possible to model the activity patterns of specific urban nodes. This methodology enables detailed spatiotemporal analysis, offering valuable insights into the hourly behavior of people in a city in relation to urban form and its functions represented by spatially related POIs. The estimation of the volume of people, using category-dependent density ratios and the floor area of POIs, weighted by GPT data allows for an hourly capacity calculation of each location. This approach involves a reverse-engineering process using percentage values provided by Google from aggregated and anonymized data, all of which is publicly accessible.
Furthermore, this study confirms that the relationship between land use and activity patterns remains a critical factor in urban life. The case study also highlights the importance of understanding the spatial interaction of different POIs categories in shaping urban dynamics throughout the day. The insights gained from clustering spatiotemporal activity patterns provide a framework for targeted urban planning interventions, as the observed temporal rhythms in areas with mixed land use reinforce the role of urban form and function in shaping activity patterns.
It also allows for the identification of characteristic urban patterns or rhythms by incorporating ML techniques into the analysis of urban big data. Furthermore, the clustering of time series data offers a clear visual representation of urban areas that share similar functionality and activity patterns, even when those areas are geographically discontinuous.
By integrating temporal and spatial data on the presence of people in a city, a new dimension is introduced for the complex analysis of urban dynamics. In conjunction with the study of urban structure and form, this approach enables the identification of imbalances occurring within a city, as well as the characterization of large depressed or low-vitality areas. Additionally, it allows for the detection of zones with excessive occupancy, which may be considered saturated.
Therefore, the proposed methodology introduces a novel approach that supports data-driven urban planning decisions, which could be applied in the evaluation and design of municipal policies in various areas such as mobility, the development of local economies, or the location of public facilities, for example. On the other hand, as the methodology is standardized, it is transferable and applicable to other cities. Moreover, this study lays the groundwork for more advanced methods that can further explore the complexities of urban phenomena. Future research could aim to create more representative samples of the population, reducing biases in social network data related to age, gender, or origin. Extending the study period to include seasonal variations or more days of the week would also allow for comparative studies of occupancy patterns, providing a more accurate representation of reality and serving as a valuable tool for city design and management.

Author Contributions

Conceptualization: Mikel Barrena-Herrán, Olatz Grijalba and Itziar Modrego-Monforte; Data curation: Mikel Barrena-Herrán; Formal analysis: Mikel Barrena-Herrán; Funding acquisition: Olatz Grijalba; Investigation: Mikel Barrena-Herrán, Olatz Grijalba and Itziar Modrego-Monforte; Methodology: Mikel Barrena-Herrán; Project administration: Olatz Grijalba; Software: Mikel Barrena-Herrán; Resources: Mikel Barrena-Herrán and Itziar Modrego-Monforte; Supervision: Olatz Grijalba; Validation: Mikel Barrena-Herrán, Olatz Grijalba and Itziar Modrego-Monforte; Visualization: Mikel Barrena-Herrán and Itziar Modrego-Monforte; Writing—original draft: Mikel Barrena-Herrán, Olatz Grijalba and Itziar Modrego-Monforte; Writing—review and editing: Mikel Barrena-Herrán, Olatz Grijalba and Itziar Modrego-Monforte. All authors have read and agreed to the published version of the manuscript.

Funding

This work was supported by the Diputación Foral Gipuzkoa under grant number 2021-CIEN-000044-05-02-01.

Data Availability Statement

Publicly available Google Popular Times data, which uses aggregated and anonymized data from its users, was scraped from the internet through the platform declared in this paper. Methodology for the obtention of the data is also provided and, although not posted in a repository, our data can be accessed upon reasonable request.

Acknowledgments

This paper is part of the project “DinUr: Método de análisis de las dinámicas urbanas a través de Big (Geo) Data para la Regenación y Transformación de la ciudad” subsidized by the Economic Promotion and Strategic Projects of the Diputación Foral Gipuzkoa through the Gipuzkoa Science, Technology and Innovation Network Programme.

Conflicts of Interest

The authors declare no conflicts of interest.

References

  1. Hägerstrand, T. What about people in Regional Science? Pap. Reg. Sci. Assoc. 1970, 24, 6–21. [Google Scholar] [CrossRef]
  2. Couclelis, H. Space, time, geography. In Geographical Information Systems, 1st ed.; Longley, P.A., Goodchild, M.F., Maguire, D.J., Rhind, D.W., Eds.; John Wiley and Sons: New York, NY, USA, 1999; Volume 1, pp. 29–38. [Google Scholar]
  3. Rapoport, A. Human Aspects of Urban Form; Pergamon Press: Oxford, UK, 1977. [Google Scholar] [CrossRef]
  4. Hillier, B.; Penn, A.; Hanson, J.; Grajewski, T.; Xu, J. Natural movement: Or, configuration and attraction in urban pedestrian movement. Environ. Plan. B Plan. Des. 1993, 20, 29–66. [Google Scholar] [CrossRef]
  5. Moore-Cherry, N.; Bonnin, C. Playing with time in Moore Street, Dublin: Urban redevelopment, temporal politics and the governance of space-time. Urban Geogr. 2020, 41, 1198–1217. [Google Scholar] [CrossRef]
  6. Goodchild, M.F.; Janelle, D.G. The city around the clock: Space-time patterns of urban ecological structure (Halifax, Canada). Environ. Plan. A 1984, 16, 807–820. [Google Scholar] [CrossRef]
  7. Janelle, D.G.; Klinkenberg, B.; Goodchild, M.F. The temporal ordering of urban space and daily activity patterns for population role groups. Geogr. Syst. 1998, 5, 117–137. [Google Scholar]
  8. Anderson, J. Space-Time Budgets and Activity Studies in Urban Geography and Planning. Environ. Plan. A Econ. Space 1971, 3, 353–368. [Google Scholar] [CrossRef]
  9. Goodchild, M.F.; Klinkenberg, B.; Janelle, D.G. A Factorial Model of Aggregate Spatio-Temporal Behavior: Application to the Diurnal Cycle. Geogr. Anal. 1993, 25, 277–294. [Google Scholar] [CrossRef]
  10. Brail, R.K.; Chapin, F.S. Activity patterns of urban residents. Environ. Behav. 1973, 5, 163–190. [Google Scholar] [CrossRef]
  11. Grese, R.E. A Sense of Place, a Sense of Time. Landsc. J. 1995, 14, 226–227. [Google Scholar] [CrossRef]
  12. Meentemeyer, V. Geographical perspectives of space, time, and scale. Landsc. Ecol. 1989, 3, 163–173. [Google Scholar] [CrossRef]
  13. Lískovec, R.; Lichter, M.; Mulíček, O. Chronotopes of urban centralities: Looking for prominent urban times and places. Geogr. J. 2022, 188, 166–176. [Google Scholar] [CrossRef]
  14. Nevejan, C.; Cunningham, S.; Sefkatli, P. City Rhythm Logbook of an Exploration; Delft University of Technology: Delft, The Netherlands, 2018. [Google Scholar]
  15. Chen, L.; Zhao, L.; Xiao, Y.; Lu, Y. Investigating the spatiotemporal pattern between the built environment and urban vibrancy using big data in Shenzhen, China. Comput. Environ. Urban Syst. 2022, 95, 101827. [Google Scholar] [CrossRef]
  16. Wunderlich, F.M. Place-Temporality and Urban Place-Rhythms in Urban Analysis and Design: An Aesthetic Akin to Music. J. Urban Des. 2013, 18, 383–408. [Google Scholar] [CrossRef]
  17. Row, A.T.; Jacobs, J. The Death and Life of Great American Cities. Yale Law J. 1962, 71, 1597–1602. [Google Scholar] [CrossRef]
  18. Pafka, E. Places as Intersecting Flows: Mapping Urban Morphologies, Functional Constellations and Pedestrian Rhythms. In Proceedings of the Space and Place, 4th Global Conference, Oxford, UK, 9–12 September 2013. [Google Scholar]
  19. Mulíček, O.; Osman, R.; Seidenglanz, D. Urban rhythms: A chronotopic approach to urban timespace. Time Soc. 2015, 24, 304–325. [Google Scholar] [CrossRef]
  20. Osman, R.; Mulíček, O. Urban chronopolis: Ensemble of rhythmized dislocated places. Geoforum 2017, 85, 46–57. [Google Scholar] [CrossRef]
  21. Tan, W.; Klaasen, I. 24/7 Environments: A Theoretical and Empirical Exploration from an Urban Planners Perspective. In Proceedings of the European Urban Research Association (EURA): 10th Anniversary Conference, Glasglow, Scotland, 12–14 September 2007. [Google Scholar]
  22. Bromley, R.D.F.; Tallon, A.R.; Thomas, C.J. Disaggregating the space-time layers of city-centre activities and their users. Environ. Plan. A 2003, 35, 1381–1851. [Google Scholar] [CrossRef]
  23. Palmer, J.R.B. Activity-Space Segregation: Understanding Social Divisions in Space and Time; Princeton University: Princeton, NJ, USA, 2013. [Google Scholar]
  24. Roberts, M.; Eldridge, A. Quieter, safer, cheaper: Planning for a more inclusive evening and night-time economy. Plan. Pract. Res. 2007, 22, 253–266. [Google Scholar] [CrossRef]
  25. Van Liempt, I.; van Aalst, I.; Schwanen, T. Introduction: Geographies of the urban night. Urban Stud. 2015, 52, 407–421. [Google Scholar] [CrossRef]
  26. Roberts, M.; Turner, C. Conflicts of liveability in the 24-hour city: Learning from 48 hours in the life of London’s Soho. J. Urban Des. 2005, 10, 171–193. [Google Scholar] [CrossRef]
  27. Ghafouri, A.; Weber, C. Multifunctional Urban Spaces a Solution to Increase the Quality of Urban Life in Dense Cities. Manzar 2020, 12, 34–45. [Google Scholar] [CrossRef]
  28. Jones, M.; Pebley, A.R. Redefining Neighborhoods Using Common Destinations: Social Characteristics of Activity Spaces and Home Census Tracts Compared. Demography 2014, 51, 727–752. [Google Scholar] [CrossRef]
  29. Mehta, V. Lively streets: Determining environmental characteristics to support social behavior. J. Plan. Educ. Res. 2007, 27, 165–187. [Google Scholar] [CrossRef]
  30. Taylor, R.B. Defining Neighborhoods in Space and Time. Cityscape 2012, 14, 225–230. [Google Scholar]
  31. Shirazi, M.R. Mapping neighbourhood outdoor activities: Space, time, gender and age. J. Urban Des. 2019, 24, 715–737. [Google Scholar] [CrossRef]
  32. Smith, R.J.; Hetherington, K. Urban rhythms: Mobilities, Space and Interaction in the contemporary city. Sociol. Rev. 2013, 61 (Suppl. 1), 4–16. [Google Scholar] [CrossRef]
  33. Diepen, A.M.L.; Musterd, S. Lifestyles and the city: Connecting daily life to urbanity. J. Hous. Built Environ. 2009, 24, 331–345. [Google Scholar] [CrossRef]
  34. Raman, S. Designing a liveable compact city physical forms of city and social life in urban neighbourhoods. Built Environ. 2010, 36, 63–80. [Google Scholar] [CrossRef]
  35. Boeing, G. Measuring the complexity of urban form and design. Urban Des. Int. 2018, 23, 281–292. [Google Scholar] [CrossRef]
  36. Batty, M.; Besussi, E.; Maat, K.; Harts, J.J. Representing multifunctional cities: Density and diversity in space and time. Built Environ. 2004, 30, 324–337. [Google Scholar] [CrossRef]
  37. Kwan, M.P. Time, information technologies, and the geographies of everyday life. Urban Geogr. 2002, 23, 471–482. [Google Scholar] [CrossRef]
  38. Li, S.; Dragicevic, S.; Castro, F.A.; Sester, M.; Winter, S.; Coltekin, A.; Pettit, C.; Jiang, B.; Haworth, J.; Stein, A.; et al. Geospatial big data handling theory and methods: A review and research challenges. ISPRS J. Photogramm. Remote Sens. 2016, 115, 119–133. [Google Scholar] [CrossRef]
  39. Toole, J.L.; Colak, S.; Sturt, B.; Alexander, L.P.; Evsukoff, A.; González, M.C. The path most traveled: Travel demand estimation using big data resources. Transp. Res. Part C Emerg. Technol. 2015, 58, 162–177. [Google Scholar] [CrossRef]
  40. Kitchin, R. The real-time city? Big data and smart urbanism. GeoJournal 2014, 79, 1–14. [Google Scholar] [CrossRef]
  41. Puebla, J.G. Big Data y nuevas geografías: La huella digital de las actividades humanas. Doc. Anal. Geogr. 2018, 64, 195–217. [Google Scholar]
  42. Gao, S.; Liu, Y.; Wang, Y.; Ma, X. Discovering spatial interaction communities from mobile phone data. Trans. GIS 2013, 17, 463–481. [Google Scholar] [CrossRef]
  43. Liu, Z.; Ma, T.; Du, Y.; Pei, T.; Yi, J.; Peng, H. Mapping hourly dynamics of urban population using trajectories reconstructed from mobile phone records. Trans. GIS 2018, 22, 494–513. [Google Scholar] [CrossRef]
  44. Yang, X.; Fang, Z.; Xu, Y.; Shaw, S.-L.; Zhao, Z.; Yin, L.; Zhang, T.; Lin, Y. Understanding spatiotemporal patterns of human convergence and divergence using mobile phone location data. ISPRS Int. J. Geoinf. 2016, 5, 177. [Google Scholar] [CrossRef]
  45. Gao, S. Spatio-Temporal Analytics for Exploring Human Mobility Patterns and Urban Dynamics in the Mobile Age. Spat. Cogn. Comput. 2015, 15, 86–114. [Google Scholar] [CrossRef]
  46. Chen, Y.; Liu, X.; Li, X.; Liu, X.; Yao, Y.; Xu, X.; Pei, F. Delineating urban functional areas with building-level social media data: A dynamic time warping (DTW) distance based k-medoids method. Landsc Urban Plan. 2017, 160, 48–60. [Google Scholar] [CrossRef]
  47. Hu, Y.; Gao, S.; Janowicz, K.; Yu, B.; Li, W.; Prasad, S. Extracting and understanding urban areas of interest using geotagged photos. Comput. Environ. Urban Syst. 2015, 54, 240–254. [Google Scholar] [CrossRef]
  48. Wang, Y.; Wang, T.; Tsou, M.H.; Li, H.; Jiang, W.; Guo, F. Mapping dynamic urban land use patterns with crowdsourced geo-tagged social media (Sina-Weibo) and commercial points of interest collections in Beijing, China. Sustainability 2016, 8, 1202. [Google Scholar] [CrossRef]
  49. Steiger, E.; Resch, B.; Zipf, A. Exploration of spatiotemporal and semantic clusters of Twitter data using unsupervised neural networks. Int. J. Geogr. Inf. Sci. 2016, 30, 1694–1716. [Google Scholar] [CrossRef]
  50. Ma, X.; Liu, C.; Wen, H.; Wang, Y.; Wu, Y.J. Understanding commuting patterns using transit smart card data. J. Transp. Geogr. 2017, 58, 135–145. [Google Scholar] [CrossRef]
  51. Gan, Z.; Yang, M.; Feng, T.; Timmermans, H. Understanding urban mobility patterns from a spatiotemporal perspective: Daily ridership profiles of metro stations. Transportation 2020, 47, 315–336. [Google Scholar] [CrossRef]
  52. Froehlich, J.; Neumann, J.; Oliver, N. Sensing and predicting the pulse of the city through shared bicycling. In Proceedings of the IJCAI International Joint Conference on Artificial Intelligence, Pasadena, CA, USA, 11–17 July 2009. [Google Scholar]
  53. Ma, X.; Cao, R.; Jin, Y. Spatiotemporal clustering analysis of bicycle sharing system with data mining approach. Information 2019, 10, 163. [Google Scholar] [CrossRef]
  54. Zeng, P.; Wei, M.; Liu, X. Investigating the spatiotemporal dynamics of urban vitality using bicycle-sharing data. Sustainability 2020, 12, 1714. [Google Scholar] [CrossRef]
  55. Rempe, F.; Huber, G.; Bogenberger, K. Spatio-Temporal Congestion Patterns in Urban Traffic Networks. Transp. Res. Procedia 2016, 15, 513–524. [Google Scholar] [CrossRef]
  56. Zhang, K.; Sun, D.J.; Shen, S.; Zhu, Y. Analyzing spatiotemporal congestion pattern on urban roads based on taxi GPS data. J. Transp. Land Use 2017, 10. [Google Scholar] [CrossRef]
  57. Mao, F.; Ji, M.; Liu, T. Mining spatiotemporal patterns of urban dwellers from taxi trajectory data. Front. Earth Sci. 2016, 10, 205–221. [Google Scholar] [CrossRef]
  58. Carpio-Pinedo, J.; Romanillos, G.; Aparicio, D.; Martín-Caro, M.S.H.; García-Palomares, J.C.; Gutiérrez, J. Towards a new urban geography of expenditure: Using bank card transactions data to analyze multi-sector spatiotemporal distributions. Cities 2022, 131, 103894. [Google Scholar] [CrossRef]
  59. Liu, S.; Zhang, L.; Long, Y. Urban vitality area identification and pattern analysis from the perspective of time and space fusion. Sustainability 2019, 11, 4032. [Google Scholar] [CrossRef]
  60. Xia, Z.; Li, H.; Chen, Y.; Liao, W. Identify and delimitate urban hotspot areas using a network-based spatiotemporal field clustering method. ISPRS Int. J. Geoinf. 2019, 8, 344. [Google Scholar] [CrossRef]
  61. Yao, X.; Zhu, D.; Gao, Y.; Wu, L.; Zhang, P.; Liu, Y. A Stepwise Spatio-Temporal Flow Clustering Method for Discovering Mobility Trends; IEEE Access: Piscataway, NJ, USA, 2018; Volume 6. [Google Scholar] [CrossRef]
  62. Santiago-Iglesias, E.; Carpio-Pinedo, J.; Sun, W.; García-Palomares, J.C. Frozen city: Analysing the disruption and resilience of urban activities during a heavy snowfall event using Google Popular Times. Urban Clim. 2023, 51, 101644. [Google Scholar] [CrossRef]
  63. Calafiore, A.; Palmer, G.; Comber, S.; Arribas-Bel, D.; Singleton, A. A geographic data science framework for the functional and contextual analysis of human dynamics within global cities. Comput. Environ. Urban Syst. 2021, 85, 101539. [Google Scholar] [CrossRef]
  64. Eustat. Tablas Estadísticas: Edificios de la C.A. de Euskadi por Ámbitos Territoriales, Según Tipo de Edificio. Instituto Vasco de Estadística. 2021. Available online: https://www.eustat.eus/municipal/datos_estadisticos/donostia_san_sebastian_c.html (accessed on 30 July 2024).
  65. Fernandez-Crehuet, J.M.; Gimenez-Nadal, J.I.; Reyes Recio, L.E. The National Work–Life Balance Index©: The European Case. Soc. Indic. Res. 2016, 128, 341–359. [Google Scholar] [CrossRef]
  66. Eustat. Proporción de Personas Entre 16 y 74 Años Que Han Usado el Móvil en los Últimos Tres Meses. Published online 2022. Available online: https://www.eustat.eus/indicadores/temaseleccionado_5.b.1.1/ods2.html (accessed on 30 July 2024).
  67. Eustat. Panorama de la Sociedad de la Información 2022 [Nota de Prensa]. Instituto Vasco de Estadística. 2022. Available online: https://www.eustat.eus/elementos/el-565-de-los-internautas-participa-en-redes-sociales-y-el-552-de-las-empresas-las-usa-para-fines-empresariales-en-la-ca-de-euskadi-en-2022/not0020532_c.html (accessed on 30 July 2024).
  68. Eustat. Establecimientos y Personas Empleadas en Municipios de Más de 10.000 Habitantes Según Rama de Actividad (A10). Instituto Vasco de Estadística. 2023. Available online: https://www.eustat.eus/elementos/ele0005800/establecimientos-y-personas-empleadas-en-municipios-de-mas-de-10000-habitantes-segun-rama-de-actividad-a10/tbl0005834_c.html (accessed on 30 July 2024).
  69. D’Zmura, M. Behind the Scenes: Popular Times and Live Busyness Information. Available online: https://blog.google/products/maps/maps101-popular-times-and-live-busyness-information/ (accessed on 3 March 2025).
  70. Drobník, J. Google Maps Scraper. 2019. Available online: https://github.com/josiahakinloye/store-crawler-google-places (accessed on 4 May 2022).
  71. Diputación de Gipuzkoa. Catastro de Gipuzkoa. Diputación de Gipuzkoa. 2025. Available online: https://www.gipuzkoairekia.eus/es/datu-irekien-katalogoa/-/openDataSearcher/detail/detailView/f249fd69-9765-4850-9bf8-c3ad457d848e (accessed on 24 January 2025).
  72. Dunham, H.W. The Image of the City Kevin Lynch. Soc. Probl. 1960, 8, 280–281. [Google Scholar] [CrossRef]
  73. Paparrizos, J.; Gravano, L. K-Shape: Efficient and Accurate Clustering of Time Series. SIGMOD Rec. 2016, 45, 69–76. [Google Scholar] [CrossRef]
  74. Zhu, Y.; Diao, M. Understanding the spatiotemporal patterns of public bicycle usage: A case study of Hangzhou, China. Int. J. Sustain. Transp. 2020, 14, 163–176. [Google Scholar] [CrossRef]
  75. Santiago-Iglesias, E.; Romanillos, G.; Carpio-Pinedo, J.; Sun, W.; García-Palomares, J.C. Recovering urban nightlife: COVID-19 insights from Google Places activity trends in Madrid. J. Maps 2024, 20, 2371927. [Google Scholar] [CrossRef]
  76. Happle, G.; Fonseca, J.A.; Schlueter, A. Context-specific urban occupancy modeling using location-based services data. Build Environ. 2020, 175, 106803. [Google Scholar] [CrossRef]
  77. Bernabeu-Bautista, Á.; Serrano-Estrada, L.; Perez-Sanchez, V.R.; Martí, P. The geography of social media data in urban areas: Representativeness and complementarity. ISPRS Int. J. Geoinf. 2021, 10, 747. [Google Scholar] [CrossRef]
Figure 1. The administrative division of Donostia-San Sebastián. Source: GeoEuskadi. Own elaboration.
Ijgi 14 00221 g001
Figure 2. Method flow diagram.
Ijgi 14 00221 g002
Figure 3. Classification of POIs in the municipality of Donostia-San Sebastián. The size of the symbols is proportional to the number of POIs. Source: Google Places. Own elaboration.
Ijgi 14 00221 g003
Figure 4. Design process of the morphological grid from the street network. (1) The original street network includes all line features mapped for each street (e.g., bike lanes, traffic directions); (2) the simplified street network reduces each street to a single central axis; (3) intersections are generated at the crossing points of these axes, shown as ‘+’ symbols; (4) Voronoi polygons are created from the intersections to define the morphological grid, aligning with the urban structure. Colors are randomly assigned to aid interpretation. Source: GeoEuskadi. Own elaboration.
Ijgi 14 00221 g004
Figure 5. Three-dimensional capacity heatmap and POIs heatmaps by category within the municipality of Donostia-San Sebastián. Source: Google Places. Own elaboration.
Ijgi 14 00221 g005
Figure 6. Overall daily activity disaggregated by categories, with the sum of estimated people per hour. Subfigure (a) displays the five general categories used in the analysis, while (b) shows the specific categories retrieved from Google Places, which serve as the basis for aggregation. Source: Google Places. Own elaboration.
Ijgi 14 00221 g006
Figure 7. The five types of time series clustering with their confidence interval for a typical Friday in Donostia-San Sebastián.
Ijgi 14 00221 g007
Figure 8. Spatial distribution of each cluster in DonostiaSan Sebastián. Urban areas not associated with any cluster correspond to cells without POIs with recorded occupancy.
Ijgi 14 00221 g008
Figure 9. The 5 clusters in Donostia-San Sebastián and their respective (a) kernel density maps highlighting the most representative areas, (b) radar charts of mixed-use composition by POIs categories, and (c) stacked area graphs of temporal occupancy by POIs categories. Each cluster is represented by a specific color. The five categories are color-coded and identified in the legend below.
Ijgi 14 00221 g009
Table 2. Functional attributes of each cluster.
ClusterCellsPOIPOI/CellShops (%)Bars and Restaurants (%)Outdoors (%)Wellbeing (%)Professional Services (%)Median Cell Area (m2)Median Capacity (People)
1189 (33%)4752.526.729.16.525.512.2639680
294 (16.4%)2182.322.056.94.115.61.44646100.7
367 (11.7%)1452.233.813.88.337.96.2550470
4101 (17.7%)2862.838.529.44.520.37.35321105.3
5121 (21.2%)2492.112.061.012.412.42.0603192.3
Disclaimer/Publisher’s Note: The statements, opinions and data contained in all publications are solely those of the individual author(s) and contributor(s) and not of MDPI and/or the editor(s). MDPI and/or the editor(s) disclaim responsibility for any injury to people or property resulting from any ideas, methods, instructions or products referred to in the content.

