1. Introduction
The rapid development of geoinformatics has brought significant changes to archaeological research, introducing new tools, such as geographic information systems (GIS) and Machine Learning (ML) applications. These technologies offer new possibilities for analyzing and interpreting archaeological data, enhancing traditional methods and practices in the field [
1,
2]. Based on artificial intelligence (AI), ML enables the training of algorithms that recognize and analyze objects, providing valuable tools for the discovery and interpretation of archaeological finds. Typical studies have shown the application of these techniques in archaeological investigations to identify ancient hydraulic systems in Iraq [
3], vaulted tombs in Tonga [
4], and large archaeological deposits at sites worldwide [
5,
6].
Artificial neural networks (ANNs) and convolutional neural networks (CNNs) have become an integral part of this revolution. ANNs, inspired by the functioning of the human brain, where billions of interconnected neurons process information in parallel [
7], enable the recognition of patterns in complex data [
8]. In this way, they are able to separate patterns from the background they are embedded in, making sound and sensible decisions about the categories of patterns they belong to [
9].
CNNs, which specialize in image processing, have found wide application in computer vision and pattern detection [
10]. Their particular utility is based on their ability to accept inputs in the form of multidimensional matrices (tensors), allowing them to work with patterns in multiple directions. The R-CNN object detection algorithms [
11], Fast R-CNN [
12] and Faster R-CNN [
13], are milestones in the evolution of CNNs, with MASK R-CNN [
14] introducing pixel segmentation to reduce the computational process and increase accuracy.
In archaeology, the above algorithms have found many applications in research combined with remote sensing data. In particular, the MASK R-CNN algorithm has proven to be highly effective for the identification of archaeological structures from satellite imagery, LIDAR, and UAV data [
3,
5,
15,
16,
17,
18,
19,
20]. However, a significant portion of the MASK R-CNN algorithm’s potential in archaeology remains unexplored or is still in an experimental stage. The primary challenge in its application lies in the morphological complexity of archaeological remains, which makes it extremely difficult to categorize them into distinct patterns.
In the present study, deep learning and AI techniques are used to develop an algorithmic model capable of identifying and classifying ancient houses and rooms from excavations on Delos Island. At the same time, the use of these techniques as complementary tools to support traditional archaeological investigations is explored, with the aim of saving time and resources, while enhancing the ability to analyze large and complex areas with accuracy and efficiency. To the best of the authors’ knowledge, this approach has not been widely applied in archaeological research, making this study innovative in several aspects.
One of the most significant contributions of this study is the use of the built-in deep learning tools within ArcGIS Pro, which allows for the implementation and visualization of convolutional neural network models without requiring extensive programming knowledge. This is particularly relevant for professionals in the field of archaeology, where formal training in software development is often limited. This accessibility allows for greater engagement with the technology while yielding highly satisfactory results.
The choice of ArcGIS Pro—despite being proprietary—was based on its strong support for geospatial deep learning workflows, its ability to integrate data seamlessly, and its institutional availability through pre-existing licenses. We completely recognize the benefits of open-source alternatives, such as QGIS in combination with libraries like TensorFlow (Google Brain, Mountain View, CA, USA) or PyTorch (Meta AI, Menlo Park, CA, USA). Even if such options can offer equivalent functionality, they generally require more technical know-how and customization. We believe that future implementations of this methodology may be adapted to these platforms, further enhancing accessibility within the research community.
Finally, beyond its technical focus, this study aims to contribute to the broader discourse on the role of AI in landscape archaeology. The ability to accelerate surface analysis and detect structures at scale becomes increasingly valuable in a context of growing datasets and limited resources for fieldwork. Rather than replacing traditional practices, AI-based methods offer an opportunity to enhance archaeological workflows. This aligns with other recent contributions that discuss the theoretical and practical implications of automation in heritage research and non-invasive prospection strategies [
6,
10,
17].
2. Experimental Setup
2.1. Study Area
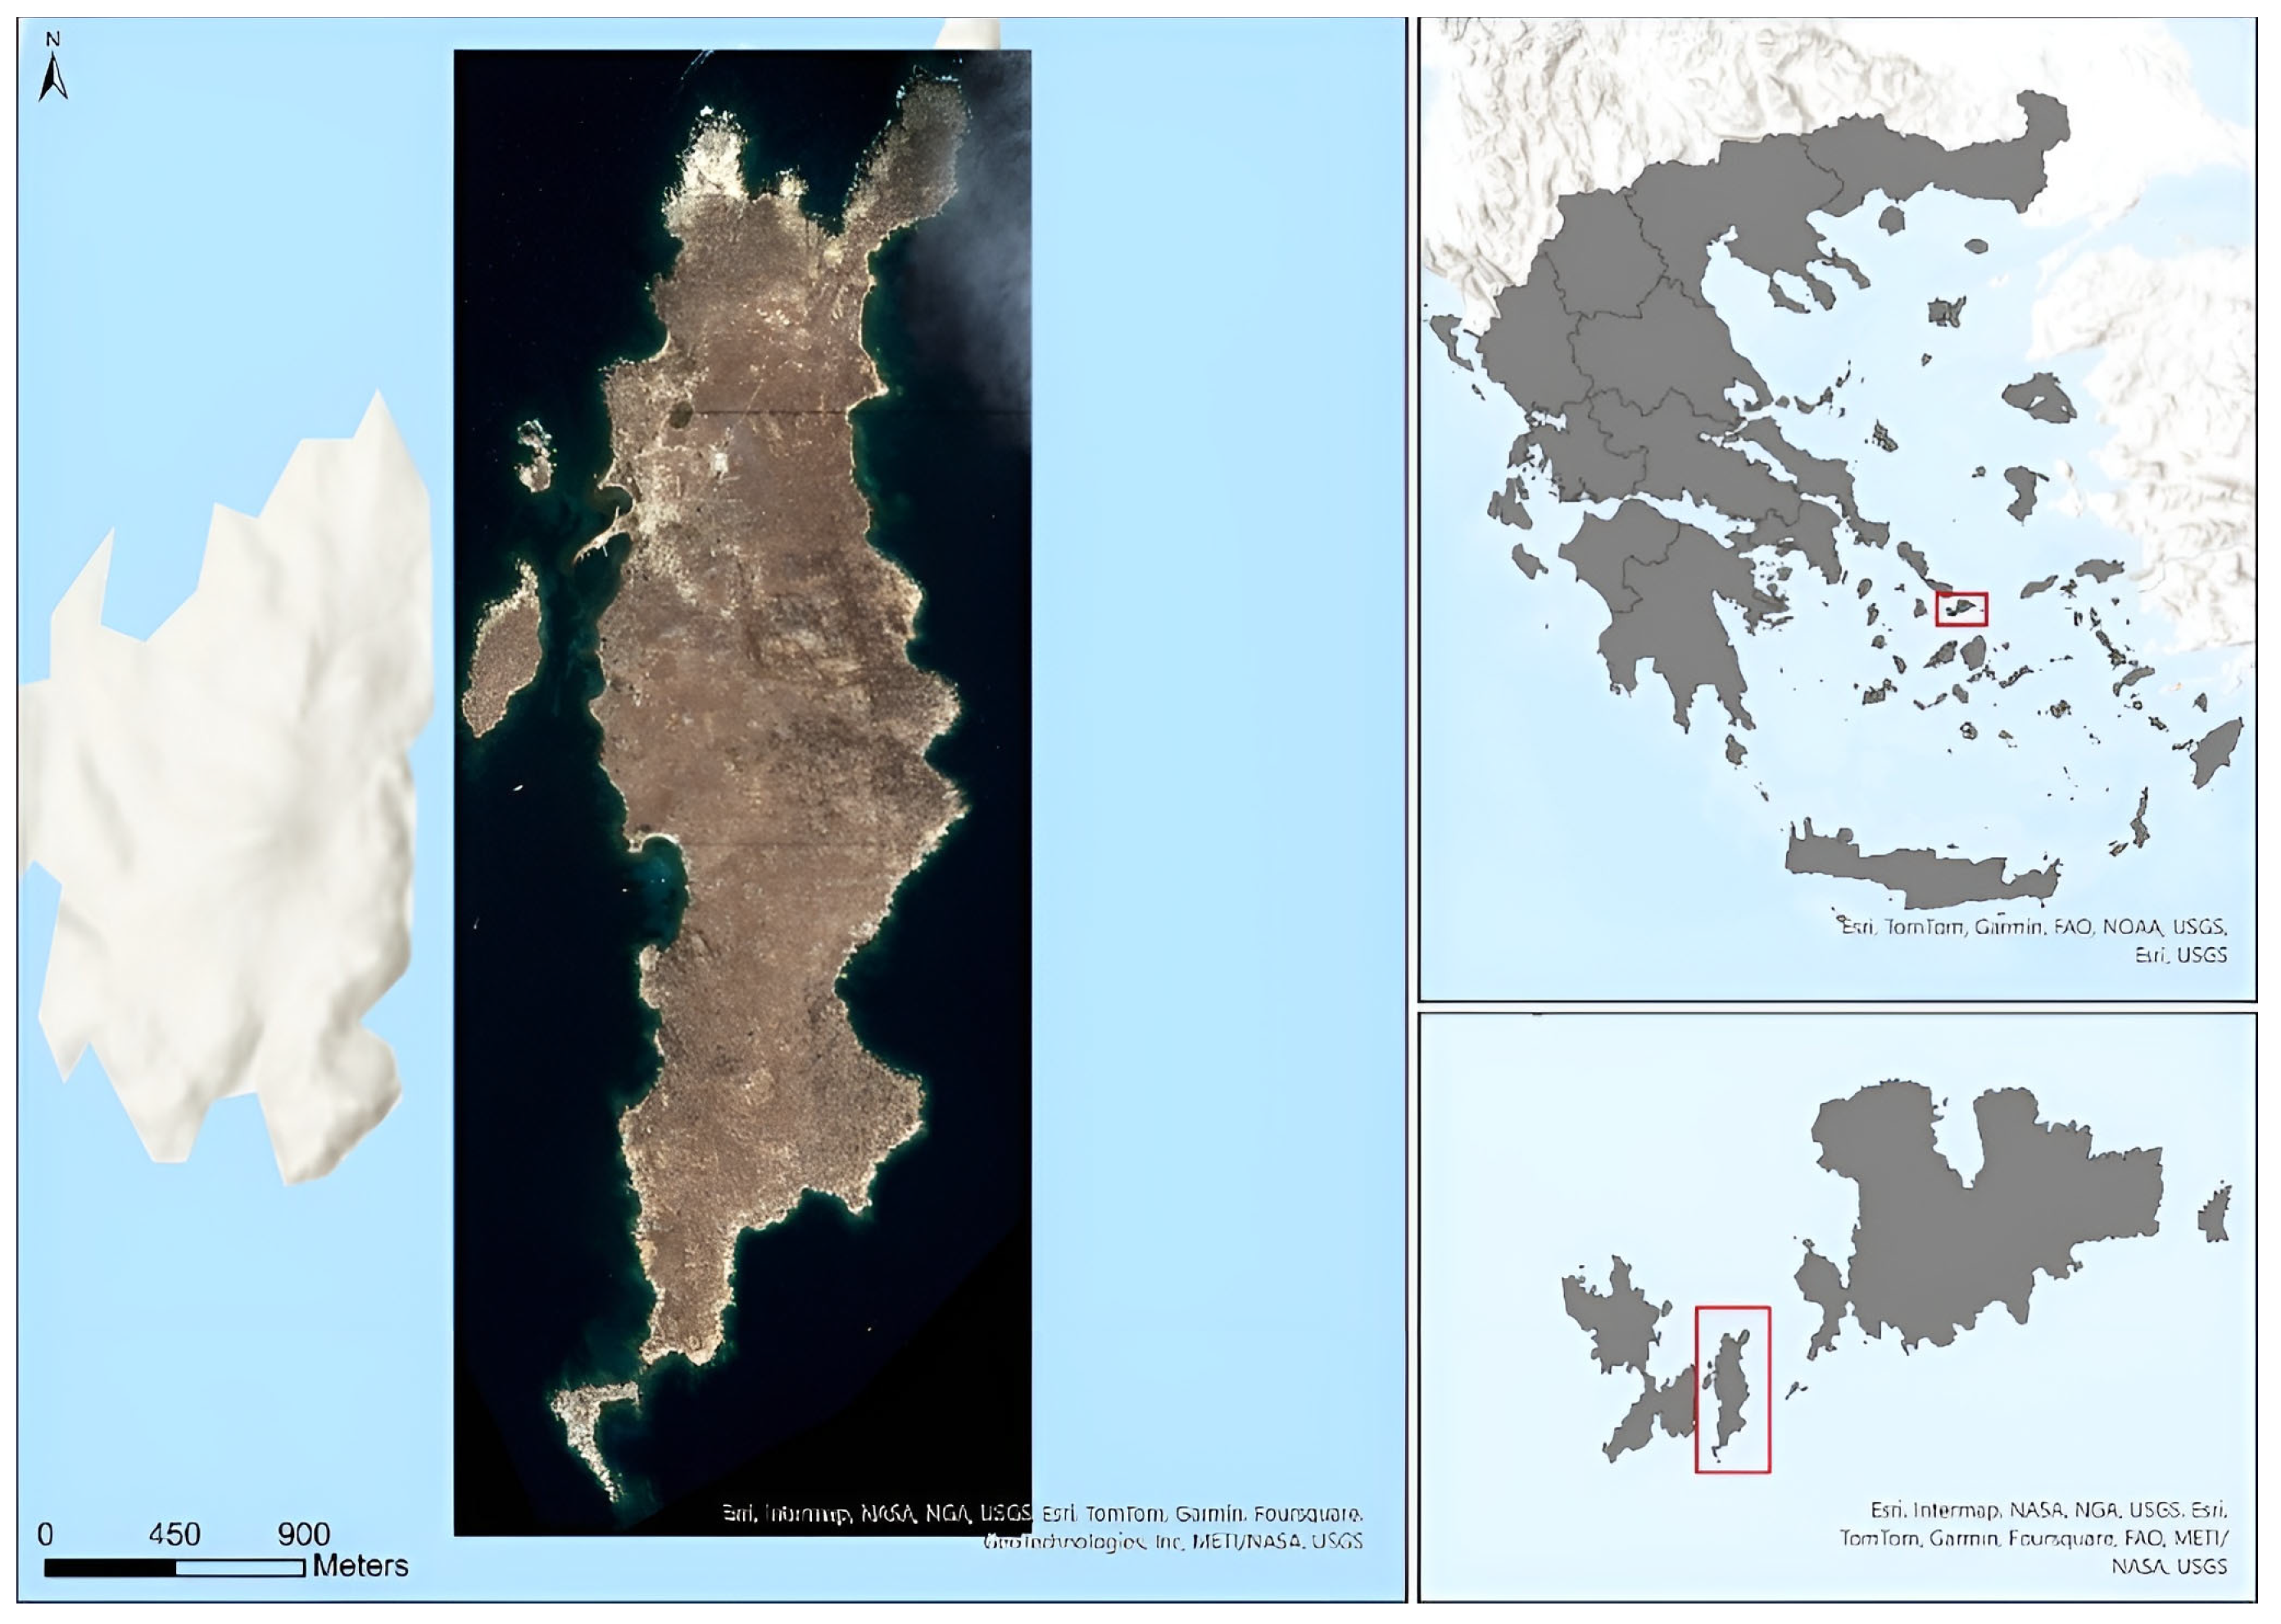
Delos, a small islet in the Cyclades, has an area of 3.5 km
2 and an elongated shape, with a length of 5 km and a maximum width of 1.3 km (
Figure 1). Today it is one of the most important archaeological sites in Greece, recognized by UNESCO since 1990. Archaeological research has proven continuous habitation since the 3rd millennium BC, with finds from the Mycenaean period and the oldest monument being the open-air “horned altar”. From the 9th to 8th centuries BC, Delos became a religious center for the Ionians, with prominent monuments established, such as the House and the Naxian Lodge. In the 6th century BC, it passed under Athenian rule, and during the Classical and Hellenistic periods there was a great deal of building activity, with a population of up to 10,000 inhabitants and the development of foreign sanctuaries and commercial infrastructure [
21].
Roman rule from the 2nd century BC marked an economic boom in Delos, with its declaration as a free port in 166 BC attracting merchants and increasing the population to 25,000. Luxurious residences and shopping centers were built, and the districts around the sanctuary were expanded. However, the devastation caused by Mithridates (88 BC) and pirate raids (69 BC) led to its decline. With the spread of Christianity, the island was gradually abandoned and lost its prestige. The first excavations began in 1872, under the guidance of Panagiotis Stamatakis and the French School of Archaeology. Since then, the sanctuary; the quarters of the Theatre, the Lake, and the Stadium; and monuments from the Hellenistic and Roman periods have been uncovered. Although large-scale excavations ceased in the 1960s, conservation and study continue, highlighting Delos as a unique archaeological treasure [
21].
2.2. Datasets
WorldView-3 Remote Sensing Dataset
WorldView-3 (WV 3) is an advanced remote sensing satellite owned by Maxar Technologies (formerly DigitalGlobe, Westminster, CO, USA). It was launched on 13 August 2014, at an altitude of 617 km. The instruments it carries capture satellite images in a total of 29 spectral channels covering different parts of the electromagnetic spectrum. In particular, it has a panchromatic channel with an excellent spatial resolution of 31 cm, eight multispectral channels in the visible and near-infrared spectrum (VNIR) with a spatial resolution of 1.24 m, and eight channels in the shortwave infrared (SWIR) spectrum with a spatial resolution of 3.7 m. In addition, it has a 12-channel instrument with a spatial resolution of 30 m, CAVIS (Clouds, Aerosols, Vapours, Ice, and Snow), which records atmospheric phenomena, such as thin clouds, aerosols, and water vapour, factors that can degrade the quality of the imaging. This feature ensures clear images even under challenging environmental conditions by correcting for atmospheric effects in real time. Finally, the WV 3 is capable of collecting images covering 680,000 square kilometers per day [
22].
Table 1 below shows the main technical characteristics of the WV 3 satellite system.
The satellite data used in the present study were acquired for the research purposes of the five-year project (2019–2023) entitled “Systematic archaeological research in Rineia Island and Kounelonisi, Municipality of Mykonos”, under the auspices of the Ephorate of Cyclades Antiquities. They are satellite images with Code 1040050038DC8200, which were taken on 22 September 2021 with a spatial resolution of 0.15 m and four spectral channels (Red, Blue, Green, and NIR). The images cover the islands of Rhinia, Delos, and the western part of the island of Mykonos. For the purposes of this study, the area exclusively concerning Delos Island was isolated.
3. Methodology
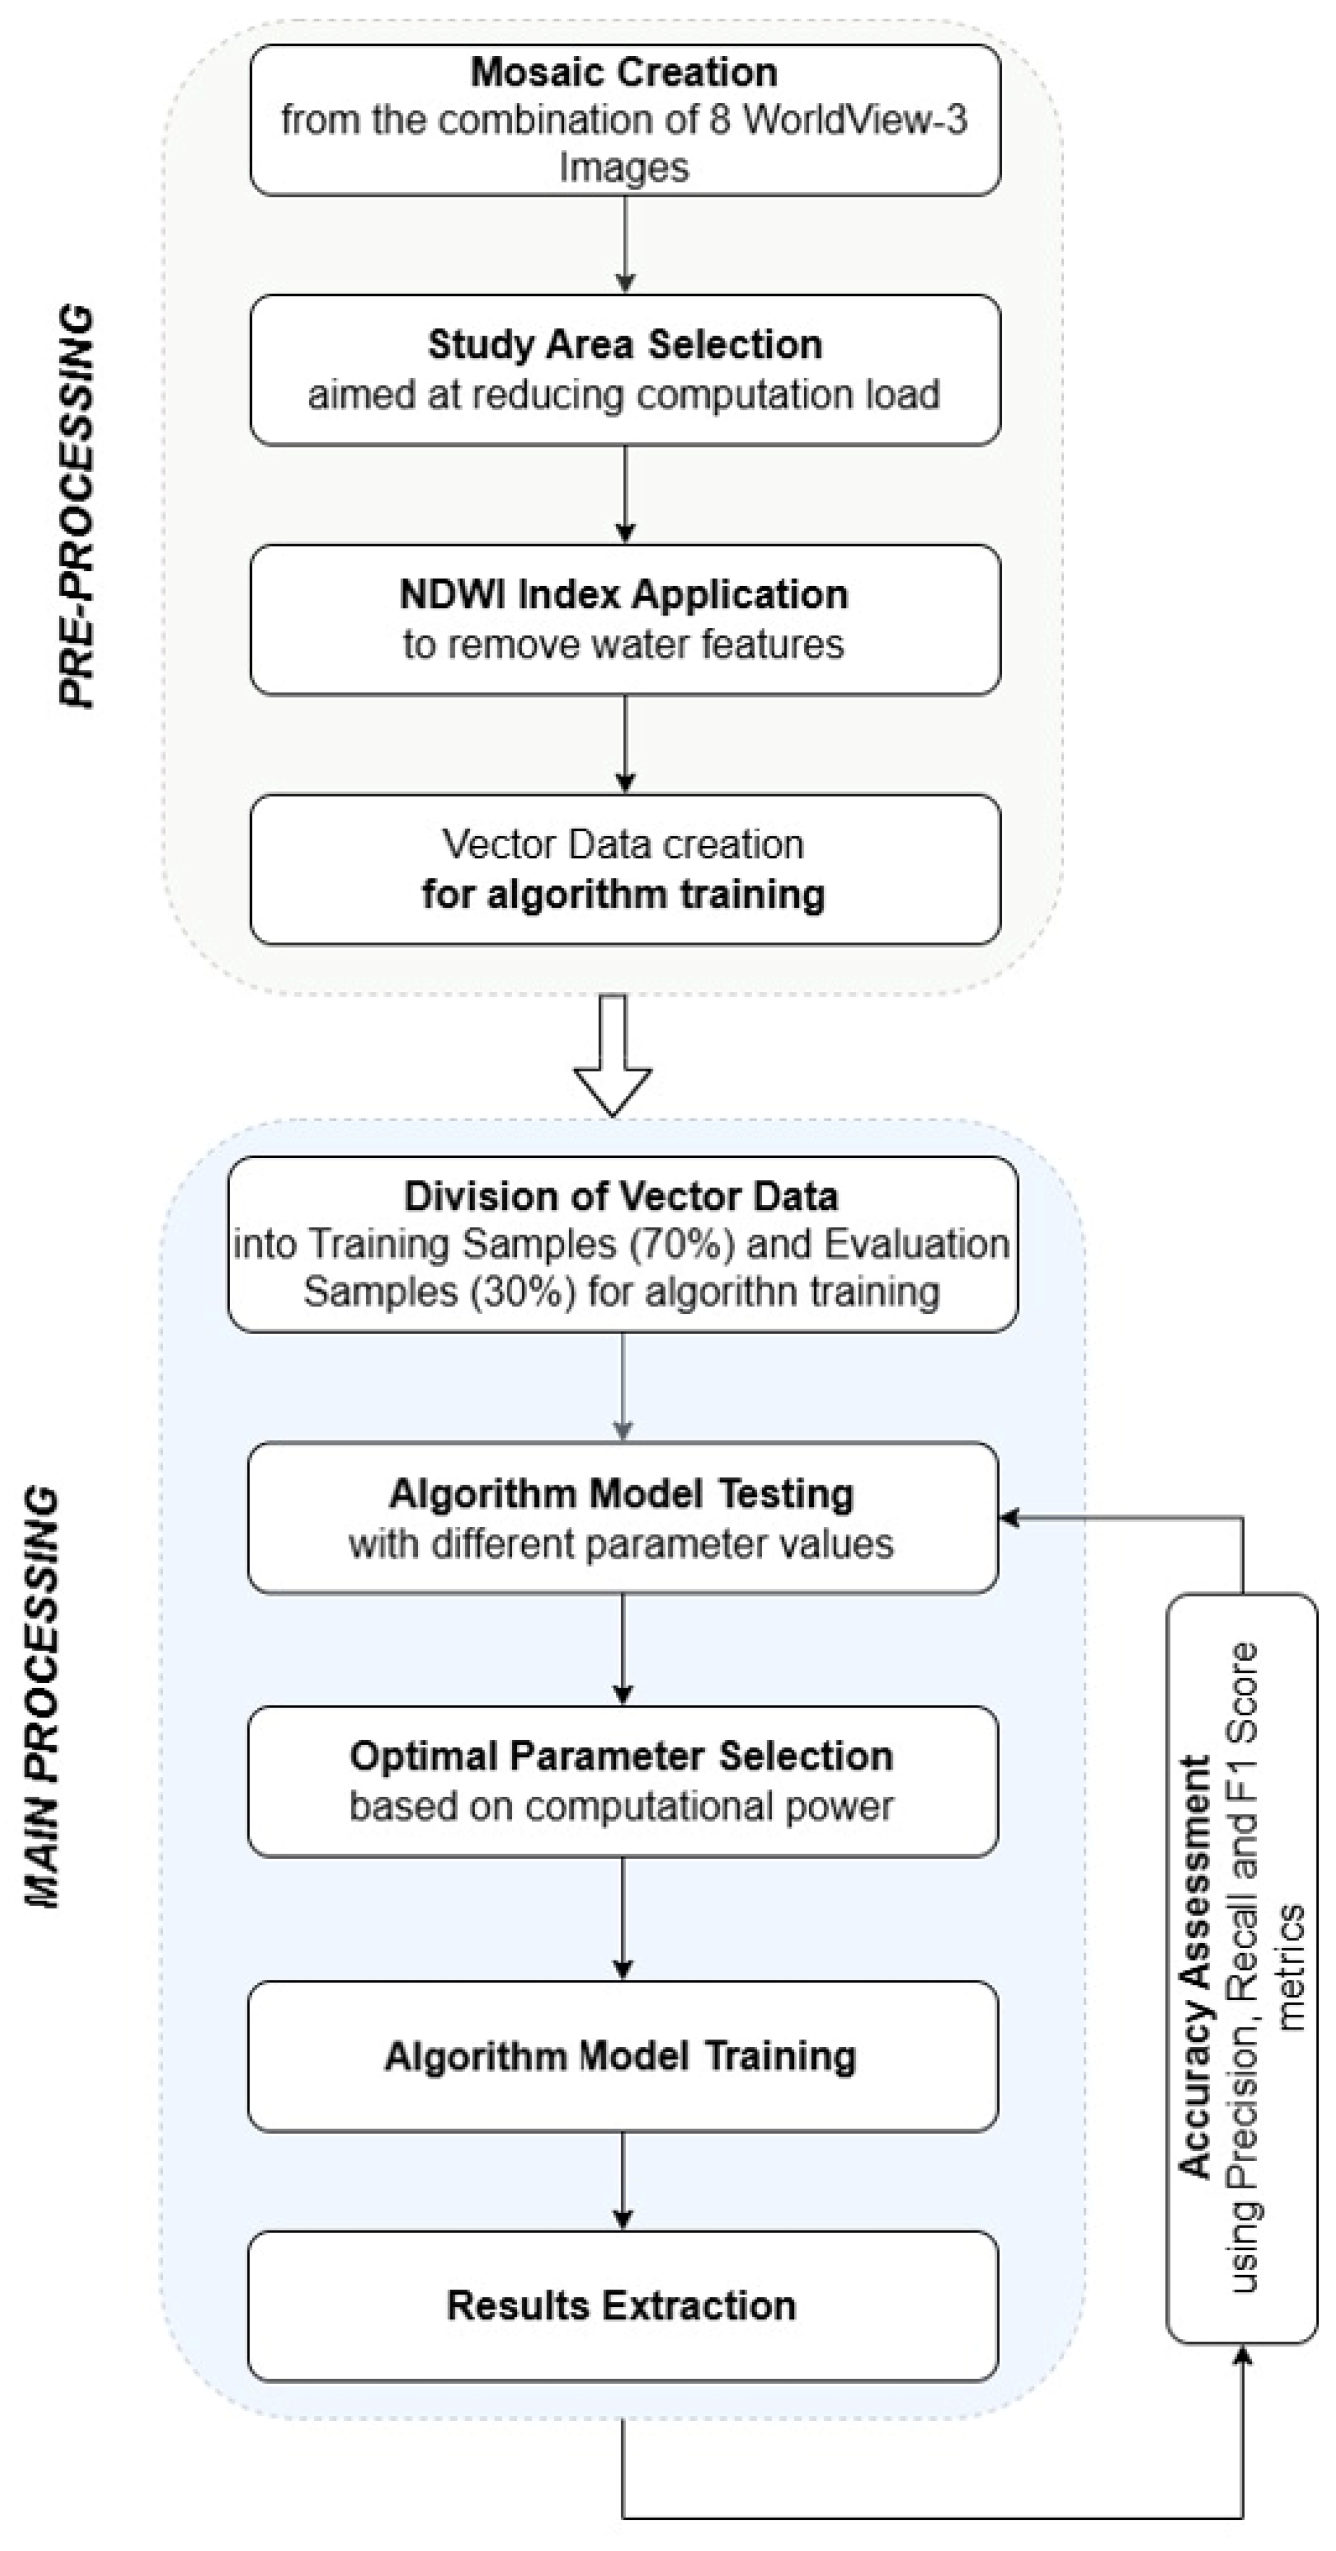
The methodology followed in this study included three main stages. In the first stage, data pre-processing was carried out to define the study area and prepare the training data for the deep learning models. In particular, a mask was applied to remove the water bodies to reduce the data volume, while polygonal vector data were created, which were the main data volume for the model’s execution. In the second stage, the computational model was parameterized to optimize its performance, taking into account constraints, such as available computing power. In the third and final stage, the model was evaluated based on several parameters, such as the variables’ F1 Score, Average Precision (AP), mean Average Precision (mAP), and the Precision–Recall curve. An overview of the methodological steps employed herein are presented in the following figure (
Figure 2).
The process was implemented using the ArcGIS PRO 3.0.3 geographic information system and ENVI v.5.2 software, which provided the necessary tools for data analysis and processing.
3.1. Pre-Processing
The data pre-processing process involved creating a mosaic of eight satellite images to produce a single file with four spectral channels (R, G, B, and near infrared) and high spatial resolution. The island of Delos was then selected as the study area, with emphasis on areas of archaeological interest. To reduce the computational burden, this area was isolated and a mask was applied to remove the marine areas that were not relevant to the purpose of this study, using the Normalized Difference Water Index (NDWI) which is a remote sensing index used to identify water.
The processed file was further divided into four sub-images, covering different areas of Delos, in order to facilitate model training and evaluation experiments. This process was implemented through ENVI Classic software.
In addition, vector polygonal data were created, based on the neighbouring areas of Delos, as described in the literature and from the findings of archaeological excavations. These data included a total of 1675 polygons, which correspond to buildings or rooms that have been excavated. These polygonal data were used to train the ML model. The distribution of polygons by area is shown in
Table 2.
3.2. Main Processing
The main data processing involved the development and parameterization of the deep learning algorithmic model, utilizing the mosaic and vector files resulting from the pre-processing stage. The algorithm used was Mask R-CNN [
14], an advanced type of convolutional neural network (CNN) suitable for the object instance segmentation technique. This model was chosen due to its ability to detect and classify objects on satellite images accurately.
Initially, the vector data generated during pre-processing were divided into training (70% of the total) and evaluation (30%) samples. Due to computational power limitations, multiple experiments were conducted on portions of the mosaic file created based on the spatial layout of the districts of Delos. The aim of this process was to optimize the performance of the model and to understand the behavior of the computational system.
During model training, the following key variables were tested and parameterized [
23]:
NUMBER OF EPOCHS (EPOCHS): the maximum number of iterations during model training, which determines the number of times the dataset is passed through the neural network.
BATCH SIZE: The number of training samples processed at a time. Increasing this variable can improve performance, but requires increased computational resources (e.g., more powerful GPU and RAM).
BACKBONE MODEL: The architecture of the pre-trained neural network used to train the new model, applying the Transfer Learning technique.
FREEZE/UNFREEZE MODEL: Determines whether the weights and bias of the backbone remain constant or are adjusted during training. The unfreeze option requires more processing time, but can lead to better results.
VALIDATION SPLIT: The percentage of the training sample used to validate the model.
In addition, data augmentation was performed by applying different viewing angles to the data (e.g., 0°, 90°, etc.) in order to improve the generalization of the model. The observations from these experiments determined the final implementation parameters of the algorithm, which were applied across the study area that included excavated structures.
Table 3 shows the training parameters of the algorithmic model for each experiment. These parameters were determined taking into account both the requirements of the methodology and the available resources in order to study and compare the results.
3.3. Accuracy Assessment
The last stage of the methodology concerned the evaluation of the accuracy of the ML algorithm, regarding its ability to identify buildings and building rooms in the given training model. This process was based on three main variables, which are described below [
6,
19,
24,
25,
26].
3.3.1. Precision
The
Precision variable calculates the ratio of correctly identified buildings or rooms (
True Positives) to the total number of objects classified as
True Positives and False Positives. It is expressed by the following formula:
This metric captures the accuracy of the modelling, showing how well correct categories are identified against false negative classifications.
3.3.2. Recall
The
Recall variable is calculated as the quotient of the number of truly correct identified buildings or building rooms (
True Positive), divided by the sum of the number of truly correct (
True Positive) and false
positive (
False Positive) identified buildings and building rooms.
3.3.3. F1 Score
The third variable is the F1 Score, which is essentially the average of
Precision and
Recall, evaluating the overall performance of the model. It is calculated as
The F1 Score takes values from 0 to 1, with a value of 1 representing ideal model performance, where both accuracy and recall are excellent [
25].
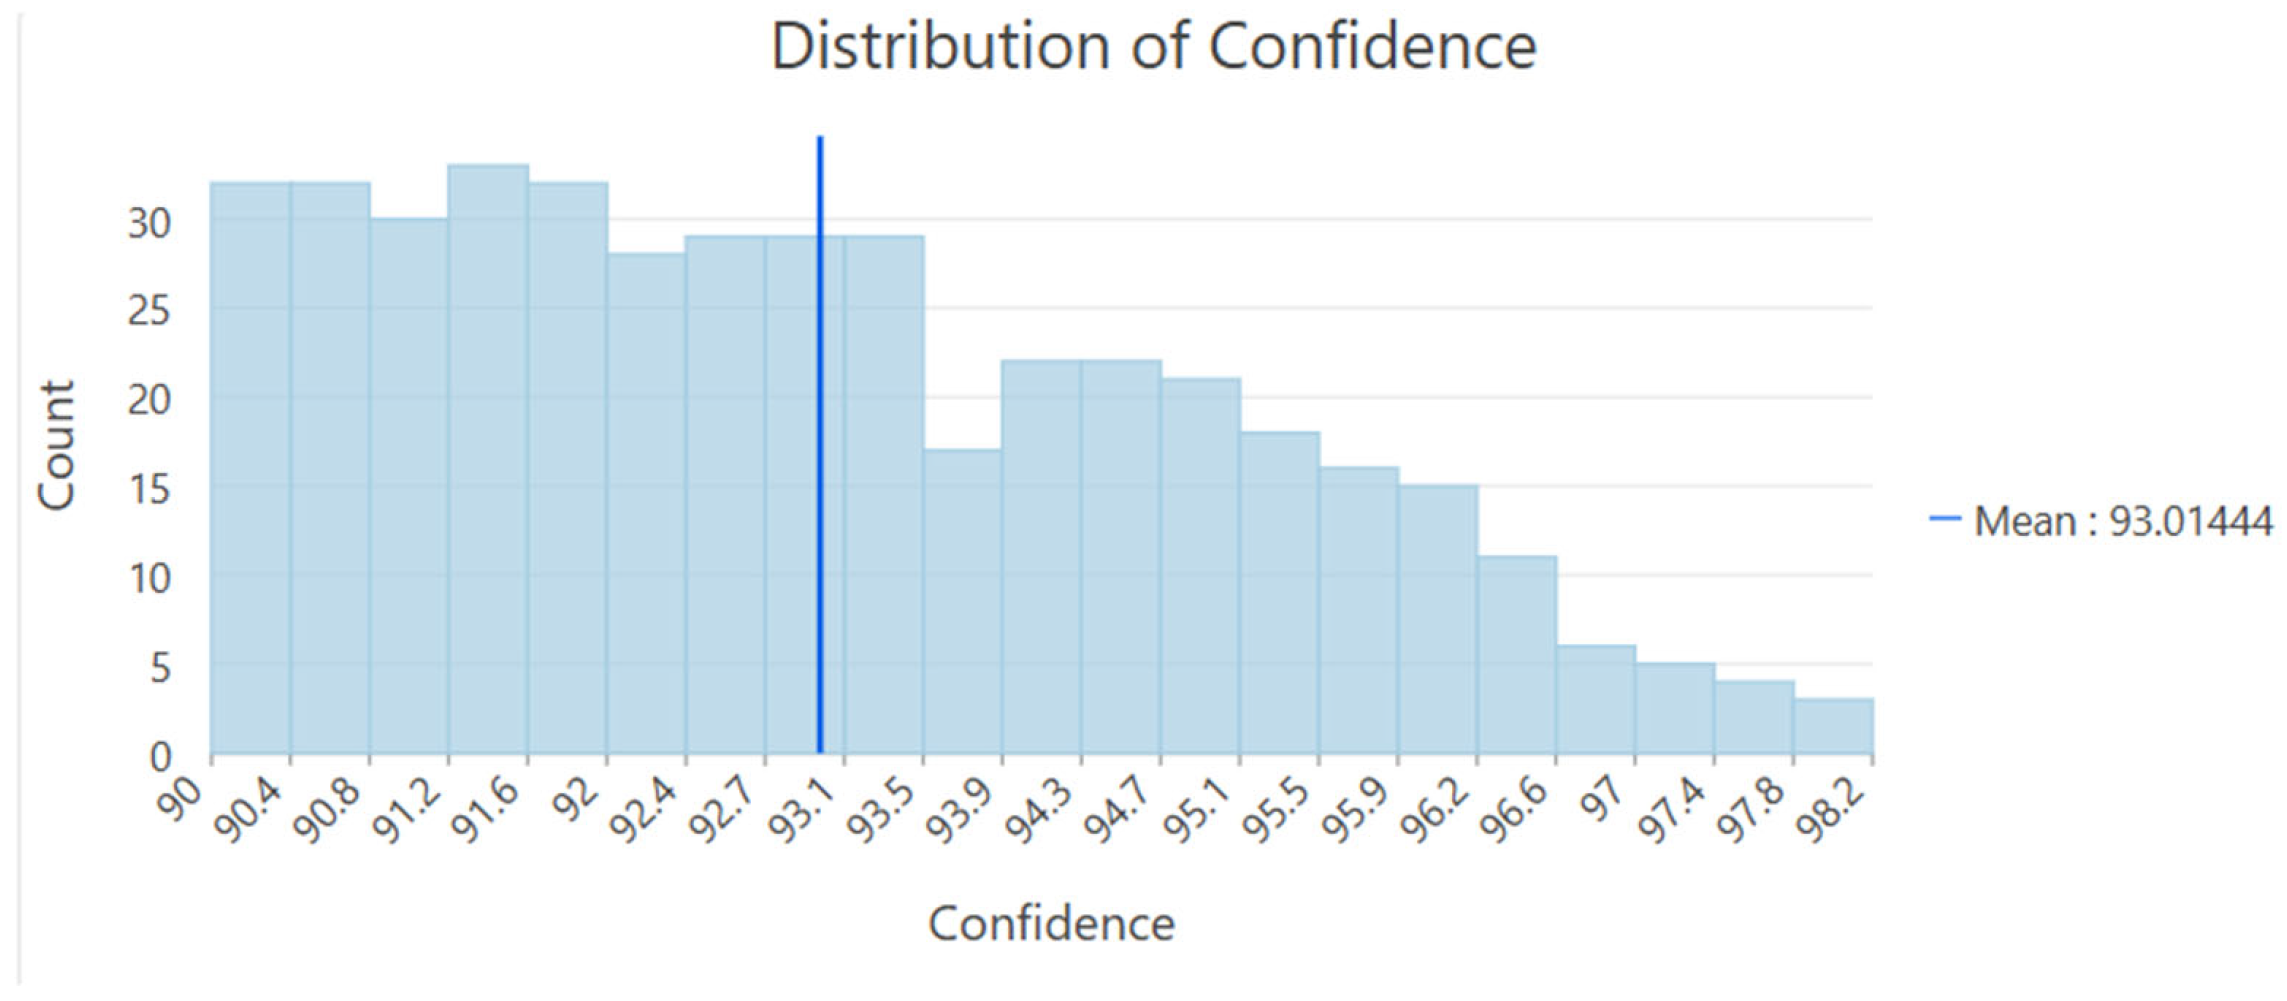
In addition to the above three basic indicators, the ArcGIS Pro geographic information system, which was used to implement this model, applies additional indicators to assess accuracy. These include Average Precision (AP), COCO mean Average Precision (mAP), and a Precision × Recall curve. The combination of these metrics provides an overall assessment of the performance of the model, expressed as the Distribution of Confidence in the Results.
4. Results
In the context of this study’s objectives, different models were run, with variations in their parameters, to better understand the functionality of the MASK R-CNN algorithm and the capabilities of the computer system used for running the algorithmic model for small- and large-scale applications. The results of the applications, detailed in
Table 4, were very encouraging, considering that the analysis was based on the predefined parameters of the ML system ArcGIS Pro 3.0.3. These parameters were chosen mainly due to low power of the computing system used. For the F1 Score parameter, a tolerance range (threshold), with values from 0.7 to 0.9, was defined on a case-by-case basis. In all cases, the F1 Score—identification success rate of the absolute number of ancient buildings and rooms of ancient buildings that it was able to identify—was 0.80% and above.
The final model, which was applied to the entire area of interest, was based on the following parameters, which were considered optimal. More specifically, training data based on zero degrees of view, i.e., the actual geographic dimension of the geospatial mosaic (raster) file, were used. The Epochs variable was set to 20, the Batch Size to 4, and the Backbone Model was set to ResNet-50 (pro.arcgis.com). The total execution time of the algorithm was 1 h, 33 min, and 47 s. All of the above are listed in the table below (
Table 5).
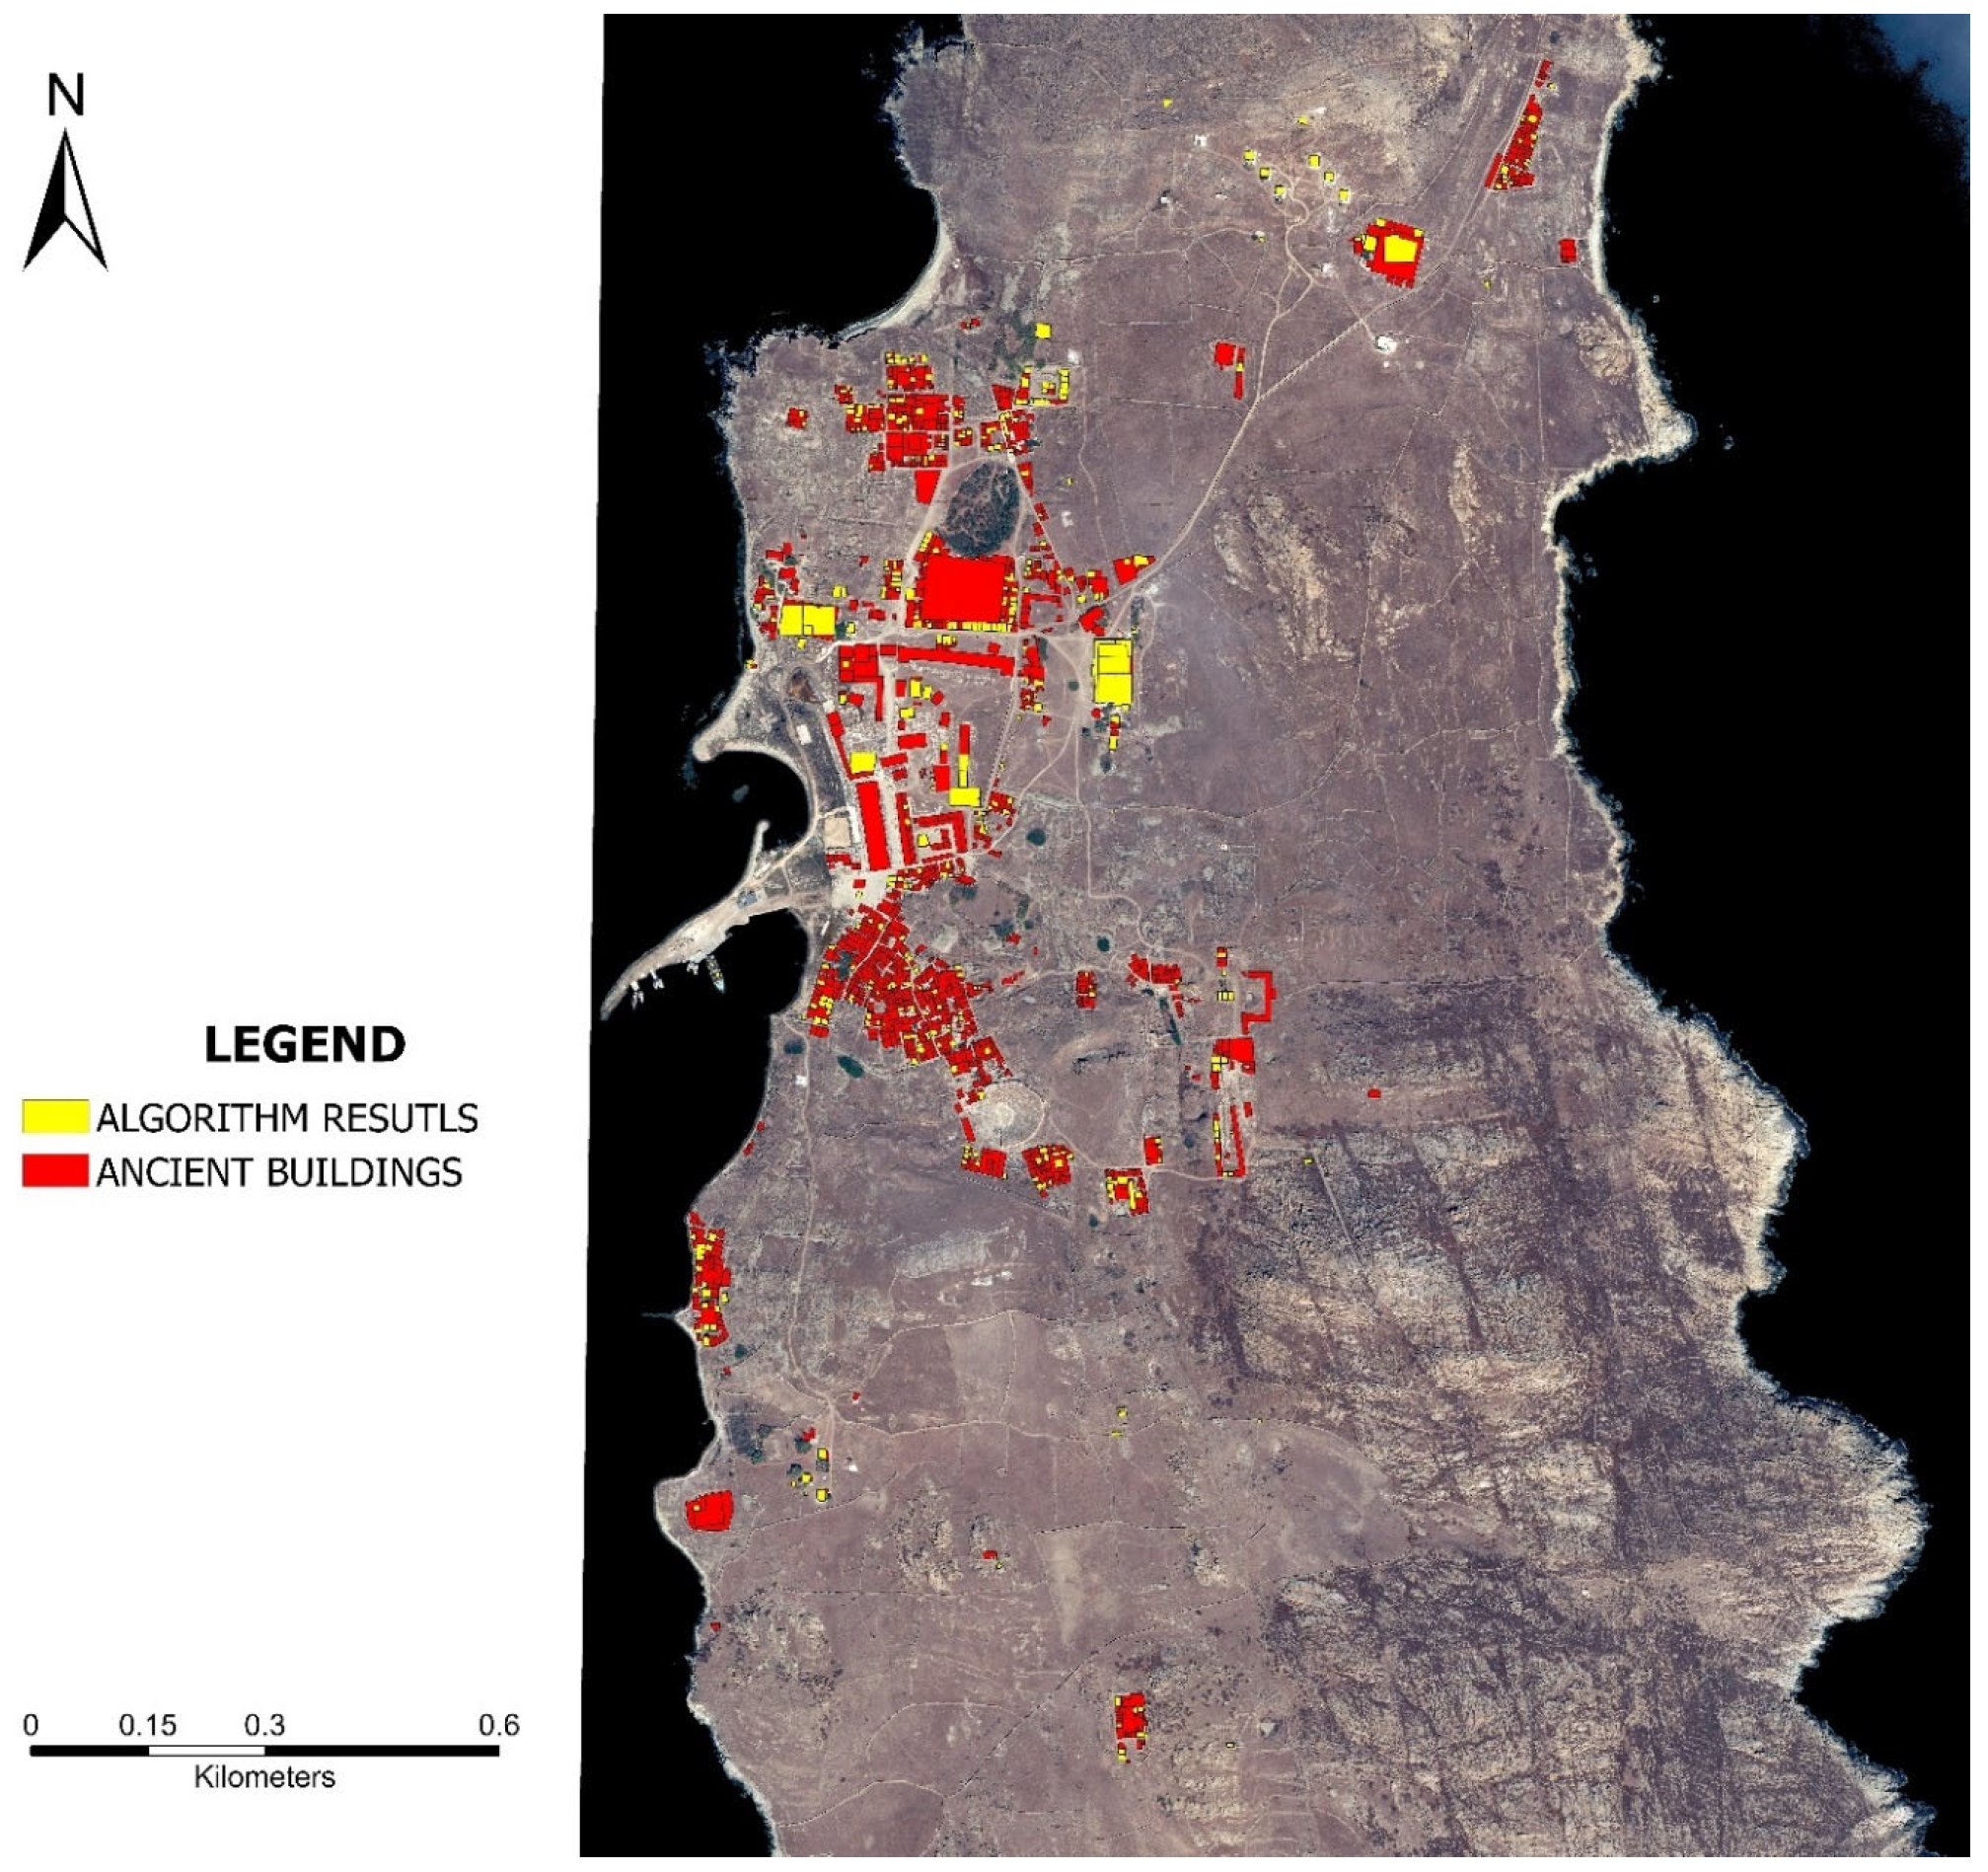
The result that the training of the model gave us after the period of 48 min and 31 s that it took for its elaboration, reveals that out of the total of 1675 manually recorded polygons (houses and rooms of the ancient constructions on the island of Delos) that were initially entered into the system, it classified 434 of them (
Figure 3). The tolerance range (threshold) was set at 0.9, yielding an F1 Score of 0.93 (
Figure 4) for the correctly identified buildings and rooms of the ancient structures.
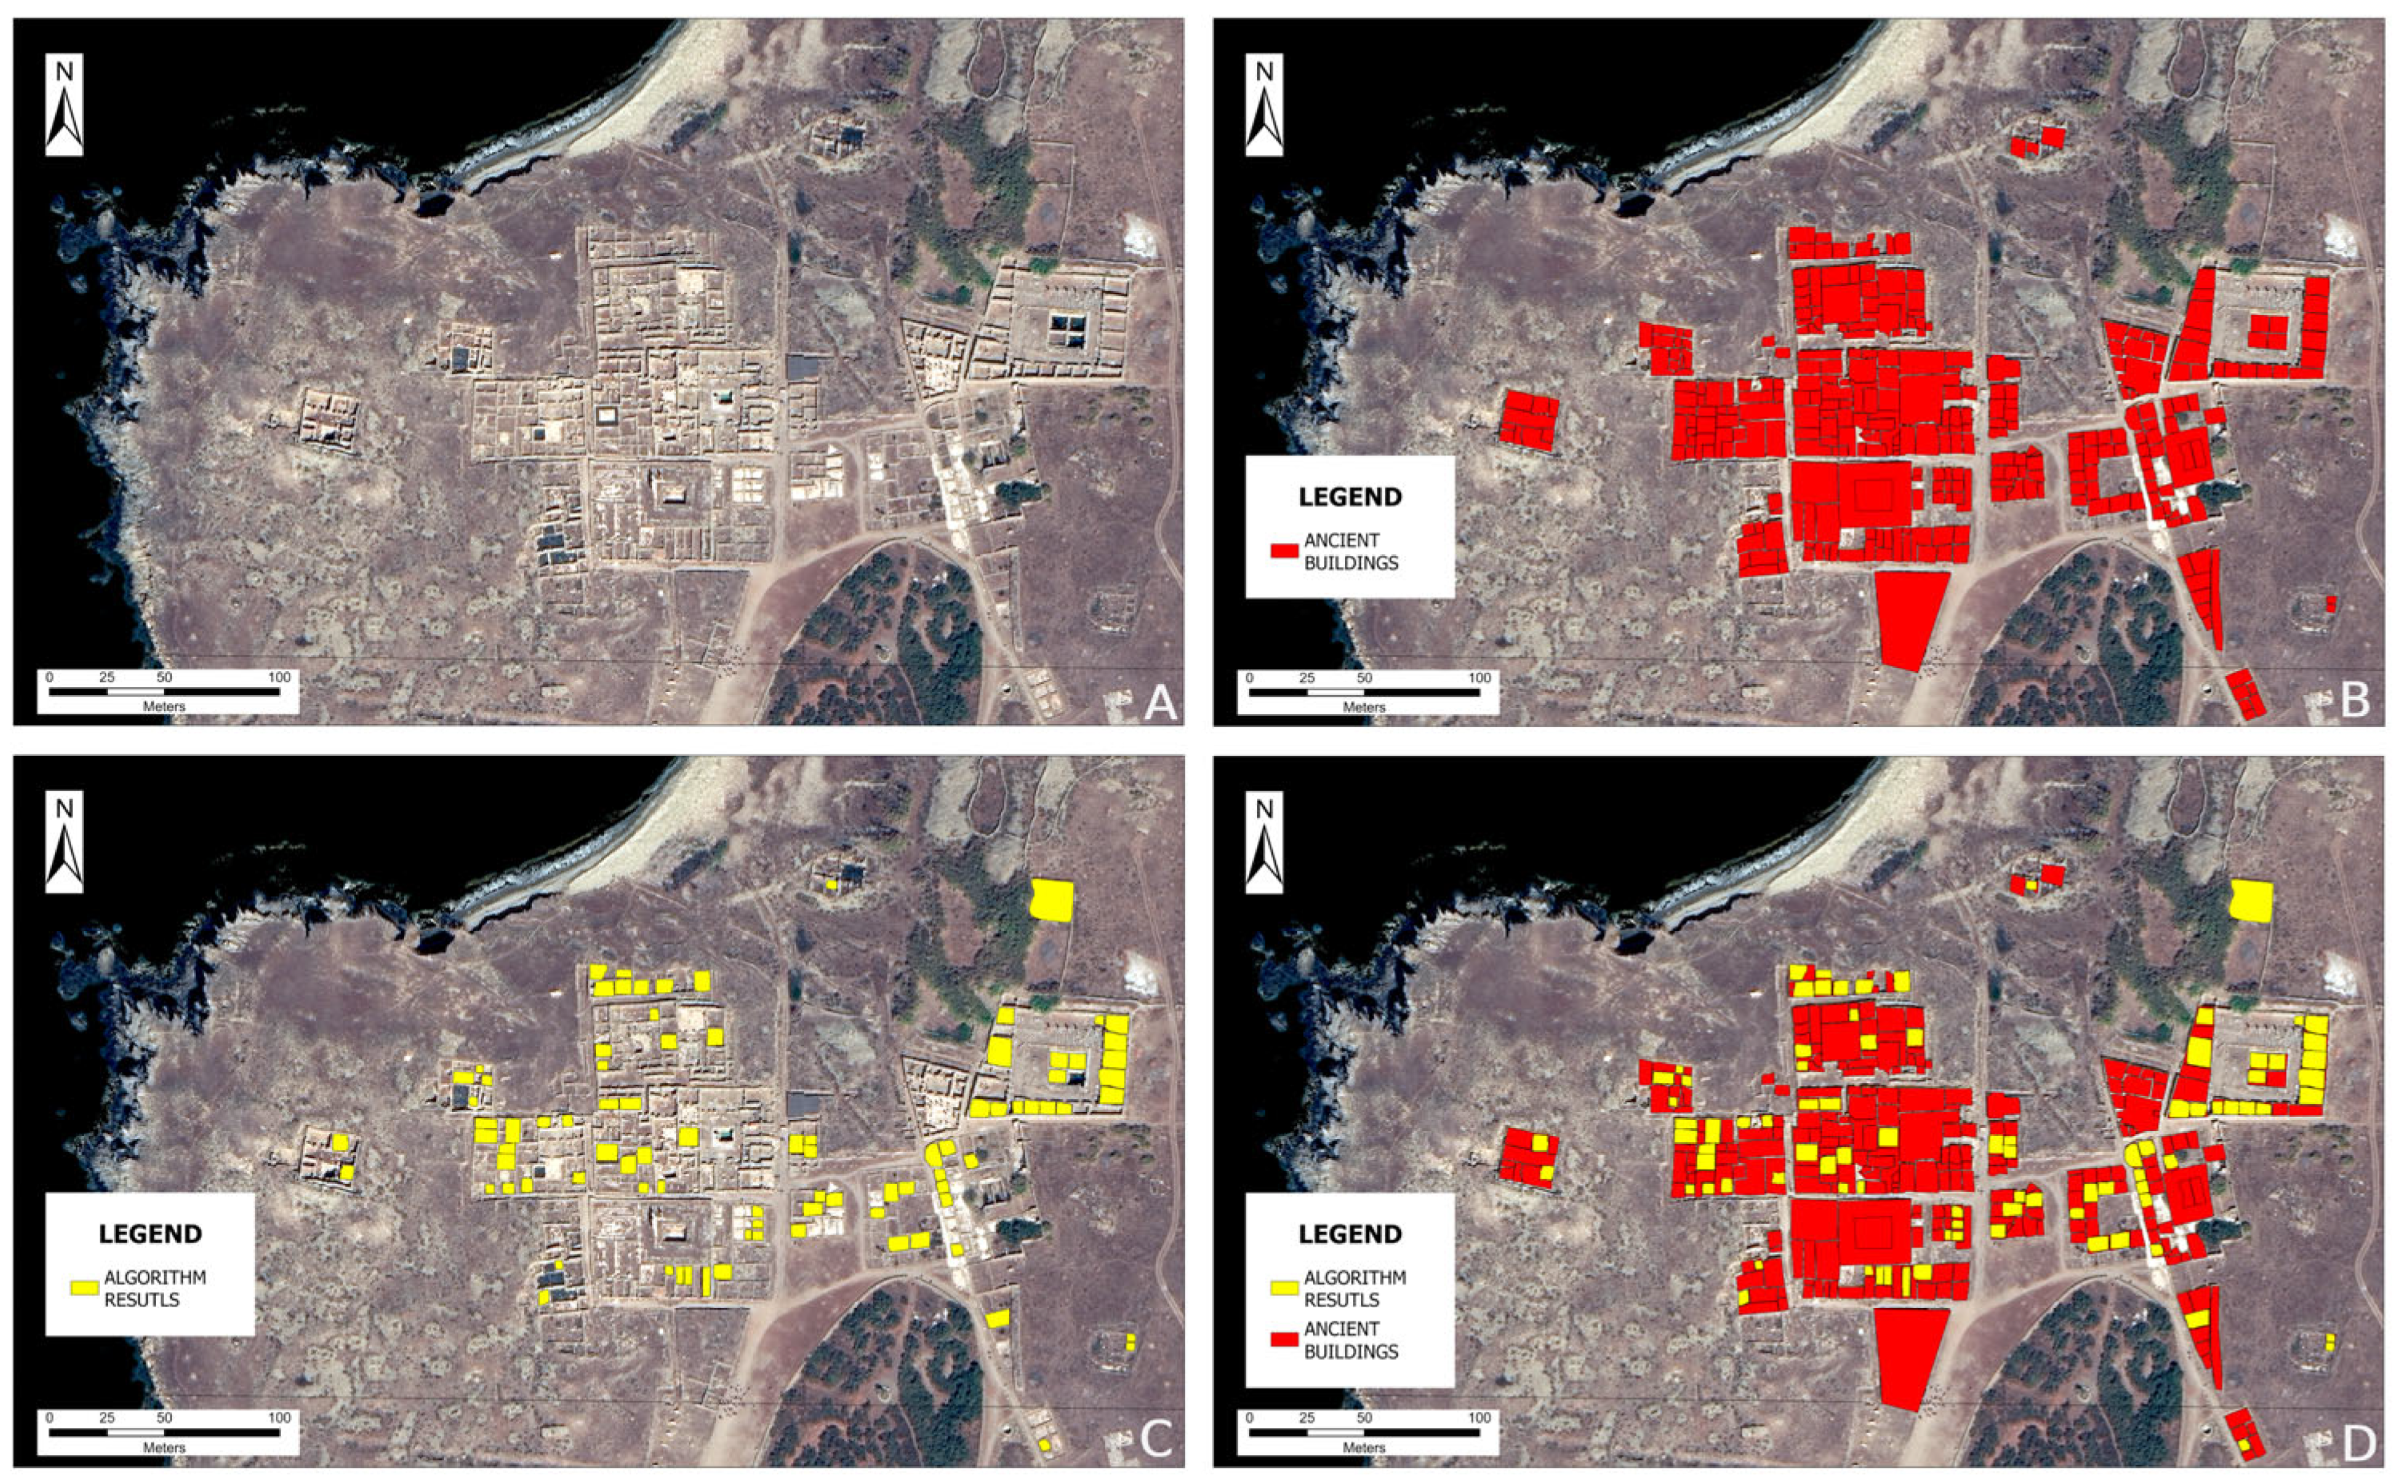
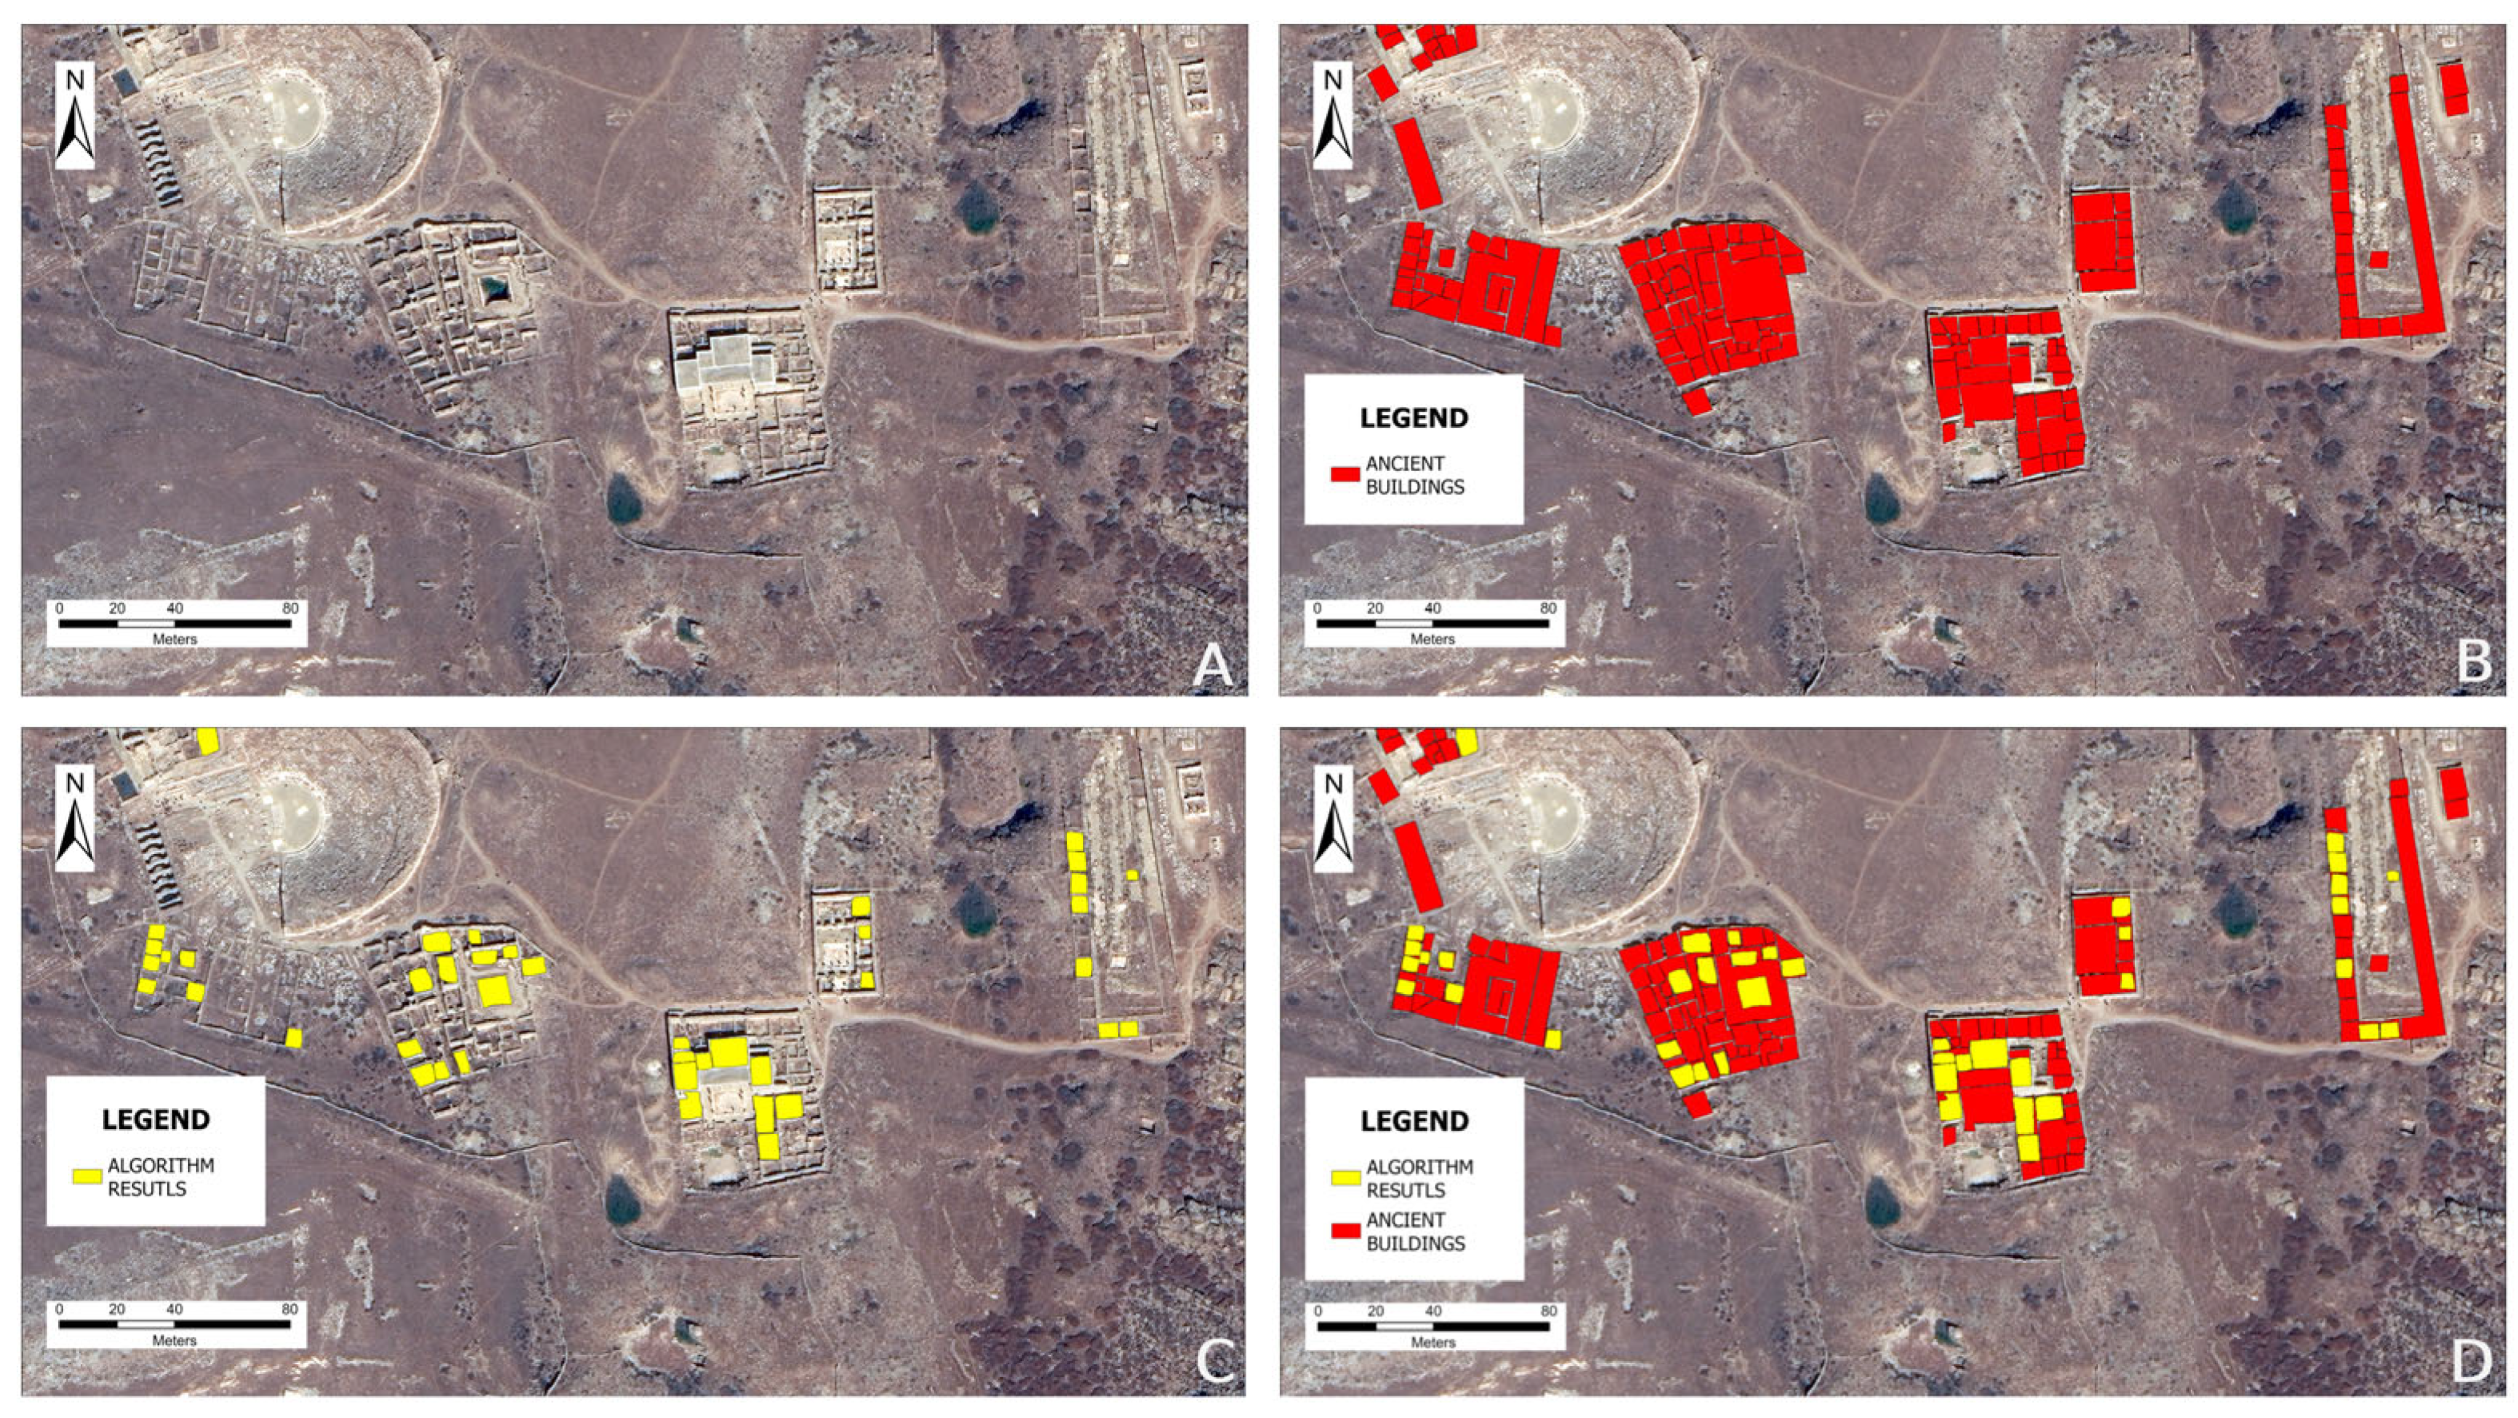
Three individual parts of the final model are presented below, which demonstrate the effectiveness of the MASK RCNN ML algorithm, even in computationally limited environments. The results for the selected regions are summarized in
Table 6.
From the results, it is observed that in all the cases selected for visualization, the algorithm successfully identified truly correct buildings—houses in a ratio approaching 30% compared to the original, manually recorded polygons of the houses and rooms of the ancient structures that were entered into the system. This is significant, as it highlights the consistency of the algorithm at recording ancient buildings in the study area, despite the limitations of the computational system used. It is also interesting to note that in some cases, the algorithm identified buildings that were not previously entered into the system, which reinforces its reliability (
Figure 5A–D).
Table 6.
Results of the main model’s application to specific sub-regions corresponding to the ancient neighbourhoods of Delos.
Table 6.
Results of the main model’s application to specific sub-regions corresponding to the ancient neighbourhoods of Delos.
| Cases | Existing Buildings | Recognized Buildings | Proportion (%) |
|---|
Case 1
(Figure 6) | 332 | 90 | 27.11 |
Case 2
(Figure 7) | 65 | 19 | 29.23 |
Case 3
(Figure 8) | 147 | 44 | 29.93 |
5. Discussion
The present study aimed to train an algorithmic model capable of identifying ancient structures on the island of Delos. The training results indicate that the model successfully met its objective, identifying a significant percentage of the buildings and rooms of ancient structures, utilizing high-resolution satellite imagery (WorldView-3). Specifically, the model identified 434 polygons out of the 1675 included in the original vector file. With a tolerance threshold, it yielded an F1 Score of 93% correctly identified buildings. The results confirm that the MASK RCNN convolutional neural network, using the automated functions of ArcGIS Pro 3.0.3 software, is capable of identifying and separating archaeological objects from the rest of a geographic background.
In the last decade, there has been a rapid increase in the use of new technologies in the field of archaeology. Tools, such as unmanned aerial vehicles (UAVs), remote sensing data, and LIDAR technologies, have provided high-resolution cartographic data, which have been incorporated into ML models. This methodology, as demonstrated in this paper, has brought significant benefits, saving time and resources. Some examples related to the aforementioned are the following. Caspari and Crespo [
10], in their study, applied the Hough forests technique to high-resolution satellite imagery to record burial mounds, highlighting the plethora of pattern detection techniques for archaeological object detection. Soroush et al. [
3], using ML techniques, were able to identify extensive ancient water supply systems in the region of modern Iraq. Guyot et al. [
17] used ML techniques on LiDAR data, resulting in the detection and segmentation of sites of archaeological interest in the South Morbihan region (Brittany, France). In 2022, Fiorucci et al. [
6], in Gelderland, The Netherlands, investigated the application of CNN models by applying new techniques to the identification of sites of archaeological interest in order to simplify and improve the interaction of the archaeological sector with ML models.
The results of the present research, compared to other similar applications of ML methods for the identification of archaeological patterns in high-spatial-resolution geographic backgrounds (such as satellite imagery, LIDAR geographic backgrounds, etc.) [
5,
16,
19,
27], can be considered relatively limited. The reason is that most studies have used semi-automated algorithms tailored to the particular field of research, with very computationally powerful hardware and, in many cases, significant logistical resources. However, comparing the results based on the F1 Score index, the present study achieved a 93% true positive in terms of the number of ancient buildings and rooms of ancient buildings that the algorithm identified. Comparing the results with those of other studies [
5,
16,
19,
27], it is evident that they are consistent with them. This reinforces the view that, firstly, the automated ML functions implemented by ArcGIS Pro software yielded encouraging results, even with the default settings. Secondly, applying the model developed in this study using more powerful computing systems and utilizing semi-automated techniques—as far as the level of parameterization of the algorithmic model is concerned—would likely produce even better results.
It should be noted that some annotated polygons were not detected, mainly due to computational limitations. The model was trained on a low-power system using the default parameters, which limited its optimization. Further improvements would require larger training datasets or data augmentation techniques, such as rotation, which were not feasible in this setup. Additionally, the lack of standardized digital archaeological pattern libraries limits its broader generalization. As such, the current approach should be seen as a supportive analytical tool that enhances—but does not replace—traditional archaeological workflows.
However, this study also has some limitations. One important limitation concerns the high computational requirements associated with training deep learning models. The use of powerful graphics processing units (GPUs) and a large RAM memory is necessary to process the huge amount of data. In this work, the limited capabilities of the available computing system did not allow for the implementation of more complex models. As a result, training was limited to the basic settings of the ArcGIS Pro software. Despite these limitations, the model yielded encouraging results, indicating that the use of more powerful systems could lead to even more accurate predictions.
A second limitation concerns the lack of electronic data libraries and the impossibility, so far, of creating archaeological patterns. The absence of electronic libraries of archaeological patterns makes it difficult to parameterize and automate algorithms for wider applications. The training of ML models is highly dependent on the quantity and quality of the available data, which limits their potential in archaeological research.
It is also important to acknowledge that differences in geographical settings, architectural typologies, and preservation conditions across archaeological sites may affect the performance and adaptability of the model. These variations could require site-specific retraining and parameter tuning to maintain detection accuracy. Addressing such contextual challenges will be essential in future efforts to expand this method’s applicability.
6. Conclusions
The present study focused on the detection and segmentation of ancient buildings and building rooms as they appeared on a high-spatial-resolution satellite image of the island of Delos. Using the ML algorithm MASK RCNN, and the automated procedures of ArcGIS Pro 3.0.3 software, the identification and recording of a significant proportion of the archaeological structures in the study area was achieved. In particular, the model managed to identify 25.91% of the requested objects, yielding an excellent accuracy, with an F1 Score of 0.93%. These results underline the innovative contribution of this research, showcasing the potential of integrating AI with high-resolution remote sensing data for archaeological applications. This methodology demonstrates a novel combination of advanced ML algorithms and Earth Observation data to address the challenges of automated feature identification in complex archaeological landscapes, saving time and material resources.
This work demonstrates the important contribution of artificial intelligence to the science of archaeology, utilizing high-spatial-resolution data for the accurate identification of structures of archaeological interest. The combination of algorithmic ML models with remote sensing data results in the analysis of a field of interest from a distance, often involving automated or semi-automated applications. While such methods are not a substitute for field observation, they are complementary to traditional archaeological investigations, enriching scientific knowledge and reducing field expenditures. Although the specificity of archaeological remains, with their diversity and complexity, makes it difficult to create standardized patterns and data, this work demonstrates how the development of specific data libraries could enhance the parameterization and effectiveness of algorithms in similar investigations.
Furthermore, while the methodology developed in this study was not originally designed with direct replicability in mind, it holds potential for application to other archaeological case studies with similar characteristics. By appropriately adjusting its parameters and conducting new training and validation cycles, the approach could be tailored to different geographical and archaeological contexts. However, this remains to be demonstrated through its practical application to additional cases. Therefore, its generalizability should be considered as a promising possibility rather than a confirmed outcome.
In parallel, the use of AI in archaeological research raises important ethical considerations. Although automated methods can significantly enhance the analytical capacity and reduce the need for extensive fieldwork, their outputs should never be accepted uncritically. The results must always be cross-validated and substantiated through expert archaeological interpretation and, crucially, through on-site investigation. This will ensure both the scientific integrity of the findings and the responsible application of AI-driven technologies in cultural heritage contexts.
The research results and the generated data, such as shapefile files, could be used in future applications for other archaeological sites, enhancing the use of ML in the field of archaeology. In addition, future work could focus on integrating more powerful computing systems and more complex algorithmic models to further improve the accuracy of the results. Such developments could enable the detection and mapping of surface antiquities for large areas, while exploiting high-spatial-resolution mapping backgrounds.


