1. Introduction
Landslides, as a common geological hazard, are characterized by sudden occurrence, significant destructive power, and extensive impact areas, posing severe threats to human life, property security, and socioeconomic development [
1,
2,
3]. In Japan, landslides frequently occur during the rainy summer season [
4,
5], and rainfall often triggers secondary landslides [
6], posing significant risks to emergency response operations. Therefore, rapidly and accurately obtaining real-time conditions of landslide sites, clarifying landslide formation mechanisms and failure modes, and predicting subsequent stability are crucial for conducting effective rescue operations. To capture the spatiotemporal distribution characteristics and failure morphology of landslides, 3D reconstruction of landslide bodies is required to obtain precise terrain information, which also plays an essential role in governmental decision-making and early warning of secondary hazards [
7,
8].
In slope engineering, traditional 3D reconstruction methods can be broadly classified into two categories [
9]: geodetic surveying techniques and remote sensing technologies. Geodetic surveying techniques, represented by total stations [
10] and terrestrial laser scanners (TLS) [
11], can achieve highly accurate reconstruction results. However, these instruments are complicated to operate, inconvenient to transport, and challenging to deploy in the complex terrain conditions following landslides. Airborne LiDAR scanners [
12], a type of remote sensing technology, offer flexible operation and can rapidly construct high-precision 3D models. LiDAR measures distances by emitting and receiving reflected laser pulses. Its key advantage lies in its ability to penetrate vegetation canopies and capture sub-canopy terrain data, enabling the generation of accurate bare-earth digital elevation models and the detection of hazardous features such as ground fissures. For this reason, LiDAR has been widely applied in landslide detection. However, they involve high data processing costs and expensive equipment, making large-scale adoption challenging. Additionally, a limited number of researchers have applied structured-light methods [
13] from remote sensing technologies for landslide disaster 3D reconstruction. Nevertheless, structured-light techniques depend on additional projection equipment and still present significant challenges for large-scale 3D reconstruction applications.
In recent years, with the rapid advancement of civilian unmanned aerial vehicles (UAVs), represented by DJI, UAV-based photogrammetric 3D reconstruction techniques have been widely adopted in the field of landslide disasters. UAV photogrammetry offers advantages such as low cost, high flexibility, high image resolution, and portability, providing efficient on-site data acquisition and accurate 3D reconstruction solutions for landslide disaster investigations. Gupta et al. [
14] utilized UAVs to reconstruct two landslides in Mandi district, Himachal Pradesh, Himalaya, and compared the results with total station measurements, finding errors within 5%. Zhao et al. [
15] performed detailed reconstruction of a landslide-affected area using close-range photogrammetry, obtaining precise information on surface crack development. Lucieer et al. [
16] employed multi-temporal UAV models to map the displacement of the slope toe, soil blocks, and vegetation patches at the top of a landslide. Gallo et al. [
17] conducted hazard assessments of rockfall disasters using UAVs, generated high-resolution point cloud models, and analyzed the morphological characteristics and fragmentation of rock blocks. Zhu et al. [
18] proposed a UAV photogrammetry-based method for interpreting rock mass discontinuities and early recognition of potential hazards, utilizing UAVs to acquire the discontinuity and spatial distribution characteristics of rock slopes. Zhu et al. [
19] utilized UAVs to assist emergency response by performing 3D reconstruction and investigation analysis of a rainfall-induced landslide event that occurred in Guangzhou, China, in July 2022.
Although UAV photogrammetry provides high-accuracy 3D reconstruction, the data processing phase demands substantial computational resources, leading to prolonged reconstruction times. Given the urgency during the emergency response phase following a landslide event, speed and efficiency should be prioritized. In recent years, Neural Radiance Fields (NeRF) [
20], a novel 3D reconstruction technique, has gradually shown a trend toward replacing traditional photogrammetry due to its efficiency and high-quality reconstruction results. NeRF employs implicit neural representation, leveraging a multilayer perceptron (MLP) network to learn the 3D geometry and appearance information of a scene, subsequently generating high-quality novel-view images via volume rendering techniques. Compared to traditional methods, NeRF can significantly accelerate reconstruction processes and provide rapid scene representation, demonstrating considerable advantages for emergency response applications. Croce et al. [
21] evaluated the application of NeRF and photogrammetric methods for three-dimensional reconstruction in the cultural heritage domain and found that NeRF trains far more rapidly than photogrammetry. Remondino et al. [
22] presented a critical analysis of NeRF-based 3D reconstruction techniques and compared them with conventional photogrammetric approaches; they reported that the Nerfacto method completes modeling on the test dataset in just 15 minutes, whereas photogrammetry requires four to six hours. Moreover, comparative studies of NeRF and photogrammetric methods in reconstructing the Panagia Karmoitissa Cathedral [
23] and other historic structures [
24] consistently demonstrate that NeRF achieves higher efficiency than photogrammetry. However, to date, there have been no reports of applying NeRF to 3D reconstruction for landslide disaster emergency response.
This study aims to comprehensively evaluate the performance of Neural Radiance Fields (NeRF) and traditional photogrammetry methods for 3D reconstruction of landslide disasters, and explore the potential of integrating these two approaches for landslide hazard investigations. This study takes a rainfall-induced landslide in Sasebo City, Japan, as a case study, employing UAV imagery data to perform reconstructions separately using both methods. A comparative analysis of the two methods is conducted regarding visual realism and point cloud detail of the generated models.
2. Case Study: Sasebo Landslide
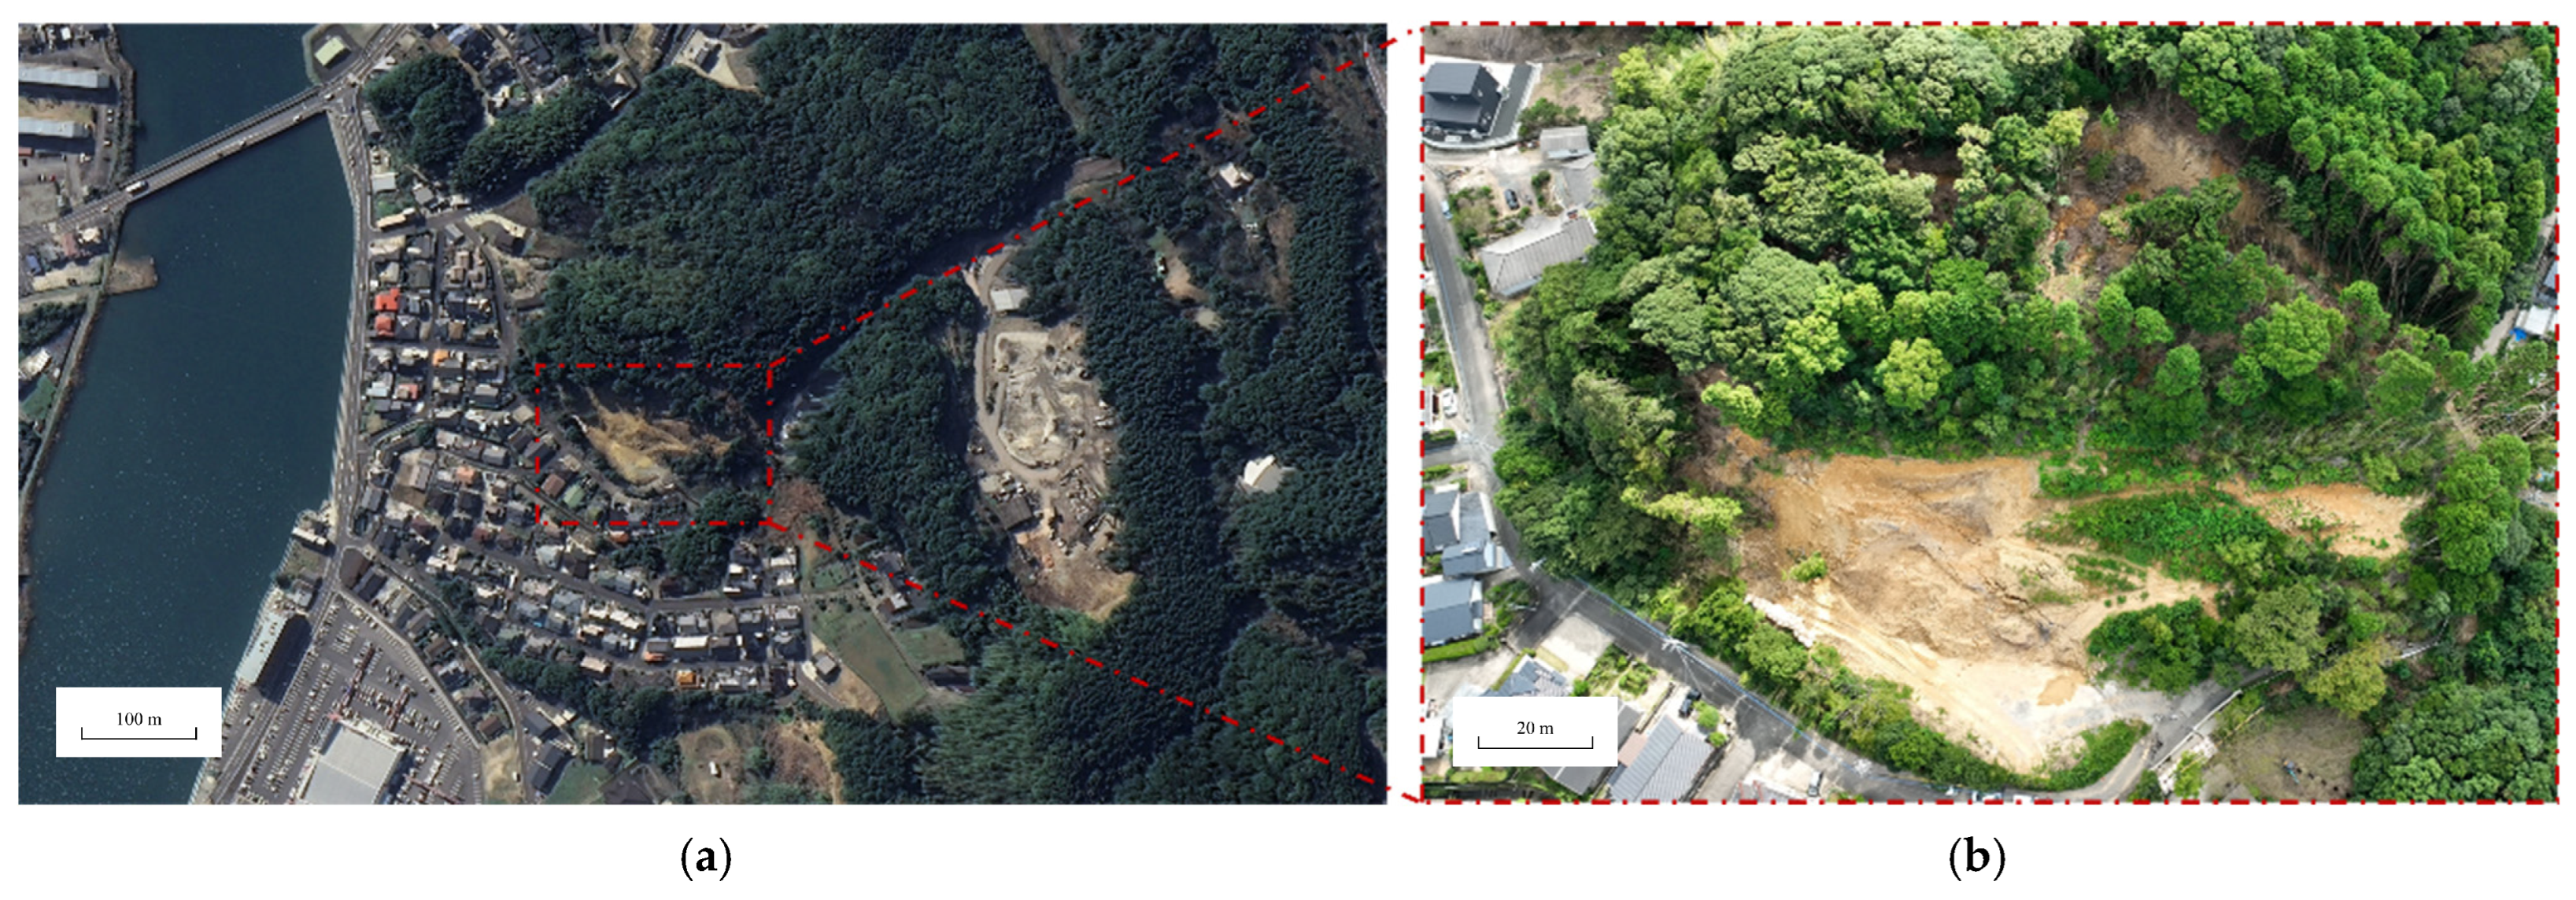
The case selected for this study is a landslide event that occurred in Sasebo City, located in the Kyushu region of Japan.
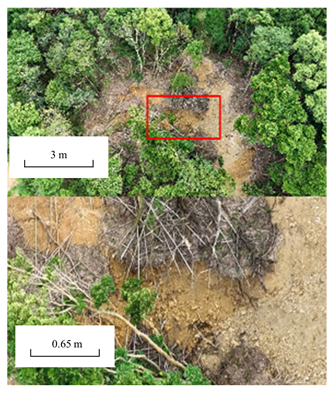
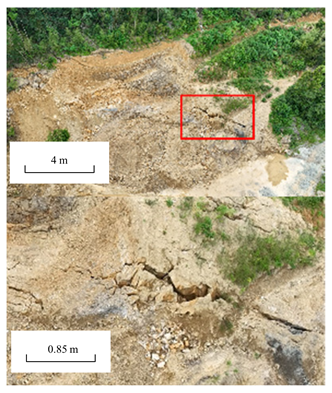
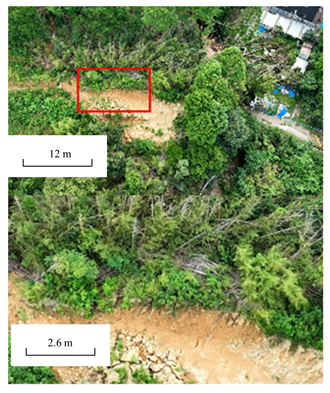
Figure 1 shows the landslide and its surrounding area: (a) is a satellite image taken in March 2023; (b) is an aerial photograph captured on 22 September 2023. The Sasebo landslide occurred during a heavy rainfall period from 13 to 17 September 2023, representing a case of slope failure triggered by intense precipitation; uninfiltrated water was observed along the front edge of the landslide mass. According to field investigations, the landslide deposit measured approximately 89 m in length and 109 m in width, and had a volume of nearly 103,800 m
3; additionally, the Tahara–Kuroishi Line in Sasebo City was obstructed by the event.
To obtain a 3D model of the landslide site, TEC-FORCE (Technical Emergency Control FORCE) personnel in the Kyushu region used a DJI Phantom4 Pro UAV to record two videos of the site at 30 frames per second, and subsequently generated a raw dataset through processing. The dataset comprises a total of 394 images, each with a resolution of 3840 × 2160. The UAV operated at a flight altitude of 35 to 52 m, and the average overlap rate was 84.2%. It should be noted that although TEC-FORCE personnel possess extensive experience in responding to natural disasters, they are not experts in aerial surveying or 3D reconstruction. Consequently, the on-site video capture was not conducted in accordance with standard photogrammetric protocols—a point that will be further elaborated in the discussion section.
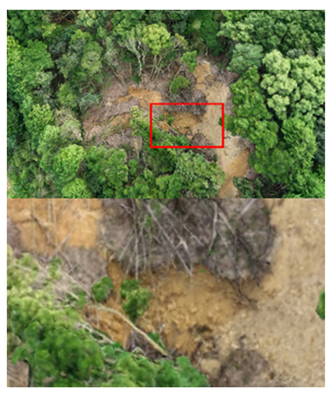
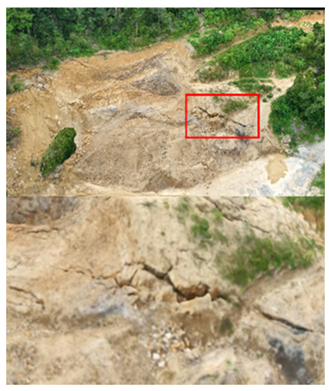
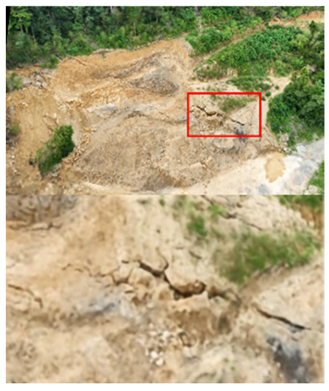
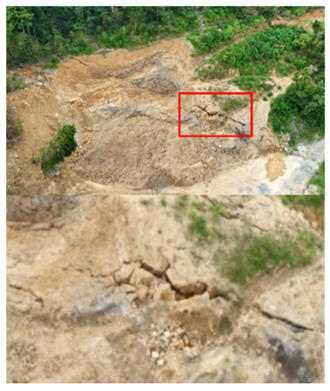
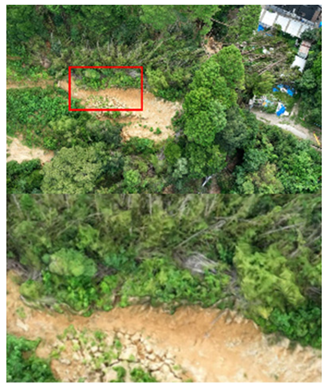
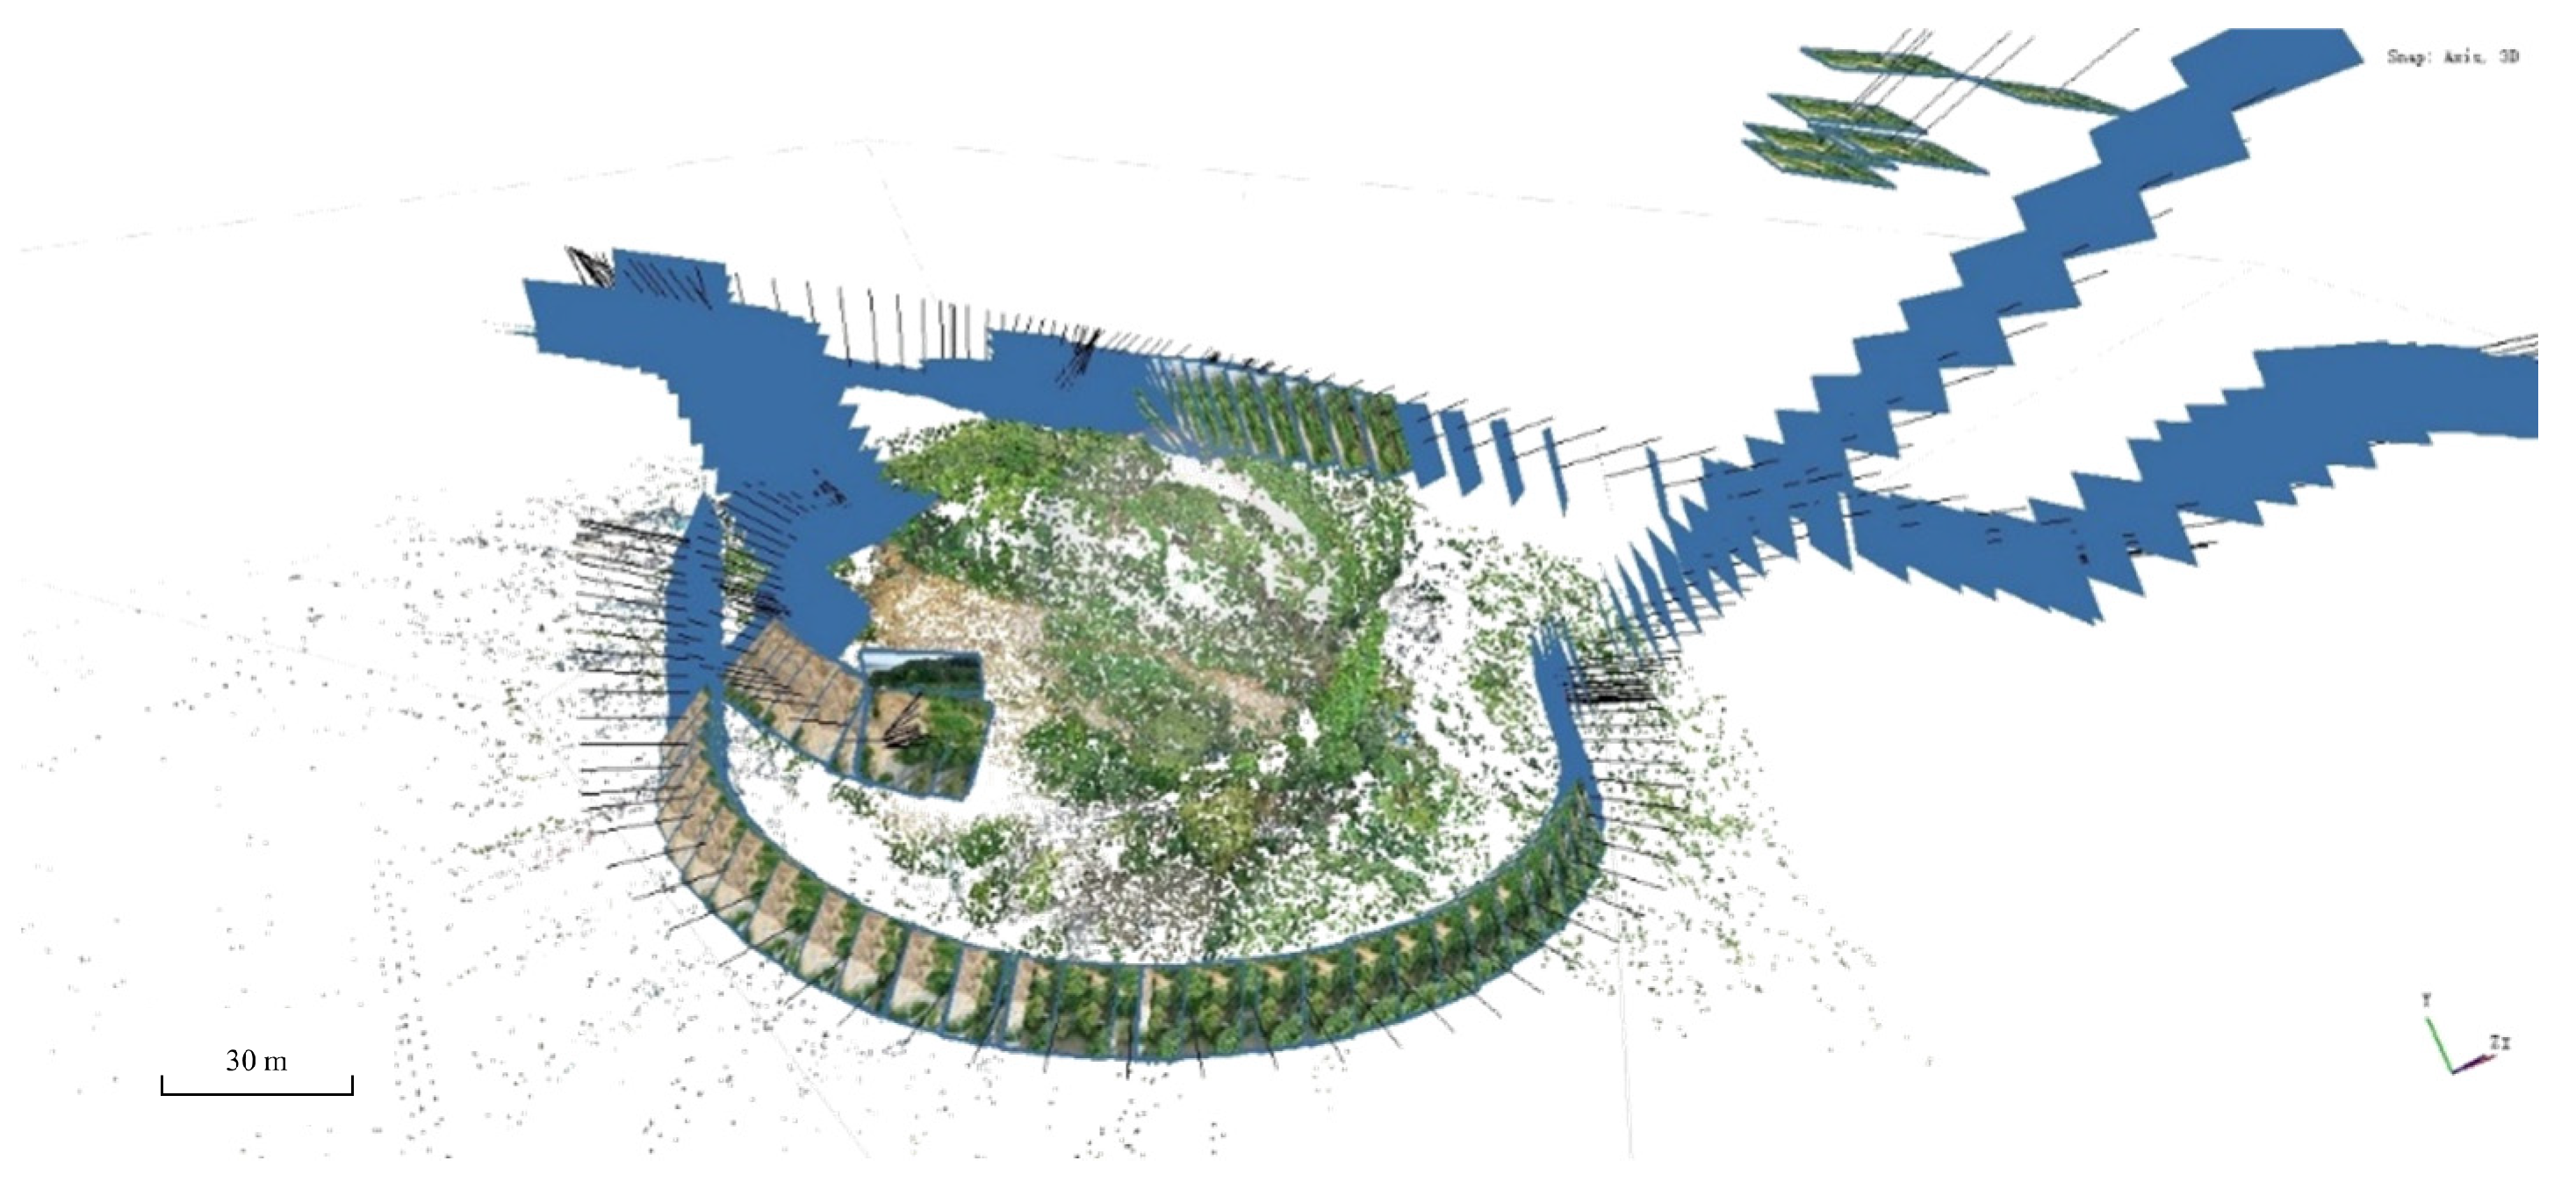
The images in the dataset capture the entire landslide body along with an expansive background, including the surrounding environment and trees. After an initial photogrammetric registration, the dataset’s images are presented as shown in
Figure 2. The dataset’s images reveal a clear depiction of the landslide’s morphology and structure, including slope deformations and fractures resulting from tensile forces acting on the soil mass—one of the key focal points in 3D reconstruction for slope engineering [
25].
3. Methodology
Three-dimensional reconstruction is a key technology in the monitoring [
26,
27], assessment, and post-disaster management of landslides. Conducting 3D reconstruction in landslide areas enables the accurate reproduction of the terrain and geomorphological features of the disaster site, thereby providing critical data support for landslide volume estimation, stability evaluation, and secondary hazard prediction. This section briefly introduces 3D reconstruction based on photogrammetry and that based on NeRF.
3.1. Photogrammetry-Based 3D Reconstruction
Photogrammetric 3D reconstruction technology is based on two-dimensional imagery acquired from multiple viewpoints, with its core principle lying in leveraging the geometric relationships among multi-view images to infer a scene’s 3D structure. Its core workflow includes Structure from Motion (SFM) and Multi-View Stereo (MVS) [
28,
29]. During the SFM stage, features are first extracted and matched from the acquired oblique image sequence, employing techniques such as epipolar geometry constraints and Bundle Adjustment to simultaneously compute the exterior orientation parameters (camera poses) of all images and derive a sparse 3D structure (sparse point cloud) of the scene. Subsequently, a dense point cloud is computed using MVS, and further processes such as mesh generation, point cloud refinement, and texture mapping are performed to achieve a detailed 3D reconstruction of the target scene. Photogrammetry has been widely applied in fields such as topographic mapping [
30,
31], disaster identification [
32], cultural heritage digitization [
33], and smart cities [
34].
3.2. NeRF-Based 3D Reconstruction
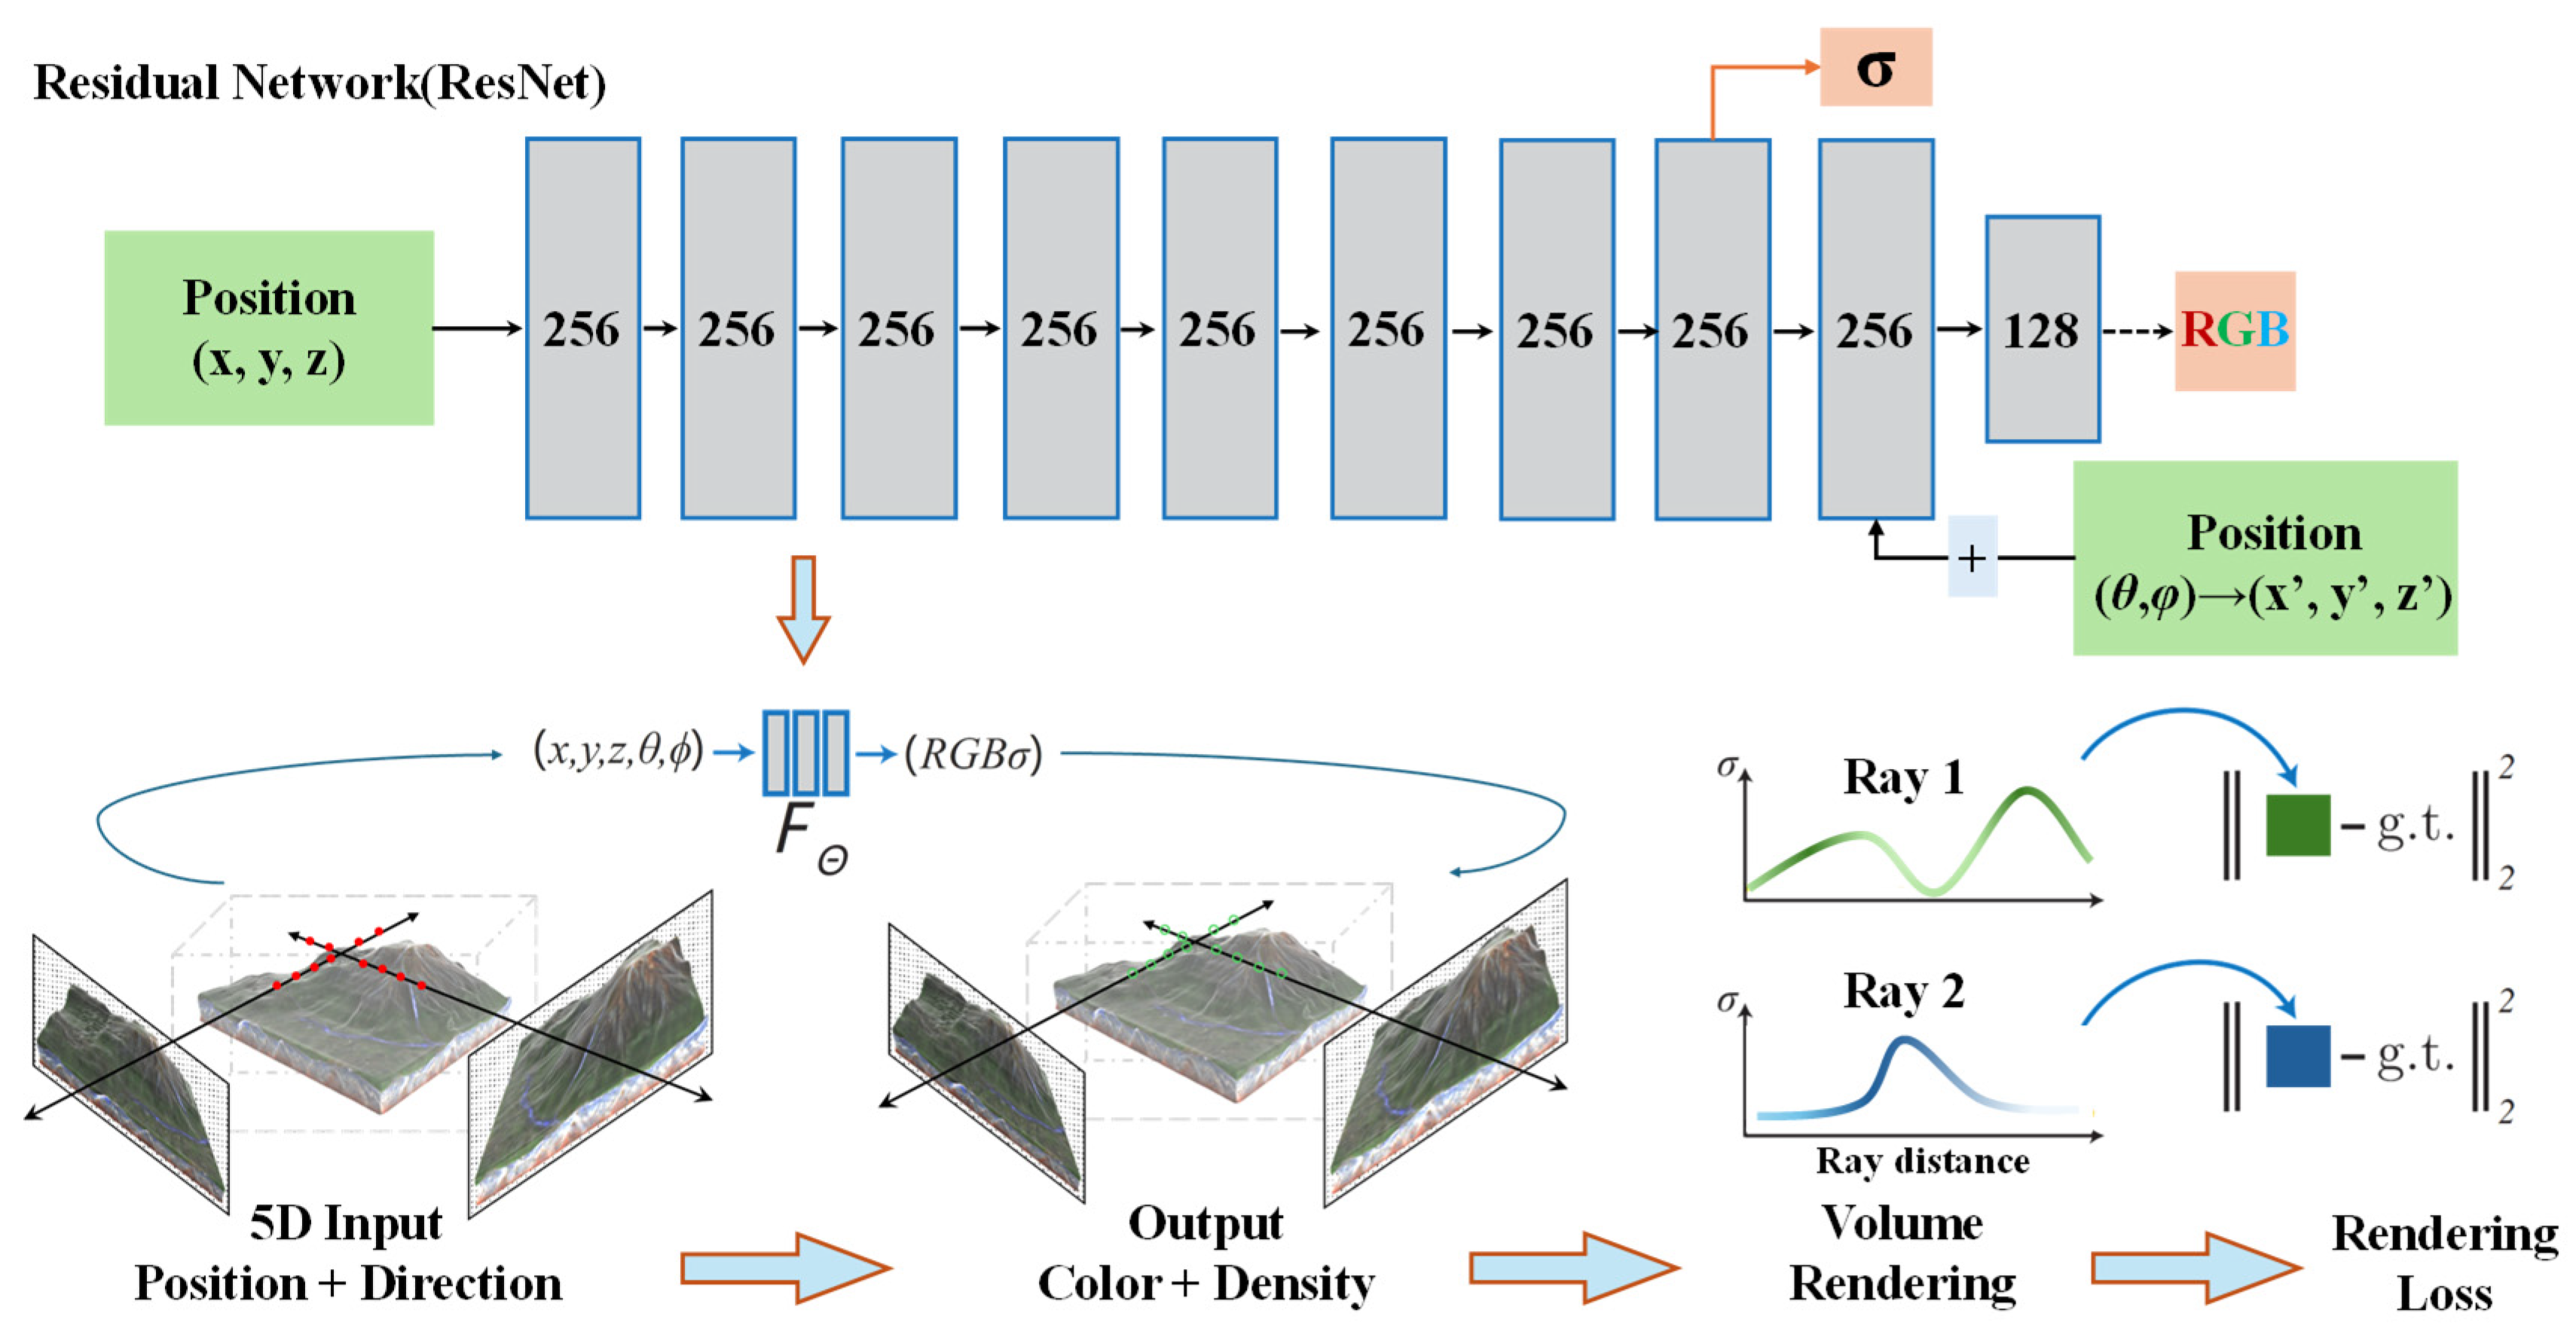
In computer graphics, novel view synthesis is an extremely challenging task. However, with the rapid development of deep learning technology—especially the powerful capabilities of deep neural networks in image generation and representation—new breakthroughs in novel view synthesis have emerged. Mildenhall et al. [
35] introduced the concept of NeRF in 2020. NeRF adopts an entirely novel approach by forgoing the explicit storage of 3D geometric models (such as meshes or point clouds). Instead, it employs a deep neural network to implicitly represent the continuous density and color information of a scene, and utilizes volume rendering techniques to generate high-quality novel view images.
Figure 3 illustrates a schematic diagram of the underlying principles of NeRF.
At the core of NeRF lies a residual network (ResNet). The network takes as input the 3D coordinates (
x, y, z) of a point in space along with its viewing direction (
θ, φ), and outputs the corresponding volume density σ and color (RGB). This network can be represented as
where
denotes the learnable parameters of the network.
represents the volume density at location
.
denotes the radiance (color) when observed along the viewing direction
. To better capture high-frequency details, NeRF typically applies a positional encoding to the input coordinates
and viewing direction
, mapping low-frequency information into a higher-dimensional space, thereby enabling the network to represent richer spatial variations.
Subsequently, NeRF integrates along rays using volume rendering techniques to generate the final pixel color. The pixel color
corresponding to a ray can be expressed as follows:
where
represents the transmittance from the ray origin to the
sample point.
denotes the absorption coefficient at the
sample point.
represents the distance between adjacent sample points.
Due to its ability to capture fine details and complex lighting effects, NeRF has been rapidly adopted in many fields since its introduction in 2020, such as autonomous driving [
36] and cultural heritage preservation [
37]. However, there are few reports on its application in rock engineering and slope engineering.
3.3. Technical Approach
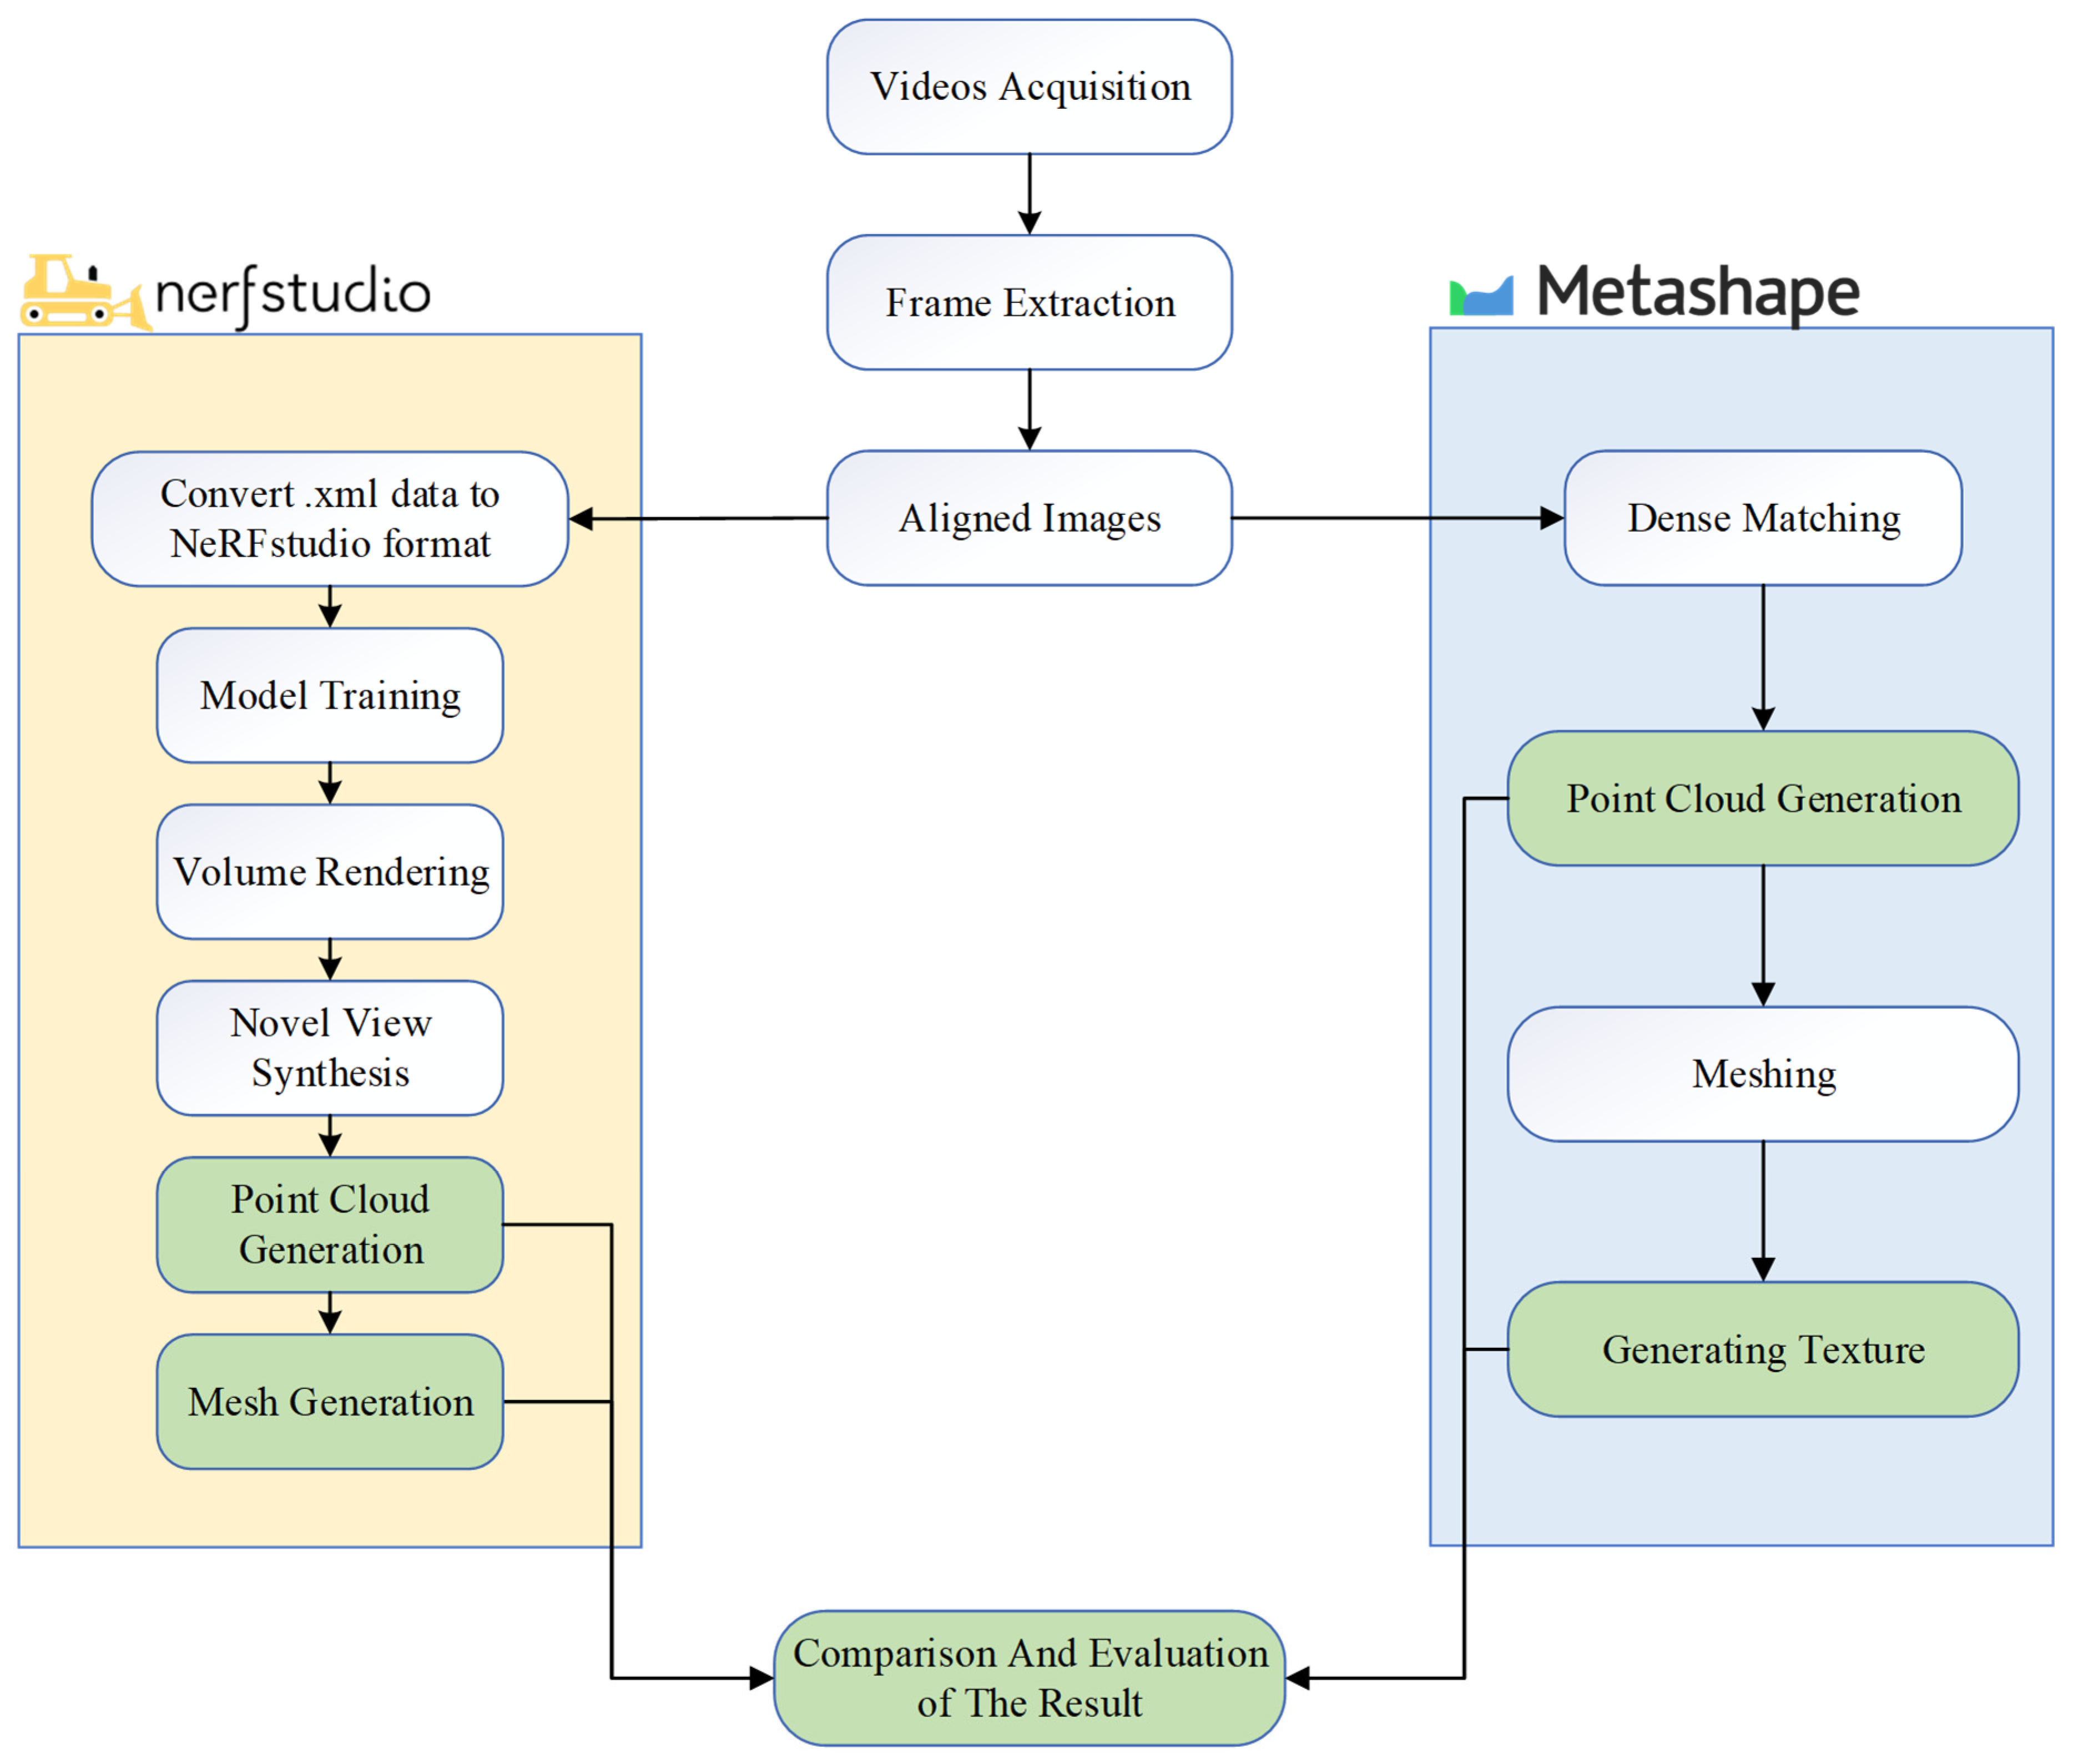
The aim of this study is to explore the potential of NeRF-based 3D reconstruction in the field of geological disasters and, using traditional photogrammetry-based 3D reconstruction as a benchmark, to evaluate the advantages and limitations of NeRF. In order to achieve this, both NeRF and photogrammetry are applied to perform 3D reconstruction on the same dataset, which includes the complete landslide body along with the surrounding trees and clearly captures the landslide’s features. The detailed workflow for modeling and comparing the two methods in this study is illustrated in
Figure 4. All steps shown in
Figure 4 were executed under the same hardware configuration, utilizing an RTX 4090 graphics card with 24 GB VRAM, a 14th-generation Intel Core i9-14900K CPU, and 128 GB of RAM.
After obtaining the video and extracting frames to create the dataset, image alignment, initial point cloud generation, and camera pose estimation are required; in this study, these steps were implemented using Agisoft Metashape. For traditional photogrammetry-based 3D reconstruction, the aligned image dataset is directly used to generate a dense point cloud, create a mesh network, and finally build the model texture. All these steps were executed using the highest quality mode.
For NeRF-based 3D reconstruction, this study employed the Nerfstudio platform developed by Tancik et al. [
38]. Nerfstudio also requires an aligned image dataset as the initial input. Because Nerfstudio is compatible with the image alignment performed by Metashape, the alignment results were exported in XML format and then converted for input into Nerfstudio. Subsequently, the multi-layer perceptron (MLP) is trained to generate predictions for novel viewpoints, ultimately yielding neural renderings. In this phase, Nerfstudio offers additional model options based on the required training capacity; the standard model occupies 6 GB of VRAM, while the “huge” model—employing more parameters and a denser feature network—requires 24 GB of VRAM. The huge model can capture finer scene details and high-frequency information, thereby enhancing rendering and reconstruction accuracy, albeit at the expense of slower training and rendering speeds. This study concurrently trained and generated both types of neural renderings, hereafter referred to as NeRF 6G and NeRF 24G, respectively. We employed the Nerfacto method within the Nerfstudio framework for three-dimensional reconstruction, which uses a two-stage sampling strategy consisting of an initial piecewise sampler followed by a proposal sampler. By default, the proposal network samples 64 points per ray in each of two iterations, while the main NeRF network samples 32 points per ray. Nerfacto adopts multi-resolution hash encoding with default settings including 16 encoding levels, 2 features per level, a hash map size exponent of 19, a base resolution of 16, and a maximum resolution of 2048. Since neural renderings cannot be directly compared with the meshes or point clouds produced by photogrammetry, Nerfstudio provides an API to convert neural renderings into point cloud and mesh representations. Nerfstudio leverages the depth predictions from the radiance field to reconstruct the scene’s geometric structure, generating point cloud data through ray sampling and depth estimation, and producing a mesh model via Poisson reconstruction.
Finally, this study evaluated the performance of the different 3D reconstruction methods. Visually, the reconstruction results were examined from the same viewpoints. In terms of geometric accuracy, the point clouds generated by the different 3D reconstruction methods were analyzed.
3.4. Metrics
To quantitatively assess the differences between models constructed using photogrammetry and those built using NeRF relative to the actual scene—and to fully explore the potential of NeRF in post-disaster response—this study introduces various metrics, with each metric quantifying the reconstruction performance from different perspectives.
(1) Peak Signal-to-Noise Ratio (PSNR)
PSNR measures the difference between the reconstructed image and the original image using pixel-level mean squared error (MSE), thereby reflecting the accuracy of image reconstruction; a higher value indicates that the model is closer to the actual scene in terms of pixel accuracy. Its mathematical expression is as follows:
where MSE denotes the mean squared error, and MAX is typically set to 255.
(2) Visual information fidelity (VIF)
VIF, based on natural scene statistics and human visual system theory, can measure the ability of a reconstructed image to preserve the information of the original image. VIF indicates how much visual information is retained during transmission or processing; a higher VIF value means that the distorted image maintains a higher degree of information fidelity compared to the reference image, resulting in better quality, whereas a lower VIF value suggests that significant visual information is lost, leading to poorer quality. The mathematical formulation of VIF based on a wavelet domain model is given below:
where
represent the scale and subband, respectively.
denotes the local variance (i.e., signal energy) of the reference image at scale
and subband
.
is the gain factor.
is the noise variance.
(3) Feature Similarity (FSIM)
FSIM leverages the human visual system’s sensitivity to critical image features—such as phase congruency and gradient magnitude—to assess the similarity between images. It captures both the structural information and details of an image, with values typically ranging from 0 to 1; the closer the value is to 1, the more similar the features are between the images, indicating higher quality. Its mathematical expression is as follows:
where
represents the set of image pixels.
denotes the minimum phase congruency index between the two images at pixel
.
represents the gradient magnitude similarity at pixel
.
(4) Learned Perceptual Image Patch Similarity (LPIPS)
LPIPS leverages pre-trained deep neural networks (e.g., VGG or AlexNet) to extract image features and compute feature differences at multiple layers between two images, thereby obtaining a perceptual similarity score. LPIPS aligns more closely with human subjective perception and is capable of capturing subtle perceptual differences that traditional metrics may fail to reflect. Unlike the previous metrics, a lower LPIPS value indicates a higher perceptual similarity between images, meaning better image quality. Its mathematical expression is as follows:
where
represents the image under comparison;
denotes the feature map extracted from image
at the
layer;
indicate the height and width of that feature map, respectively;
is the weighting factor;
stands for element-wise multiplication. Since LPIPS relies on deep networks, its formulation essentially defines a distance metric implicitly through the network architecture.
By comprehensively evaluating these four metrics, we can analyze the differences between photogrammetry-based and NeRF-based 3D reconstructions relative to the actual scene from multiple perspectives—including pixel error, information fidelity, structural consistency, and perceptual similarity.
4. Comparisons and Analyses
This chapter evaluates the performance of photogrammetry-based and NeRF-based 3D reconstructions on the Sasebo landslide dataset, and compares them with respect to the image capture angles.
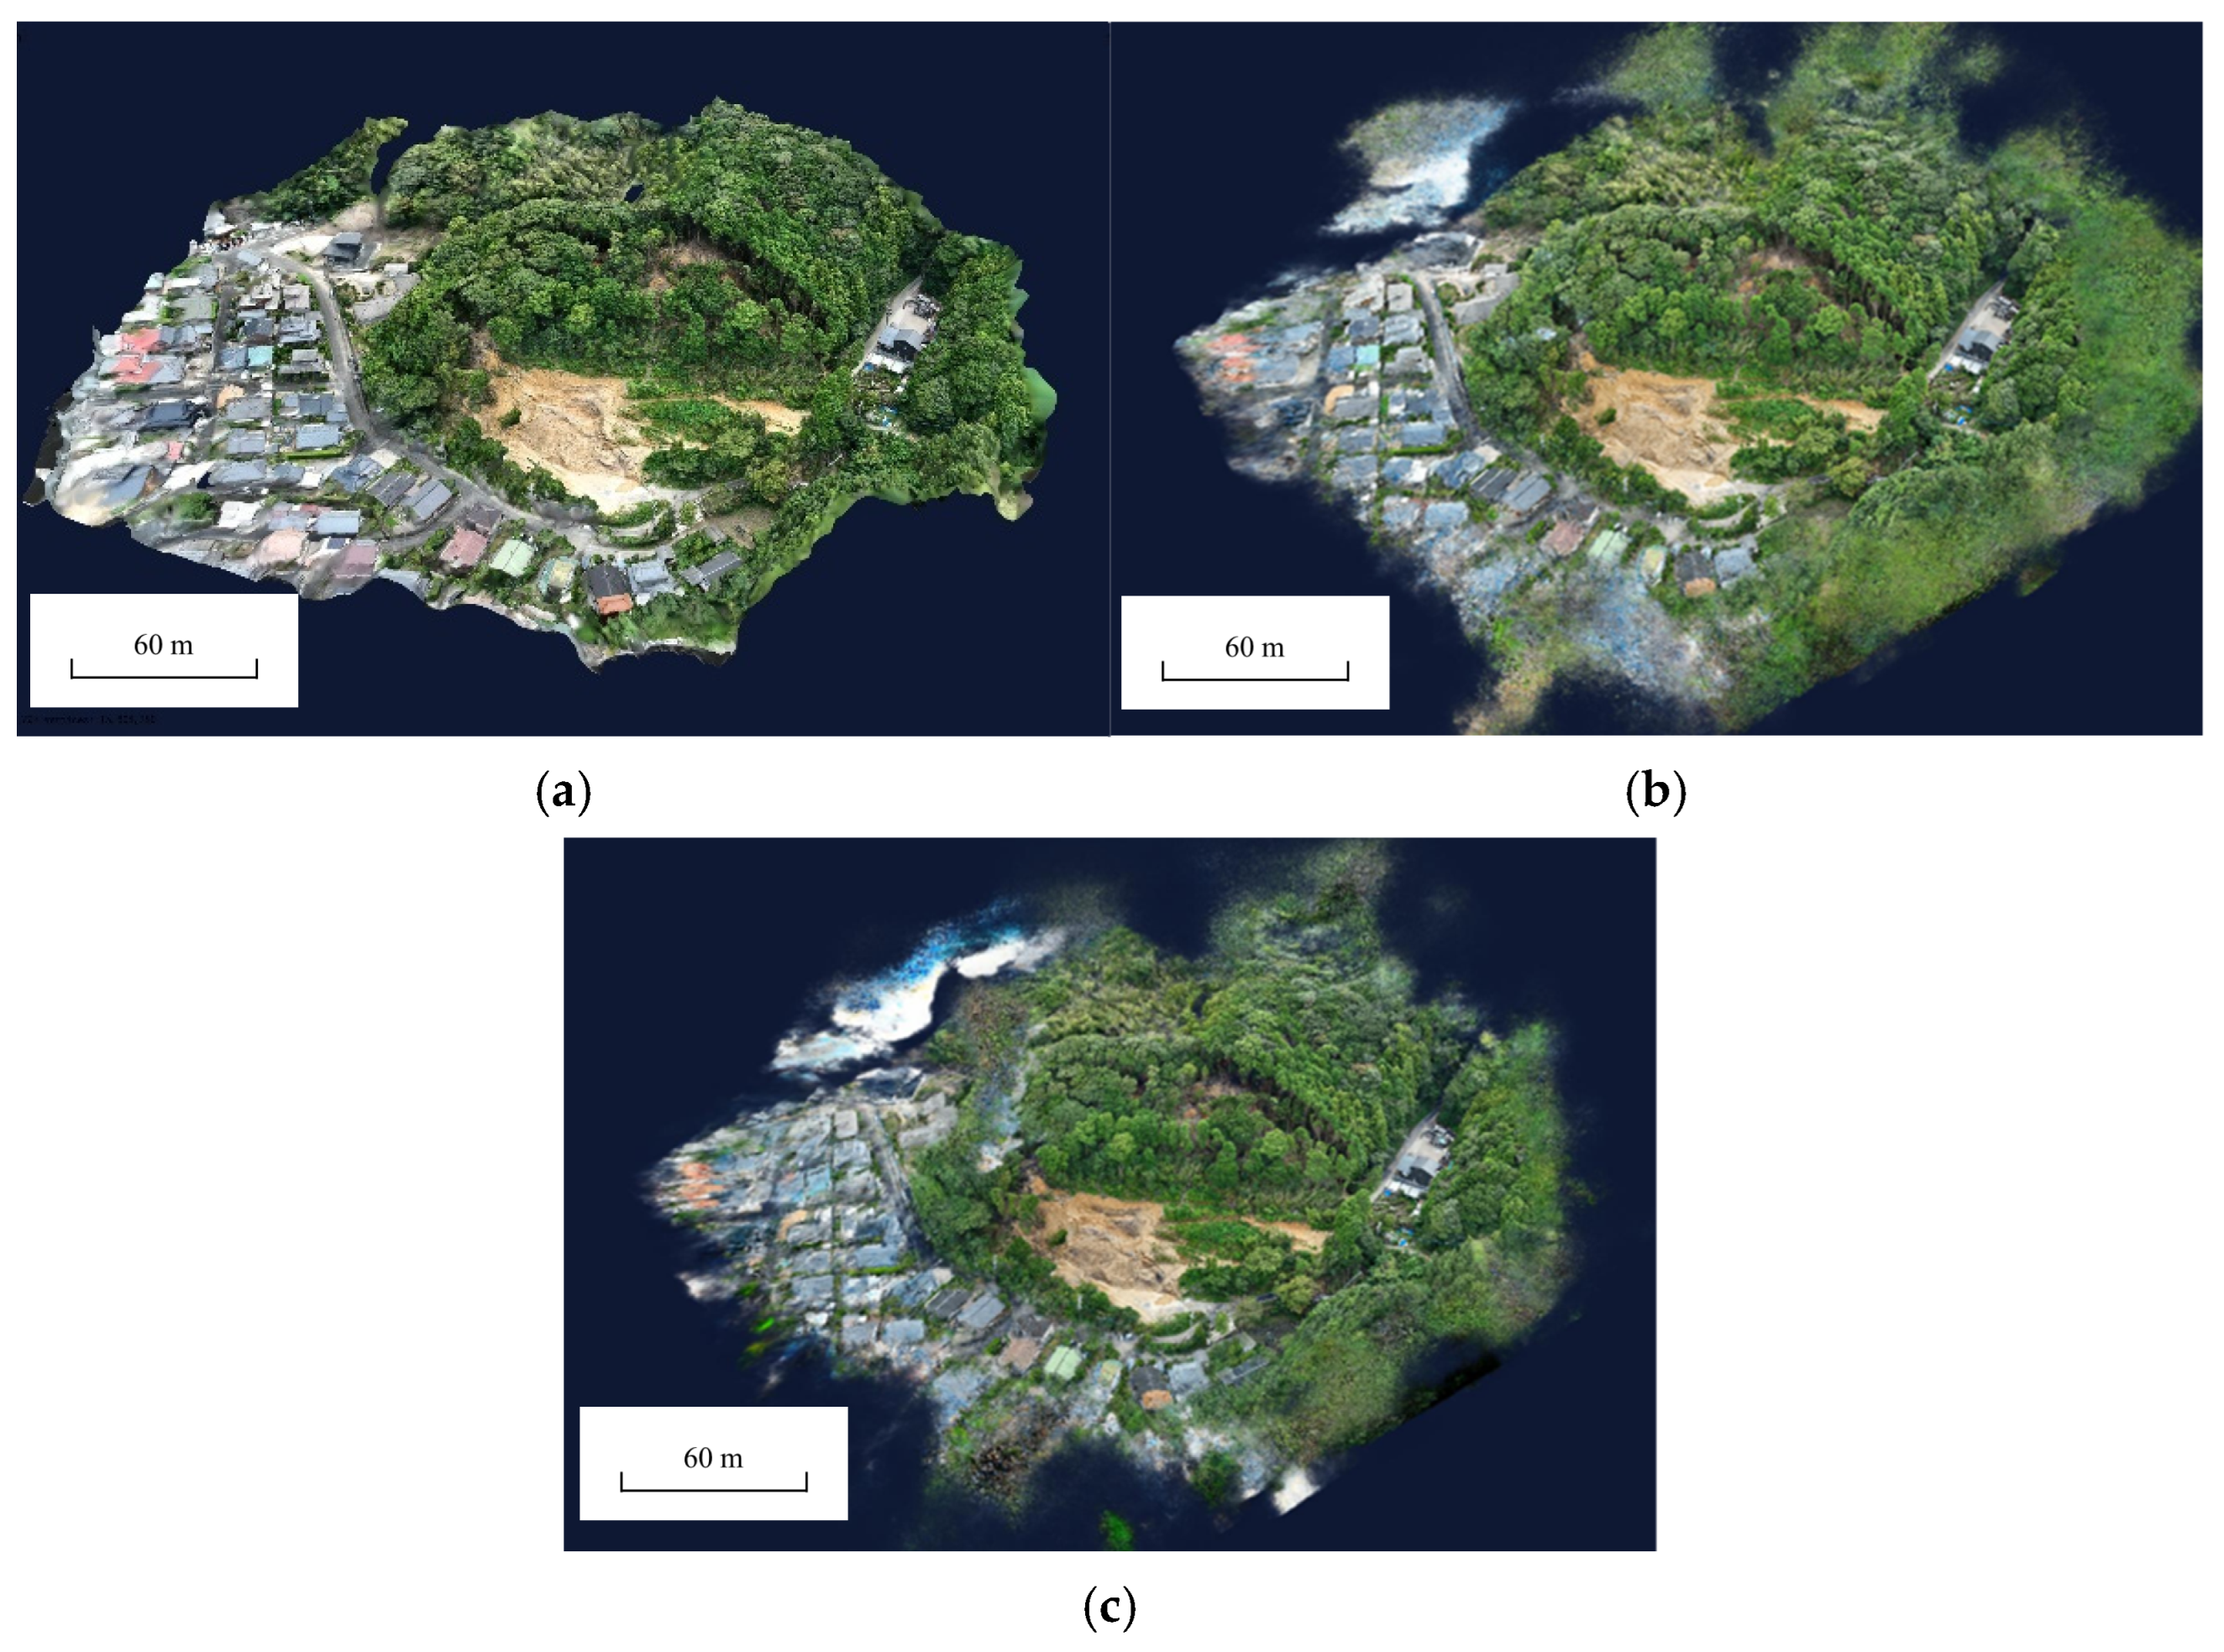
Figure 5 illustrates the overall view of the three constructed models, including both the landslide body and its surrounding environment.
All three models successfully reconstructed the landslide body and the surrounding trees. The model reconstructed using photogrammetry exhibits relatively regular edges. Both NeRF-based models, however, display numerous floating artifacts along their edges. From this viewpoint, aside from the edge regions, it is difficult to discern differences in reconstruction quality. Therefore, this study selected three local regions for evaluation: the landslide body, the rear edge, and the lateral boundary of the landslide. The results are presented in
Table 1,
Table 2 and
Table 3.
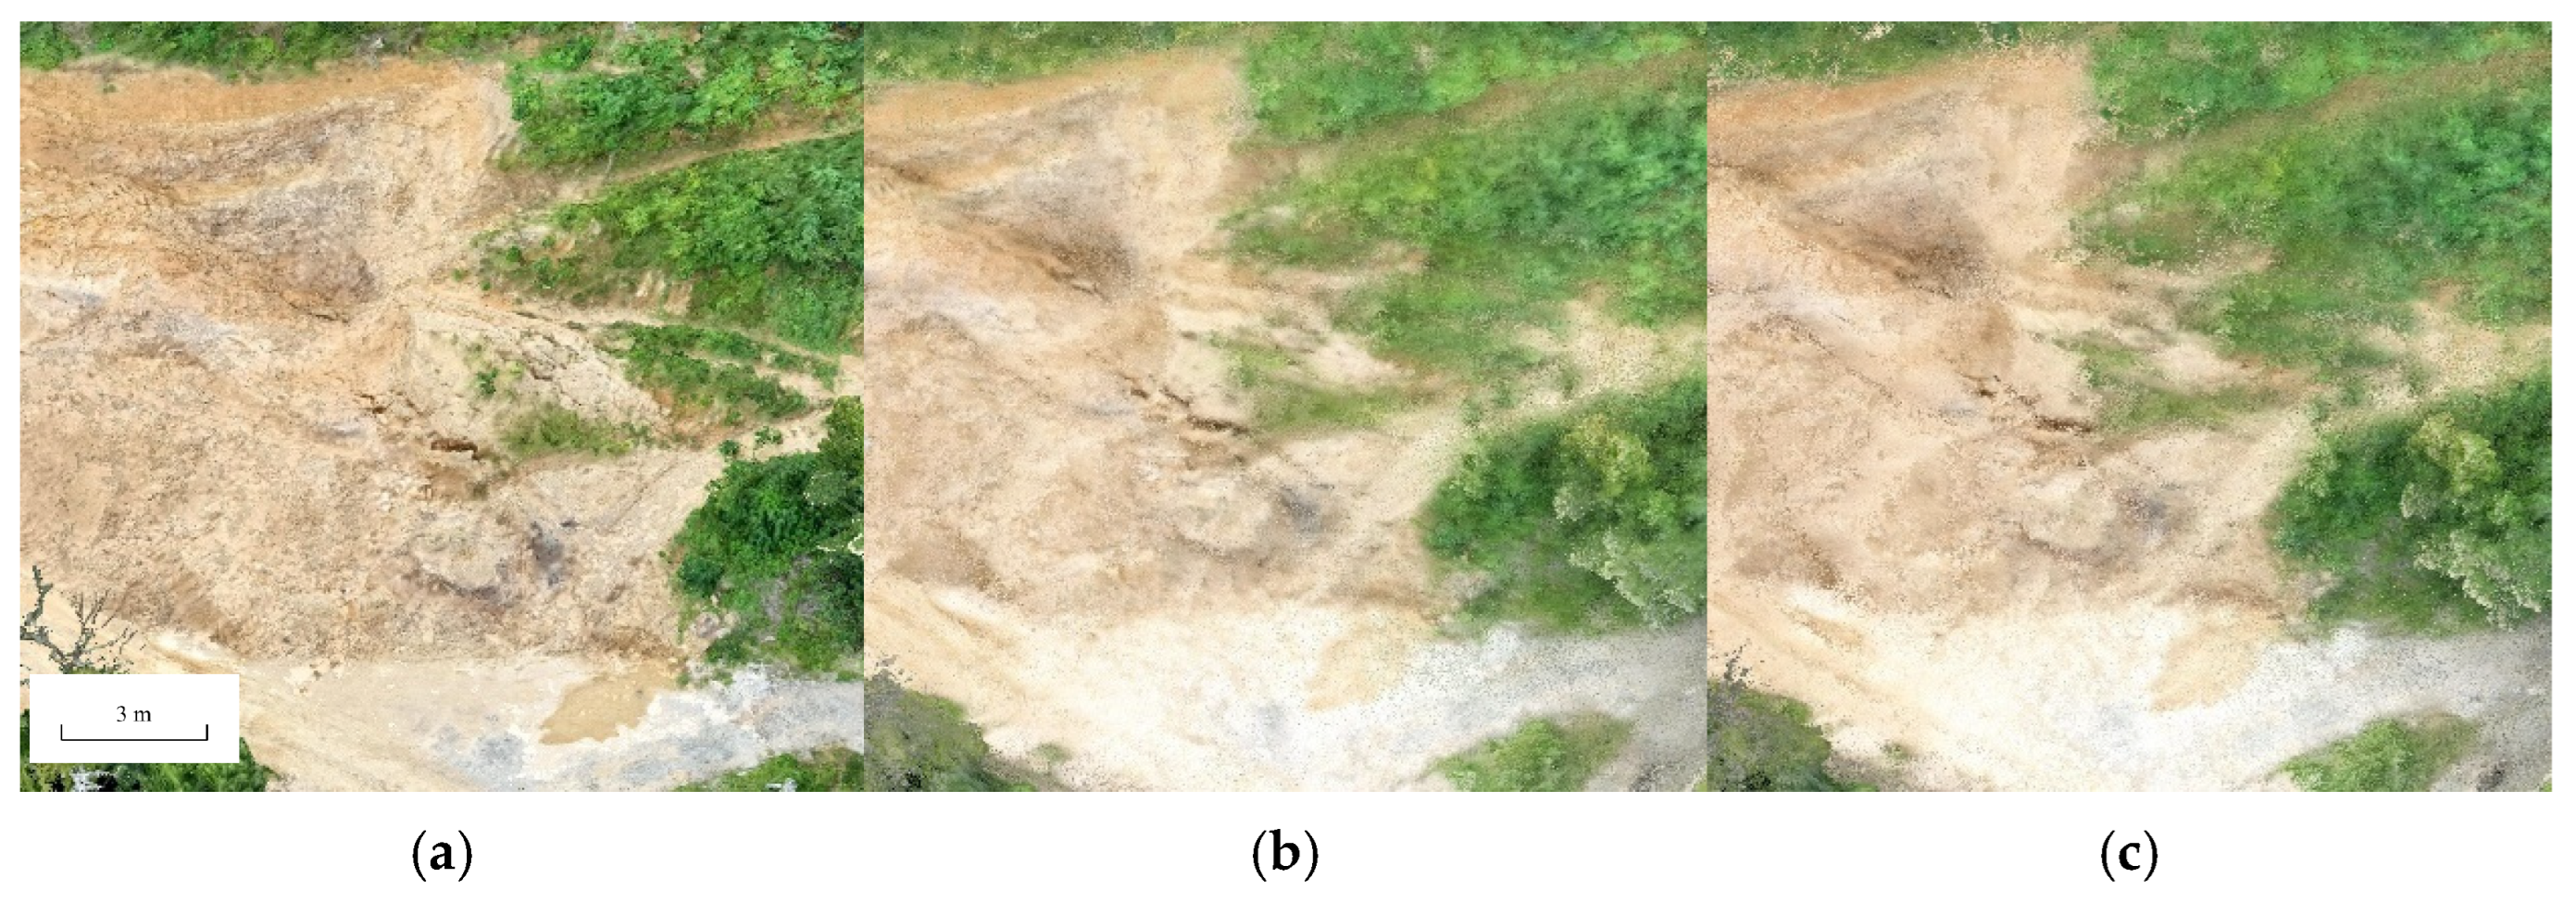
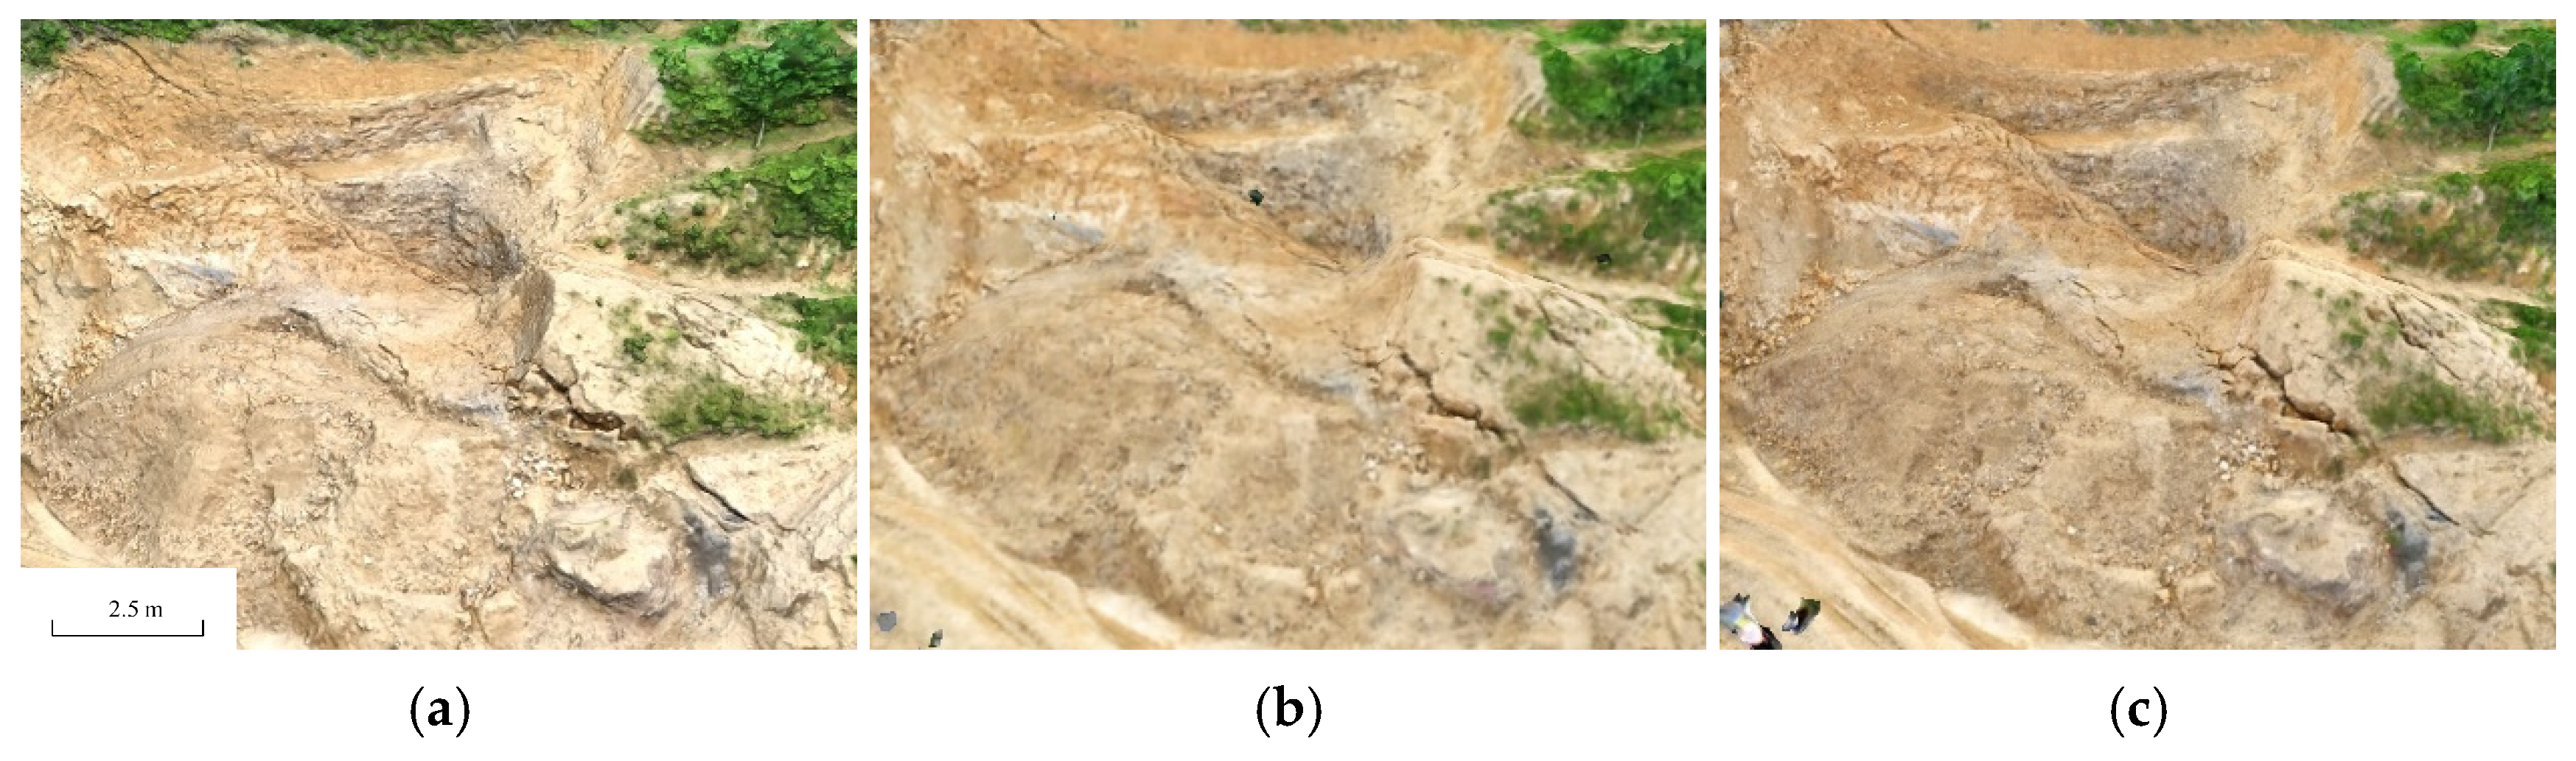
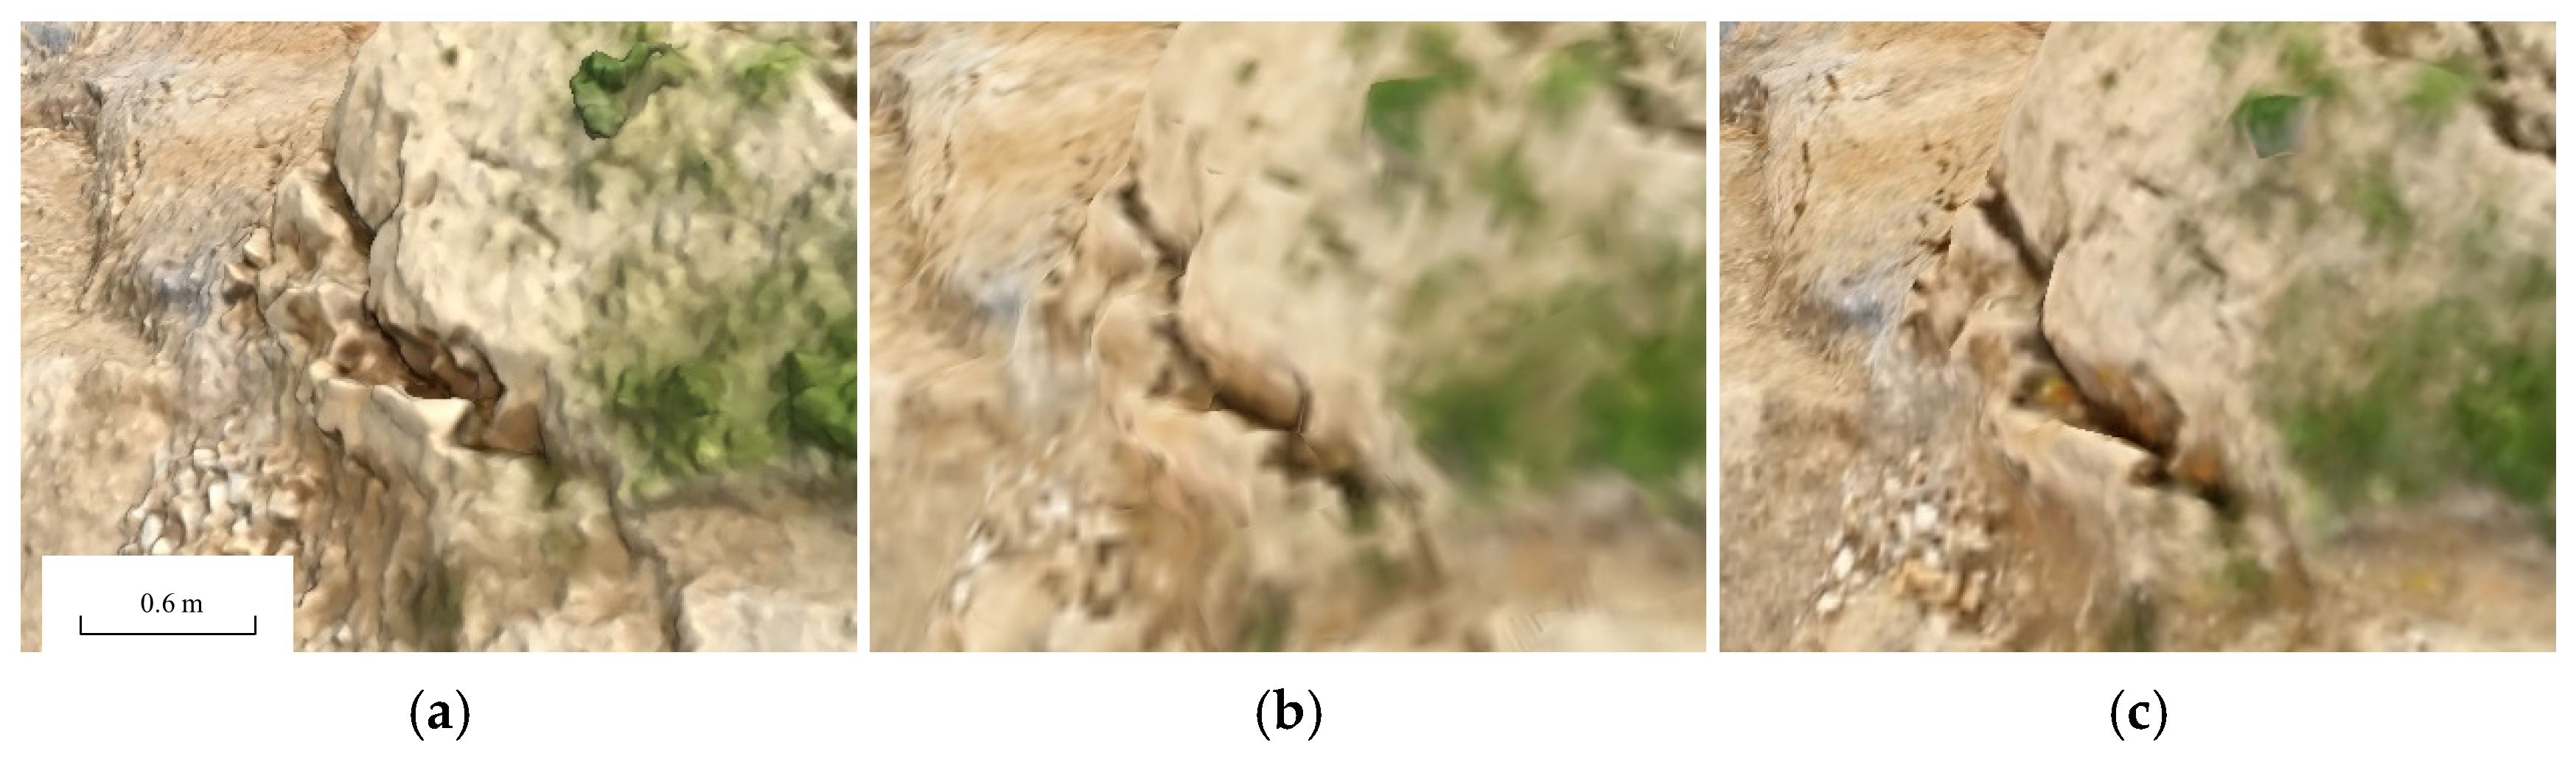
Table 1,
Table 2 and
Table 3 present detailed depictions of three regions of the landslide as reconstructed by different models, along with the scores of four metrics benchmarked against the ground truth. All three models successfully reconstructed the landslide body and its surrounding environment. Although they did not achieve the fine level of detail exhibited by the ground truth, they nevertheless captured sufficient structure, details, and color. Upon close examination at high magnification, the three models differ only slightly in terms of clarity.
Through comparison, it is evident that for the landslide rear edge, the NeRF 24G model achieved the best performance—appearing most similar to the ground truth—and its scores across all four metrics were consistently higher than those of the traditional photogrammetry model. The photogrammetry model ranked second, outperforming the NeRF 6G model. Although the NeRF 6G model reconstructed the entire scene, its fewer internal parameters and relatively sparse feature network rendered it visually akin to a downsampled, lower-level version of the NeRF 24G model during the image pyramid construction, resulting in a blurred effect. For the landslide main body region, the photogrammetry model slightly outperformed the NeRF 24G model across all four metrics, while the NeRF 6G model recorded the lowest scores. This region mainly consists of post-slide soil, which features similar colors and contains numerous small soil blocks and particles, making it challenging to accurately model surface textures and subtle features. The final comparison region is the landslide lateral boundary, where the NeRF 24G model achieved the highest overall score; except for the PSNR metric, its scores on the remaining metrics surpassed those of the photogrammetry model. The PSNR metric mechanically compares the brightness and color information of the target and reference images on a pixel-by-pixel basis, whereas the other three metrics are more sensitive to information fidelity, structural similarity, and subjective human perception.
Table 3 shows that the NeRF 24G model is closer to the real scene and aligns better with the notion of “similarity” from a subjective perspective.
In slope engineering, high-precision point cloud data can provide detailed three-dimensional spatial information, accurately reflecting the topography and elevation differences of slopes. By utilizing point cloud data, engineers can perform numerical simulations and finite element analyses to more accurately assess slope stability and identify potential landslide risks. Therefore, this study also compared the differences between point clouds generated using photogrammetry and those produced by the NeRF method.
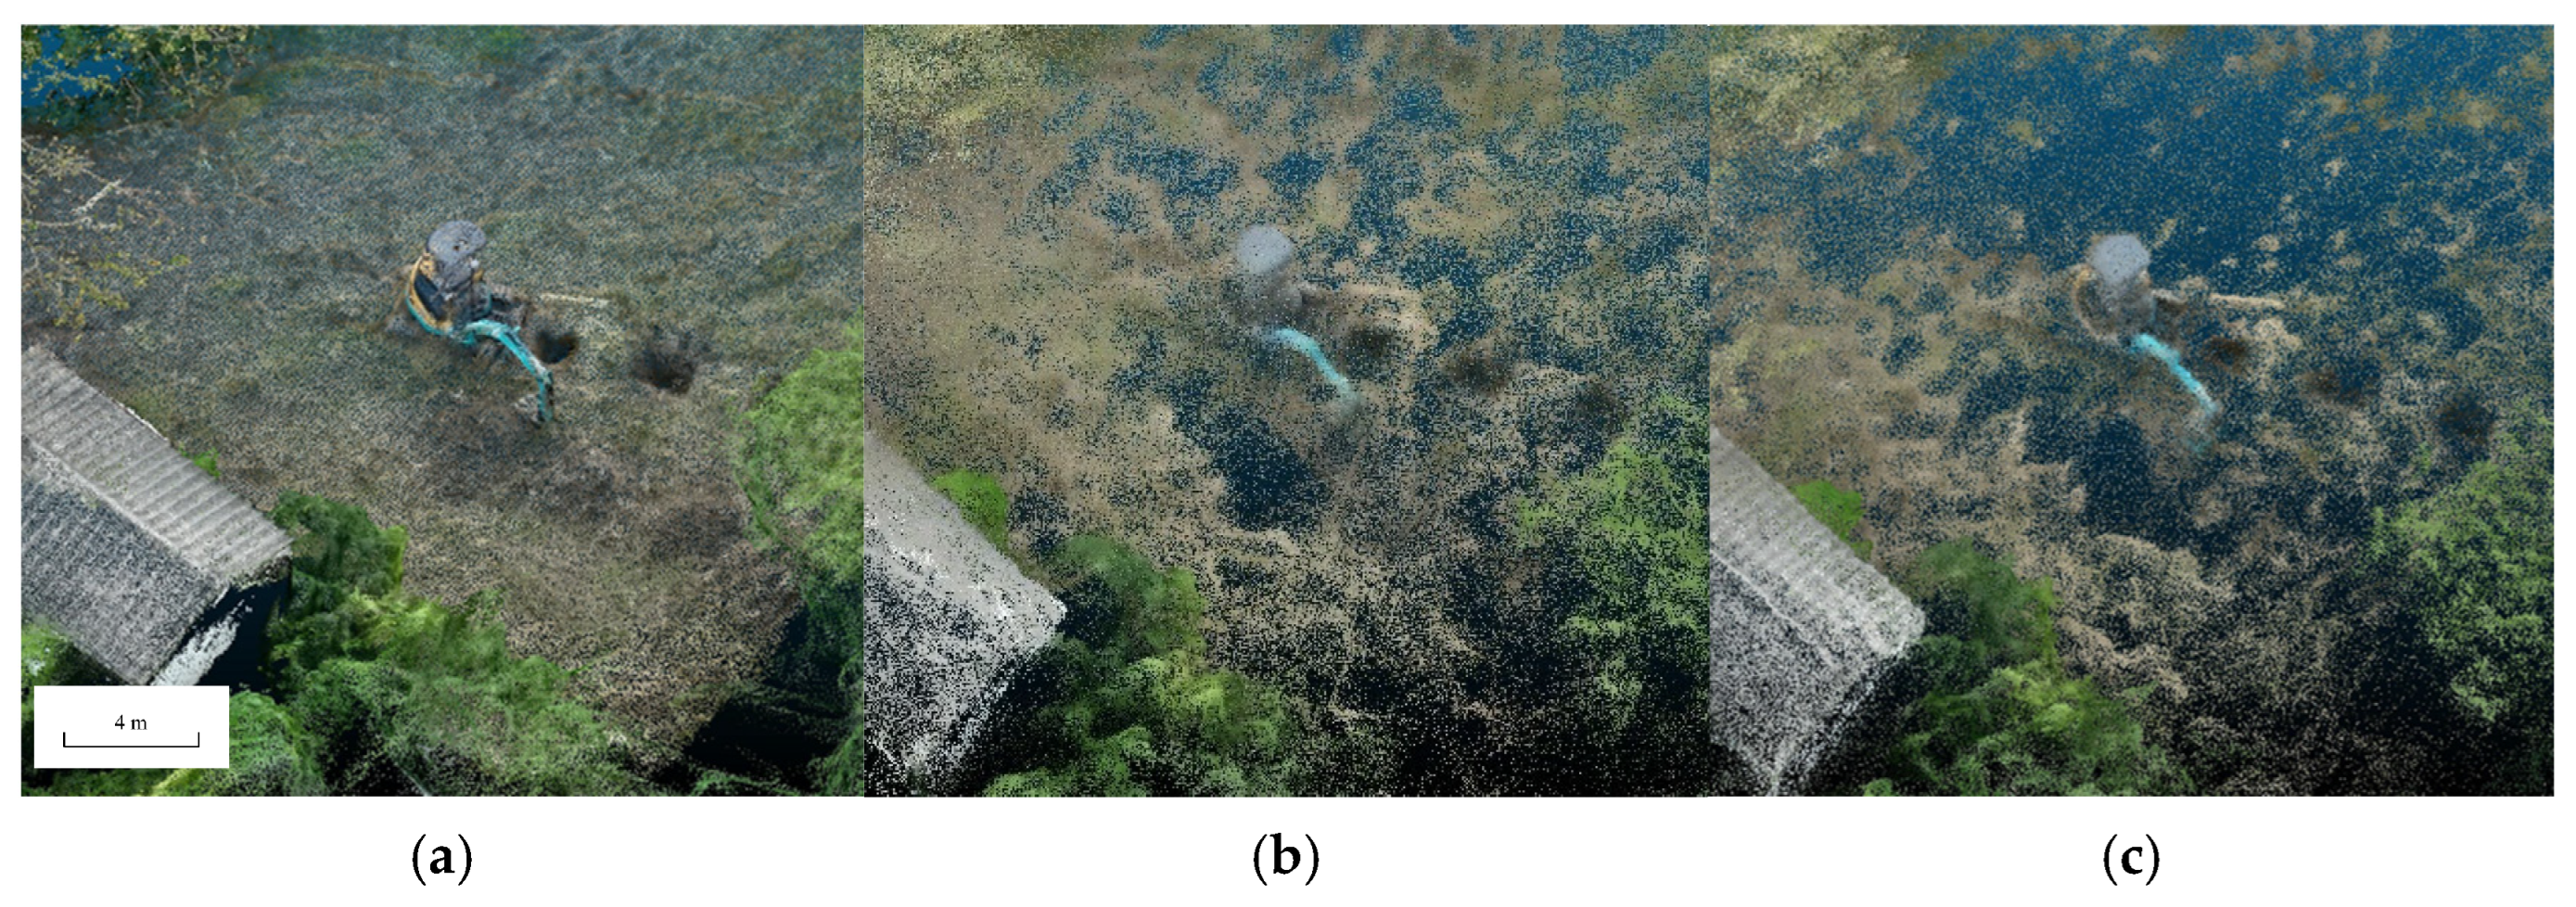
Figure 6 and
Figure 7 illustrate these differences.
Figure 6 compares the point clouds generated by the three models, with an excavator used for road clearing as the main subject in the image. It is evident that the point cloud produced by the photogrammetry method is the most detailed, faithfully representing trees, rooftops, the ground, and the excavator in its entirety. In contrast, the point cloud generated by the NeRF 6G model is noticeably sparser, losing many details, with numerous voids on the ground and unclear boundaries between the various parts of the excavator. The point cloud produced by the NeRF 24G model is slightly better than that of the NeRF 6G model, with a somewhat clearer rooftop and relatively complete excavator components; however, it still falls significantly short of the point cloud generated by the photogrammetry method.
Figure 7 presents a comparison of the point clouds of the main landslide body. Owing to the larger number of images used in the modeling process for this area, all three models produced relatively complete point clouds. The point cloud produced by the photogrammetry method remains the most detailed, with landform features such as cracks clearly rendered. The point cloud produced by the NeRF method loses many high-frequency details; however, it still effectively captures the overall undulations of the terrain and the major cracks, thereby providing an important reference for identifying macro features such as landslide deformation and soil distribution. It is worth noting that as the capacity of the NeRF model increases, improvements are observed in both detail preservation and noise control; however, the precision still falls short of that achieved by the photogrammetry method.
Figure 8 presents the three mesh models of the main landslide area. A comparison reveals that the mesh model produced by photogrammetry exhibits higher contrast and richer details, while the NeRF-generated mesh appears somewhat blurred and shows minor anomalous texture mapping errors (notably in the lower left corner of
Figure 8b,c).
Figure 9 illustrates the differences among the three mesh models after close-up and angle adjustments. Regarding the tensile cracks in the soil, the photogrammetry method preserves the most details—fully capturing information such as crack length and depth—whereas the NeRF 6G model loses a significant amount of detail, rendering only an approximate shape; the NeRF 24G model retains more detail than the NeRF 6G model but still falls short of the photogrammetry method. Furthermore, the photogrammetry-derived mesh preserves small surrounding stones, while the meshes generated by NeRF 6G and NeRF 24G fail to reconstruct these stones accurately, instead smoothing them out. This indicates that capturing minute objects and rough surface textures remains a challenge for NeRF.
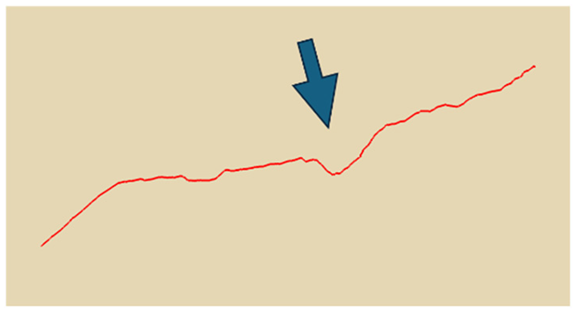
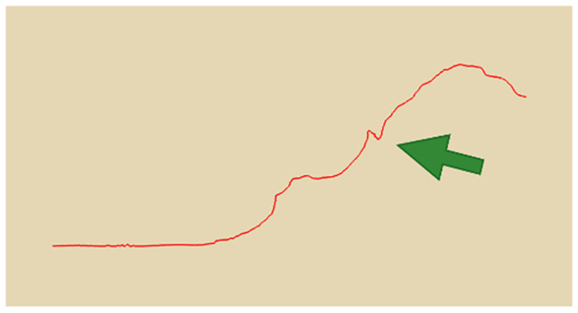
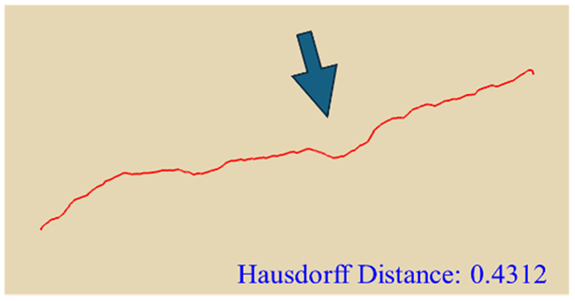
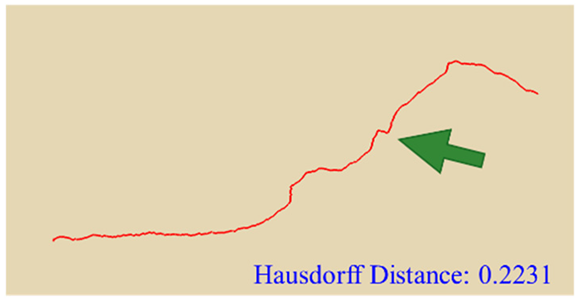
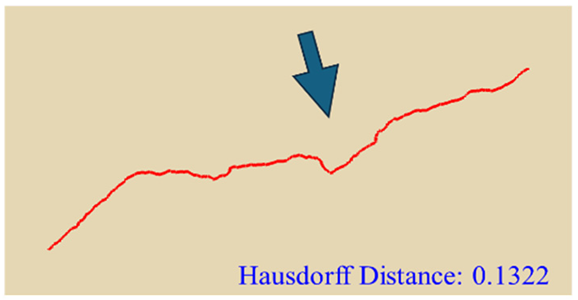
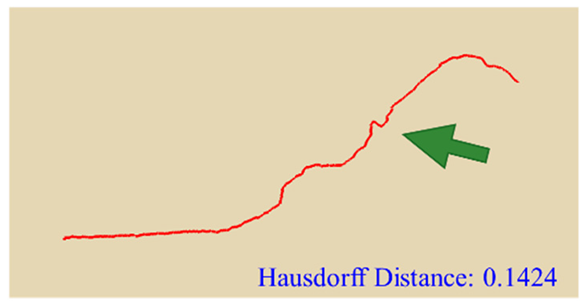
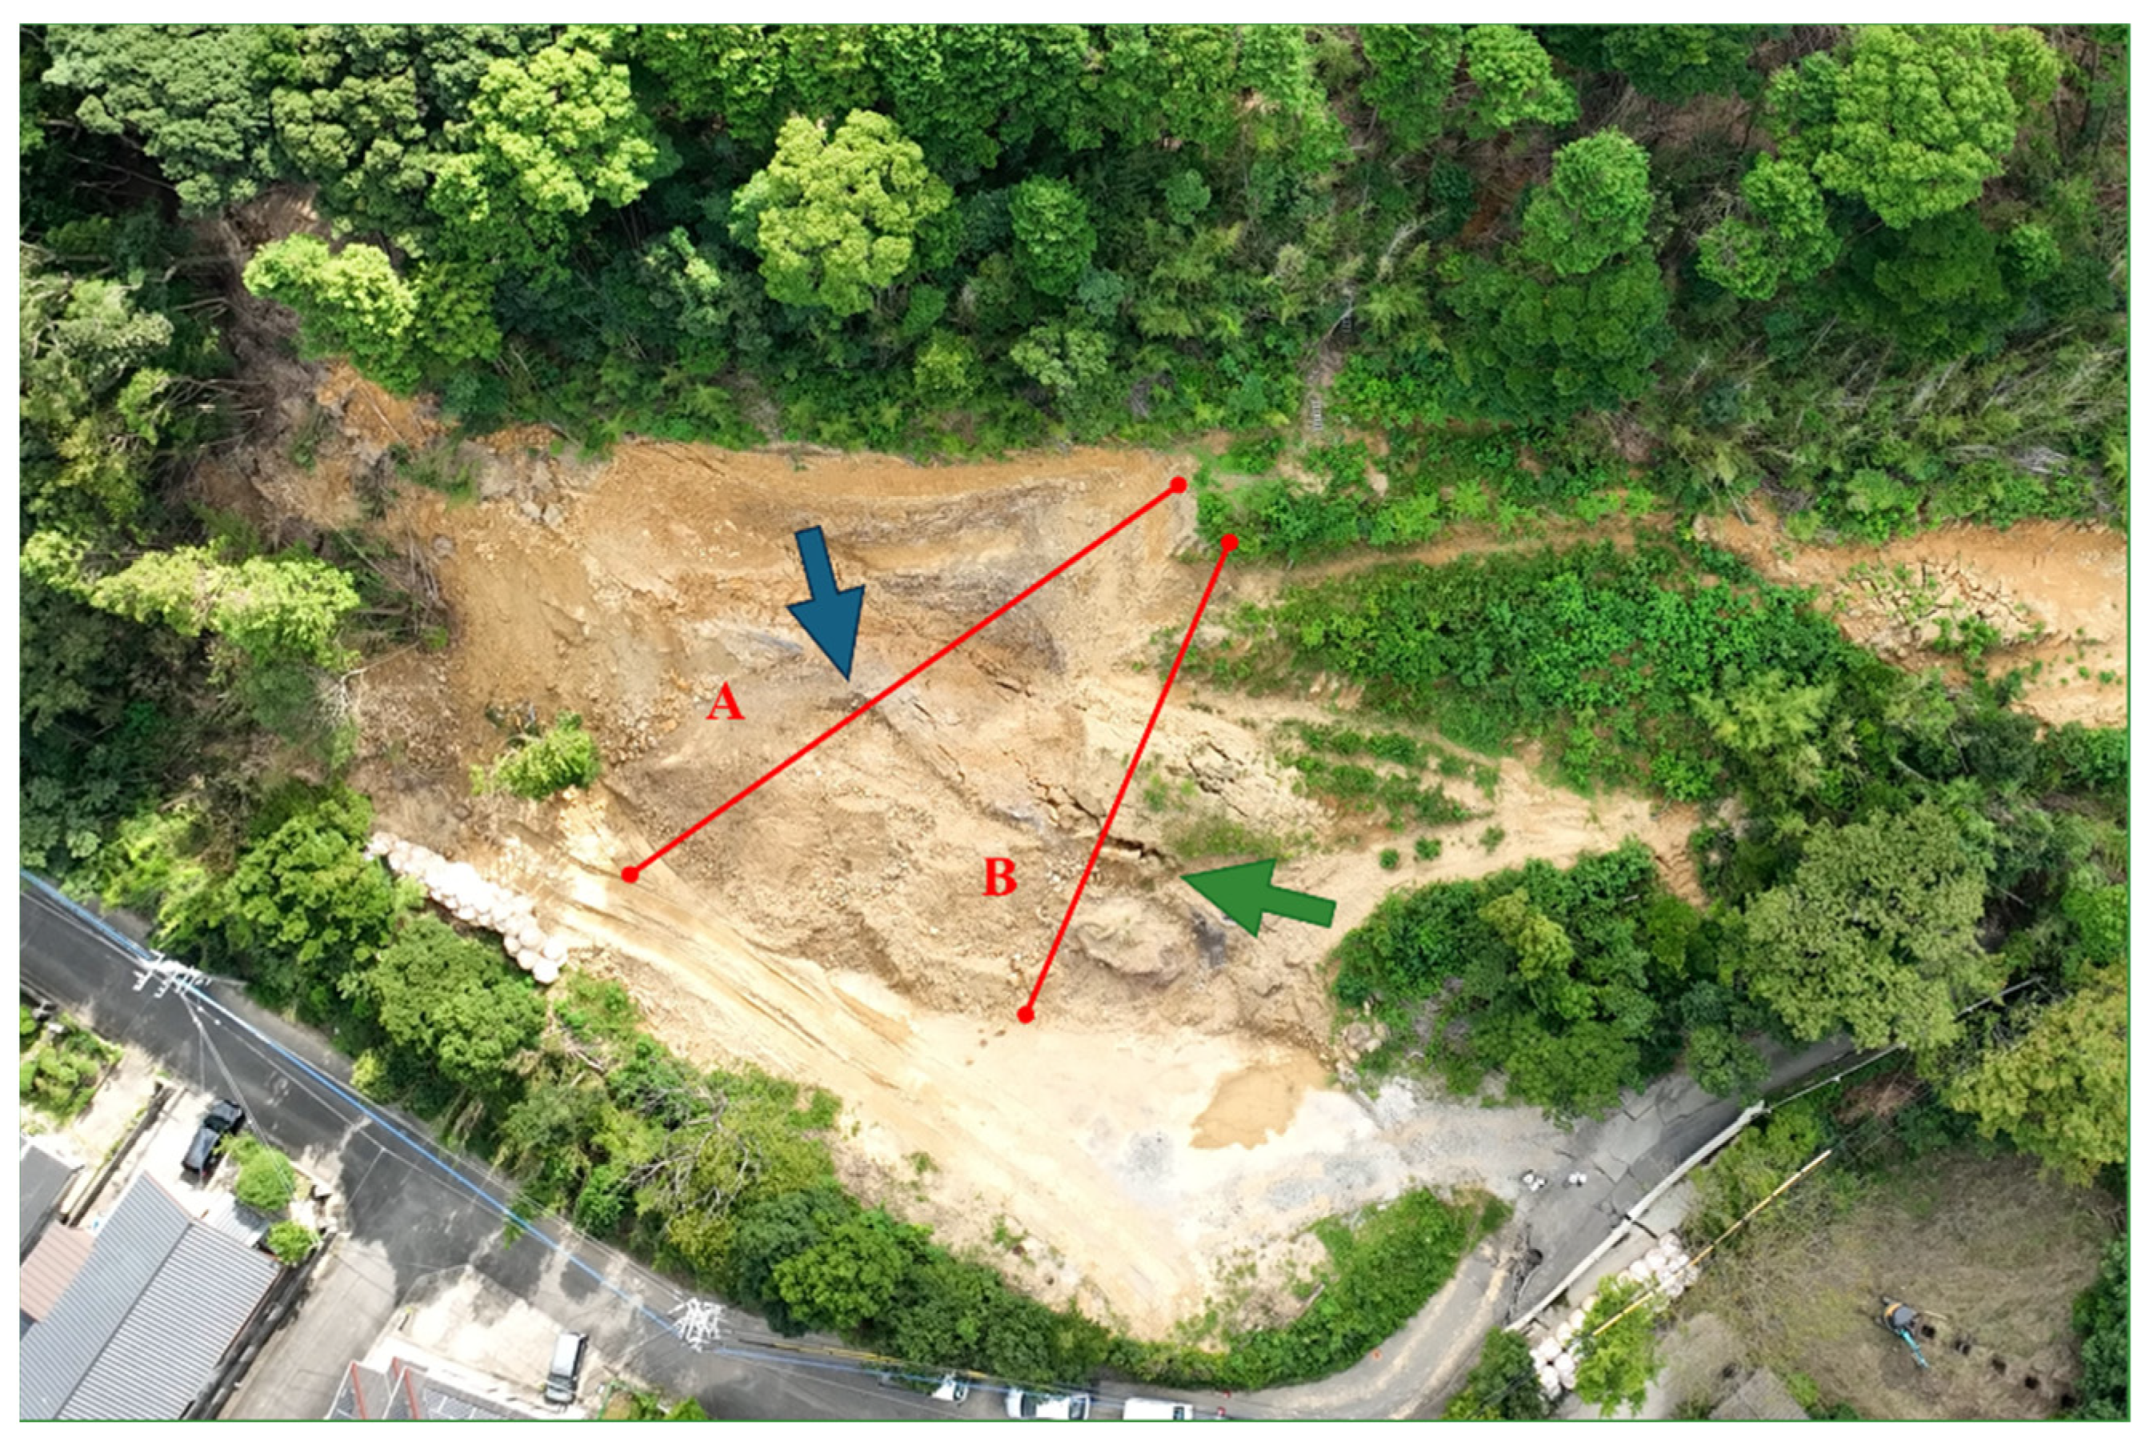
In practical slope engineering, surface morphology is of primary concern, as features such as undulations, slope angles, and micro-topography are key factors in determining slope stability. To evaluate this aspect, we extracted ground surface profiles from the point clouds generated by the three methods along two reference lines indicated in
Figure 1. The profile derived from the photogrammetric method was used as the benchmark, and the Hausdorff Distance was adopted as the quantitative metric, where smaller values indicate closer alignment between curves. The detailed results are presented in
Table 4. Key topographic features—such as large surface fissures and depressions—are highlighted with arrows of different colors in
Figure 10. These highlighted sections correspond to the regions marked by arrows in
Table 4.
As shown by the comparison results in
Table 4, both NeRF 6G and NeRF 24G achieved outcomes comparable to the photogrammetric method for Profiles A and B. Notably, NeRF 24G demonstrated superior modeling quality, offering higher geometric fidelity and closer alignment with the reference profiles. In large-scale applications such as slope engineering, the accurate reproduction of the overall terrain morphology and spatial extent is more critical than the precision of fine geometric details. From this perspective, both NeRF 6G and NeRF 24G effectively captured the primary topographic contours and variation trends. Their reconstruction accuracy is sufficient to meet the practical requirements of post-disaster emergency modeling and slope morphology interpretation. Therefore, even the lightweight NeRF 6G model shows promising feasibility and practicality for deployment in rapid response scenarios.
5. Discussion
In emergency response to landslide disasters, the speed and quality of acquiring on-site 3D models play a critical role in supporting governmental emergency decision making. This paper compares the application performance of traditional photogrammetry-based modeling and NeRF-based modeling in landslide disaster response and discusses them from the following perspectives.
(1) Model Processing Time:
In terms of data processing time, there are substantial differences between NeRF and traditional photogrammetry, as shown in
Table 5. From an engineering and practical application standpoint, our evaluation of time efficiency focuses on the duration required for each critical step in the 3D reconstruction process, as well as the total time needed to complete the task. This is because intermediate results at each stage may provide incremental support for emergency response operations. As illustrated in
Table 5, constructing a lightweight NeRF 6G model typically takes only around 46 min, while the more detailed NeRF 24G model also requires significantly less time than the photogrammetric approach. Overall, NeRF enables faster generations of 3D models, making it feasible to complete reconstruction tasks within a single day in emergency scenarios, thereby offering timely spatial information to support on-site decision making.
(2) Rendering Effect:
In terms of rendering, traditional photogrammetry-generated texture models typically rely on image stitching, and their final appearance is easily affected by factors such as lighting conditions, viewpoint occlusions, and image stitching errors, which can result in a lack of realism. In contrast, NeRF-based modeling, by establishing an implicit volumetric representation of the scene, is capable of achieving more realistic volume rendering. Although the NeRF 6G model exhibits inferior rendering quality compared to the photogrammetry-generated texture model, the more resource-intensive NeRF 24G model demonstrates visual performance that is very close to—and even, in certain scenarios, surpasses—that of the traditional photogrammetry-generated texture model. The NeRF 24G model is more faithful to reality, providing rescue personnel with a more intuitive and realistic perception of the on-site environment, which facilitates rapid disaster assessment.
(3) Disaster Management Data:
This study demonstrates that NeRF-based rapid reconstruction offers significant advantages for post-disaster landslide management by balancing modeling speed with the level of geometric detail required for emergency applications. While traditional photogrammetry-based modeling excels in generating highly detailed point cloud and mesh data, its time-consuming nature makes it less suitable for immediate response scenarios. In contrast, NeRF-based modeling—though inferior in geometric precision—can produce a comprehensive three-dimensional overview of the landslide site within a single day, fulfilling the core requirements of post-disaster assessment without the need for engineering-grade accuracy. Experimental results show that the point clouds generated by NeRF 6G and NeRF 24G can be effectively converted into DEMs for volume estimation, yielding values of 1102.6 m3 and 1078.5 m3, respectively, compared to 1082.2 m3 obtained from photogrammetry. The small variation among these estimates confirms the reliability of NeRF in estimating landslide volume. Moreover, the NeRF-derived point clouds accurately reproduce critical terrain features, including landslide deposits, roads, and buildings along potential runout paths—elements essential for subsequent dynamic landslide simulations. Additionally, both NeRF models are capable of identifying surface features such as tensile cracks and main scarp boundaries, which are crucial indicators for early warning and monitoring deployment. Although NeRF may lack certain fine structural details, it adequately supports rapid on-site assessment and decision making, making it a valuable complementary tool to conventional photogrammetry. In summary, NeRF provides timely access to essential information for post-disaster response, including volume quantification, terrain condition analysis, and surface deformation indicators, thereby offering a practical solution for emergency 3D modeling under time constraints.
(4) Discussion on NeRF Variants:
Since the original NeRF method was introduced by Mildenhall et al. [
35], a number of variants have been proposed, each making different trade-offs between speed, accuracy, and applicability. Instant-NGP employs multi-resolution hash encoding and a sparse occupancy grid to dramatically accelerate both training and rendering, but it can lose fine details in highly complex scenes [
39]. Mip-NeRF adopts cone tracing and Integrated Positional Encoding (IPE) to reduce aliasing and achieve modest speed gains, yet it remains constrained to bounded scenes and often fails to converge in intricate outdoor environments [
40]. Mip-NeRF 360 overcomes this limitation by using nonlinear scene parameterization to map unbounded content into a finite representation, substantially enhancing robustness for distant terrain. Zip-NeRF further combines the anti-aliasing strengths of Mip-NeRF 360 with Instant-NGP’s efficient architecture, yielding approximately 22-fold faster training and lowering reconstruction error by 8% to 77% [
41]. Nerfacto—the default pipeline in Nerfstudio—integrates per-image appearance embeddings, multi-resolution hash encoding, proposal-guided sampling, and scene contraction, striking an effective balance between efficiency and accuracy and making it particularly well suited for rapid-response deployments. It is important to note that these approaches have predominantly targeted indoor or small-scale scenes. Recently, large-scale NeRF variants tailored for outdoor drone imagery have begun to emerge—such as Drone-NeRF [
42], UAV-NeRF [
43], and FlyNeRF [
44]—which employ tiling, parallel modeling, and camera-pose optimization to boost reconstruction efficiency and precision over expansive terrains. In future work, we plan to incorporate these large-scene optimization strategies to further enhance rapid 3D modeling of natural environments, including landslide scenarios.
(5) Limitations of the Study:
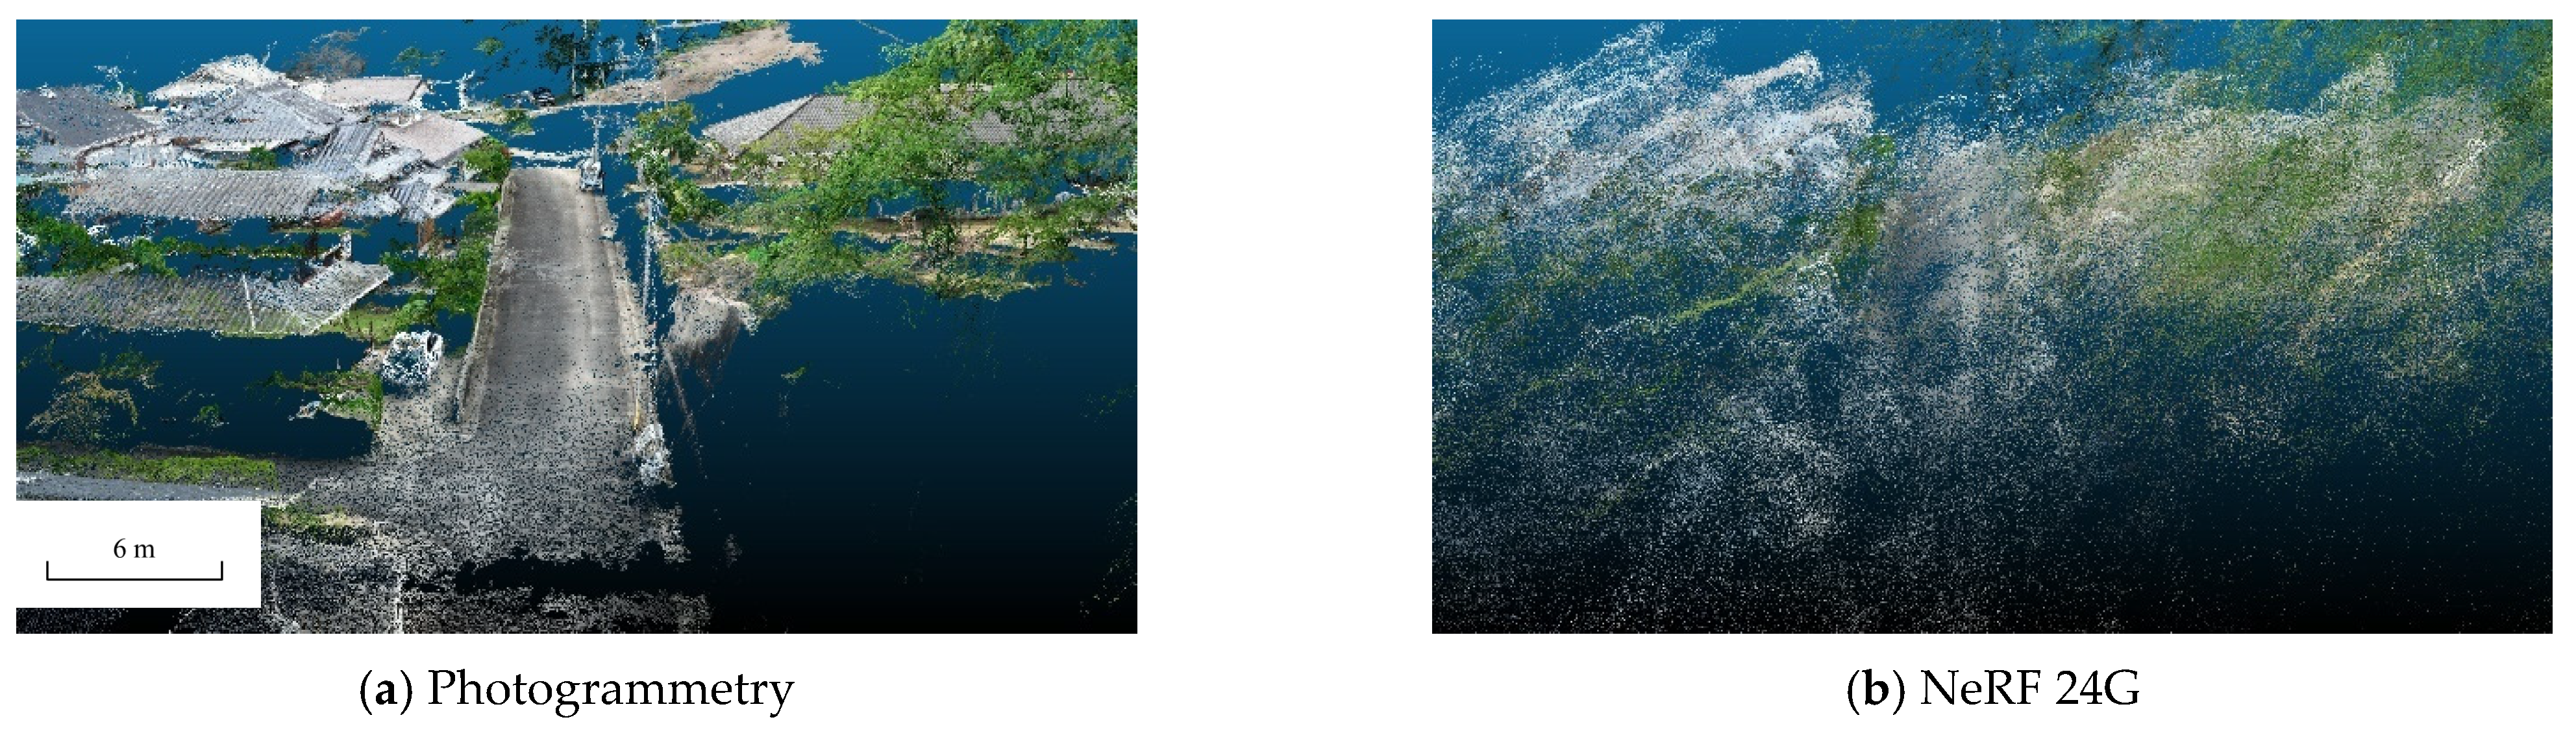
As mentioned in
Section 2 of this study, the dataset used for modeling the Sasebo landslide was collected by TEC-FORCE personnel in the Kyushu region. Since they are not professional remote sensing practitioners, the dataset does not follow standard photogrammetric protocols. Nevertheless, traditional photogrammetry still yields clearer reconstructions of roads, buildings, and other structures—producing concentrated, uniform point-cloud density—even under sparse data (
Figure 11). By contrast, NeRF point clouds appear more dispersed and “foggy” along edges, making fine structural outlines harder to discern. Future research will acquire imagery in strict accordance with photogrammetric data acquisition standards to ensure adequate coverage and consistency. Another limitation of our study is that we directly applied the Nerfacto model, even though Nerfacto is primarily optimized for smaller-scale scenes. Its default hyperparameter settings—such as hash encoding depth and sampling strategies—might not be ideally suited for large-area slope reconstruction. Future studies will therefore incorporate NeRF variants that have been specifically adapted for UAV or large-area imagery and benchmark them against Nerfacto. In addition, we used a photogrammetric model as the reference baseline, yet photogrammetry is susceptible to image quality, lens distortion and processing parameters, which can introduce geometric errors. Because laser scanning delivers more precise and stable ground truth, we plan to include high-resolution LiDAR data in future work to provide a more reliable benchmark for evaluating NeRF accuracy.


