1. Introduction
In recent years, the global retail landscape has undergone a significant transformation driven by technological innovation and shifting consumer behaviors. International retail giants such as Amazon (with Amazon Go), Walmart, and Carrefour have adopted hybrid models that integrate online and offline channels, signaling the rise of “new retail” as a global trend. In China, new retail has been embraced rapidly and at scale, with Shanghai emerging as a leading testing ground. Shanghai, as China’s economic center, has developed a diversified business district structure and established a strong brand awareness, creating opportunities to experiment with new retail models. In 2023, the report “Highlights and Trends in Shanghai’s Digital Life Consumption” revealed that the average monthly scale of new retail in Shanghai exceeded 2.5 billion yuan. Furthermore, the Special Planning for Shanghai’s Commercial Spatial Layout (2022–2035) explicitly emphasized commercial digital transformation as a key component of Shanghai’s planning support system. With its rich commercial practices and forward-looking policies, Shanghai stands out as an ideal location for studying new retail models and their development.
The aim of “new retail” is to establish an offline channel and integrate it with the online retail channel [
1]. This model merges physical and digital spaces, adjusting supply chains dynamically based on consumer data. The essence of new retail lies in retail itself, with its “new” aspect being the interactive methods it employs to enhance competitiveness in operational models, service concepts, and technological innovation [
2]. However, new retail enterprises still face significant challenges in integrating online and offline resources, delivering seamless shopping experiences, and addressing rapidly changing market demands. For the success of a retail store, its location is arguably the most critical and costly decision that retailers must make [
3]. Specifically, businesses need to carefully select precise locations to ensure efficient logistics and provide high-quality services. Substantial resources and efforts are required to strategically position themselves within urban spaces according to their business models, which is crucial for their survival and sustainable development. Therefore, when opening new stores or modifying the locations of existing ones, optimizing their location becomes the top priority [
4].
In this study, we select coffee shops in Shanghai as a research case. The coffee industry is characterized by rapid market expansion, everyday consumption scenarios, and a well-defined consumer profile [
5,
6]. Luckin Coffee and Starbucks, as two representative coffee shop brands, highlight contrasting business models. The former entered the market with an “Internet+” model from the outset, while the latter, as a traditional retail giant, has also begun introducing its own online channels and integrating its digital operation platforms [
7]. Different business models exhibit unique distribution trends and preferences within urban areas, which has prompted numerous scholars to investigate and compare their spatial distribution patterns.
Traditional research has typically focused on intercity or street-level scales, using spatial analysis methods to examine the spatial distribution characteristics and spatial autocorrelation of commercial outlets within cities [
8,
9]. In recent years, scholars have increasingly adopted machine learning approaches—such as Random Forest (RF), Iterative Dichotomiser 3 (ID3), Artificial Neural Network (ANN), and Gradient Boosting Decision Tree (GBDT)—at the grid level to analyze distribution patterns, identify influencing factors, and predict site selection [
10,
11,
12,
13,
14,
15,
16,
17]. Among these methods, RF has been widely used [
10,
11,
14,
15,
16]. Existing studies have demonstrated their accuracy and practical value in predicting the location of coffee shops in Beijing by integrating multi-source spatial data [
18,
19,
20]. To explore the nonlinear relationships of influencing factors, researchers have applied methods such as the Geographical Detector and XGBoost combined with partial dependence plots (PDPs) to reveal the direction and mechanisms of these effects [
21,
22]. However, prior studies have largely focused on comparing model performance, while lacking forward-looking perspectives on the future trends of influencing factors. Moreover, few studies have explicitly integrated site selection predictions with formal spatial planning documents, which limits the practical applicability of these models in supporting urban commercial development strategies [
23].
Therefore, this study aims to integrate site selection prediction for new retail stores with the analysis of influencing mechanisms and interpretation within the context of urban policy. Specifically, we use an RF model to predict site suitability at a 100 m grid scale, compare the influencing factors of two retail models—Luckin Coffee and Starbucks—using Shapley Additive Explanation (SHAP) values and PDPs, and link the resulting spatial patterns with the planned commercial structure outlined in Shanghai’s official urban spatial planning documents.
2. Literature Review
2.1. Evolution of Site Selection Methods
In addressing business site selection issues, three distinct waves of retail location decision-making approaches have emerged in the academic field [
24]. Early retail site selection often combined contact diffusion and hierarchical diffusion [
25]. As a result, the Analytic Hierarchy Process (AHP), which enables hierarchical and systematic operational analysis, has emerged as a leading traditional site selection model [
26,
27,
28,
29]. With the emergence of new retail models and the growing availability of data resources, many scholars have increasingly turned to Geographic Information System (GIS) to analyze commercial store layouts [
8,
9,
30,
31]. Various spatial econometric models provide intuitive insights into the spatial distribution and influencing factors of new retail stores [
32] while also identifying suitable site selection areas [
33]. Moreover, as data volumes and computational demands rise in complex social and geographic environments, machine learning methods can improve the intelligence and precision of site selection models [
18]. Previous research has examined site selection predictions for new retail stores using both single-model approaches [
17] and comparative multi-model analyses [
34], assessing the influence of various factors. Among these, the RF model often demonstrates relatively stable performance [
10,
18,
19,
20]. As a robust ensemble learning method, RF is well suited for handling high-dimensional, nonlinear, and collinear spatial data—common characteristics in urban site selection problems [
35]. In addition, RF provides interpretable outputs, including variable importance scores, and is compatible with SHAP and PDPs, enabling deeper insights into the contribution and directionality of each predictive factor [
36,
37]. Compared to deep learning models such as neural networks, RF performs well with relatively small sample sizes and requires less parameter tuning, which makes it particularly suitable for exploratory spatial analysis with moderate amounts of data [
38].
2.2. Selection of Influencing Factors
The form and spatial distribution of new retail stores differ fundamentally from those of traditional retail, reflecting shifts in consumer behavior, technological dependence, and business strategies. Unlike traditional retail, which often relies on centralized locations such as shopping malls and commercial streets, new retail emphasizes decentralization, integration with online platforms, and rapid adaptation to local demand. This shift has led to the emergence of smaller, more dispersed store layouts—often co-located with transportation hubs, office areas, or residential neighborhoods.
Therefore, site selection and the optimization of new retail store layouts require a comprehensive analysis of the interactions among multiple factors. In addition to conventional factors that reflect suitability for commercial development—such as the natural environment, transportation accessibility, economic conditions, and market demand [
39]—this study also incorporates urban functional zoning and the competitive landscape into feature construction, as these better align with everyday consumption scenarios and target consumer behavior.
The natural environment—particularly topographic features such as elevation and land type—can constrain the use of land for commercial purposes due to differences in environmental carrying capacity and physical accessibility [
10]. Land categories such as water bodies, farmland, and forests can be excluded from commercial development based on land use classification standards [
40].
Transportation accessibility is crucial for attracting customer traffic and ensuring efficient logistics. High road network density and proximity to major roads or public transportation—such as metro and bus stations—are strongly preferred by commercial retailers [
41,
42].
Economic conditions significantly influence commercial investment decisions. Nighttime light intensity is strongly correlated with GDP and serves as an intuitive indicator of regional economic development [
43]. Population density and housing prices further reflect land value and local purchasing power [
44,
45].
Market demand includes specific types of buildings commonly selected by coffee shops, such as commercial centers, schools, and office buildings. The former are typically surrounded by well-developed industries and facilities, offering strong consumer appeal [
46], while in the latter two are concentrated key target groups for coffee shops, including students and office workers—primarily younger consumers [
47].
Urban functional zoning is defined by the density of specific categories of points of interest (POIs) [
48]. Identifying and comparing the preferred functional zones of the studied retail models helps analyze their site selection differences from an urban planning perspective.
The competitive landscape helps assess market saturation and spatial inefficiency. The presence and overlap of same-brand or rival coffee shops reveal both regional demand and the risk of over-distribution. In this study, coffee shops of different brands are treated as competitors. The overlapping service areas among these shops indicate the local demand for coffee, while also suggesting potential inefficiencies in store location allocation.
2.3. Theoretical Framework
Based on different optimization objectives for site selection decisions, the commercial site selection process can be explained by four primary theories: central place theory [
49], the retail gravity model [
50], the theory of minimum differentiation [
51], and bid rent theory [
52]. From a consumer behavior perspective, the first two theories assume that consumers in different regions are equal and uniform and that the retail industry merely needs to respond to consumer demand [
53]. However, many challenges faced by modern retail enterprises stem from increasingly complex and unpredictable consumer behaviors [
54,
55], driven by socioeconomic differentiation among consumer groups. From the perspective of spatial diffusion and location, the spatial expansion of new retail disrupts traditional assumptions of homogeneous plains, as urban spatial structures undergo significant changes [
56]. In this context, new retail models gradually decentralize retail away from traditional shopping centers, leading to the rising prominence of smaller centers. With the emergence of multi-centered urban structures, the monocentric scenarios discussed in bid rent theory no longer fully capture the site selection processes of new retail models.
Nevertheless, traditional theories still offer salient lessons for the layout of new retail businesses. For instance, the retail agglomeration theory, which evolved from the theory of minimum differentiation [
57], provides a valuable explanation for the benefits of clustering. Clusters can reduce uncertainty and risk while fostering healthy competition. These benefits are equally attractive to new retail models. On the other hand, Spatial Interaction Models further emphasize that the interaction of goods and information flows between regions leads to shifts in socio-economic relationships, rather than assuming consumer homogeneity. This highlights that attention to the spatiality of retail regions should not focus solely on economic factors but must also account for the role of urban morphology in analysis [
58]. Thus, explaining the site preferences of new retail businesses requires a nuanced analysis of locational contexts and urban vitality.
In summary, the theory of site selection for new retail should be expanded to encompass a more realistic and universal framework. This framework must account for the “reverse hierarchical” spatial distribution pattern often exhibited by new retail, minimize subjective factors in the complex site selection process, and incorporate the external environmental characteristics reflected in site selection trends. Accordingly, by leveraging multi-source data and machine learning algorithms, we can predict and compare the site selection trends of these two brands, enabling an objective analysis of their distribution preferences within urban spaces. To ensure the feasibility of the site selection results, we align our evaluation with the requirements outlined in urban planning documents.
3. Materials and Methods
3.1. Study Area and Data
3.1.1. Overview of the Study Area and Research Subjects
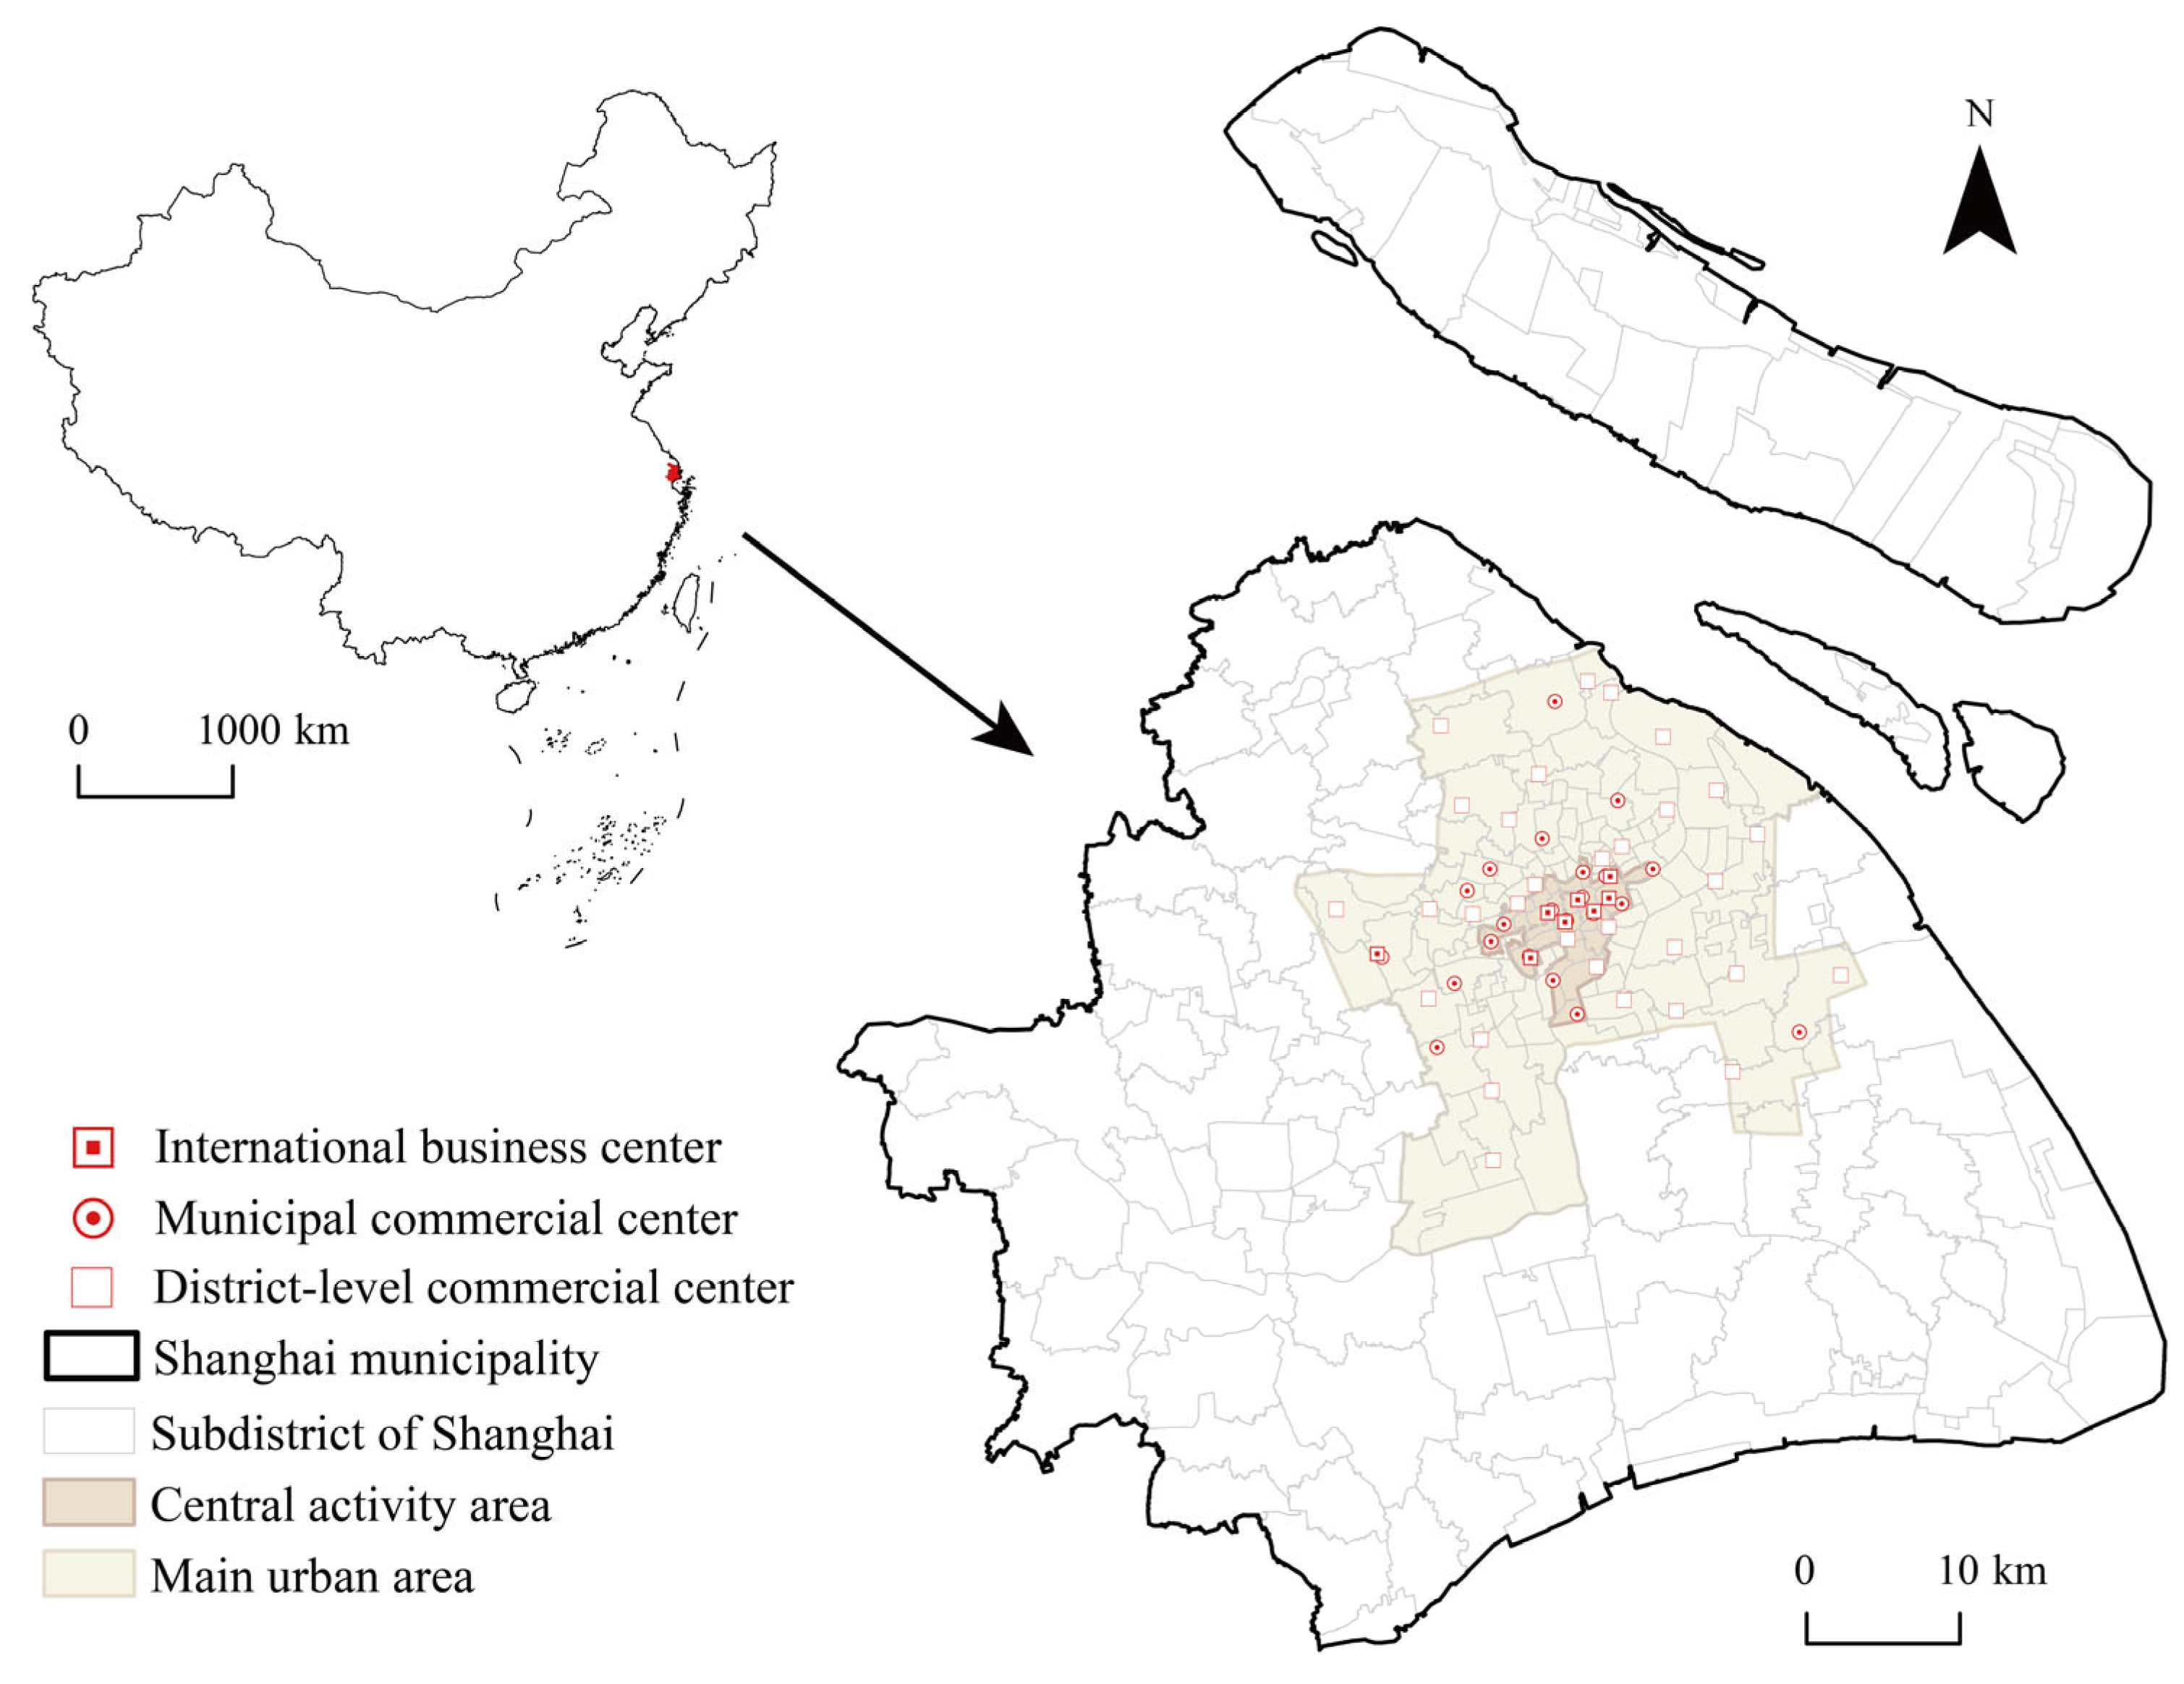
Shanghai, situated at the mouth of the Yangtze River, spans an area of 6341 km
2. According to Shanghai’s commercial planning, the city is divided into the Central Activity Zone and the main urban area (
Figure 1). As the economic center of the Yangtze River Delta and a global hub for economics, finance, trade, and shipping, Shanghai’s geographical advantages and economic vitality have provided new opportunities for the growth of the coffee retail industry. In 2023, Shanghai hosted a total of 9553 coffee shops, ranking first in the nation, with Luckin Coffee and Starbucks holding the top two positions in the city’s coffee market [
59].
Before conducting the site selection model analysis, we performed a comparative analysis of the brand backgrounds and store operation characteristics of Starbucks and Luckin Coffee, as shown in
Table 1. According to Luckin’s 2024 annual report [
60] and Starbucks’s financial statements [
61], there are significant differences between the two brands in terms of store composition and order structure. In terms of store composition, 98.9% of Luckin stores are small-format pick-up stores with a floor area of 20–60 square meters, while only 1.1% are larger relax stores occupying around 120 square meters. In contrast, Starbucks primarily operates relax stores. Regarding order composition, Luckin operates entirely under a mobile internet-driven model, with nearly all orders placed through its app, WeChat mini-programs, or third-party delivery platforms—17.1% of which are delivery orders and 82.9% mobile pick-up orders. By contrast, even during its digital transformation, Starbucks still recorded 48% of its orders as on-site purchases. In addition, the two brands differ significantly in market positioning and marketing strategies, which further highlights the value of comparing their site selection patterns.
3.1.2. Data Sources and Preprocessing
The types, time dimensions, and sources of data used in this study are summarized in
Table 2. This study draws on two primary data sources: offline store data for Luckin Coffee and Starbucks in Shanghai, along with data on relevant influencing factors. The POI data for the stores were sourced from Amap. First, Python and the Amap API were used to scrape the addresses and geographic coordinates of all Luckin Coffee and Starbucks stores in Shanghai. Second, the obtained addresses were verified and filtered through the official websites of Luckin Coffee and Starbucks. After verification, the store data underwent coordinate transformation and cleaning, yielding a final dataset of 1035 Luckin Coffee stores and 1167 Starbucks stores for analysis.
For grid data, the initial step involves geographic registration, followed by standardizing projections and resampling to achieve a uniform resolution size. From the POI data retrieved via Amap, a total of 1,508,610 valid data entries were obtained after cleaning. In line with the research objectives, the Shanghai metropolitan area was subdivided into 100 m × 100 m grids, thus facilitating a multi-source spatial data overlay analysis. The use of a grid division approach ensures consistency across study units [
62], facilitating comparisons and tests while aiding in the integration or deconstruction of multi-source spatial data [
63].
3.2. Methods
3.2.1. Research Framework
The overall research framework of this study is illustrated in
Figure 2 and is divided into five main steps: dataset construction, feature selection, model building, model comparison, and spatial comparative analysis. First, the study area was processed by grid division and overlaid with multiple spatial datasets to construct a geographic dataset. A feature matrix was then created by extracting the grids containing the research objects along with an equal number of negative sample points. Next, the dataset was split into training and testing sets at a 70:30 ratio [
64]. Based on the initial RF model, features were ranked according to their importance scores derived from SHAP values. Starting with the top-ranked feature, variables were incrementally added one by one to build models with increasing dimensionality. For each subset of variables, 20% of the training set was used as a validation set, and model performance was evaluated using accuracy. The subset that achieved the highest accuracy on the validation set was selected for the final model. Subsequently, the RF model was trained on the filtered training set, and its performance was evaluated on the test set. The best-performing model was then selected for final use. Lastly, the suitability for site selection across all grids within the study area was predicted. A set of highly suitable sample points were selected as potential site locations. The distribution of high-probability points was examined using Shanghai’s commercial spatial planning, and a comparative analysis was conducted with actual distribution patterns to test the relative suitability of their layouts.
All data preprocessing, spatial analysis, and machine learning modeling in this study were conducted using the following software: Python 3.9 was used for data processing, model training, and evaluation, primarily relying on the pandas, scikit-learn, matplotlib, and SHAP libraries; and ArcGIS 10.8 was used for spatial data extraction, layer processing, and result visualization.
3.2.2. Feature Extraction
Initially, irrelevant place names were removed from the POI data. Building on the research of Zhao et al. [
11], this study selected universities, shopping malls, office buildings, subway stations, and bus stations for the Euclidean distance analysis to examine the layout preferences of the two types of coffee retail stores. In addition, eleven categories of POI data—including transportation facilities, dining services, residential areas, science and education, cultural facilities, shopping services, life services, medical facilities, scenic spots, sports and leisure facilities, government institutions, and corporate businesses—were chosen for kernel density analysis to reflect the division of functional areas within the city. Land use data were used to extract built-up areas. Using Stata MP 18, a binary variable was created to indicate whether the center of each grid cell falls within a built-up area, with a value of 1 representing built-up and 0 representing non-built-up. To prevent redundancy in the feature factors, subway and bus stations within transportation facilities, higher education institutions within science and education, office buildings within residential areas, and shopping malls within shopping services were excluded during POI processing. A circular area with a radius of 1000 m was defined as the basis for analysis, referencing the stores’ delivery distance and the walking accessibility range of consumers. Finally, the various data types were overlaid with the grid center points and standardized to derive feature variables for each grid. In summary, this study categorizes the data into 26 feature types, as shown in
Table 3.
3.2.3. Feature Selection
In practical machine learning applications, having an excessive number of features does not necessarily improve performance [
65]. A large number of features often leads to increased interdependence among variables and longer model-training times [
36]. SHAP indicates how a given feature contributes to the prediction of a specific data point and determines the direction and magnitude of its influence. This method can be applied to any supervised learning problem requiring feature selection, helping to identify features related to the dependent variable and, thus, improving data understanding and enabling more accurate predictive models. The selected features were further tested using the forward selection method to evaluate how changes in the feature count affected model performance on the validation set.
3.2.4. Model Construction and Interpretation Methods
This study applies the RF model to conduct probability prediction for the site selection of Luckin Coffee and Starbucks in Shanghai. First, grids containing Luckin Coffee and Starbucks stores are overlaid with an equal number of negative sample points, along with their feature values, to create the training dataset. The training dataset is then split into a training set (D) and a test set (S) in a 70:30 ratio, according to practical requirements [
64].
The SHAP value is used to determine the feature importance for each research object. SHAP is a game-theoretic approach that explains the contribution of each feature to the model’s prediction by computing the marginal contribution of each feature across all possible combinations. The SHAP value for a feature i is defined as Equation (1):
where
is the set of all features,
is a subset of features not containing
, and
is the model output when only features in
are present.
The PDPs illustrate the dependency between the target response and a set of “target” features while marginalizing the values of other features [
66]. Intuitively, partial dependence can be interpreted as a function of the expected target response with respect to the “target” feature. Although feature importance reflects the contribution of a feature to the model, the use of PDPs provides insights into how a feature influences predictions.
3.2.5. Model Validation and Evaluation
Machine learning requires quantitative evaluation metrics to assess model performance. For classification model results, this study uses accuracy, precision, recall, F1 score, and area under the receiver operating characteristic curve (AUC) to evaluate performance. The first four metrics are based on the confusion matrix, while the AUC represents the probability that a randomly selected positive sample has a higher score than a negative sample. Although a classification model was used, the model outputs the predicted probability of each grid cell being classified as the positive class. To evaluate model performance using standard classification metrics, a threshold of 0.5 was applied to convert the predicted probabilities into binary classification results. The formulas are as follows:
where TP represents the number of true positive samples, TN represents the number of true negative samples, FP represents the number of false positive samples, and FN represents the number of false negative samples.
represents the sample index; M and N denote the number of positive and negative samples, respectively; and
the sum of positive sample indices.
4. Results
4.1. Variable Selection
The SHAP plot reflects both the magnitude and direction of each feature’s contribution to the model, with wider color bands indicating greater feature importance. As illustrated in
Figure 3, the key influencing factors contributing significantly to the spatial layout of both brands exhibit a certain degree of similarity and consistent directional effects, highlighting the commonalities in site selection for coffee shops under the new retail model.
In terms of urban functional areas, both brands show a preference for locations near science and education cultural facilities (X16) and transportation facilities (X13). This spatial arrangement helps attract highly educated consumers, enhances brand image, and improves store accessibility while increasing customer foot traffic. The distance to the nearest office building (X11) is a major contributing factor for both brands, whereas the distance to the nearest university (X12) is more significant for Luckin Coffee. As an early adopter of the new retail model, Luckin targets a broader customer base compared to Starbucks.
Notably, population density (X15) has a positive impact on Luckin’s distribution but does not significantly affect Starbucks. High population density can generate substantial customer traffic, which Luckin leverages by establishing multiple convenient pickup locations in these areas to meet the instant demands of consumers with fast-paced urban lifestyles. By contrast, Starbucks may prioritize the quality of site selection over quantity, favoring locations such as business districts and high-end shopping centers. Although these locations may not have the highest population density, they offer stronger purchasing power and higher brand loyalty among consumers.
According to our comparison, dining service (X14), distance to the nearest competitor (X24), and competitor density (X25) exert varying degrees of influence on both brands. Moreover, market agglomeration positively impacts the spatial distribution of both brands. According to spatial competition theory, the differences in transportation costs arising from geographic dispersion can weaken the intensity of market competition to varying degrees [
67]. Coffee shops of similar types tend to cluster around core commercial areas to maximize market share, while the symbiotic spatial layout of different coffee brands also demonstrates a high degree of complementarity.
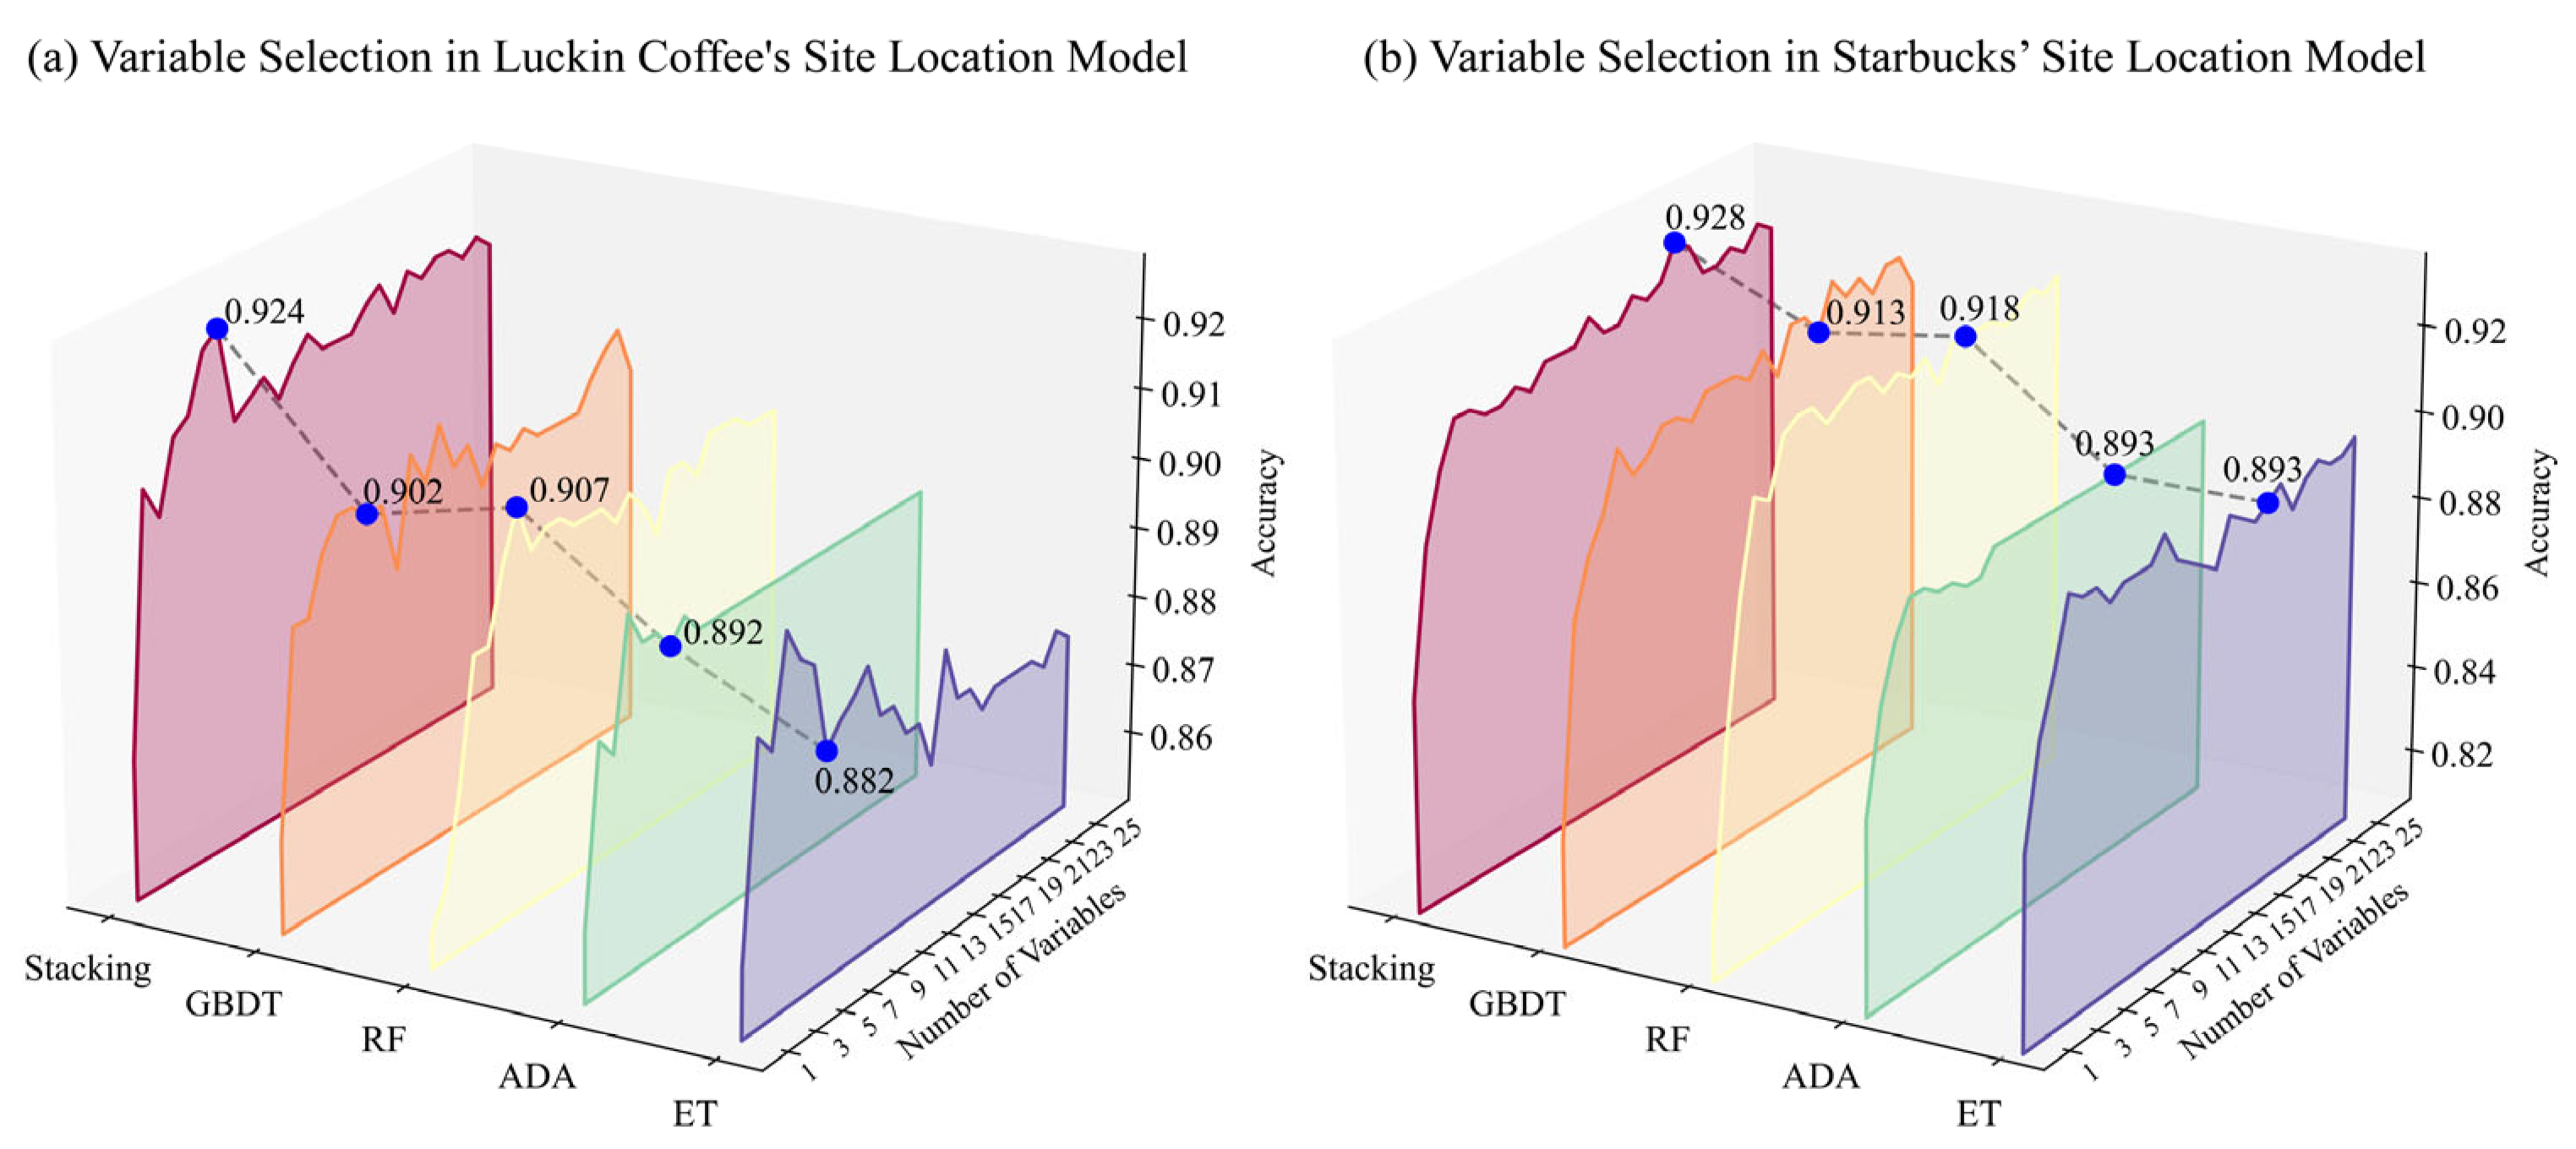
Decision tree-based methods are particularly advantageous in capturing nonlinear relationships [
37]. Therefore, we compared several tree-based algorithms—GBDT, RF, Extra Trees (ET), and AdaBoost (ADA)—as well as the Stacking ensemble method to assess the appropriateness of the model selection. As shown in
Figure 4, RF demonstrates greater stability across the different feature set sizes compared to the other models. Although Stacking achieves peak accuracy with fewer features, its overall improvement is marginal. Moreover, the complexity of the Stacking model makes it less interpretable in terms of feature importance. For these reasons, RF was ultimately selected as the primary model in this study.
The selected RF model was applied in the forward feature selection process. As shown in
Figure 5, the accuracy of the Luckin Coffee model reaches its peak at 0.910 with 14 features, while the Starbucks model achieves its highest accuracy of 0.924 with 18 features.
4.2. Feature Importance
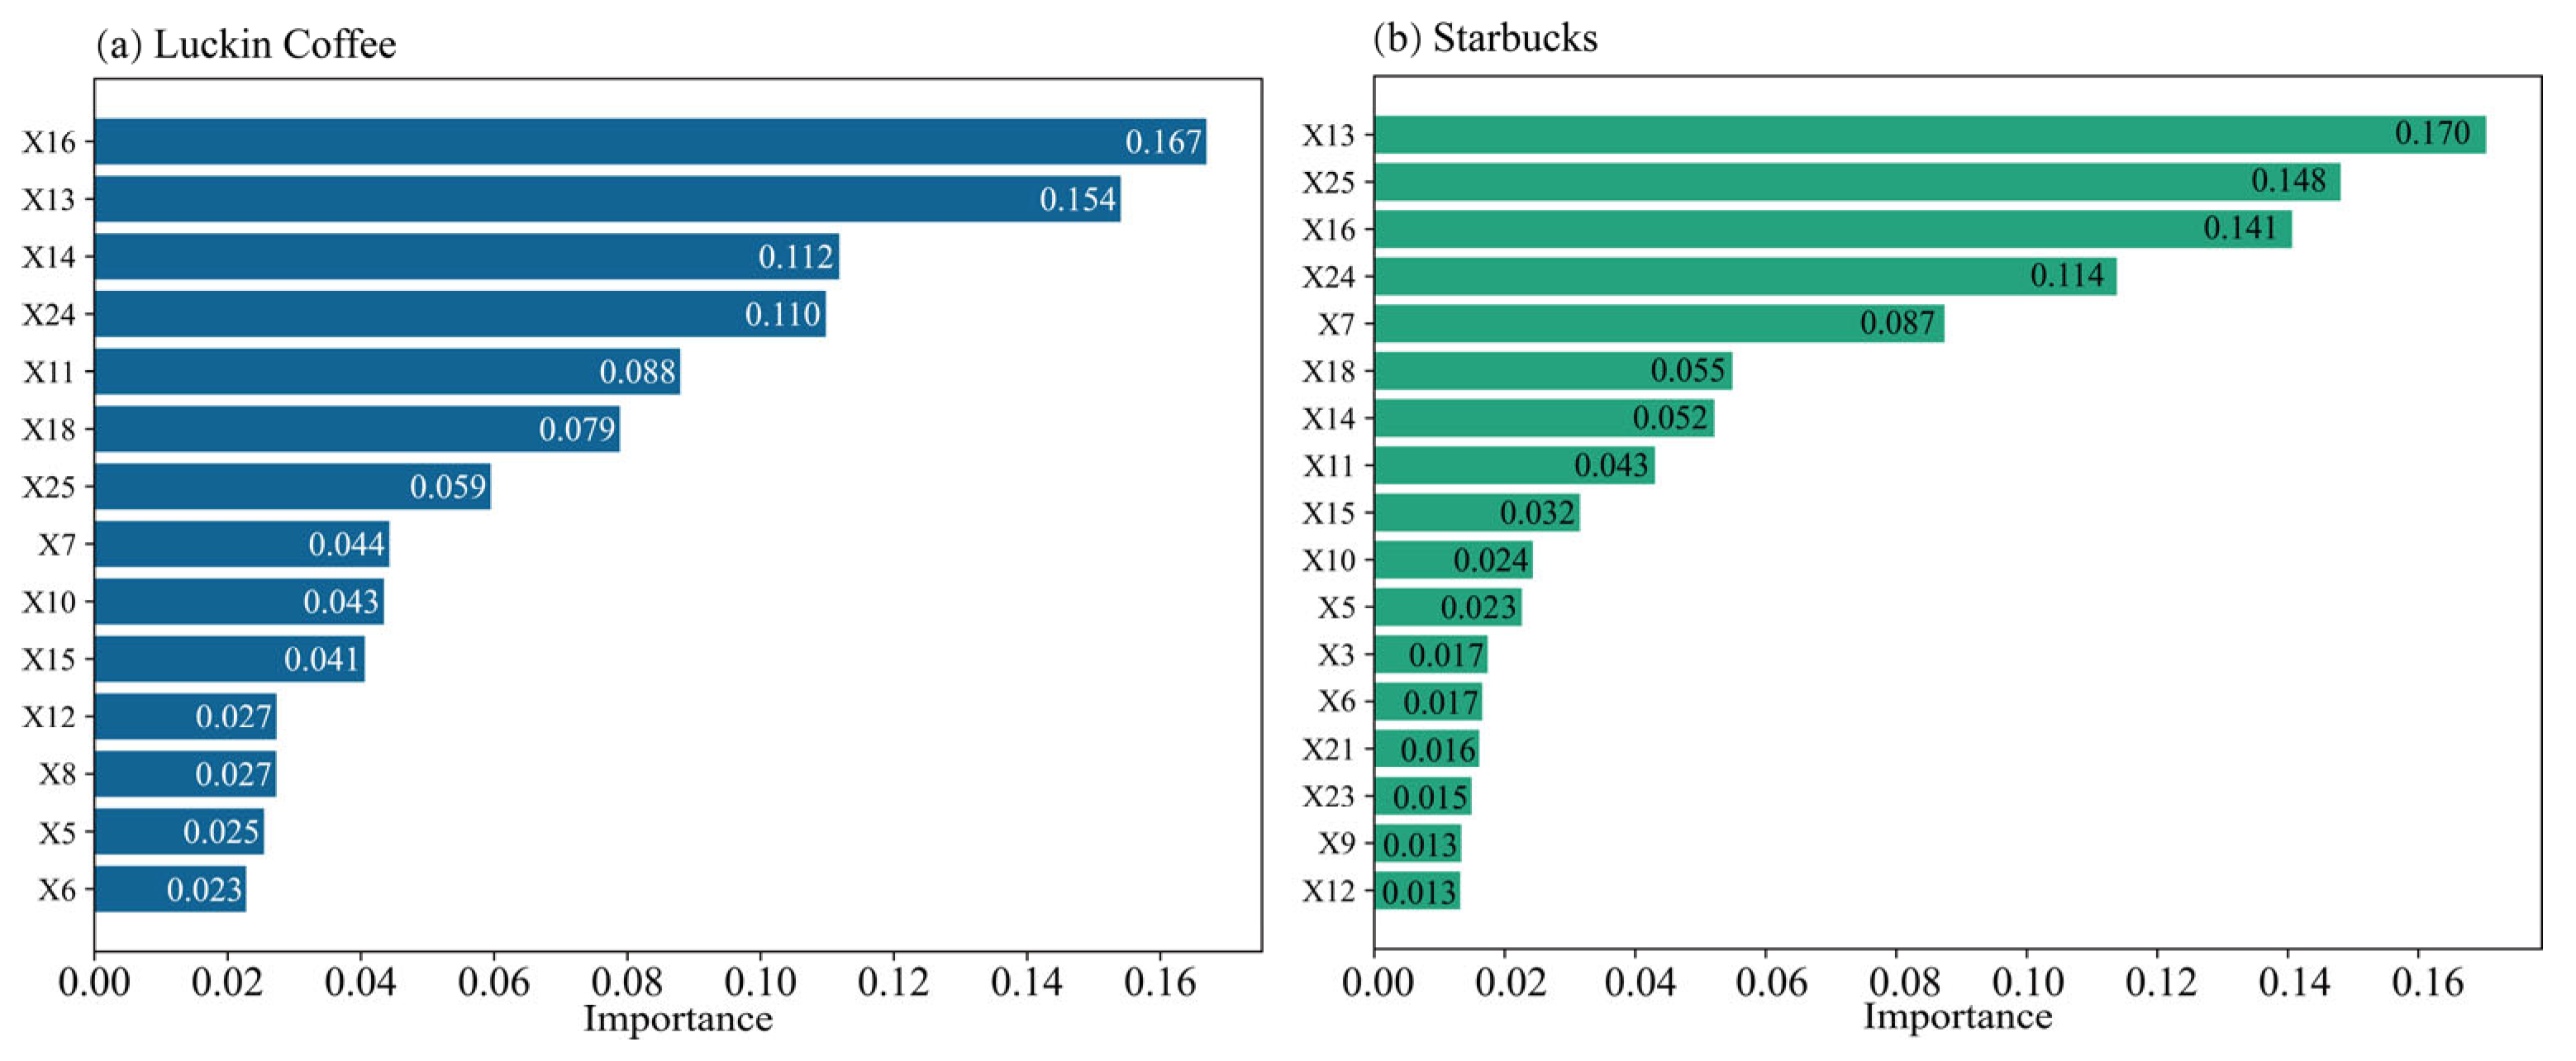
Based on feature importance and model accuracy, the following variables were identified as key influencers of location preferences (see
Table 4). PDPs were generated for the selected features to quantitatively analyze their impact on the spatial distribution of both brands.
Although RF is generally robust to multicollinearity, this study further examined multicollinearity among the selected features to ensure data quality. Variance Inflation Factors (VIFs) were calculated, and most features were found to have VIF values below 10, indicating no serious multicollinearity issues overall. Therefore, all features were retained in the model to preserve information completeness. The feature importance rankings are shown in
Figure 6.
The results of the PDPs are shown below (see
Figure 7). In terms of urban structure, nighttime light data (X7) and road network density (X3) have a positive impact on the spatial distribution of both brands, while topography (X1) exerts a negative influence. Notably, these three factors have a stronger impact on Starbucks than on Luckin Coffee. Additionally, the peak effect of land rent (X9) on Starbucks is positioned to the right of that for Luckin, indicating that Starbucks has a higher tolerance for selecting locations in prime commercial areas compared to Luckin. Even after integrating online sales channels, Starbucks continues to maintain high operational costs. This strategy reflects its reliance on brand strength and customer loyalty to sustain competitiveness in high-cost locations. Such an approach benefits Starbucks in terms of brand promotion and market influence.
Population density (X8) has an opposite effect on Luckin Coffee and Starbucks. In areas where the population density exceeds 95 people per 10,000 m2, its contribution to Luckin’s site selection surpasses that of Starbucks. In densely populated areas, such as city centers or university neighborhoods, Luckin benefits from its low pricing and convenience-oriented model, effectively attracting customers. By contrast, Starbucks’s performance in these regions may be constrained by its premium brand positioning and pricing strategy, which make it less competitive than Luckin in high-density areas.
In terms of proximity to nearby facilities, distance to the nearest subway entrance (X5), distance to the nearest mall (X10), and distance to the nearest office building (X11) have a similar level of influence on both brands. However, distance to the nearest bus stop (X6) and distance to the nearest university (X12) show significant differences in their impact, with Luckin’s fitted curve having a greater absolute slope than that of Starbucks, indicating a higher sensitivity to these factors. This suggests that, compared to Starbucks, Luckin places greater emphasis on location factors that cater to students and commuters who require fast and convenient service.
In terms of urban functional zones, the fitted curves of both brands show similar distribution patterns for dining services (X14), science and education cultural facilities (X16), and life services (X18), indicating that their market strategies and consumer appeal are relatively aligned in these areas. However, there are notable differences in peak values for transportation facilities (X13), residential areas (X15), and corporate businesses (X23). Starbucks exhibits a stronger attraction to high-traffic and office-dense areas, whereas residential areas contribute more to Luckin’s distribution. Notably, leisure facilities (X21) have completely opposite effects on the two brands. This contrast may stem from the fact that Starbucks’s store locations often signify a vibrant commercial atmosphere and high population activity. Areas with dense transportation, office spaces, and leisure facilities present stronger growth potential compared to residential neighborhoods, as visitors to these locations tend to have higher spending power.
In terms of industry competition, the fitted curves for distance to the nearest competitor (X24) and competitor density (X25) indicate that both brands exhibit a high level of tolerance for competition. Additionally, areas with a high concentration of coffee shops contribute more significantly to Starbucks’s site selection. This strategy allows Starbucks to leverage the existing coffee culture and customer flow while benefiting from the clustering effect. Moreover, the highly competitive environment encourages each store to enhance its service quality and product innovation to attract and retain customers.
4.3. Predictive Results and Spatial Analysis
4.3.1. Potential Site Locations
Hyperparameter tuning was conducted using a grid search with five-fold cross-validation on the training set. Cross-validation further partitions the training data to evaluate the performance of different hyperparameter combinations. After identifying the best-performing combination, the model was retrained on the full training set using the selected hyperparameters. The selected hyperparameters are presented in
Table 5.
Using the trained models, predictions were made on the training set, and the results are presented in
Table 6. The site selection model for Luckin Coffee achieved an accuracy of 0.900, while the model for Starbucks reached 0.922. A ROC value of 0.5 indicates that the model lacks any predictive capability. Evidently, both models demonstrate strong performance in predicting site selection outcomes. The prediction results are presented in
Figure 8.
Commercial consumption clusters, as the core framework for constructing urban consumption space networks, play a crucial role in supporting economic development. Therefore, this study uses the international-, municipal-, and district-level commercial centers, as defined in Shanghai’s commercial spatial planning, as reference urban planning landmarks for site selection. The average probabilities for these centers were calculated. As shown in
Table 7, both brands exhibit probabilities exceeding 0.7 around international and municipal commercial centers, which are significantly higher than their respective probabilities around district-level centers. Consequently, this study adopts international-level commercial centers and actual commercial centers as landmarks for subsequent fine-scale site selection.
4.3.2. Site Selection Recommendations
From September 2022 to November 2023, the number of Starbucks stores in Shanghai increased from 1000 to 1113. Based on this, the number of new stores in this study was set to 100. Excluding grids with existing stores, the remaining grids were evaluated, and the top 100 grids with the highest predicted probabilities were identified as prime candidates for future store locations. Because most high-probability points are located in the city center and significantly overlap with the locations of international- and municipal-level commercial centers, these two levels of commercial centers are selected for further site selection prediction and validation. This approach aims to provide recommendations for new retail store site selection and the sustainable development of commercial consumption spatial patterns.
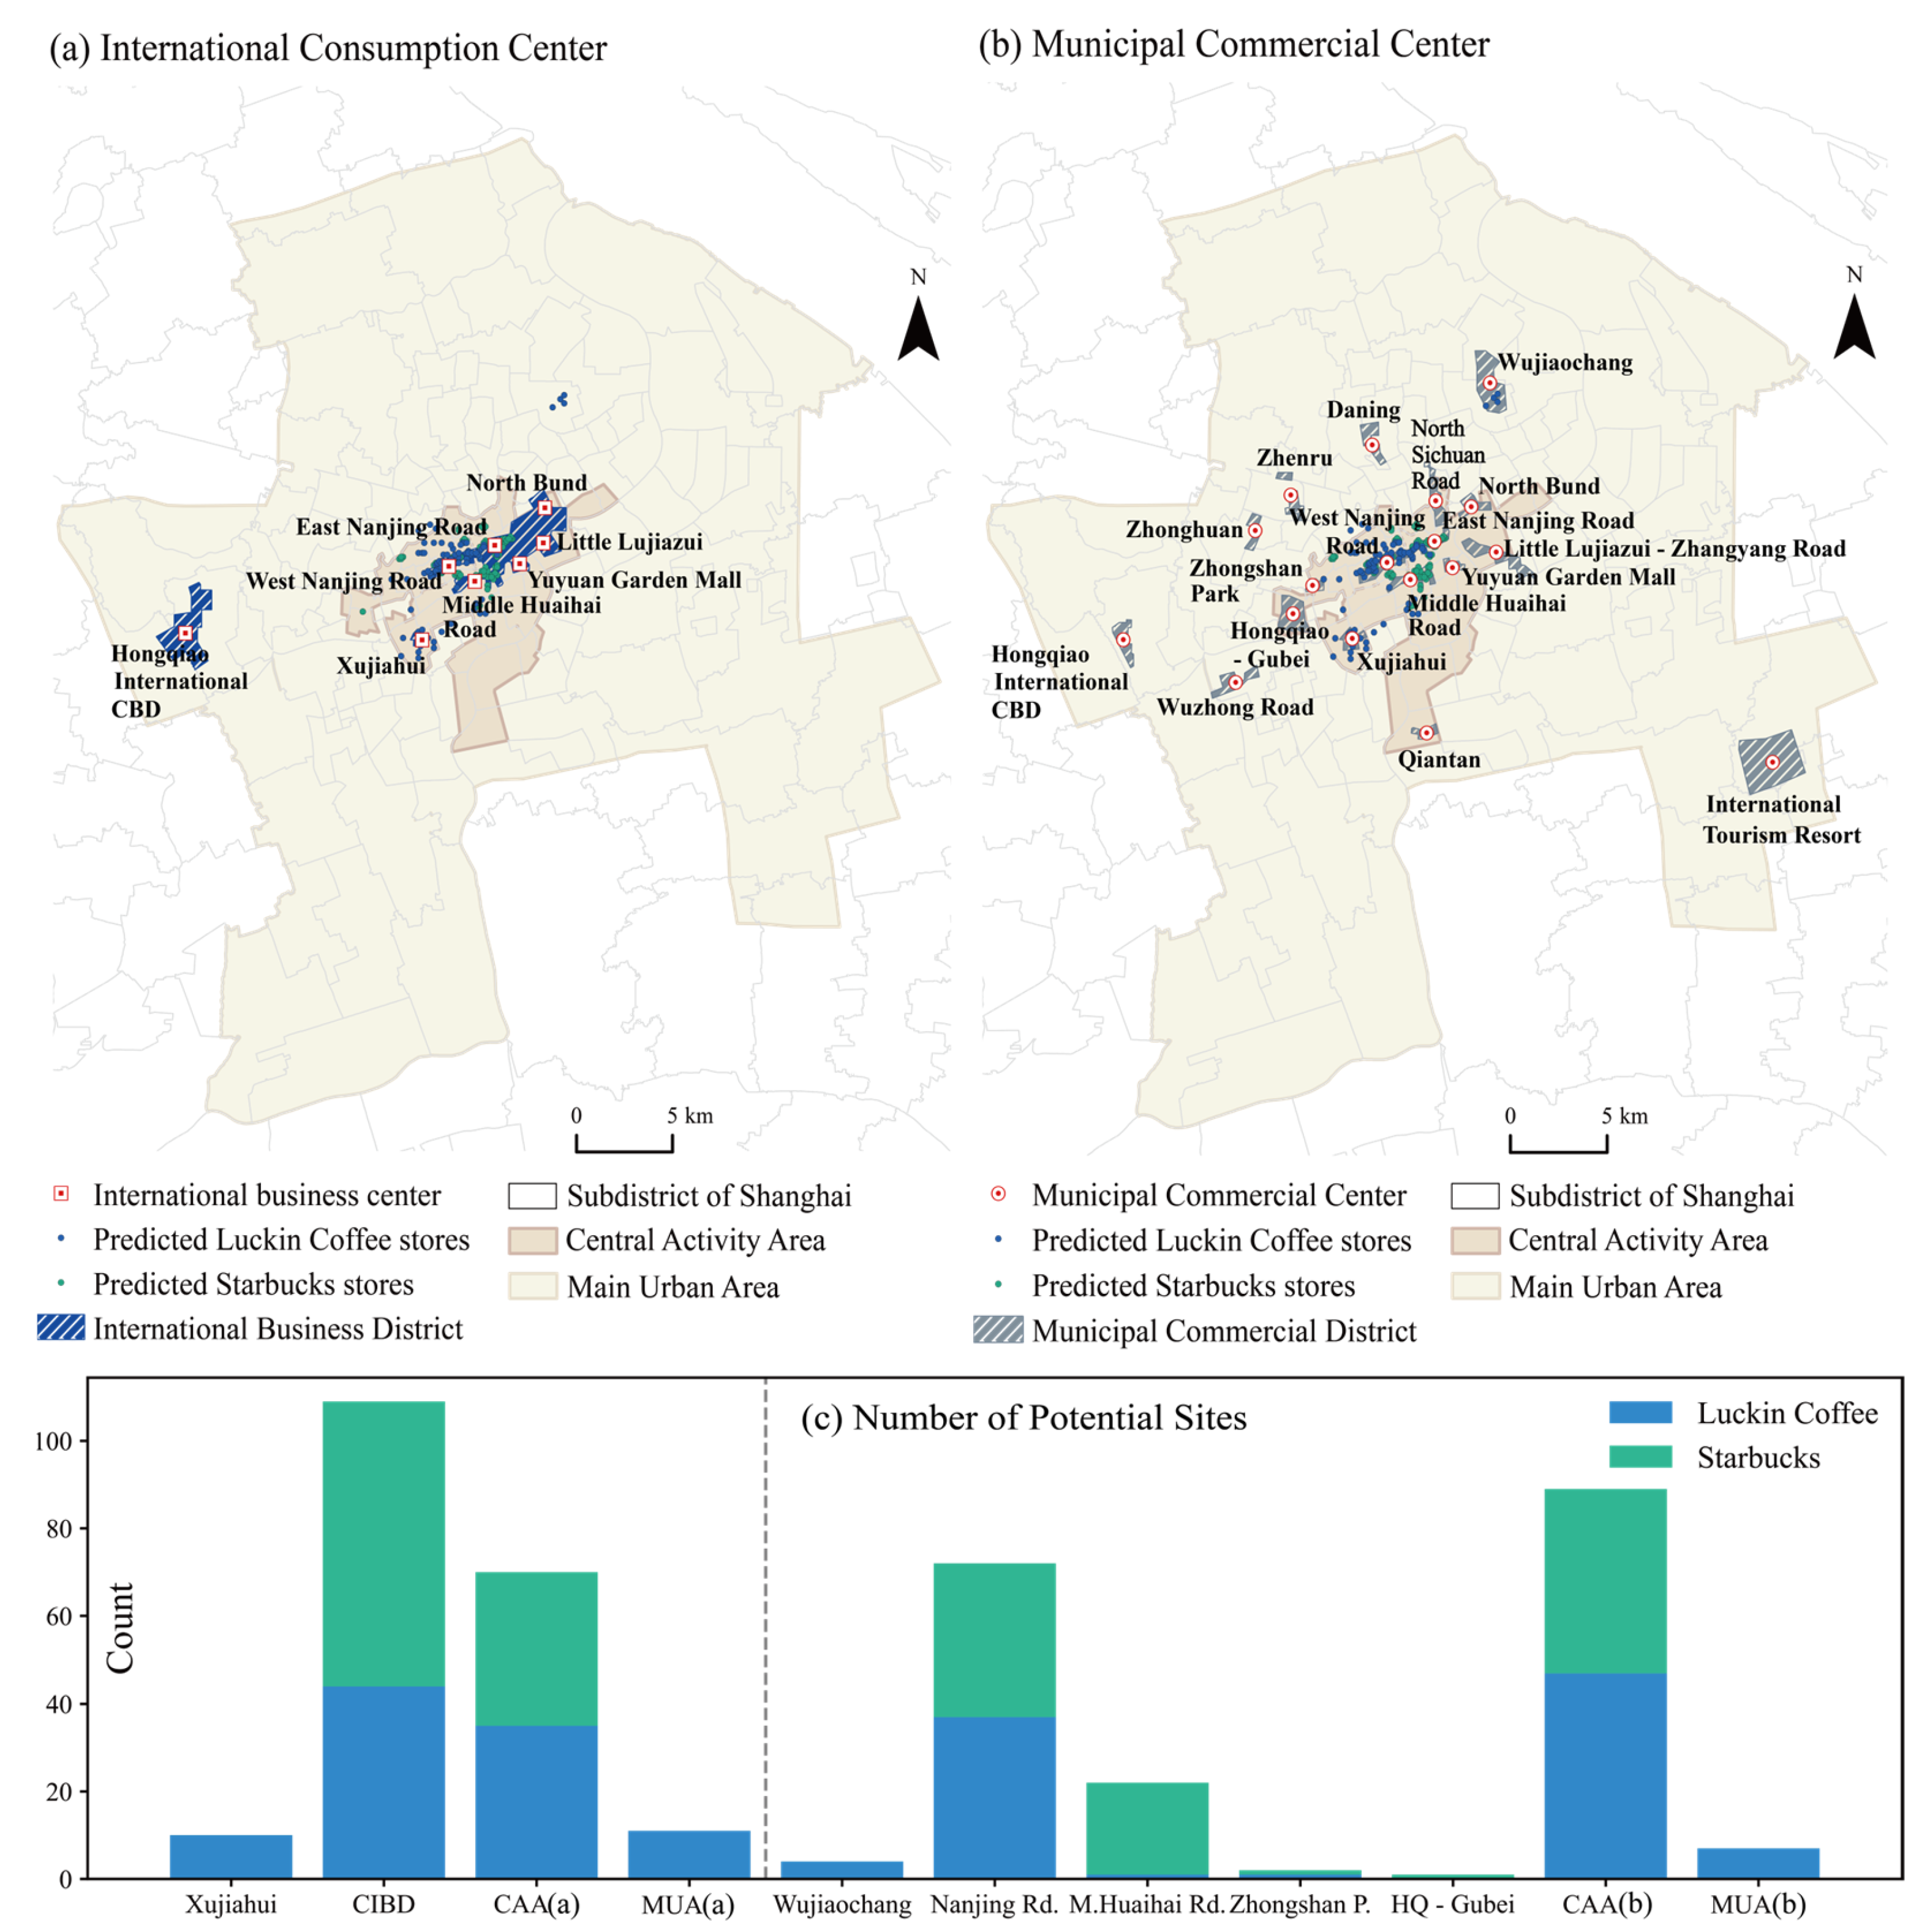
We delineated the aggregation zones for each non-future commercial center in
Figure 9. For international-level commercial centers, due to the overlapping aggregation zones of West Nanjing Road, East Nanjing Road, North Bund, Little Lujiazui, Yuyuan Garden Mall, and Middle Huaihai Road, these areas are combined into the Central International Business District (CIBD). Within this area, there are 65 candidate sites for Starbucks and 44 for Luckin Coffee. Starbucks’s candidate sites are primarily concentrated around West Nanjing Road, East Nanjing Road, and Middle Huaihai Road, whereas Luckin Coffee’s candidate sites are predominantly located around Middle Huaihai Road. Additionally, Starbucks’s other high-probability points are distributed within the Central Activity Zone, without clustering around other international commercial centers. By contrast, Luckin Coffee has 10 high-probability points in the Xujiahui commercial center aggregation zone and 35 in the Central Activity Zone, and the remainder are scattered throughout the main urban area.
For municipal-level commercial centers, we merged the overlapping aggregation zones of East Nanjing Road and West Nanjing Road into Nanjing Road, where Luckin Coffee and Starbucks show similar numbers of candidate sites, with 37 and 35, respectively. Luckin Coffee’s other high-probability points are primarily located in Xujiahui and Wujiaochang, whereas Starbucks exhibits a higher site selection probability along Middle Huaihai Road.
To further refine the high-probability points, this study calculates kernel density values for existing stores and normalizes them as realistic suitability. By subtracting realistic suitability from the estimated suitability derived from the calculated probabilities, we obtain relative suitability, which is used to evaluate whether high-probability points around commercial centers are viable for site selection. From
Figure 10, it can be observed that Luckin Coffee exhibits relative suitability values below 0 in international commercial centers such as East Nanjing Road, West Nanjing Road, and Middle Huaihai Road. In the Xujiahui international commercial center, the relative suitability approaches 0, indicating that although these areas have high site selection probabilities, opening new stores in these regions would face considerable pressure. On the other hand, Starbucks still has the potential to open new stores in the West Nanjing Road international commercial center.
For municipal-level commercial centers, East Nanjing Road and West Nanjing Road similarly attract a large number of high-probability points for both brands. Starbucks also has a notable number of high-probability points on Middle Huaihai Road. However, opening stores in these commercial aggregation zones would similarly face significant challenges. Conversely, the high-probability points for Luckin Coffee in Wujiaochang face less competitive pressure, which makes it a suitable area for new store openings.
5. Discussion
From the perspective of influencing factors, the influence of natural environment, transportation accessibility [
41,
42], and economic conditions [
43,
44,
45] on store layout is gradually diminishing for both brands. In terms of urban functional zones, science and education cultural facilities (X16) and transportation facilities (X13) have a positive influence on site selection for both brands but exhibit clear marginal effects. This suggests that the two brands share similar spatial preferences regarding urban functional zones and that in areas with excessive concentration or intense competition, stores may face diluted customer traffic and overlapping services, thereby reducing the marginal value of site selection. Distance to the nearest competitor (X24) and competitor density (X25) represent micro- and macro-level competitive factors, respectively. These factors show threshold and marginal effects on the two brands. The impact of competitor density (X25) is weaker for Luckin, which indicates that Starbucks is better positioned to leverage high-density commercial clusters to generate brand agglomeration effects and market recognition spillovers. This aligns with Starbucks’s strategic emphasis on “social experiences” and “brand value”. By contrast, Luckin tends to pursue rapid market penetration by avoiding saturated areas, thereby enhancing operational efficiency and reducing customer acquisition costs. The observed nonlinear effects are also consistent with the findings of Gao [
21]. This shift from traditional factors to urban functional variables further underscores the enduring relevance of foundational concepts from location and diffusion theory—such as market demand, market competition, and agglomeration—even in the era of new retail, albeit in evolved forms [
68].
In terms of urban spatial planning, Starbucks and Luckin Coffee exhibit stark differences in probability and suitability within the Central Activity Zone and the main urban area. Both brands currently face the issue of high probability but low suitability in their layouts within the Central Activity Zone, indicating increasingly limited opportunities for growth by simply expanding the number of stores. The Eastern International Consumption Cluster, as a commercial hub of Shanghai, includes East Nanjing Road, Middle Huaihai Road, and Xujiahui, all of which contain numerous high-probability site selection points. However, these areas already have dense store layouts in reality, which leads to challenges such as homogeneous competition, service overflow, and significant diminishing marginal returns for both brands. Notably, West Nanjing Road still offers development potential for Starbucks. The area’s well-crafted commercial spaces, combining artistic comfort with recognizable public spaces, and its strong brand presence create a favorable environment for Starbucks to further grow and differentiate itself in the market. Notably, the International Tourism Resort commercial center within the main urban area demonstrates high suitability exclusively for Starbucks. Centered around Disneyland, this area benefits from a consumer base with high spending power. Even without relying on an integrated online–offline approach, Starbucks can leverage the new retail model to provide customized products and services, capitalizing on the area’s unique market characteristics.
The location strategies of Starbucks and Luckin Coffee should not be viewed as a rejection of classical location theory but rather as adaptations and extensions under the logic of new retail. Starbucks consistently favors high-rent, high-footfall areas such as central activity zones, aligning with central place theory and bid rent theory, both of which emphasize accessibility and the willingness to pay for centrality. By contrast, Luckin Coffee’s dispersed layout supports the emerging polycentric urban spatial model. This indicates that new retail formats are challenging the monocentric assumption by increasingly prioritizing convenience, density, and localized demand over central prestige. The threshold effect at the micro scale (distance to the nearest competitor) and the marginal effect of saturation at the macro scale (competitor density) reflect the logic of the theory of minimum differentiation and its extensions into retail agglomeration theory. Starbucks thrives in highly saturated clusters, benefiting from brand-driven agglomeration and synergistic foot traffic. Meanwhile, Luckin Coffee actively avoids oversaturated areas, which reflects a strategy of competitive avoidance.
Overall, addressing site selection tasks through an integrated planning approach will not only sustain and encourage the layout and development of new retail stores in urban centers but also extend these efforts to suburban areas. This strategy promotes mutual reinforcement between suburban and central commercial centers, fostering balanced urban development.
6. Conclusions
This paper offers a novel perspective on the comparative analysis of the new retail model. The study area is divided into 100 m × 100 m small-scale grids, and a feature matrix is constructed based on the spatial data of the research subjects. Machine learning methods are used to filter out the key features of both subjects, predicting their location suitability. SHAP and PDPs are employed to compare and interpret the spatial drivers underlying the site selection mechanisms of the two brands. Furthermore, high-probability grids are overlaid with urban planning maps to guide future site selection strategies in alignment with formal spatial planning frameworks.
The findings reveal that urban functional variables—such as transportation and educational facilities—as well as the competitive landscape increasingly influence store location decisions. In Shanghai’s nearly saturated international business centers, West Nanjing Road still presents growth potential and is well suited for further expansion by Starbucks. By contrast, Luckin Coffee is better positioned to expand in municipal-level commercial centers, where the competitive intensity is relatively lower. These observations suggest that the new retail model necessitates a reconfiguration of spatial layout strategies in response to varying degrees of market saturation and urban functional structures. Rather than relying exclusively on central business districts, new retail brands are increasingly integrating localized demand, competitive dynamics, and functional zoning into their site selection strategies—signaling a broader shift toward more data-driven, adaptive, and decentralized approaches to urban commercial planning.
Overall, this study demonstrates the value of integrating machine learning and GIS in understanding and optimizing urban retail site selection, while also highlighting the importance of aligning site selection outcomes with formal urban planning documents. The proposed approach offers a scalable, data-driven framework that contributes to both academic research and practical urban commercial planning.
However, this study also has several limitations. This research divides the area into 100 m × 100 m grids. Although this scale is fine-grained, there is a potential issue of weak spatial heterogeneity between adjacent grids. A comparative analysis with larger-scale grids could be conducted in future studies. The analysis assumes that all site selection decisions are driven by brand-level strategic considerations. However, in practice, many new store openings—particularly for Starbucks—may be initiated by franchisees or influenced by local partners. These decentralized decisions may not strictly follow the optimization logic reflected in the model. Additionally, due to the deterioration of the global economic environment, the accompanying issue of consumption downgrading is likely to have a greater impact on Starbucks compared to Luckin Coffee.


