Article

Micro-Terrain Recognition Method of Transmission Lines Based on Improved UNet++

School of Geodesy and Geomatics, Wuhan University, Wuhan 430079, China
*
Author to whom correspondence should be addressed.
ISPRS Int. J. Geo-Inf. 2025, 14(6), 216; https://doi.org/10.3390/ijgi14060216
Submission received: 1 April 2025 / Revised: 25 May 2025 / Accepted: 27 May 2025 / Published: 30 May 2025

Abstract

Micro-terrain recognition plays a crucial role in the planning, design, and safe operation of transmission lines. To achieve intelligent and automatic recognition of micro-terrain surrounding transmission lines, this paper proposes an improved semantic segmentation model based on UNet++. This model expands the single encoder into multiple encoders to accommodate the input of multi-source geographic features and introduces a gated fusion module (GFM) to effectively integrate the data from diverse sources. Additionally, the model incorporates a dual attention network (DA-Net) and a deep supervision strategy to enhance performance and robustness. The multi-source dataset used for the experiment includes the Digital Elevation Model (DEM), Elevation Coefficient of Variation (ECV), and profile curvature. The experimental results of the model comparison indicate that the improved model outperforms common semantic segmentation models in terms of multiple evaluation metrics, with pixel accuracy (PA) and intersection over union (IoU) reaching 92.26% and 85.63%, respectively. Notably, the performance in identifying the saddle and alpine watershed types has been enhanced significantly by the improved model. The ablation experiment results confirm that the introduced modules contribute to enhancing the model’s segmentation performance. Compared to the baseline network, the improved model enhances PA and IoU by 1.75% and 2.96%, respectively.

1. Introduction

Transmission lines are a critical component of power systems. Their safe operation is not only essential for stable electricity transmission, but also closely tied to the normal functioning of society. When power is transmitted over large regions, transmission lines often traverse areas with complex terrain, which imposes greater challenges for their design, construction, and maintenance. Because the differences in micro-terrain can affect the stability and orientation of transmission lines and increase construction challenges. For instance, specific types of micro-terrain, such as alpine watersheds, may expose lines to geological hazards like landslides and mudslides during construction and operation phases. Additionally, the effects of varying micro-terrain on wind, ice, and snow can intensify pressure on transmission lines, causing faults in transmission lines [1]. To ensure the long-term stability of transmission lines, it is essential to thoroughly investigate methods for identifying micro-terrain. Accurate classification of micro-terrain during the planning stage can help avoid disaster-prone areas, optimize line site selection, and reduce the impact of external hazards on power transmission lines. Furthermore, integrating micro-terrain classification results with meteorological and geological data enables relevant personnel to conduct risk assessments during transmission line operations and implement timely preventive maintenance strategies.
Research on micro-terrain identification surrounding transmission lines mainly focuses on how to calculate various terrain features from Digital Elevation Model (DEM) data and develop classification rules. For instance, Hu et al. [2] explored a method to extract ice-covered saddles near transmission lines by combining terrain feature lines and terrain factors. The identified locations showed strong consistency with the distribution of severe ice-covered disasters affecting transmission lines. However, the complexity of extracting feature lines renders this method unsuitable for large-scale saddles identification. To improve efficiency, Zhou et al. [3] developed a classification decision table to identify micro-terrain around transmission lines. The decision table incorporated four terrain features, such as slope, undulation, and two different scales of the Topographic Position Index (TPI) [4]. However, the limited samples employed to construct the decision table reduced the method’s applicability, resulting in poor performance when distinguishing saddles from canyons, which are often misclassified. Traditional micro-terrain recognition methods rely heavily on heuristic rules, making their results sensitive to subjective factors. Additionally, these approaches often suffer from issues such as incomplete classification and limited automation.
To improve the accuracy of terrain recognition, several studies have explored machine learning methods for micro-terrain identification. Zou [5] selected the terrain factors such as plane curvature, profile curvature, slope, and elevation to construct datasets and employed the support vector machine (SVM) algorithm to identify mountain micro-terrain. This method achieves high recognition accuracy; however, the process of generating sample datasets remains cumbersome. Machine learning methods offer improved accuracy compared to traditional micro-terrain recognition approaches; however, they require considerable effort in the early stages to compute and integrate terrain factors, and their level of automation remains limited. Furthermore, these approaches do not automatically extract the geographic information embedded within the data, which often limits generalization capability across varying micro-terrain environments.
The terrain recognition task primarily focuses on the automatic identification and segmentation of complex terrain in natural environments. However, traditional approaches struggle to handle the diversity of terrain types and the complexity of scenes. In recent years, deep learning algorithms have made rapid progress. In 2014, Fully Convolutional Networks (FCNs) [6] were introduced, marking the advent of deep learning semantic segmentation. Since then, numerous semantic segmentation models, including UNet [7], PSPNet [8], SegNet [9], RefineNet [10], and DeepLab series [10,11,12,13,14], have been proposed and widely adopted in autonomous driving, medical image diagnosis, virtual reality, human–computer interaction, and other fields. Deep learning-based semantic segmentation technology has provided new opportunities for terrain recognition due to its robust feature learning capabilities and efficient end-to-end training framework. Du et al. [15] designed a pyramid deep learning model to adaptively extract geomorphic features and effectively leverage spatial context. The model effectively extracted multimodal geomorphic features and integrated multi-scale features, significantly enhancing the accuracy of terrain classification. Bajaj et al. [16] applied three deep learning models, namely Convolutional Neural Network (CNN), Convolutional Autoencoder, and UNet, to terrain classification and compared their performance. Yang et al. [17] utilized the FCN-ResNet framework to develop a semantic segmentation model for large-scale terrain classification. In this model, ResNet was used to extract features, while FCN was used to generate pixel-level terrain recognition results. In their study, Yang et al. [17] achieved promising results by utilizing only DEM data to learn semantic information. Ouyang et al. [18] proposed a multimodal deep learning geomorphology recognition framework based on the regional geological background and channel attention, aiming to address the limitation that current geomorphology classification approaches neglect regional geological context.
In general, the existing micro-terrain recognition approaches exhibit certain limitations. Although terrain recognition approaches are evolving towards greater diversity, with increasing emphasis on the adoption of deep learning-based semantic segmentation techniques, they have rarely been applied in the field of micro-terrain recognition for transmission lines.
Building upon previous research, this paper employs deep learning-based semantic segmentation technology to identify micro-terrain along transmission lines. We propose an improved approach based on UNet++ [19,20], which expands the single encoder into multiple encoders to accommodate multi-source terrain feature inputs and introduces the gated fusion module (GFM) [21], dual attention network (DA-Net) [22], and deep supervision strategy [23] to enhance the segmentation performance of the improved model. The method proposed in this article aims to achieve automatic and intelligent recognition of the micro-terrain along transmission lines by leveraging the robust feature learning capabilities and the efficient end-to-end training framework of deep learning.

2. Materials and Methods

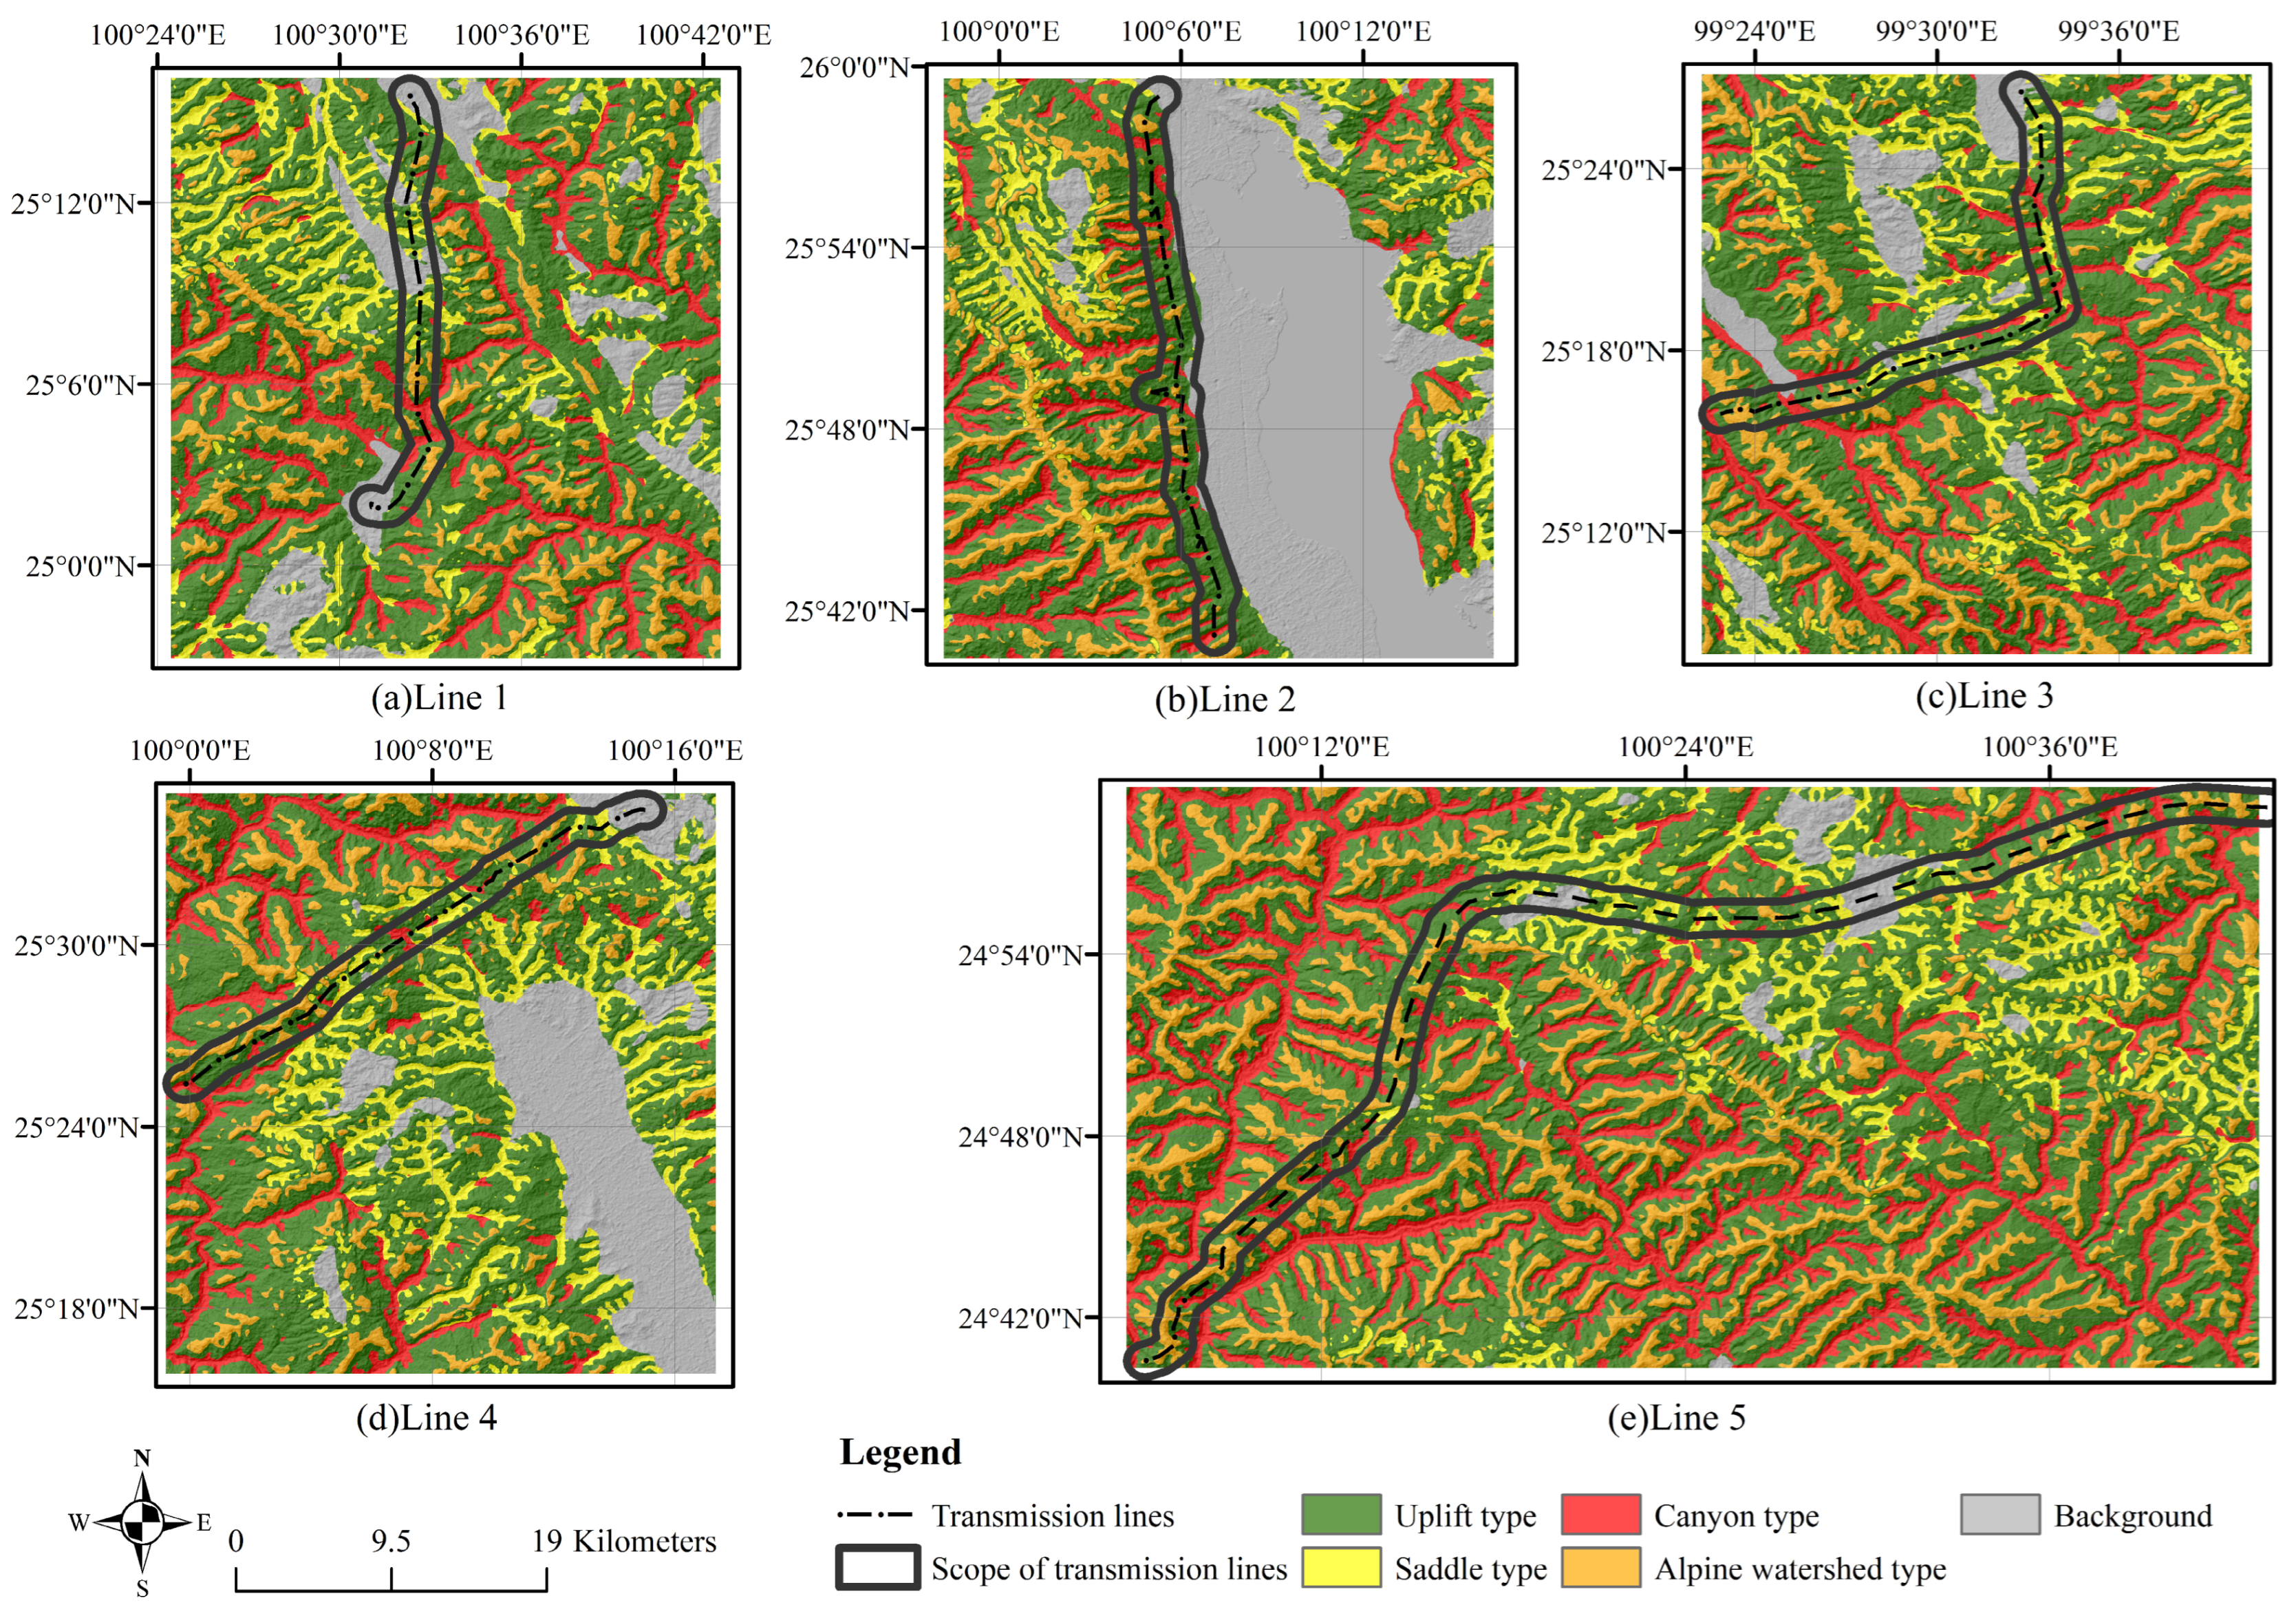
2.1. Data Description

Due to the absence of relevant public datasets, this paper develops a dataset specifically for identifying micro-terrain along transmission lines, referred to as the Micro-Terrain dataset.
The Micro-Terrain dataset consists of five categories, four of which represent distinct types of micro-terrain found along the transmission lines, with the fifth category serving as background. These four micro-terrain types are as follows: saddle, canyon, alpine watershed, and uplift [3].
In the context of transmission line engineering safety, micro-terrain refers to geomorphological features that exhibit distinct spatial heterogeneity in small-scale areas along the transmission line. Research [24,25] has shown that the damage caused by natural disasters to transmission lines is linked to the surrounding terrain, and the micro-terrain conditions along the transmission lines are directly correlated with transmission lines’ safety. Therefore, studying the micro-terrain along transmission lines in detail becomes essential. The extraction of the complex micro-terrain around the transmission line plays a vital role in the planning, construction, and operation of the line. According to the characteristics of different micro-terrain types, the structural diagrams of four typical types of transmission line micro-terrain are shown in Figure 1.
The saddle (Figure 1a) refers to a low area or gap between two peaks, often resembling a narrow pass that sits lower than the surrounding peaks. In the saddle areas, wind speed significantly increases, which may subject transmission lines to high wind loads, potentially causing conductor swaying. Additionally, due to the complex soil and bedrock conditions in the saddle regions, the construction of transmission tower foundations may face challenges such as settlement or slope stability issues.
The canyon (Figure 1b) is a narrow, steep-sided valley typically formed by water erosion, often resulting from rivers cutting through rock over time. Due to the steep mountains on both sides of the canyon forming a natural wind channel, the airflow passing through this region is subject to the narrow channel effect, resulting in a significant increase in wind speed. Under such strong wind conditions, transmission lines are prone to swaying or breakage, posing risks to transmission safety. Moreover, valleys often exhibit significant elevation differences, constraining route selection and increasing construction difficulty. During periods of heavy rainfall, geological hazards such as debris flows, landslides, and flash floods can be triggered, posing a threat to transmission infrastructure.
The alpine watershed (Figure 1c) is a ridge or elevated land that divides two neighboring river basins. This type of micro-terrain is characterized by high elevation, steep slopes, exposed surfaces, and strong winds. Since mountaintop ridges lack high obstacles, transmission lines in these areas experience substantial wind loads, with a significantly increased risk of vibration, especially under extreme weather conditions. Additionally, due to the thin soil layer and exposed bedrock, constructing transmission tower foundations in these areas is challenging, and their stability may deteriorate over time.
The uplift (Figure 1d) forms due to crustal uplift or localized tectonic movements, resulting in elevated landforms or hills that are higher than the surrounding areas. This type of micro-terrain can disturb airflow, potentially increasing local wind speeds and impacting the normal operation of transmission lines. Additionally, this type of micro-terrain is susceptible to water erosion, posing long-term risks to the safety of transmission infrastructure.
To identify the micro-terrain of transmission lines, prior studies have extensively utilized terrain factors derived from the Digital Elevation Model (DEM), such as slope, curvature, terrain relief, and the Topographic Position Index (TPI), and have applied classification rules or decision tables for categorization. While these methods have improved classification accuracy to some extent, they typically rely on manually designed features and involve indirect use of DEM data, which limits the ability to fully exploit the spatial information inherently contained in the DEM. Building upon previous research, this study proposes an improved UNet++ deep learning framework with superior end-to-end feature learning capabilities and introduces an innovative feature input strategy. Unlike traditional approaches that rely solely on features derived from DEM, this study directly incorporates the raw DEM data as an input feature, thereby leveraging the deep learning model’s ability to automatically extract and integrate terrain morphological information in the image. Meanwhile, this study incorporates two derived features based on DEM—the Elevation Coefficient of Variation (ECV) and profile curvature—to construct the Micro-Line dataset. The Micro-Terrain dataset includes three types of terrain features commonly used for terrain recognition: DEM, ECV, and profile curvature (Figure 2).
The DEM used is a subset of the DEM data from Yunnan Province, China, with a spatial resolution of 30 m. The ECV and profile curvature are derived from the DEM data. The transmission lines used in the experiments are located in Dali Bai Autonomous Prefecture, Yunnan Province. As the primary data type for terrain analysis, the DEM not only provides elevation information but also enables the extraction of a diverse variety of terrain features. Deep learning models can automatically extract local terrain features from DEM, such as slope variations and elevation changes. This data-driven methodology effectively utilizes the spatial information within DEM, improving the accuracy and generalizability of micro-terrain classification.
The ECV [26] is a statistical indicator for quantifying the terrain undulation, primarily employed to describe the degree of elevation change. Its calculation formula is as follows:
  E C V = σ μ
where σ represents the standard deviation of the elevation values within a given area, μ represents the average elevation value within a given area.
ECV reflects the degree of local terrain undulation, with higher values typically corresponding to steep terrains such as ridges or deep valleys, and lower values responding to relatively gentle terrains such as plateaus or basins. In micro-terrain classification tasks, ECV provides essential information about terrain variability, effectively aiding in distinguishing different types of micro-terrain.
Profile curvature is an indicator used in terrain analysis to describe the morphological changes in the surface along the slope direction (i.e., the direction of maximum slope). Positive values indicate convex terrain (e.g., ridges), while negative values indicate concave terrain (e.g., valleys). Profile curvature can effectively describe surface morphology and is a commonly used terrain feature in landslide detection [27], soil and water erosion [28], terrain recognition, and other fields.
During dataset preparation, the original remote sensing images and their corresponding label maps were segmented using a sliding window of 256 × 256 pixels with a stride of 128 pixels (i.e., 50% overlap), resulting in 2000 image–label pairs. To enable supervised learning and evaluate model performance effectively, all samples were randomly shuffled and then split into training and validation sets at a ratio of 4:1, with 80% of the data used for training and 20% for validation. The class distribution was preserved during the split to prevent model bias caused by class imbalance. This data partitioning scheme remained fixed across all experiments to ensure the reproducibility and fairness of the evaluation. Data augmentation, including normalization, random horizontal flipping, and random rotation within ±30 degrees, was applied exclusively to the training set to enhance model robustness and generalization.

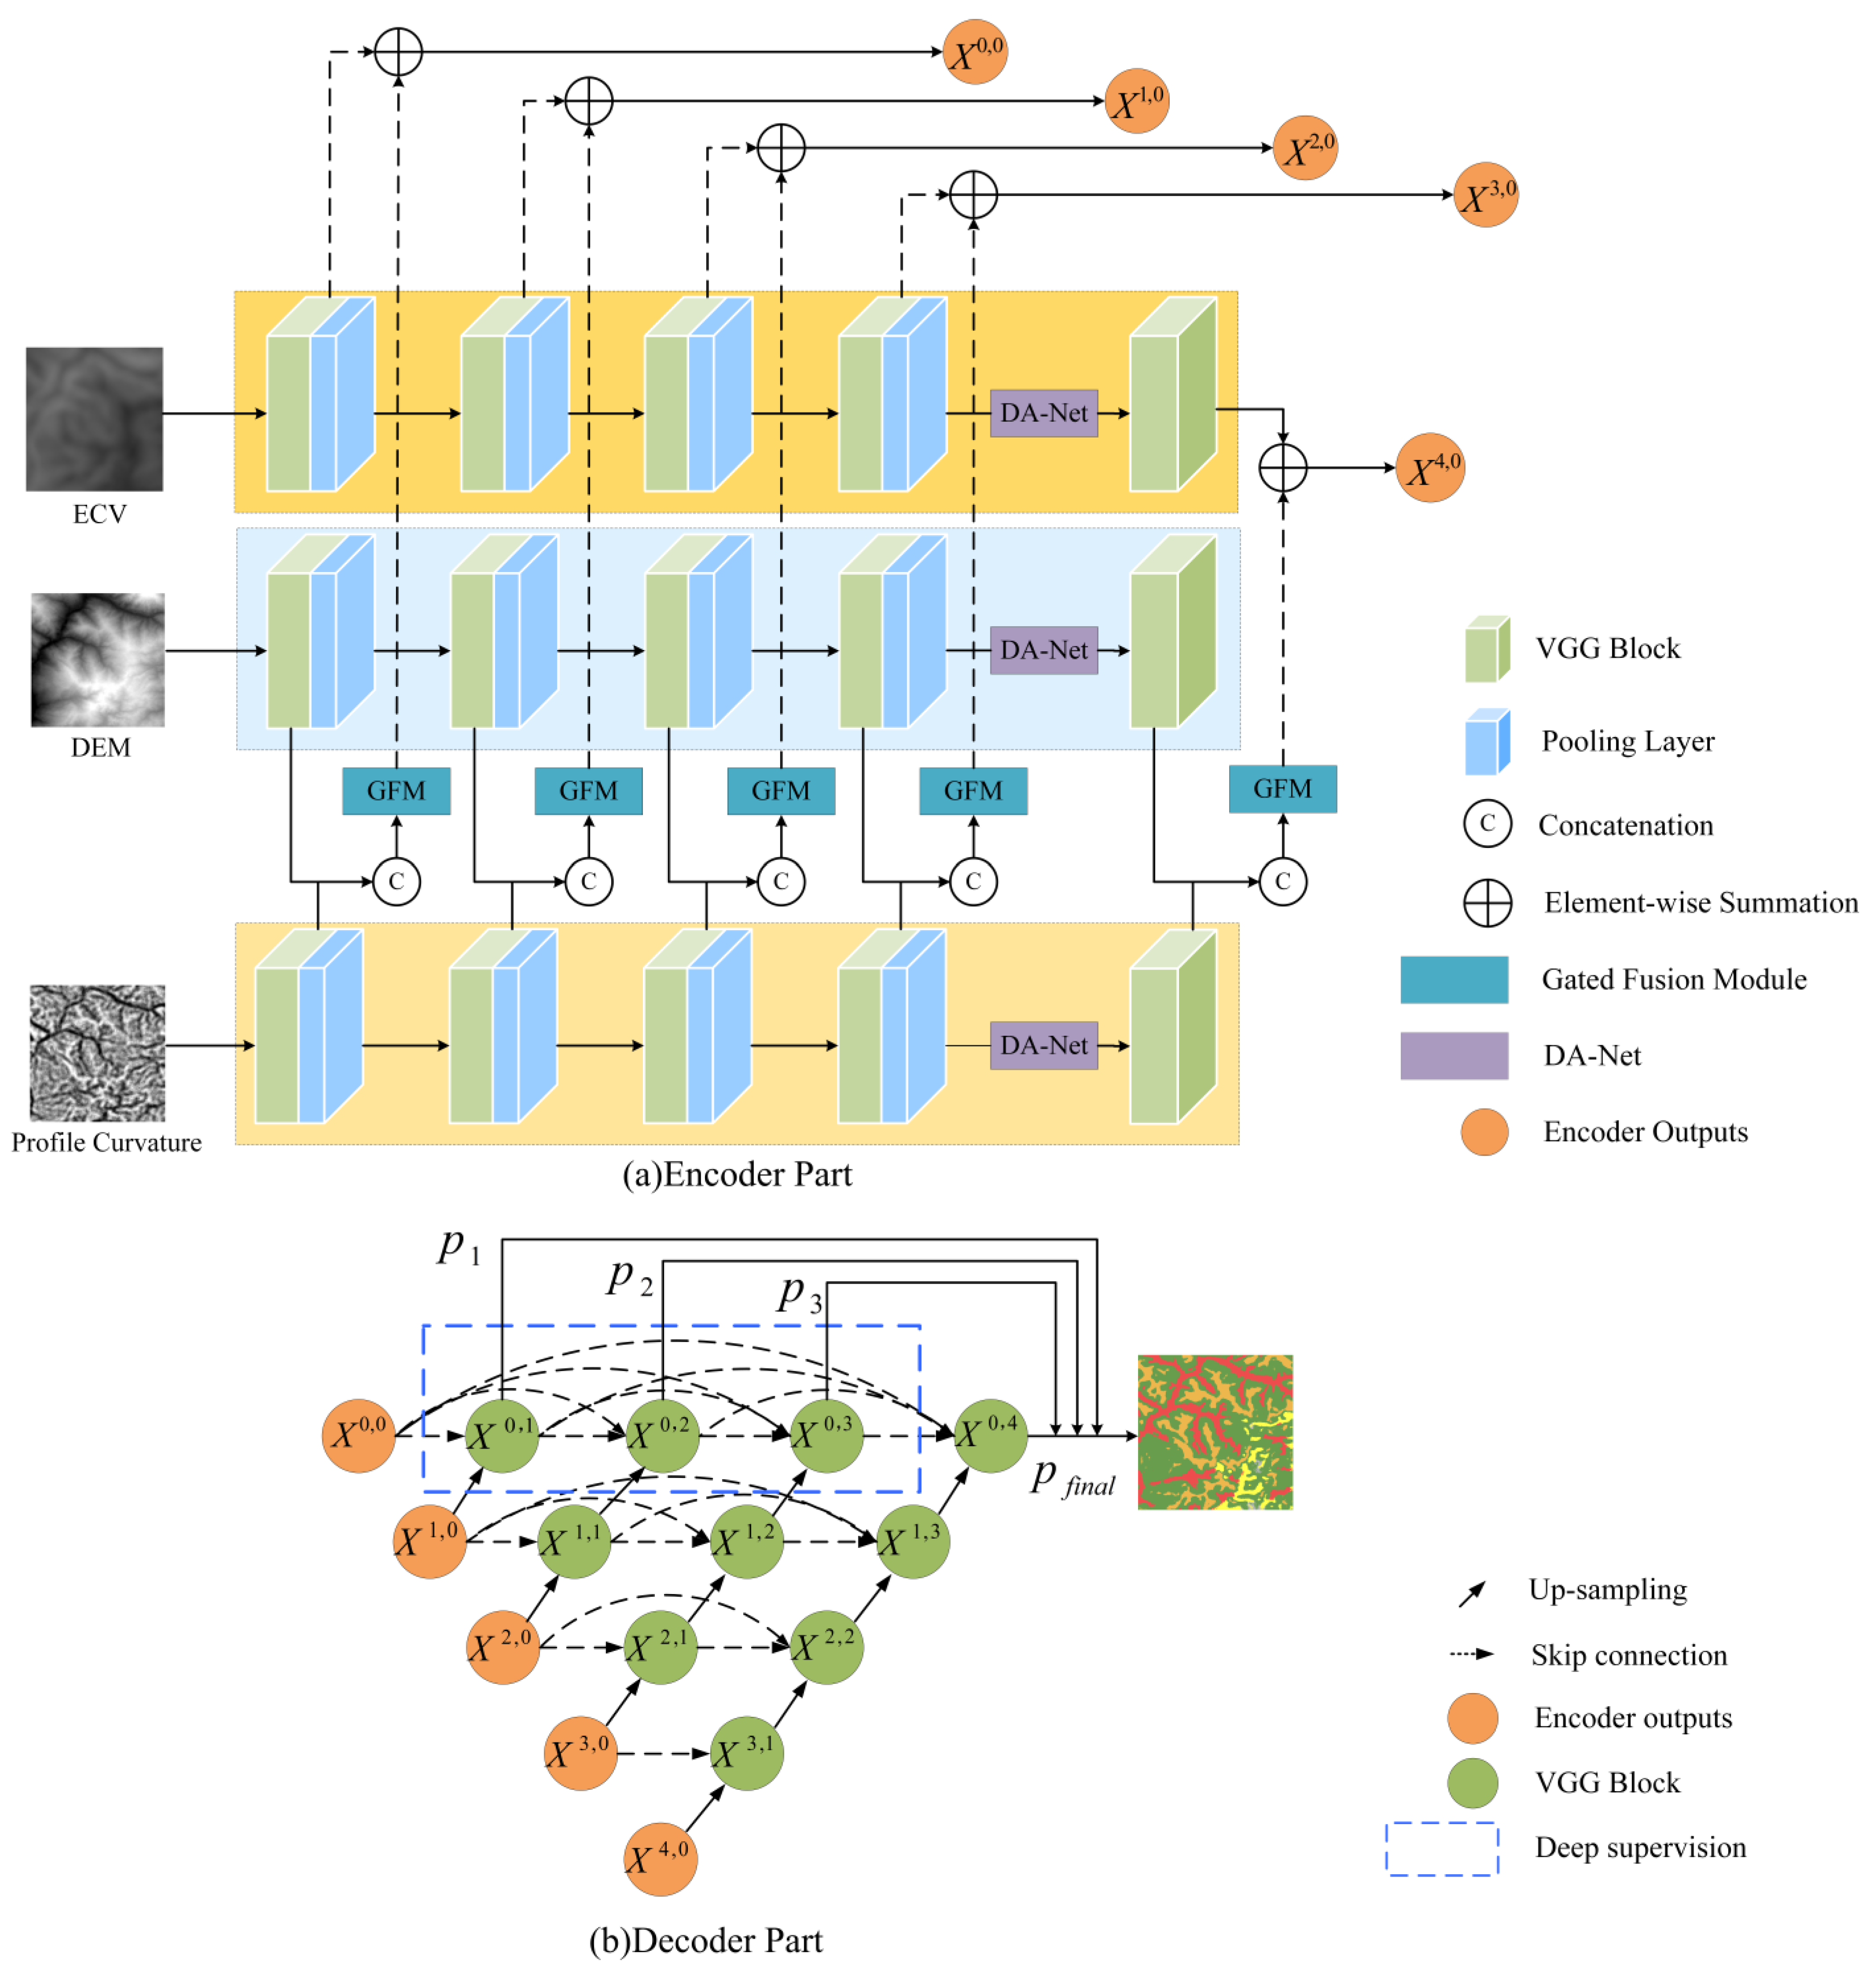
2.2. Improved UNet++ Model

UNet is a widely used deep learning semantic segmentation network, initially proposed by Ronneberger et al. [7] in 2015. Its core concept is to perform image segmentation tasks through a symmetrical encoder–decoder structure with skip connections. In the encoder, the spatial resolution of the input image is gradually reduced through a series of convolutional and pooling layers, extracting high-level semantic information. In the decoder, features extracted by the encoder are upsampled (e.g., using deconvolution) to progressively reconstruct the image’s spatial resolution. Combined with convolution operations for dimensionality reduction, the decoder ultimately reconstructs the features into segmented image results. Additionally, UNet incorporates skip connections between the encoder and decoder, which transfer feature maps from specific encoder layers directly to the corresponding decoder layers, facilitating the restoration of detailed image information during decoding.
UNet++ introduces a more intricate and multi-level skip connections structure compared to UNet. While UNet only establishes skip connections between corresponding layers of the encoder and decoder, UNet++ incorporates additional connections across different layers. These enhanced skip connections support feature fusion across multiple scales, enabling the model to process multi-scale information more efficiently.
The micro-terrain recognition approach proposed in this paper is an enhancement of UNet++. A schematic diagram illustrating the improved model structure is presented in Figure 3. Figure 3a depicts the encoder component of the improved model. Since the micro-terrain recognition of transmission lines in this paper requires multi-source feature inputs, the improved approach utilizes three encoders to extract features of diverse input data. These three encoders depicted in the figure are structurally identical, each consisting of five VGG Blocks [29] and four max pooling layers. VGG Block is a widely used convolutional module in convolutional neural networks, comprising two convolutional layers, two normalization layers, and two ReLU activation functions. As the input image is processed through the convolution operation of five VGG Blocks, the number of channels progressively increases to 32, 64, 128, 256, and 512. Through four max-pooling layers, the size of the feature map is progressively reduced to 1/2, 1/4, 1/8, and 1/16 of the original image.
To facilitate effective multi-source data fusion, this study introduces the GFM within the encoder structure. The input features of this module are the concatenated features of DEM and profile curvature after processing through each VGG Block (Figure 3a). GFM utilizes a gate control unit to dynamically adjust the contribution of different features to the semantic segmentation results, thereby enhancing the model’s capacity to integrate and utilize multi-source information.
To improve the model’s focus on critical geographic feature information, this study incorporates the DA-Net after the fourth VGG Block of each encoder (Figure 3a). DA-Net integrates spatial and channel attention mechanisms, enabling the model to capture both the spatial significance of features and the significance in terms of the channel.
In the decoder component of the improved model, this study incorporates a deep supervision strategy (Figure 3b). The core concept of the deep supervision strategy is to provide additional supervisory guidance to the intermediate layers of the network, thereby improving the learning efficiency. Thanks to its dense skip connections, the UNet++ model is capable of generating multiple prediction outputs in the decoder, all of which match the original image size. This architecture is particularly well suited for facilitating the implementation of the deep supervision strategy.

2.3. Gated Fusion Module

To enhance the performance, the input data for many semantic segmentation models are gradually transitioning towards multi-source and multimodal approaches [30,31,32]. The traditional feature fusion methods typically involve concatenating different features along the channel dimension or adding them element-wise. These approaches simply stack multi-source features together, failing to fully exploit the information embedded in multi-source data. To improve the fusion performance, various novel data fusion techniques have been proposed. Hu et al. [33] proposed a high-level feature fusion (HFF) module that effectively fused DSM (Digital Surface Model) image features into IRRG (Infrared–Red–Green) image features using weighted fusion. Xie et al. [34] integrated channel attention into feature fusion for semantic segmentation of remote sensing images. Their approach adaptively assigned weights to concatenated features along the channel dimension, thereby optimizing the feature representation.
To effectively fuse micro-terrain features, this study integrates the GFM into the improved UNet++ model to fuse DEM and profile curvature features. In the improved model, the feature maps at different layers of the encoder participate in skip connections, necessitating the iterative use of the GFM to fuse DEM and profile curvature features at each layer.
The GFM adaptively adjusts the weights of multi-level features to achieve collaborative modeling of micro-terrain details and global terrain semantics.
High-resolution feature maps in shallow networks preserve rich spatial details, such as subtle undulations of ridgelines or local curvature variations in valleys. At this stage, GFM prioritizes enhancing the contribution of profile curvature features, as curvature quantifies the concavity and convexity of the surface and directly reflects the geometric structure of abrupt terrain changes. This prioritization allows the model to accurately extract fine-grained characteristics of micro-terrain units at early stages, providing detailed information for deeper layers.
As the network depth increases, feature map resolution gradually decreases, but the receptive field expands significantly, shifting the model’s focus from local details to global semantics. Deep features emphasize the overall distribution of the terrain information. At this stage, the dynamic weights of GFM naturally shift toward DEM features. The elevation information in DEMs characterizes the overall terrain. By integrating the global semantics of DEMs, the deep network effectively incorporates large-scale terrain structure information, mitigating the interference of local noise in high-level semantic understanding.
The GFM developed in this paper is based on the fusion approach employed by Hosseinpour et al. [21] in Cross-Modal Gated Fusion Network (CMGFNet), which builds upon the Gate Multimodal Unit proposed by Arevalo et al. [35]. The structure of the GFM in this work is illustrated in Figure 4. To implement this module, the DEM and profile curvature features extracted through the convolutional layer are first concatenated along the channel dimension and then passed through a 1 × 1 convolution kernel and a sigmoid function to generate a weight matrix, Z . The weight matrices Z and 1 Z are multiplied by DEM and profile curvature, respectively. The weighted features are combined through element-wise addition to produce the final fused representation (Figure 4). This paper selects the fusion of DEM and profile curvature to effectively combine the elevation information from DEM and the surface undulation information from profile curvature, thereby obtaining more informative and discriminative representations for micro-terrain classification.

2.4. DA-Net

Traditional deep learning models uniformly process all input features, failing to differentiate and prioritize them based on their relative importance. Introducing the attention mechanism allows the model to focus on critical features while disregarding less relevant ones, thereby improving accuracy. The attention mechanism is inspired by the selective perception characteristics of the human visual system [36]. In practice, the attention mechanism can be categorized into single-path and multi-path architectures. Commonly used single-path attention networks include Squeeze and Excitation Networks (SE-Nets) [37], Efficient Channel Attention Networks (ECA-Nets) [38], and others. Examples of multi-path attention networks include Selective Kernel Networks (SK-Nets) [39], ResNeSt [40], Convolutional Block Attention Module (CBAM) [41], and DA-Net [22].
In the encoder section of the improved model, as convolution and pooling operations progress, the amount of redundant information in the extracted feature maps increases. To extract discriminative and contextually relevant features, DA-Net is incorporated after the fourth VGG Block in each encoder (Figure 3a). The operational principle of DA-Net is illustrated in Figure 5. DA-Net consists of two attention modules: the Position Attention Module (PAM) and the Channel Attention Module (CAM). PAM enhances the model’s spatial perception by emphasizing critical regions in the image. It assigns varying weights to spatial positions, guiding the model to prioritize key information and ignore irrelevant areas. CAM learns the weights of feature maps at the channel level, shifting the model’s focus to various channel features. By calculating the importance of each channel, CAM automatically adjusts the contribution of each channel, helping the network more effectively identify meaningful features. By combining spatial and channel attention mechanisms, DA-Net captures useful information in both spatial and channel dimensions. This enables the model to intelligently select important spatial regions and feature channels, enhancing the overall effectiveness of information propagation within the network and significantly boosting semantic segmentation performance.
The ability of dual attention network to enhance model performance can be analyzed from the following perspectives.
In micro-terrain classification tasks, different types of micro-terrain exhibit distinct dependencies on specific input features. For example, the alpine watershed micro-terrain is primarily distinguished by elevation differences, making it highly sensitive to DEM features. In contrast, the saddle and canyon micro-terrain mainly depend on terrain factors such as profile curvature and ECV. Thus, to improve classification robustness and accuracy, the model must adapt to the specific feature requirements of different micro-terrain types.
DA-Net’s dual attention mechanism, comprising spatial and channel attention, plays a critical role in this adaptation. Firstly, the Channel Attention Module (CAM) dynamically adjusts the model’s focus on different feature channels according to the dependencies of various micro-terrain types. For instance, CAM strengthens the weight of channels related to elevation differences for the alpine watershed, whereas, for the saddle or the canyon type, it increases the importance of features associated with profile curvature and ECV. This adaptive mechanism enables the model to extract discriminative features more effectively across different micro-terrain categories, thereby improving classification accuracy. Secondly, the Position Attention Module (PAM) enhances the model’s perception of micro-terrain boundaries and local details by focusing on the spatial relationships within critical regions of the image. For complex terrains such as canyons or saddles, PAM emphasizes the continuity of terrain boundaries and their spatial distribution characteristics, reducing misclassification due to similar features and enhancing segmentation precision.

2.5. Deep Supervision Strategy

The UNet++ forms a series of nested sub-networks in its decoder section through dense skip connections. As illustrated in Figure 3b, the decoder section of the improved model consists of four nested sub-networks. Each nested sub-network generates a prediction result at its end, corresponding to the output results of X 0 , 1 , X 0 , 2 , X 0 , 3 , and X 0 , 4 . The output of X 0 , 4 serves as the model’s final prediction result. In the absence of the deep supervision strategy, only the final prediction result is utilized to compute the loss value during model training.
To leverage the hierarchical nature of UNet++ and better capture multi-scale micro-terrain features, this study incorporates a deep supervision strategy. In micro-terrain classification tasks, terrain features at various scales play a crucial role in the classification results. Relying solely on the final prediction for classification may result in insufficient learning of intermediate features, negatively affecting overall segmentation performance. With deep supervision, the model can compute losses at different scales within nested sub-networks, ensuring effective optimization of even the shallow feature extraction layers, thus boosting the network’s capacity to represent multi-scale features. Additionally, the multi-level supervision mechanism helps the network focus on local details while learning global information, allowing small-scale micro-terrain features to be retained and strengthened, thereby enhancing segmentation accuracy. Furthermore, deep supervision helps alleviate the gradient vanishing problem, contributing to more stable training dynamics.
When implementing the deep supervision strategy, the loss value calculation is adjusted to include two components: the loss from the deep supervision part and the loss from the final prediction result (Figure 3b). To balance the contributions of these two components during model training, their respective loss values are weighted and then summed. Therefore, the overall loss function of the improved model with the deep supervision strategy is defined as follows:
  L t o t a l = α 1 L p 1 , y + α 2 L p 2 , y + α 3 L p 3 , y + β L p f i n a l , y
where L ( ) represents the loss function, which is the cross-entropy loss function in this study; y represents the ground truth labels in the Micro-Terrain dataset; p 1 , p 2 , and p 3 correspond to the prediction results from the deep supervision parts X 0 , 1 , X 0 , 2 , and X 0 , 3 , respectively; p f i n a l represents the final prediction result from X 0 , 4 ; and α 1 , α 2 , α 3 , and β are the respective weights assigned to the loss values from different prediction results. In subsequent experiments, the values of α 1 , α 2 , α 3 and β are set to 1, 1, 1, and 2, respectively.
As the various components of deep supervision play similar roles in model training, without distinct inter-layer influence differences, they are assigned equal weights ( α 1 = α 2 = α 3 = 1 ). This configuration ensures that each prediction from deep supervision functions equitably during training, allowing the model to effectively utilize multi-level feature information without excessive dependence on a single supervision signal. Furthermore, as the final prediction serves as the most crucial output of the model, directly influencing overall performance, it is given a higher weight ( β = 2 ). This weighting strategy ensures that the final prediction has a greater influence on loss computation, guiding the model’s primary optimization direction while continuing to benefit from deep supervision for auxiliary training.

2.6. Experimental Environment and Parameter Settings

The hardware devices used in the experiments consist of an Intel(R) Xeon Gold 5218R 2.10 GHz processor and an NVIDIA Quadro RTX 8000 GPU with 48 GB of memory. The software stack includes the GPU acceleration library is managed using CUDA version 12.1, and the deep learning framework employed is PyTorch version 2.3.0.
During model training, the parameter optimizer is set to the SGD optimizer with a momentum parameter of 0.9. The initial learning rate is set to 0.001, and the number of training epochs is 100. The batch size is set to 32.

2.7. Model Evaluation Metrics

To evaluate the performance of the proposed model in the micro-terrain recognition task, three commonly used evaluation metrics in image semantic segmentation were selected for the experiments: Class Pixel Accuracy (CPA), Pixel Accuracy (PA), and Intersection over Union (IoU). CPA is used as the evaluation metric for a single class, while PA and IoU serve as global evaluation metrics.
The computation of model evaluation metrics is primarily based on the confusion matrix. The confusion matrix is a two-dimensional matrix that illustrates the differences between the actual and predicted categories in a dataset, offering an intuitive assessment of classification performance. In a semantic segmentation task with n categories, the confusion matrix is an n × n matrix. The total number of samples in the dataset is expressed as N = i = 1 n j = 1 n C i j .
PA is a widely used metric for assessing the overall classification performance of a deep learning model. It measures the ratio of correctly predicted samples to the total number of samples. In multi-class classification tasks, PA is computed using the following formula [42]:
P A = i = 1 n C i i N
In this formula, N denotes the total sample count, C i i represents the number of actual samples from class i that are correctly classified as class i , and n indicates the number of categories.
IoU is a crucial metric in semantic segmentation tasks that evaluates the overlap between predicted results and ground truth labels. It measures the extent of overlap between the predicted and actual regions, with values ranging from 0 to 1, where a higher value signifies greater consistency between the prediction and the true target. In multi-class classification tasks, IoU is calculated using the following formula [42]:
I o U = i = 1 n C i i i = 1 n ( j = 1 n C j i + j = 1 n C i j C i i )
In this formula, C i i represents the number of actual samples from class i that are correctly classified as class i , C j i denotes the number of samples from class j that have been classified as class i , C i j denotes the number of samples from class i that have been classified as class j , and n indicates the number of categories.
For the evaluation metric of a single class, the CPA of class i represents the proportion of samples predicted as class i that actually belong to class i . The calculation formula is as follows [42]:
C P A i = C i i j = 1 n C j i
In this formula, C j i denotes the number of samples from class j that have been classified as class i .

3. Results

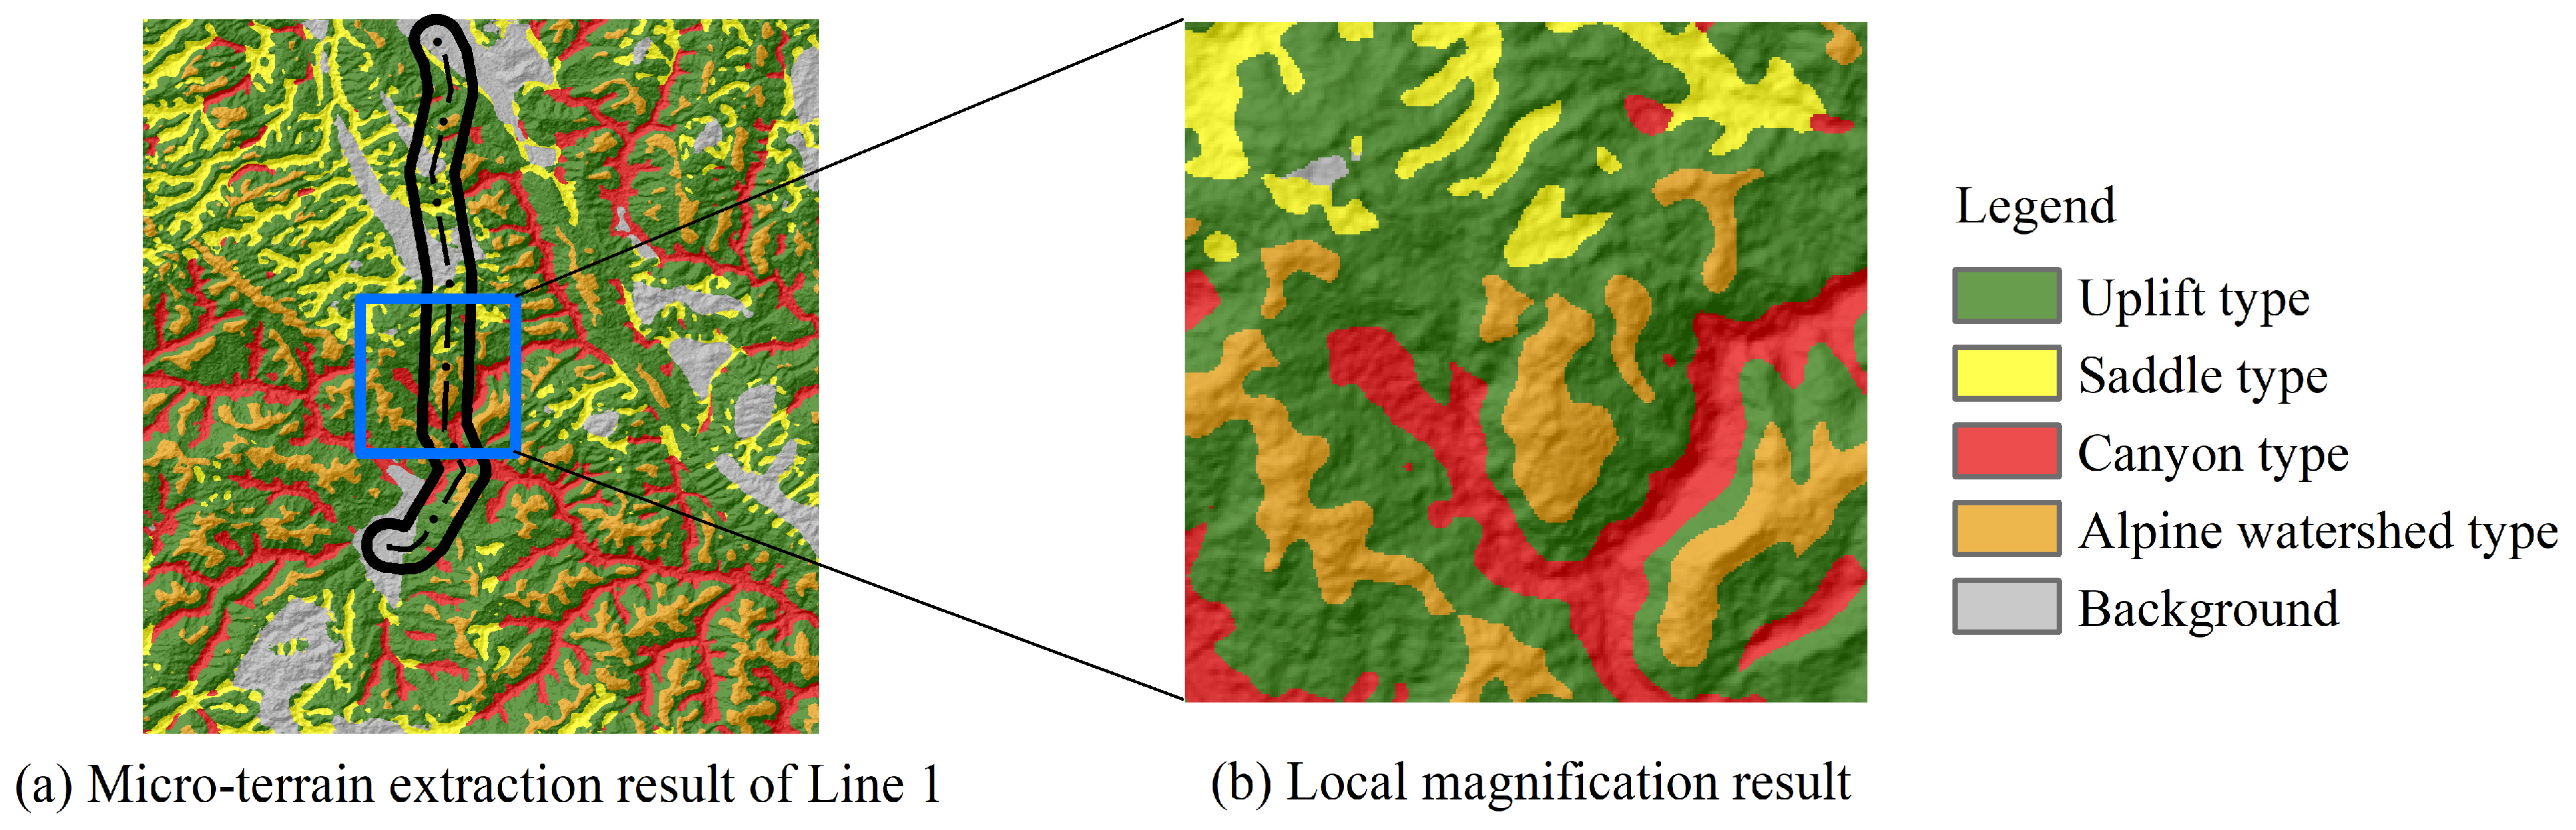
3.1. Experimental Results of the Improved Model

After multiple rounds of training, the improved model achieved PA and IoU values of 92.26% and 85.63%, respectively (Figure 6). Regarding CPA: the canyon type exhibits the highest CPA at 94.75%, while the CPAs of uplift type, saddle type, and background are slightly lower, at 93.93%, 90.64%, and 88.73%, respectively, and the micro-terrain category with the lowest CPA is the alpine watershed type, with a value of 88.0%.
To evaluate the effectiveness of the improved model, DEM, ECV, and profile curvature data from five transmission lines were selected as input features to predict the micro-terrain types. The prediction results from the improved model are presented in Figure 7. As shown in the figure, the micro-terrain within 1 km on both sides of the transmission line is delineated by black lines. The micro-terrain recognition results clearly show that the boundaries between different micro-terrain categories are well distinguished, and finer-scale micro-terrain features are accurately captured.
To further verify the performance of the improved model in micro-terrain recognition, a magnified result of Line 1 (Figure 8a) was presented in Figure 8b. This enables a more detailed examination of the recognition accuracy at a finer scale. From the magnified image (Figure 8b), it is evident that the boundaries of different micro-terrain categories remain distinct, with no significant classification ambiguity or excessive edge smoothing. This demonstrates that the improved model can effectively characterize micro-terrain types with fine granularity. For instance, in the magnified image (Figure 8b), the saddle type micro-terrain (yellow) is precisely extracted among numerous uplift type micro-terrain (green). This demonstrates that the model can accurately identify the characteristic features of the saddle, thereby clearly distinguishing its boundary from the surrounding terrain. Additionally, the magnified image (Figure 8b) reveals that the canyon-type micro-terrain (red) is continuously distributed along low-lying areas, with clear boundaries that are distinctly separated from the adjacent uplift type (green). This highlights the model’s ability to accurately recognize canyon features.
Overall, the micro-terrain classification results of the improved model exhibit strong performance in boundary clarity and detail recognition, enabling a more accurate representation of the actual micro-terrain conditions surrounding the transmission lines.

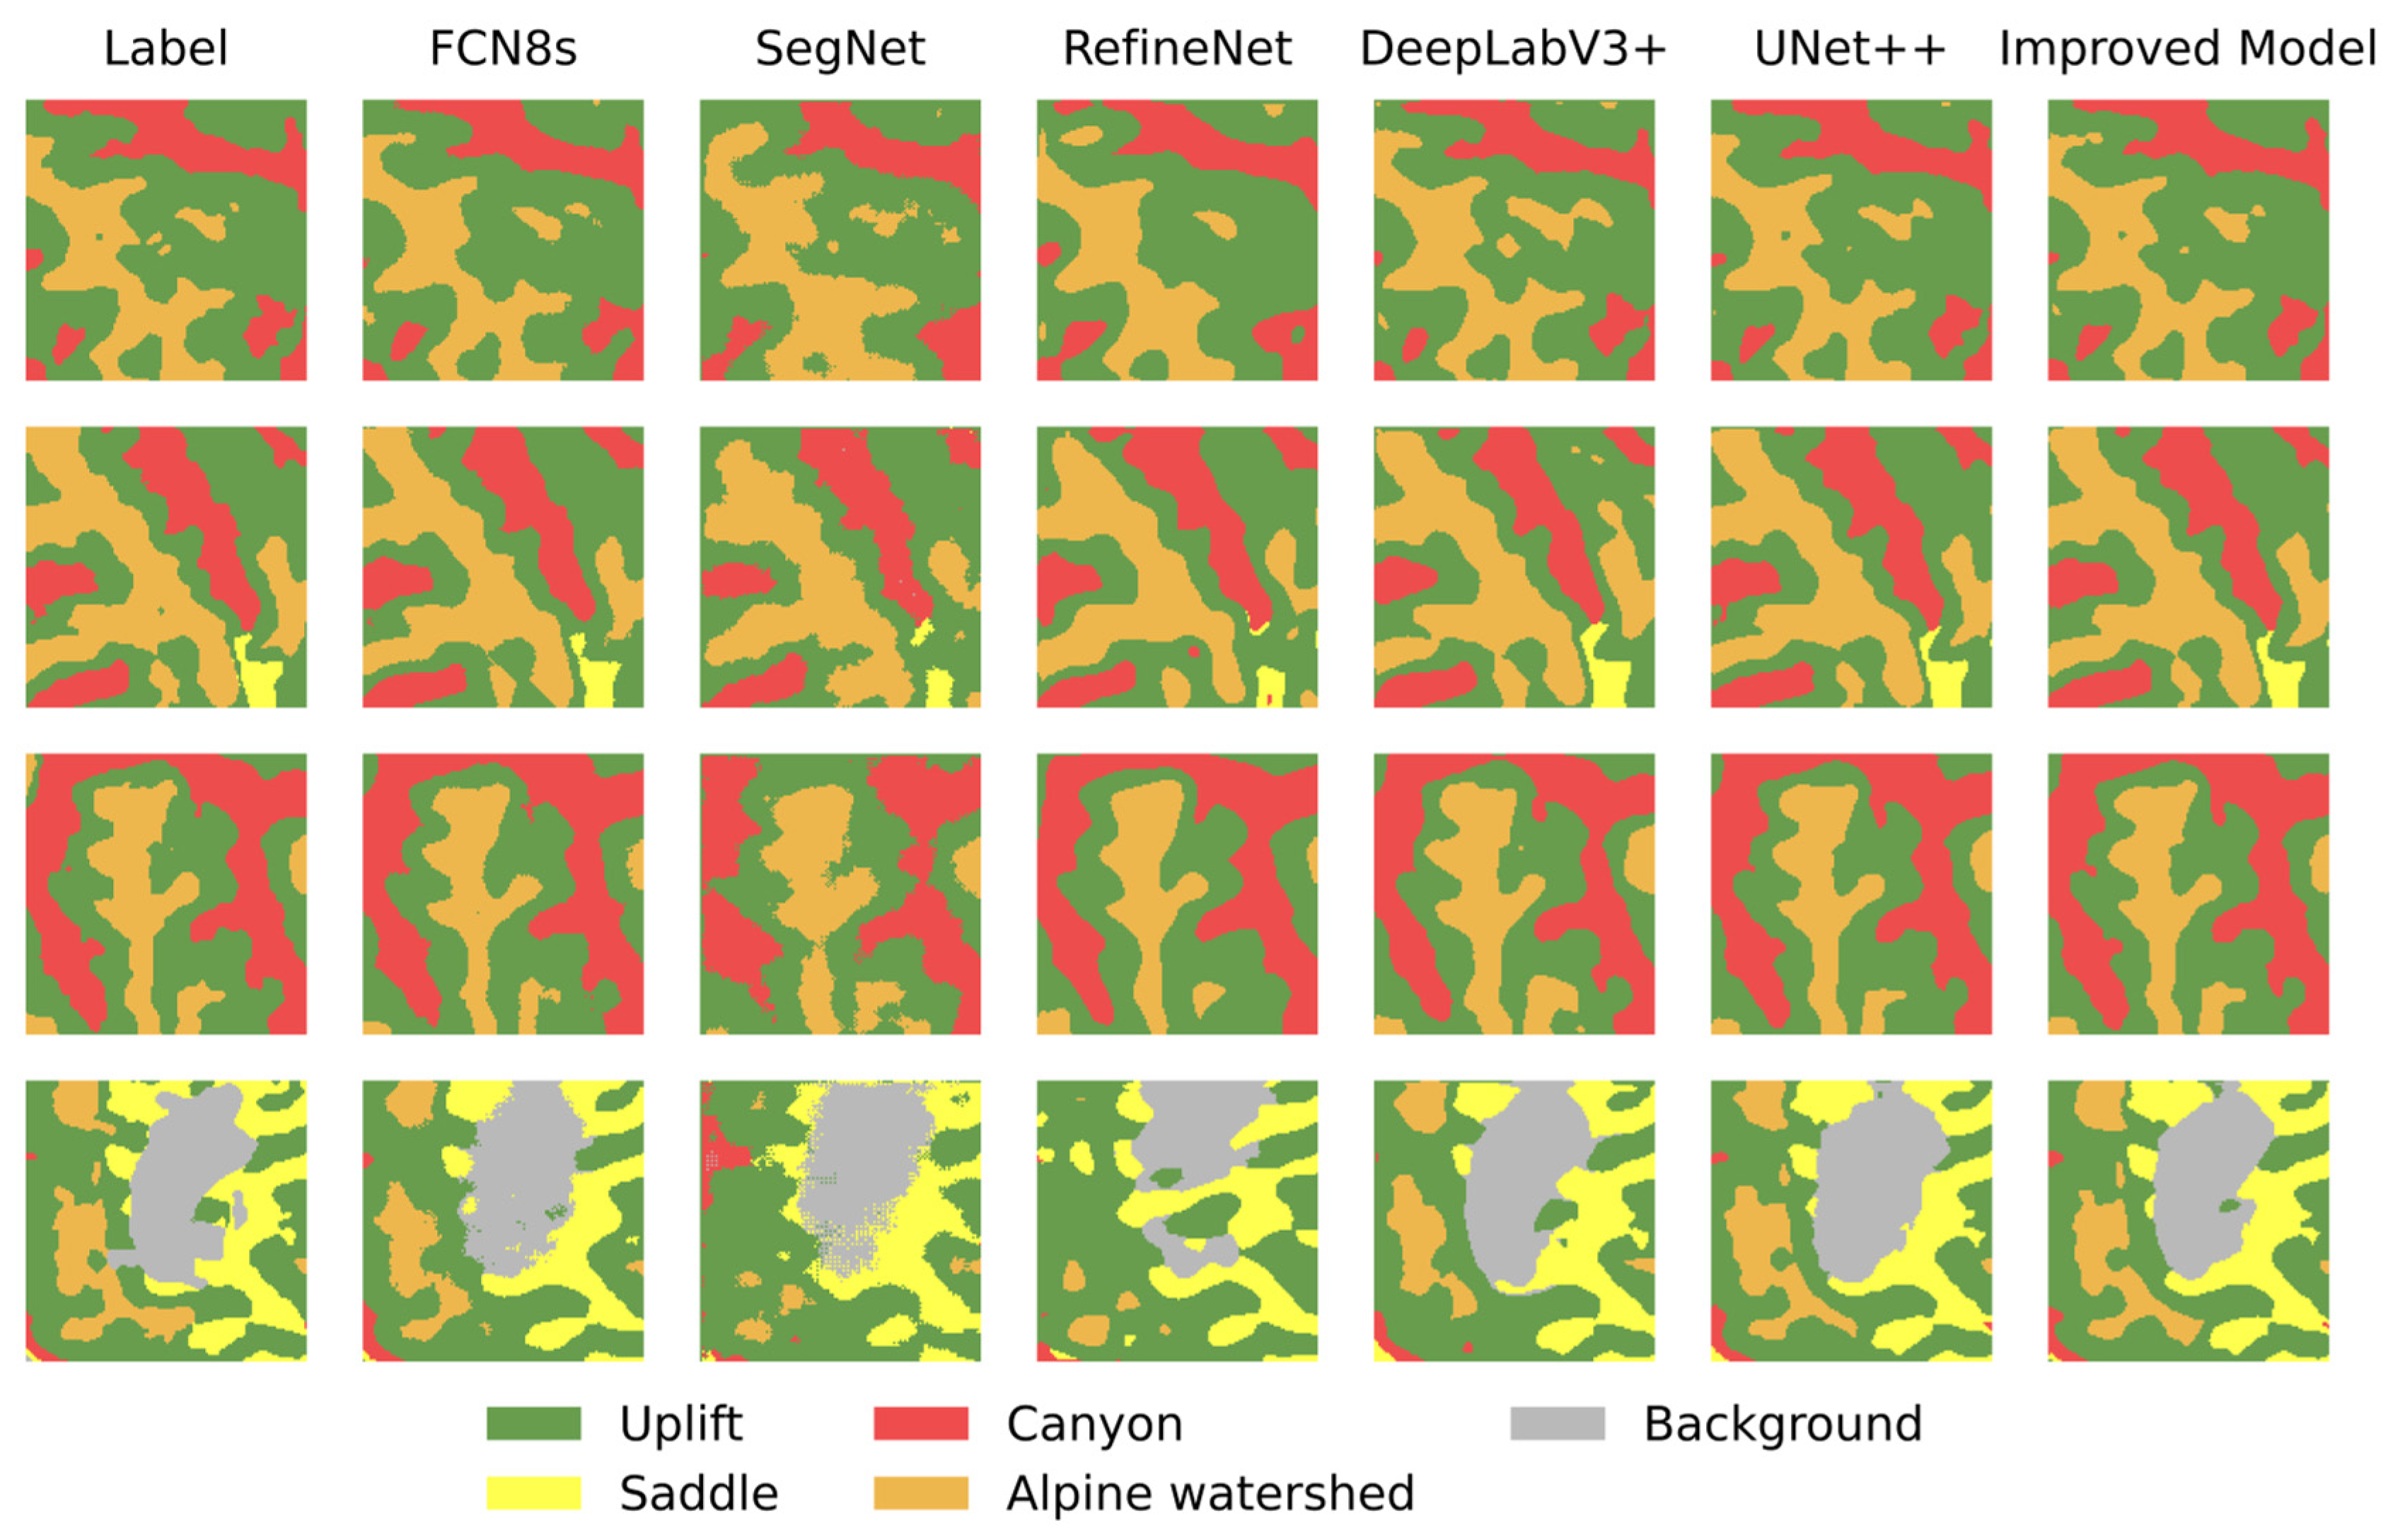
3.2. Experimental Results of the Model Comparison Experiment

To further evaluate the effectiveness of the improved model, a comparative experiment was conducted between the improved model and several widely used deep learning semantic segmentation models, including FCN8s, SegNet, RefineNet, DeepLabV3+, and the original UNet++. All the semantic segmentation models were trained and tested under identical hardware and software environments, utilizing the same dataset, data augmentation techniques, and training strategies.
The performance of various models on the Micro-Terrain dataset is presented in Table 1. As illustrated in the table, the improved model substantially outperforms the other models in identifying micro-terrain along the transmission lines: its PA, the CPA of most micro-terrain categories, and IoU are higher than other models, with PA and IoU achieving 92.26% and 85.63%, respectively. The observed performance discrepancies among the models can be attributed to variations in their underlying architectures. Notably, FCN8s, DeepLabV3+, UNet++, and the improved model demonstrate significantly better segmentation results compared to SegNet and RefineNet.
In terms of specific classification performance, with the exception of the CPA for the canyon type, which is slightly lower than that of the original UNet++, the improved model demonstrates a significant improvement in identifying other micro-terrain types. The CPA for the uplift type has increased to 93.93%, representing a 2.36% improvement over the original UNet++. For the saddle type, the improved model achieves a CPA of 90.64%, the highest value among all models involved in the comparison. Regarding the alpine watershed type, the CPA across all models is relatively low, but the improved model has raised it to 88.0%, representing a significant improvement. In terms of background recognition, the improved model outperforms all others.
Overall, the improved model demonstrates superior capability in micro-terrain recognition. This enhancement can be attributed to the model’s advancements in multi-source data fusion and its ability to focus on critical features, enabling it to more effectively capture and retain important details in complex micro-terrain recognition scenarios.
The improved model enhances the recognition performance of various micro-terrain types around transmission lines, particularly in the extraction of saddle type and alpine watershed type. This holds significant practical value for the design and operation of transmission lines.
The saddle micro-terrain typically serves as wind corridors, characterized by high wind speeds and complex meteorological conditions. In low-temperature and high-humidity environments, strong winds transport large amounts of supercooled water droplets, making the saddle areas high-risk zones for transmission line icing. Accurate identification of the saddle provides refined topographic support for icing risk assessment. When integrated with meteorological models, this enables more accurate icing forecasts, thereby optimizing anti-icing strategies, such as adjusting the transmission line route, selecting appropriate conductor types, or applying anti-icing coatings.
The alpine watershed areas are often steep and geologically complex, making them critical regions for transmission line routing decisions. Accurate identification of this type micro-terrain provides detailed topographic data support for route optimization. When further considering factors such as slope and stability, the transmission line alignment can be refined to avoid high-risk areas like steep slopes and landslide-prone zones. Additionally, the alpine watershed often exhibits significant hydrological variability, with intense precipitation and surface runoff potentially causing soil erosion and foundation instability. The improved model’s recognition results provide precise topographic information for engineering design, facilitating the development of effective drainage and protective measures to enhance the long-term operational safety of transmission lines.
Figure 9 illustrates a comparison of micro-terrain recognition results across various semantic segmentation models. As depicted in Figure 9, there are notable differences in the micro-terrain recognition outcomes among the various models. SegNet and RefineNet, which exhibit relatively poor segmentation performance, display significant misclassification issues. Moreover, the micro-terrain boundaries extracted by these two models are blurred, showing significant discrepancies with the true boundaries. In contrast, the micro-terrain recognition results from FCN8s, DeepLabV3+, UNet++, and the improved model, which exhibit superior segmentation performance, are generally quite similar, with the primary differences occurring in the finer details. Compared to other models with superior performance, the improved model achieves a more accurate delineation of micro-terrain boundaries, and its results more closely match the actual boundaries.
To provide a more comprehensive assessment of the improved model, this study examines the number of parameters and training time across different models. Table 2 presents the final comparison results.
Regarding model complexity, the improved model contains 22.51 million parameters, representing a slight increase compared to the baseline UNet++ (18.59 million), yet remaining considerably smaller than FCN8s (49.67 million), SegNet (49.37 million), and DeepLabV3+ (33.65 million). This indicates that the improved model enhances feature extraction capabilities while preventing excessive parameter growth, thereby reducing storage and computational resource consumption.
In terms of training efficiency, the improved model requires an average of 88.17 s per epoch, which is comparable to UNet++ (81.19 s), with only a slight increase of approximately 7 s. This minimal increase remains within an acceptable range. Furthermore, the improved model exhibits a significantly lower training time than DeepLabV3+ (142.28 s) while maintaining a comparable efficiency to FCN8s (71.08 s) and SegNet (83.19 s). Although RefineNet exhibits a relatively short training time (41.37 s), its classification accuracy is substantially lower than that of the improved model. Overall, despite incorporating additional modules, the improved model maintains moderate computational complexity, ensuring its competitiveness in training efficiency.
Based on the above analysis, the improved model not only enhances classification accuracy but also maintains parameter size and training time within a reasonable range.

3.3. Experimental Results of the Ablation Experiment

To assess the positive impact of the proposed modules on model improvement, we conducted an ablation experiment on the Micro-Terrain dataset. The ablation experiment evaluates micro-terrain recognition performance based on PA and IoU. Based on the improved model, the experiment removed the deep supervision module, GFM, and DA-Net module. The resulting network (i.e., the UNet++ model), after the removal of these modules, was used as the baseline for this experiment.
The results of the ablation experiment are presented in Table 3. “Base” refers to the baseline network, and “Fusion” denotes the fusion of DEM and profile curvature using the GFM.
The individual modules contributed differently to the model’s performance. Among them, the deep supervision strategy contributes the most significant enhancement in model classification performance. After incorporating the deep supervision strategy into the decoder, the model’s PA and IoU increased by 1.43% and 2.41%, respectively. The deep supervision strategy leverages the dense skip connections in UNet++ to integrate multi-scale terrain features, thereby significantly enhancing segmentation accuracy. The DA-Net and GFM exhibit comparable improvements but perform worse than the deep supervision strategy. Incorporating DA-Net improves the model’s PA by 0.48% and its IoU by 0.79%. This demonstrates that incorporating the attention module effectively guides the model to focus on more important features. After employing the GFM for data fusion, the model’s PA and IoU increased by 0.40% and 0.67%, respectively.
Different module combinations contribute varying degrees of improvement. The combination of DA-Net and GFM enhances the model’s PA by 0.82% and its IoU by 1.37%. However, the combination of GFM and the deep supervision strategy leads to an increase of 1.69% in PA and 2.86% in IoU. This combination proves to be the most effective among different module pairings.
In general, while the modules introduced in this study contribute differently to performance improvements, they all aid in model optimization. Through the combined effect of the three additional modules, the improved model ultimately enhances PA and IoU of the baseline network by 1.75% and 2.96%, respectively, achieving a notable improvement.

4. Conclusions

This paper focuses on the micro-terrain recognition of transmission lines and explores an improved semantic segmentation model based on UNet++. This model utilizes DEM, ECV, and profile curvature as multi-source input features, extracting high-level semantic features from each input through multiple encoders before fusing them. The extracted features are then processed by the decoder to generate micro-terrain recognition results. The improved model enhances its performance in the micro-terrain recognition of transmission lines by introducing the DA-Net module, GFM, and deep supervision strategy, achieving superior recognition results relative to other widely used semantic segmentation models. The main findings of the article are as follows:
(1) The improved model achieved 92.26% and 85.63% for PA and IoU, respectively, in the micro-terrain recognition. In comparison to widely used semantic segmentation models, such as FCN8s, DeepLabV3+, SegNet, and RefineNet, the improved model significantly enhanced its classification performance and demonstrated superior accuracy in delineating micro-terrain boundaries.
(2) In the recognition of specific categories, the improved model enhanced its classification performance for most micro-terrain categories. Notably, the improved model increased the CPA of the saddle type and alpine watershed type—categories that typically exhibit lower performance in other semantic segmentation models, at 90.64% and 88.00%, respectively.
(3) Ablation experiments demonstrate that the various modules integrated into the improved model significantly contributed to its performance improvement. Under the combined effect of these modules, the improved model increased PA and IoU by 1.75% and 2.96%, respectively, relative to the baseline network.
The improved semantic segmentation model proposed in this paper achieves the automatic and intelligent micro-terrain recognition for transmission lines and addresses the limitations of traditional methods, such as susceptibility to subjective factors, low automation, and incomplete classification. Furthermore, this model provides new insights and methodological advancements for transmission lines micro-terrain recognition.
Although the improved model has demonstrated strong recognition performance in micro-terrain recognition on the existing dataset, there are still some limitations and potential for further improvement. On one hand, the terrain data used in this study were all collected in Yunnan Province, which may limit the dataset’s representativeness. In the future, the dataset could be expanded to include data from other regions, which would further enhance the robustness and generalization ability of the trained model. On the other hand, the input features of the improved model are based solely on the terrain data, without incorporating remote sensing images, which could assist in micro-terrain recognition. Remote sensing images contain rich surface information, and their integration with terrain data would help identify more complex micro-terrain and extract clearer background details.

Author Contributions

Conceptualization, Feng Yi and Chunchun Hu; methodology, Feng Yi; software, Feng Yi; validation, Feng Yi and Chunchun Hu; formal analysis, Feng Yi; investigation, Feng Yi and Chunchun Hu; resources, Feng Yi; data curation, Feng Yi and Chunchun Hu; writing—original draft preparation, Feng Yi; writing—review and editing, Feng Yi and Chunchun Hu; visualization, Feng Yi; supervision, Chunchun Hu; project administration, Chunchun Hu; funding acquisition, Chunchun Hu. All authors have read and agreed to the published version of the manuscript.

Funding

This research was supported by the Natural Science Foundation of Hubei Province of China, grant number 2022CFB194.

Data Availability Statement

The data presented in this study are available on request from the corresponding author.

Acknowledgments

The authors wish to express their sincere gratitude to the reviewers and editors for their insightful comments, which significantly contributed to the improvement of this paper.

Conflicts of Interest

The authors declare no conflicts of interest.

References

  1. Huang, X.; Cao, W. Review of the disaster mechanism of transmission lines. J. Xi’an Polytech. Univ. 2017, 31, 589–605. [Google Scholar]
  2. Hu, J.; Deng, Y.; Jiang, X.; Zeng, Y. Feature extraction and identification method of ice-covered saddle mircotopography for transmission lines. Electr. Power 2022, 55, 135–142. [Google Scholar]
  3. Zhou, F.; Meng, F.; Zou, L.; Li, Z.; Wang, J. Automatic extraction of digital micro landform for transmission lines. Geomat. Inf. Sci. Wuhan Univ. 2022, 47, 1398–1405. [Google Scholar]
  4. Weiss, A.D. Topographic Position and Landforms Analysis; Semantic Scholar: Seattle, WA, USA, 2001. [Google Scholar]
  5. Zou, L. Micro Landform Classification Method of Grid DEM Based on Artificial Intelligence. Master’s Thesis, Changsha University of Science & Technology, Changsha, China, 2021. [Google Scholar]
  6. Long, J.; Shelhamer, E.; Darrell, T. Fully convolutional networks for semantic segmentation. In Proceedings of the 2015 IEEE Conference on Computer Vision and Pattern Recognition (CVPR), Boston, MA, USA, 7–12 June 2015; pp. 3431–3440. [Google Scholar]
  7. Ronneberger, O.; Fischer, P.; Brox, T. U-Net: Convolutional networks for biomedical image segmentation. In Medical Image Computing and Computer-Assisted Intervention—MICCAI 2015; Navab, N., Hornegger, J., Wells, W.M., Frangi, A.F., Eds.; Springer International Publishing: Cham, Switzerland, 2015; pp. 234–241. [Google Scholar]
  8. Zhao, H.; Shi, J.; Qi, X.; Wang, X.; Jia, J. Pyramid scene parsing network. In Proceedings of the 2017 IEEE Conference on Computer Vision and Pattern Recognition (CVPR), Honolulu, HI, USA, 21–26 July 2017; pp. 6230–6239. [Google Scholar]
  9. Badrinarayanan, V.; Kendall, A.; Cipolla, R. SegNet: A deep convolutional encoder-decoder architecture for image segmentation. IEEE Trans. Pattern Anal. Mach. Intell. 2017, 39, 2481–2495. [Google Scholar] [CrossRef]
  10. Lin, G.; Milan, A.; Shen, C.; Reid, I. Refinenet: Multi-path refinement networks for high-resolution semantic segmentation. In Proceedings of the 2017 IEEE Conference on Computer Vision and Pattern Recognition (CVPR), Honolulu, HI, USA, 21–26 July 2017; IEEE: Piscataway, NJ, USA, 2017; pp. 5168–5177. [Google Scholar]
  11. Chen, L.-C.; Papandreou, G.; Kokkinos, I.; Murphy, K.; Yuille, A.L. Semantic image segmentation with deep convolutional nets and fully connected CRFs. CoRR 2014, 40, 834–848. [Google Scholar]
  12. Chen, L.-C.; Papandreou, G.; Kokkinos, I.; Murphy, K.; Yuille, A.L. Deeplab: Semantic image segmentation with deep convolutional nets, atrous convolution, and fully connected crfs. IEEE Trans. Pattern Anal. Mach. Intell. 2018, 40, 834–848. [Google Scholar] [CrossRef]
  13. Chen, L.-C.; Papandreou, G.; Schroff, F.; Adam, H. Rethinking atrous convolution for semantic image segmentation. arXiv 2017, arXiv:1706.05587. [Google Scholar]
  14. Chen, L.-C.; Zhu, Y.; Papandreou, G.; Schroff, F.; Adam, H. Encoder-Decoder with Atrous Separable Convolution for Semantic Image Segmentation. In Computer Vision—ECCV 2018, Proceedings of the 15th European Conference, Munich, Germany, 8–14 September 2018; Ferrari, V., Hebert, M., Sminchisescu, C., Weiss, Y., Eds.; Springer International Publishing: Cham, Switzerland, 2018; pp. 833–851. [Google Scholar]
  15. Du, L. Research on Geomorphology Recognition and Classification Based on Multi-Modal Data Fusion. Ph.D. Thesis, Information Engineering University, Zhengzhou, China, 2019. [Google Scholar]
  16. Bajaj, A.; Bhardwaj, A.; Tuteja, Y.; Abraham, A. Landform segmentation in terrain images using image translation neural network architectures. In Intelligent Systems Design and Applications; Abraham, A., Bajaj, A., Hanne, T., Siarry, P., Ma, K., Eds.; Springer Nature: Cham, Switzerland, 2024; pp. 493–505. [Google Scholar]
  17. Yang, J.; Xu, J.; Lv, Y.; Zhou, C.; Zhu, Y.; Cheng, W. Deep learning-based automated terrain classification using high-resolution dem data. Int. J. Appl. Earth Obs. Geoinf. 2023, 118, 103249. [Google Scholar] [CrossRef]
  18. Ouyang, S.; Xu, J.; Chen, W.; Dong, Y.; Li, X.; Li, J. A fine-grained genetic landform classification network based on multimodal feature extraction and regional geological context. IEEE Trans. Geosci. Remote Sens. 2022, 60, 1–14. [Google Scholar] [CrossRef]
  19. Zhou, Z.; Rahman Siddiquee, M.M.; Tajbakhsh, N.; Liang, J. UNet++: A nested u-net architecture for medical image segmentation. In Deep Learning in Medical Image Analysis and Multimodal Learning for Clinical Decision Support; Stoyanov, D., Taylor, Z., Carneiro, G., Syeda-Mahmood, T., Martel, A., Maier-Hein, L., Tavares, J.M.R.S., Bradley, A., Papa, J.P., Belagiannis, V., et al., Eds.; Springer International Publishing: Cham, Switzerland, 2018; pp. 3–11. [Google Scholar]
  20. Zhou, Z.; Siddiquee, M.M.R.; Tajbakhsh, N.; Liang, J. UNet++: Redesigning skip connections to exploit multiscale features in image segmentation. IEEE Trans. Med. Imaging 2020, 39, 1856–1867. [Google Scholar] [CrossRef]
  21. Hosseinpour, H.; Samadzadegan, F.; Javan, F.D. CMGFNet: A deep cross-modal gated fusion network for building extraction from very high-resolution remote sensing images. ISPRS J. Photogramm. Remote Sens. 2022, 184, 96–115. [Google Scholar] [CrossRef]
  22. Fu, J.; Liu, J.; Tian, H.; Li, Y.; Bao, Y.; Fang, Z.; Lu, H. Dual attention network for scene segmentation. In Proceedings of the 2019 IEEE/CVF Conference on Computer Vision and Pattern Recognition (CVPR), Long Beach, CA, USA, 15–20 June 2019; IEEE: Piscataway, NJ, USA, 2019; pp. 3141–3149. [Google Scholar]
  23. Lee, C.-Y.; Xie, S.; Gallagher, P.; Zhang, Z.; Tu, Z. Deeply-supervised nets. arXiv 2014, arXiv:1409.5185. [Google Scholar]
  24. He, X.; Kong, T.; Dong, N.; Cheng, J.; Yu, F.; Feng, X.; Meng, L.; She, L. Impact of several typical micro-terrain and micro-meteorological areas on electric transmission lines. Hubei Electr. Power 2020, 44, 33–38. [Google Scholar]
  25. Wu, Z.; Luo, M.; Zhai, C.; Liu, Y. Analysis methods and application of landslide susceptibility in transmission line area. Shanxi Archit. 2023, 49, 58–62. [Google Scholar]
  26. Jiao, B.; Shi, P.; Liu, C.; Chen, L.; Liu, H. The distribution of rural settlements in relation to land form factors in low hilly land on the Loess Plateau. Resour. Sci. 2013, 35, 1719–1727. [Google Scholar]
  27. Guo, Z.; Yin, K.; Huang, F.; Fu, S.; Zhang, W. Evaluation of landslide susceptibility based on landslide classification and weighted frequency ratio model. Chin. J. Rock Mech. Eng. 2019, 38, 287–300. [Google Scholar]
  28. Yang, Q.; Zhao, M.; Liu, Y.; Guo, W.; Wang, L.; Li, R. Application of DEMs in regional soil erosion modeling. Geomat. World 2009, 7, 25–32. [Google Scholar]
  29. Simonyan, K.; Zisserman, A. Very deep convolutional networks for large-scale image recognition. arXiv 2015, arXiv:1409.1556. [Google Scholar]
  30. Li, W.; Li, K.; Chen, S. Multi-modal fusion based method for high resolution remote sensing image segmentation. J. South-Cent. Univ. Natl. 2020, 137, 405–412. [Google Scholar]
  31. Sun, H.; Pan, C.; He, L.; Xu, Z. Remote sensing image semantic segmentation network based on multimodal feature fusion. Comput. Eng. Appl. 2022, 58, 256–264. [Google Scholar]
  32. Li, M.; Xu, C.; Li, X.; Liu, H.; Yan, C.; Liao, W. Multimodal fusion for video captioning on urban road scene. Appl. Res. Comput. 2023, 40, 607–611+640. [Google Scholar]
  33. Hu, Y.; Yu, C.; Gao, M. Remote Sensing image semantic segmentation network based on multimodal fusion. Comput. Eng. Appl. 2024, 60, 234–242. [Google Scholar]
  34. Xie, S.; Chen, Z.; Shen, B. Detail-enhanced rgb-ir multichannel feature fusion network for semantic segmentation. Comput. Eng. 2022, 48, 230. [Google Scholar]
  35. Arevalo, J.; Solorio, T.; Montes-y-Gómez, M.; González, F.A. Gated multimodal networks. Neural. Comput. Appl. 2020, 32, 10209–10228. [Google Scholar] [CrossRef]
  36. Zhang, C.; Zhu, L.; Yu, L. Review of attention mechanism in convolutional neural networks. Comput. Eng. Appl. 2021, 57, 64–72. [Google Scholar]
  37. Hu, J.; Shen, L.; Sun, G. Squeeze-and-excitation networks. In Proceedings of the 2018 IEEE/CVF Conference on Computer Vision and Pattern Recognition, Salt Lake City, UT, USA, 18–22 June 2018; IEEE: Piscataway, NJ, USA, 2018; pp. 7132–7141. [Google Scholar]
  38. Wang, Q.; Wu, B.; Zhu, P.; Li, P.; Zuo, W.; Hu, Q. ECA-net: Efficient channel attention for deep convolutional neural networks. In Proceedings of the 2020 IEEE/CVF Conference on Computer Vision and Pattern Recognition (CVPR), Seattle, WA, USA, 13–19 June 2020; IEEE: Piscataway, NJ, USA, 2020; pp. 11531–11539. [Google Scholar]
  39. Li, X.; Wang, W.; Hu, X.; Yang, J. Selective kernel networks. In Proceedings of the 2019 IEEE/CVF Conference on Computer Vision and Pattern Recognition (CVPR), Long Beach, CA, USA, 15–20 June 2019; IEEE: Piscataway, NJ, USA, 2019; pp. 510–519. [Google Scholar]
  40. Zhang, H.; Wu, C.; Zhang, Z.; Zhu, Y.; Lin, H.; Zhang, Z.; Sun, Y.; He, T.; Mueller, J.; Manmatha, R.; et al. ResNeSt: Split-attention networks. In Proceedings of the 2022 IEEE/CVF Conference on Computer Vision and Pattern Recognition Workshops (CVPRW), New Orleans, LA, USA, 19–20 June 2022; IEEE: Piscataway, NJ, USA, 2022; pp. 2735–2745. [Google Scholar]
  41. Wang, Y.; Wang, H.; Peng, Z. Rice diseases detection and classification using attention based neural network and bayesian optimization. Expert Syst. Appl. 2021, 178, 114770. [Google Scholar] [CrossRef]
  42. Yu, Y.; Wang, P.; Fu, Q.; Kou, R.; Wu, W.; Liu, T. Survey of Evaluation Metrics and Methods for Semantic Segmentation. Comput. Eng. Appl. 2023, 59, 57. [Google Scholar]
Figure 1. Delineation of the micro-terrain types. (a) Saddle type; (b) canyon type; (c) alpine watershed type; (d) uplift type. The green lines in the figures represent the transmission lines built in the micro-terrain areas.
Ijgi 14 00216 g001
Figure 2. Micro-Terrain dataset example. DEM, ECV, and profile curvature are the three input features of Micro-Terrain dataset. In the labels, yellow indicates saddle type, red indicates canyon type, orange indicates the alpine watershed type, green indicates uplift type, and gray indicates the background.
Ijgi 14 00216 g002
Figure 3. Micro-terrain recognition model based on improved UNet++. (a) Encoder part; (b) decoder part. X 0 , 1 , X 0 , 2 , X 0 , 3 , and X 0 , 4 are both the output features of the encoder and the input features of the decoder. p 1 ,   p 2 ,   p 3 , and p f i a n l represent the prediction results of different network outputs in the decoder.
Ijgi 14 00216 g003
Figure 4. Schematic diagram of the gated fusion module. The DEM and profile curvature extracted by the encoder step by step are the input features of this module. Rectangles of different colors represent feature maps at different stages in the module. This module constructs a weight matrix Z to achieve dynamic fusion of two features.
Ijgi 14 00216 g004
Figure 5. DA-Net structure. DA-Net extracts important information from both spatial and channel aspects. Rectangles of different colors represent feature maps at different stages in the network. In this figure, C, H, and W denote the channel count, height, and width of the feature maps in the network, respectively.
Ijgi 14 00216 g005
Figure 6. Improved model classification metrics. In this figure, PA stands for Pixel Accuracy; CPA stands for Class Pixel Accuracy; IoU stands for Intersection over Union.
Ijgi 14 00216 g006
Figure 7. Transmission lines micro-terrain identification results of the improved model. (a) Line 1; (b) Line 2; (c) Line 3; (d) Line 4; (e) Line 5.
Ijgi 14 00216 g007
Figure 8. Zoomed in micro-terrain extraction result of Line 1. (a) Micro-terrain extraction result of Line 1; (b) local magnification result.
Ijgi 14 00216 g008
Figure 9. Comparison of micro-terrain recognition results from different semantic segmentation models. Label represents the true annotation in the Micro-Terrain dataset. FCN8s, SegNet, RefineNet, DeepLabV3+, and UNet++ represent the commonly used semantic segmentation networks involved in the comparison.
Ijgi 14 00216 g009
Table 1. Comparison of different semantic segmentation models on the Micro-Terrain dataset.
ModelPA (%)CPA (%)IoU (%)
UpliftSaddleCanyonAlpine WatershedBackground
FCN8s87.8491.3183.6289.8679.1584.1278.01
SegNet76.6278.8369.6481.8867.3875.9862.10
RefineNet80.3786.0757.1683.4768.0681.7967.18
DeepLabV3+89.1991.1688.2890.0982.9187.7780.50
UNet++90.5191.5788.8495.2684.4788.4582.67
Improved Model92.2693.9390.6494.7588.0088.7385.63
Table 2. Comparison of parameters and training time between different models (M refers to million).
ModelParamsAverage Training Time per Epoch/s
FCN8s49.67 M71.08
SegNet49.37 M83.19
RefineNet17.29 M41.37
DeepLabV3+33.65 M142.28
UNet++18.59 M81.19
Improved Model22.51 M88.17
Table 3. Ablation experiment results.
BaseDA-NetFusionDeep SupervisionPA (%)IoU (%)
×××90.5182.67
××90.9983.46
××90.9183.34
××91.9485.08
×91.3384.04
×92.1185.38
×92.2085.53
92.2685.63
Disclaimer/Publisher’s Note: The statements, opinions and data contained in all publications are solely those of the individual author(s) and contributor(s) and not of MDPI and/or the editor(s). MDPI and/or the editor(s) disclaim responsibility for any injury to people or property resulting from any ideas, methods, instructions or products referred to in the content.

