Article

Flow-Based Community Search Approach for Functionally Cohesive Building Group Recognition: A Case Study on Commercial Complexes

by
Taiyang Yang
1,2,
Pengxin Zhang
2,
Daozhu Xu
1,*,
Pengcheng Liu
3 and
Min Yang
1,2
1
Key Laboratory of Smart Earth, Beijing 100029, China
2
School of Resource and Environmental Sciences, Wuhan University, Wuhan 430079, China
3
College of Urban and Environmental Sciences, Central China Normal University, Wuhan 430079, China
*
Author to whom correspondence should be addressed.
ISPRS Int. J. Geo-Inf. 2025, 14(6), 213; https://doi.org/10.3390/ijgi14060213
Submission received: 7 March 2025 / Revised: 26 May 2025 / Accepted: 27 May 2025 / Published: 29 May 2025

Abstract

Recognizing functionally cohesive building groups is crucial for urban analysis, geospatial intelligence, and smart city applications. Traditional methods rely heavily on geometric information and often overlook the functional and semantic coherence of buildings, leading to their incorrect recognition. To overcome these challenges, this study introduces a flow-based community search approach, which models morphological, functional, and spatial relationships with a graph-based representation. The approach consists of graph representation learning, flow-based community generation, and community quality assessment, enabling adaptive building group recognition based on both structural coherence and functional similarity. Experimental results on commercial complex recognition demonstrate that our approach consistently outperforms traditional methods, achieving an improvement of over 5.4% in F1 score compared to the second-best method. Furthermore, its strong performance on limited training datasets highlights its robustness. These findings establish the proposed approach as an effective and reliable tool for recognizing functionally cohesive building groups, with practical viability in urban planning and policy formulation.

1. Introduction

Building groups represent structured collections of proximate buildings that are spatially arranged or functionally linked. They constitute a fundamental component of urban space, reflecting both physical organization and socio-functional integration. Building groups not only delineate the spatial configurations of urban environments (e.g., linear clusters or grid-based layouts) but also carry functional attributes closely associated with human-centered activities, such as commercial districts and residential zones [1,2]. Therefore, the recognition of building groups contributes to a deeper understanding of urban morphology, offering critical insights for urban planners and geospatial analysts. Furthermore, it serves as a key enabler in smart city research, supporting applications ranging from three-dimensional urban modeling to sustainable urban design [3,4]. In addition, the recognition of building groups serves as a fundamental prerequisite in multi-scale building mapping, as it provides the structural foundation for subsequent generalization operations [5,6]. In summary, the recognition of building groups constitutes a significant research task with broad applicability across a wide variety of fields.
Prior research on building group recognition has largely focused on detecting building clusters with regular spatial distributions, such as linear, grid-structured, or alphabetical-shaped patterns [7,8,9,10]. Although significant progress has been made, existing methods still exhibit inherent limitations in recognizing functionally cohesive building groups. A key challenge underlying these limitations is the decoupling of geometric and semantic features, where an over-reliance on geometric features leads to the neglect of semantic attributes. Despite buildings within the same group exhibiting similar geometric shapes, they may serve distinct functional purposes. For example, in the task of recognizing commercial complexes, existing methods may erroneously group geometrically adjacent shopping malls and residential buildings into the same cluster, failing to account for their distinct functional purposes.
To overcome this challenge, it is essential to move beyond purely geometric features and incorporate both semantic attributes and spatial relationships into the recognition process. Conventional rule-based and machine learning approaches often overlook the intricate spatial relationships among buildings, thereby limiting their capacity to recognize building groups. Although graph neural networks (GNNs) offer the advantage of modeling spatial dependencies within building networks [11,12], they are still constrained by a rigid one-size-fits-all grouping paradigm, which imposes uniform grouping rules across all buildings. This lack of adaptability makes it challenging to adapt to complex scenarios, where building functional heterogeneity is pronounced. Graph-based community search methods [13], which iteratively expand from one or more given query nodes to identify the most cohesive subgraph based on structural tightness and attribute similarity, offer a promising solution to the challenges of recognizing building groups with functional coherence. Community search methods focus on nodes that are functionally relevant and spatially adjacent, yielding more meaningful subgraphs—namely, building groups with functional coherence. Furthermore, compared to GNNs, community search is case-driven: it can learn potential grouping patterns from data rather than relying on rigid, predefined rules, thereby offering superior adaptability in complicated and heterogeneous urban contexts. Given these advantages, this study explores the application of the community search approach to the recognition of building groups, using commercial complexes as a case study.
The innovations and main contributions of this paper are as follows:
  • A case-driven, flow-based community search approach is innovatively applied to the task of recognizing functionally cohesive building groups. Using commercial complex recognition as a case study, our approach demonstrates a 5.4% improvement in F1 score over the second-best method.
  • An incremental graph propagation network is applied in our study to integrate the geometric features, semantic attributes, and spatial relationships of buildings. This integration effectively mitigates the decoupling of geometric and semantic features—an issue that commonly arises in building group recognition tasks.
  • We designed three synergistic modules that integrate feature computation, iterative node selection, and quality evaluation mechanisms. These components enable our method to maintain robust performance even with limited training data, demonstrating its practical applicability in data-scarce scenarios.
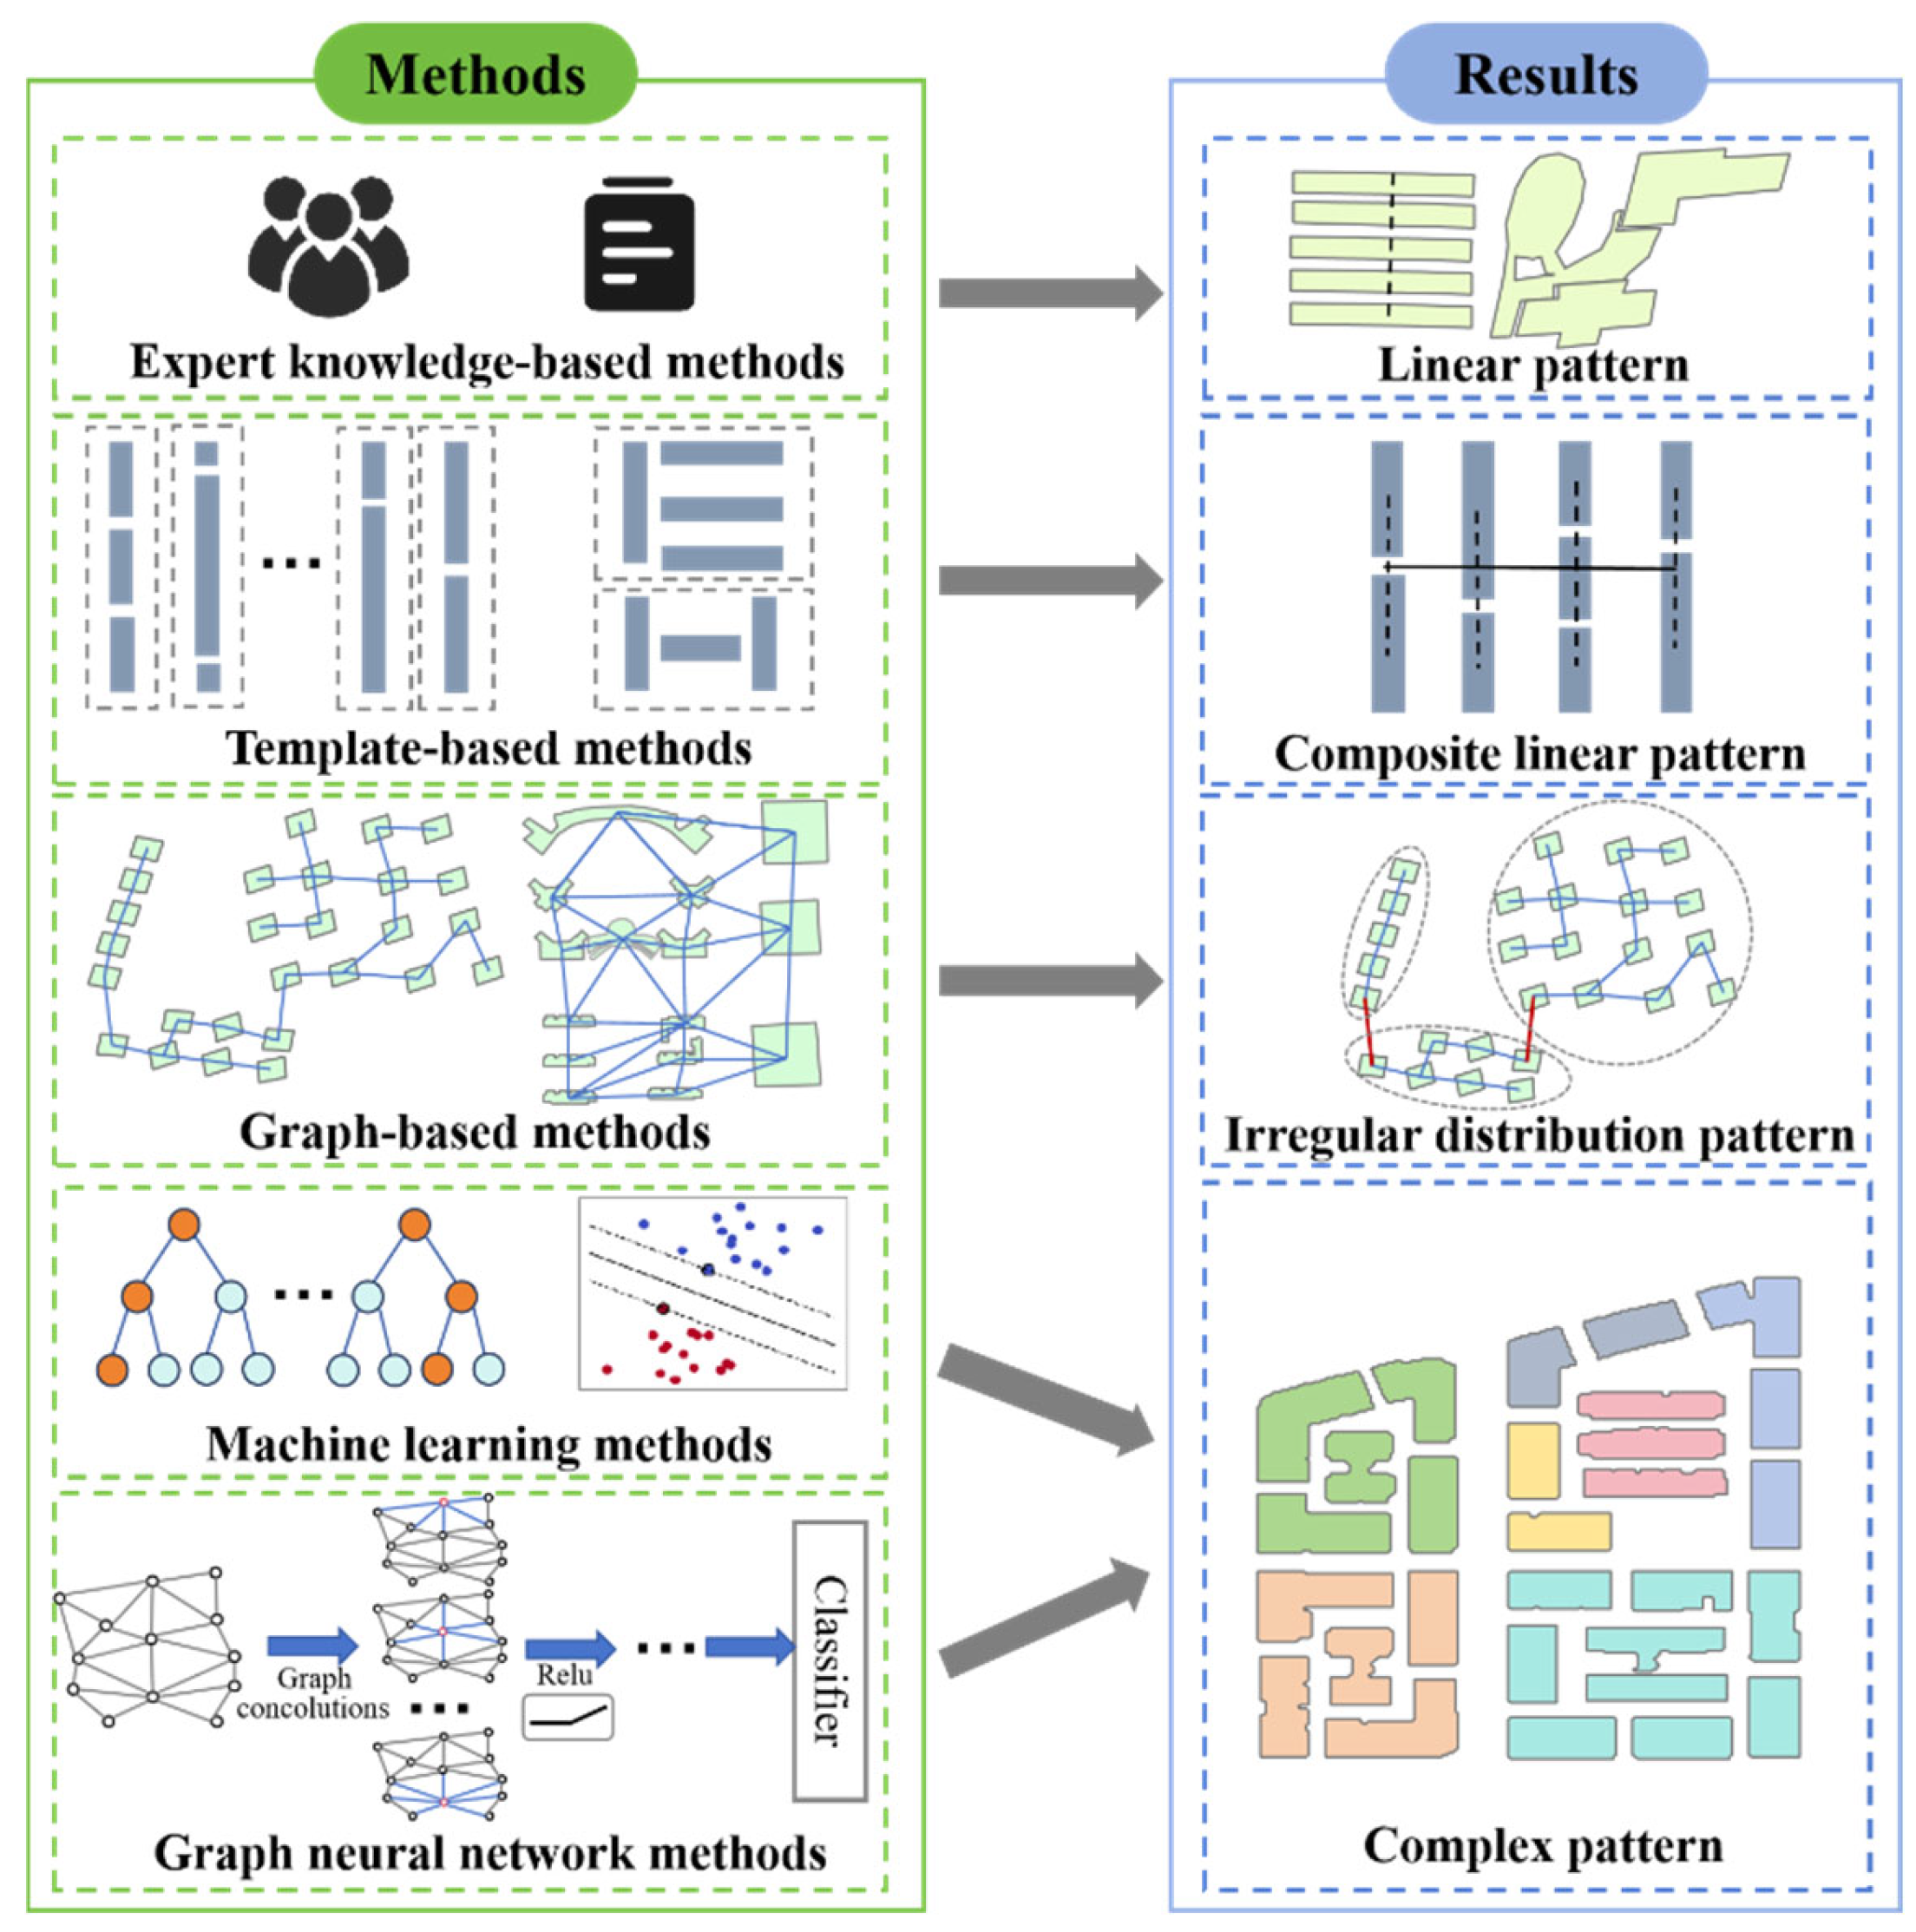
The remainder of this paper is structured as follows: Section 2 reviews related works on the recognition of building groups and community search. Section 3 provides an overview of the study area and the data used in the experiments. Section 4 describes the proposed approach in a step-by-step manner. In Section 5, we discuss the experiments, including experimental datasets, implementation details, recognition performance, and key insights. Finally, in Section 6, the conclusion encapsulates the main findings.

2. Related Works

2.1. Recognition of Building Groups

Research on recognizing building groups has undergone a significant paradigm shift, evolving from rule-based to data-driven methods, as shown in Figure 1. Early studies predominantly relied on expert knowledge to define building patterns as fixed templates, recognizing building groups by matching a given set of buildings to these predefined patterns. For instance, Rainsford and Mackaness [14] and Xing et al. [15] introduced templates to detect building patterns and grouping, but their methods were restricted to linear patterns. Similarly, Gong and Wu [5] employed template-based methods to recognize alphabetic-like building groups, such as Z-shaped and H-shaped patterns. Despite their effectiveness in specific cases, these template-based methods lack flexibility when dealing with building groups that exhibit irregular spatial distributions.
To enhance the adaptability of methods, researchers have increasingly adopted models based on graph theory. These models construct proximity graphs, such as the minimum spanning tree (MST) and Delaunay triangulation (DT) [16,17], to model spatial relationships. The recognition of building groups is subsequently carried out using rule-based detection algorithms. For instance, Zhang et al. [18] employed the MST in conjunction with Gestalt principles to detect collinear and curvilinear building groups. Further innovations have introduced graph refinement techniques, including graph pruning [19,20] and convex graph decomposition [1]. These refinement strategies enabled more sophisticated recognition of building groups through systematic edge removal and subgraph generation, particularly enhancing the detection of irregular spatial configurations.
Developments in computer science have prompted the integration of data-driven methods for recognizing building groups, marking a departure from the reliance on hand-crafted decision rules. Traditional models, including support vector machine (SVM) and random forest (RF), are adept at extracting building patterns from labeled examples and producing corresponding decision rules [18,21]. Nevertheless, these methods heavily depend on manual features and struggle to effectively process non-Euclidean spatial data, which are typical of complex building groups in urban environments. In response to these challenges, researchers have increasingly adopted graph neural networks (GNNs) as a robust alternative for recognizing building groups [22,23,24]. GNNs are uniquely suited for processing unstructured data, making them ideal for capturing the spatial relationships and nuanced interactions between buildings.
In addition, the functional consistency of building groups should not be overlooked. However, compared to the analysis of geometric patterns, recognizing building groups with inherent semantic significance—such as commercial complexes, healthcare campuses, or transportation hubs—remains an underexplored area despite its critical practical implications.

2.2. Community Search

Real-world networks (e.g., social networks and the World Wide Web) are frequently represented as graph structures to model intricate relationships among heterogeneous entities. A fundamental concept in network analysis is that of communities—clusters of vertices characterized by extensive intra-connections [25]. Given the intricacies of community structures, efficiently identifying them within graphs has emerged as a critical research challenge. To address this issue, a growing body of research has recently introduced methods of community search (CS). A CS method can automatically identify additional nodes that collectively form a coherent subgraph by designating a known node as a query node and modeling spatial links between adjacent nodes as graph edges. Existing CS methods bifurcate into two principal categories: non-attributed community search, which focuses on topological connectivity in simple graphs, and attributed community search (ACS), which integrates both structural cohesion and semantic consistency in attributed graphs. To quantify structural cohesion, multiple graph-theoretical metrics have been developed, including k-core decompositions [26], k-truss formulations [27], and k-clique [28]. However, these conventional metrics demonstrate limited adaptability when handling multifaceted real-world networks characterized by multidimensional attributes, necessitating more flexible community detection frameworks.
ACS extends non-attributed methods by synergistically integrating the dual constraints of structural cohesion and attribute homogeneity. Existing studies of ACS are systematically categorized into three paradigms: cohesiveness-based, spectral-based, and generative model-based methods. Firstly, cohesiveness-based methods, exemplified by ACQ [29] and ATC [30], employ two-stage optimization frameworks, where initial candidate communities are generated through predefined structural constraints (k-truss/k-core) and subsequently refined via attribute score maximization. Secondly, advancements in spectral-based methods include LEMON [31], which constructs localized spectral embeddings from short random walks to capture community signatures. Li et al. [32] facilitated the identification of attribute-aligned communities across multiple scales through adaptive spectral partitioning. Thirdly, generative model-based methods have emerged as a promising avenue for local community detection. A notable example is SEAL [33], which employs a GNN to learn node representations and follows a Generative Adversarial Network (GAN) framework. In this setup, the generator iteratively forms communities, while the discriminator distinguishes them from real ones. Through adversarial training, the generator refines its ability to produce communities that are increasingly indistinguishable from real ones.
In some of the literature, there is a significant overlap between CS and community detection (CD) [34,35,36], which share similar goals. Typically, CD employs global criteria to partition the entire graph and detect communities. In contrast, CS defines communities based on a set of query vertices and examples provided by the user. This enables the generation of subgraphs that are both structurally and semantically cohesive, which aligns more closely with the task of recognizing building groups.

3. Study Area and Dataset
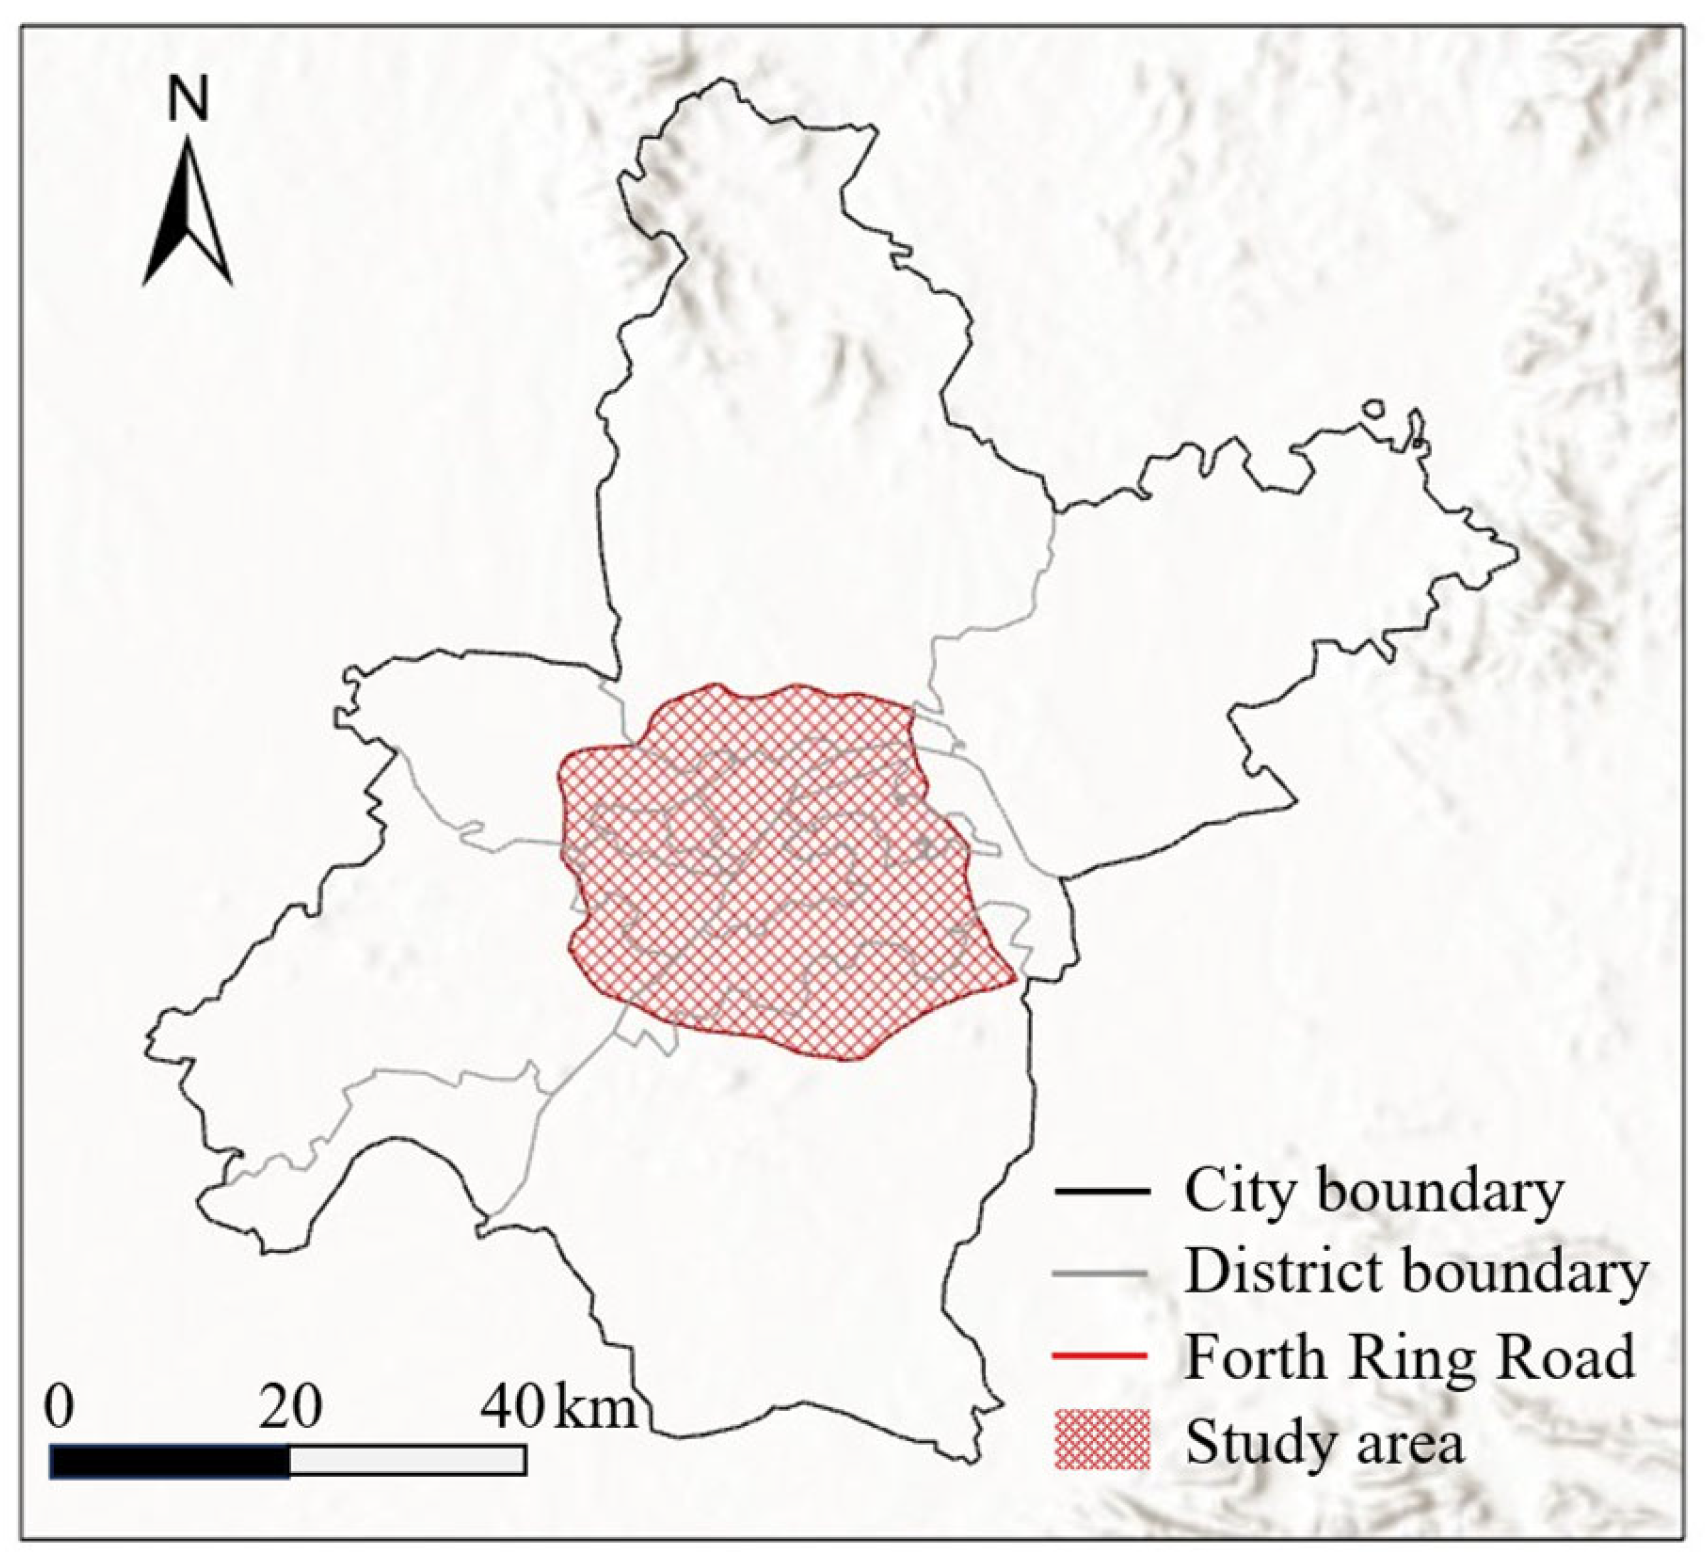
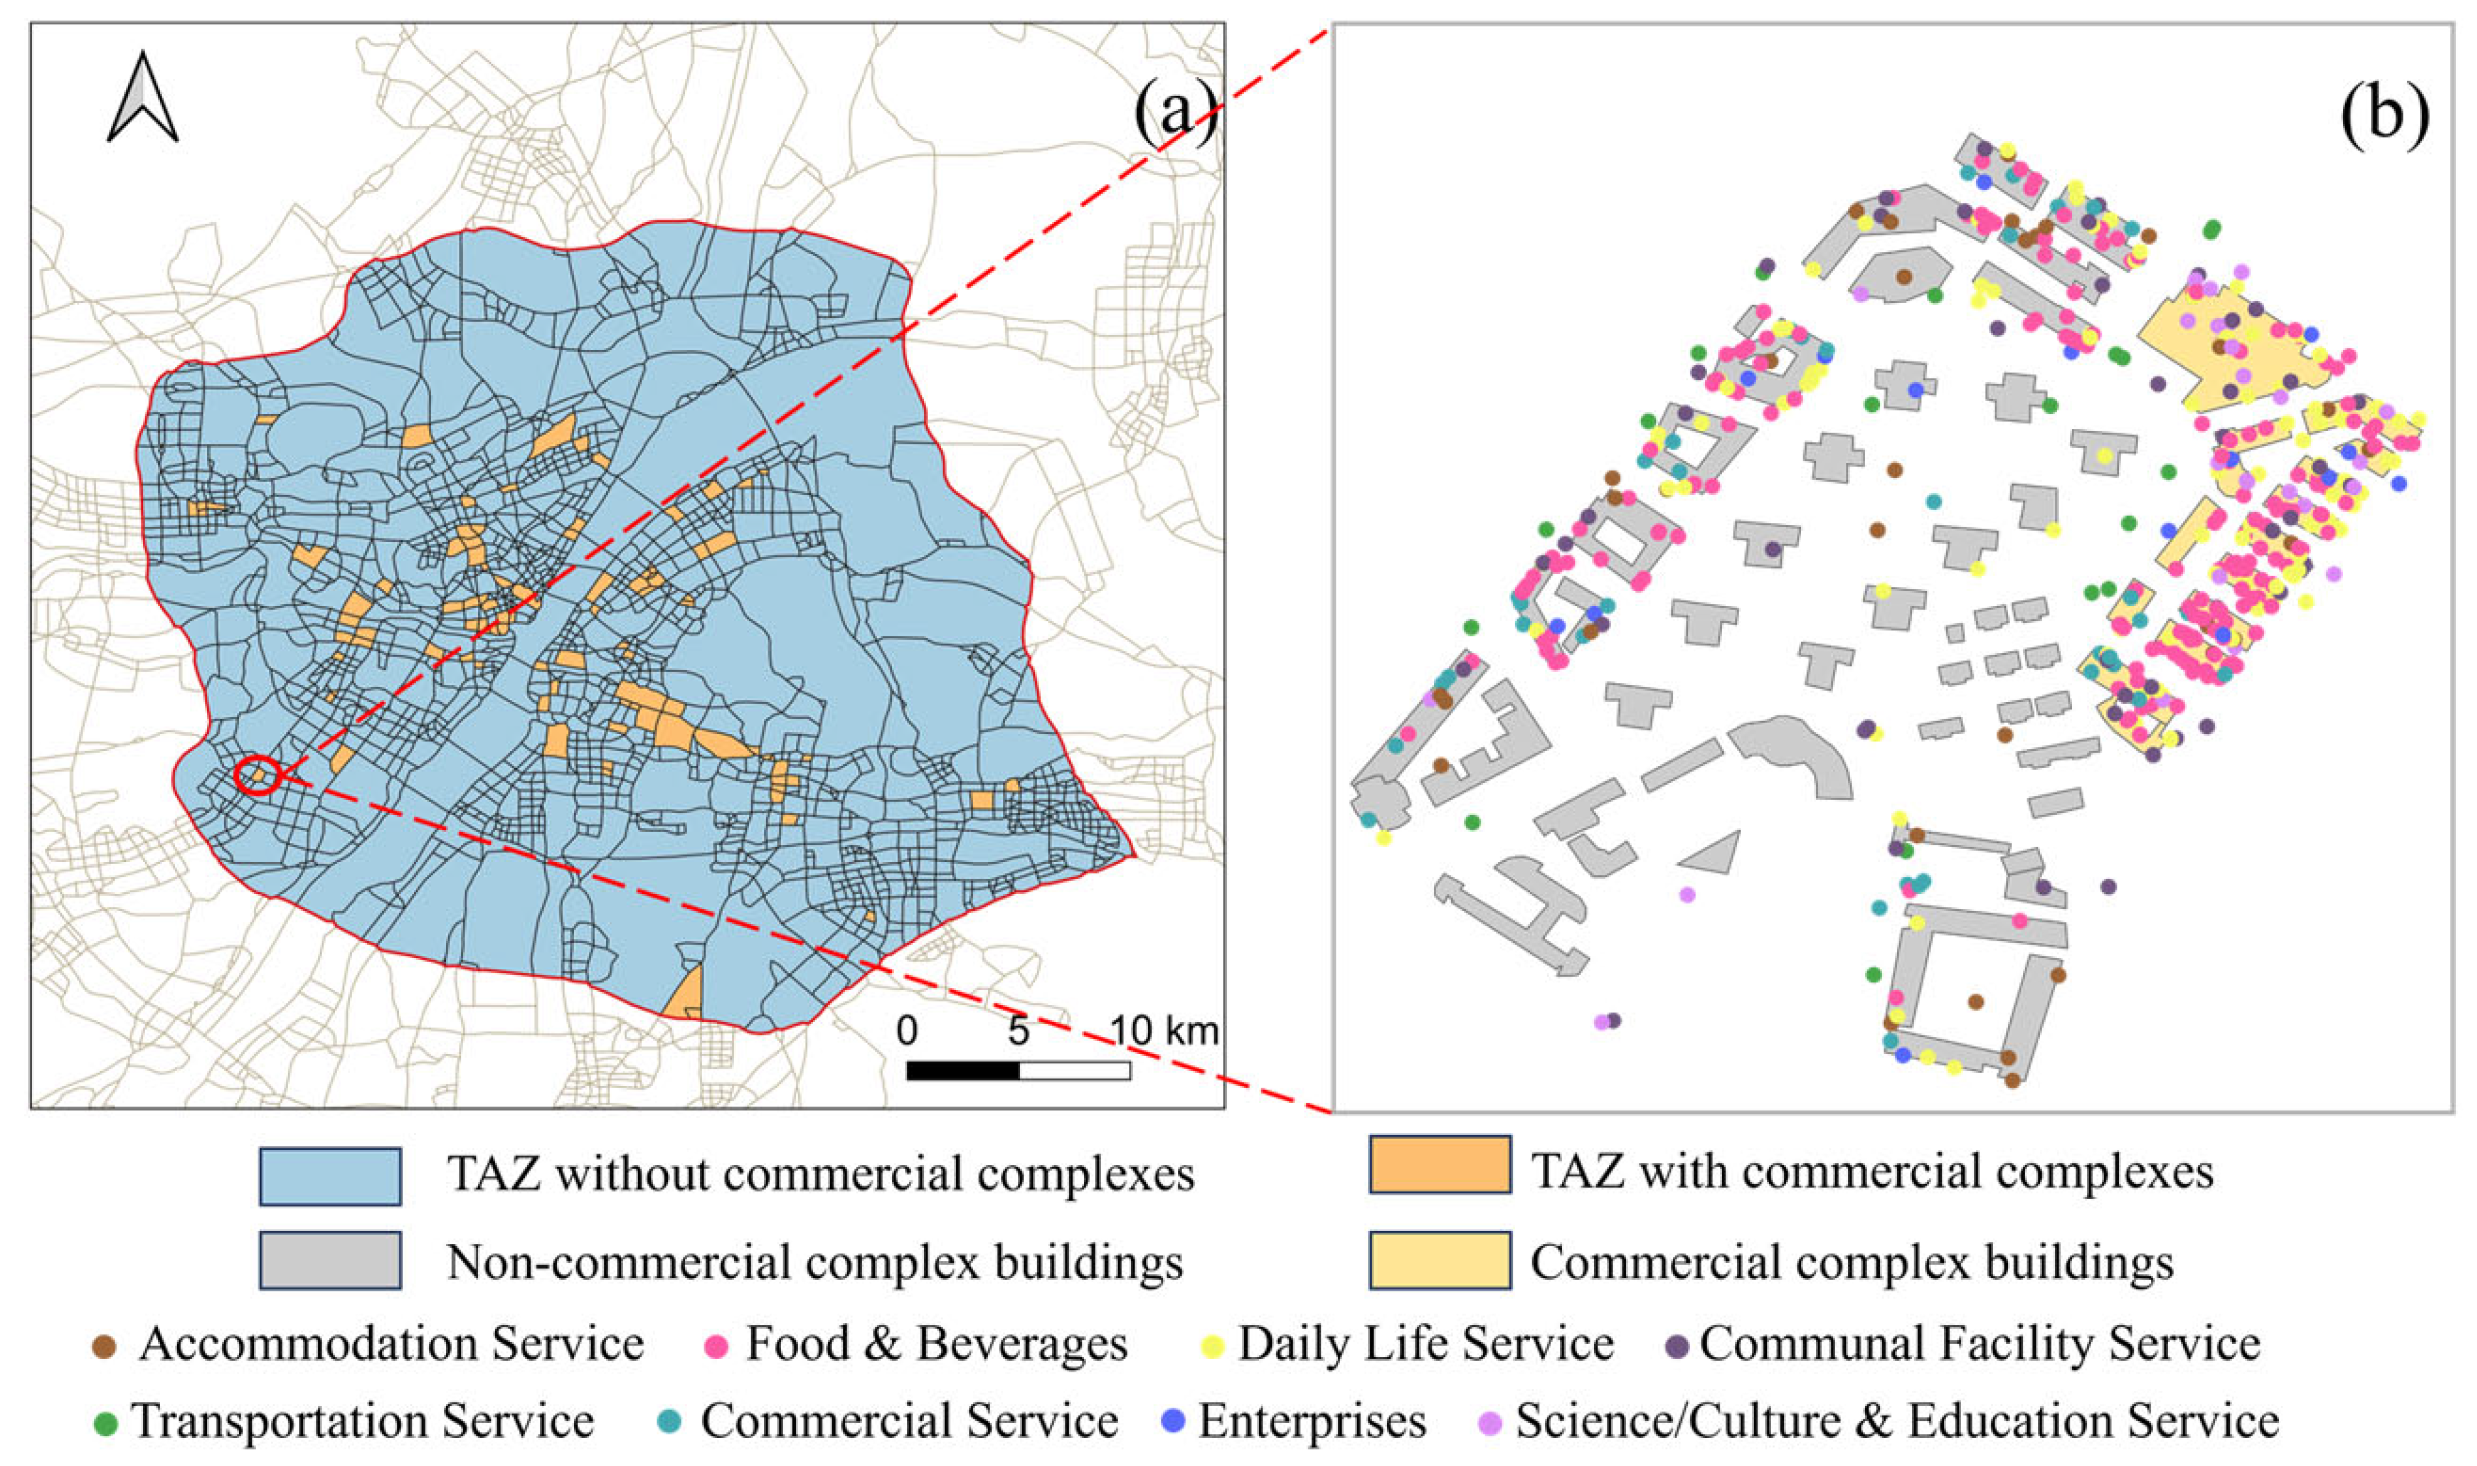
3.1. Study Area

Wuhan City, Hubei Province, China, a core city in the Yangtze River Economic Belt and a national central city, plays a vital role in the high-quality development of the Central Yangtze River Urban Agglomeration. In recent years, the city has released various policy documents, such as the “Implementation Opinions on Fostering and Building an International Consumer Center City”, which have facilitated the dual development of its commercial complexes in terms of both “stock updating” and “incremental innovation” and driven the transformation of commercial complexes from traditional shopping malls to multi-functional spaces, integrating commercial, cultural, and social functions. Additionally, the spatial distribution of commercial complexes in Wuhan not only follows the central place theory [37] but is also influenced by the city’s multi-center, cluster-based spatial layout, resulting in a multi-tiered commercial network structure that exhibits significant spatial heterogeneity. The combined effects of policy interventions and geographic factors provide a diverse range of case studies for commercial complex search tasks, rendering Wuhan an ideal region for research on commercial complex search. The study area is located within the Fourth Ring Road of Wuhan City, as shown in Figure 2.

3.2. Data Sources and Preprocessing
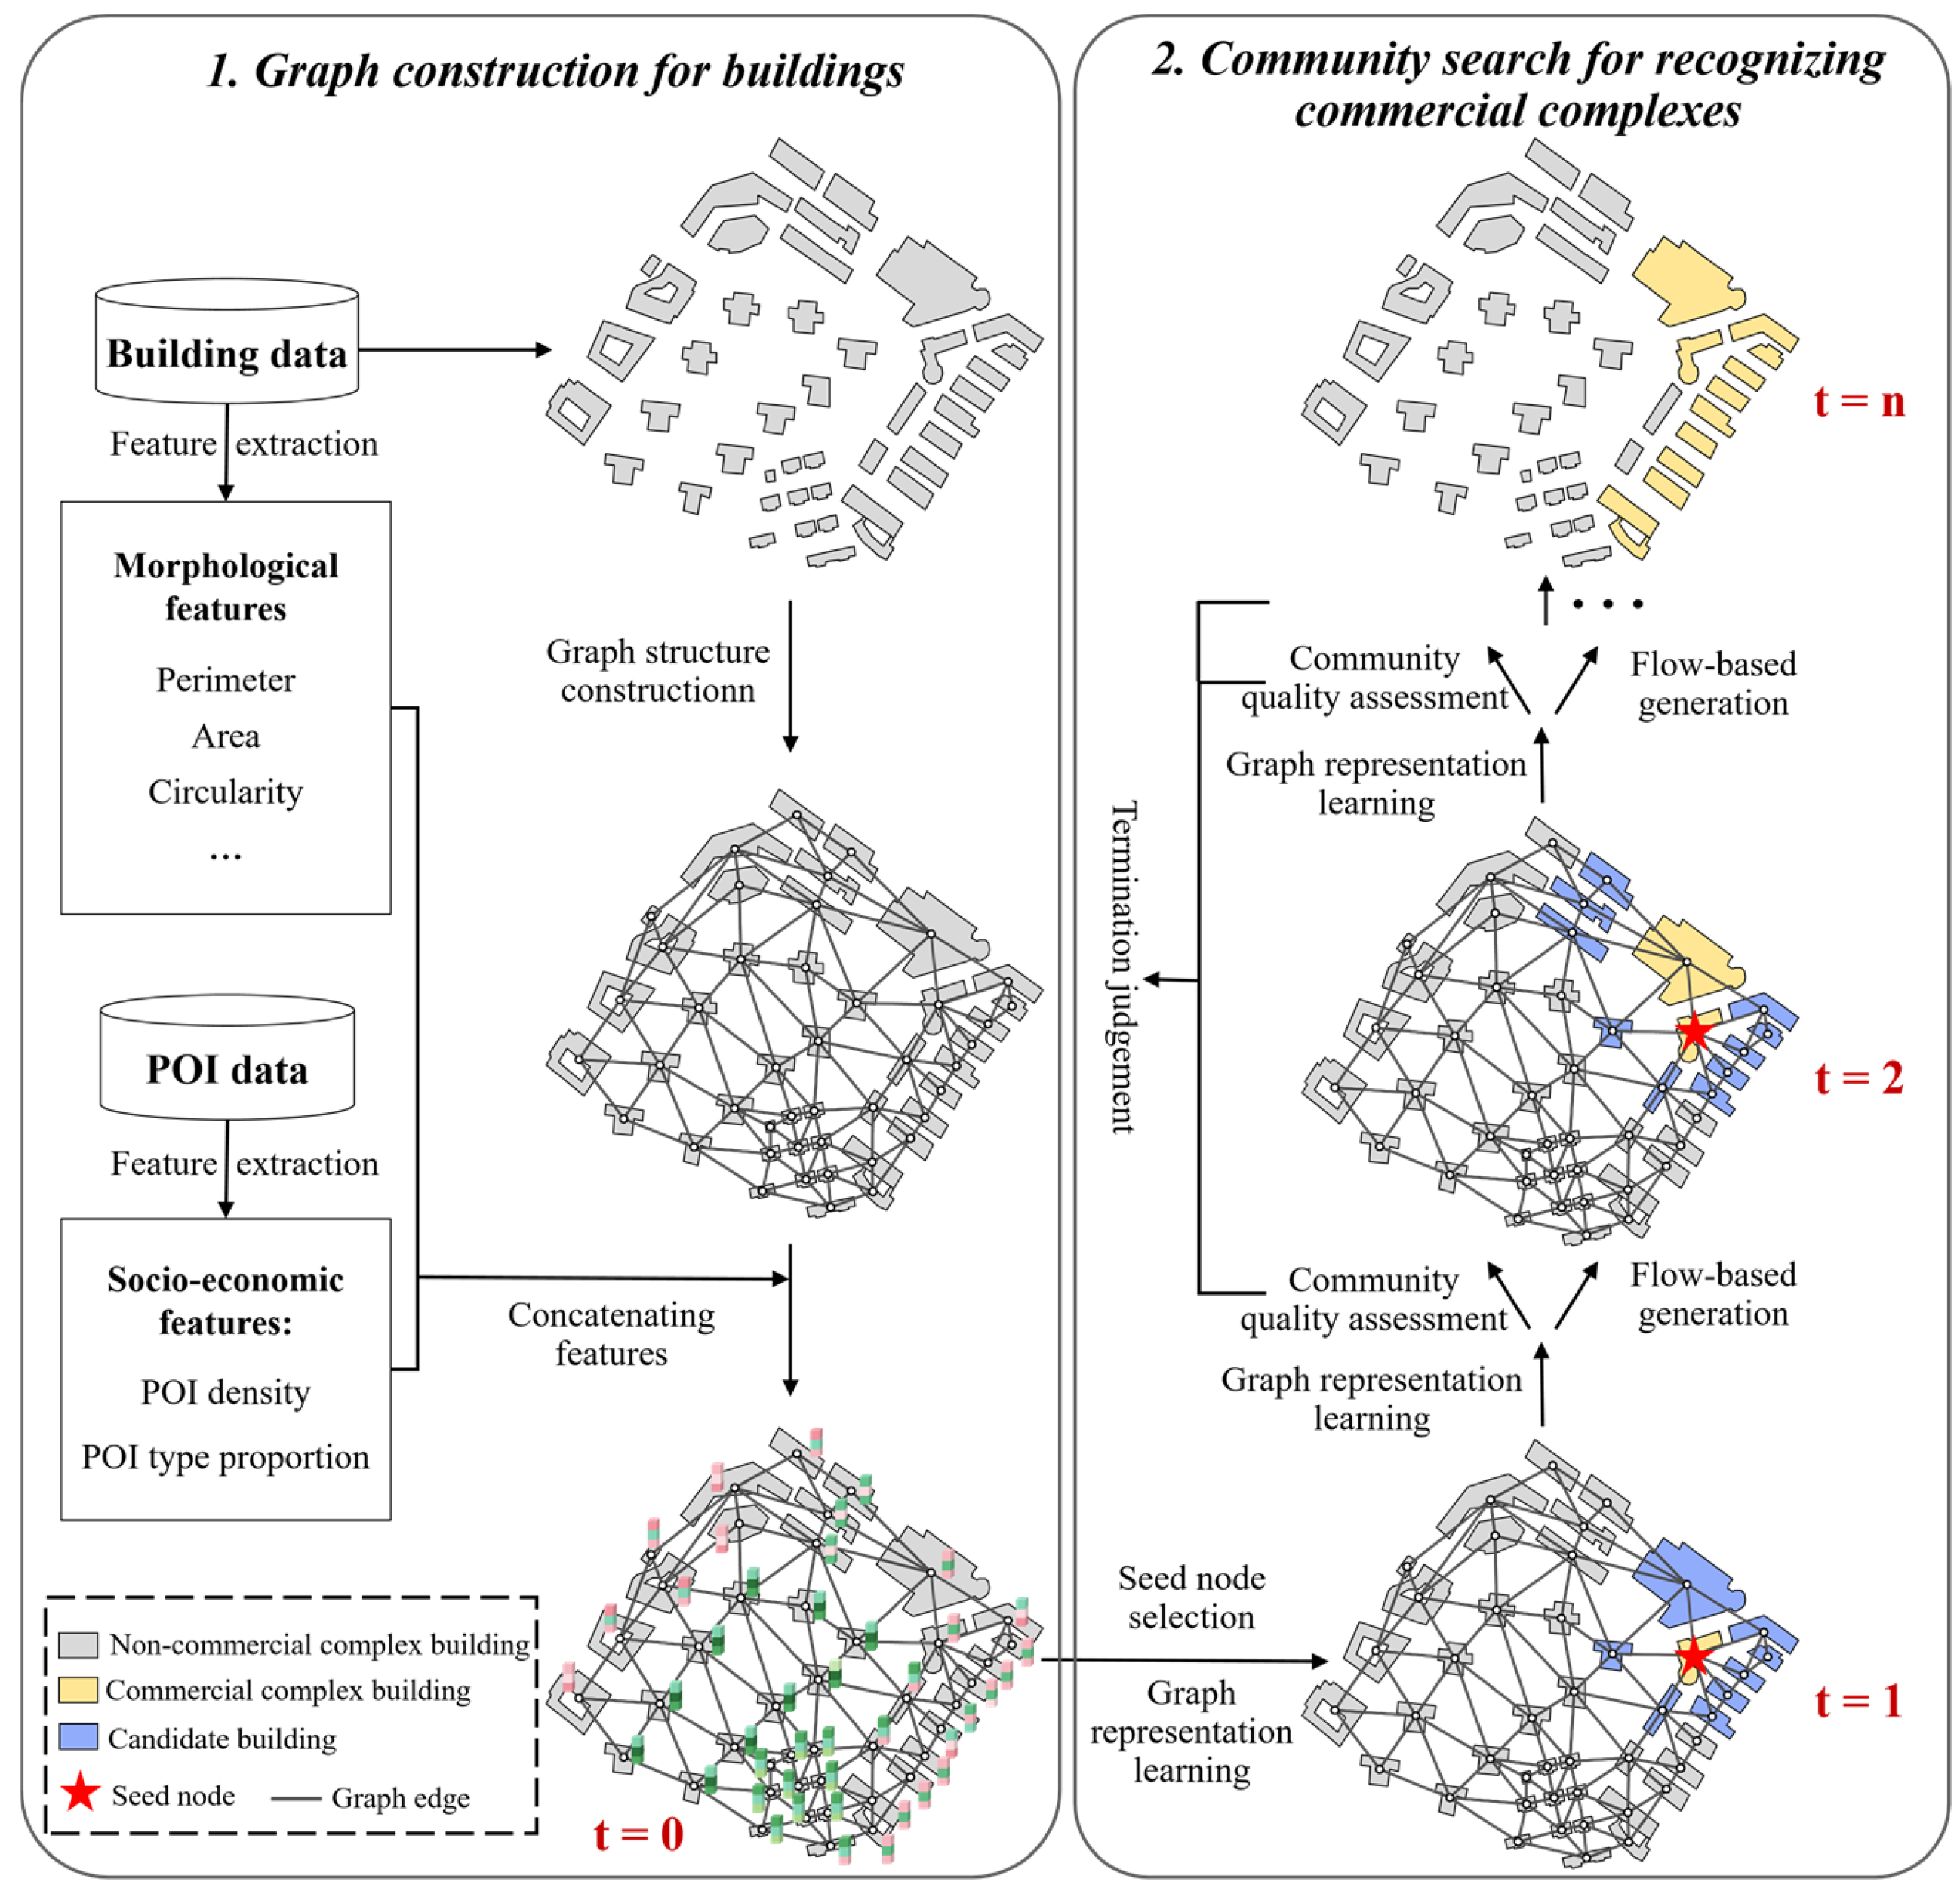
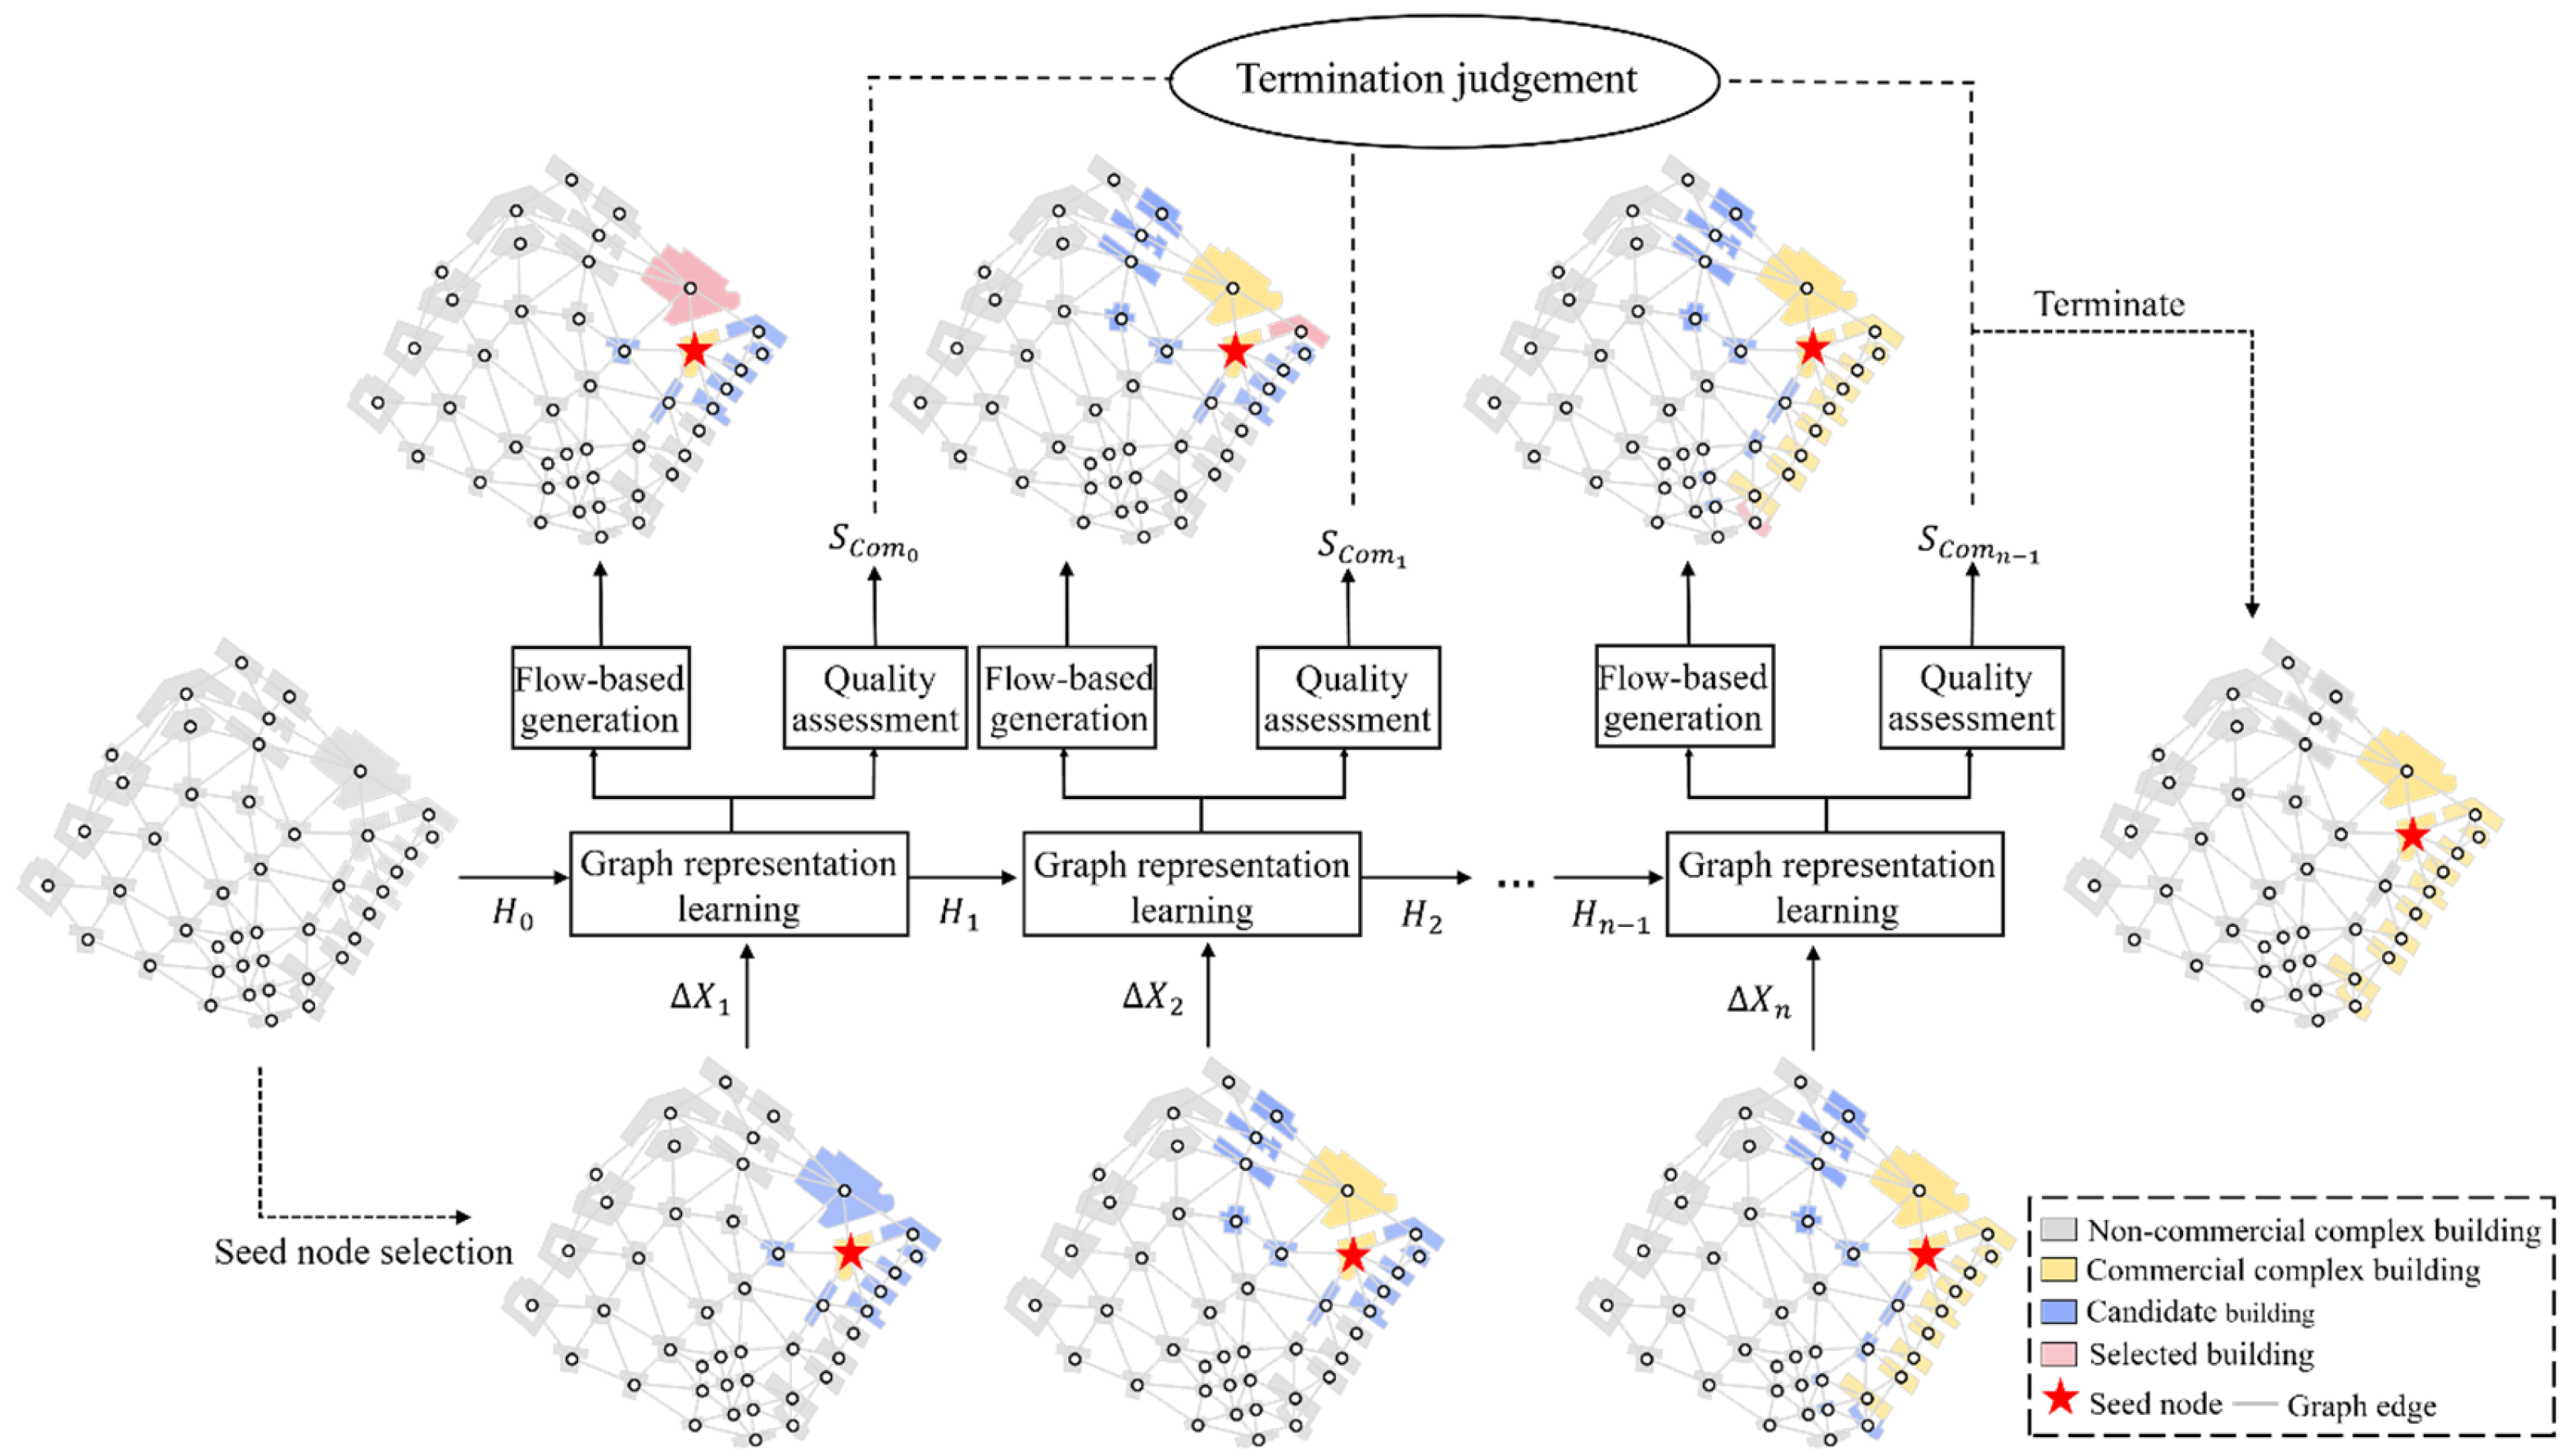
In this study, we primarily relied on building data, road data, and Point-of-Interest (POI) data. The road data were sourced from the OpenStreetMap (OSM) platform, while the building data were obtained from Baidu Maps. First, we manually labeled buildings in commercial complexes within the Fourth Ring Road of Wuhan City. The labeling process was carried out by three experts with specialized knowledge, using Baidu Maps as a reference. Next, we partitioned the study area into 1589 Traffic Analysis Zones (TAZs) using road data of level 3 and higher [38]. Given that the original OSM road data exhibit multi-lane and interchange structures in certain areas, along with topological errors, we utilized a dilation-thinning method to extract road centerlines for the TAZ division [39]. Finally, we selected 100 TAZs containing commercial complexes, as shown in Figure 3. Each TAZ corresponds to a community search unit, with all buildings within a TAZ serving as the research subjects of the search unit.
POI data were obtained through the Amap Application Programming Interface (API) and were used to calculate the socio-economic features of the buildings. Each POI entry includes attributes such as the name, address, longitude, latitude, and type (including big category, mid-category, and subcategory). To avoid excessive POI types, only the big category within the “type” field was considered in our study. Since certain POI categories were irrelevant to the scope of this research, categories such as Tourist Attraction, Motorcycle Service, and Place Name & Address were excluded. Finally, to address the imbalance in the number of POI categories, the remaining 17 categories were reclassified into 8 categories, as outlined in Table 1.

4. Methodology

The overall process of the proposed approach includes graph construction and commercial complex recognition, as shown in Figure 4. This section provides a detailed explanation of these two components.

4.1. Graph Construction for Buildings

4.1.1. Node Feature Extraction

  • Morphological features
Bertin’s visual variables [40] are the fundamental elements that make up map symbols, and their variations can effectively reflect the differences between geographic entities. In this study, we used three visual variables—size, orientation, and shape—to describe the morphological features of buildings.
Each visual variable is quantified through a set of metrics. To avoid redundancy and potential correlations among the metrics, while ensuring their applicability and relevance to our study, we have carefully selected the metrics for each visual variable. Specifically, the size variable is quantified using perimeter, area, height, and mean radius; the orientation variable is measured by the orientation of the smallest bounding rectangle; and the shape variable is characterized by elongation, circularity, convexity, rectangularity, equivalent rectangular index, and roughness index.
Based on the spatial competition theory [41], the existence of each building influences its surrounding space, and there is spatial competition between adjacent buildings. Ai and Zhang proposed a method for constructing Voronoi-like polygons based on constrained Delaunay triangulation (CDT) to capture the spatial influence range of buildings [42]. The ratio of the building area to its corresponding Voronoi-like polygon area serves as a significant metric for measuring the building density.
In summary, this study employs 4 variables—size, orientation, shape, and density—along with 12 metrics to describe the morphological features F M of individual buildings. The relevant calculation formulas and detailed annotations are provided in Table 2.
  • Socio-economic features
The socio-economic features F S E of each building are calculated based on the preprocessed POIs in Section 3.2. Specifically, these features include the density metric F D e n s i t y and the proportion metric F P r o p o r t i o n for different types of POIs around each building. Due to positional offsets in the POI data, we construct a buffer zone around the buildings with a radius of 10 m to capture nearby POIs [43]. Then, we apply kernel density estimation (KDE), a non-parametric statistical method, to calculate the density of different types of POIs within the buffer zone of building x [44], using Formula (1):
f j x = m = 1 n j 1 h 2 K D i s t a n c e x P O I m , j h
where h is the distance decay threshold; n j is the number of POIs of the j t h type within a distance of h from building x ; K is the kernel density function, with the Gaussian kernel density function being used in our study; P O I m , j denotes the m t h POI of the j t h type; and D i s t a n c e ( . ) represents the Euclidean distance calculation. The POI density metric F D e n s i t y for each building is expressed as [ f 1 x , f 2 x , f 8 x ].
In each TAZ, the proportion of the j t h type of POI at building x can be calculated using Formula (2):
g j x = c j / c C j / C
where c j and c represent the number of POIs of the j t h type and the total number of POIs within the buffer zone of building x , respectively. C j and C represent the number of POIs of the j t h type and the total number of POIs in the corresponding TAZ, respectively. The POI proportion metric F P r o p o r t i o n for each building is expressed as [ g 1 x , g 2 x , , g 8 x ].

4.1.2. Graph Structure Construction

For each TAZ, we construct an undirected graph G m ( V m , E m , X m ), where buildings are represented as nodes V m , the adjacency relationships between buildings are represented as edges E m , and the feature matrix of the nodes in the graph is represented as X m . The set of graphs corresponding to all TAZs is denoted by G s = { G 1 , G 2 , G m }, where m represents the number of TAZs containing commercial complexes.
In each G m , we determine the adjacency relationships between buildings using CDT. Two buildings are considered spatially adjacent if they share an edge in the triangulation. However, in practical applications, boundary adhesion between buildings can lead to geometric anomalies. We applied a negative buffer (0.1 m) to slightly shrink the building contours, thereby eliminating topological errors.
The descriptive feature vector F of each node is concatenated from the morphological features F M and the socio-economic features F S E of the corresponding building, as shown in Formula (3):
F = C o n c a t e n a t e F M , F S E
The node feature matrix X m of graph G m is formed by stacking the feature vectors of all the nodes within the graph, as depicted in Formula (4):
X m = S t a c k F 1 , F 1 F n
where n is the number of nodes in G m , i.e., the number of buildings in the corresponding TAZ.

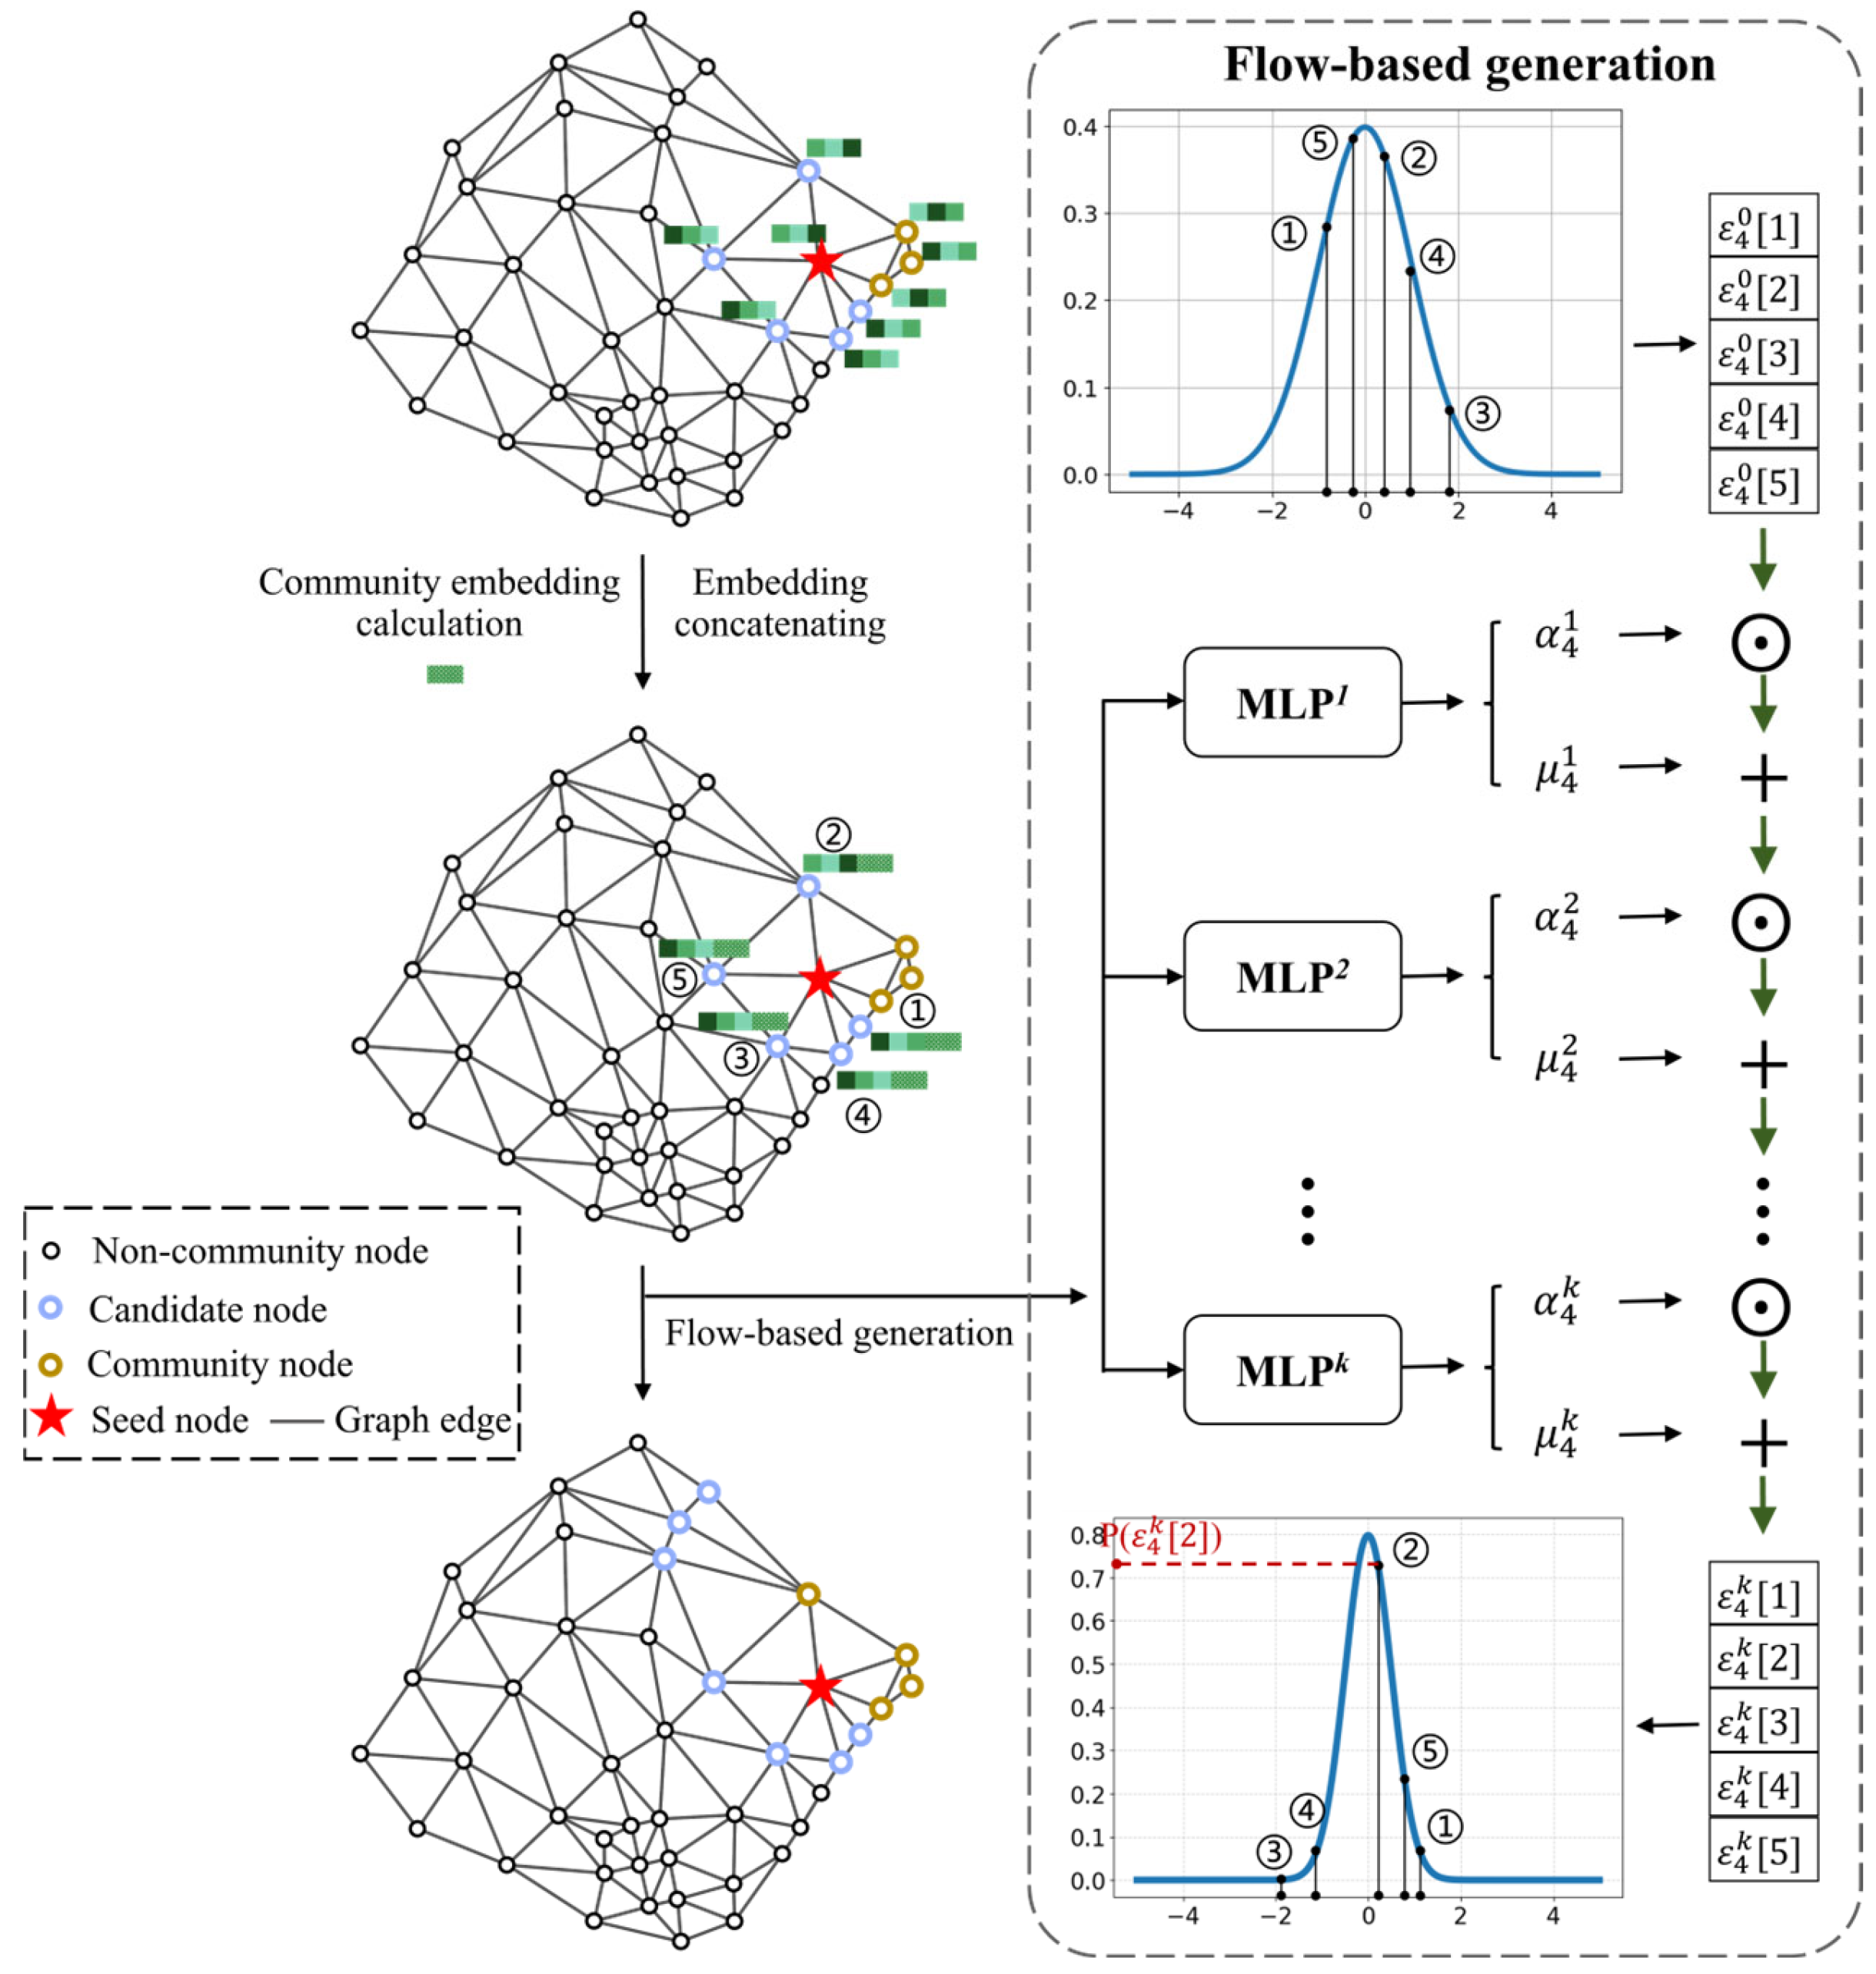
4.2. Community Search Approach for Recognizing Commercial Complexes

The commercial complex recognition task based on the community search approach aims to iteratively expand the set of commercial building nodes, also referred to as a community, denoted by C o m . The expansion process begins at the seed node s 0 and progresses based on spatial adjacency relationships and node features, continuing until specific stopping criteria are met. Ideally, all nodes corresponding to the commercial complex will be included in C o m , while nodes representing other buildings will be excluded. Through this process, each commercial building node is incorporated into only one community, ensuring that overlapping community membership does not occur.
The proposed approach consists of three synergistic modules: the graph representation learning module updates the embeddings of only a portion of nodes before each expansion, which are then passed to the flow-based generation module and the community quality assessment module. The goal of the flow-based generation module is to select the next node to expand C o m from its first-order neighbor. The community quality assessment module evaluates the quality of C o m by scoring the community and determines whether the search should be stopped based on changes in the community score. The workflow of the three proposed modules is illustrated in Figure 5. To further demonstrate the methodology, an example of a commercial complex search within a single TAZ is presented in this section.

4.2.1. Graph Representation Learning Module

The graph representation module is responsible for calculating and updating node embeddings. Prior to the embedding calculation, node features are derived by integrating both geometric and semantic information, as detailed in Section 4.1.1. During the commercial complex search process, the neighboring nodes of the seed node s 0 are more likely to be part of the commercial complex. Additionally, if all the neighbors of a given node are already included in C o m , it is highly probable that the node itself will be incorporated into C o m during subsequent expansion steps. Therefore, we enhance node features by marking whether a node is s 0 or belongs to the set C o m . In addition, considering the potential impact of nodes’ positions relative to the seed node s 0 , we also incorporate the distance between a node and s 0 as part of the enhanced features. At time step t , the enhanced feature matrix for nodes X ^ t can be expressed by Formula (5):
X ^ t = X , 0 , 0 , 0 t = 0 X , s e e d , e C o m t 1 , e d   t > 0
where X denotes the original node feature matrix, s e e d is a binary vector indicating whether nodes are seed node s 0 , e C o m t 1 is a binary vector representing whether nodes are a part of the set C o m at time step t 1 , and e d denotes the Euclidean distance between the nodes and the seed node s 0 .
In the community search process, each time a node is added to the set C o m , the vector e C o m t 1 must be updated accordingly. If traditional graph neural networks are employed, the graph representation learning module must execute t times over the entire graph, resulting in significant computational cost. To address this issue, we employ the incremental graph propagation network (iGPN), which is similar to SEAL [33]. The iGPN utilizes a random walk-based PageRank (PR) propagation mechanism [45], which incrementally updates the graph node embeddings.
When a new node is added to C o m , only a small subset of the nodes’ enhanced features undergo changes. The iGPN leverages changes in the enhanced features over consecutive time steps Δ X ^ t to compute the corresponding changes in the node embeddings Δ H t , as shown in Formula (6).
Δ H t = i G P N X ^ t = i G P N X , 0 , 0 , 0 t = 0 i G P N Δ X ^ t = i G P N O , s e e d , e C o m 1 , e d   t = 1 i G P N Δ X ^ t = i G P N O , 0 , e C o m t e C o m t 1 , 0 t > 1
where O , 0 represent the zero matrix and zero vector, respectively. As can be seen from the formula, when t = 0 , the iGPN calculates the initial embeddings for all nodes based on their initial enhanced features. At subsequent time steps, the iGPN updates the embeddings of the affected nodes based on changes in their enhanced features, rather than recalculating the embeddings for all nodes. In other words, the current node embeddings H t ( t > 0 ) are decomposed into two components: the previous time step’s node embeddings H t 1 and the computed change in node embeddings Δ H t , expressed as H t = H t 1 + Δ H t .
The computation process of the l -th layer of the iGPN is described by Formula (7):
H t l = δ A ^ H t l 1 + 1 δ H t 0
where H t ( l ) represents the node embedding matrix of the l -th iGPN at time step t ; when t = 0 , H t ( 0 ) = X ^ t , and when t > 0, H t ( 0 ) = Δ X ^ t . A ^ denotes the symmetrically normalized adjacency matrix, and δ is the damping factor that controls the contribution of neighboring node features to the current node’s features. The term 1 δ H t 0 serves as a residual component, aimed at retaining a certain proportion of the original embeddings at each node after propagation.
At time step t , only the nodes that belong to the current community, denoted by C o m t 1 , along with the first-order neighboring nodes of this community, denoted by N e i t 1 , need to be considered in the subsequent process. For ease of explanation, we merge these two sets into C o m ~ t 1 . Given that the computation process of the iGPN does not require learnable parameters, we then employ an MLP to compute the final embeddings of the nodes in the set C o m ~ t 1 , as shown in Formula (8):
H ~ t C o m ~ t 1 = M L P H t C o m t 1 , N e i t 1
where H ~ t represents the updated node embeddings at time step t.

4.2.2. Flow-Based Generation Module

The flow-based generation module is designed to support node selection in community generation by leveraging the embeddings of the current community’s first-order neighboring nodes, along with its own embedding, as shown in Figure 6. The community embedding is calculated by averaging the embeddings of all nodes within the community. Its formulation at time step t is given by Formula (9):
h ¯ C o m t 1 = M E A N H ~ t C o m t 1
We consider the nodes in N e i t 1 as candidate nodes for community generation at time step t . We concatenate the embedding of each candidate node u N e i t 1 with the community embedding, as described in Formula (10), to obtain the enhanced embedding h ^ t u of the candidate node. Finally, the enhanced embeddings of all candidate nodes are stacked, as shown in Formula (11), to form H ^ t ( N e i t 1 ) , which serves as the input to the flow-based generation module.
h ^ t u = C o n c a t e n a t e h ~ t u , h ¯ C o m t 1
H ^ t N e i t 1 = S t a c k [ h ^ t u 1 , h ^ t u 2 , , h ^ t u l t 1
where l t 1 represents the number of nodes in N e i t 1 .
The flow-based generation module utilizes a reversible transformation f θ to map a simple probability distribution (e.g., a standard normal distribution) into a more complex probability distribution, which enables a more accurate assessment of the likelihood of candidate nodes joining the community. To achieve this, k distinct MLPs are used to learn the parameters θ required for translation transformation and scaling transformation (i.e., the mean μ t i and the standard deviation σ t i , respectively), as presented in Formula (12). To ensure that the input dimension of the MLP remains consistent across different time steps, we introduce a hyperparameter to control the maximum number of neighboring nodes. If the actual number of neighbors is smaller than this threshold, zero padding is applied to H ^ t N e i t 1 . Conversely, if it exceeds the threshold, a fixed number of neighbors is randomly selected as candidate nodes, and their embeddings are used as the MLP input. The i -th ( 1 i k ) transformation is defined by Formula (13):
μ t i , α t i = M L P i H ^ t N e i t 1
ε t i = σ t i ε t i 1 + μ t i
where ε t i represents a vector whose dimension corresponds to the number of candidate nodes. The initial vector ε t 0 is randomly sampled from a standard normal distribution, i.e., ε t 0 ~ N ( 0,1 ) . denotes element-wise multiplication. After k transformations, the mapping relationship between the probability density function of the transformed sample z ( ε t k ) and the original sample ε ( ε t 0 ) can be expressed by Formula (14):
P E ε = P Z f θ ε d e t f θ ε ε = P Z z i = 0 k σ t i
where P E represents the probability density function of the sample ε , which follows a standard normal distribution; P Z denotes the probability density function of the transformed sample z = f θ ε under a complex distribution; and d e t f θ ε ε represents the Jacobian determinant of the transformation f θ , which accounts for the change in probability density induced by the transformation. Finally, based on the probability distribution function P Z , the candidate node with the highest probability u s e l e c t is added to the community, as shown in Formula (15):
u s e l e c t = argmax u Nei t 1 P Z z

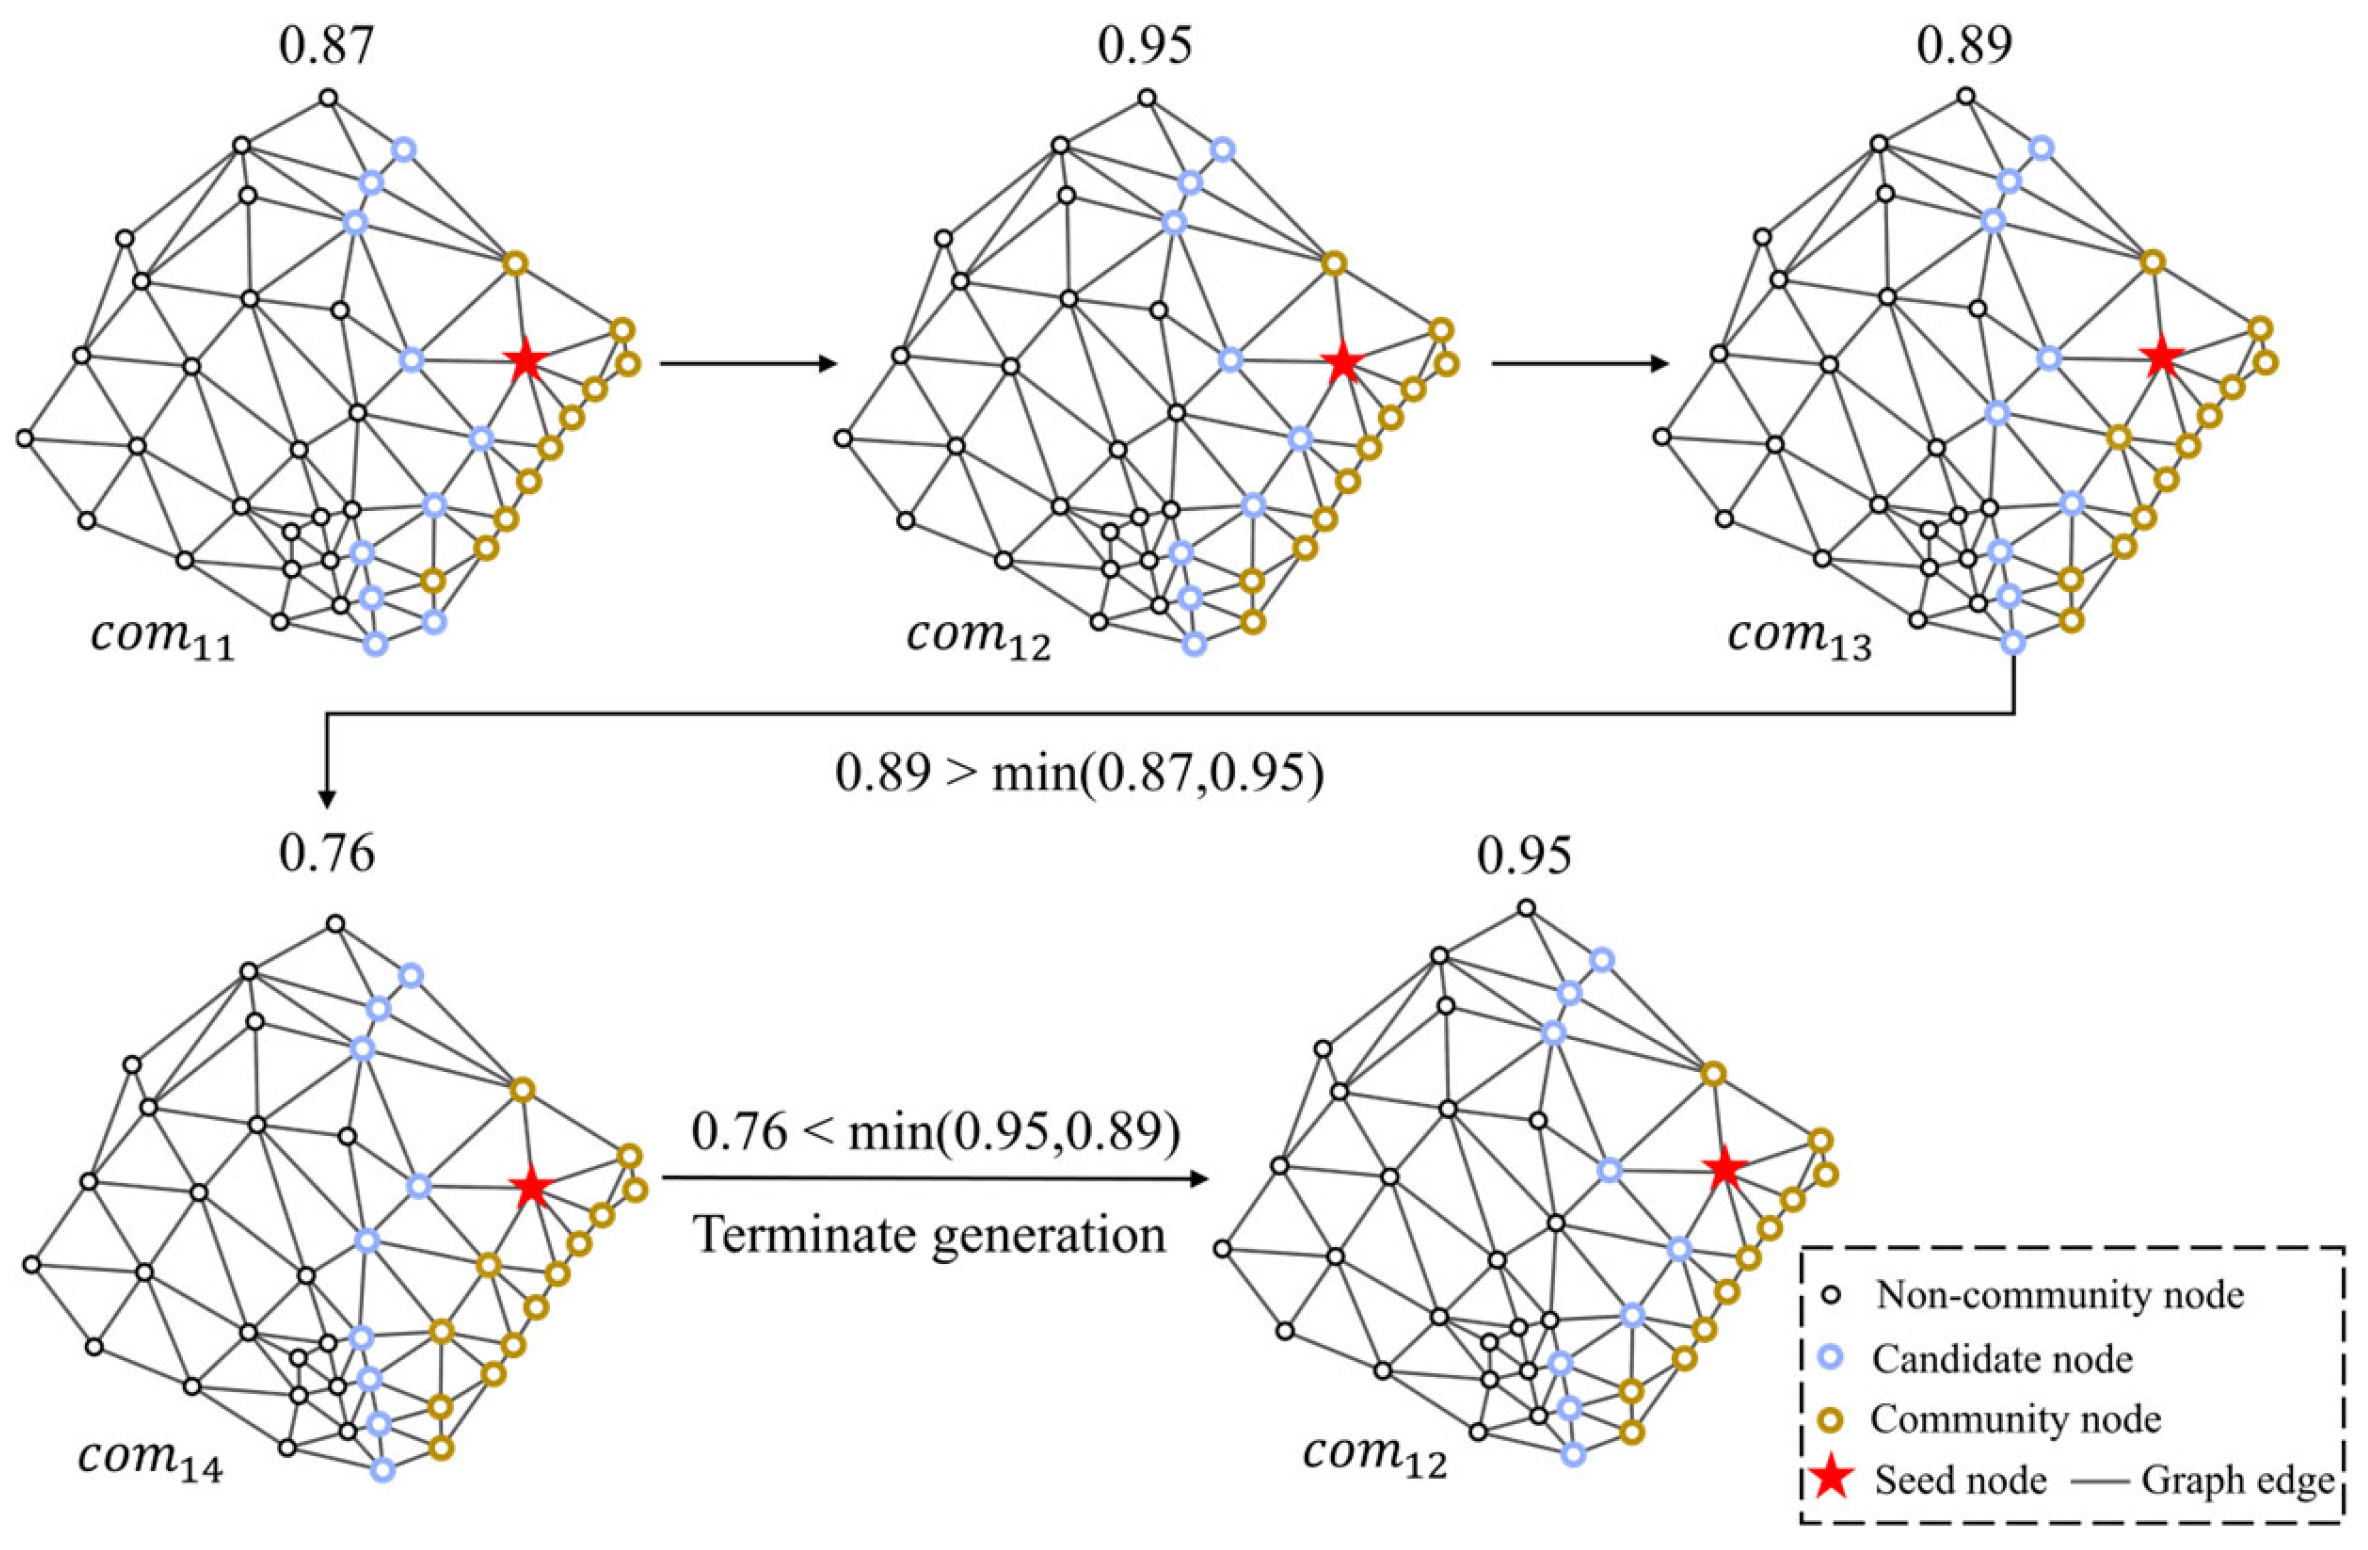
4.2.3. Community Quality Assessment Module

The community quality assessment module is designed to evaluate the quality of the community, thereby guiding the search for the commercial complex and determining when to terminate the search process. The community embedding is used to compute the quality score s C o m t 1 of the community C o m t 1 , as shown in Formula (16), where s C o m t 1 is constrained to the range [0, 1], with a higher score indicating better community quality.
s C o m t 1 = [ 1 + e x p ( M L P s ( h ¯ C o m t 1 ) ) ]
The community quality assessment module not only depends on the current community’s score to decide whether to stop the search, but also considers the trend of changes in the scores of multiple recently generated communities. Therefore, we construct a sliding window of fixed size m s , enabling a more stable termination strategy, as illustrated in Figure 7. Specifically, every time a node is added to the community, the corresponding quality score of the community is recalculated and incorporated into the sliding window, with the oldest score being removed. As a result, the sliding window always contains the scores of the most recent m s communities, denoted by { s C o m t , s C o m t 1 , , s C o m t m s + 1 }. If the community’s score s C o m t falls below the minimum score within the sliding window at step t —that is, s C o m t < m i n { s C o m t 1 , , s C o m t m s + 1 } it signifies a decline in community quality, prompting the termination of the search process. Ultimately, the community with the highest score within the sliding window is selected as the final search result.

4.3. Model Training

In each TAZ, we annotated the buildings corresponding to the commercial complexes, resulting in a set of annotated samples. A certain proportion of these annotated samples were randomly selected to construct the training dataset.
Since the selected node must be a first-order neighbor of the current community C o m t 1 at time step t , we reordered the annotated building nodes to determine the sequence of node selection. Specifically, for each annotated sample, we randomly selected a building as the seed node s 0 . Starting from this seed node, we performed a breadth-first search (BFS) to construct a series of snapshots of the generation process, as shown in Formula (17), which were used as training samples.
C o m 0 = s 0 , C o m 1 = s 0 , v 1 , , C o m T = s 0 , v 1 , , v T
where C o m T denotes the set of nodes within the community at time step T , and s 0 , v 1 , , v T are nodes ordered by the BFS. By selecting different seed nodes s 0 , multiple distinct training samples can be generated from each annotated sample.
During the training process, the flow-based generation module begins by computing the reversible transformation parameters θ based on the embeddings of the candidate nodes H ^ t ( N e i t 1 ) , as described in Formula (12). Then, the inverse transformation f θ 1 is applied, and the i -th ( 1 i k ) inverse transformation is defined by Formula (18):
ε t i 1 = ε t i μ t i 1 σ t i 1 i k
where ε t k represents a one-hot vector in which the value corresponding to the selected node is 1, while the values for all other candidate nodes are 0. The inverse transformation aims to map the samples z ( ε t k ) from the complex distribution back to the standard normal distribution samples   ε ( ε t 0 ) , as shown in Formula (19):
P Z z = P E f θ 1 z d e t f θ 1 z z = P E ε i = 1 k 1 σ t i
The loss function of the flow-based generation module is constructed with the objective of maximizing the log-likelihood of the probability distribution, as shown in Formula (20):
L o s s g = log P E ( ε ) i = 1 k l o g ( σ t i )
For the community quality assessment module, we pair adjacent snapshots to form positive sample pairs R p , as described in Formula (21), to facilitate model training. During the training process, the community quality should improve progressively; that is, s C o m T >   s C o m T 1 :
R p = C o m 1 , C o m 2 , C o m 2 , C o m 3 , , C o m T 1 , C o m T
To further enhance the ability of the community quality assessment module to differentiate between high-quality and low-quality communities, we introduce negative sample pairs R N , as shown in Formula (22). Specifically, we randomly select a node u i in N e i T and add it to C o m T , thereby generating a negative sample community, denoted by C o m N e g i = u i C o m T . During training, we enforce the condition that the quality of the negative sample community must be lower than that of the current community; that is, s C o m N e g i <   s C o m T .
R N = C o m T , C o m N e g 1 , , C o m T , C o m N e g i
We construct a squared pair ranking loss function, which effectively guides the community quality assessment module to learn community scores by simultaneously optimizing both positive and negative sample pairs. The loss function is defined by Formula (23), where m is a hyperparameter that the score difference between two adjacent communities must exceed.
L o s s s = ( C o m i , C o m i + 1 ) R P R N m a x 0 , s C o m i s C o m i + 1 + 1 2 1 m 1  
Finally, the total loss of the model L o s s is obtained by summing L o s s g and L o s s s in Formula (24), which serves as the optimization objective.
L o s s = L o s s g + L o s s s

5. Experimental Results and Discussion

5.1. Evaluation Indicators

To assess the quality of community search outcomes, appropriate metrics are needed to measure the similarity between the recognized and true communities. In this study, we employed the F1 score, normalized mutual information (NMI), and Jaccard scores as the evaluation metrics. The F1 score is computed using Formula (25):
F 1 = 2 × T P 2 × T P + F P + F N
where T P refers to the number of correctly recognized positive instances, F P to the number of incorrectly recognized positive instances, and F N to the number of incorrectly recognized negative instances.
NMI measures the consistency between the recognition results and the ground truth, with values ranging from 0 to 1, where a higher score indicates greater similarity. Based on the true and recognized labels c o m r and c o m p , NMI is defined by Formula (26):
N M I c o m r , c o m p = 2 × I c o m r , c o m p H c o m r + H c o m p
where H( c o m r ) and H( c o m p ) denote the entropy of c o m r and c o m p , respectively. The definition of I ( c o m r , c o m p ) is presented in Formula (27):
I r , p = i = 1 | c o m r | j = 1 | c o m p | p ( c o m r i , c o m p j ) log 2 ( p ( c o m r i , c o m p j ) p ( c o m r i ) p ( c o m p j ) )
where p( c o m r i , c o m p j ) denotes the probability that a randomly chosen sample is simultaneously assigned to both c o m r i and c o m p j , and p( c o m r i ) is the probability that a selected sample belongs to c o m r i .
The Jaccard score is a widely used metric for evaluating the similarity between two sets and is determined by computing the ratio of their intersection to their union. It is formulated as follows:
J a c c a r d c o m r , c o m p = c o m r c o m p c o m r c o m p
where | · | represents the number of elements in a set.

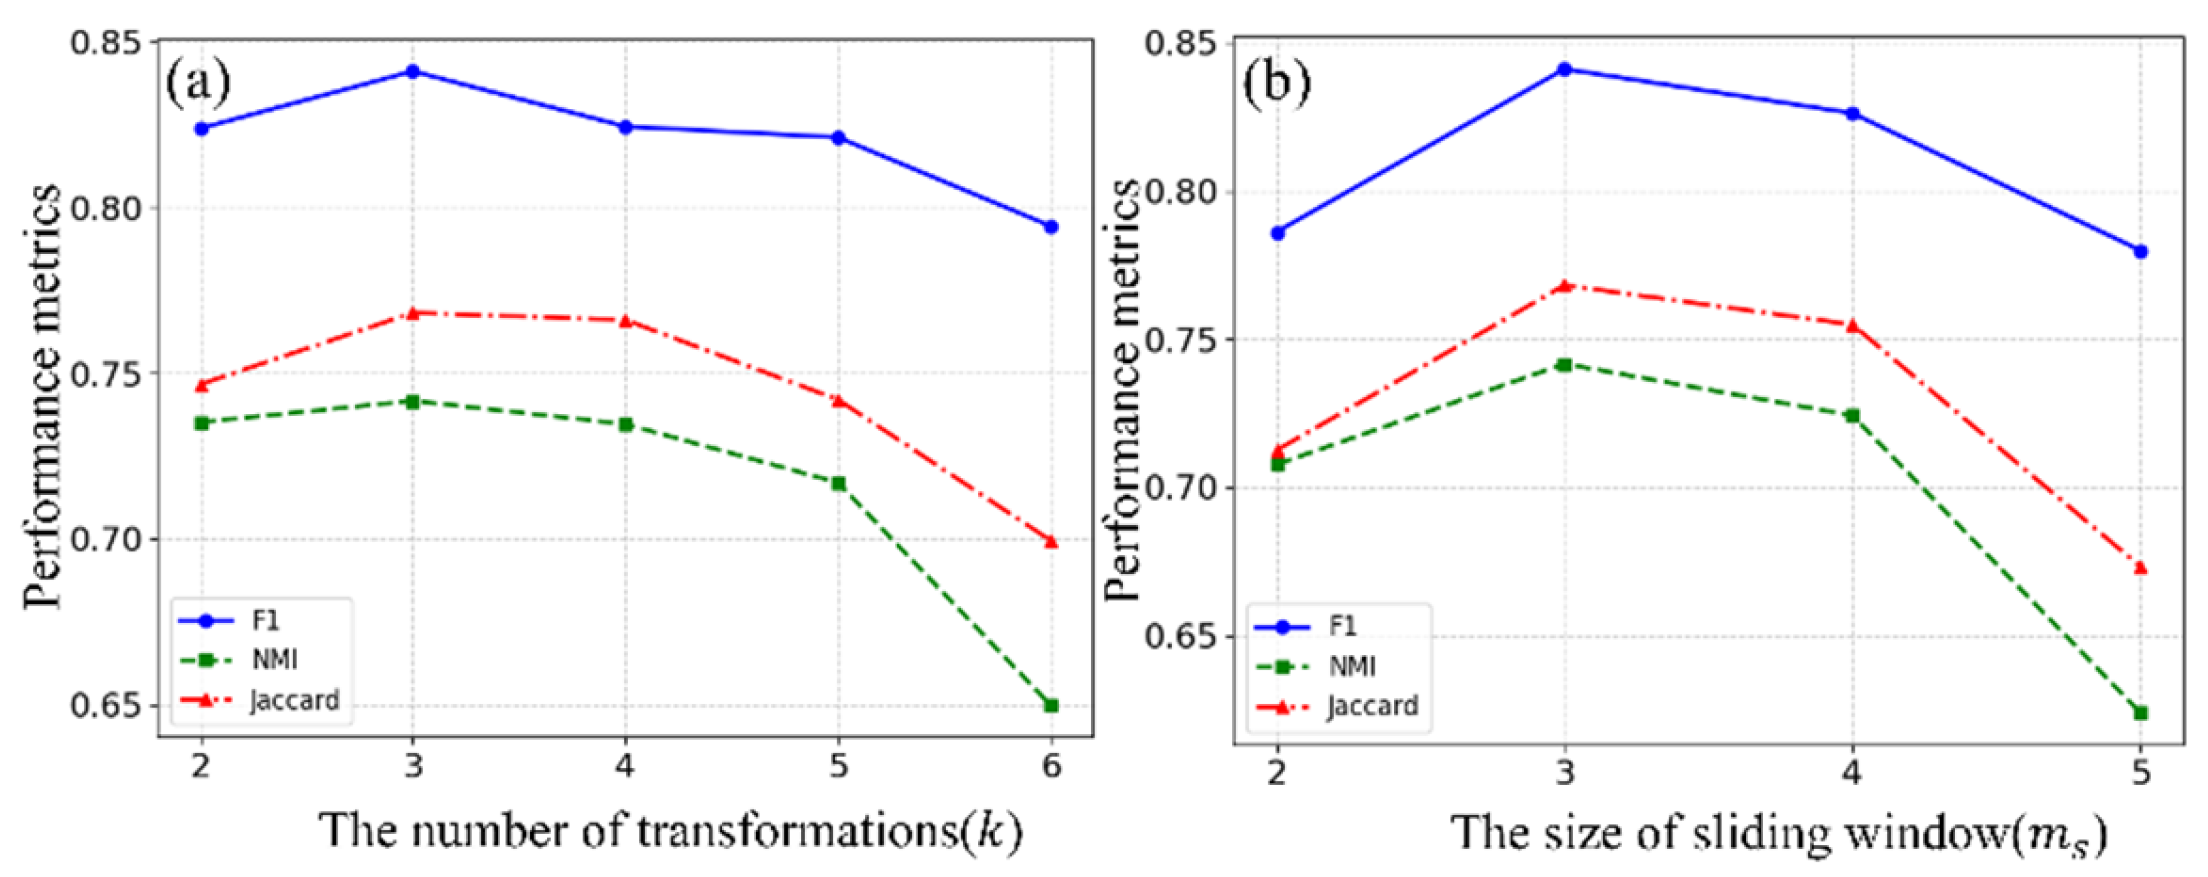
5.2. Experimental Settings

The experimental dataset (100 samples) was partitioned through random sampling, allocating 70% for training and 30% for testing purposes. The model was optimized using the Adam optimizer, with a learning rate of 1 × 10⁻⁴, 300 training epochs, and a batch size of 3, ensuring effective training. The seed node selection method for testing was as follows: Within each TAZ, we first constructed a normalized 100 m × 100 m grid and computed Gaussian kernel density distributions for two types of POIs, Commercial Services and Food & Beverages, as depicted in Figure 8a,b, respectively. These distributions were then fused using a geometric mean, and the peak coordinate of the resulting density field was identified. The building corresponding to the peak coordinate was designated as the seed node s 0 for community search, as shown in Figure 8c.
This section further details the hyperparameter tuning process, which was conducted using five-fold cross-validation on the training set. The final reported results represent the average performance over five experimental runs. First, the sliding window size m s defines the number of time steps considered for evaluating community quality. Smaller windows increase sensitivity to community score changes, potentially halting searches prematurely and missing nodes, whereas larger windows may dilute distinctions, erroneously incorporating extraneous nodes. Thus, we evaluated sizes {2, 3, 4, 5}, with all metrics peaking at 3, as shown in Figure 9a, leading to its adoption.
Second, the number of transformations k significantly impacts model performance: an excessively large k may lead to overfitting, causing the model to capture excessive noise and reducing its generalization ability, while an overly small k may limit the model’s capacity to effectively learn and represent the selection probabilities of candidate nodes, resulting in suboptimal performance. We evaluated model performance with k set to {3, 4, 5, 6}. The model’s performance metrics initially increased and then declined, achieving the best performance at k = 3 , as shown in Figure 9b, which was therefore adopted.
Further, all MLPs in the model adopted a uniform four-layer structure, with only the input layer varying in dimension, and the three subsequent layers were fixed at 64, 128, and 64 units. To ensure consistent input dimensions for the flow-based generation module, the maximum number of neighboring nodes was set to 10.

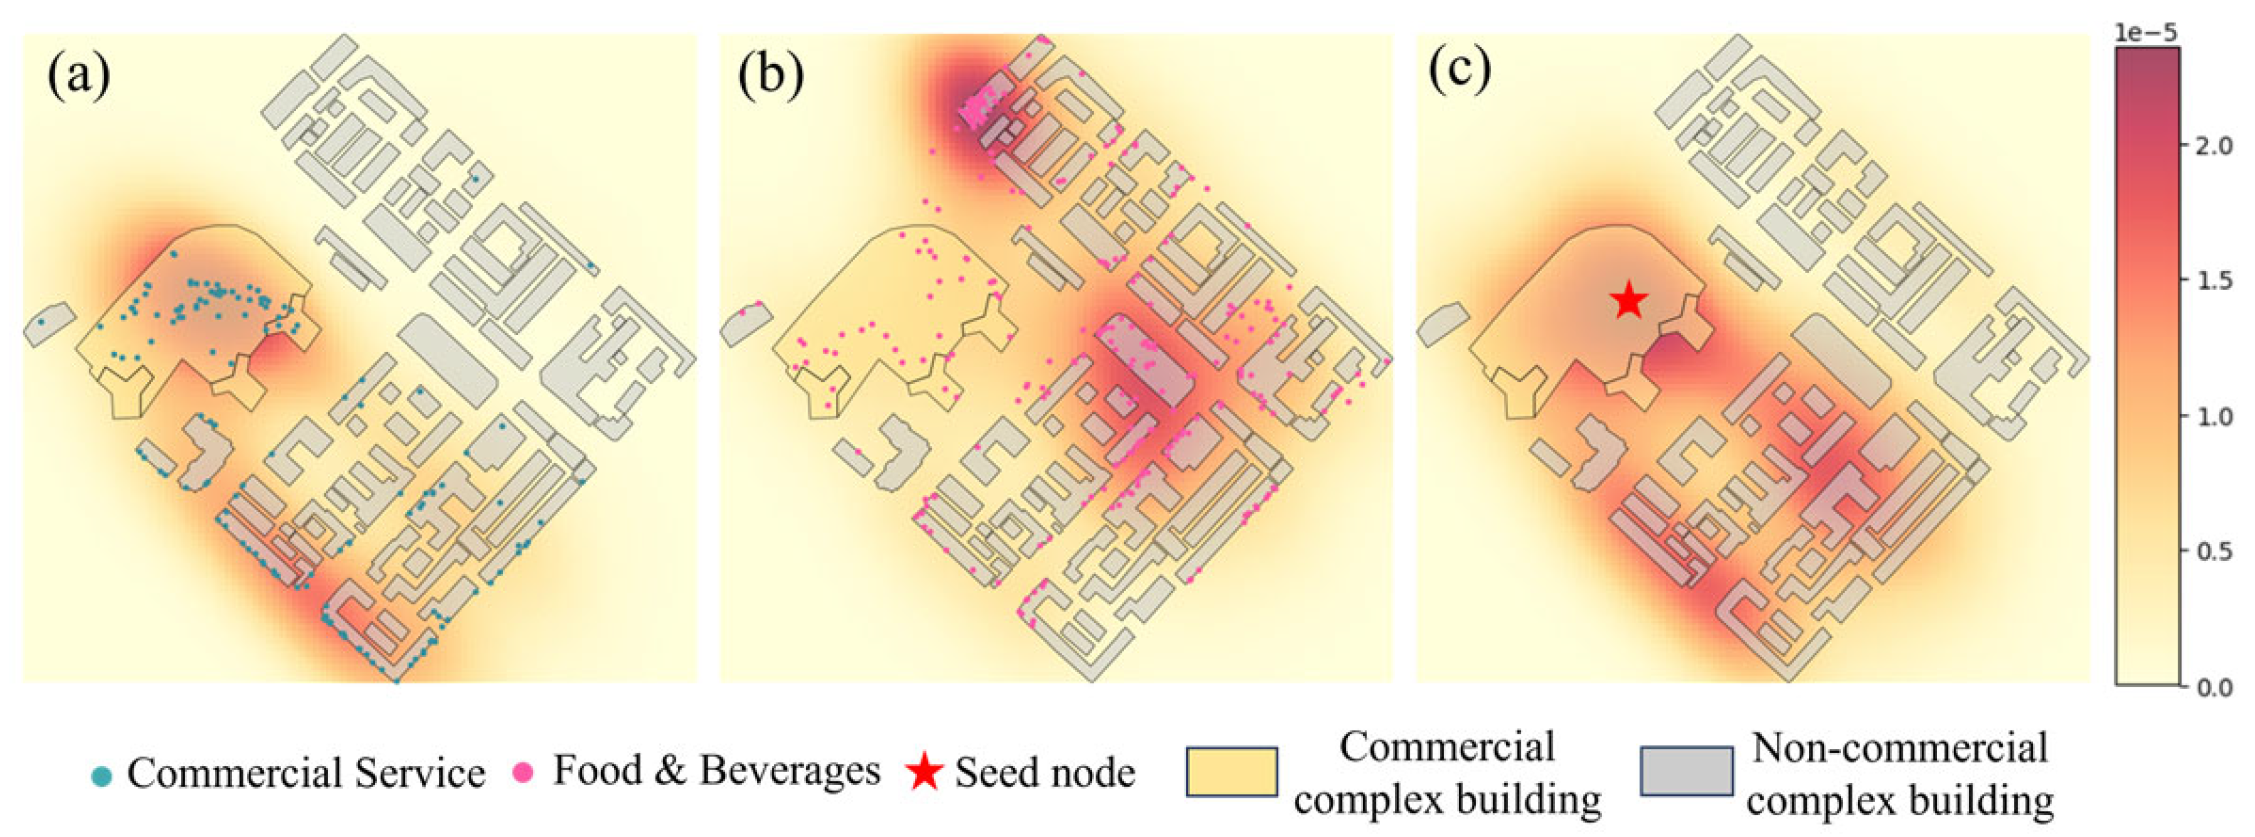
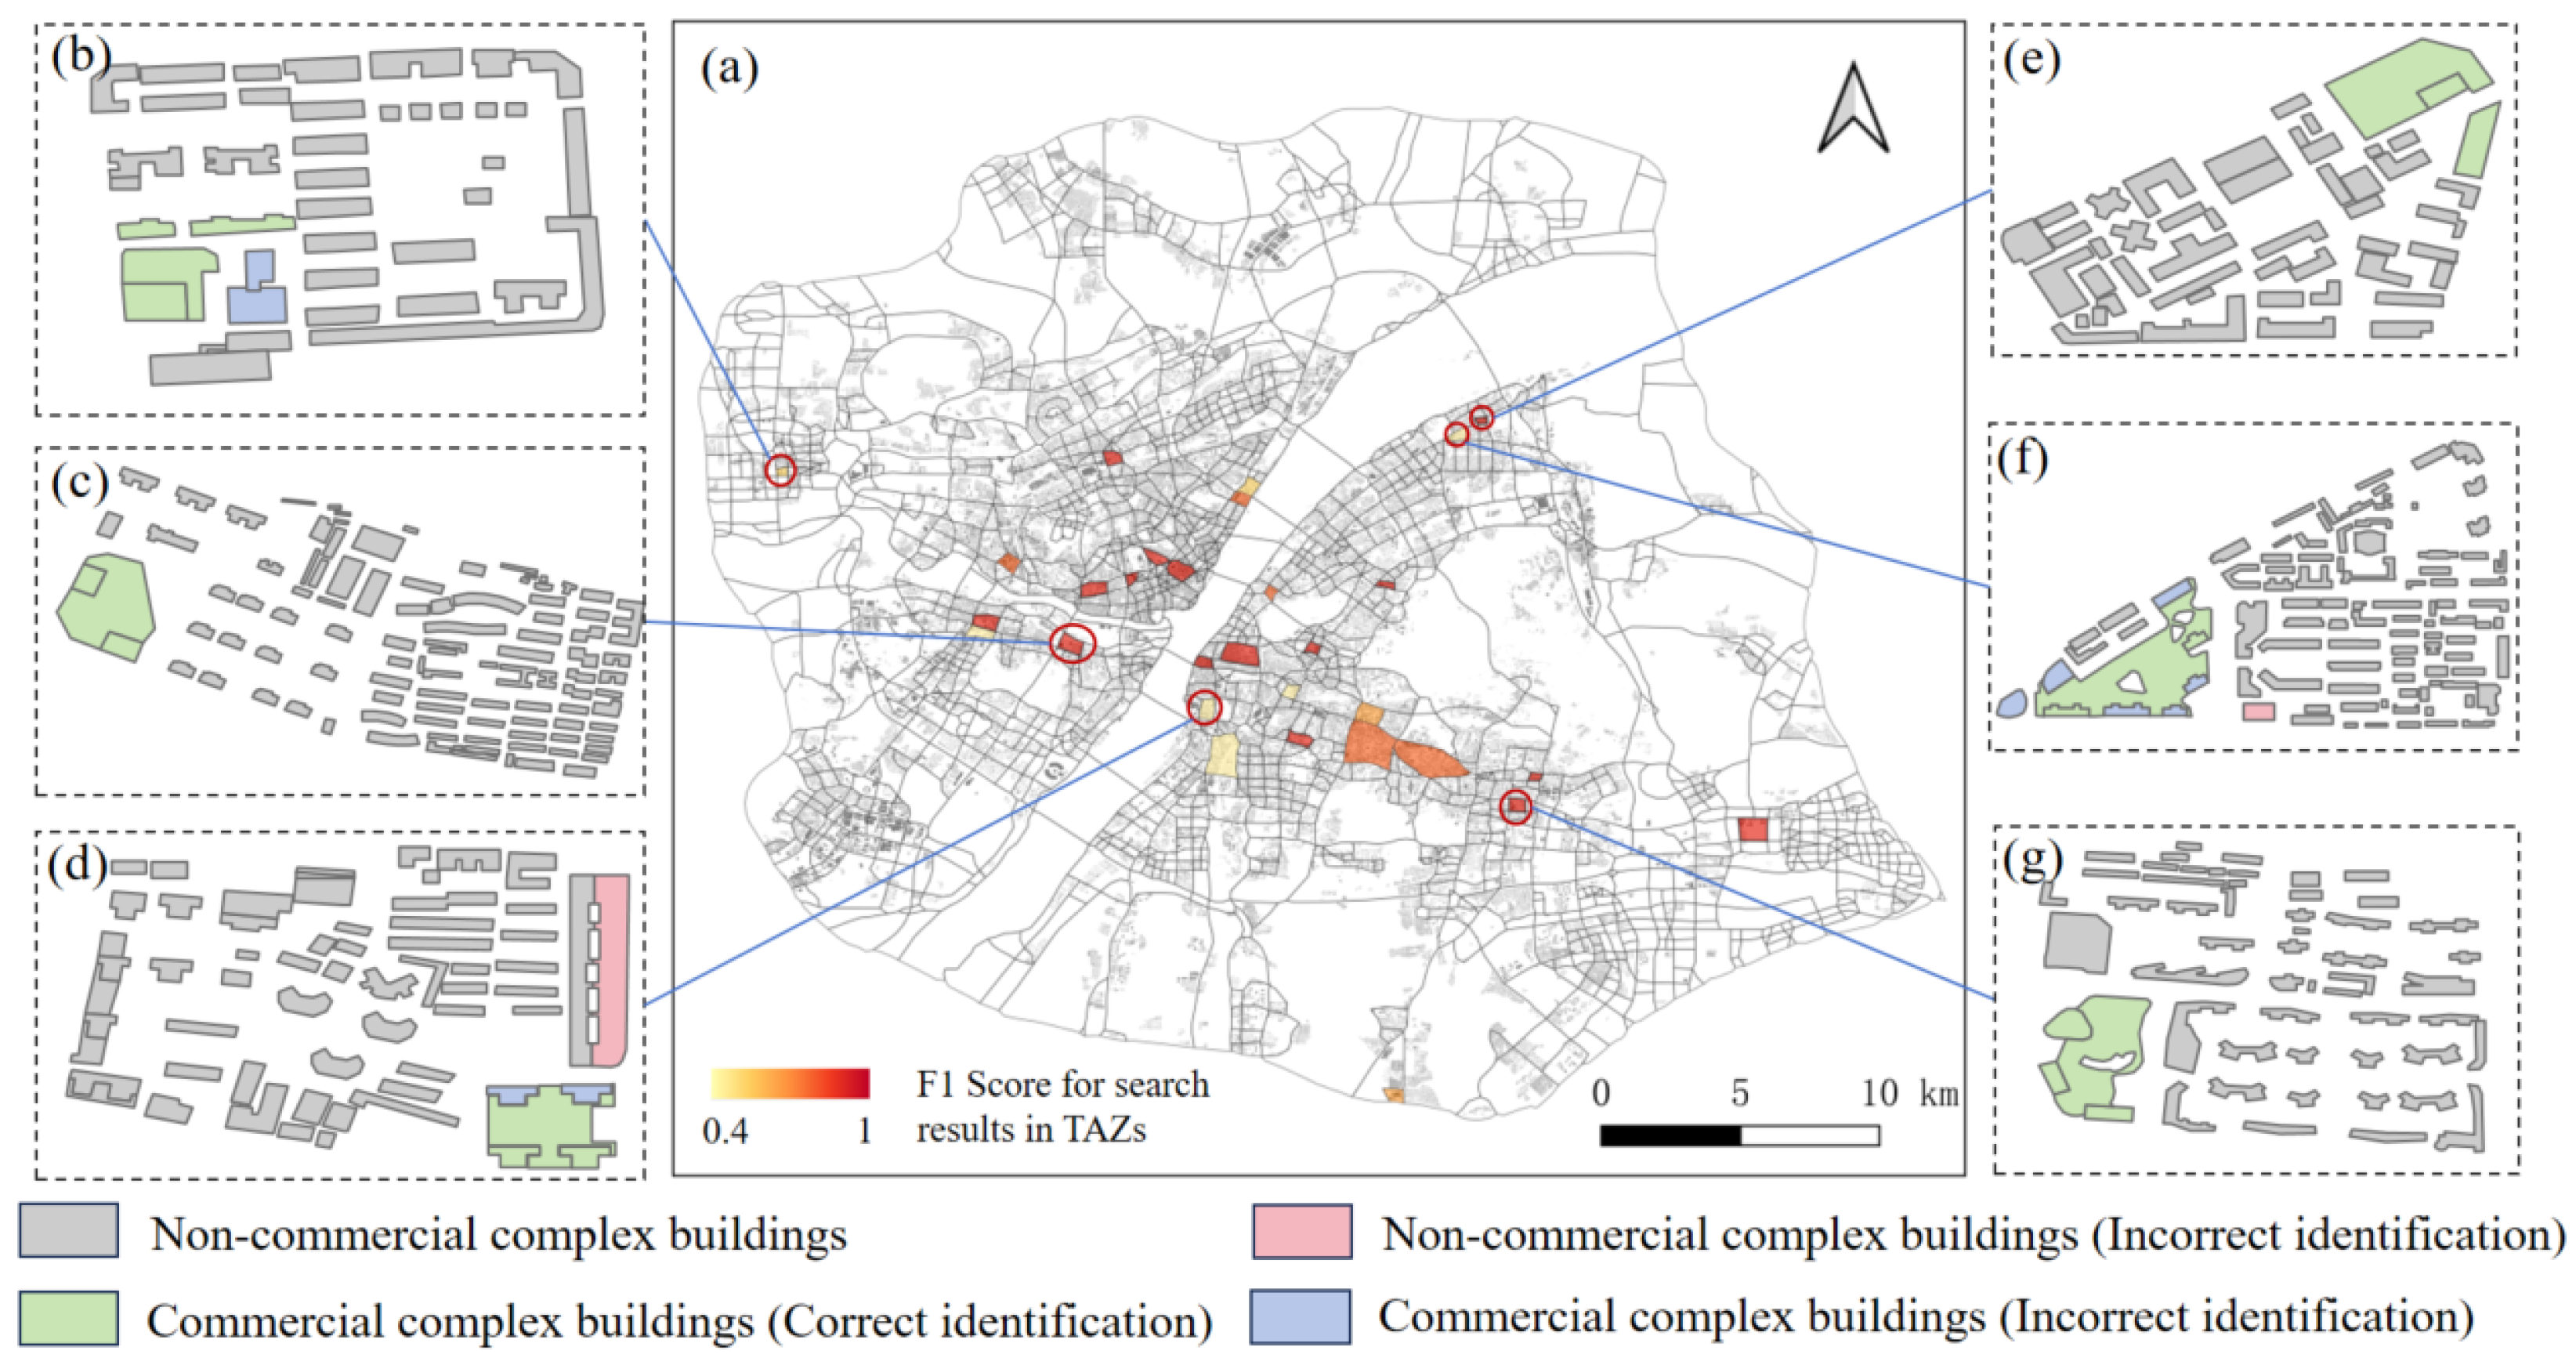
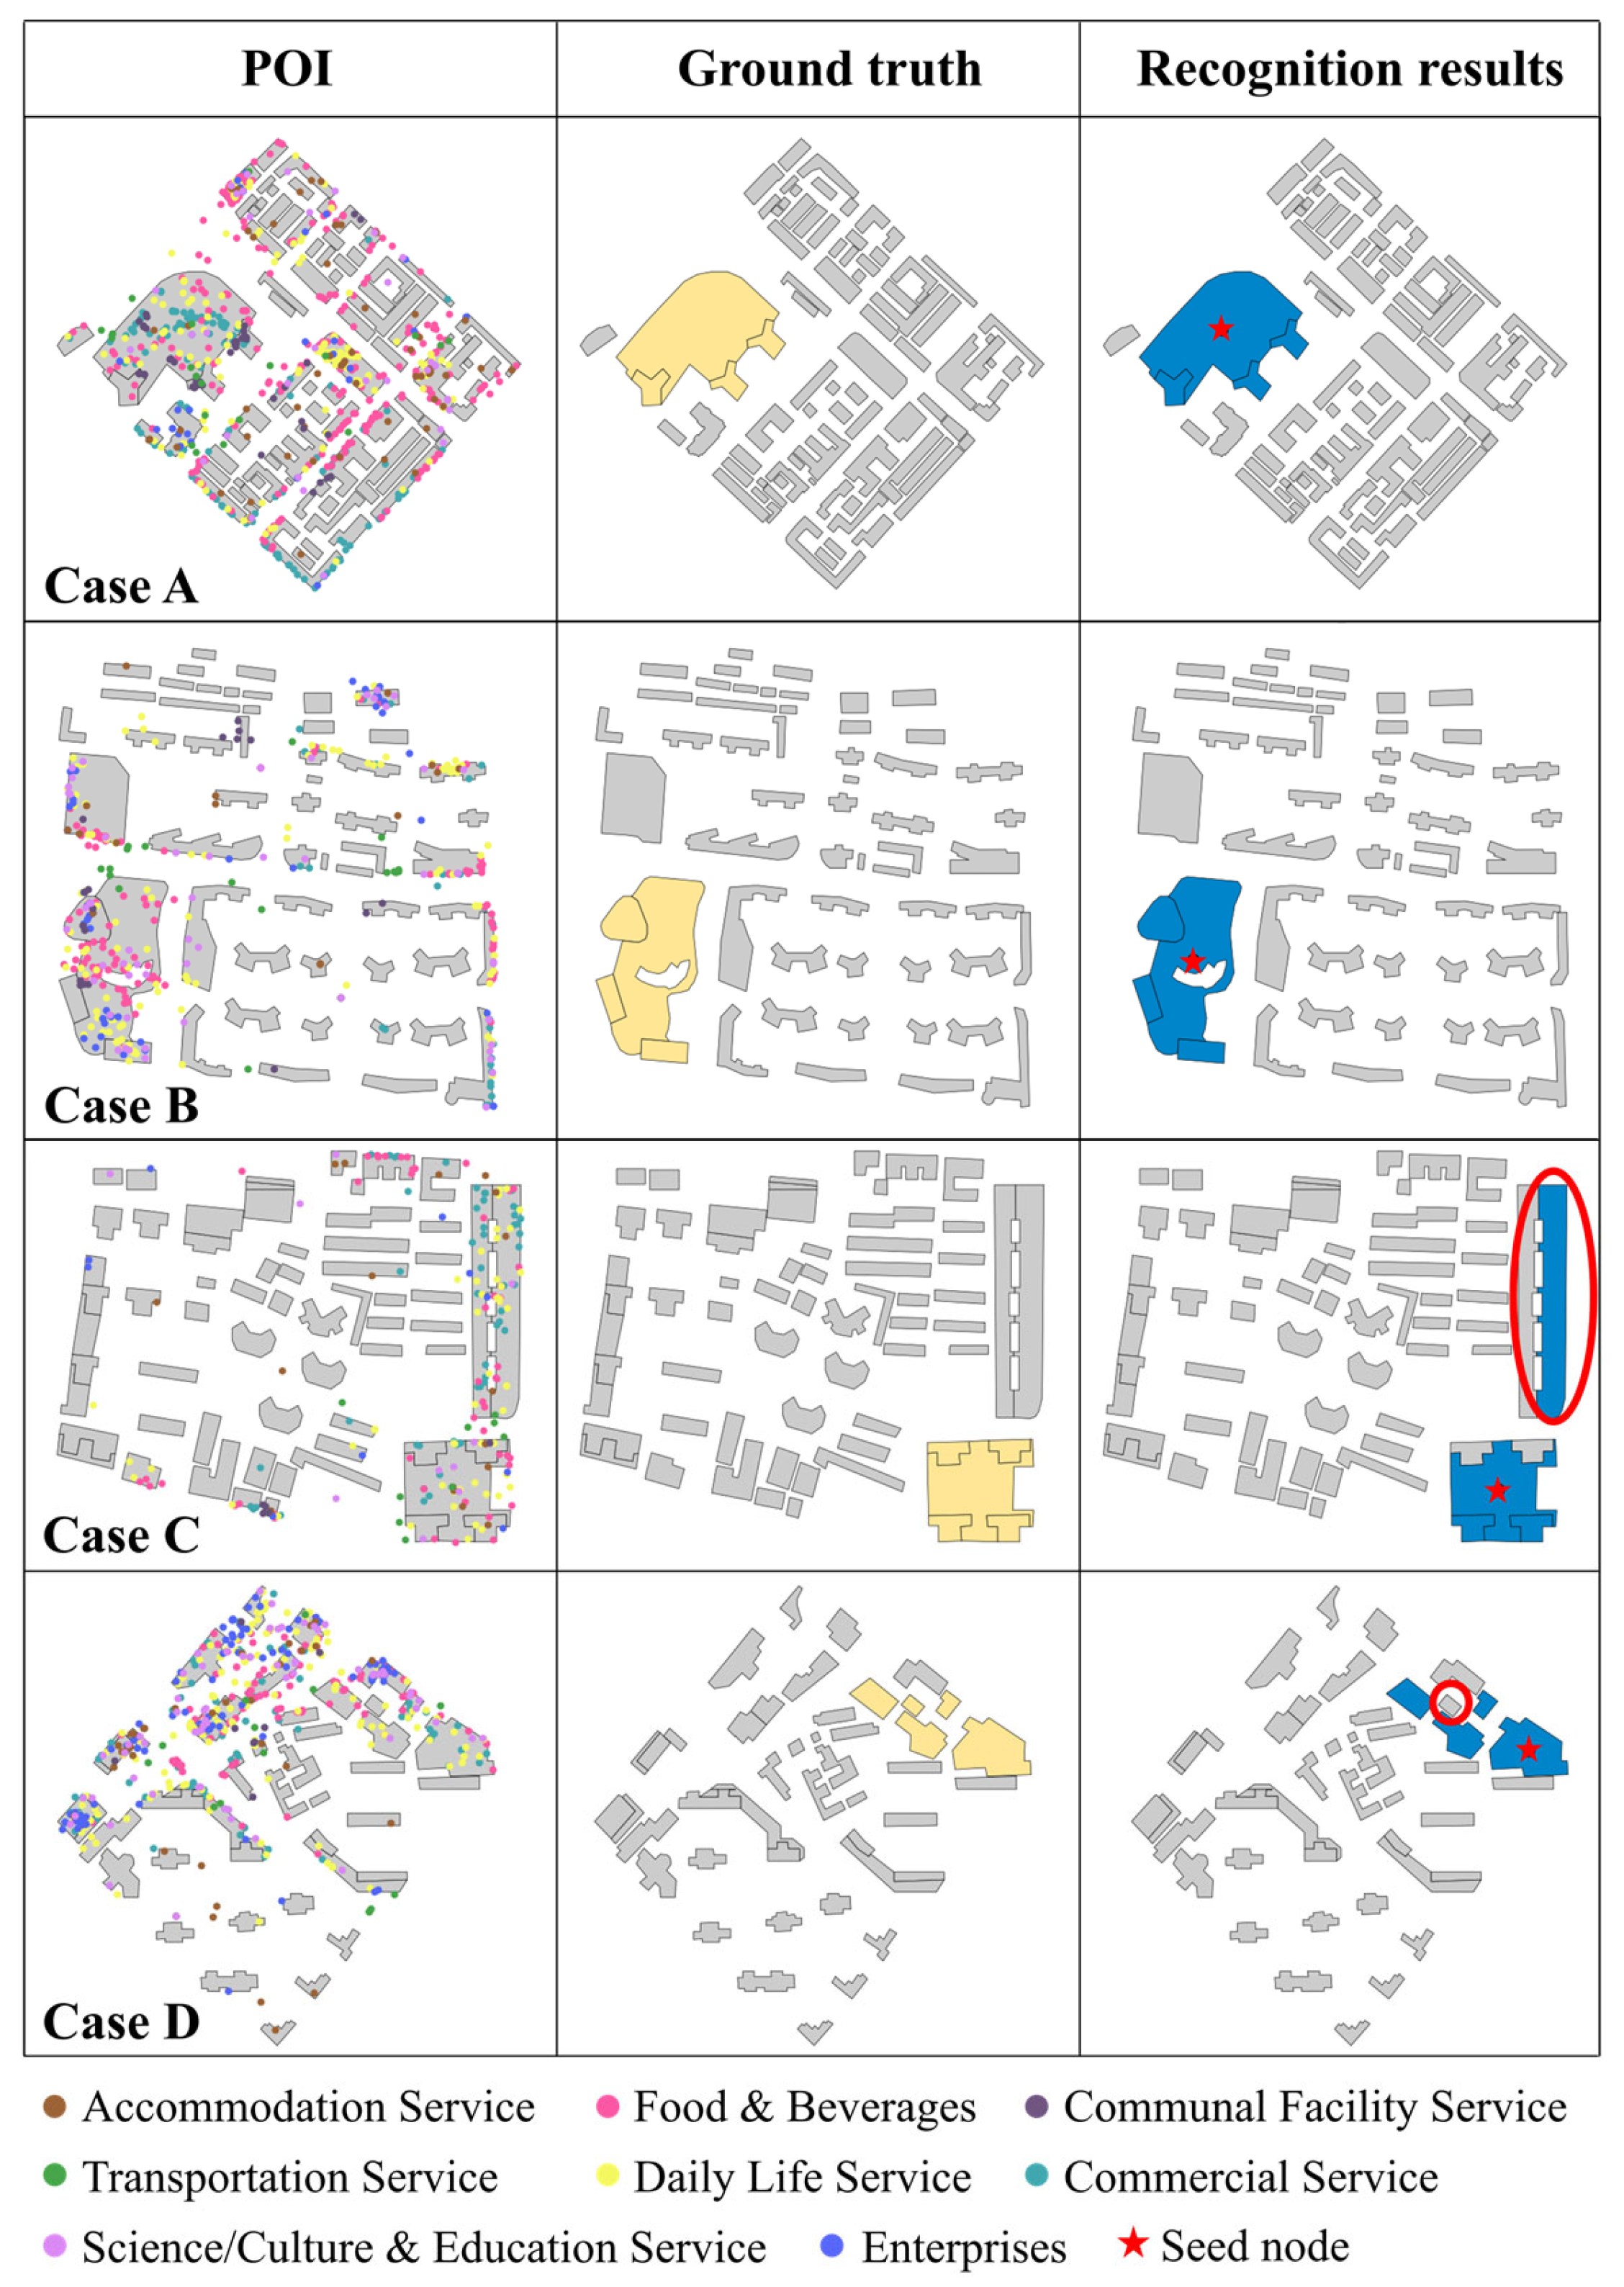
5.3. Results of Commercial Complex Recognition

The experiments were conducted following the settings described in Section 5.2, and the results are illustrated in Figure 10. The proposed method demonstrates satisfactory recognition performance for commercial complexes located both in central urban TAZs and in suburban TAZs, as shown in Figure 10b,d,f. This indicates that the model exhibits strong generalization capabilities across varying spatial distributions and geographic contexts. However, as shown in Figure 10c,e, the recognition performance in certain TAZs remains limited, with instances of both missed and false detections. A possible explanation for this limitation lies in the increased complexity of semantic features and the contextual information associated with commercial buildings in these areas, which makes it challenging for the model to effectively capture their high-level feature representations.
To systematically examine the stability and robustness of the model under varying training data conditions, we trained the model using different proportions of the full training dataset, which consisted of 70 samples. The training sample size was progressively increased from 20% to 100% in increments of 20%. As illustrated in Table 3, the model’s performance exhibits a positive correlation with the number of training samples, demonstrating consistent improvement as the sample size grows. When trained on the full training dataset, the model achieved evaluation scores exceeding 0.73 across all metrics. Moreover, even when trained with only 20% of the training dataset (20 samples), the model attained an F1 score of 0.7048, highlighting its ability to maintain satisfactory performance despite the limited training data.
To gain a deeper understanding of the model’s recognition results and assess the causes of misidentification, we visualized the outcomes for a portion of the testing samples. As shown in Figure 11, in cases A and B, the model’s recognition results are in perfect agreement with the ground truth. Despite the presence of numerous related POIs (i.e., Commercial Services and Food & Beverages) in nearby buildings, the model was able to accurately halt its community expansion, avoiding the incorrect inclusion of these buildings. This suggests that the model also takes into account factors such as building morphology and the spatial distance between buildings in its community search process. In contrast, cases C and D present instances where the model’s recognition results deviate from the ground truth. In case C, over-recognition is observed, with a building (marked by red circles) that contains a significant number of related POIs being wrongly recognized as part of the commercial complex. In reality, the building is residential, with retail stores located on the ground floor, which introduces ambiguity and affects the recognition result. Case D illustrates under-recognition, where certain buildings (marked by red circles) in commercial complexes lacked POIs and exhibited inconspicuous morphological features, resulting in their failure to be recognized by the model.

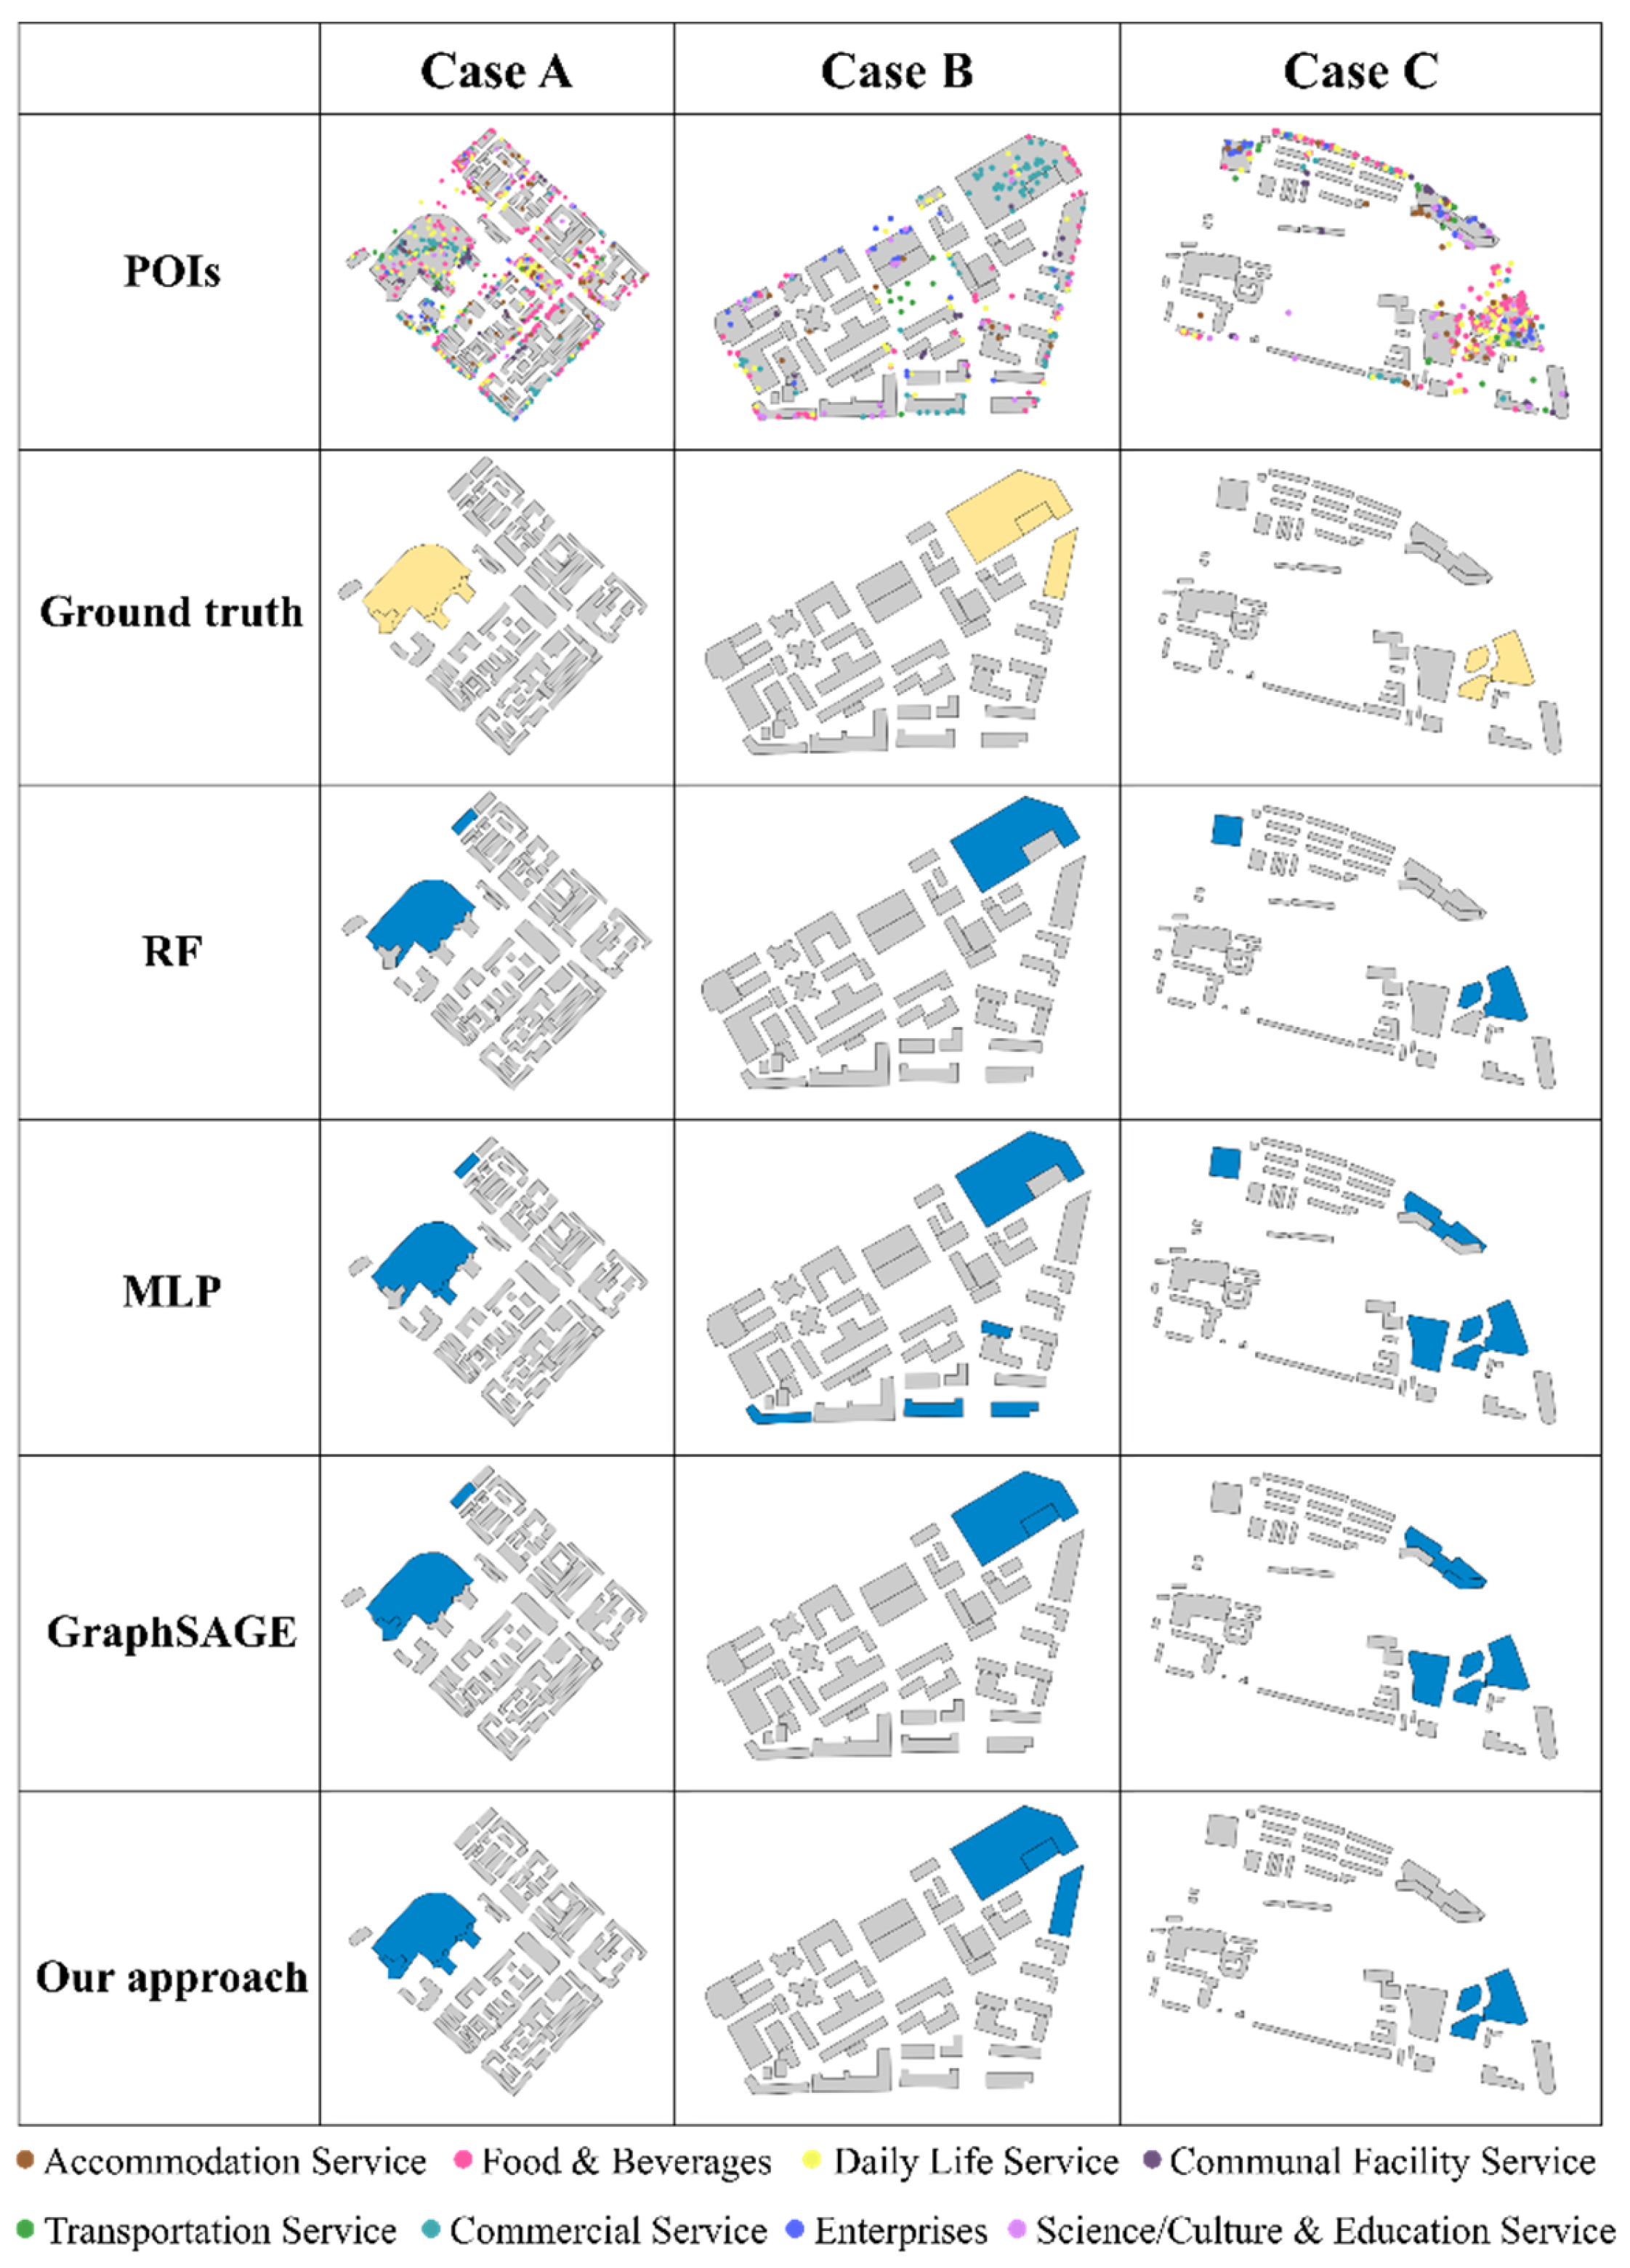
5.4. Comparison of Model Performance

In this section, we compare the performance of our proposed model against three benchmarks. As far as we are aware, no prior research has applied community search methods to the recognition of building group patterns. Therefore, we adopted alternative building group recognition methods as benchmarks, including machine learning methods such as random forest (RF), deep learning models such as feedforward neural network (FNN), and GraphSAmple and aggreGatE (GraphSAGE). For RF and FNN, recognition relied exclusively on a building’s inherent attributes, whereas GraphSAGE incorporated spatial adjacency relationships by leveraging graph-based representations. Moreover, for each benchmark, we conducted systematic hyperparameter tuning to achieve the best model performance.
The comparative evaluation, as detailed in Table 4, reveals our approach’s consistent superiority across all metrics. Notably, it achieves a 5.43% F1 score improvement over the second-best performer, with comparable advantages in NMI (+3.72%) and the Jaccard score (+4.08%). Notably, the 0.7606 Jaccard score signifies a high degree of boundary precision. Furthermore, the experimental results reveal the significant impact of graph-based learning on building group recognition. Specifically, the graph-based benchmark (i.e., GraphSAGE) demonstrated 6–19% performance gains over non-graph methods (i.e., RF and FNN).
Figure 12 provides a comparative analysis of the recognition results in three representative TAZs, further illustrating the performance of our proposed approach against the benchmarks. In all cases, our approach demonstrates superior accuracy, achieving complete consistency with the ground truth. Among the benchmarks, RF and FNN exhibit the weakest performance, likely due to their reliance solely on individual building attributes while neglecting contextual information. Consequently, small buildings that are genuinely part of a commercial complex but lack commercial POIs are often overlooked. Conversely, some buildings that contain commercial POIs but do not belong to a complex are mistakenly classified as part of one.
GraphSAGE mitigates this limitation by integrating spatial adjacency information, leading to notable performance improvements. However, despite achieving the second-best performance, GraphSAGE still exhibits a substantial number of misrecognitions. A key factor contributing to this issue is excessive neighbor influence, where buildings surrounded by buildings with few or irrelevant POIs fail to be recognized as part of a commercial complex. This is particularly evident in cases B and C for GraphSAGE, where several buildings belonging to a commercial complex were incorrectly excluded due to being surrounded by buildings with limited POIs.

5.5. Discussion

This research presents an advanced community search approach that offers a valuable contribution to both building group recognition and the broader domain of GeoAI. The approach is particularly effective in tasks that require extracting semantically meaningful and tightly connected subsets from a larger entity group while concurrently accounting for both spatial proximity and intricate entity attributes. The effectiveness of our approach can be attributed to three key strengths.
First, our approach employs an iterative generation mechanism starting from a seed node, which has proven to be both methodologically sound and practically effective, particularly in cases where entity attributes exhibit high complexity. For example, buildings with abundant POIs but dispersed across the TAZ, making it evident that they do not form a single commercial complex. Nonetheless, conventional methods such as RF and MLP fail to account for this spatial distribution pattern, erroneously grouping these buildings together, as depicted in cases A and C in Figure 12. In contrast, our approach incrementally extends the community from a seed node, thereby ensuring precise boundary delineation and mitigating misrecognition errors.
Second, buildings within commercial complexes often share similar morphological and functional characteristics, including expansive floor areas, low heights, and a high density of related POIs. Even if a particular building lacks these traits, its proximity to such structures strongly implies its inclusion in the complex. This contextual dependency aligns well with GNN models, which effectively capture such relational structures. Additionally, the iGPN in our approach solely updates the embeddings of modified nodes and their immediate neighbors, significantly improving efficiency in large-scale graph processing and ensuring broader applicability to similar tasks.
Third, we continuously evaluate community quality throughout the iterative generation process and determine whether to terminate the search based on its variations in community quality. This strategy ensures that the community remains cohesive and semantically meaningful while preventing unnecessary expansion. Unlike traditional methods that rely on arbitrary thresholds, our adaptive stopping mechanism dynamically determines the optimal point at which the community should cease growing. This not only enhances the accuracy of building group recognition but also minimizes over-expansion errors, which often lead to the inclusion of irrelevant buildings.
Despite the effectiveness of our proposed approach, several limitations should be acknowledged. Firstly, at the data level, POI data may suffer from positional inaccuracies caused by GPS errors, uneven completeness across regions, and temporal inconsistencies due to outdated or infrequently updated records. These issues may influence the accuracy of the socio-economic features. In addition, the current approach does not sufficiently integrate broader contextual information. Incorporating elements such as road networks and hydrological systems could offer valuable insights into the physical segmentation of building groups, potentially enhancing the quality and accuracy of recognition results. Secondly, within the community quality assessment module, we employed a method that averages the embeddings of all nodes within a community to derive the community embedding. While this approach demonstrates a certain degree of rationality and computational efficiency, it may oversimplify the complex relationships and hierarchical structures within the community. Alternative strategies, such as weighted aggregation based on node centrality or the incorporation of attention mechanisms, could potentially yield more nuanced and representative community embeddings. Lastly, while the iterative generation mechanism and adaptive stopping criterion have proven effective, they may still be susceptible to local optima, particularly in highly complex and heterogeneous urban environments. Future work could explore the integration of global optimization techniques or multi-objective optimization frameworks to further enhance the robustness and generalizability of the approach.

6. Conclusions

In this study, we proposed a flow-based community search approach for the recognition of building groups. It integrates both morphological and functional attributes of buildings, along with their spatial interdependencies, by constructing a graph structure using CDT. The approach consists of three interconnected modules—namely, a graph representation learning module, a flow-based community generation module, and a community quality assessment module—ensuring efficient feature computation, iterative community generation, and adaptive termination based on community quality changes. In commercial complex recognition experiments, the proposed approach consistently outperforms the benchmarks, achieving an F1 score improvement of more than 5.4% over the second-best method. Notably, the model maintains high performance even when trained on a limited dataset, further underscoring its robustness. These results affirm the effectiveness and reliability of the approach in recognizing functionally cohesive building groups, with significant implications for urban planning, commercial facility management, and policy-making. Future improvements should focus on addressing spatial heterogeneity and enhancing cross-city adaptability, which could extend the model’s applicability to varied urban environments across different regions.

Author Contributions

Conceptualization, Taiyang Yang, Daozhu Xu, and Min Yang; data curation, Taiyang Yang and Pengxin Zhang; investigation, Taiyang Yang, Pengcheng Liu, and Min Yang; methodology, Taiyang Yang, Pengxin Zhang, and Pengcheng Liu; visualization, Taiyang Yang; software, Taiyang Yang; validation, Pengxin Zhang, Daozhu Xu, Pengcheng Liu, and Min Yang; writing—original draft, Taiyang Yang and Pengxin Zhang; writing—review and editing, Pengxin Zhang and Daozhu Xu; supervision, Daozhu Xu; funding acquisition, Min Yang and Pengcheng Liu; formal analysis, Min Yang. All authors have read and agreed to the published version of the manuscript.

Funding

This work was funded by the Key Laboratory of Smart Earth under Grant number [KF2023ZD04-01] and the National Natural Science Foundation of China under Grant number [42471486].

Data Availability Statement

The data presented in this study are available on request from the authors.

Conflicts of Interest

The authors declare no conflicts of interest.

References

  1. Wei, Z.; Ding, S.; Cheng, L.; Xu, W.; Wang, Y.; Zhang, L. Linear Building Pattern Recognition in Topographical Maps Combining Convex Polygon Decomposition. Geocarto Int. 2022, 37, 11365–11389. [Google Scholar] [CrossRef]
  2. He, X.; Deng, M.; Luo, G. Recognizing Building Group Patterns in Topographic Maps by Integrating Building Functional and Geometric Information. ISPRS Int. J. Geo Inf. 2022, 11, 332. [Google Scholar] [CrossRef]
  3. Zhang, L.; Hao, D.; Dong, C.; Zhen, W. A Spatial Cognition-Based Urban Building Clustering Approach and Its Applications. Int. J. Geogr. Inf. Sci. 2013, 27, 721–740. [Google Scholar] [CrossRef]
  4. Che, W.; Zhuang, W. Integrating Vertical Greenery for Complex Building Patterns towards Sustainable Urban Environment. Sustain. Cities Soc. 2024, 113, 105684. [Google Scholar] [CrossRef]
  5. Gong, X.; Wu, F. A Typification Method for Linear Pattern in Urban Building Generalisation. Geocarto Int. 2018, 33, 189–207. [Google Scholar] [CrossRef]
  6. Li, Z.; Yan, H.; Ai, T.; Chen, J. Automated Building Generalization Based on Urban Morphology and Gestalt Theory. Int. J. Geogr. Inf. Sci. 2004, 18, 513–534. [Google Scholar] [CrossRef]
  7. Mao, B.; Harrie, L.; Ban, Y. Detection and Typification of Linear Structures for Dynamic Visualization of 3D City Models. Comput. Environ. Urban Syst. 2012, 36, 233–244. [Google Scholar] [CrossRef]
  8. Wang, X.; Burghardt, D. A Mesh-Based Typification Method for Building Groups with Grid Patterns. ISPRS Int. J. Geo Inf. 2019, 8, 168. [Google Scholar] [CrossRef]
  9. Sahbaz, K.; Basaraner, M. A Zonal Displacement Approach via Grid Point Weighting in Building Generalization. ISPRS Int. J. Geo Inf. 2021, 10, 105. [Google Scholar] [CrossRef]
  10. Wei, Z.; Xu, W.; Xiao, Y.; Shu, M.; Cheng, L.; Wang, Y.; Liu, C. Enhancing Building Pattern Recognition through Multi-Scale Data and Knowledge Graph: A Case Study of C-Shaped Patterns. Int. J. Digit. Earth 2023, 16, 3860–3881. [Google Scholar] [CrossRef]
  11. Trudelle, C.; Claramunt, C. A Graph-Based Modelling Approach for the Representation and Analysis of Urban Conflicts. Comput. Environ. Urban Syst. 2024, 114, 102201. [Google Scholar] [CrossRef]
  12. Zhang, P.; Yang, M.; Wang, Y.; Yang, T.; Yu, H.; Yan, X. Integrating Metro Passenger Flow Data to Improve the Classification of Urban Functional Regions Using a Heterogeneous Graph Neural Network. Int. J. Digit. Earth 2024, 17, 2443468. [Google Scholar] [CrossRef]
  13. Chen, J.; Xia, Y.; Gao, J. CommunityAF: An Example-Based Community Search Method via Autoregressive Flow. Proc. VLDB Endow. 2023, 16, 2565–2577. [Google Scholar] [CrossRef]
  14. Rainsford, D.; Mackaness, W. Template Matching in Support of Generalisation of Rural Buildings. In Advances in Spatial Data Handling; Richardson, D.E., Van Oosterom, P., Eds.; Springer: Berlin/Heidelberg, Germany, 2002; pp. 137–151. ISBN 978-3-642-62859-7. [Google Scholar]
  15. Xing, R.; Wu, F.; Gong, X.; Du, J.; Liu, C. The template matching approach to combined collinear pattern recognition in building groups. Acta Geod. Cartogr. 2021, 50, 800–811. [Google Scholar] [CrossRef]
  16. Wang, X.; Burghardt, D. Using Stroke and Mesh to Recognize Building Group Patterns. Int. J. Cartogr. 2020, 6, 71–98. [Google Scholar] [CrossRef]
  17. Yu, W.; Zhou, Q.; Zhao, R. A Heuristic Approach to the Generalization of Complex Building Groups in Urban Villages. Geocarto Int. 2021, 36, 155–179. [Google Scholar] [CrossRef]
  18. Zhang, X.; Ai, T.; Stoter, J.; Kraak, M.-J.; Molenaar, M. Building Pattern Recognition in Topographic Data: Examples on Collinear and Curvilinear Alignments. GeoInformatica 2013, 17, 1–33. [Google Scholar] [CrossRef]
  19. Gong, X.; Wu, F. The Graph Theory Approach to Grid Pattern Recognition in Urban Building Groups. Acta Geod. Cartogr. 2014, 43, 960–968. [Google Scholar] [CrossRef]
  20. He, X.; Deng, M.; Luo, G. Recognizing Linear Building Patterns in Topographic Data by Using Two New Indices Based on Delaunay Triangulation. ISPRS Int. J. Geo Inf. 2020, 9, 231. [Google Scholar] [CrossRef]
  21. He, X.; Zhang, X.; Xin, Q. Recognition of Building Group Patterns in Topographic Maps Based on Graph Partitioning and Random Forest. ISPRS J. Photogramm. Remote Sens. 2018, 136, 26–40. [Google Scholar] [CrossRef]
  22. Yan, X.; Ai, T.; Yang, M.; Yin, H. A Graph Convolutional Neural Network for Classification of Building Patterns Using Spatial Vector Data. ISPRS J. Photogramm. Remote Sens. 2019, 150, 259–273. [Google Scholar] [CrossRef]
  23. Bei, W.; Guo, M.; Huang, Y. A Spatial Adaptive Algorithm Framework for Building Pattern Recognition Using Graph Convolutional Networks. Sensors 2019, 19, 5518. [Google Scholar] [CrossRef] [PubMed]
  24. Zhao, R.; Ai, T.; Yu, W.; He, Y.; Shen, Y. Recognition of Building Group Patterns Using Graph Convolutional Network. Cartogr. Geogr. Inf. Sci. 2020, 47, 400–417. [Google Scholar] [CrossRef]
  25. Fang, Y.; Huang, X.; Qin, L.; Zhang, Y.; Zhang, W.; Cheng, R.; Lin, X. A Survey of Community Search over Big Graphs. VLDB J. 2020, 29, 353–392. [Google Scholar] [CrossRef]
  26. Li, R.-H.; Qin, L.; Yu, J.X.; Mao, R. Influential Community Search in Large Networks. Proc. VLDB Endow. 2015, 8, 509–520. [Google Scholar] [CrossRef]
  27. Huang, X.; Cheng, H.; Qin, L.; Tian, W.; Yu, J.X. Querying K-Truss Community in Large and Dynamic Graphs. In Proceedings of the 2014 ACM SIGMOD International Conference on Management of Data, Snowbird, UT, USA, 22–27 June 2014; pp. 1311–1322. [Google Scholar]
  28. Yuan, L.; Qin, L.; Zhang, W.; Chang, L.; Yang, J. Index-Based Densest Clique Percolation Community Search in Networks. IEEE Trans. Knowl. Data Eng. 2018, 30, 922–935. [Google Scholar] [CrossRef]
  29. Fang, Y.; Cheng, R.; Luo, S.; Hu, J. Effective Community Search for Large Attributed Graphs. Proc. VLDB Endow. 2016, 9, 1233–1244. [Google Scholar] [CrossRef]
  30. Huang, X.; Lakshmanan, L.V.S. Attribute-Driven Community Search. Proc. VLDB Endow. 2017, 10, 949–960. [Google Scholar] [CrossRef]
  31. Li, Y.; He, K.; Kloster, K.; Bindel, D.; Hopcroft, J. Local Spectral Clustering for Overlapping Community Detection. ACM Trans. Knowl. Discov. Data 2018, 12, 1–27. [Google Scholar] [CrossRef]
  32. Li, Q.; Ma, H.; Li, Z.; Chang, L. Local Spectral for Multiresolution Community Search in Attributed Graph. In Proceedings of the 2022 IEEE International Conference on Multimedia and Expo (ICME), Taipei, Taiwan, 18–22 July 2022; pp. 1–6. [Google Scholar]
  33. Zhang, Y.; Xiong, Y.; Ye, Y.; Liu, T.; Wang, W.; Zhu, Y.; Yu, P.S. SEAL: Learning Heuristics for Community Detection with Generative Adversarial Networks. In Proceedings of the 26th ACM SIGKDD International Conference on Knowledge Discovery & Data Mining, Virtual, 23–27 August 2020; pp. 1103–1113. [Google Scholar]
  34. Radicchi, F.; Castellano, C.; Cecconi, F.; Loreto, V.; Parisi, D. Defining and Identifying Communities in Networks. Proc. Natl. Acad. Sci. USA 2004, 101, 2658–2663. [Google Scholar] [CrossRef]
  35. Choudhary, S.; Malik, S.; Yadav, R.K. Analyze the Techniques of Community Detection in Social Networks and Their Applications. In Proceedings of the 2024 4th International Conference on Advancement in Electronics & Communication Engineering (AECE), Ghaziabad, India, 22–23 November 2024; pp. 42–47. [Google Scholar]
  36. Paoletti, G.; Gioacchini, L.; Mellia, M.; Vassio, L.; Almeida, J. CoDÆN: Benchmarks and Comparison of Evolutionary Community Detection Algorithms for Dynamic Networks. ACM Trans. Web 2025, 3718988. [Google Scholar] [CrossRef]
  37. Clark, W.A.V.; Rushton, R. Models of Intra Urban Consumer Behavior and Their Implications for Central Place Theory. Econ. Geogr. 1970, 46, 486–497. [Google Scholar] [CrossRef]
  38. Chan, S.H.Y.; Donner, R.V.; Lämmer, S. Urban Road Networks—Spatial Networks with Universal Geometric Features?: A Case Study on Germany’s Largest Cities. Eur. Phys. J. B 2011, 84, 563–577. [Google Scholar] [CrossRef]
  39. Yuan, J.; Zheng, Y.; Xie, X. Discovering Regions of Different Functions in a City Using Human Mobility and POIs. In Proceedings of the 18th ACM SIGKDD International Conference on Knowledge Discovery and Data Mining, Beijing, China, 12–16 August 2012; pp. 186–194. [Google Scholar]
  40. Li, W.; Yan, H.; Lu, X.; Shen, Y. A Heuristic Approach for Resolving Spatial Conflicts of Buildings in Urban Villages. ISPRS Int. J. Geo Inf. 2023, 12, 392. [Google Scholar] [CrossRef]
  41. Bertin, J. Semiology of Graphics: Diagrams, Networks, Maps; University of Wisconsin Press: Madison, WI, USA, 1983. [Google Scholar]
  42. Ai, T.; Zhang, X. The aggregation of urban building clusters based on the skeleton partitioning of gap space. In The European Information Society; Fabrikant, S.I., Wachowicz, M., Eds.; Springer: Berlin/Heidelberg, Germany, 2007; pp. 153–170. [Google Scholar]
  43. Kong, B.; Ai, T.; Zou, X.; Yan, X.; Yang, M. A Graph-Based Neural Network Approach to Integrate Multi-Source Data for Urban Building Function Classification. Comput. Environ. Urban Syst. 2024, 110, 102094. [Google Scholar] [CrossRef]
  44. Zheng, Y.; Zhang, X.; Ou, J.; Liu, X. Identifying Building Function Using Multisource Data: A Case Study of China’s Three Major Urban Agglomerations. Sustain. Cities Soc. 2024, 108, 105498. [Google Scholar] [CrossRef]
  45. Page, L.; Brin, S.; Motwani, R.; Winograd, T. The PageRank Citation Ranking: Bringing Order to the Web; Stanford Infolab: Monterrey, Mexico, 1999. [Google Scholar]
Figure 1. An illustration of the development of methods and their corresponding results in recognizing building groups.
Ijgi 14 00213 g001
Figure 2. An overview of the study area.
Ijgi 14 00213 g002
Figure 3. Experimental data: (a) TAZs divided by road data of level 3 and higher within the study area; (b) manually labeled commercial complex buildings.
Ijgi 14 00213 g003
Figure 4. The framework of the proposed approach.
Ijgi 14 00213 g004
Figure 5. Workflow illustration of the proposed three modules.
Ijgi 14 00213 g005
Figure 6. Illustration of flow-based generation process.
Ijgi 14 00213 g006
Figure 7. The workflow of the community score and its usage in the termination decision.
Ijgi 14 00213 g007
Figure 8. Illustration of the seed node selection method: (a) the KDE of Commercial Service POIs; (b) the KDE of Food & Beverages POIs; (c) seed node selection based on the geometric mean of both.
Ijgi 14 00213 g008
Figure 9. Model performance with different hyperparameters: (a) model performance with different numbers of transformations; (b) model performance with different sliding window sizes.
Ijgi 14 00213 g009
Figure 10. Recognition results of commercial complexes: (a) F1 scores for recognition results in each TAZ on the overall test dataset; (bg) recognition results within individual TAZs.
Ijgi 14 00213 g010
Figure 11. Results of commercial complex recognition in four cases using the proposed approach.
Ijgi 14 00213 g011
Figure 12. A comparison of the recognition results of the benchmarks and our approach in three representative cases.
Ijgi 14 00213 g012
Table 1. POI categories before and after reclassification.
IndexReclassified POI CategoriesFiltered POI CategoriesProportion
1Commercial ServiceShopping, Auto Dealers, Auto Service, Finance & Insurance Services19.58%
2Food & BeveragesFood & Beverages18.63%
3Accommodation ServiceAccommodation Service, Commercial House6.43%
4Communal Facility ServicePublic Facility, Governmental Organization & Social Group, Medical Service, Sports & Recreation8.28%
5Transportation ServiceTransportation Service, Pass Facilities, Road Furniture5.92%
6Daily Life ServiceDaily Life Service20.23%
7Science/Culture & Education ServiceScience/Culture & Education Service9.11%
8EnterprisesEnterprises11.80%
Table 2. Morphological feature metrics of individual building.
VariableMetricsFormulas and Annotations
SizePerimeter
Area
Height
Mean radius 1 N i = 1 N   R i
( R i indicates average distance from the i-th building’s vertexes to its centroid)
OrientationOrientation of the smallest bounding rectangle (SBR)
ShapeElongation L i s b r W i s b r
( L i s b r and W i s b r indicate the length and width of the i-th building’s SBR, respectively)
Circularity 4 π A i P i
( A i and P i indicate the area and perimeter of the i-th building)
Convexity A i A i c h
( A i c h indicates the convex hull area of the i-th building)
Rectangularity A i A i s b r
( A i s b r indicates the area of the i-th building’s SBR)
Equivalent rectangular index (ERI) P i e a r P i
( P i e a r indicates the perimeter of the i-th building’s equal-area rectangle)
Roughness index (RI) R ¯ i 2 A i + P i 2 × 42.6
( R ¯ i indicates the mean radius of the i-th building, and 42.6 is used as the coefficient to scale a circle’s RI to 1)
DensityArea ratio (AR) A i A i V
( A i V indicates the area of the i-th building’s Voronoi-like polygon)
Table 3. Model performance with varying training sample sizes.
MetricProportion of Training Samples
20%40%60%80%100%
F10.70480.78020.80700.81220.8294
NMI0.58050.65340.70960.72400.7356
Jaccard0.61340.70300.72430.74960.7606
Table 4. Experimental performance comparison of the proposed approach and three alternative methods.
ModelF1NMIJaccard
RF0.65160.57320.5690
FNN0.71180.62810.6395
GraphSAGE0.75590.67540.6394
Ours0.82940.73560.7606
Disclaimer/Publisher’s Note: The statements, opinions and data contained in all publications are solely those of the individual author(s) and contributor(s) and not of MDPI and/or the editor(s). MDPI and/or the editor(s) disclaim responsibility for any injury to people or property resulting from any ideas, methods, instructions or products referred to in the content.

