Abstract
This study presents an innovative approach to mitigating the urban heat island (UHI) effect by constructing a cold island spatial pattern (CSP) from the perspective of landscape connectivity, integrating three-dimensional (3D) urban morphology and meteorological factors for the first time. Unlike traditional studies that focus on isolated patches or single-city scales, we propose a hierarchical framework for urban agglomerations, combining morphological spatial pattern analysis (MSPA), landscape connectivity assessment, and circuit theory to a construct CSP at the scale of urban agglomeration. By incorporating wind environment data and 3D building features (e.g., height, density) into the resistance surface, we enhance the accuracy of cooling network identification, revealing 39 cold island sources, 89 cooling corridors, and optimal corridor widths (600 m) in the Changsha–Zhuzhou–Xiangtan urban agglomeration (CZXUA). Ultimately, a three-tiered heat island mitigation framework for urban agglomerations was established based on the CSP. This study offers an innovative perspective on urban climate adaptability planning within the context of contemporary urbanization. Our methodology and findings provide critical insights for future studies to integrate multiscale, multidimensional, and climate-adaptive approaches in urban thermal environment governance, fostering sustainable urbanization under escalating climate challenges.
1. Introduction
Rapid urbanization has significantly altered the composition of the underlying urban surface, with ecological areas such as woodlands and water bodies increasingly being supplanted by construction for housing and transportation [1]. The blue–green space (BGS), primarily comprising woodlands, water bodies, and wetlands, exerts a substantial cooling and humidifying effect [2,3,4]. On the one hand, the expansion of urbanized areas leads to heightened heat generation, and the thermal impact stemming from the metabolic processes of the substantially enlarged population merits consideration. On the other hand, the cooling and humidifying effect of encroached water bodies and vegetation is significantly reduced. Urbanization is leading to decreasing BGS in cities, while the urban heat island (UHI) effect is gradually increasing. Thus, anthropogenic heat emissions and subsurface alterations during urbanization are the primary drivers of the UHI effect [5,6,7]. The UHI effect denotes a condition where temperatures within urban areas exceed those of the surrounding rural regions [8,9,10,11,12]. British scholar Howard was the first to document this phenomenon, noting that temperatures in urban London were markedly [4] higher compared to those in rural areas. Later, in 1958, Manley formally characterized this phenomenon as the “urban heat island effect” [13]. The UHI effect can exert a variety of detrimental effects on both habitat and human health [8,14,15,16]. Therefore, the question of how to alleviate the urban heat island effect has become a significant subject of focus among scholars [17,18,19].
Currently, research on mitigating the UHI effect in urban planning primarily concentrates on the cooling and humidifying effects of BGS at the macroscale [20,21] and numerical simulations utilizing software like ENVI-met at the microscale [22,23]. The latter can effectively optimize green space layout and building configuration and reduce local air temperature at the community scale. However, computational complexity and resolution limit its application at larger scales (e.g., city) [24], though it has a minimal impact on the city-wide amelioration of the UHI effect. A multitude of studies attest to the significant role of urban BGS in mitigating the UHI effect [3,25,26,27,28]. Most of the BGSs in a city are “cold islands” [29,30]. Cold islands lower the temperature in the surrounding area [31]. Nonetheless, constrained by planning policies and other factors, the urban BGS cannot expand indefinitely. Accordingly, it is essential to maximize the cooling potential of existing urban cold islands [32].
However, current research on urban cold islands predominantly concentrates on statistical analyses at the macrolevel or at the simple patch level [33]. By overlooking the connectivity within the spatial configuration of cold islands and the significance of landscape networks, these research findings often struggle to achieve effective practical application. High-density urban development and spatial expansion contribute to the ongoing degradation of the urban thermal environment [34]. Particularly as urban agglomerations evolve, an increasing number of small urban heat islands coalesce into larger expanses, amplifying the UHI effect [35]. In this context, establishing a comprehensive and strategically designed cooling network can markedly diminish the persistent adverse effects of high-intensity urban development. Furthermore, interconnected cold islands possess superior cooling capacities compared to isolated patches [36], which not only enhance the quality of life for urban dwellers but also promote equitable allocation of ecological resources.
In recent years, scholars have begun to use landscape ecology methods such as MSPA and circuit theory to construct urban cold island networks from a landscape ecology perspective to alleviate the UHI effect [4,33,37]. Liu et al. used MSPA to extract high-temperature patches in Zhuzhou and formulated graded conservation measures for UHI patches according to their importance based on landscape connectivity [38]. Qian et al. developed a faceted-linear-point regional cooling network, considering the connectivity and network structure of cold islands in Wuhan [4]. Although previous research has made significant contributions to the construction of cooling networks, several shortcomings remain. Firstly, the cooling network is inevitably affected by wind direction and wind speed; however, none of the existing studies have considered the effect of the wind environment where the cooling network is located. Concurrently, in constructing the resistance surface, the majority of previous studies have focused solely on two-dimensional and natural factors, overlooking the impact of three-dimensional elements and socio-economic factors, such as building height. Secondly, the determination of resistance factor weights in existing studies has predominantly employed subjective methodologies, such as the analytic hierarchy process (AHP) [4,33]. Thirdly, there is a paucity of strategic measures proposed for the targeted integration of key regions into specific spatial contexts within the construction of cold island networks. Furthermore, existing studies predominantly focus on the scale of individual cities and small towns, with less emphasis on urban agglomerations. Unlike isolated cities, urban agglomerations exhibit interconnected heat island networks due to cross-boundary heat exchange (e.g., thermal radiation from transportation corridors, industrial clusters) and scaling effects where localized UHIs merge into regional thermal anomalies. This spatial complexity necessitates mitigation strategies beyond single-city approaches, addressing both intra-city hotspots and inter-city thermal interactions [39]. Therefore, constructing CSPs to mitigate the UHI effect at the urban agglomeration scale is significant for urban climate adaptation planning.
To address the aforementioned shortcomings, this study focused on the Changsha–Zhuzhou–Xiangtan urban agglomeration (CZXUA) as the subject of investigation. Based on assessments of the wind environment of urban agglomerations, we explored a framework for developing a cold island spatial pattern (CSP) within urban agglomerations, comprising cold islands, resistance surface, cooling corridor networks, and critical nodes. A CSP refers to a network framework designed to mitigate the UHI effect. It comprises interconnected cold island sources (large green/blue spaces with significant cooling potential), cooling corridors, cooling nodes (the area where cold air must pass through or frequently flow), and heating nodes (an area where cold airflow is impeded). The CZXUA is among China’s most prominent urban agglomerations [40,41], experiencing frequent episodes of hot weather and heatwaves during the summer months [42]. Hence, there is an imperative to establish a regional cooling network aimed at mitigating the UHI effect. The objectives of this research were to (1) determine the classification of UHI intensity through LST inversion derived from remote sensing imagery; (2) utilize MSPA–circuit theory and additional methodologies to identify and establish a cooling corridor network; and (3) propose a foundational framework for the development of CSPs in urban agglomerations. This study creatively constructs a CSP framework for urban agglomerations that integrates the wind environment and three-dimensional elements and proposes three-level governance strategies to provide systematic methods and practical paths for cross-regional climate adaptation planning.
2. Study Area and Data Sources
2.1. Study Area
The CZXUA, situated in the east-central region of Hunan Province, encompasses three prefecture-level cities, five county-level cities, five county towns, and 165 organic towns [43] covering a total area of 28,087 km2, with geographic coordinates ranging from 26°03′ N to 28°41′ N, and 111°53′ E to 114°15′ E [41] (Figure 1). The CZXUA represents a critical component of the urban agglomerations within the middle reaches of the Yangtze River and serves as the central growth pole for economic development in Hunan Province. In 2022, occupying 13.3% of the province’s land area and housing 25.7% of its population, the CZXUA contributed 41.7% of the total GDP of Hunan Province. The CZXUA is situated in an area characterized by hot summers and cold winters and experiences a subtropical monsoon humid climate, marked by low temperatures and substantial rainfall in spring, high temperatures and intense sunlight in summer, drought conditions with scant rainfall in autumn, and cold, damp winters. Frequent occurrences of extreme heat are observed in summer, with temperatures occasionally exceeding 40 °C. Notably, Changsha is recognized as one of China’s four “furnace” cities [44]. In recent years, the rapid development of the CZXUA has led to expanding urban agglomeration, exacerbating the UHI effect, which significantly impacts the health of urban dwellers and the sustainable development of the urban agglomeration. An immediate construction of a CSP is imperative to alleviate the UHI effect.
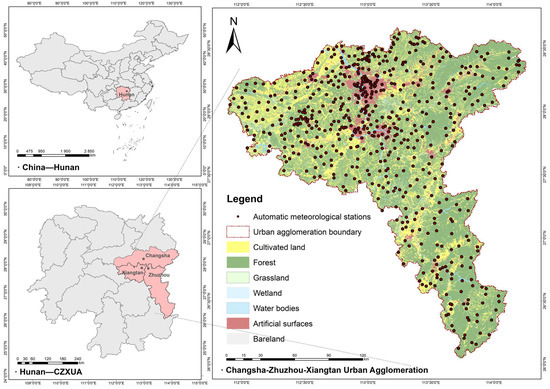
Figure 1.
(a) Location of Hunan Province in China; (b) CZXUA’s location in Hunan Province; (c) geographic location and automatic meteorological station in CZXUA.
2.2. Data Sources
The data utilized in this study primarily consisted of Landsat 8 OLI/TIRS satellite digital products, land use data, meteorological data, administrative district data, road network data, and DEM, among others, with specific data types, resolutions, sources, and applications detailed in Table 1. The projection for all spatial data has been standardized to the equal-area projection of WGS 1984 UTM Zone 49N to ensure the spatial consistency across multi-source data. Raster data of varying resolutions were resampled to a uniform resolution of 30 m × 30 m.

Table 1.
Data sources and uses.
3. Methodology
Based on assessing the wind environment of urban agglomerations, this study introduces a comprehensive framework for the construction of CSP within urban agglomerations: “identification of cold island sources–construction of resistance surfaces–extraction of cooling corridors networks–identification of critical nodes”. The methodologies employed in this research primarily encompass MSPA, landscape connectivity analysis, and circuit theory, among others (See Table 2 for each step’s research methodology and indicator items). The detailed research framework is depicted in Figure 2.
Table 2.
Construction framework of CSP.

Figure 2.
Research framework diagram.
3.1. Retrieval of Land Surface Temperature
At present, remote sensing monitoring has emerged as the predominant method for UHI research, attributed to its facile data acquisition and labor-efficiency. The most extensively utilized approaches for land surface temperature (LST) inversion from remote sensing data include the atmospheric correction method (based on the radiative transfer equation), single-window algorithms, and split-window algorithms. The USGS has implemented updated calibration parameters for Landsat 8. However, due to TIRS11 band uncertainties [37], this study employed the atmospheric correction method. The underlying principle of the atmospheric correction method entails estimating the impact of atmospheric thermal radiation on the surface, subsequently deducting this atmospheric influence from the total thermal radiation detected by satellite sensors to derive the surface thermal radiation intensity, and then converting this to the corresponding surface temperature [50]. The UHI effect is particularly pronounced during periods of hot weather in the summer, hence our selection of Landsat 8 remote sensing data for the study area from July to September, with cloud cover below 10%, for LST inversion. For LST inversion, considering data availability, the remote sensing data from 28 August 2020 was ultimately chosen, utilizing ENVI 5.3 for pre-processing, which encompassed radiometric calibration, atmospheric correction, and image cropping. The procedural steps of the atmospheric correction method comprise image radiometric calibration, estimation of vegetation cover, determination of surface-specific emissivity, calculation of blackbody radiance, and calculation of LST.
(a) Vegetation cover fraction (FVC) calculation:
where FVC is vegetation coverage; NDVIsoli is the NDVI value of areas with no vegetation cover or completely bare soil; and NDVIveg is the NDVI value of areas with complete vegetation cover.
(b) Surface-specific emissivity calculation:
where ε is the surface specific emissivity and FVC is the vegetation cover [51].
ε = 0.004 ∗ FVC + 0.986
(c) Blackbody thermal radiation brightness calculation:
where Lλ is the value of thermal infrared radiation brightness received by the sensor, ε is the surface-specific emissivity, TS is the true LST, B(TS) is the blackbody thermal radiation brightness, and τ is the atmospheric transmittance in the thermal infrared band [52].
Lλ = [ε ∗ B(TS) + (1 − ε) ∗ L↓] ∗ τ + L↑
(d) LST calculation:
where TS is LST; in Landsat 8, K1 = 774.8853 W⋅m−2⋅sr−1⋅μm−1 and K2 = 1321.0789 k.
The derived LST showed high consistency with MODIS LST products, with sensitivity analysis confirming robustness to parameter variations (<0.5 °C error).
3.2. Classification of LST
To elucidate the characteristics of LST spatial distribution with greater clarity and precision and to mitigate the impact of extraneous variables, such as the timing of data acquisition and meteorological conditions, on the estimation of surface temperatures. It is imperative to implement a grading process for the surface temperature estimation results and to ascertain the UHI grade. Currently, UHI grading methodologies are primarily categorized into two approaches. The initial approach is the equidistant division method, characterized by a significant degree of subjectivity in determining division parameters, potentially leading to inaccurate categorization. The second method, which has garnered widespread adoption, is the mean–standard deviation approach, facilitating precise UHI classification through the judicious integration of LST’s mean and standard deviation within the study area [37,53]. Accordingly, this study employed the mean–standard deviation method for grading surface temperatures. It classifies the inverted surface temperatures into seven distinct grades, utilizing ±0.5 sd, ±1.5 sd, and ±2.5 sd as the demarcation points (Table 3).
Table 3.
UHI classification.
3.3. Wind Environment Assessment in CZXUA
The purpose of the wind environment assessment is twofold. The first is to clarify the spatial distribution of wind speed and provide a natural driving force basis for the layout of the cold channel network. The second is to correct the resistance surface of the cold island due to it: adjust the resistance value through the wind field data to ensure that the cooling corridor direction is synergized with the ventilation potential to enhance the cooling efficiency.
According to the meteorological bureaux of Changsha, Zhuzhou, and Xiangtan, there are 611 meteorological automatic stations within the CZXUA. Of these, 293 are in Changsha, 192 are in Zhuzhou, and 131 are in Xiangtan (Figure 1). Automatic meteorological stations record wind speed and direction data on a daily, monthly, and yearly basis. Missing data stations and anomalous data values were excluded. Based on the perennial dominant wind direction of the urban agglomeration, we weighted the wind direction of each station by the annual average wind speed. Subsequently, the ventilation potential at each station location was determined. Kriging interpolation was employed to extrapolate data from known sites to unknown locations within the same region, thereby assessing the wind environment in the study area. The selection of the kriging interpolation method was mainly based on its adaptive advantages. The kriging method quantifies spatial autocorrelation through the semi-variance function, which more accurately reflects the spatial distribution law of the wind field than deterministic methods such as inverse distance weighting [54] and also provides an interpolation error surface (kriging variance), which identifies the reliability of the sparse region of the data.
Here, Z(s0) is the predicted value at s0; Z(si) is the measured value at the ith position; λi is the unknown weight of the estimated value at the ith position; s0 is the predicted position; and N is the number of measurement sample points [54].
3.4. Cold Island Network Construction
3.4.1. Identification of Heat and Cold Island Sources
(1) MSPA
MSPA refers to the discrimination and identification of habitat patches within the study area that are crucial for landscape connectivity [55], highlighting the structural connectivity of the landscape. It categorizes the necessary image elements as foreground data based on spatial topological relationships, whereas the remaining image elements serve as background data. Subsequently, the foreground data are classified into seven distinct landscape types utilizing image processing techniques (Table A2) [56]. MSPA is predominantly employed in landscape ecology research, focusing primarily on the identification of ecological sources [57,58]. In the present study, MSPA was utilized to delineate urban cold island (and heat island) areas [4,37,59]. The lower-temperature zone, low-temperature zone, and sub-low-temperature zone were designated as foreground data with an assigned value of 2, while other regions were classified as background data with a value of 1 (the converse applied for identifying heat island areas). Employing Guidos, seven spatial elements from the cold island (heat island) map were extracted. The cooling efficacy of an urban cold island is directly proportional to the area of the cold island [33], yet scholars have not established a definitive threshold for its size. Accordingly, this study referenced prior research [4] and considered the specific context of the study area to select cold and hot island patches with a core area exceeding 1 km2 for subsequent landscape connectivity analysis.
(2) Landscape connectivity analysis
The cooling efficacy of urban cold islands is not only correlated with the area’s size but also directly proportional to the islands’ landscape connectivity [59]. Conefor 2.6 was utilized to assess the landscape connectivity. Upon comparison, optimal connectivity between patches was achieved when the distance threshold for connectivity was established at 10,000 m, with the connectivity probability threshold set at 0.5. Calculations were conducted for the index of possible connectivity (PC) and the index of connectivity importance (ICC) for each core area. The formulae for these calculations are as follows:
dPC = (PC − PCremove)/PC × 100%
3.4.2. Construction of Resistance Surface
The cold island resistance surface reflects the difficulties faced by cold air in the process of landscape dispersion [61]. Impediments to cold air circulation within urban environments can be broadly classified into two categories: natural and socio-economic factors. Natural factors encompass DEM [33] and NDVI [62]. NDVI was selected primarily for its capacity to mitigate the impacts of radiative variations due to atmospheric conditions, including solar altitude, satellite viewing angles, topography, and cloud cover [62]. Socio-economic factors primarily comprise land use types [63], road densities [4], and other relevant variables. It is not difficult to find that current resistance factors are predominantly two-dimensional, neglecting the impact of three-dimensional elements [64]. Furthermore, the obstruction of urban airflow by dense high-rise structures in metropolitan areas merits consideration. Regions of heightened building density frequently serve as concentrated heat sources, thereby impeding the movement of cold air [59]. In addition, we used the MSPA type as an influence factor on the cold island resistance surface, as it accurately delineates the functional zones of the cold island (e.g., core, bridge, and loop) through the spatial topological relationship and quantifies the differential influence of the different zones on the cold air dispersion [59]. Based on the preceding analysis, we identified seven critical factors for constructing the resistance surface: land use types, MSPA types, DEM, NDVI, road densities, building densities, and building heights (Table 4). Spatial principal component analysis (SPCA) was employed to ascertain the weights of resistance factors. This approach mitigates the subjectivity inherent in prior weight assignment methodologies, such as the analytic hierarchy process (AHP) [4,33]. The SPCA calculation formula is as follows:
Table 4.
Resistance surface factors.
is the original factor value; is the mean; and is the standard deviation.
PCk is the kth principal component score; wki is the loading of the ith resistance factor in the kth principal component; and Fi is the normalized ith resistance factor value.
Wi is the final weight of the ith factor.
R is the integrated resistance surface before correction.
Existing studies have overlooked the impact of the wind environment. Consequently, this study corrected the resistance surface based on the ventilation potential:
where R, is the corrected resistance surface; R is the resistance surface before correction; Si is the ventilation potential of grid i; and Sa is the average ventilation potential of CZXUA.
3.4.3. Construction of Cold Island Spatial Pattern (CSP)
Circuit theory, a concept originating from physics, was initially introduced by the American scholar McRae for ecological studies and initially employed to forecast species inheritance [59]. It subsequently evolved to examine the random walk attributes of wildlife, utilizing the analogy of electrons’ random traversal within circuits to simulate species migration and dispersal processes. Consequently, circuit theory can be applied to pinpoint critical nodes within potential cooling corridor networks by modeling random flow dynamics [4,37,59]. Regions with higher current values are considered important cold and hot spaces (cooling nodes, heating nodes).
Linkage Mapper, utilizing CircuitScape and ArcGIS as its foundation, serves as the principal instrument for applying circuit theory. It is recognized for its efficiency, convenience, authenticity, and precision, hence its widespread adoption in recent years for studies pertaining to network construction [65,66]. The Linkage Mapper toolkit comprises Centrality Mapper, Pinchpoint Mapper, Barrier Mapper, and Linkage Priority Mapper. Centrality Mapper and Linkage Priority Mapper assess the aggregate current flow for each source and corridor junction. The greater the current centrality, the more pivotal the source and corridor are for the overall network connectivity. Empirical research [67,68] has validated the efficacy and accuracy of Centrality Mapper and Linkage Priority Mapper in grading the significance of sources and corridors. Pinchpoint Mapper is primarily utilized for the identification of ecological pinch points, which denote locations that are obligatory for organism migration. In circuit theory modeling, ecological pinch points are areas in ecological corridors with higher current density, representing a higher likelihood of passage at that location [69]. In the cooling corridor network, it is the area where cold air must pass through or frequently flow. These corridors’ key nodes, subject to concentrated airflow, can notably reduce the surrounding temperature such that we can define them as cooling nodes. Barrier Mapper is predominantly employed for the detection of ecological barrier points, which are regions that impede movement and communication among organisms, and their removal can enhance the connectivity between ecological sources [70]. Within the cooling corridors network, a heating node is an area where cold airflow is impeded. For example, a dense area of high-rise buildings or topographical barriers (e.g., mountain gaps) can significantly impede the flow of cold air (high-resistance areas), leading to localized heat buildup. Therefore, it can be defined as a heating node. The cold island sources, cooling corridors, cooling nodes, and heating nodes together constitute the CSP.
4. Results
4.1. UHI Classification
The LST inversion was conducted utilizing the atmospheric correction method. The analysis revealed that the LST of the CZXUA spanned from 8.73 to 53.54 °C. The inversion outcomes were subsequently employed to categorize the UHI effect, employing the mean-standard deviation approach. As depicted in Figure 3, the higher-temperature zones are predominantly situated within the central urban regions of Changsha, Zhuzhou, and Xiangtan, as well as within the core urban areas of Ningxiang, Liuyang, and Liling. The high-temperature and sub-high-temperature zones are primarily located in the periphery of the urban centers or in the BGS near the inner part of the urban centers. Moreover, there are also high-temperature zones (sub-high-temperature and higher-temperature zones) in the form of a “mesh.” This phenomenon is primarily attributed to the substantial thermal emissions from major regional traffic artery, including highways.
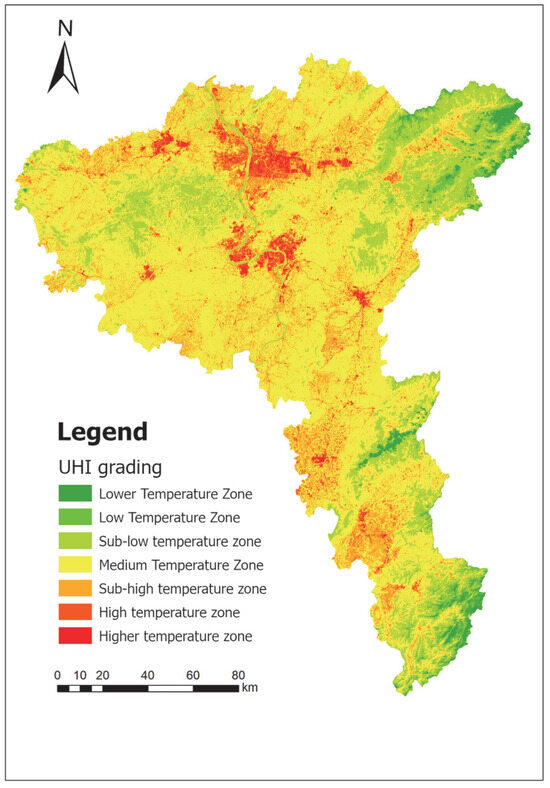
Figure 3.
UHI classification.
4.2. Assessment of the Wind Environment in CZXUA
Kriging interpolation was utilized to disseminate the data from 611 points across the study area. This ultimately yielded an assessment map depicting the CZXUA’s ventilation potential (Figure 4). Areas characterized by high ventilation potential are primarily concentrated within the eastern portion of the CZXUA, with a preponderance of these areas located at higher elevations, such as mountain ranges. Conversely, areas exhibiting low ventilation potential are predominantly situated in the low-hill regions of the central part of the CZXUA.

Figure 4.
Ventilation potential in CZXUA.
4.3. Construction of CSP
4.3.1. Construction of Cold Island Sources
Based on LST, MSPA and landscape connectivity analysis were conducted, resulting in the identification of 39 cold island sources, as depicted in Figure 5c. The cold island sources exhibit a broad spatial scale, ranging from 1 km2 to 2019 km2 in individual area, with a total aggregated coverage of 4356.73 km2—representing 15.5% of the entire study region (see Table A3 for spatial distributions and area breakdowns). In terms of spatial distribution, the cold island sources are predominantly located in the eastern sector of Changsha, the central and southern regions, the southeastern area of Zhuzhou, and the northern region of Xiangtan (such as Jiuling Mountain Range and Lianyun Mountain Range). They are located away from urban built-up areas, exhibiting a distribution pattern of “peripheral concentration and core deficiency.” Most cold island sources are woodlands and mountain ranges, which overlap significantly with the large BGS of the CZXUA.
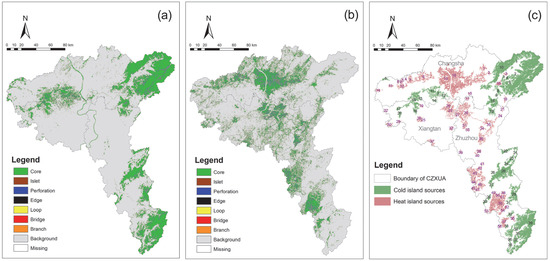
Figure 5.
(a) Urban cold island patch types. (b) Urban heat island patch types. (c) Urban cold island and UHI sources.
A total of 58 heat island sources were identified (Figure 5c). Regarding area, the heat island sources span an area ranging from 5.15 to 562.03 km2. With respect to spatial distribution, the heat island sources exhibit uniform distribution across the CZXUA region, predominantly within urban and rural construction land, with a particular concentration in the metropolitan areas of Changsha, Zhuzhou, and Xiangtan. It exhibits a spatial distribution characterized by a “core cluster and network-like diffusion” pattern. This pattern suggests a pronounced UHI effect within the CZXUA.
The spatial distribution of cold and heat sources shows significant opposition, with the minimum boundary distance between them being just 300 m (e.g., between cold source 11 and heat source 13), highlighting the risk of urban expansion eroding natural cold sources.
4.3.2. Cold Island Resistance Surface
The magnitude of the resistance value quantifies the degree to which cold air circulation is facilitated or hindered within a given area, with lower values indicating preferential pathways for airflow and higher values reflecting thermal or structural barriers. Following the reclassification and valuation of the seven resistance factors, the cold island resistance surface was generated utilizing SPCA (individual resistance factor diagrams are shown in Figure A1, Figure A2, Figure A3, Figure A4, Figure A5, Figure A6 and Figure A7). Percentage and cumulative eigenvalues of the SPCA results (Table A4) show that the cumulative variance contribution rate of the first three principal components reached 96.76%, indicating that these components encompass most of the spatial variability information from the original data. Therefore, we selected the first three principal components to construct the resistance surface and reduce redundancy while retaining key spatial characteristics. Finally, the ventilation potential data were used to correct the resistance surface (Figure 6). The resistance values span a range from 27.72 to 128.92. Regarding spatial distribution, regions exhibiting higher resistance values are predominantly located within urban and rural construction land, whereas the cold island sources exhibit lower resistance values.
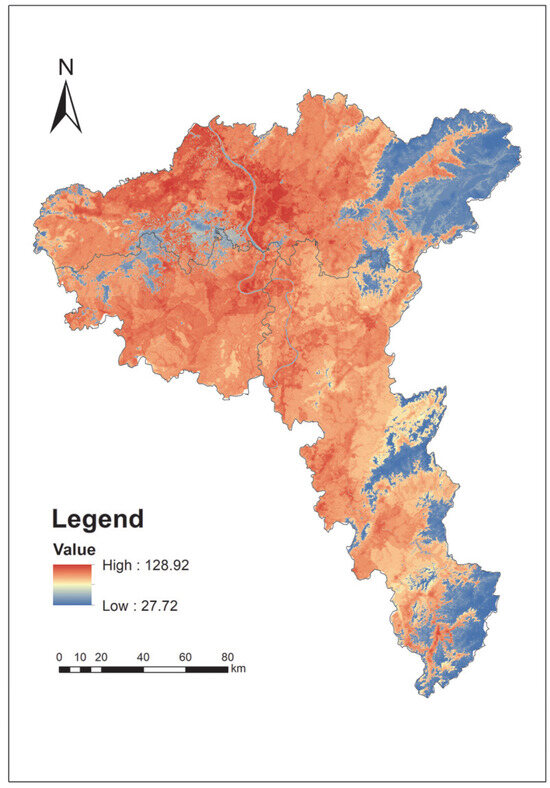
Figure 6.
Cold island resistance surface construction.
4.3.3. Result of Cooling Corridor Identification
Based on the cold island sources and the resistance surface, 89 cooling corridors were delineated employing circuit theory and Linkage Mapper (Figure 7). The lengths of the cooling corridors extend from 72 to 188,316 m, exhibiting uniform distribution across the central and southern regions of Changsha and throughout Zhuzhou and Xiangtan. As indicated by the wind rose charts for Changsha, Zhuzhou, and Xiangtan, the prevailing wind direction within the CZXUA is from the northwest. A majority of the identified cooling corridors align parallel to the prevailing wind direction, thereby substantiating the precision of the identification process. This not only aids in mitigating the UHI effect but also enhances urban ventilation.
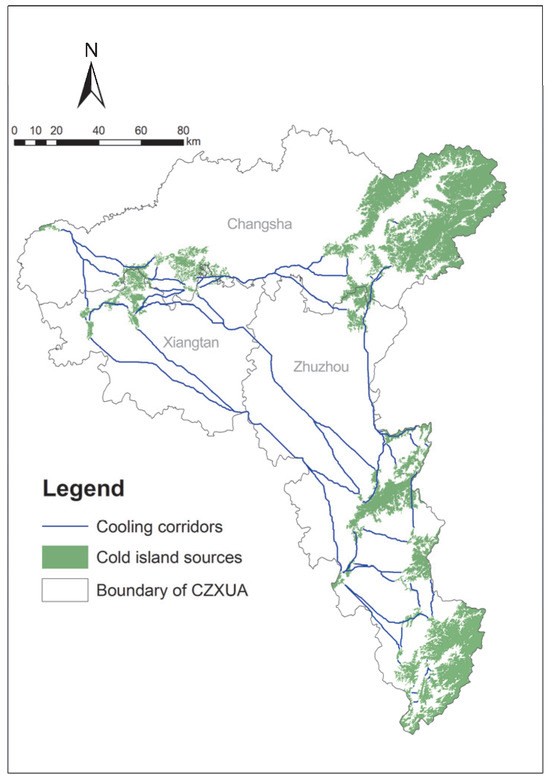
Figure 7.
Cold island network construction.
4.3.4. Cooling and Heating Node Identification
Employing Pinchpoint Mapper, a total of 42 cooling nodes were identified. These nodes span an area from 1.52 to 605.48 hectares, encompassing a collective area of 34.62 km2 (Figure 8a). Cooling nodes are mostly distributed on the outskirts of cities or in large ecological spaces inside, such as the water bodies along the Xiangjiang River, Zhaoshan Scenic Area. These nodes form local cold sources through transpiration and surface radiation cooling effects, and are spatially distributed in a “patchy discrete” pattern. Barrier Mapper was utilized to identify heating nodes. A total of 63 heating nodes were discerned, spanning areas from 10.35 to 6028.42 hectares and aggregating to a total area of 314.7 km2 (Figure 8b). Heating nodes are mainly concentrated in urban core areas, especially high-density built-up areas, transportation hubs and industrial clusters. Such areas have a high rate of surface hardening, significant anthropogenic heat emissions, forming a contiguous heat island effect area, and the spatial distribution is characterized by “multi-core agglomeration.”
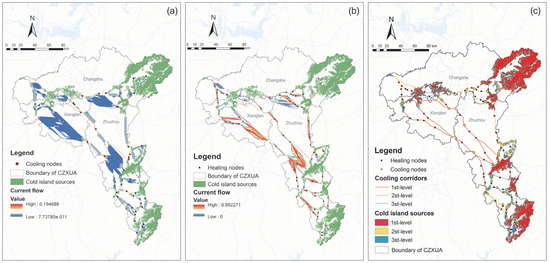
Figure 8.
(a) Identification of cooling nodes. (b) Identification of heating nodes. (c) Construction of the CSP4.4 cooling range of the network.
Subsequently, we employed Centrality Mapper and Linkage Priority Mapper to categorize the cold island sources and cooling corridors, respectively. The CSP of the CZXUA was jointly constructed (Figure 8c). The CSP was stratified into three levels utilizing the natural breakpoint classification method. A total of six first-level corridors were discerned, amassing a cumulative length of 902.2 km; fifteen second-level corridors, aggregating to a total length of 845.3 km; and sixty-eight third-level corridors, summing to a total length of 479.6 km. A total of ten first-level cold sources, encompassing a collective area of 3912.4 km2; fourteen secondary cold island sources, aggregating to a total area of 296.5 km2; and thirteen tertiary cold island sources, encompassing a collective area of 147.82 km2. The primary corridor runs through the study area in a southeast–northwest direction, parallel to the dominant wind direction. The secondary corridor is branched to the middle of the urban area, covering the transition area. The tertiary corridors are intensively embedded in urban built-up areas, especially in high-density heat island areas (such as the core area of the main city).
The LST of cooling corridors varies significantly across different widths. To analyze the heat dissipation efficiency of the cooling network, it is essential to delineate the thermal boundaries of corridors and rationally plan width thresholds to maximize their cooling effectiveness. In this study, we established 20 buffer zones centered on the corridors, with buffer distances ranging from 10 to 1000 m. We analyzed the cooling effects of corridors within different width thresholds and compiled LST data for ecological corridors under varying widths (Table A4).
Using average LST as the dependent variable and corridor width as the independent variable, curve estimation was performed to identify the best-fitting function. Results showed that quadratic and cubic functions achieved superior model fit (R2 = 0.939 and 0.962, respectively) (Table 5). Based on the polynomial functions illustrated in Figure 9 and considering constraints from planning policies and construction costs (as corridor width cannot expand indefinitely), the optimal threshold for cooling corridor width was determined to be 600 m.
Table 5.
The fitting results of different functions.
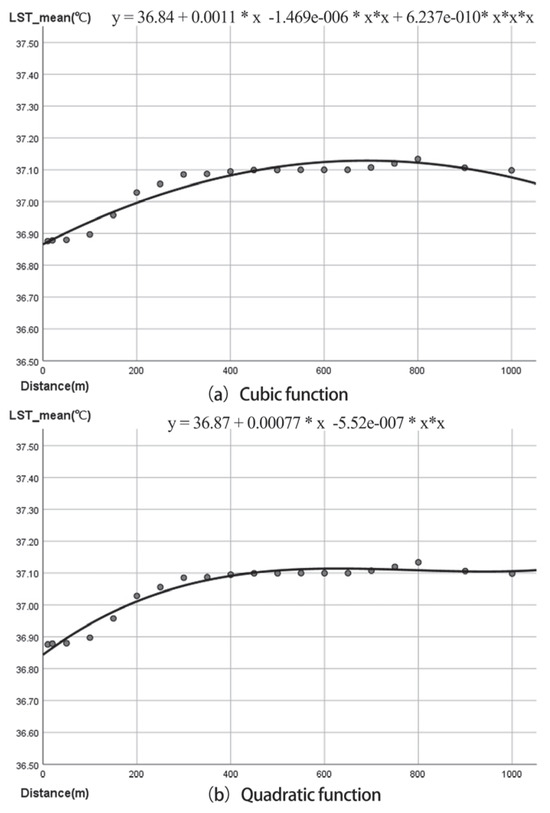
Figure 9.
Fitting between corridor width and LST.
4.4. Multiscale Analysis of CSP in Alleviating UHI Effect
To better reveal the differences in thermal environment responses at various spatial levels, provide a scientific basis for alleviating the UHI effect at different scales within the urban agglomeration, and avoid the limitations of single-scale strategies, we divided the CZXUA into three scales: the central urban area, the suburban scale, and the periphery of the urban agglomeration for comparative analysis (Figure A8). As shown in Table 6, the corridor density peaks at the suburban scale (87.48 m/km2), reflecting the ecological buffering role of the suburban area. The average LST decreases gradually with scale expansion, which reflects the effect of regional collaborative cooling. The centrality of the cold island sources at the urban scale is much higher than that at other scales, highlighting the importance of the sources of the central urban area.
Table 6.
Multiscale analysis table.
4.5. Relationship Between the CSP and the UHI
The CSP was analyzed by overlaying it with UHI patches (Figure 9). It was observed that certain cold island sources are near heat island patches. The main ones are cold island sources such as 11, 28, and 33. For these cold island sources, they should be prevented from being “eroded” by the heat island. Priority can be given to establishing ecological corridors between the two as a buffer zone. Concurrently, during the ecological planning of urban agglomerations, stringent regulations should be applied to cold island sources, with an emphasis on integrating key sources into the ecological protection red line for stringent preservation.
The “edge agglomeration” of the cold island source originates from the natural cold source advantage of the eastern mountains and the Xiangjiang River system, while the “core contiguity” of the heat island source is driven by high-density built-up areas and traffic heat emissions (Figure 10). This confrontation pattern shows that the trend of continuous expansion of heat islands needs to be broken through the cross-scale cooling corridor.

Figure 10.
CSP and UHI plaque overlay analysis.
Additionally, it was observed that certain first- and second-level cooling corridors traverse UHI areas. These corridors exhibit considerable length. Consequently, the implementation of stringent conservation measures for these corridors is imperative for preserving the integrity of the urban agglomerations’ CSP. In tandem, enhanced protective strategies should be applied to corridors traversing densely populated urban locales. Measures such as river regulation, integration of shoreline resources, and widening of greenways can be taken.
There are also cooling nodes and heating nodes located within UHI patches. For these zones, strategies should be implemented, including converting farmland back to forests and lakes and enhancing urban parks, pocket parks, and other urban green infrastructure services. In instances where significant practical impediments or prohibitive economic costs for renovation are present, the promotion of green buildings to efficiently absorb solar radiation is advisable. Additionally, the architectural layout of the area should be strategically planned to diminish building density and augment green spaces and vegetation, thereby effectively mitigating the UHI effect.
5. Discussion
5.1. UHI Effect Mitigation Strategy Based on CSP
Based on the results of multiscale analysis (Section 4.4) and the overlay analysis of CSP and UHI patches (Section 4.5), we propose a hierarchical governance framework for the three-level urban heat island mitigation zones (Figure 11). The primary thermal mitigation zone corresponds to the urban scale, mainly covering the main urban areas of Changsha, Zhuzhou, and Xiangtan. This area also has the most significant heat island effect in the CZXUA (LST has the highest mean value, reaching 41.19 °C). The cold island sources within this zone (mainly including Xiangbiwo Forest Park and Maolichong Forest Park) have the highest centrality, with an average value of 274.55. Therefore, it is the most crucial and significant in mitigating the UHI effect of the CZXUA, and thus requires focused attention and strict protection. In addition, the density of cold island sources in the urban area is relatively low (only 1.43% of the area), so the density of cold island sources can be prioritized improved by constructing urban parks and other measures. The secondary thermal mitigation zone corresponds to the suburban scale, mainly covering the cold island sources on the city’s outskirts, including Xiangshan National Forest Park, Shaoshan Scenic Spot, etc. Suburban areas have the highest corridor density (87.48 m/km2), despite cold sources accounting for only 4.86% of the area such that the secondary thermal mitigation zone mainly plays a transitional role in alleviating the UHI effect within the urban agglomeration. The tertiary thermal mitigation zone corresponds to the urban agglomeration scale and is located mainly on the periphery of peri-urban agglomerations. This region features a relatively concentrated and substantial array of cold island sources, including the Jiuling Mountain System and the Lianyun Mountain System. The tertiary thermal mitigation zone primarily serves to prevent the proliferation of the UHI effect and to obstruct the connectivity of the urban heat island network both within and beyond the urban agglomeration. The construction of the three-tiered heat mitigation zones mirrors the distinct requirements for heat island management, the necessity for efficient resource allocation, and the spatial characteristics of heat islands. This hierarchical design aligns with the radial diffusion pattern of heat islands (“core–edge–periphery” structure). This structure is essential for effective urban planning and resource allocation to combat heat islands. Concurrently, the cooling and humidifying effects of existing large river systems, which are significant BGSs within urban agglomerations, should not be overlooked. Accordingly, we designate the existing large rivers, including the Xiangjiang River and its seven primary tributaries, potential cooling corridors.

Figure 11.
Three-tiered heat island mitigation zones.
In addition, while the 600 m threshold for width optimizes the cooling efficiency, its application in urban areas with dense development requires adaptive strategies. In high-density zones, strictly observing a 600 m corridor may conflict with urban development priorities. Therefore, we propose a hierarchical planning approach. In the periphery of urban agglomeration where land use intensity is low, a width of 600 m is feasible. In suburban transition zones, widths of 100–500 m can be used in combination with forest parks. In city centers, we stress micro-interventions that synergize with existing BGS. For example, widening riverbanks, upgrading urban parks, or integrating greenways into transport networks can cut land acquisition costs, and widths under 100 m are acceptable here.
5.2. Detailed Comparative Analysis with Existing Relevant Studies
In recent years, the more authoritative, downloaded, and cited literature on constructing urban cold island networks to mitigate the UHI effect mainly includes Peng et al. (2022) [59], Qian et al. (2023) [4], Qiu et al. (2023) [62], and Liu et al. (2024) [37]. The innovation of this study is reflected in the synthesis of methods, scale expansion, and the depth of practical strategies, which are important supplements and breakthroughs in existing research. Specific comparative analysis is shown in Table 7.
Table 7.
Detailed comparative analysis with existing relevant studies.
5.3. Advantages of the Methodology
The CSP was constructed from the perspective of landscape connectivity to mitigate the UHI effect. It is more effective than previous studies that only focused on isolated landscape patches to mitigate the UHI effect over a larger regional scale. In terms of research scale, this study breaks the traditional single-city heat island research framework [4,62]. It proposes a regionalized heat mitigation paradigm on the scale of urban agglomeration [40], a typical form of urbanization in China. Taking the CZXUA as an example, its innovative value is reflected in: (1) cross-border heat management—constructing strategic cooling corridors across administrative boundaries to solve the problem of superposition of heat flow between cities; (2) hierarchical resource optimization—constructing three-level heat mitigation zones (city core–transition zone–periphery), differentiated allocation measures, and breaking through the single-city resource; and (3) policy scalability—complying with China’s “ecological civilization” regional collaboration policy and promoting climate resilience governance in synergy with sustainable development goals.
In the framework of this study, the paper assesses the wind environment, focusing on the impact of wind speeds. Building on this, this paper introduces a comprehensive paradigm for the construction of CSPs: “identification of cold island sources–construction of resistance surfaces–extraction of cooling corridor networks–identification of critical nodes.” We considered three-dimensional factors such as building height in constructing resistance surfaces, which is more scientific than most previous studies [4,37,64,71] that ignored the three-dimensional factor. Concurrently, SPCA was utilized to ascertain the weighting of each resistance factor, thereby addressing potential subjectivity inherent in prior methodologies [4,71]. Centrality Mapper and Linkage Priority Mapper were deployed to assess and rank the significance of cold island sources and the cooling corridor network, respectively, offering a more reliable approach than previous reliance solely on the natural breakpoint method [72]. Related studies [4,37] lack comparative analysis between cooling and heating spaces and urban heat island sources. This study compares the CSP’s cooling and heating nodes with urban heat islands within urban agglomerations, proposing more pragmatic and actionable strategic recommendations.
In summary, this study innovatively considered the effects of meteorological and three-dimensional factors such as wind speed and building height. We have established a comprehensive circular system that encompasses cold island sources, cooling corridor networks, and nodal spaces, thereby developing a CSP model that transitions from points to lines and from surfaces to rings. This design substantially augments the depth and scope of the research, concurrently enhancing its applicability in real-world contexts. This framework offers critical insights for mitigating the UHI effect amidst rapid urbanization and serves as a valuable reference for advancing sustainable urban development strategies and urban climate adaptation planning.
5.4. Limitations and Future Research Directions
The core methodology of the CSP construction framework in this study is universal and applicable to other urban agglomerations, such as the Yangtze River Delta (YRD) and Beijing–Tianjin–Hebei (BTH) urban agglomerations, which also face the challenge of UHIs. Firstly, regarding climate adaptation, key steps in the framework, like resistance surface construction, can be adjusted according to different climatic zones’ characteristics. For instance, in arid urban agglomerations, it is necessary to focus on the limitations of NDVI and water scarcity on the cold island network. The resistance surfaces can be modified accordingly by combining with the diffusion resistance of sand and dust. Secondly, the CSP framework can flexibly adapt to urban agglomerations at different spatial scales. The three-tiered heat island mitigation zones strategy (main city–suburban–suburban) proposed in this study can dynamically adjust the scope of the tiers. This dynamic adjustment allows the strategy to adapt to the expansion or contraction of urban agglomerations, making it a versatile tool for addressing UHI effects across various urban contexts. Nevertheless, the approach is not without its limitations. Primarily, while numerous studies depend on remote sensing technology to examine the urban thermal environment, such methodology can be compromised by adverse weather conditions, such as cloudiness or fog, thereby diminishing the image data quality. Additionally, we only used annual average wind speed data. Future studies could incorporate seasonal or even diurnal wind variations to optimize corridor designs for specific microclimates, particularly in high-density urban cores dominated by local airflow dynamics. Furthermore, our threshold setting of cold island areas greater than 1 km2 overlooks the cumulative effects of small-scale cold islands (although individual small cold islands, such as community green spaces, have limited cooling capacity, their spatial aggregation may form a regional cooling network [21]) and the non-area-dependent ecological functions (some linear cold islands, such as river corridors, can play critical ventilation roles due to their continuity, despite their smaller areas [29], and the threshold setting may diminish their contributions). These limitations could result in a lower-than-optimal density of cooling corridor networks. Future studies could employ machine learning methods, such as random forests or convolutional neural networks (CNNs), to automatically identify the functional effectiveness of cold islands, thereby replacing the reliance on a single area threshold. Finally, the construction of cold island networks and CSP using circuit theory in this study also suffers from limitations such as vertical dimension simplification and insufficient 3D obstacle modeling, which can be followed up by coupling CFD models to improve the construction of 3D resistance surfaces.
6. Conclusions
The intensification of the UHI effect presents a substantial threat to urban environments and the well-being of their inhabitants. Accordingly, this study investigated strategic approaches for UHI mitigation by integrating urban cold islands and landscape connectivity to optimize the distribution of isolated cold islands. Concurrently, regarding the research scale, existing studies predominantly concentrate on urban or small-town scales, often overlooking the urban agglomeration scale. This study selected the CZXUA, a quintessential hot summer and cold winter region in China, as its research subject. We innovatively considered the effects of meteorological and three-dimensional factors such as wind speed and building height. Employing modeling techniques including MSPA, landscape connectivity analysis, SPCA, and circuit theory, this study proposes a comprehensive framework for CSP construction: identification of cold island sources, construction of resistance surfaces, extraction of cooling corridor networks, and identification of critical nodes. A total of 39 cold island sources, 89 cooling corridors, 42 cooling nodes, and 63 heating nodes were identified. We have calculated that the optimal threshold for the cooling corridor is 600 m. Based on the CSP, this study proposes a three-tiered urban agglomeration heat island mitigation framework. The primary thermal mitigation zone constitutes the most critical component of UHI effect mitigation, encompassing primarily the central urban areas of the urban agglomeration. The secondary thermal mitigation zone is predominantly situated in suburban areas and functions as a transitional zone. The tertiary thermal mitigation zone primarily serves to prevent the proliferation of the UHI effect and to obstruct the connectivity between the heat island networks within and beyond the urban agglomeration. The CSP developed in this study effectively mitigates the regional UHI effect at the macrolevel. Based on these findings, this study proposes the following policy enhancement pathways.
(1) Ecological Protection Policies: Incorporate core cold island sources into ecological protection redlines, legally prohibit encroachment, and establish ecological compensation mechanisms.
(2) Urban Planning Regulations: Formulate legal width standards for cooling corridors (e.g., 600 m), mandate ventilation spaces along new roads and riverbanks, and integrate 3D resistance factors into regulatory planning indicators.
(3) Regional Collaboration Mechanisms: Establish a cross-city thermal environment governance alliance under the CSP framework to jointly regulate cross-boundary heat flows (e.g., industrial heat sources, thermal radiation from transportation networks).
(4) Climate-Adaptive Investments: Prioritize the deployment of pocket parks and vertical greening systems in heating nodes and integrate these initiatives into special funding programs.
Author Contributions
Conceptualization, Qianli Ouyang, Xi Luo, and Bohong Zheng; methodology, Qianli Ouyang, Junyou Liu, and Bohong Zheng; software, Qianli Ouyang, Junyou Liu, and Xi Luo; validation, Zhaoqian Sun, Shengyan Wu, and Bohong Zheng; formal analysis, Qianli Ouyang, Shengyan Wu, and Zhaoqian Sun; investigation, Qianli Ouyang, Shengyan Wu, and Zhaoqian Sun. All authors have read and agreed to the published version of the manuscript.
Funding
This work was supported by the Open Topic of Hunan Key Laboratory of Land Resources Evaluation and Utilization (SYS-MT-202401) and Hunan Provincial Natural Science Foundation General Project (2023JJ30693).
Data Availability Statement
Data can be obtained by asking the author.
Conflicts of Interest
The authors declare that the research was conducted in the absence of any commercial or financial relationships that could be construed as a potential conflict of interest.
Abbreviations
The following abbreviations are used in this manuscript:
| LST | land surface temperature |
| UHI | urban heat island |
| MSPA | morphological spatial pattern analysis |
| CSP | cold island spatial pattern |
| CZXUA | Changsha–Zhuzhou–Xiangtan urban agglomeration |
Appendix A
Table A1.
Area and proportion of 7 types of land use in CZXUA.
Table A1.
Area and proportion of 7 types of land use in CZXUA.
| Land Use Type | Area (km) | Proportion |
|---|---|---|
| Cultivated land | 7946.15 | 28.33% |
| Forest | 17,479.08 | 62.31% |
| Grassland | 428.1 | 1.53% |
| Wetland | 7.489239716 | 0.03% |
| Water body | 552.6707603 | 1.97% |
| Artificial surfaces | 1632.7 | 5.82% |
| Bare land | 7.22 | 0.03% |
Table A2.
MSPA types and implications.
Table A2.
MSPA types and implications.
| Morphological Types | Implications |
|---|---|
| Core | Larger habitat patches in the foreground image, “sources” of multiple ecological processes. |
| Bridge | Narrow areas connecting adjacent core areas, characterized as corridors, represent corridors for energy exchange and material flow and are important for landscape connectivity. |
| Edge | A transition area is created between the core area and the peripheral non-study landscape areas to protect the ecological processes and natural succession in the core area and reduce the impact of anthropogenic disturbances in the external landscape. |
| Branch | Extended areas of the prospective study landscape with only one end connected to the edge zone. Bridges, traffic circles, or perforations serve as conduits for exchanging energy with the peripheral landscape. |
| Loop | Internal corridors connecting the same core area, also characterized as corridors, for energy exchange within the core area. |
| Islet | Isolated, fragmented, poorly connected patches that are not connected and have less potential for internal material and energy exchange and transfer. |
| Perforation | The transition area between the core area and its internal background data landscape, also with edge effects. |
Table A3.
Landscape connectivity analysis of the cold island sources.
Table A3.
Landscape connectivity analysis of the cold island sources.
| ID | Area (km2) | dIIC | dPC | ID | Area (km2) | dIIC | dPC |
|---|---|---|---|---|---|---|---|
| 1 | 1.9989 | 0.0001 | 0.0182 | 21 | 21.2364 | 0.0089 | 0.0224 |
| 2 | 1.0566 | 0.0423 | 0.0491 | 22 | 36.6705 | 0.0267 | 0.0525 |
| 3 | 3.3453 | 0.0002 | 0.0178 | 23 | 55.7964 | 0.0617 | 0.1206 |
| 4 | 11.8728 | 0.0028 | 0.1008 | 24 | 14.1048 | 0.0039 | 0.0447 |
| 5 | 14.0634 | 0.0072 | 0.0102 | 25 | 4.6170 | 0.0004 | 0.0122 |
| 6 | 1.3914 | 0.0000 | 0.0112 | 26 | 341.8010 | 2.3162 | 2.4245 |
| 7 | 25.5942 | 0.0152 | 0.0772 | 27 | 16.5186 | 0.0068 | 0.0215 |
| 8 | 47.2752 | 0.0515 | 0.1062 | 28 | 13.8375 | 0.0038 | 0.0125 |
| 9 | 5.7546 | 0.0046 | 0.0139 | 29 | 158.6910 | 0.4993 | 0.5453 |
| 10 | 2018.9500 | 80.8542 | 80.0947 | 30 | 16.4916 | 0.0054 | 0.0118 |
| 11 | 120.8350 | 0.2895 | 0.4207 | 31 | 7.8525 | 0.0012 | 0.0105 |
| 12 | 33.1992 | 0.0219 | 0.0730 | 32 | 24.6204 | 0.0120 | 0.0447 |
| 13 | 6.2415 | 0.0022 | 0.0197 | 33 | 7.1280 | 0.0020 | 0.0154 |
| 14 | 9.8433 | 0.0039 | 0.0210 | 34 | 3.2616 | 0.0005 | 0.0296 |
| 15 | 123.3870 | 0.3018 | 0.3988 | 35 | 3.9231 | 0.0006 | 0.0368 |
| 16 | 177.7980 | 0.6374 | 0.7393 | 36 | 6.0957 | 0.0015 | 0.0144 |
| 17 | 16.5159 | 0.0054 | 0.0175 | 37 | 42.7329 | 0.0362 | 0.1577 |
| 18 | 19.4778 | 0.0092 | 0.0309 | 38 | 13.2165 | 0.0042 | 0.0210 |
| 19 | 51.5538 | 0.0547 | 0.1153 | 39 | 860.5970 | 14.6833 | 14.7872 |
| 20 | 17.3853 | 0.0060 | 0.0163 |
Table A4.
Percentage and cumulative eigenvalues.
Table A4.
Percentage and cumulative eigenvalues.
| PC Layer | Eigenvalue | Percentage Eigenvalues | Cumulative Eigenvalues |
|---|---|---|---|
| 1 | 4.33 × 10³ | 85.4373 | 85.4373 |
| 2 | 4.25 × 10² | 8.3833 | 93.8207 |
| 3 | 1.49 × 10² | 2.9359 | 96.7565 |
| 2 | 4.25 × 10² | 8.3833 | 93.8207 |
| 3 | 1.49 × 10² | 2.9359 | 96.7565 |
| 3 | 1.49 × 10² | 2.9359 | 96.7565 |
| 4 | 1.10 × 10² | 2.1715 | 98.928 |
| 7 | 1.34 × 10⁻⁶ | 0 | 100 |
Table A5.
LST statistics at different buffer distances.
Table A5.
LST statistics at different buffer distances.
| Distance (m) | LST_mean (°C) | LST_std (°C) | LST_min (°C) | LST_max (°C) |
|---|---|---|---|---|
| 10 | 36.875818 | 1.09561 | 33.819246 | 40.21373 |
| 20 | 36.878057 | 1.128505 | 34.034776 | 40.394714 |
| 50 | 36.879691 | 1.20456 | 33.901357 | 40.758771 |
| 100 | 36.896856 | 1.168311 | 33.70495 | 41.187857 |
| 150 | 36.957254 | 1.203831 | 33.821936 | 41.586634 |
| 200 | 37.028614 | 1.266541 | 33.66811 | 42.147822 |
| 250 | 37.055595 | 1.368697 | 33.495671 | 42.476772 |
| 300 | 37.085376 | 1.363284 | 33.37116 | 42.732005 |
| 350 | 37.087061 | 1.339004 | 33.059356 | 42.970234 |
| 400 | 37.094863 | 1.383731 | 32.968609 | 43.238875 |
| 450 | 37.099274 | 1.385414 | 32.929814 | 43.3404 |
| 500 | 37.099369 | 1.424647 | 32.568147 | 43.425537 |
| 550 | 37.099809 | 1.435725 | 32.436533 | 43.389677 |
| 600 | 37.099793 | 1.449669 | 32.57667 | 43.478389 |
| 650 | 37.099827 | 1.473347 | 32.480934 | 43.599589 |
| 700 | 37.107318 | 1.466245 | 32.579622 | 43.705826 |
| 750 | 37.119694 | 1.499639 | 32.40155 | 43.853574 |
| 800 | 37.134109 | 1.521924 | 32.440563 | 43.921288 |
| 900 | 37.106261 | 1.543059 | 32.019323 | 44.124647 |
| 1000 | 37.098366 | 1.659499 | 31.620075 | 44.437516 |
Appendix B
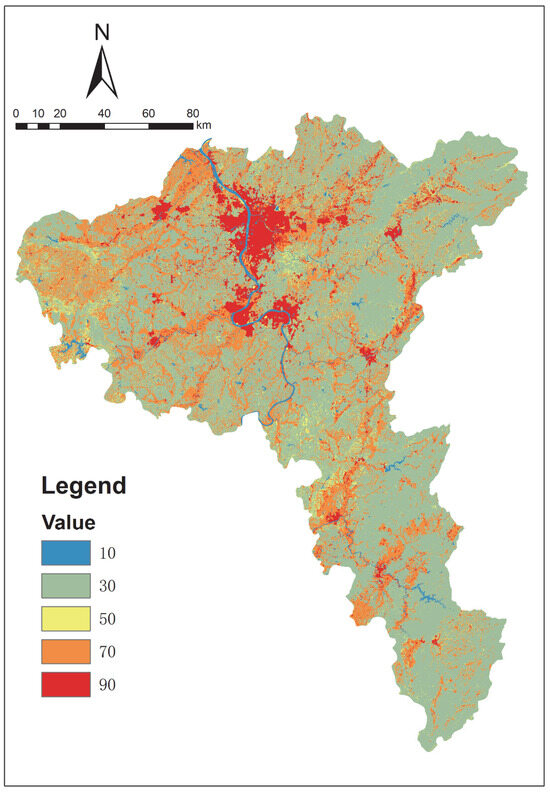
Figure A1.
Land use type.
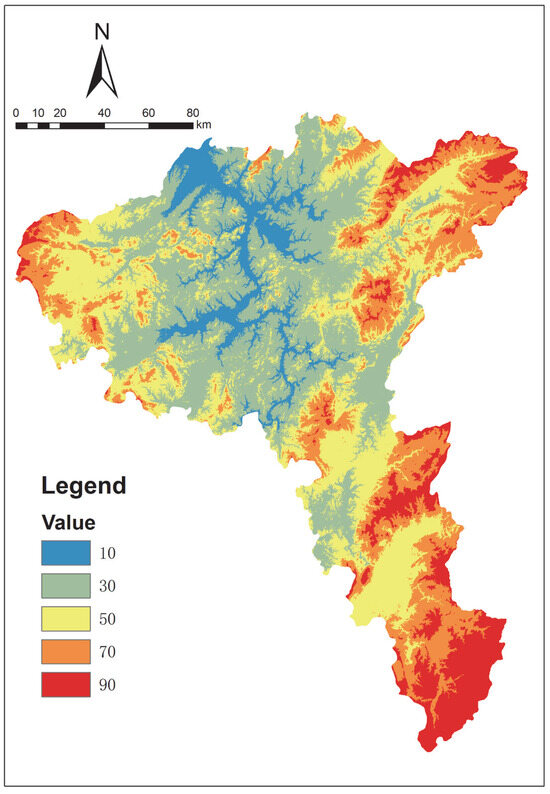
Figure A2.
DEM.
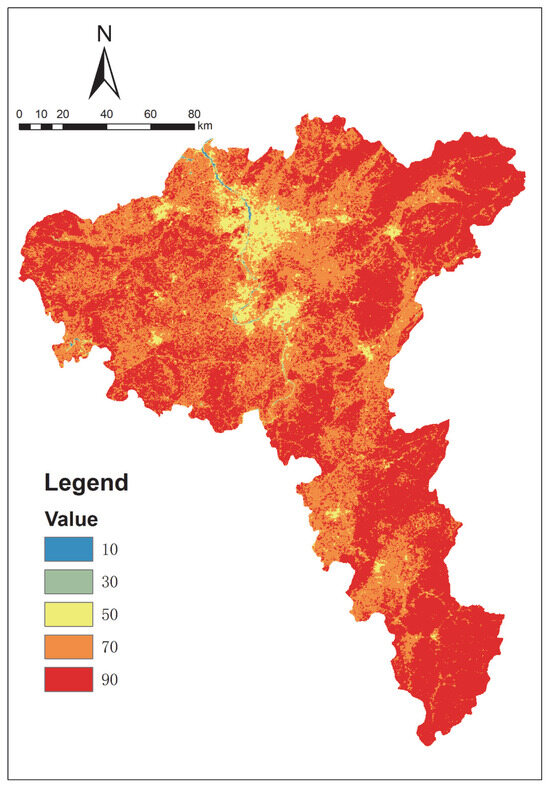
Figure A3.
NDVI.
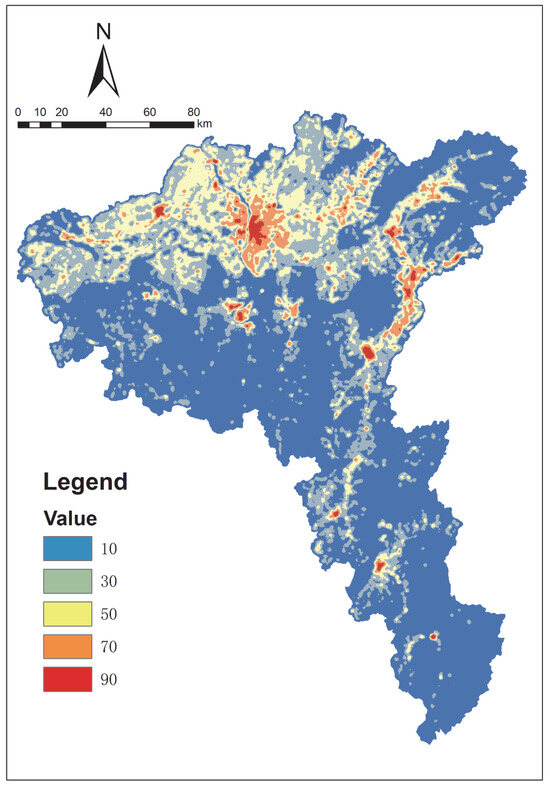
Figure A4.
Building height.

Figure A5.
Building density.
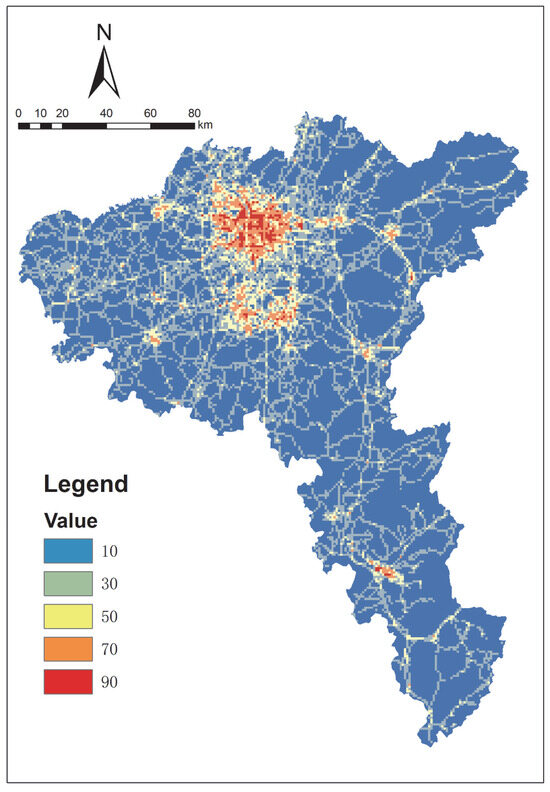
Figure A6.
Road density.
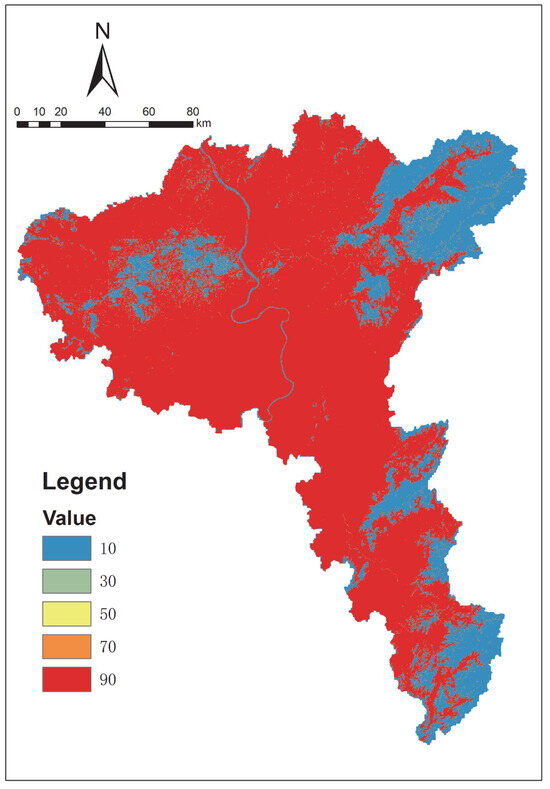
Figure A7.
MSPA type.
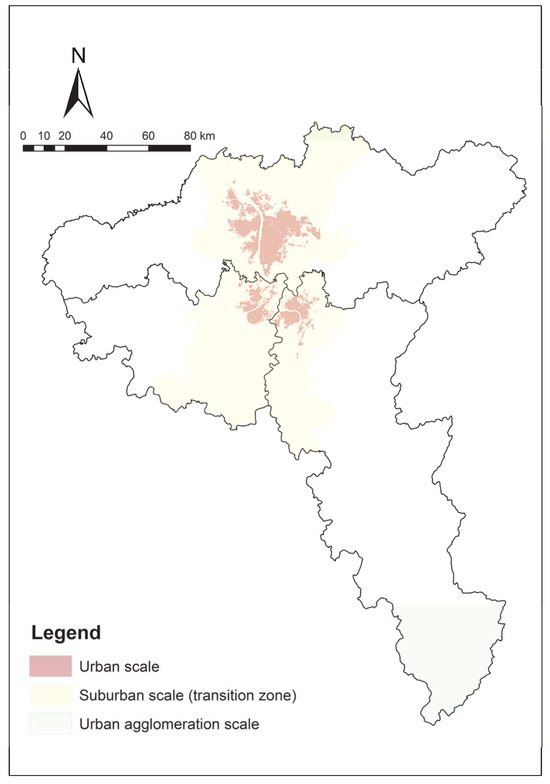
Figure A8.
Multiscale partitioning results.
References
- Gu, C. Urbanization: Processes and driving forces. Sci. China Earth Sci. 2019, 62, 1351–1360. [Google Scholar] [CrossRef]
- Zhou, W.; Wang, J.; Cadenasso, M.L. Effects of the spatial configuration of trees on urban heat mitigation: A comparative study. Remote Sens. Environ. 2017, 195, 1–12. [Google Scholar] [CrossRef]
- Li, X.; Li, W.; Middel, A.; Harlan, S.L.; Brazel, A.J.; Turner Ii, B. Remote sensing of the surface urban heat island and land architecture in Phoenix, Arizona: Combined effects of land composition and configuration and cadastral–demographic–economic factors. Remote Sens. Environ. 2016, 174, 233–243. [Google Scholar] [CrossRef]
- Qian, W.; Li, X. A cold island connectivity and network perspective to mitigate the urban heat island effect. Sustain. Cities Soc. 2023, 94, 104525. [Google Scholar] [CrossRef]
- Mathew, A.; Khandelwal, S.; Kaul, N. Spatial and temporal variations of urban heat island effect and the effect of percentage impervious surface area and elevation on land surface temperature: Study of Chandigarh city, India. Sustain. Cities Soc. 2016, 26, 264–277. [Google Scholar] [CrossRef]
- He, B.-J.; Wang, J.; Zhu, J.; Qi, J. Beating the urban heat: Situation, background, impacts and the way forward in China. Renew. Sustain. Energy Rev. 2022, 161, 112350. [Google Scholar] [CrossRef]
- Xiang, Y.; Zheng, B.; Bedra, K.B.; Ouyang, Q.; Liu, J.; Zheng, J. Spatial and seasonal differences between near surface air temperature and land surface temperature for Urban Heat Island effect assessment. Urban Clim. 2023, 52, 101745. [Google Scholar] [CrossRef]
- Debbage, N.; Shepherd, J.M. The urban heat island effect and city contiguity. Comput. Environ. Urban Syst. 2015, 54, 181–194. [Google Scholar] [CrossRef]
- Oke, T.R. The energetic basis of the urban heat island. Q. J. R. Meteorolog. Soc. 1982, 108, 1–24. [Google Scholar] [CrossRef]
- Magee, N.; Curtis, J.; Wendler, G.J.T. The urban heat island effect at Fairbanks, Alaska. Theor. Appl. Climatol. 1999, 64, 39–47. [Google Scholar] [CrossRef]
- Memon, R.A.; Leung, D.Y.; Chunho, L. A review on the generation, determination and mitigation of urban heat island. J. Environ. Sci. 2008, 20, 120–128. [Google Scholar] [CrossRef]
- Zhao, L.; Lee, X.; Smith, R.B.; Oleson, K. Strong contributions of local background climate to urban heat islands. Nature 2014, 511, 216–219. [Google Scholar] [CrossRef] [PubMed]
- Manley, G. On the frequency of snowfall in metropolitan England. Q. J. R. Meteorolog. Soc. 1958, 84, 70–72. [Google Scholar] [CrossRef]
- Song, X.-P.; Hansen, M.C.; Stehman, S.V.; Potapov, P.V.; Tyukavina, A.; Vermote, E.F.; Townshend, J.R. Global land change from 1982 to 2016. Nature 2018, 560, 639–643. [Google Scholar] [CrossRef]
- Basu, R.; Ostro, B.D. A multicounty analysis identifying the populations vulnerable to mortality associated with high ambient temperature in California. Am. J. Epidemiol. 2008, 168, 632–637. [Google Scholar] [CrossRef]
- Patz, J.A.; Campbell-Lendrum, D.; Holloway, T.; Foley, J.A. Impact of regional climate change on human health. Nature 2005, 438, 310–317. [Google Scholar] [CrossRef]
- Zhang, W.; Li, Y.; Zheng, C.; Zhu, Y. Surface urban heat island effect and its driving factors for all the cities in China: Based on a new batch processing method. Ecol. Indic. 2023, 146, 109818. [Google Scholar] [CrossRef]
- Cao, J.; Zhou, W.; Zheng, Z.; Ren, T.; Wang, W. Within-city spatial and temporal heterogeneity of air temperature and its relationship with land surface temperature. Landsc. Urban Plan. 2021, 206, 103979. [Google Scholar] [CrossRef]
- Estoque, R.C.; Murayama, Y.; Myint, S.W. Effects of landscape composition and pattern on land surface temperature: An urban heat island study in the megacities of Southeast Asia. Sci. Total Environ. 2017, 577, 349–359. [Google Scholar] [CrossRef]
- Xiao, X.D.; Dong, L.; Yan, H.; Yang, N.; Xiong, Y. The influence of the spatial characteristics of urban green space on the urban heat island effect in Suzhou Industrial Park. Sustain. Cities Soc. 2018, 40, 428–439. [Google Scholar] [CrossRef]
- Zhang, Q.; Zhou, D.; Xu, D.; Rogora, A. Correlation between cooling effect of green space and surrounding urban spatial form: Evidence from 36 urban green spaces. Build. Environ. 2022, 222, 109375. [Google Scholar] [CrossRef]
- Li, J.; Zheng, B.; Bedra, K.B.; Li, Z.; Chen, X. Effects of residential building height, density, and floor area ratios on indoor thermal environment in Singapore. J. Environ. Manag. 2022, 313, 114976. [Google Scholar] [CrossRef]
- Zheng, J.; Li, Z.; Zheng, B. A Study on the Effect of Green Plot Ratio (GPR) on Urban Heat Island Intensity and Outdoor Thermal Comfort in Residential Areas. Forests 2024, 15, 518. [Google Scholar] [CrossRef]
- Brears, R.C. Copenhagen becoming a blue-green city through blue-green infrastructure. In Blue and Green Cities: The Role of Blue-Green Infrastructure in Managing Urban Water Resources; Springer: Cham, Switzerland, 2023; pp. 115–132. [Google Scholar]
- Moss, J.L.; Doick, K.J.; Smith, S.; Shahrestani, M. Influence of evaporative cooling by urban forests on cooling demand in cities. Urban For. Urban Green. 2019, 37, 65–73. [Google Scholar] [CrossRef]
- Gunawardena, K.R.; Wells, M.J.; Kershaw, T. Utilising green and bluespace to mitigate urban heat island intensity. Sci. Total Environ. 2017, 584–585, 1040–1055. [Google Scholar] [CrossRef]
- Santamouris, M.; Ban-Weiss, G.; Osmond, P.; Paolini, R.; Synnefa, A.; Cartalis, C.; Muscio, A.; Zinzi, M.; Morakinyo, T.E.; Edward, N. Progress in urban greenery mitigation science–assessment methodologies advanced technologies and impact on cities. J. Civ. Eng. Manag. 2018, 24, 638–671. [Google Scholar] [CrossRef]
- Chen, H.; Deng, Q.; Zhou, Z.; Ren, Z.; Shan, X. Influence of land cover change on spatio-temporal distribution of urban heat island—A case in Wuhan main urban area. Sustain. Cities Soc. 2022, 79, 103715. [Google Scholar] [CrossRef]
- Cai, Z.; Han, G.; Chen, M. Do water bodies play an important role in the relationship between urban form and land surface temperature? Sustain. Cities Soc. 2018, 39, 487–498. [Google Scholar] [CrossRef]
- Tan, X.; Sun, X.; Huang, C.; Yuan, Y.; Hou, D. Comparison of cooling effect between green space and water body. Sustain. Cities Soc. 2021, 67, 102711. [Google Scholar] [CrossRef]
- Doick, K.J.; Peace, A.; Hutchings, T.R. The role of one large greenspace in mitigating London’s nocturnal urban heat island. Sci. Total Environ. 2014, 493, 662–671. [Google Scholar] [CrossRef]
- Zhang, M.; Wang, J.; Zhang, F. The Influence of Spatial Heterogeneity of Urban Green Space on Surface Temperature. Forests 2024, 15, 878. [Google Scholar] [CrossRef]
- Yue, X.; Liu, W.; Wang, X.; Yang, J.; Lan, Y.; Zhu, Z.; Yao, X. Constructing an urban heat network to mitigate the urban heat island effect from a connectivity perspective. Sustain. Cities Soc. 2024, 114, 105774. [Google Scholar] [CrossRef]
- Chen, Y.; Yang, J.; Yang, R.; Xiao, X.; Xia, J. Contribution of urban functional zones to the spatial distribution of urban thermal environment. Build. Environ. 2022, 216, 109000. [Google Scholar] [CrossRef]
- Halder, B.; Bandyopadhyay, J.; Banik, P. Monitoring the effect of urban development on urban heat island based on remote sensing and geo-spatial approach in Kolkata and adjacent areas, India. Sustain. Cities Soc. 2021, 74, 103186. [Google Scholar] [CrossRef]
- Zhao, Q.; Yu, K.; Geng, J.; Lin, J.; Ai, J.; Liu, J. Spatiotemporal Evolution of Urban Heat Islands and Optimization of Spatial Network Construction in the Central Urban Area of Fuzhou City, China. Chin. Geogr. Sci. 2024, 34, 917–930. [Google Scholar] [CrossRef]
- Liu, F.; Liu, J.; Zhang, Y.; Hong, S.; Fu, W.; Wang, M.; Dong, J. Construction of a cold island network for the urban heat island effect mitigation. Sci. Total Environ. 2024, 915, 169950. [Google Scholar] [CrossRef]
- Liu, T.; Ouyang, S.; Gou, M.; Xiang, W.; Lei, P.; Li, Y. Analysis connectivity of urban heat island in a new-type urbanization based on MSPA model. Acta Ecol. Sin 2023, 43, 615–624. [Google Scholar]
- Zhou, W.; Huang, G.; Cadenasso, M.L. Does spatial configuration matter? Understanding the effects of land cover pattern on land surface temperature in urban landscapes. Landsc. Urban Plan. 2011, 102, 54–63. [Google Scholar] [CrossRef]
- Ouyang, X.; Wang, Z.; Zhu, X. Construction of the ecological security pattern of urban agglomeration under the framework of supply and demand of ecosystem services using Bayesian network machine learning: Case study of the Changsha–Zhuzhou–Xiangtan urban agglomeration, China. Sustainability 2019, 11, 6416. [Google Scholar] [CrossRef]
- Ouyang, Q.; Zheng, B.; Luo, X.; Wu, S. Construction of ecological security pattern of urban agglomeration based on multi-scale ecological corridor networks. Ecosyst. Health Sustain. 2024, 10, 0253. [Google Scholar] [CrossRef]
- Gao, J.; Sun, Y.; Liu, Q.; Zhou, M.; Lu, Y.; Li, L. Impact of extreme high temperature on mortality and regional level definition of heat wave: A multi-city study in China. Sci. Total Environ. 2015, 505, 535–544. [Google Scholar] [CrossRef] [PubMed]
- Changchun, T.; Jiaqi, C.; Yunfei, X.; Jialu, T.; Chulai, Z. Integrated Identification and Spatial Differentiation Mechanism of Urban Built-up Area in Changsha-Zhuzhou-Xiangtan Urban Agglomeration Based on the Multi-source Big Data. Econ. Geogr. 2024, 44, 66–76. [Google Scholar]
- Xiong, Y.; Zhang, F. Effect of human settlements on urban thermal environment and factor analysis based on multi-source data: A case study of Changsha city. J. Geog. Sci. 2021, 31, 819–838. [Google Scholar] [CrossRef]
- Global 30m Land Cover Dataset. Available online: http://www.globallandcover.com/ (accessed on 15 March 2024).
- USGS EarthExplorer. Landsat 8 Data Users Handbook (Version 5.0). Available online: https://earthexplorer.usgs.gov/ (accessed on 15 March 2024).
- GSCloud. 30m Resolution Digital Elevation Model. Available online: https://www.gscloud.cn/ (accessed on 15 March 2024).
- MODIS/Terra Vegetation Indices Monthly L3 Global 1km SIN Grid V006. Available online: https://modis.gsfc.nasa.gov/ (accessed on 15 March 2024).
- Che, Y.; Li, X.; Liu, X.; Wang, Y.; Liao, W.; Zheng, X.; Zhang, X.; Xu, X.; Shi, Q.; Zhu, J. 3D-GloBFP: The first global three-dimensional building footprint dataset. Earth Syst. Sci. Data Discuss. 2024, 2024, 1–28. [Google Scholar] [CrossRef]
- Vanhellemont, Q. Automated water surface temperature retrieval from Landsat 8/TIRS. Remote Sens. Environ. 2020, 237, 111518. [Google Scholar] [CrossRef]
- Sobrino, J.A.; Jiménez-Muñoz, J.C.; Paolini, L. Land surface temperature retrieval from LANDSAT TM 5. Remote Sens. Environ. 2004, 90, 434–440. [Google Scholar] [CrossRef]
- Chander, G.; Markham, B.L.; Helder, D.L. Summary of current radiometric calibration coefficients for Landsat MSS, TM, ETM+, and EO-1 ALI sensors. Remote Sens. Environ. 2009, 113, 893–903. [Google Scholar] [CrossRef]
- Renc, A.; Łupikasza, E.; Błaszczyk, M. Spatial structure of the surface heat and cold islands in summer based on Landsat 8 imagery in southern Poland. Ecol. Indic. 2022, 142, 109181. [Google Scholar] [CrossRef]
- Oliver, M.A.; Webster, R. Kriging: A method of interpolation for geographical information systems. Int. J. Geogr. Inf. Syst. 1990, 4, 313–332. [Google Scholar] [CrossRef]
- Wickham, J.D.; Riitters, K.H.; Wade, T.G.; Vogt, P. A national assessment of green infrastructure and change for the conterminous United States using morphological image processing. Landsc. Urban Plan. 2010, 94, 186–195. [Google Scholar] [CrossRef]
- Song, L.; Bei, H. Construction of regional green infrastructure based on MSPA—Case study on Suzhou-Wuxi-Changzhou Area. Landsc. Archit. 2017, 24, 98–104. [Google Scholar]
- Jie, Y.; Baopeng, X.; Taibing, W.; Mak-Mensah, E. Identification and optimization strategy of ecological security pattern in Maiji District of Gansu, China. Ecol. Indic. 2023, 157, 111309. [Google Scholar] [CrossRef]
- Zhang, R.; Zhang, Q.; Zhang, L.; Zhong, Q.; Liu, J.; Wang, Z. Identification and extraction of a current urban ecological network in Minhang District of Shanghai based on an optimization method. Ecol. Indic. 2022, 136, 108647. [Google Scholar] [CrossRef]
- Peng, J.; Cheng, X.; Hu, Y.; Corcoran, J.J.L.E. A landscape connectivity approach to mitigating the urban heat island effect. Landsc. Ecol. 2022, 37, 1707–1719. [Google Scholar] [CrossRef]
- Saura, S.; Rubio, L. A common currency for the different ways in which patches and links can contribute to habitat availability and connectivity in the landscape. Ecography 2010, 33, 523–537. [Google Scholar] [CrossRef]
- Ran Aobo, L.J. Pendulum: The 70-Year Evolution of the Old Residential Area Regeneration in China. China City Plan. Rev. 2023, 32, 75–83. [Google Scholar] [CrossRef]
- Qiu, J.; Li, X.; Qian, W. Optimizing the spatial pattern of the cold island to mitigate the urban heat island effect. Ecol. Indic. 2023, 154, 110550. [Google Scholar] [CrossRef]
- Yu, Z.; Zhang, J.; Yang, G. How to build a heat network to alleviate surface heat island effect? Sustain. Cities Soc. 2021, 74, 103135. [Google Scholar] [CrossRef]
- Zhao, Z.; Li, W.; Zhang, J.; Zheng, Y. Constructing an urban heat island network based on connectivity perspective: A case study of Harbin, China. Ecol. Indic. 2024, 159, 111665. [Google Scholar] [CrossRef]
- Wang, N.; Zhao, Y. Construction of an ecological security pattern in Jiangnan water network area based on an integrated Approach: A case study of Gaochun, Nanjing. Ecol. Indic. 2024, 158, 111314. [Google Scholar] [CrossRef]
- Wang, Y.; Qu, Z.; Zhong, Q.; Zhang, Q.; Zhang, L.; Zhang, R.; Yi, Y.; Zhang, G.; Li, X.; Liu, J. Delimitation of ecological corridors in a highly urbanizing region based on circuit theory and MSPA. Ecol. Indic. 2022, 142, 109258. [Google Scholar] [CrossRef]
- Shen, Z.; Yin, H.; Kong, F.; Wu, W.; Sun, H.; Su, J.; Tian, S. Enhancing ecological network establishment with explicit species information and spatially coordinated optimization for supporting urban landscape planning and management. Landsc. Urban Plan. 2024, 248, 105079. [Google Scholar] [CrossRef]
- Dong, J.; Peng, J.; Xu, Z.; Liu, Y.; Wang, X.; Li, B. Integrating regional and interregional approaches to identify ecological security patterns. Landsc. Ecol. 2021, 36, 2151–2164. [Google Scholar] [CrossRef]
- Ran, Y.; Lei, D.; Li, J.; Gao, L.; Mo, J.; Liu, X. Identification of crucial areas of territorial ecological restoration based on ecological security pattern: A case study of the central Yunnan urban agglomeration, China. Ecol. Indic. 2022, 143, 109318. [Google Scholar] [CrossRef]
- Nie, W.; Shi, Y.; Siaw, M.J.; Yang, F.; Wu, R.; Wu, X.; Zheng, X.; Bao, Z. Constructing and optimizing ecological network at county and town Scale: The case of Anji County, China. Ecol. Indic. 2021, 132, 108294. [Google Scholar] [CrossRef]
- Guo, N.; Liang, X.; Meng, L. Evaluation of the thermal environmental effects of urban ecological networks—A case study of Xuzhou city, China. Sustainability 2022, 14, 7744. [Google Scholar] [CrossRef]
- Lu, J.; Jiao, S.; Han, Z.; Yin, J. Promoting ecological restoration of deeply urbanized hilly areas: A multi-scale ecological networks approach. Ecol. Indic. 2023, 154, 110655. [Google Scholar] [CrossRef]
Disclaimer/Publisher’s Note: The statements, opinions and data contained in all publications are solely those of the individual author(s) and contributor(s) and not of MDPI and/or the editor(s). MDPI and/or the editor(s) disclaim responsibility for any injury to people or property resulting from any ideas, methods, instructions or products referred to in the content. |
© 2025 by the authors. Published by MDPI on behalf of the International Society for Photogrammetry and Remote Sensing. Licensee MDPI, Basel, Switzerland. This article is an open access article distributed under the terms and conditions of the Creative Commons Attribution (CC BY) license (https://creativecommons.org/licenses/by/4.0/).