Article

Topography–Land Surface Temperature Coupling: A Promising Approach for the Early Identification of Coal Seam Fire Zones

1
School of Human Settlements and Civil Engineering, Xi’an Jiaotong University, Xi’an 710049, China
2
College of Life Sciences, Yulin University, Yulin 719000, China
3
Xi’an Center of China Geological Survey, Xi’an 710054, China
4
Key Laboratory for Geohazard in Loess Area of Ministry of Natural Resources, Xi’an 710054, China
*
Author to whom correspondence should be addressed.
ISPRS Int. J. Geo-Inf. 2025, 14(5), 206; https://doi.org/10.3390/ijgi14050206 (registering DOI)
Submission received: 19 February 2025 / Revised: 16 April 2025 / Accepted: 30 April 2025 / Published: 18 May 2025

Abstract

:
Coal mining provides energy and economic benefits but also causes environmental damage, including land degradation, pollution, and surface temperature anomalies. Underground coal fires can severely impact the environment, leading to abnormal heat, ground deformation, and ecological harm. Using Landsat-9 imagery and meteorological data, we developed a new threshold-based method to detect large-scale land surface temperature anomalies (LSTAs). By analyzing multiple images from November to February, we improved the accuracy of this method. The LSTA data were integrated with topographic indexes and different coal seam depths to filter irrelevant points. A Wilcoxon test, correlation analysis, and linear regression were performed with the LSTA multi-data matrix to quantify the relationships between the topographical and temperature indexes. The results revealed significant differences in elevation (relative elevation), slope, and TWI across different coal seam depths (p < 0.001). LST distribution in November, December, and February was significantly different among the three different seam depth units (p < 0.001). Relative elevation strongly correlated with temperature. The relationship between relative elevation and temperature may change seasonally due to seasonal climatic fluctuations and heterogeneous underlying surface characteristics.

1. Introduction

China is the largest coal producer and consumer in the world. The coal mining industry can provide energy, materials, and economic profits, yet it also causes a series of environmental problems, including geological hazards, water contamination, land cover destruction, environmental pollution, and land surface temperature anomalies [1,2,3,4]. The oxidation of coal generates heat, which, if not dissipated, causes the temperature to rise to the ignition threshold and starts to burn the coal, which might lead to the spontaneous combustion of coal and result in critical environmental and social catastrophes [5,6]. The underground coal fire could influence the environment profoundly, causing abnormally high surface temperature anomalies, ground deformation, land cover destruction, and ecological crises [7,8]. Thus, a combination of accurate monitoring and precise thermal anomaly recognition is critical for the alerting and settlement of possible underground coal fire events. Furthermore, the precise specification of the relationship between topography and land surface temperature anomalies in coalfields can provide an important perspective in the management of coal fire crises.
Currently, remote sensing serves as an economical technology for monitoring and mapping land surface temperature (LST), since the latter has a dynamic nature and a widespread occurrence [9,10,11,12,13,14]. With certain temperature threshold determination methods, the LST remote sensing techniques can be applied to the extraction of land surface temperature anomaly (LSTA) zones, as well as the specification of underground coal fire regions [14,15,16]. The traditional coal fire detection methods vary from physical to chemical techniques, including laboratory-based assessments, geophysical exploration, geochemical examination, thermal detection, in situ mapping, and drilling exploration [17,18,19]. They have played an important role in the accurate specification of coal fire events in small areas. Compared with the traditional methods, the LST remote sensing techniques can be utilized in the time-series synchronous characterization of coal fire events by extracting information about land surface temperature anomalies, ground deformation, and ground collapses on a large scale [20,21,22].
This study was carried out at the Daliuta coalfields, Shenmu, Shaanxi, China. It is located between the Loess Plateau and the Mu Us Sandy Land, with a large area of fixed sands and dunes. It is hot and dry during the summer, and the ground objects and land covers (sands, dunes, and bare rocks) with low specific heat capacity warm up rapidly during sunlight hours. The high-temperature ground objects mask the high-thermal-anomaly areas.
In this study, we propose a new threshold-based thermal anomaly recognition method on a large scale. According to the Landsat-9 image capture time and the meteorological records of the target coalfield area, the threshold-based LSTA recognition method is founded based on three hypotheses. In Hypothesis 1, the thermal anomaly is assumed to be caused by an underground coal fire and is continuously heated, resulting in a higher temperature than that of the nearby areas. In Hypothesis 2, the thermal anomaly is more significant in winter than in summer. In Hypothesis 3, the temperatures (Celsius) of the thermal anomaly areas in the cold season are higher than zero degrees Celsius, the average temperature during the day, and the temperature at 11 o’clock in the day. Additionally, multiple satellite images from November to February (of the next year) were integrated to enhance the accuracy of the LSTA results.
The LSTA points and topographical indexes were synthesized into the overlay analysis, and their relationships were constructed. The objectives of this study were to achieve the following: (1) quantify the LSTA zones of the Daliuta coalfields and (2) specify the relationships between the topography and temperature indexes of the study area.

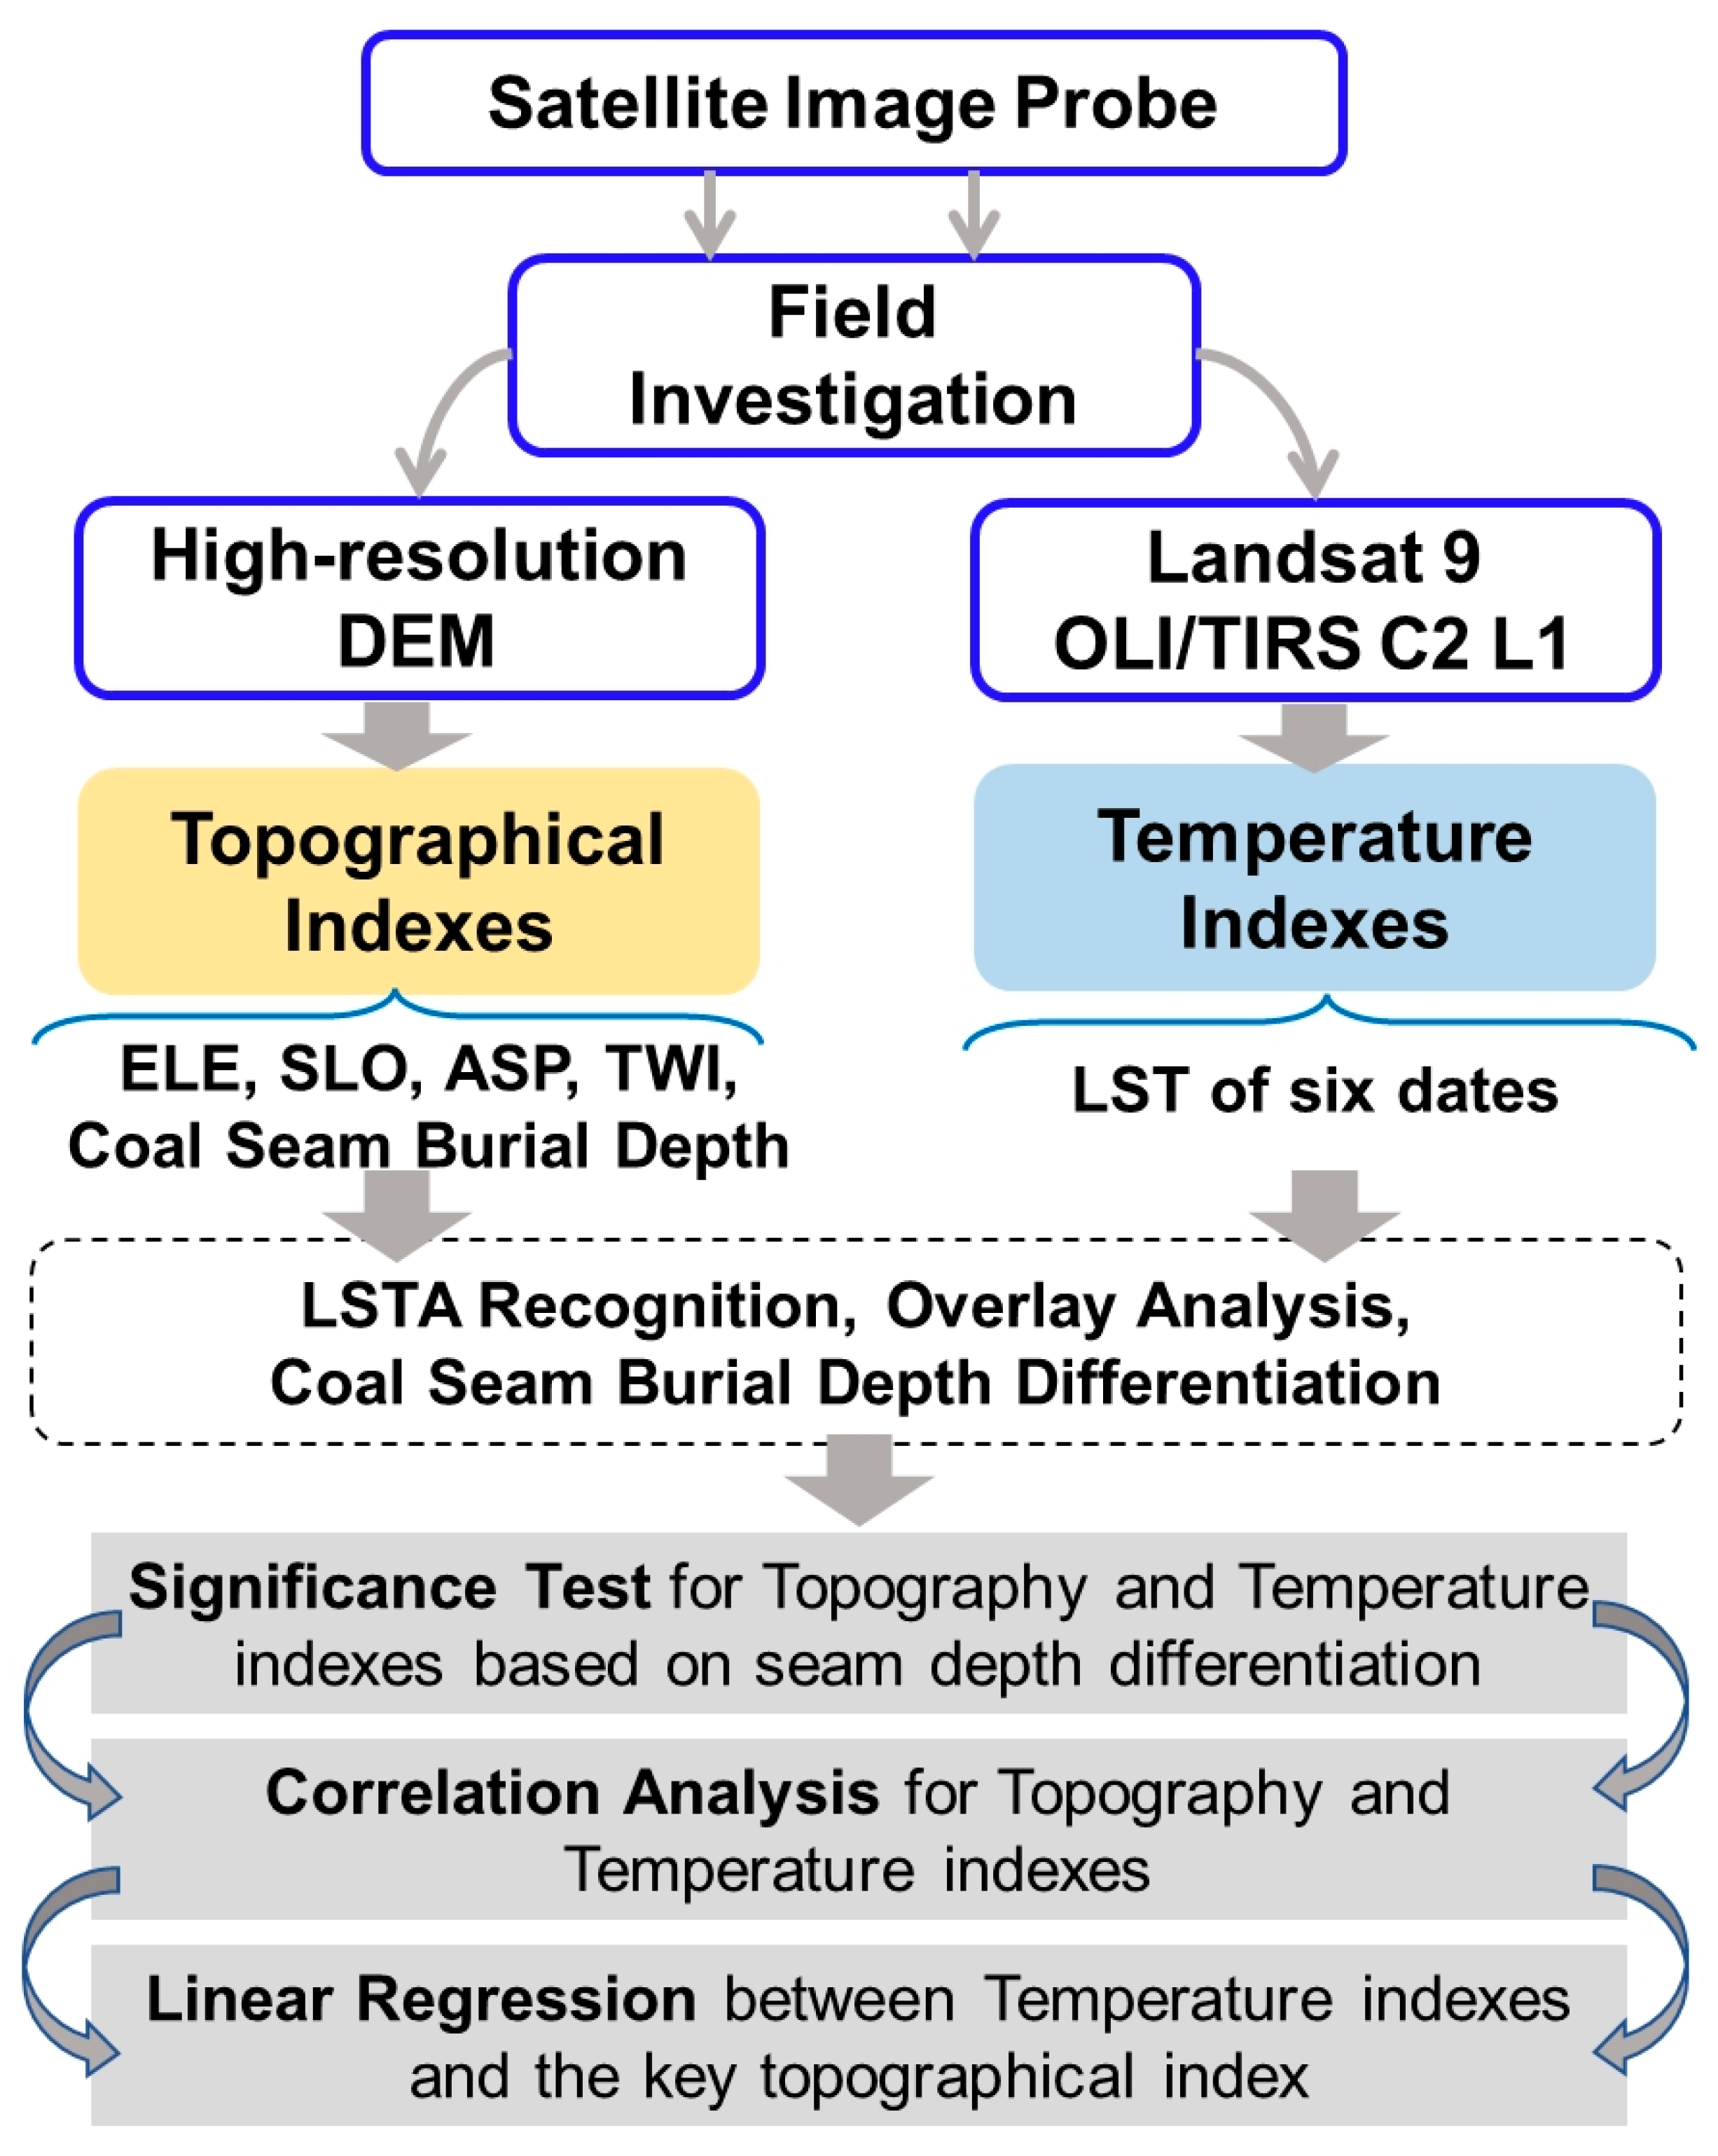
2. Materials and Methods
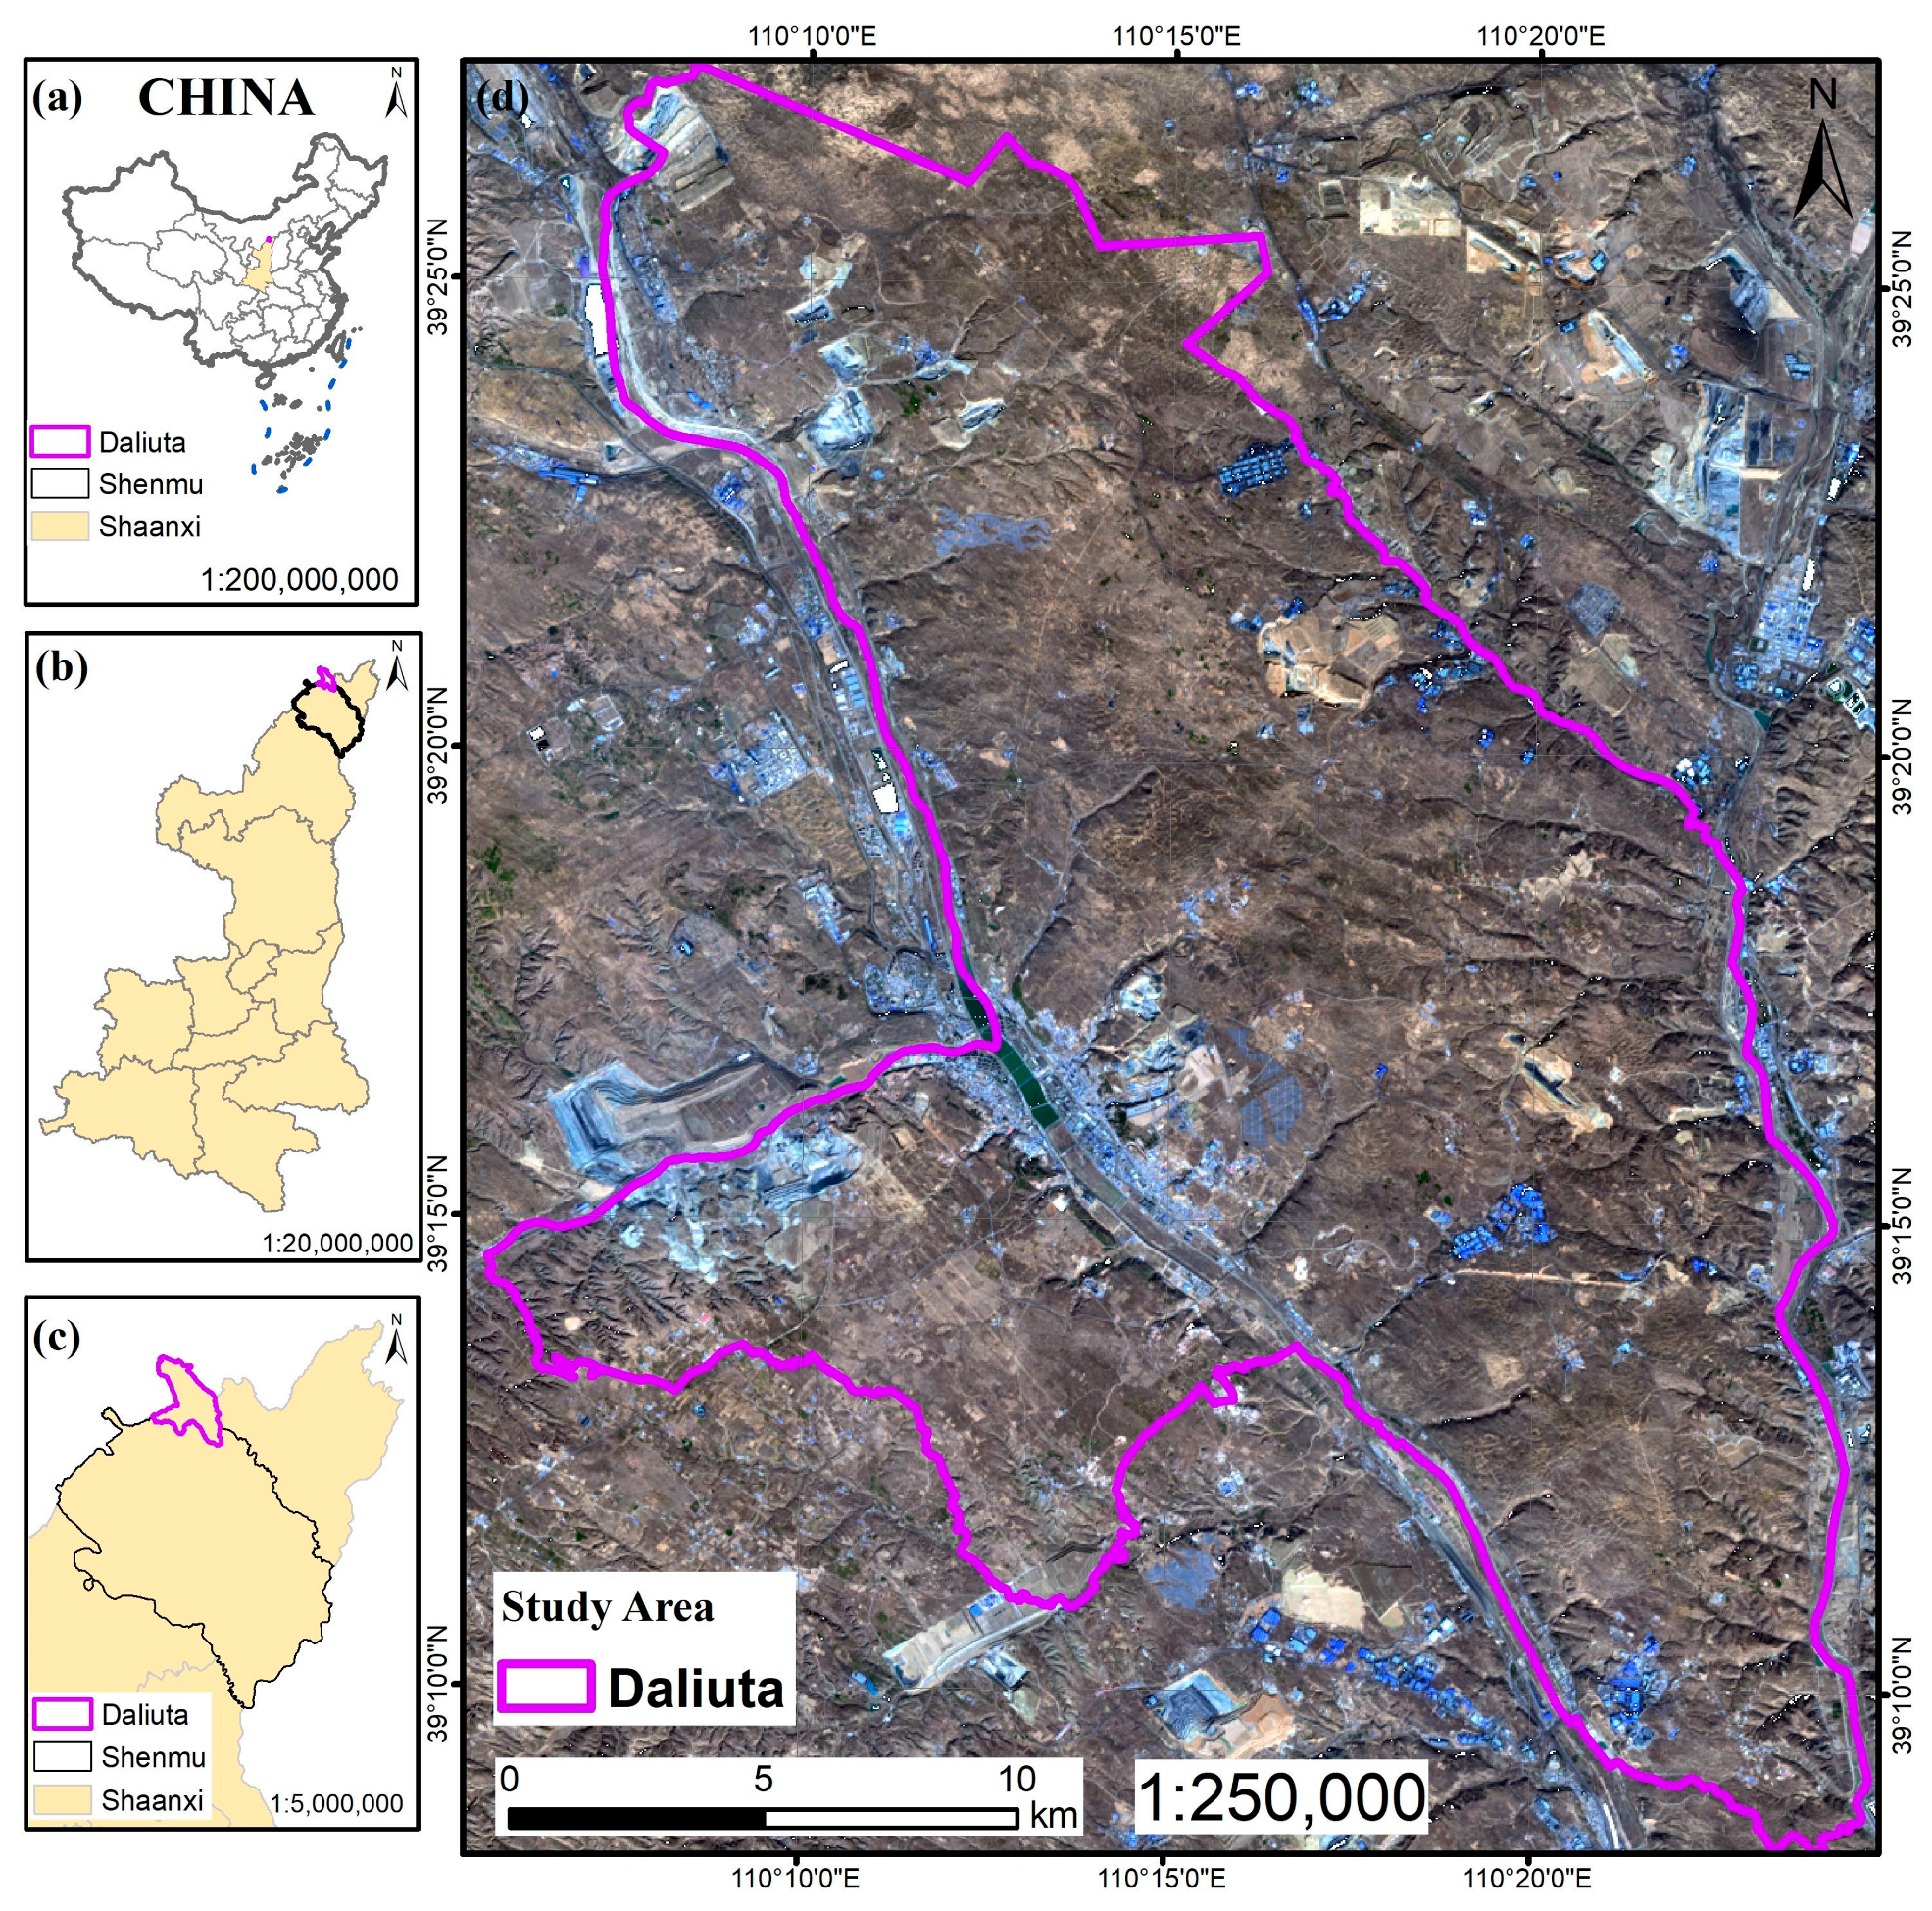
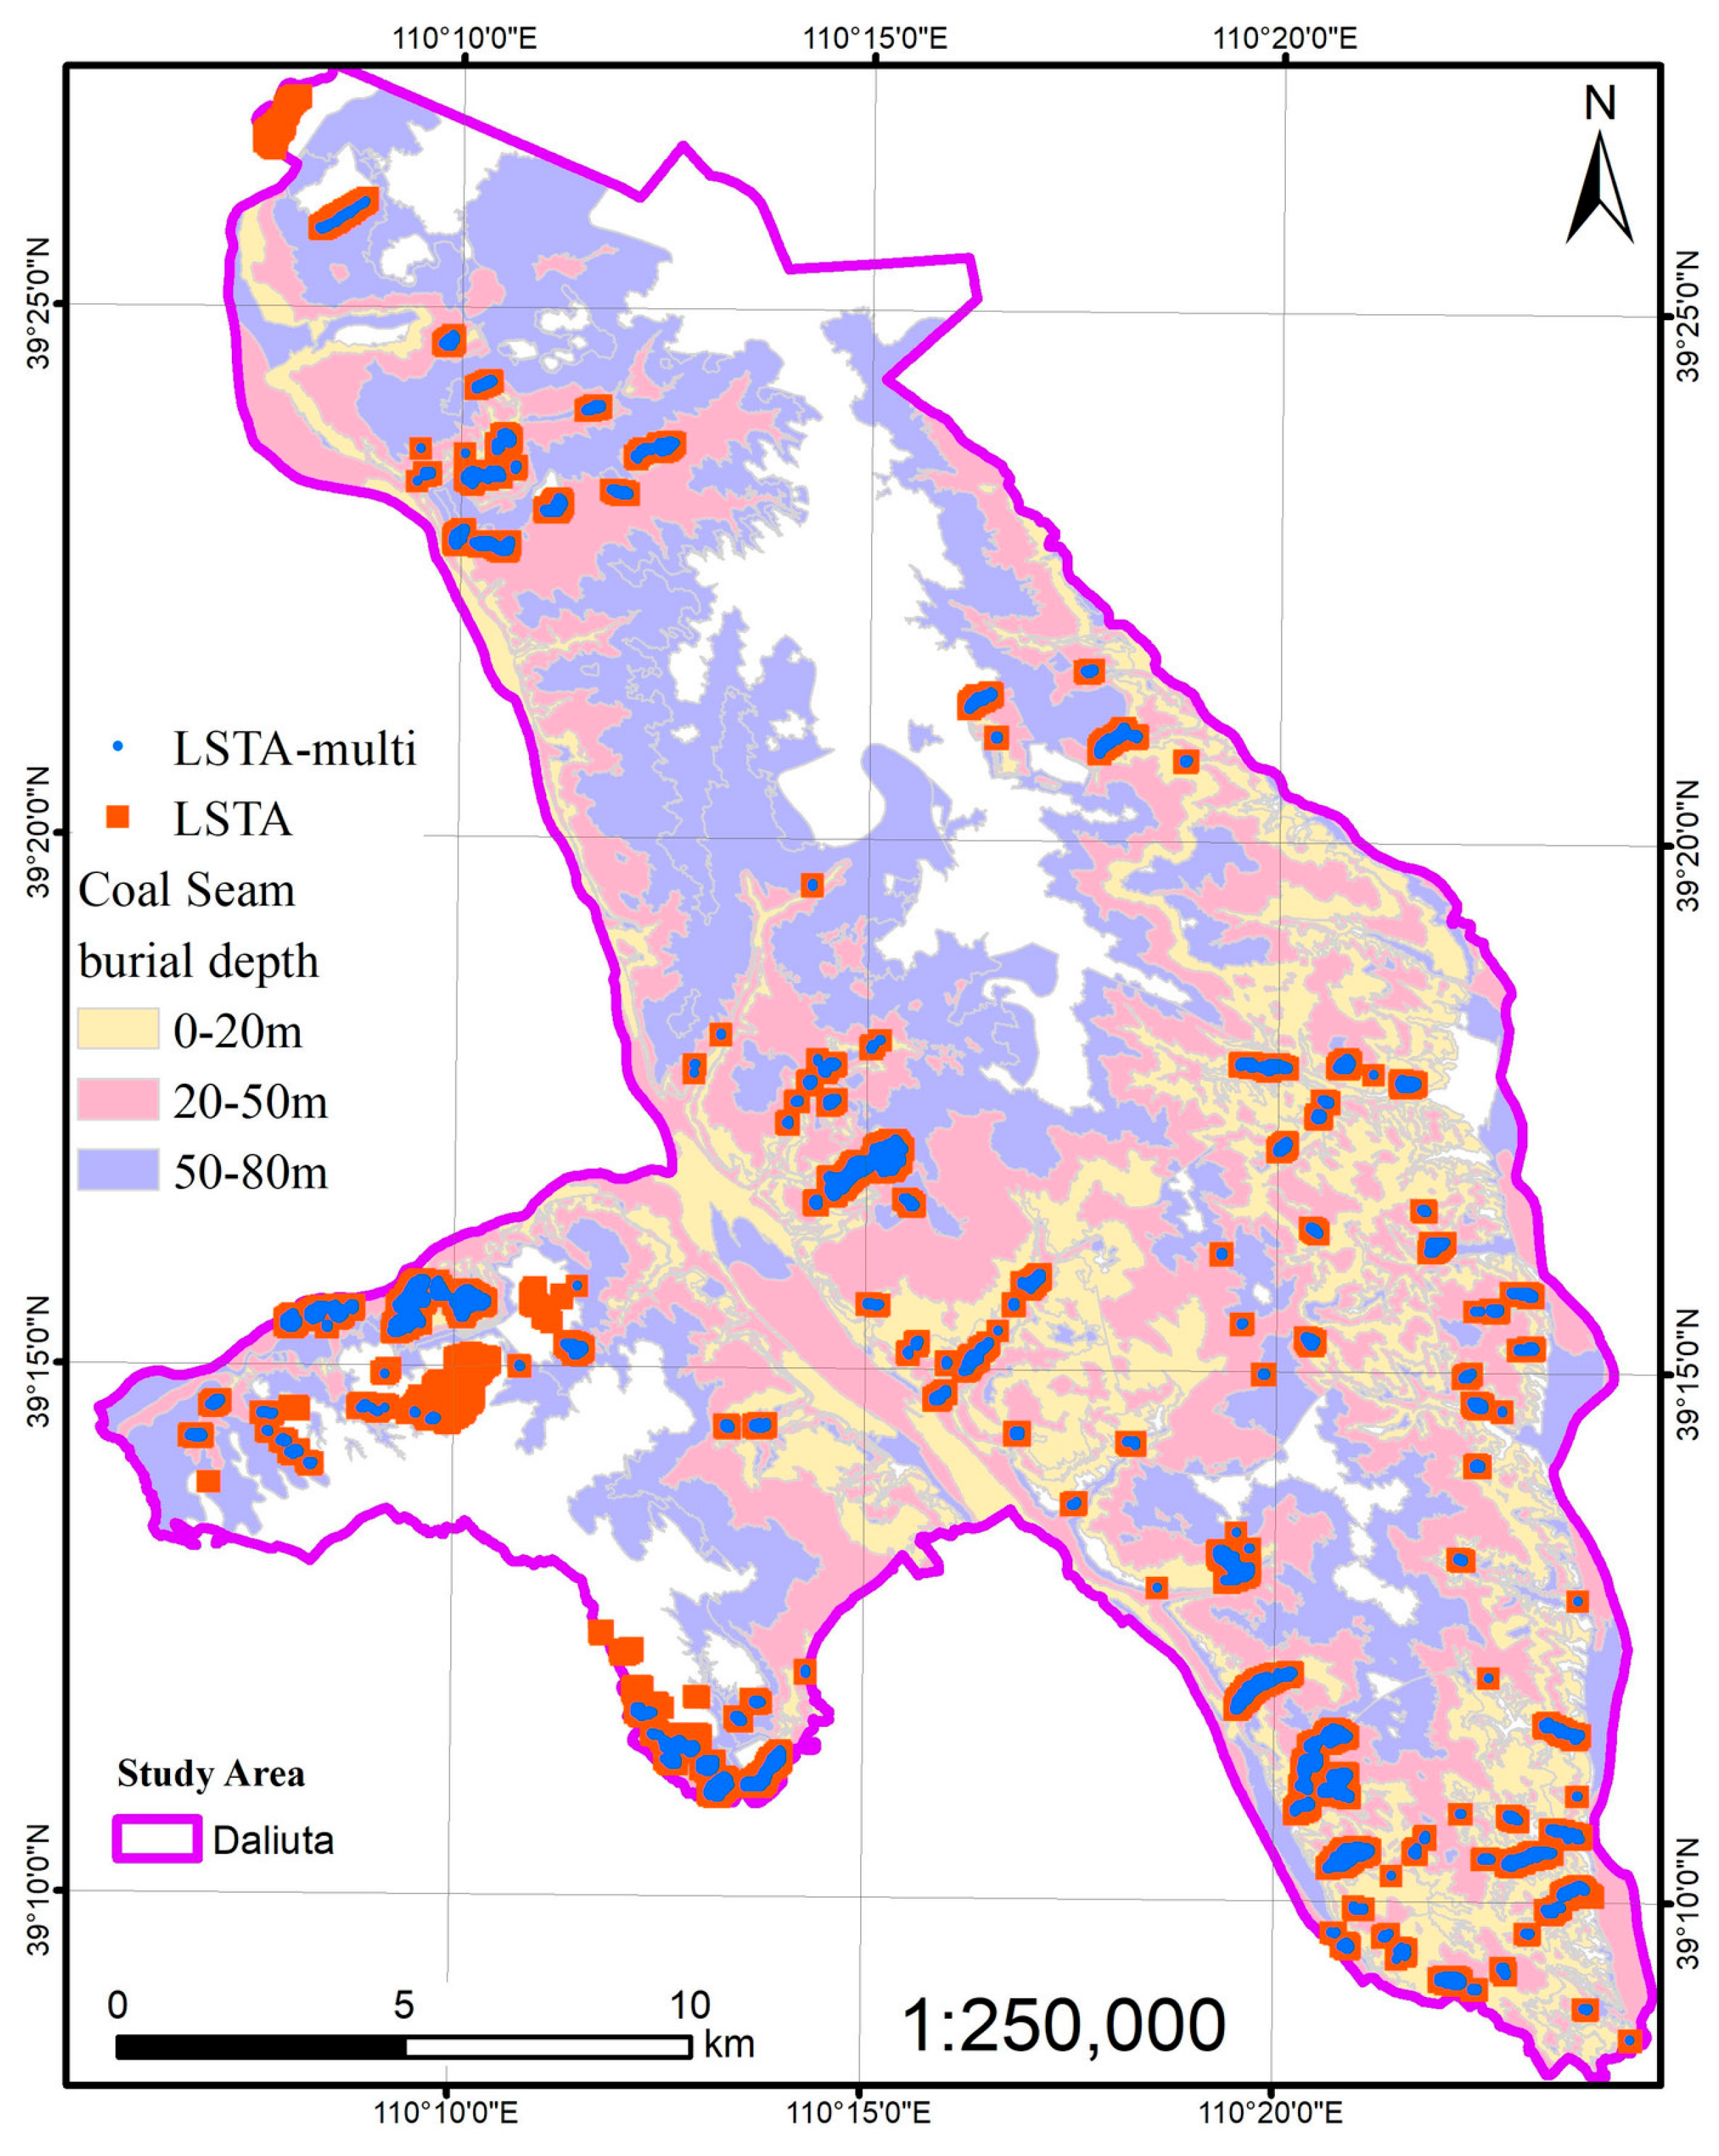
2.1. Study Area

This study was conducted in Daliuta coalfields (Figure 1), which are located in Shenmu County, Shaanxi Province, China. They are located between the Loess Plateau and the Mu Us Sandy Land, with a total area of 448.90 km2. Daliuta experiences a semi-arid continental monsoon climate and its annual temperatures vary from −28 to 38 °C, with precipitations varying from 251.3 to 646.5 mm [23]. The study area is hot and dry from June to September and it can be freezing cold from November to February.
The study area exhibits seven distinct land use/cover types: farmland, shrubland, grassland, water bodies, bare land, sandy land, and mining areas. Notably, psammophyte vegetation (predominantly Artemisia and Salix species) constitutes the dominant vegetation cover, primarily established on stabilized sands and dune formations. The Daliuta coalfields present simple structural geology with flat-lying, medium-thickness bituminous seams in the terrestrial Jurassic Yan’an Formation. These shallow coal resources are amenable to efficient longwall mining operations [24].
The Daliuta coalfields were inaugurated in 1986 and put into production in 1993. The geological reserves of Daliuta coalfields are 1419.1 million tons, with a recoverable reserve of 993.4 million tons and an estimated service life of 118 years [23].
Figure 2 reveals the workflow of characterizing the effects of topography on the land surface temperature anomaly in Daliuta coalfields. The Gaofen-2 (GF-2) images and ASTER GDEM V2 DEM data were utilized in the incipient exploration of Daliuta coalfields in July 2023. We used the Gaofen-2 images to delineate the general range of the study area. And a coarse outline of the altitude background was established with the ASTER GDEM V2 DEM (30 × 30 m) data. These two datasets were provided by the Geospatial Data Cloud site, Computer Network Information Center, Chinese Academy of Sciences (http://www.gscloud.cn, accessed on 20 June 2023). After that satellite image investigation in the summer of 2023, a field investigation was performed in the Daliuta coalfields in October 2023. Through collaboration with local authorities and academic institutions, we enhanced our geospatial database by acquiring high-resolution digital elevation models (DEMs) and multispectral imagery datasets. The newly generated high-resolution spatial delineation of the Daliuta coalfields (Figure 1d) served as the cornerstone for this investigation, enabling precise analysis of thermal anomalies and land surface changes.
The topographical indexes, including elevation, slope, aspect, topographical wetness index, were generated from high-resolution DEM data. The coal seam burial depth data were provided by the local authorities. Land surface temperature (LST) of six periods was generated from the Landsat-9 OLI/TIRS C2 L1 product. We used threshold-based methods to recognize the thermal anomalies in the LST results. The topographical and temperature indexes were integrated in the GIS overlay analysis, and, subsequently, a series of statistical procedures were commenced.

2.2. Datasets

2.2.1. DEM

The ASTER GDEM V2 DEM (30 × 30 m) data, from the Geospatial Data Cloud site, were used to establish a coarse altitude background of the Daliuta coalfields. The high-resolution DEM (2 × 2 m) was provided by the local authorities, which was the fusion product of reconstructed DEM from UAV-based Digital Aerial Photogrammetry (DAP) techniques. All the basic topographical indexes were derived from a high-resolution 2-meter DEM using standard geomorphometric algorithms in ArcGIS 10.6.

2.2.2. Landsat-9

Six scenes of Landsat-9 OLI/TIRS multispectral images over the study area, collected on 1 November 2022, 17 November 2022, 19 December 2022, 4 January 2023, 20 January 2023, 5 February 2023, were used to retrieve land surface temperature. These images were downloaded from the Landsat Collection 2 Level-1 Product Bundle, from the EarthExplorer of USGS (https://earthexplorer.usgs.gov/, accessed on 20 June 2023).
The scene center time of the above six scenes was 03:19 Greenwich Mean Time, which was 11:19 local time (24 h system) in Daliuta coalfields. According to the Landsat-9 image capture time and the meteorological records of the study area, we proposed a new threshold-based land surface temperature anomaly (LSTA) recognition method on a large scale. Multiple images from November to February (of the next year) were integrated to enhance the accuracy of the LSTA results.
The study area is dry and hot from June to September, and the ground objects (sand, dunes, and bare rock) with low heat capacity heat up rapidly. It conceals the abnormal high-temperature areas, which were probably induced by underground coal fire. However, the Daliuta study area is cold-prone from November to February, and the land surface thermal anomaly zones can be distinguished from surrounding ground features. Considering the appropriate winter season and image cloud coverage (<6%), we chose six scenes of Landsat-9 OLI/TIRS multispectral images of the above six dates during the winter season.
The satellite image investigation and land surface temperature retrieving procedures were initiated in July 2023. We processed the latest Landsat-9 images of that time, the six dates aforesaid from 1st November 2022 to 5th February 2023. We tried the Landsat Collection 2 Level-2 Science Products, which include scene-based global surface reflectance and surface temperature image products. However, the Level-2 Science Products had not updated the surface temperature products of the Daliuta area for all those six dates. Therefore, we unified the land surface temperature retrieving methodology with the plausible validated Landsat LST tool from the ENVI App Store of the ENVI software (version 5.3.1), based on the images downloaded from the Landsat Collection 2 Level-1 Product Bundle.

2.3. Topographical and Temperature Indexes

2.3.1. Topographical Indexes

The high-resolution DEM (2 × 2 m) was provided by the local authorities, which was the fusion product of reconstructed DEM from UAV-based DAP methods. The basic topographical indexes, including elevation, slope, aspect, and relative elevation, were calculated using spatial analyst tools in ArcGIS 10.6 (https://www.arcgis.com), and the topographic wetness index (TWI) was computed in SAGA GIS (version 7.5.0) (http://www.saga-gis.org/, http://saga-gis.sourceforge.net/en/) [25]. The relative elevation is defined as the difference between the elevation and the lowest altitude within the Daliuta coalfields.
Based on the coal seam burial depth data, three layers of seam depth in the Daliuta coalfields were classified: (1) burial depth of 0–20 m; (2) burial depth of 20–50 m; (3) burial depth of 50–80 m.
TWI is extensively utilized in topographical analysis and is associated with the spatial and size distribution of saturation zones or variable source areas that contribute to runoff generation [26,27,28]. TWI is calculated from the specific catchment area (α) of the upper slope and local slope (tanβ) [29]. In this study, the standard computing method of TWI was applied, which was calculated based on the equation of ln (α/tanβ) [26,28].

2.3.2. Temperature Indexes

The temperature indexes comprised the land surface temperature (LST) retrieved on six specific dates: 1 November 2022; 17 November 2022; 19 December 2022; 4 January 2023; 20 January 2023; and 5 February 2023.
The LST indexes were computed based on the images downloaded from Landsat Collection 2 Level-1 Products. We installed an official module, ENVI App Store (https://envi.geoscene.cn/appstore/), into the ENVI software mainframe (version 5.6.3), and we used the Landsat LST tool from the ENVI App Store to calculate land surface temperature results. The Landsat LST tool has combined atmospheric correction processes, using the atmospheric parameters from the Atmospheric Correction Parameter Calculator website, which was developed and maintained by NASA scientists and engineers [30,31] (https://atmcorr.gsfc.nasa.gov/). The atmospheric correction was performed and the NDVI data were utilized in the retrieving procedure.
The Daliuta boundary dataset served as the spatial extraction mask for LST products. Consequently, six time-series LST datasets (LST20221101, LST20221117, LST20221219, LST20230104, LST20230120, LST20230205) covering the Daliuta coalfields were successfully generated.

2.3.3. Threshold-Based LSTA Recognition Method

Through integrated analysis of satellite imagery and meteorological records, we identified November through February of the subsequent year as the optimal observation window for land surface temperature anomalies (LSTAs) in the study area. This temporal selection led us to hypothesize that the detected LSTA patterns likely originated from underground coal fires.
The Landsat-9 image scene center time of the Daliuta study area was 11:19 local time (24 h system); hence, the LST results were basically the ground temperature of the eleven o’clock local time. During the winter season, the LSTA ground temperature should be higher than the average temperature and the eleven o’clock temperature in the day.
The LSTA zones were recognized with the threshold-based method, which was established based on three hypotheses. In Hypothesis 1, the thermal anomaly is assumed to be caused by an underground coal fire and is continuously heated, resulting in a higher temperature than that of the nearby areas. In Hypothesis 2, the thermal anomaly is more significant in winter than in summer. In Hypothesis 3, the temperature (Celsius) of the thermal anomaly areas in the cold season is higher than zero degrees Celsius, the average temperature during the day, and the temperature at 11 o’clock in the day.
The six LST results were integrated and converted from raster into matrix data, and the threshold-based methods were executed. Subsequently, 5978 LSTA points were selected. The LSTA points and topographical indexes were integrated into the overlay analysis, and the coal seam burial depth data were used to exclude the anomalies outside of the coal seam zones. Through this integrated analytical approach, we identified 4489 multi-parameter LSTA points, each characterized by both topographic attributes and thermal properties. Consequently, we conducted a series of statistical analyses on the 4489 multi-parameter LSTA point data to quantitatively examine the relationships between the topographic characteristics and thermal indexes.

2.4. Statistical Analysis

The 4489 multi-parameter LSTA points were selected and converted into a matrix, containing both topographic characteristics and thermal indexes. The significance test (Wilcoxon test, α = 0.05), correlation analysis (Pearson method), and linear regression were performed with the multi-data matrix to quantify the relationships between the topographical and temperature indexes. The Wilcoxon test (α = 0.05) [32,33] was performed with the integrated observations to verify the differences of topographical and temperature indexes among the paired coal seam burial depths. The null hypothesis was that the paired seam depth layers have the same data distribution as the topographical or temperature index, and the alternative hypothesis was that the paired seam depth layers are different in the topographical or temperature data distribution. The above statistical analyses were conducted in RStudio (version 2024.04.1 + 748, http://www.rstudio.com/) with R (version 4.4.0, https://www.R-project.org/) [34,35].

3. Results

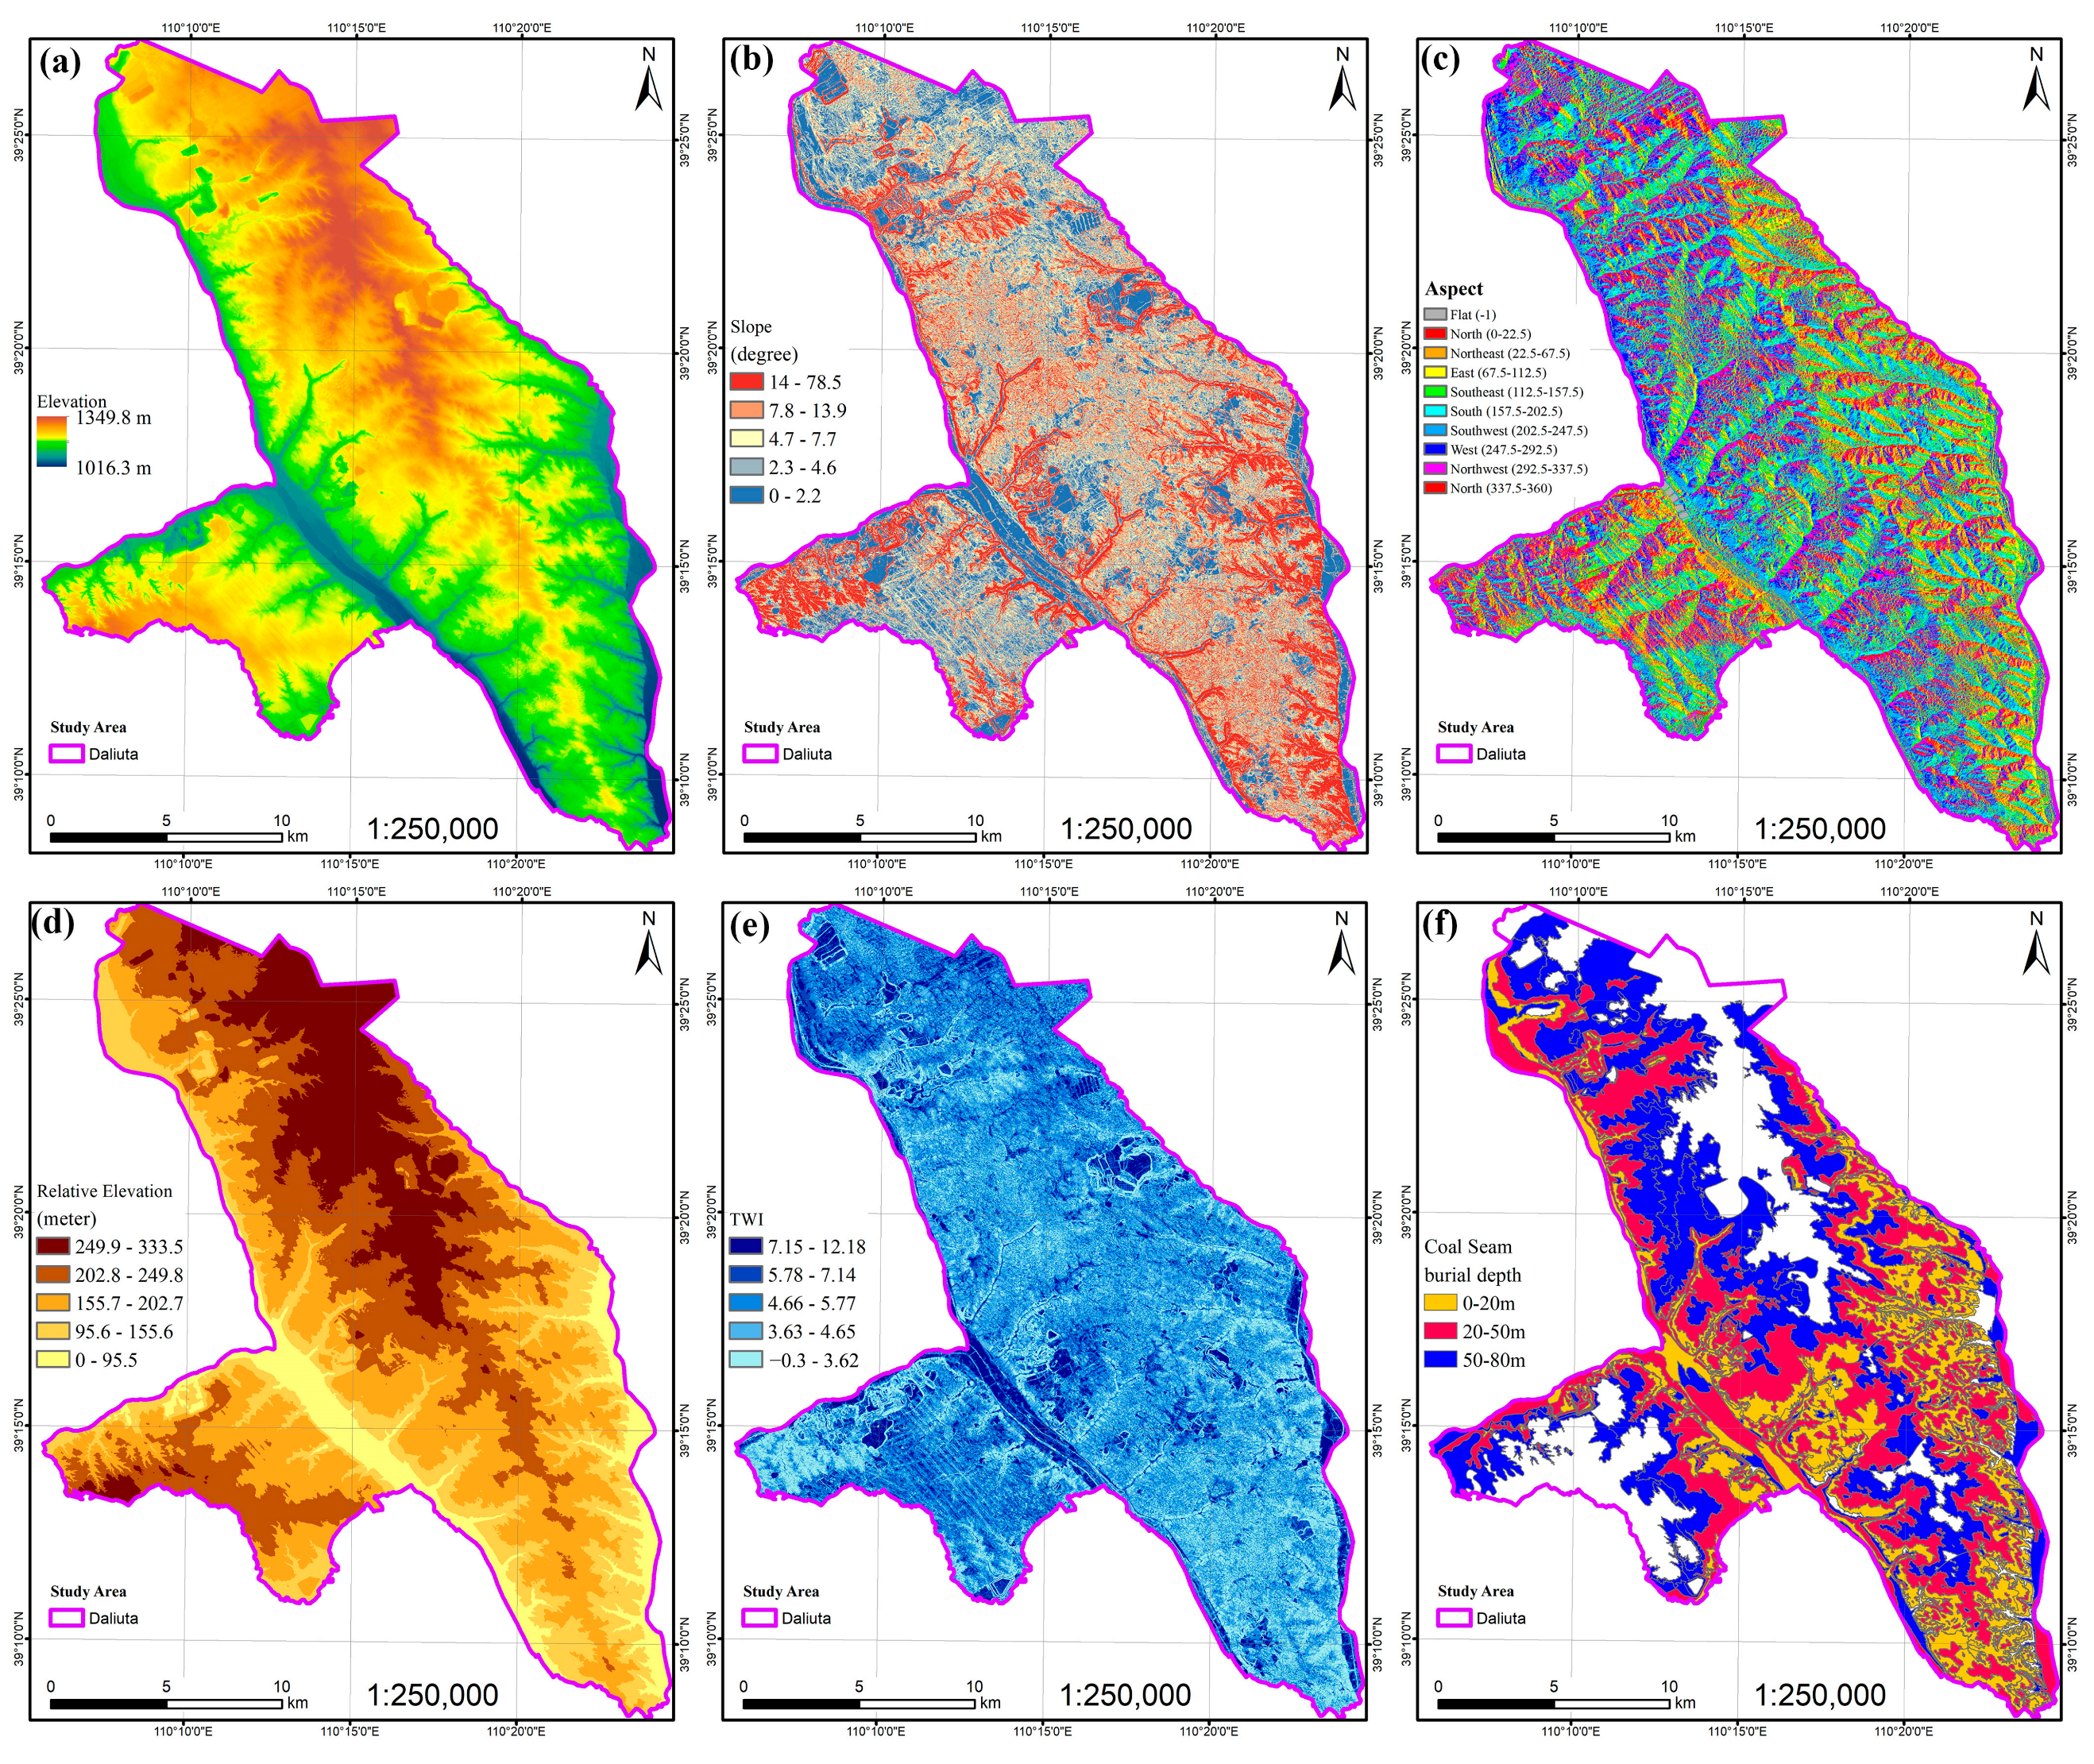
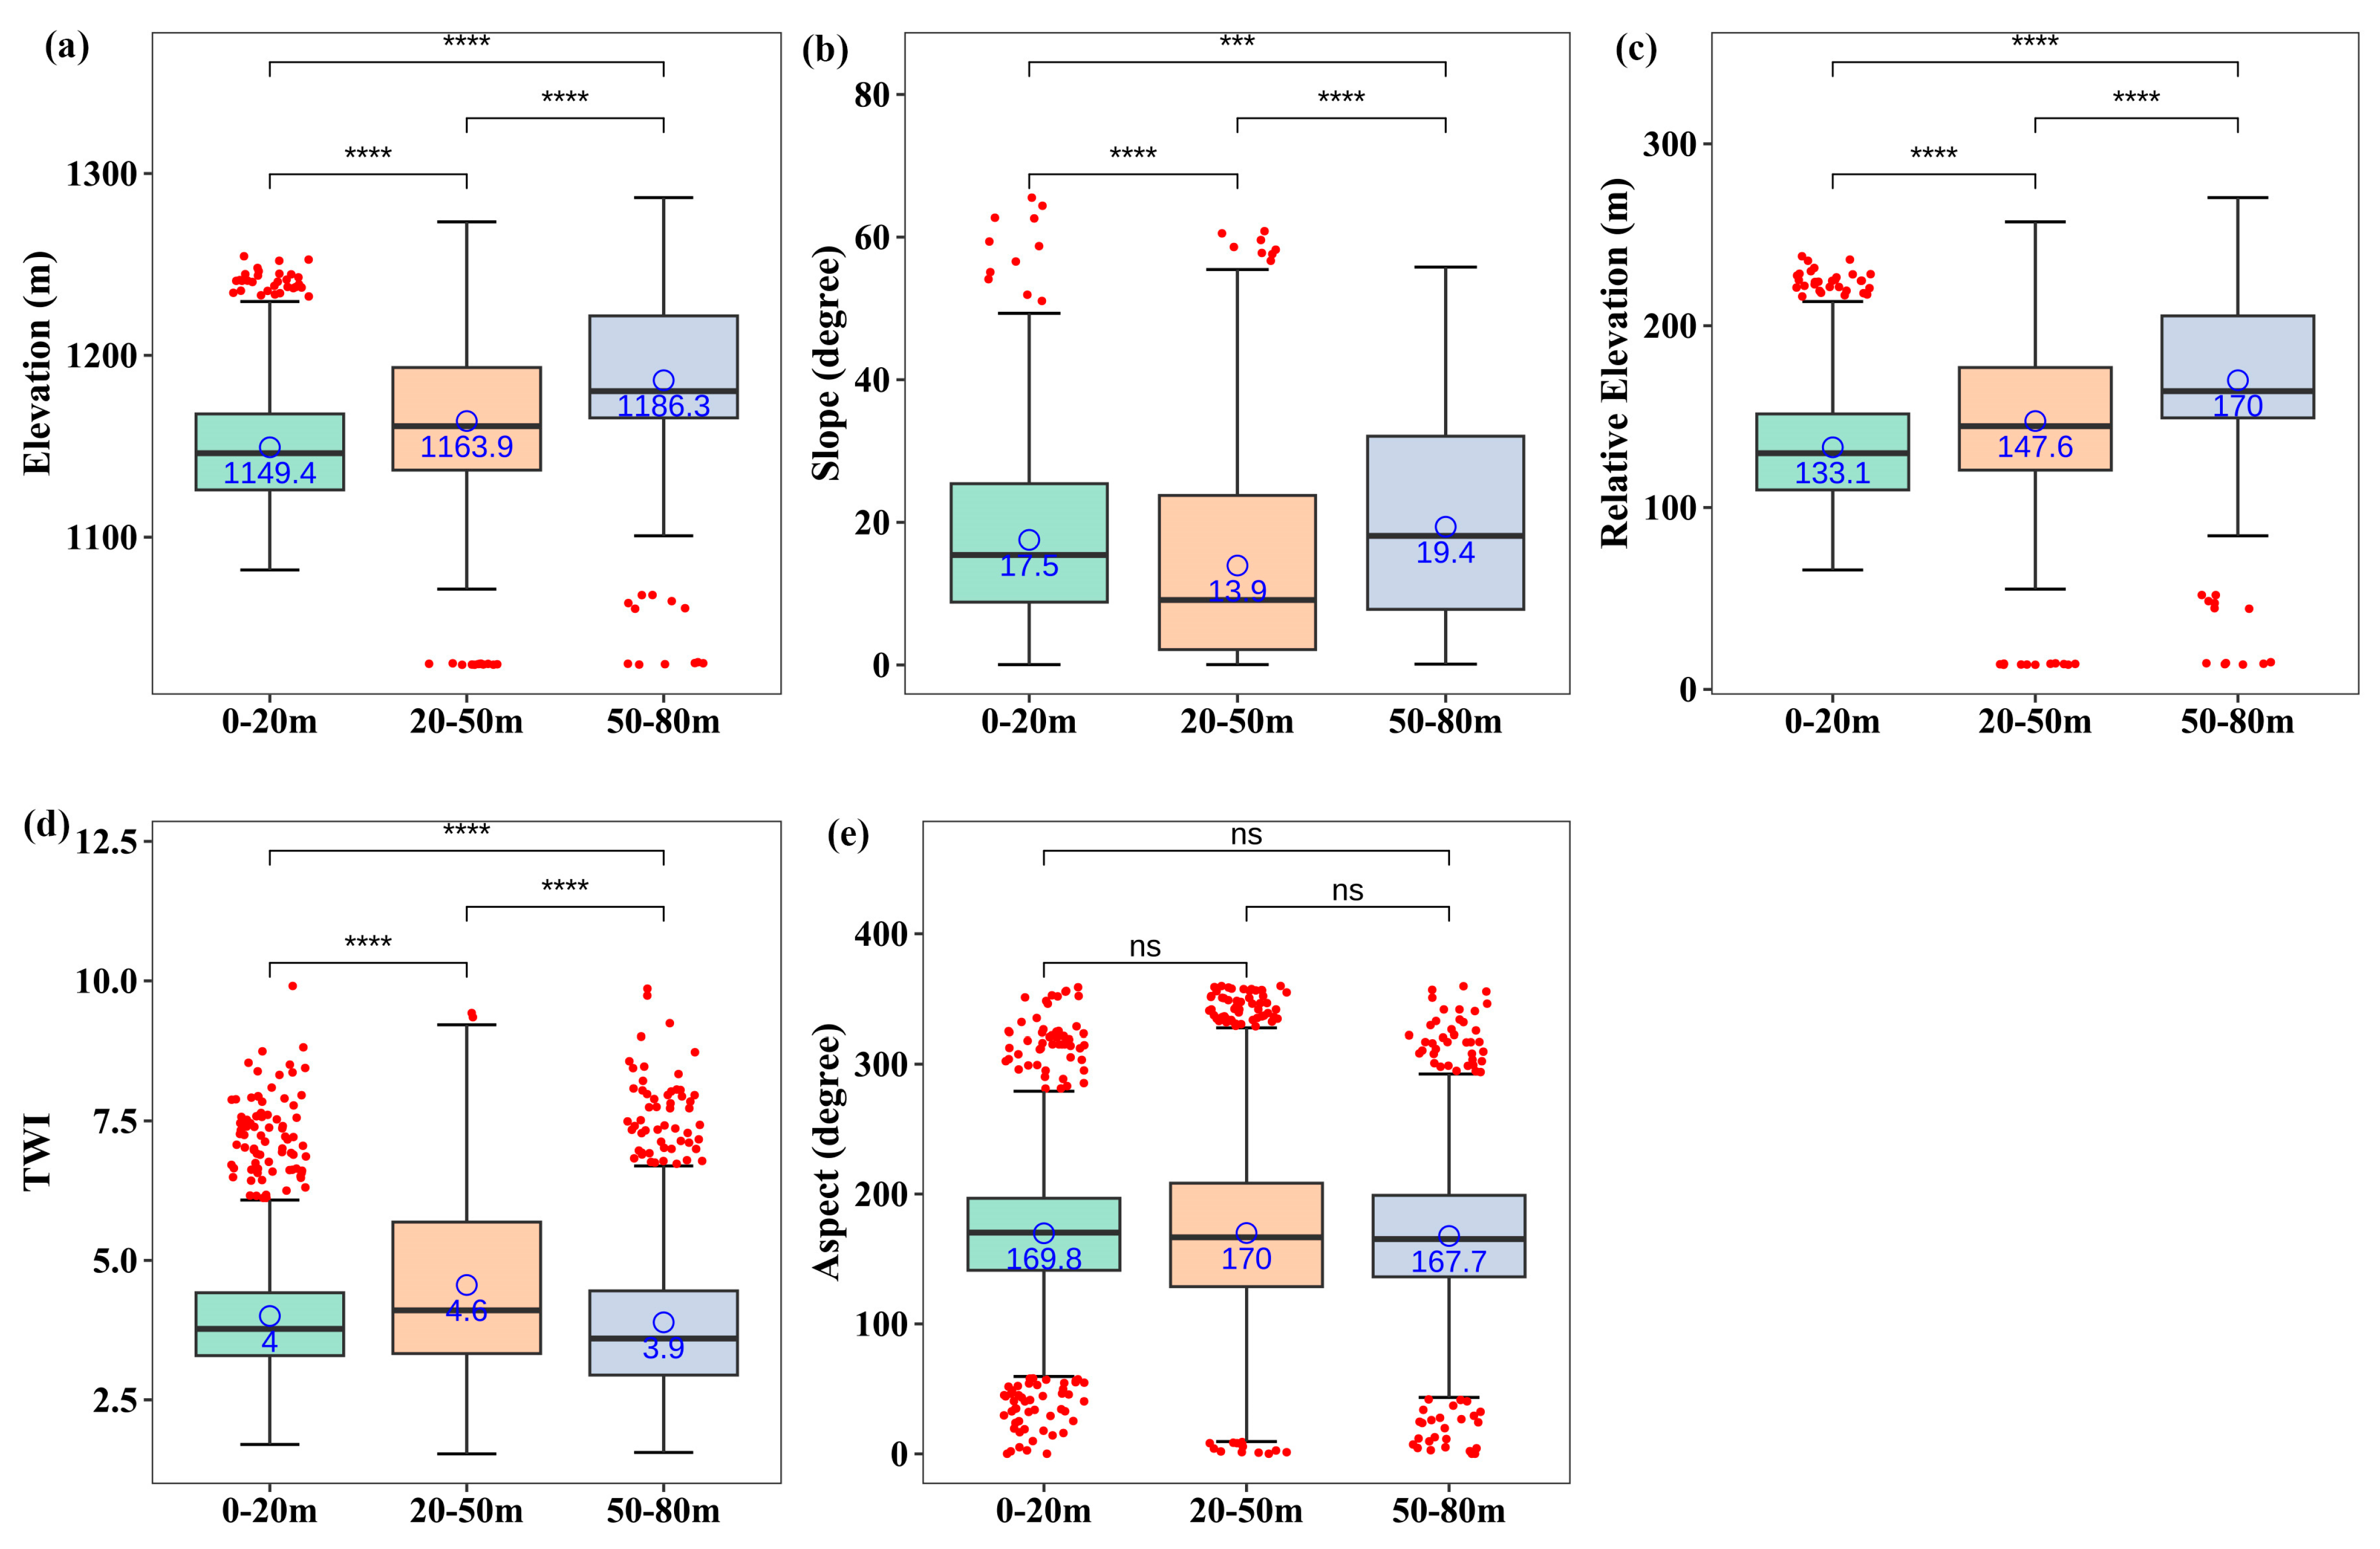
3.1. Topographical Indexes of the Study Area

High-resolution DEM data were processed to derive the spatial distributions of key topographic indexes, including elevation, slope gradient, aspect orientation, relative elevation, and topographic wetness index (TWI) (Figure 3). These geomorphometric variables were subsequently integrated with coal seam burial depth data for comprehensive spatial analysis.
The elevation of the Daliuta coalfields ranges from 1016.3 to 1349.8 m (Figure 3a). The relative elevation within the study area exhibits a range of 0–333.5 m, which we classified into five distinct intervals using natural breaks classification: Class I (0–95.5 m), Class II (95.6–155.6 m), Class III (155.7–202.7 m), Class IV (202.8–249.8 m), and Class V (249.9–333.5 m) (Figure 3d). This stratification effectively captures the topographic variability across the coal fire-affected terrain.
Slope gradients across the study area ranged from 0° to 78.5°, which we classified into five distinct categories using natural breaks optimization: Class I (0–2.2°; nearly level), Class II (2.3–4.6°; very gentle), Class III (4.7–7.7°; gentle), Class IV (7.8–13.9°; moderately steep), and Class V (14–78.5°; steep to very steep) (Figure 3b). This classification scheme efficiently delineates the complete geomorphic diversity of the terrain.
The TWI distribution exhibited distinct slope-dependent characteristics, as shown in Figure 3e. Our analysis revealed a strong inverse relationship between slope gradient and TWI values, with flatter terrain consistently demonstrating higher moisture accumulation potential.
Figure 3c shows that the distribution in each direction is relatively balanced. Figure 3f shows that three layers of coal seam burial depth in the Daliuta coalfields are classified as follows: (1) burial depth of 0–20 m; (2) burial depth of 20–50 m; (3) burial depth of 50–80 m.

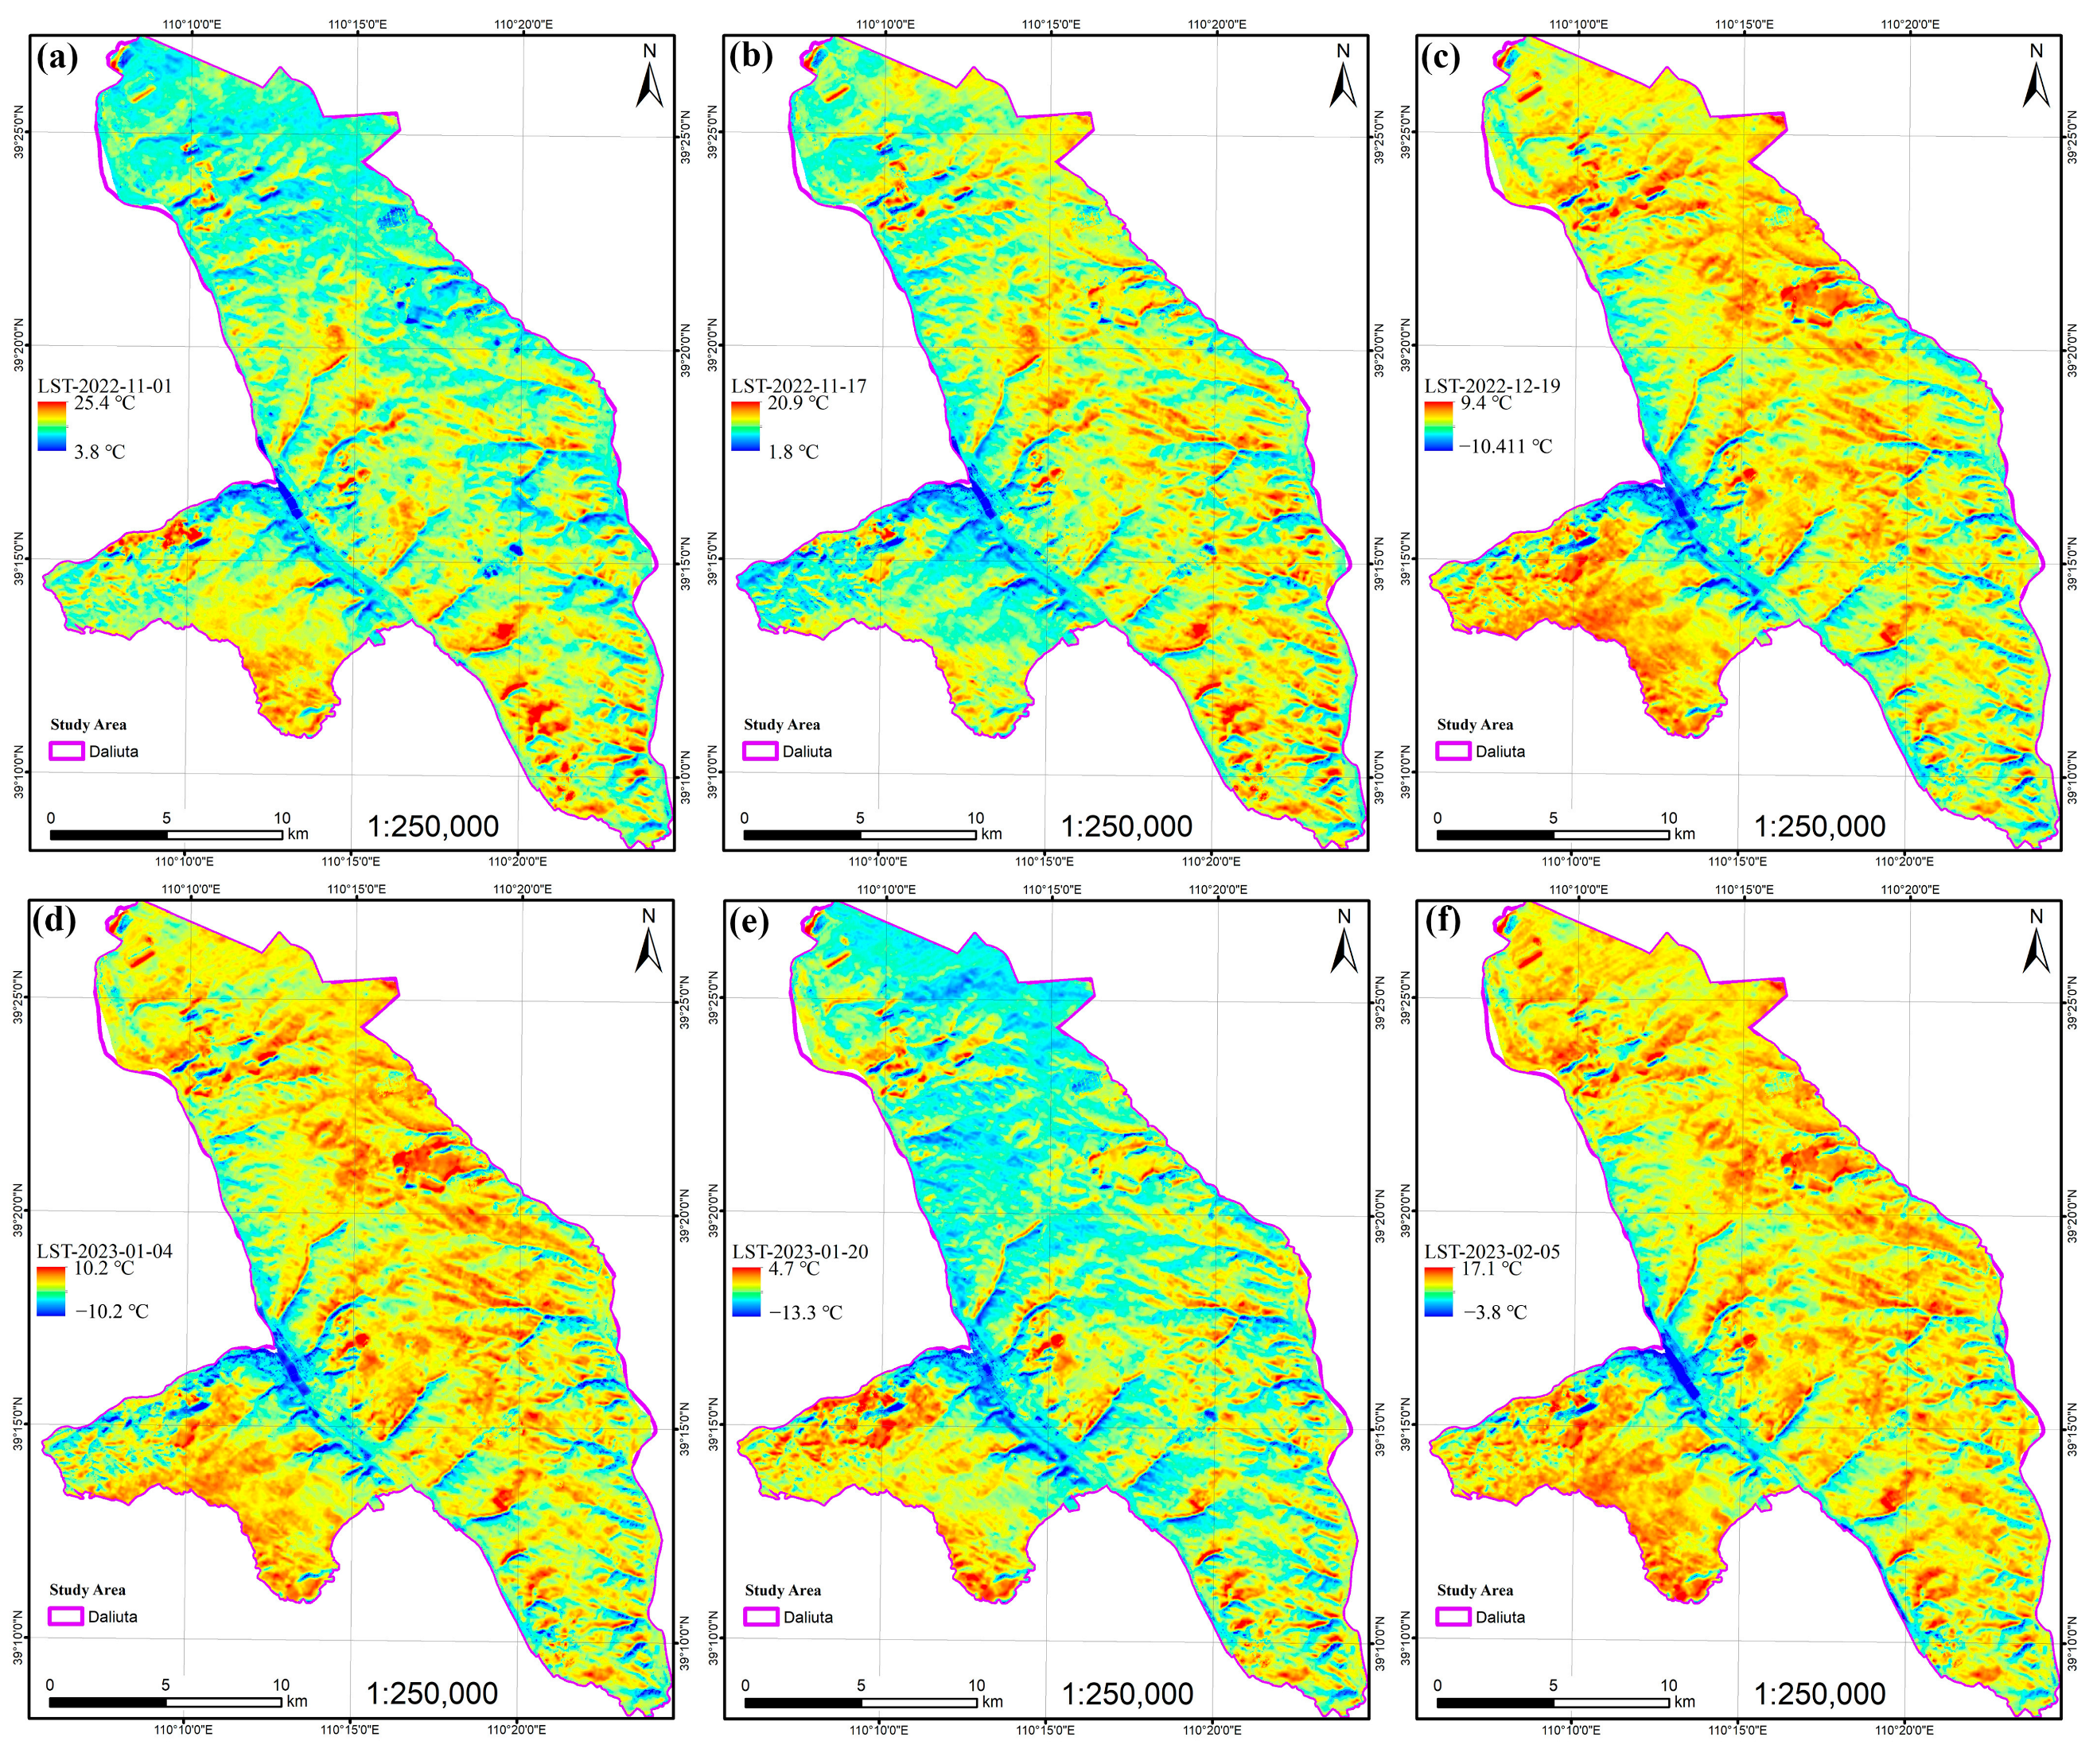
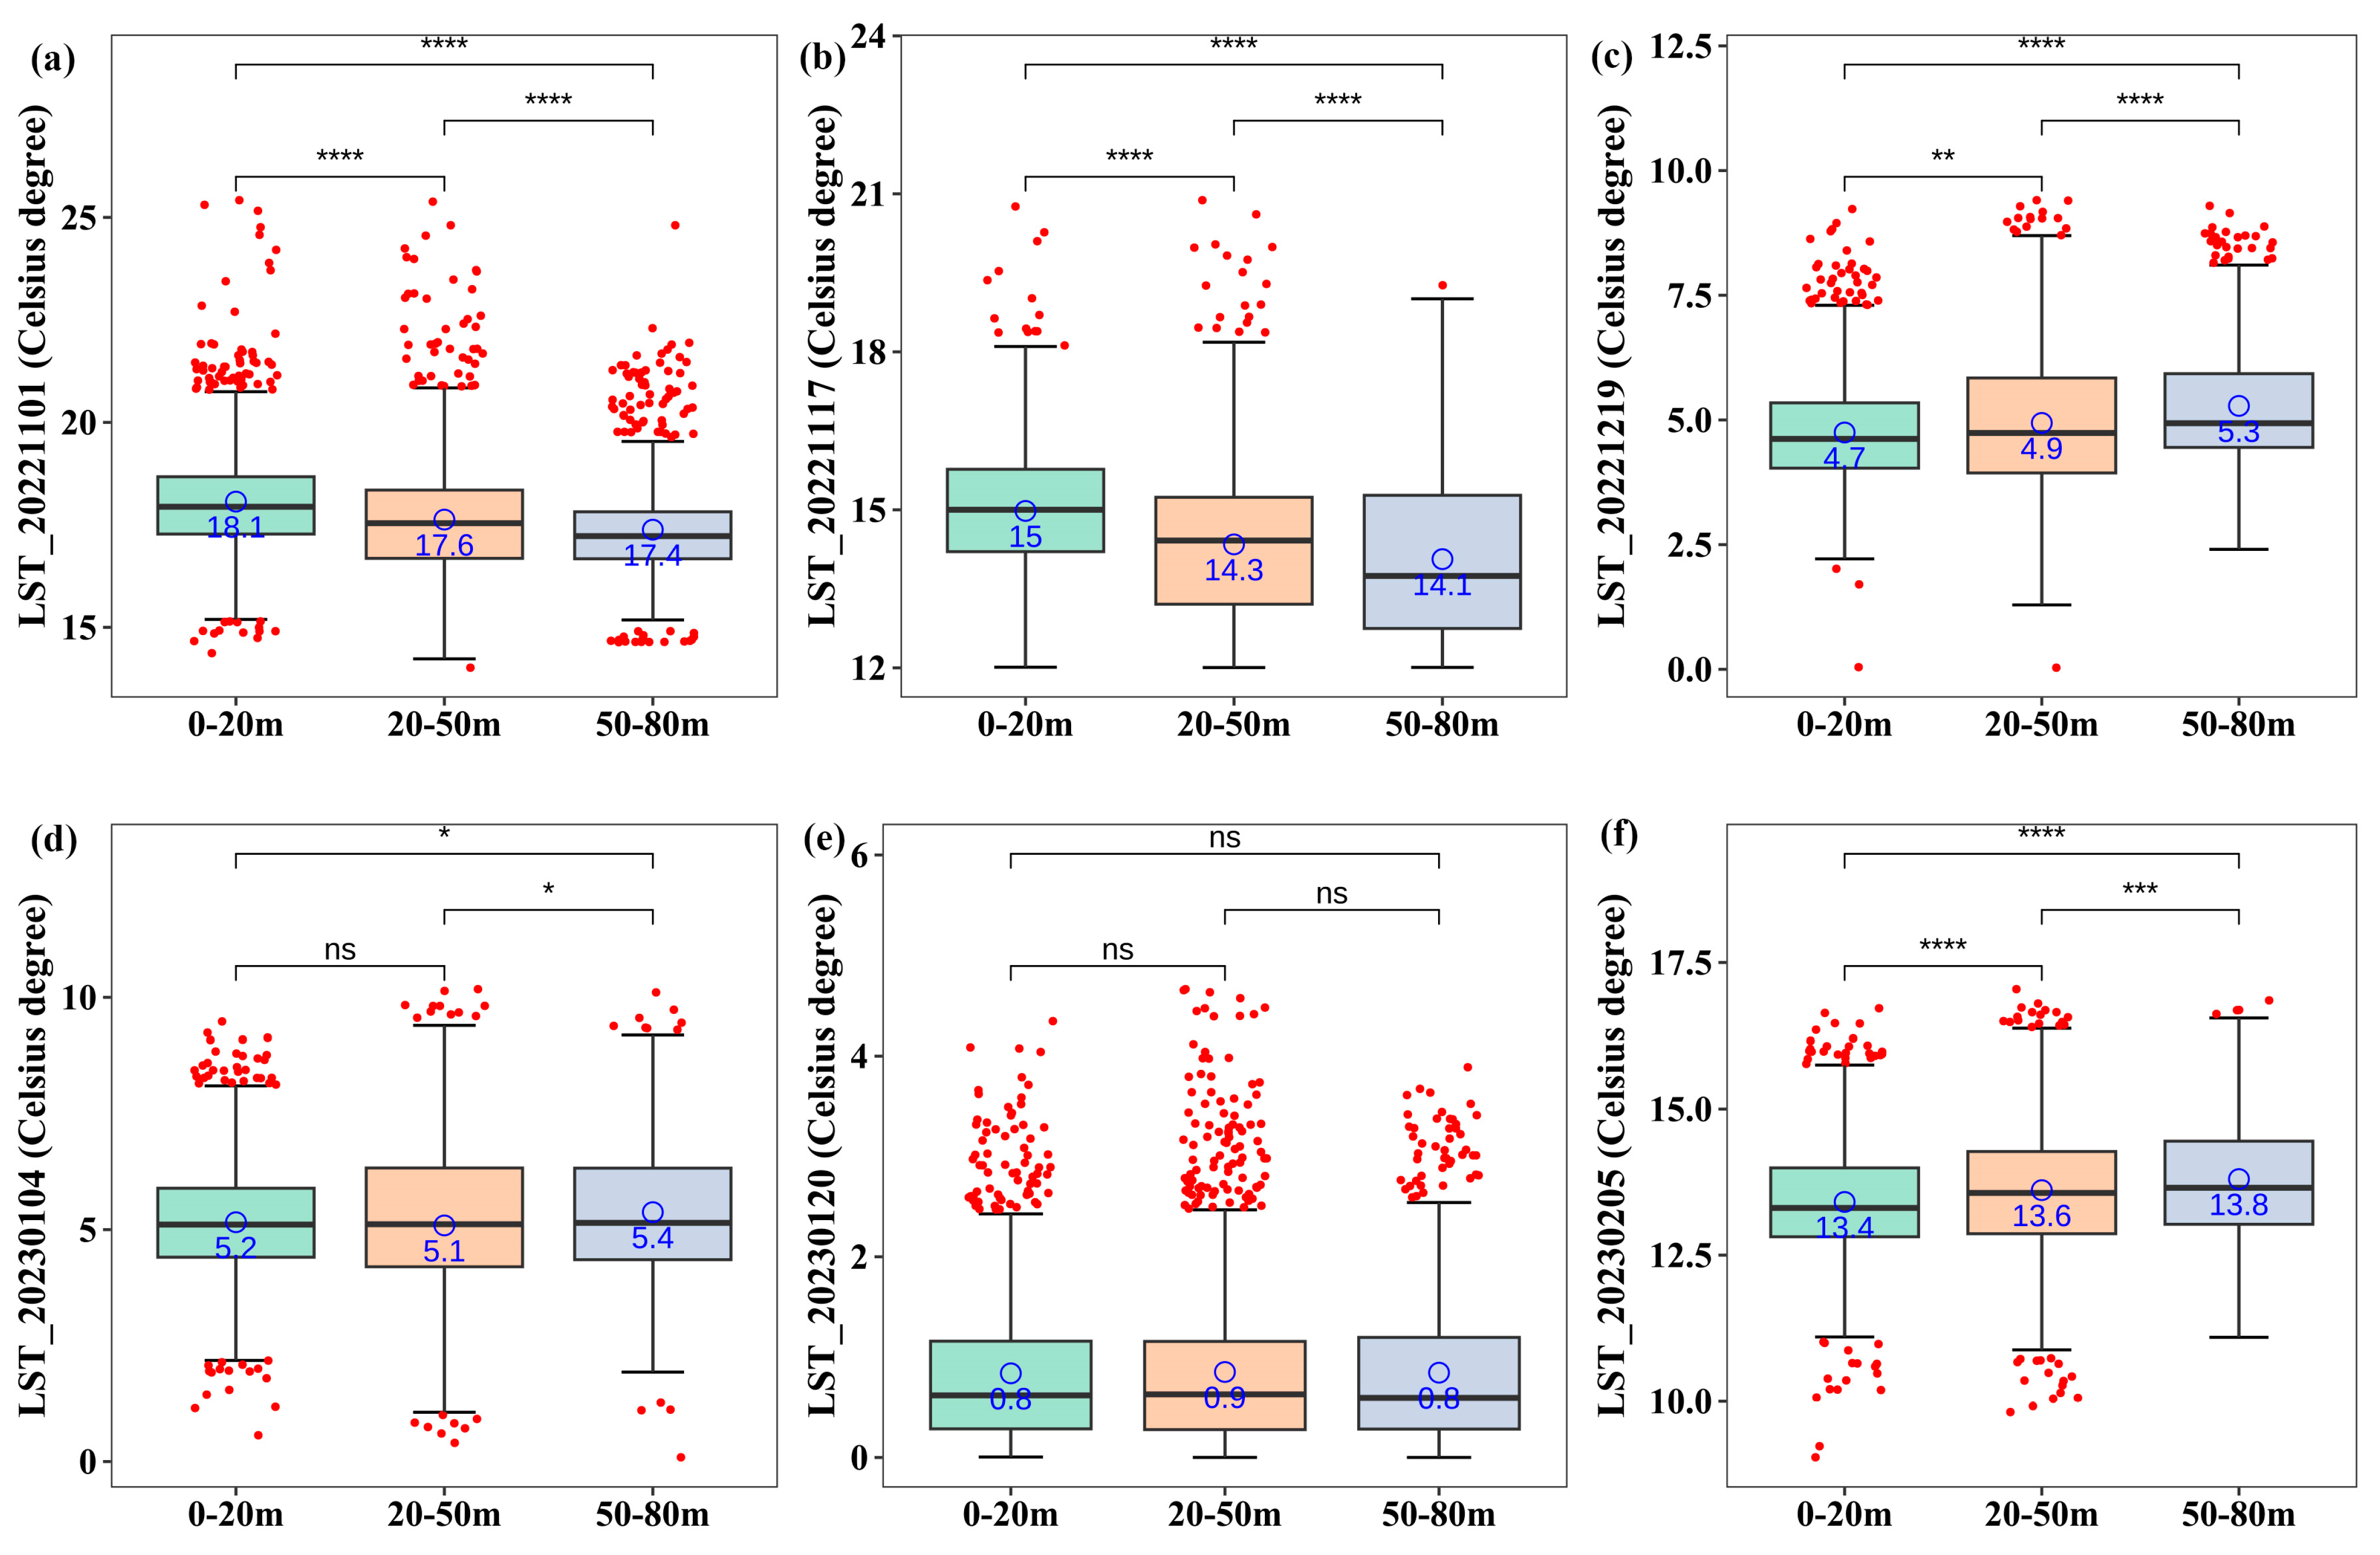
3.2. Temperature Indexes of the Study Area

The study area experiences pronounced winter conditions from November to February, during which thermal anomalies become readily distinguishable from surrounding terrain features due to enhanced thermal contrast under cold ambient temperatures. Summer heating of low-conductivity surfaces (sands, dunes, and bare rocks) creates homogeneous high-temperature backgrounds that mask thermal anomalies, reducing detection reliability between June and September.
Integrated analysis of multi-temporal satellite imagery and meteorological data identified November through February as the optimal detection window for LSTA in the study area. This seasonal period provides the following: (1) enhanced thermal contrast between anomalies and background features, (2) stable atmospheric conditions, and (3) minimal solar heating interference, enabling the reliable identification of potential underground coal fire sources.
Figure 4 shows the time-series land surface temperature (LST) results of the Daliuta coalfields. High-temperature anomalies displayed a non-random spatial distribution, concentrating predominantly in northern, southwestern, and southeastern subregions, corresponding to areas of documented coal fire activity.
The land surface temperature anomaly (LSTA) points were extracted with the threshold-based method. The thermal anomaly recognition method was founded based on three hypotheses. In Hypothesis 1, the thermal anomaly is assumed to be caused by an underground coal fire and is continuously heated, resulting in a higher temperature than that of the nearby areas. In Hypothesis 2, the thermal anomaly is more significant in winter than in summer. In Hypothesis 3, the temperatures (Celsius) of the thermal anomaly areas in the cold season are higher than zero degrees Celsius, the average temperature during the day, and the temperature at 11 o’clock in the day (Table 1.).
The LST products were integrated and filtrated with the threshold-based recognition method, and 5978 LSTA points were selected (red squares in Figure 5). Overlain with the coal seam burial depth data, some LSTA points fell out of the coal seam range, and they were excluded. Consequently, 4489 LSTA-multi points were selected (blue point in Figure 5). And the LSTA points were scattered in the northern, southwestern, and southeastern parts of Daliuta coalfields.

3.3. Depth-Dependent Differences in Topography and Temperature Indexes

In this study, we converted 4489 identified land surface temperature anomaly (LSTA) areas into vector point features through geospatial processing. Each point was then attributed with both topographic parameters (elevation, slope, relative elevation, TWI, aspect) and thermal characteristics (LST), resulting in a comprehensive set of 4489 multi-parameter LSTA observation points for subsequent analysis.
The Wilcoxon test (α = 0.05) was utilized to verify the differences in topographical and temperature indexes among the three different coal seam burial depth units, 0–20 m, 20–50 m, 50–80 m.
Figure 6 shows that the distributions of elevation, slope, relative elevation, and TWI were significantly different among the three different seam depth units (p < 0.0001, Figure 6a–d). The aspect index did not show any significance among the three units (Figure 6e).
In the study area, the average elevation differences of the 0–20 m, 20–50 m, and 50–80 m seam depths were 1149.4 m, 1163.9 m, and 1186.3 m. It revealed that the higher the elevation, the deeper the coal seam. The average slope of the three seam depth units was 17.5°, 13.9°, and 19.4°, respectively. And the average TWI of the three seam depth units was 4, 4.6, and 3.9, respectively.
Figure 7 shows that the LST distributions in November, December, and February were significantly different among the three different seam depth units (p < 0.001). However, no significant differences were found in LST20230120. As for the LST20221101, the average temperatures of the 0–20 m, 20–50 m, and 50–80 m seam depths were 18.1 °C, 17.6 °C, and 17.4 °C, respectively (Figure 7a). And the land surface temperature in November 2022 was higher than that in December 2022. As for the LST20221219, the average temperature of the three seam depth units was 4.7 °C, 4.9 °C, and 5.3 °C, respectively. In late January, as well as the coldest time of the study area, the average temperature of the three seam depth units was 0.8 °C, 0.9 °C, and 0.8 °C, respectively.

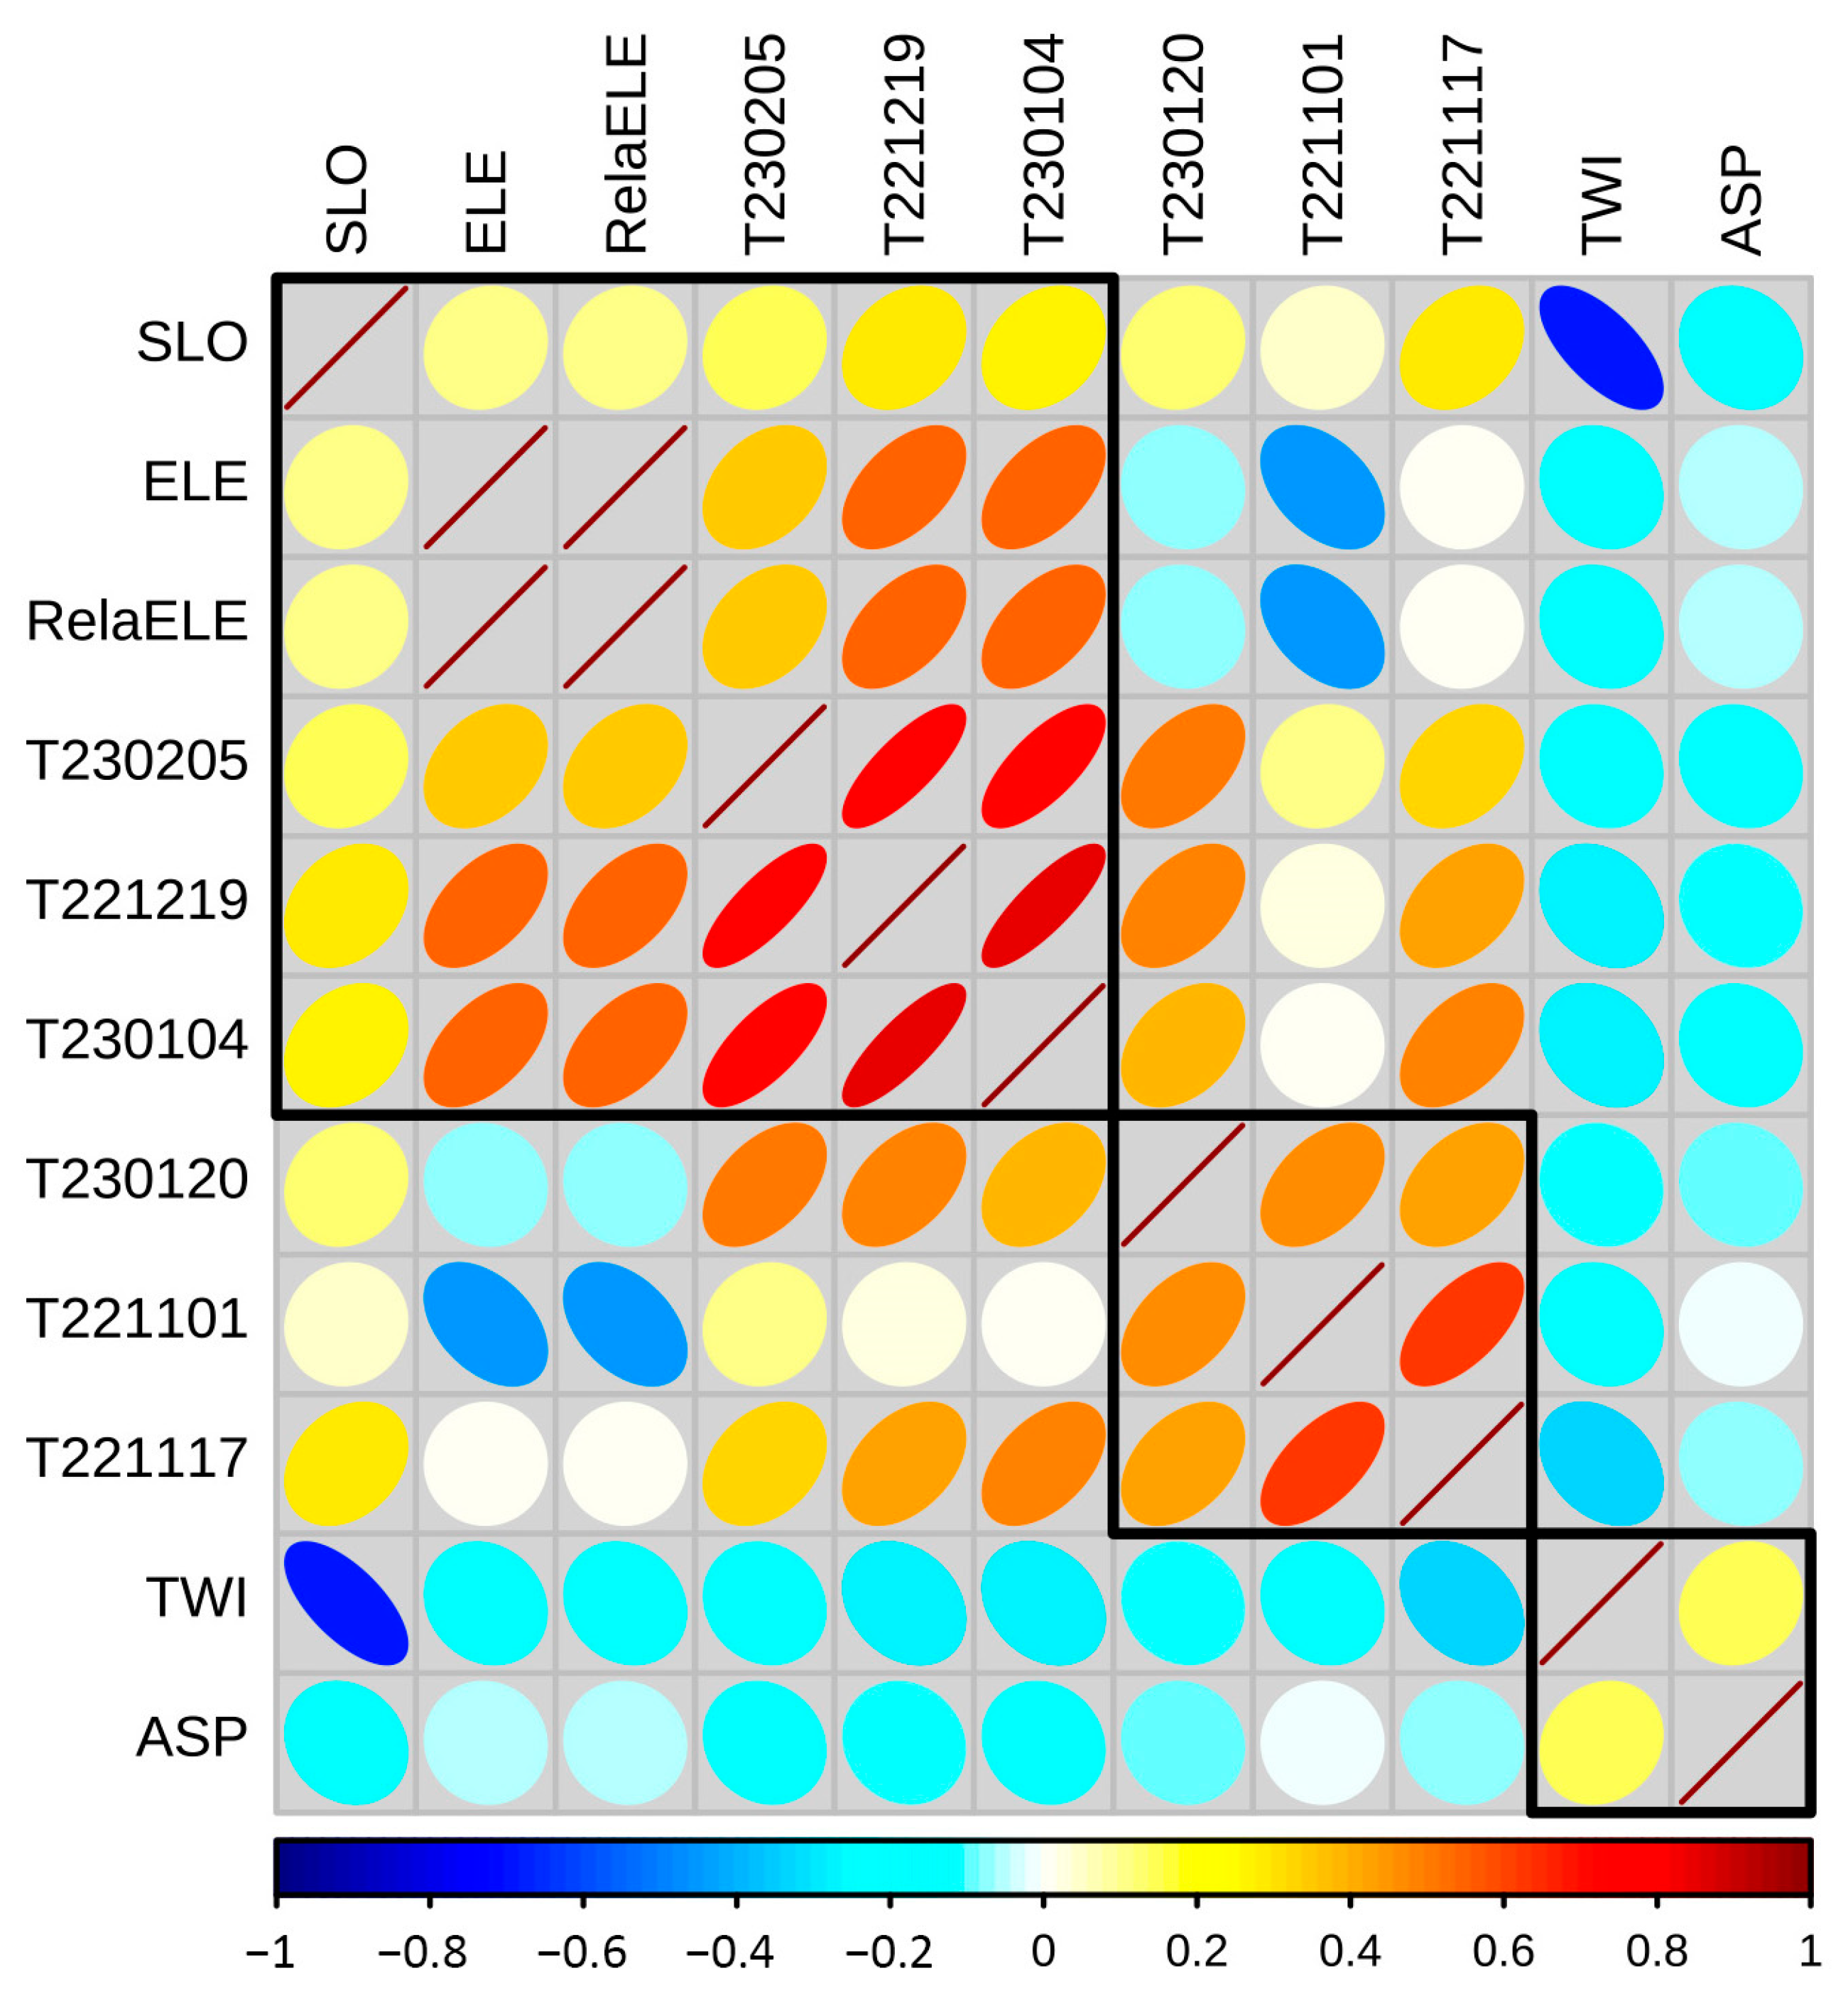
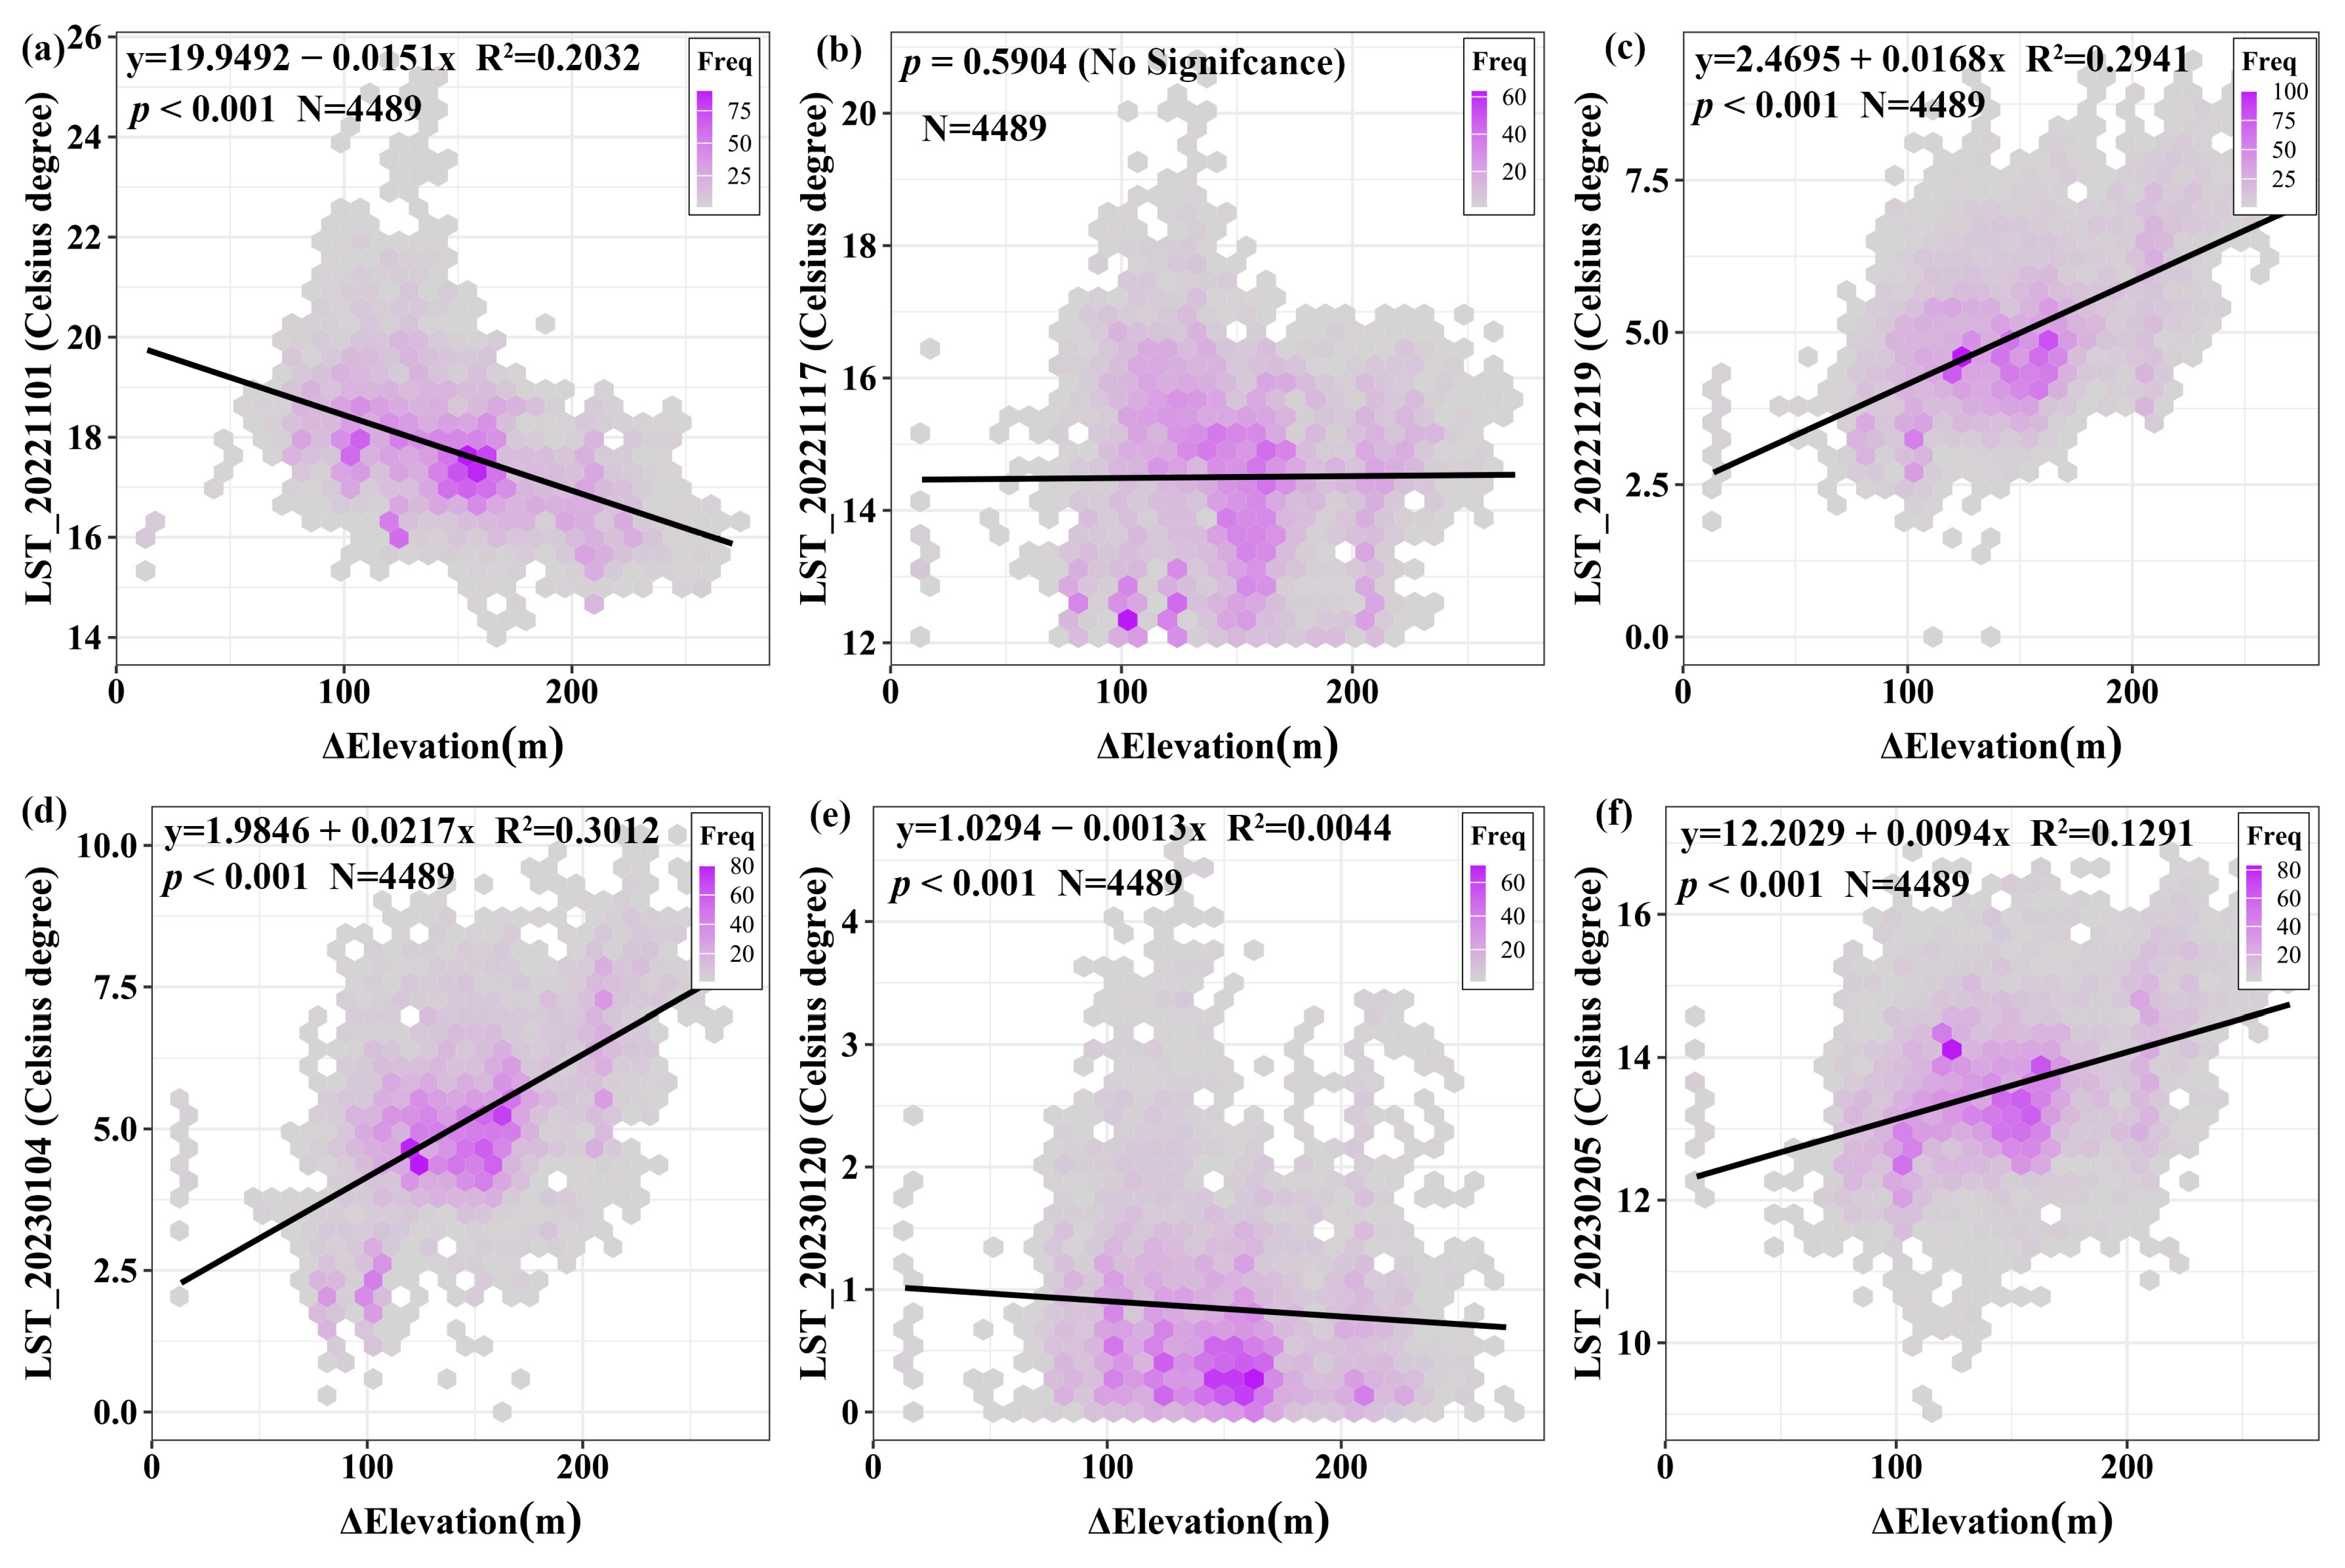
3.4. Correlation and Linear Regression Analysis of Topography and Temperature Indexes

Figure 8 presents the Pearson correlation matrix analyzing relationships between topographic parameters (elevation, slope, aspect, relative elevation, TWI) and multitemporal land surface temperature (LST) indexes. Our analysis revealed statistically significant correlations between elevation metrics and thermal patterns. Consequently, we identified relative elevation (RelaELE) as the primary topographic control influencing spatial thermal variability in the study area.
The hierarchical clustering results (black rectangles in Figure 8) revealed that the TWI and aspect were categorized into one group, and the temperature and other topographical indexes were classified into two groups. A strong correlation relationship (r = −0.69) was found between SLO and TWI, and no significant correlations were found among the SLO, RelaELE, and ASP indexes. And relatively strong correlations could be found among the temperature indexes of the same clustering group.
Figure 8 demonstrates significant seasonal variations in the RelaELE-LST relationships, showing the following: (1) positive correlations with LST20230205 (r = 0.36), LST20221219 (r = 0.54), and LST20230104 (r = 0.55), and (2) a negative correlation with LST20221101 (r = -0.45). To quantify these associations, we conducted linear regression analysis between all six LST datasets and relative elevation, revealing distinct seasonal patterns of topographic thermal modulation (Figure 9).
In Figure 9, the linear regression results indicate that the temperature indexes of LST20221101 had a negative relationship with the relative elevation (Figure 9a, R2 = 0.2032). The temperature indexes of LST20221219, LST20230104, and LST20230205 had significant positive relationships with the relative elevation index (Figure 9c,d,f, R2 = 0.2941, R2 = 0.3012, R2 = 0.1291, respectively).

4. Discussion

4.1. Application of the Threshold-Based LSTA Recognition Method

Conventional thermal anomaly detection methods prove inadequate in this unique geoenvironmental setting due to several confounding factors: (1) the transitional location between the Loess Plateau and Mu Us Sandy Land contains extensive stabilized dunes with low thermal inertia; (2) arid summer conditions (June–September) induce rapid daytime heating of surface materials, creating thermal noise that obscures potential subsurface anomalies; and (3) the similar spectral signatures between naturally heated surfaces and actual underground coal fire anomalies render traditional threshold-based detection methods ineffective.
In this study, we proposed a new threshold-based thermal anomaly recognition method on a large scale. According to the satellite image capture time and the meteorological records of the target coalfield area, the threshold-based LSTA recognition method was founded based on three hypotheses. In Hypothesis 1, the thermal anomaly is assumed to be caused by an underground coal fire and is continuously heated, resulting in a higher temperature than that of the nearby areas. In Hypothesis 2, the thermal anomaly is more significant in winter than in summer. In Hypothesis 3, the temperatures (Celsius) of the thermal anomaly areas in the cold season are higher than zero degrees Celsius, the average temperature during the day, and the temperature at 11 o’clock in the day. And the Landsat-9 images of the study area were captured at 11:19. Moreover, multiple satellite images from November to February were integrated to enhance the accuracy of the LSTA results.

4.2. Effects of Topography on the Distribution of LSTA

Kuenzer and Stracher [36] studied the geomorphology of coal seam fires, and three process groups of geomorphologic manifestations of coal fires can be differentiated: (1) bedrock surface fracturing, leading to fissures, cracks, funnels, vents, and sponges; (2) manifestations resulting from surface bedrock subsidence, including sinkholes, trenches, depressions, partial-surface subsidence, large-surface subsidence, and slides; and (3) coal fire-induced bedrock changes, including the generation of ash layers, pyrometamorphic rocks, and fumarolic minerals.
Our analysis revealed statistically significant variations (p < 0.001) in topographic parameters (elevation, slope, relative elevation, TWI) across three distinct coal seam depth units. Similarly, land surface temperature (LST) distributions demonstrated significant seasonal differences (p < 0.001) during November, December, and February observations. Notably, relative elevation showed strong correlations with thermal indexes.
The relationships between relative elevation and land surface temperature may exhibit monthly or seasonal variations due to seasonal climatic fluctuations and heterogeneous underlying surface characteristics.

5. Conclusions

This study was conducted in typical coal mining areas. It demonstrated that the threshold-based method could facilitate the recognition of the land surface temperature anomaly on a large scale. The overlay analysis of multiple image-derived land surface temperature results could enhance the accuracy of the LSTA results. Elevation, slope, relative elevation, TWI, and LST indexes showed significant differences among the coal seam burial depth units. Significant correlations were found between elevation (relative elevation) and temperature indexes. In the future, a combination system of long-term in situ monitoring, periodic drone scanning, and remote sensing techniques should be developed to facilitate the feasibility and effectiveness of large-scale LSTA investigation.

Author Contributions

Conceptualization, Li Feng; methodology, Li Feng, Mao-Sheng Zhang and Yao Wang; data curation, Yao Wang, Ying Dong, Chuanbo Yang, Yuteng Yan and Xu Zhang; software, Yao Wang, Da Luo and Yuteng Yan; formal analysis, Yao Wang, Da Luo, Ying Dong, Li Feng and Hao Liu; writing—original draft preparation, Yao Wang and Da Luo; writing—review and editing, Li Feng and Mao-Sheng Zhang; visualization, Yao Wang and Da Luo; funding acquisition, Mao-Sheng Zhang; investigation, Li Feng, Yao Wang, Chuanbo Yang, Ying Dong, Hao Liu and Xu Zhang. All authors have read and agreed to the published version of the manuscript.

Funding

This research was funded by the research project on Risks Investigation of Coal Mining Subsidence and Coal Seam Fire Areas in Yulin City, China (Grant No. HXDSH20240285).

Data Availability Statement

The Landsat image data that support the analyses in this study can be found in the USGS EarthExplorer website (https://earthexplorer.usgs.gov/, accessed on 20 June 2023). The Gaofen-2 image data can be found in Geospatial Data Cloud site, Computer Network Information Center, Chinese Academy of Sciences (http://www.gscloud.cn, accessed on 20 June 2023).

Acknowledgments

We would like to thank the editor and anonymous reviewers for their constructive suggestions and comments for this article.

Conflicts of Interest

The authors declare no conflicts of interest.

References

  1. Liu, Y.; Heng, W.; Yue, H. Quantifying the coal mining impact on the ecological environment of Gobi open-pit mines. Sci. Total Environ. 2023, 883, 163723. [Google Scholar] [CrossRef] [PubMed]
  2. Liang, Y. Progress and Advancements of coal mine gas control and management for Safe Mining in China. J. Ind. Saf. 2024, 1, 100005. [Google Scholar] [CrossRef]
  3. Ge, W.; Li, J.; Liu, J.; Xu, C.; Wu, H.; Zhou, Y.; Ren, Y.; Wang, X.; Zheng, L.; Zhou, J.; et al. Impacts of coal use phase-out in China on the atmospheric environment: (1) emissions, surface concentrations and exceedance of air quality standards. Atmos. Environ. 2023, 315, 120163. [Google Scholar] [CrossRef]
  4. Zhang, Y.; Wang, Y.; Huo, W.; Zhao, F.; Hu, Z.; Wang, T.; Song, R.; Liu, J.; Zhang, L.; Fernández, J.; et al. Ground Deformation Monitoring over Xinjiang Coal Fire Area by an Adaptive ERA5-Corrected Stacking-InSAR Method. Remote Sens. 2023, 15, 1444. [Google Scholar] [CrossRef]
  5. Kuenzer, C.; Zhang, J.; Sun, Y.; Jia, Y.; Dech, S. Coal fires revisited: The Wuda coal field in the aftermath of extensive coal fire research and accelerating extinguishing activities. Int. J. Coal Geol. 2012, 102, 75–86. [Google Scholar] [CrossRef]
  6. Pandey, J.; Kumar, D.; Panigrahi, D.C.; Singh, V.K. Temporal transition analysis of coal mine fire of Jharia coalfield, India, using Landsat satellite imageries. Environ. Earth Sci. 2017, 76, 439. [Google Scholar] [CrossRef]
  7. Stracher, G.B. Coal fires burning around the world: A Global Catastrophe. Int. J. Coal Geol. 2004, 59, 1–6. [Google Scholar] [CrossRef]
  8. Zhou, B.; Wu, J.; Wang, J.; Wu, Y. Surface-based radon detection to identify spontaneous combustion areas in small abandoned coal mine gobs: Case study of a small coal mine in China. Process Saf. Environ. Prot. 2018, 119, 223–232. [Google Scholar] [CrossRef]
  9. Syed, T.H.; Riyas, M.J.; Kuenzer, C. Remote sensing of coal fires in India: A review. Earth-Sci. Rev. 2018, 187, 338–355. [Google Scholar] [CrossRef]
  10. Wang, T.; Wang, Y.; Zhao, F.; Feng, H.; Liu, J.; Zhang, L.; Zhang, N.; Yuan, G.; Wang, D. A spatio-temporal temperature-based thresholding algorithm for underground coal fire detection with satellite thermal infrared and radar remote sensing. Int. J. Appl. Earth Obs. Geoinf. 2022, 110, 102805. [Google Scholar] [CrossRef]
  11. Huo, H.; Ni, Z.; Gao, C.; Zhao, E.; Zhang, Y.; Lian, Y.; Zhang, H.; Zhang, S.; Jiang, X.; Song, X.; et al. A Study of Coal Fire Propagation with Remotely Sensed Thermal Infrared Data. Remote Sens. 2015, 7, 3088–3113. [Google Scholar] [CrossRef]
  12. Song, Z.; Kuenzer, C.; Zhu, H.; Zhang, Z.; Jia, Y.; Sun, Y.; Zhang, J. Analysis of coal fire dynamics in the Wuda syncline impacted by fire-fighting activities based on in-situ observations and Landsat-8 remote sensing data. Int. J. Coal Geol. 2015, 141–142, 91–102. [Google Scholar] [CrossRef]
  13. Liu, Y.; Qi, X.; Luo, D.; Zhang, Y.; Qin, J. Detection and management of coal seam outcrop fire in China: A case study. Sci. Rep. 2024, 14, 4609. [Google Scholar] [CrossRef]
  14. Huo, H.; Jiang, X.; Song, X.; Li, Z.-L.; Ni, Z.; Gao, C. Detection of Coal Fire Dynamics and Propagation Direction from Multi-Temporal Nighttime Landsat SWIR and TIR Data: A Case Study on the Rujigou Coalfield, Northwest (NW) China. Remote Sens. 2014, 6, 1234–1259. [Google Scholar] [CrossRef]
  15. Mansor, S.B.; Cracknell, A.P.; Shilin, B.V.; Gornyi, V.I. Monitoring of underground coal fires using thermal infrared data. Int. J. Remote Sens. 1994, 15, 1675–1685. [Google Scholar] [CrossRef]
  16. Guo, J.; He, T.; Xiao, W.; Lei, K. Time series procession for monitoring land disturbance caused by surface coal mining in China. J. Clean. Prod. 2024, 448, 141585. [Google Scholar] [CrossRef]
  17. Xie, J.; Xue, S.; Cheng, W.; Wang, G. Early detection of spontaneous combustion of coal in underground coal mines with development of an ethylene enriching system. Int. J. Coal Geol. 2011, 85, 123–127. [Google Scholar] [CrossRef]
  18. Singh, A.K.; Singh, R.V.K.; Singh, M.P.; Chandra, H.; Shukla, N.K. Mine fire gas indices and their application to Indian underground coal mine fires. Int. J. Coal Geol. 2007, 69, 192–204. [Google Scholar] [CrossRef]
  19. Stracher, G.B.; Prakash, A.; Schroeder, P.; Mccormack, J.; Zhang, X.; Dijk, P.V.; Blake, D. New mineral occurrences and mineralization processes: Wuda coal-fire gas vents of Inner Mongolia. Am. Mineral. 2005, 90, 1729–1739. [Google Scholar] [CrossRef]
  20. Biswal, S.S.; Gorai, A.K. Change detection analysis in coverage area of coal fire from 2009 to 2019 in Jharia Coalfield using remote sensing data. Int. J. Remote Sens. 2020, 41, 9545–9564. [Google Scholar] [CrossRef]
  21. Gao, Y.; Hao, M.; Wang, Y.; Dang, L.; Guo, Y. Multi-Scale Coal Fire Detection Based on an Improved Active Contour Model from Landsat-8 Satellite and UAV Images. ISPRS Int. J. Geo-Inf. 2021, 10, 449. [Google Scholar] [CrossRef]
  22. Yu, B.; She, J.; Liu, G.; Ma, D.; Zhang, R.; Zhou, Z.; Zhang, B. Coal fire identification and state assessment by integrating multitemporal thermal infrared and InSAR remote sensing data: A case study of Midong District, Urumqi, China. ISPRS J. Photogramm. Remote Sens. 2022, 190, 144–164. [Google Scholar] [CrossRef]
  23. Song, D.; Hu, Z.; Zeng, J.; Sun, H. Influence of mining on vegetation in semi-arid areas of western China based on the coupling of above ground and below ground—A case study of Daliuta coalfield. Ecol. Indic. 2024, 161, 111964. [Google Scholar] [CrossRef]
  24. Meng, Z.; Shi, X.; Li, G. Deformation, failure and permeability of coal-bearing strata during longwall mining. Eng. Geol. 2016, 208, 69–80. [Google Scholar] [CrossRef]
  25. Conrad, O.; Bechtel, B.; Bock, M.; Dietrich, H.; Fischer, E.; Gerlitz, L.; Wehberg, J.; Wichmann, V.; Bohner, J. System for Automated Geoscientific Analyses (SAGA) v. 2.1.4. Geosci. Model Dev. 2015, 8, 1991–2007. [Google Scholar] [CrossRef]
  26. Moore, I.D.; Grayson, R.B.; Ladson, A.R. Digital terrain modelling: A review of hydrological, geomorphological, and biological applications. Hydrol. Process. 1991, 5, 3–30. [Google Scholar] [CrossRef]
  27. O’Loughlin, E.M. Prediction of Surface Saturation Zones in Natural Catchments by Topographic Analysis. Water Resour. Res. 1986, 22, 794–804. [Google Scholar] [CrossRef]
  28. Beven, K.J.; Kirkby, M.J. A physically based, variable contributing area model of basin hydrology / Un modèle à base physique de zone d’appel variable de l’hydrologie du bassin versant. Hydrol. Sci. Bull. 1979, 24, 43–69. [Google Scholar] [CrossRef]
  29. Seibert, J.; Stendahl, J.; Sorensen, R. Topographical influences on soil properties in boreal forests. Geoderma 2007, 141, 139–148. [Google Scholar] [CrossRef]
  30. Barsi, J.A.; Barker, J.L.; Schott, J.R. An Atmospheric Correction Parameter Calculator for a single thermal band earth-sensing instrument. In Proceedings of the IGARSS 2003. 2003 IEEE International Geoscience and Remote Sensing Symposium. Proceedings (IEEE Cat. No.03CH37477), Toulouse, France, 21–25 July 2003; Volume 3015, pp. 3014–3016. [Google Scholar]
  31. Barsi, J.; Schott, J.; Palluconi, F.; Hook, S. Validation of a Web-Based Atmospheric Correction Tool for Single Thermal Band Instruments; SPIE: Washington, DC, USA, 2005; Volume 5882. [Google Scholar]
  32. Bauer, D.F. Constructing confidence sets using rank statistics. J. Am. Stat. Assoc. 1972, 67, 687–690. [Google Scholar] [CrossRef]
  33. Hollander, M.; Wolfe, D.A. Nonparametric Statistical Methods, 2nd ed.; John Wiley & Sons: New York, NY, USA, 1999. [Google Scholar]
  34. R Core Team. R: A Language and Environment for Statistical Computing; R Foundation for Statistical Computing: Vienna, Austria, 2019. [Google Scholar]
  35. RStudio Team. RStudio: Integrated Development Environment for R, RStudio Team: Boston, MA, USA, 2019.
  36. Kuenzer, C.; Stracher, G.B. Geomorphology of coal seam fires. Geomorphology 2012, 138, 209–222. [Google Scholar] [CrossRef]
Figure 1. Geographical location of the study area. (a) China; (b) Shaanxi Province; (c) Shenmu County; (d) the study area of Daliuta coalfields.
Ijgi 14 00206 g001
Figure 2. Conceptual framework of this study.
Ijgi 14 00206 g002
Figure 3. Distribution of topographical indexes in the Daliuta coalfields: (a) elevation, (b) slope, (c) aspect, (d) relative elevation, (e) topographical wetness index, (f) coal seam burial depth.
Ijgi 14 00206 g003
Figure 4. Distribution of land surface temperature: (a) LST20221101, (b) LST20221117, (c) LST20221219, (d) LST20230104, (e) LST20230120, (f) LST20230205.
Ijgi 14 00206 g004
Figure 5. Distribution of LSTA and LSTA-multi zones.
Ijgi 14 00206 g005
Figure 6. Significance boxplot of topographical indexes (ELE, SLO, RelaELE, TWI, ASP). Blue circles and numbers are the mean values of each group. Red dots are the outliers. The p-value levels are symbolized as (1) ns: p > 0.05, (2) *: p < 0.05, (3) **: p < 0.01, (4) ***: p < 0.001, (5) ****: p < 0.0001.
Ijgi 14 00206 g006
Figure 7. Significance boxplot of temperature indexes (LST of six periods). Blue circles and numbers are the mean values of each group. Red dots are the outliers. The p-value levels are symbolized as (1) ns: p > 0.05, (2) *: p < 0.05, (3) **: p < 0.01, (4) ***: p < 0.001, (5) ****: p < 0.0001.
Ijgi 14 00206 g007
Figure 8. Pearson correlations between topography and temperature indexes. Strength and direction of the correlations are denoted by ellipse size and colors (as per scale bar). The size of ellipse in plot cells is proportional to the Pearson correlation coefficients (r). The scale bar extends from perfect negative correlation (dark bule, r = −1) to perfect positive correlation (dark red, r = 1). Black rectangles categorize the indexes into groups based on the Hierarchical clustering method. In the plot, SLO, ELE, RelaELE, TWI, and ASP indicate slope, elevation, relative elevation, topographical wetness index, and aspect, respectively. T is short for LST, and T230205 stands for LST20230205.
Ijgi 14 00206 g008
Figure 9. Relationships between the six-period LST and the relative elevation (ΔElevation). (a) Linear regression and scatter plot of ΔElevation and LST20221101; (b) linear regression and scatter plot of ΔElevation and LST20221117; (c) linear regression and scatter plot of ΔElevation and LST20221219; (d) linear regression and scatter plot of ΔElevation and LST20230104; (e) linear regression and scatter plot of ΔElevation and LST20230120; (f) linear regression and scatter plot of ΔElevation and LST20230205. The number of points in the plot hexagon is denoted by colors (as per each embedded scale bar). Freq is the abbreviation of Frequency.
Ijgi 14 00206 g009
Table 1. Temperature threshold values used for each of the land surface temperature results.
LST ResultsDateDaily Maximum TemperatureDaily Minimum TemperatureThreshold01 Zero TemperatureThreshold02 Daily Mean TemperatureThreshold03 Temperature at 11 O’clock
LST202211011 November 2022164Null1014
LST2022111717 November 2022141Null812
LST2022121919 December 20222−120−50
LST202301044 January 20232−100−40
LST2023012020 January 2023−2−150−8−4
LST202302055 February 20239−6Null27
Note: (1) The temperature unit in the table is Celsius. (2) Daily maximum temperature and minimum temperature were obtained from meteorological data records. (3) Threshold01 is zero Celsius degree of that day, based on the temperature range. And null means that the daily temperature was above zero. (4) Threshold02 is the average temperature of the day, which is the arithmetic mean of the daily highest and lowest temperatures, and rounded to the nearest integer. (5) Threshold03 is the temperature at 11 o’clock of that day, based on the meteorological records.
Disclaimer/Publisher’s Note: The statements, opinions and data contained in all publications are solely those of the individual author(s) and contributor(s) and not of MDPI and/or the editor(s). MDPI and/or the editor(s) disclaim responsibility for any injury to people or property resulting from any ideas, methods, instructions or products referred to in the content.

