

Leveraging Principal Component Analysis for Data-Driven and Objective Weight Assignment in Spatial Decision-Making Framework for Qanat-Induced Subsidence Susceptibility Assessment in Railway Networks

Abstract
1. Introduction
2. Materials and Methods
2.1. Background and Case Study
2.2. Data Source and Processing
2.3. Research Methodology
2.4. Criteria Determination, Criteria Map Creation, and Criteria Map Preparation
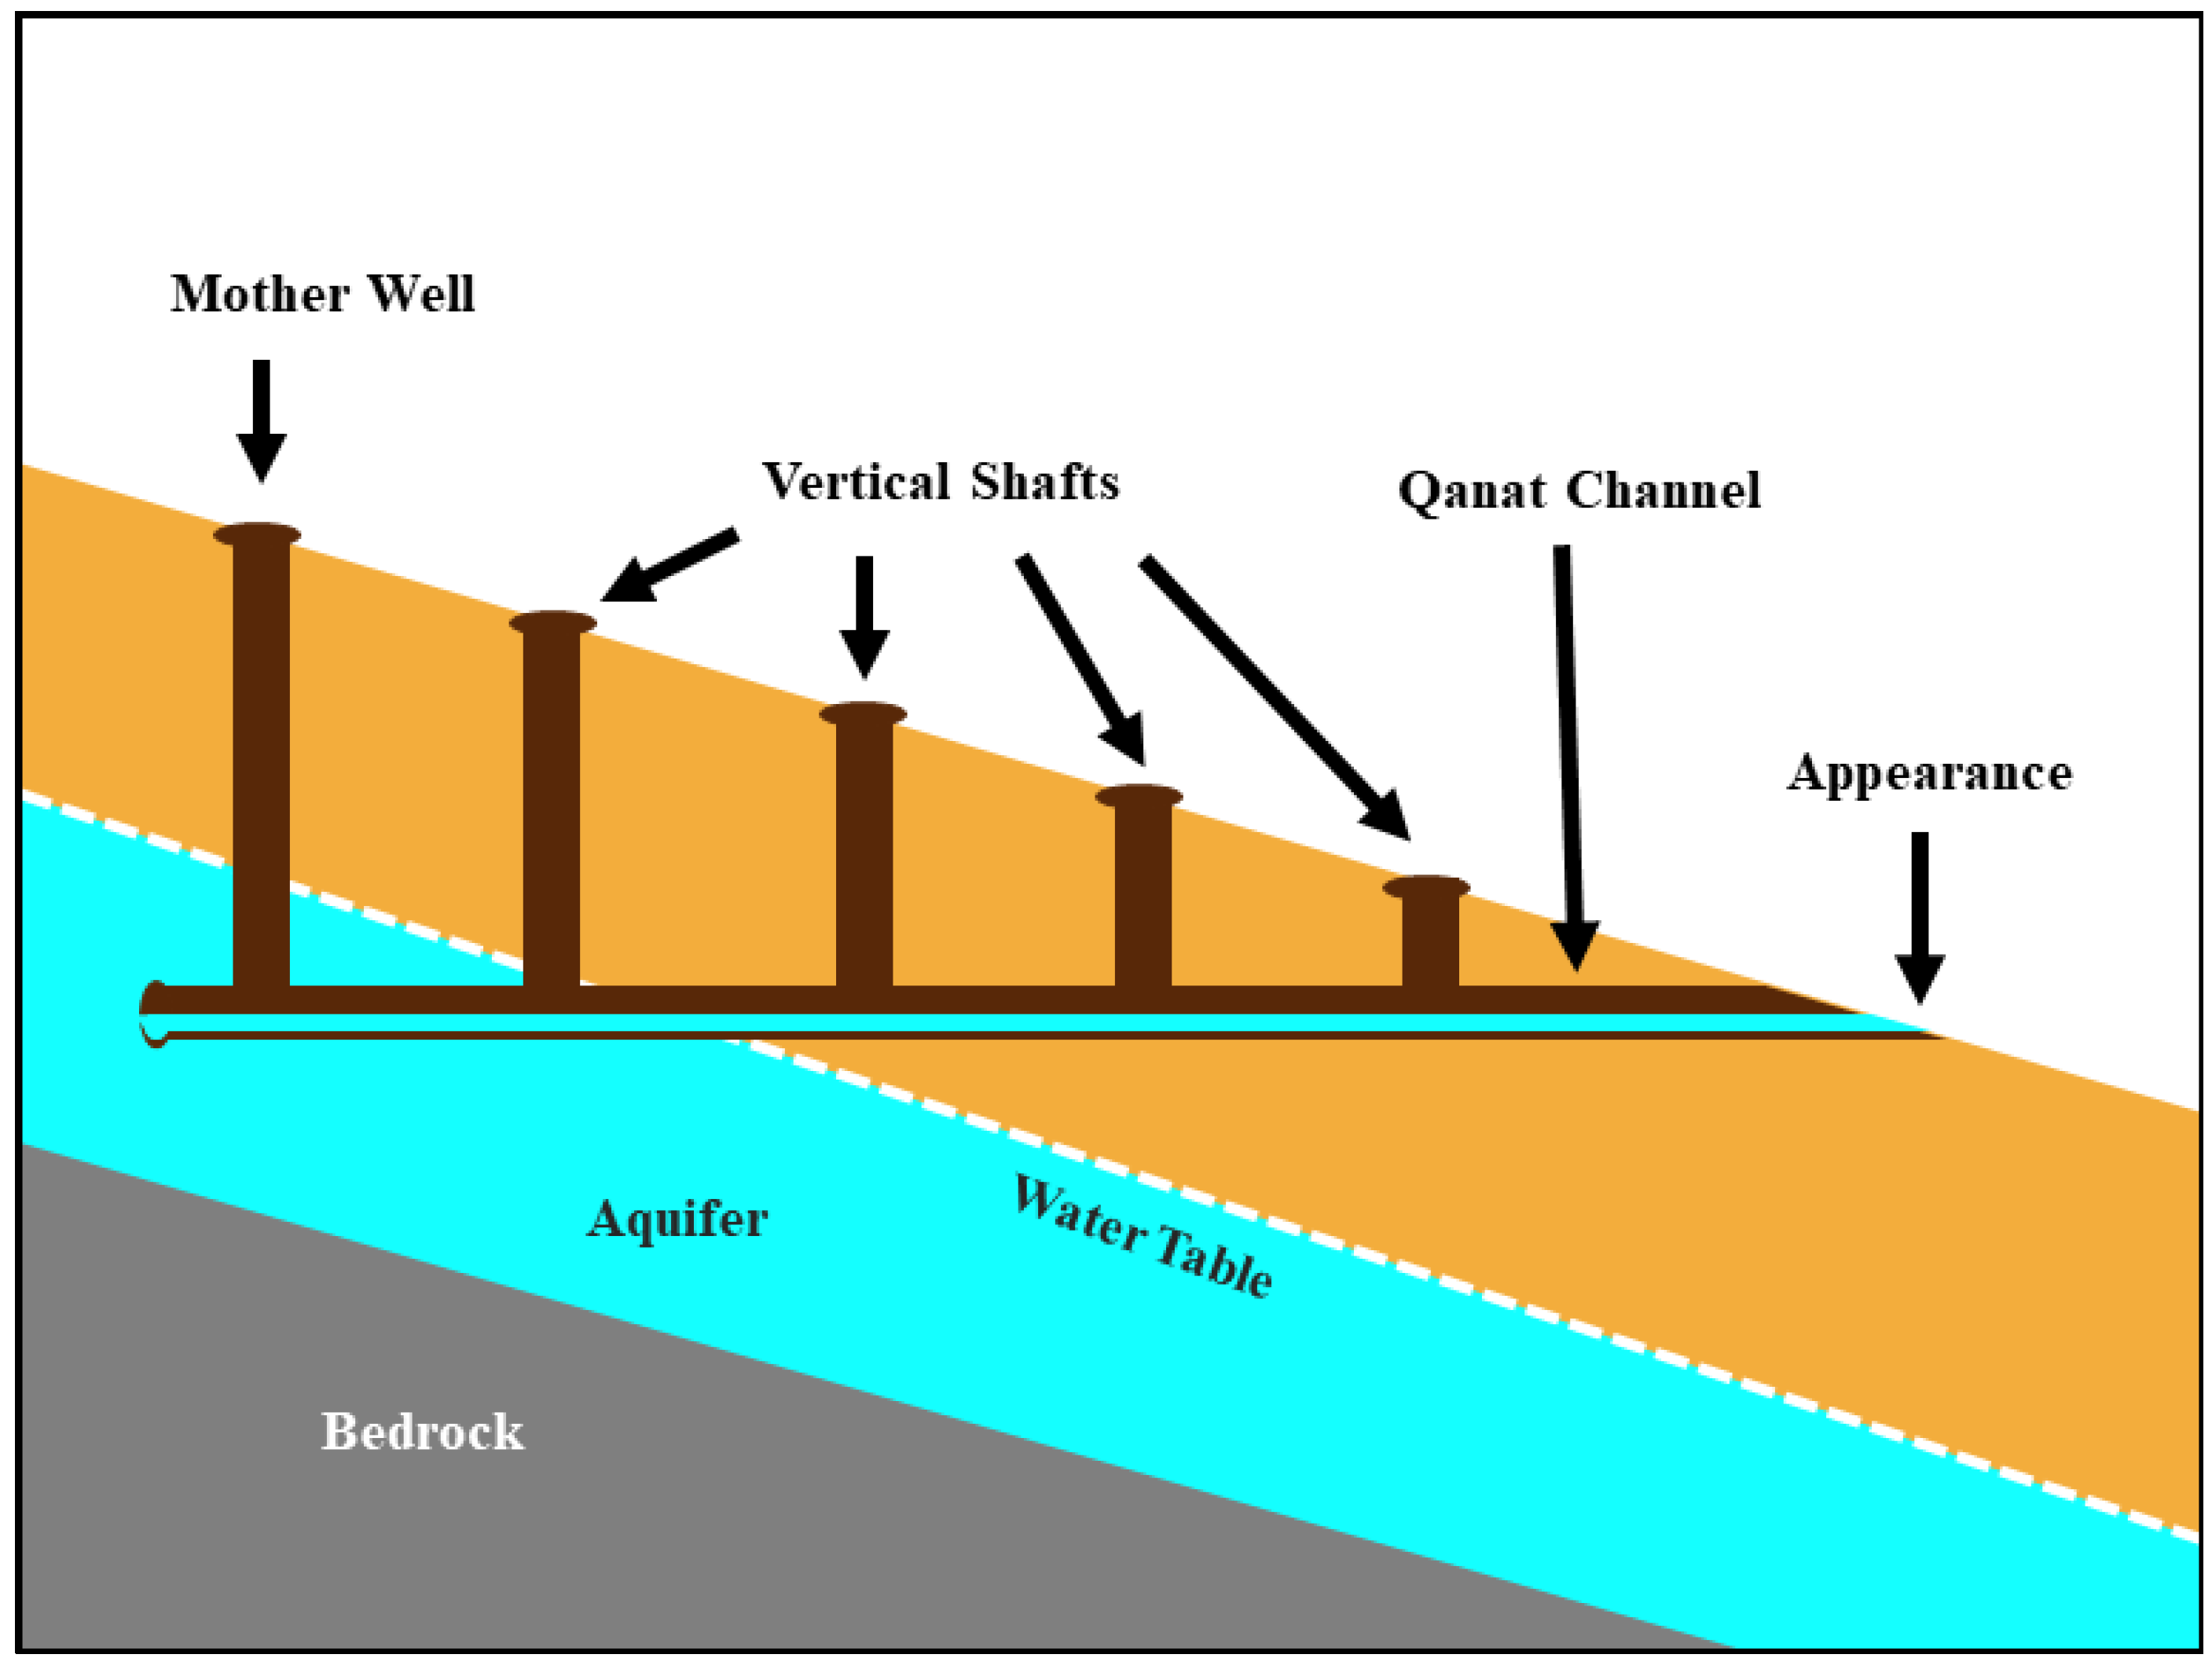
- Qanat channel density: The susceptibility level of rail structures due to subsidence is directly related to the density of Qanat channels in the area—the higher the concentration of Qanat channels in an area, the greater the potential for increased subsidence vulnerability [49]. This criterion is represented as a Qanat channel density map, generated using KDE, which assigns density values based on the proximity to each channel.
- Qanat well density: Ground instability and subsidence due to excessive deep wells have been common challenges in many areas [50], and our study area is no exception. Qanat wells in the study area vary in depth from 28 to 68 m, deep enough to impact the surrounding environment. Regarding the depth of 28 Qanat wells in the region, a well density map was created using the KDE technique. The higher the concentration of deeper Qanat wells in an area, the greater the potential for increased subsidence vulnerability.
- Discharge rate of the Qanat: Many Qanats have lost their functionality due to various reasons and have dried up over time. Decreasing the discharge rate of Qanats can lead to soil moisture loss in the surrounding area and consequently weaken the underlying support structure [51]. Thus, the reduced soil stability may result in significant ground subsidence, especially when heavy surface structures are constructed above the deteriorated Qanat systems [14]. In this context, to quantify this criterion, a density map based on the average discharge rate of Qanat channels was produced using the KDE technique.
- Depth of the Qanat: The presence of Qanats beneath the surface can cause movements in the surrounding soil mass and disrupt the original stress conditions of the ground. However, by increasing the depth of Qanat channels from the ground surface level, the vulnerability to subsidence is reduced [9]. To quantify this criterion, a density map based on the channel depth of Qanats was produced using the KDE technique.
- Railway traffic: The railway traffic volume (i.e., the total number of wagons passing in both directions on the tracks) increases ground vibrations, which, in turn, intensify soil displacement [52,53]. This increased vibration and soil movement can heighten the susceptibility of subsidence in areas with underlying Qanat systems. In our study area, there are nine rail blocks that handle traffic ranging from 28,532 year-round wagons for the lowest traffic block to a maximum of 137,250 passing wagons. Thus, a traffic density map was created similar to other criteria, indicating that the heavier the traffic, the greater the impact on railway subsidence.
- Railway passing load: The dynamic load exerted by trains during operations generates significant forces on railway tracks. These forces, which are temporary and of considerable magnitude, are known as impact loading [54]. The post-construction settling of the tracks is generally attributed to the combined weight of the railway infrastructure and the moving train loads [55]. The weight of the passing load for each rail block is taken into account, varying from a minimum of 1,733,467 tons to a maximum of 7,674,007 tons. Considering this information, a railway passing load density map was generated, similar to other criteria, indicating that heavier loads have more detrimental effects on railway subsidence.
2.5. PCA
2.6. TOPSIS
3. Results
Calculated Weights
4. Discussion
5. Conclusions
Author Contributions
Funding
Data Availability Statement
Conflicts of Interest
References
- Ge, L.; Li, X.; Chang, H.; Ng, A.H.; Zhang, K.; Hu, Z. Impact of Ground Subsidence on the Beijing–Tianjin High-Speed Railway as Mapped by Radar Interferometry. Ann. GIS 2010, 16, 91–102. [Google Scholar] [CrossRef]
- Voudouris, K.S.; Christodoulakos, Y.; Steiakakis, E.; Angelakis, A.N. Hydrogeological Characteristics of Hellenic Aqueducts-Like Qanats. Water 2013, 5, 1326–1345. [Google Scholar] [CrossRef]
- Beaumont, P. Qanat Systems in Iran. Hydrol. Sci. J. 1971, 16, 39–50. [Google Scholar] [CrossRef]
- Mousazadeh, H.; Ghorbani, A.; Azadi, H.; Almani, F.A.; Zangiabadi, A.; Zhu, K.; Dávid, L.D. Developing Sustainable Behaviors for Underground Heritage Tourism Management: The Case of Persian Qanats, a UNESCO World Heritage Property. Land 2023, 12, 808. [Google Scholar] [CrossRef]
- Ahmadi, H.; Samani, A.; Malekian, A. The Qanat: A Living History in Iran. In Water and Sustainability in Arid Regions; Springer: Berlin/Heidelberg, Germany, 2010; pp. 125–138. ISBN 978-90-481-2775-7. [Google Scholar]
- Pazwash, H. Qanats and Historic Structures in Persia: Potential Modern Applications; CRC Press: Boca Raton, FL, USA, 2024; ISBN 978-1-04-009639-0. [Google Scholar]
- Nasiri, F.; Mafakheri, M.S. Qanat Water Supply Systems: A Revisit of Sustainability Perspectives. Environ. Syst. Res. 2015, 4, 13. [Google Scholar] [CrossRef]
- Semsar Yazdi, A.A.; Labbaf Khaneiki, M. (Eds.) Hydrology Mechanism of Qanat. In Qanat Knowledge: Construction and Maintenance; Springer: Dordrecht, The Netherlands, 2017; pp. 21–31. ISBN 978-94-024-0957-4. [Google Scholar]
- Zhang, Y.; Liu, X.; Yuan, S.; Song, J.; Chen, W.; Dias, D. A Two-Dimensional Experimental Study of Active Progressive Failure of Deeply Buried Qanat Tunnels in Sandy Ground. Soils Found. 2023, 63, 101323. [Google Scholar] [CrossRef]
- Nasrullah, N.; Kian, L.I.; Khan, S.; Ahmad, A.; Ishtiaq, T.; Rashid, M.; Islam, I. Land Subsidence Resulting from Reservoir Overexploitation and Karez Collapse in Mastung and Quetta Districts, Baluchistan, Pakistan. Environ. Earth Sci. 2024, 83, 455. [Google Scholar] [CrossRef]
- Rayhani, M.; El Naggar, M.H. Collapse Hazard Zonation of Qanats in Greater Tehran Area. Geotech. Geol. Eng. 2007, 25, 327–338. [Google Scholar] [CrossRef]
- Semsar Yazdi, A.A.; Labbaf Khaneiki, M. (Eds.) Qanat Maintenance and Preservation. In Qanat Knowledge: Construction and Maintenance; Springer: Dordrecht, The Netherlands, 2017; pp. 117–143. ISBN 978-94-024-0957-4. [Google Scholar]
- Ebrahimi, A.; Mehraban, Y.; Omidvarborna, H.; Vakilinejad, A.; Al-Sayigh, A.R.S. Kariz (Ancient Aqueduct) System: A Review on Geoengineering and Environmental Studies. Environ. Earth Sci. 2021, 80, 236. [Google Scholar] [CrossRef]
- Baghban Golpasand, M.-R.; Do, N.A.; Dias, D. Impact of Pre-Existent Qanats on Ground Settlements Due to Mechanized Tunneling. Transp. Geotech. 2019, 21, 100262. [Google Scholar] [CrossRef]
- Zhu, Z.; Tang, C.; Ma, Y.; Luo, F.; Luo, B.; Zou, Z.; Guo, Z.; Jang, X. Train-Induced Vibration and Subsidence Prediction of the Permafrost Subgrade along the Qinghai-Tibet Railway. Soil Dyn. Earthq. Eng. 2022, 162, 107433. [Google Scholar] [CrossRef]
- Gyani, J.; Ahmed, A.; Haq, M.A. MCDM and Various Prioritization Methods in AHP for CSS: A Comprehensive Review. IEEE Access 2022, 10, 33492–33511. [Google Scholar] [CrossRef]
- Lyu, H.-M.; Yin, Z.-Y.; Zhou, A.; Shen, S.-L. MCDM-Based Flood Risk Assessment of Metro Systems in Smart City Development: A Review. Environ. Impact Assess. Rev. 2023, 101, 107154. [Google Scholar] [CrossRef]
- Shao, M.; Han, Z.; Sun, J.; Gao, H.; Zhang, S.; Zhao, Y. A Novel Framework for Wave Power Plant Site Selection and Wave Forecasting Based on GIS, MCDM, and ANN Methods: A Case Study in Hainan Island, Southern China. Energy Convers. Manag. 2024, 299, 117816. [Google Scholar] [CrossRef]
- Vahidnia, M.H.; Vahidi, H.; Hassanabad, M.G.; Shafiei, M. A Spatial Decision Support System Based on a Hybrid AHP and TOPSIS Method for Fire Station Site Selection. J. Geovis. Spat. Anal. 2022, 6, 30. [Google Scholar] [CrossRef]
- Akay, H. Flood Hazards Susceptibility Mapping Using Statistical, Fuzzy Logic, and MCDM Methods. Soft Comput. 2021, 25, 9325–9346. [Google Scholar] [CrossRef]
- Awodi, N.J.; Liu, Y.; Ayo-Imoru, R.M.; Ayodeji, A. Fuzzy TOPSIS-Based Risk Assessment Model for Effective Nuclear Decommissioning Risk Management. Prog. Nucl. Energy 2023, 155, 104524. [Google Scholar] [CrossRef]
- Nyimbili, P.H.; Erden, T.; Karaman, H. Integration of GIS, AHP and TOPSIS for Earthquake Hazard Analysis. Nat. Hazards 2018, 92, 1523–1546. [Google Scholar] [CrossRef]
- Norouzi, A.; Namin, H.G. A Hybrid Fuzzy TOPSIS—Best Worst Method for Risk Prioritization in Megaprojects. Civ. Eng. J. 2019, 5, 1257–1272. [Google Scholar] [CrossRef]
- Majumdar, B.B.; Dissanayake, D.; Rajput, A.S.; Saw, Y.Q.; Sahu, P.K. Prioritizing Metro Service Quality Attributes to Enhance Commuter Experience: TOPSIS Ranking and Importance Satisfaction Analysis Methods. Transp. Res. Rec. 2020, 2674, 124–139. [Google Scholar] [CrossRef]
- Zhang, H.; Sun, Q. An Integrated MCDM Approach to Train Derailment Risk Response Strategy Selection. Symmetry 2020, 12, 47. [Google Scholar] [CrossRef]
- Keshavarz-Ghorabaee, M. Assessment of Distribution Center Locations Using a Multi-Expert Subjective–Objective Decision-Making Approach. Sci. Rep. 2021, 11, 19461. [Google Scholar] [CrossRef] [PubMed]
- Singh, M.; Pant, M. A Review of Selected Weighing Methods in MCDM with a Case Study. Int. J. Syst. Assur. Eng. Manag. 2021, 12, 126–144. [Google Scholar] [CrossRef]
- Wu, M.; Wang, Y. Which Objective Weight Method Is Better: PCA or Entropy? Sci. J. Res. Rev. (SJRR) 2022, 3. [Google Scholar] [CrossRef]
- Ecer, F.; Pamucar, D.; Mardani, A.; Alrasheedi, M. Assessment of Renewable Energy Resources Using New Interval Rough Number Extension of the Level Based Weight Assessment and Combinative Distance-Based Assessment. Renew. Energy 2021, 170, 1156–1177. [Google Scholar] [CrossRef]
- Žižović, M.; Pamucar, D. New Model for Determining Criteria Weights: Level Based Weight Assessment (LBWA) Model. Decis. Mak. Appl. Manag. Eng. 2019, 2, 126–137. [Google Scholar] [CrossRef]
- de Araújo Costa, A.P.; Choren, R.; de Moura Pereira, D.A.; Terra, A.V.; de Araújo Costa, I.P.; de Souza Rocha Junior, C.; Santos, M.D.; Gomes, C.F.S.; Moreira, M.Â.L. Integrating Multicriteria Decision Making and Principal Component Analysis: A Systematic Literature Review. Cogent Eng. 2024, 11, 2374944. [Google Scholar] [CrossRef]
- Moghtadernejad, S.; Chouinard, L.E.; Mirza, M.S. Enhanced Façade Design: A Data-Driven Approach for Decision Analysis Based on Past Experiences. Dev. Built Environ. 2021, 5, 100038. [Google Scholar] [CrossRef]
- Soori, M.; Jough, F.K.G.; Dastres, R.; Arezoo, B. Additive Manufacturing Modification by Artificial Intelligence, Machine Learning, and Deep Learning: A Review. Addit. Manuf. Front. 2025, 4, 200198. [Google Scholar] [CrossRef]
- Ge, Y.; Wang, H.; Liu, G.; Chen, Q.; Tang, H. Automated Identification of Rock Discontinuities from 3D Point Clouds Using a Convolutional Neural Network. Rock Mech. Rock Eng. 2025, 58, 3683–3700. [Google Scholar] [CrossRef]
- Liao, H.; He, Y.; Wu, X.; Wu, Z.; Bausys, R. Reimagining Multi-Criterion Decision Making by Data-Driven Methods Based on Machine Learning: A Literature Review. Inf. Fusion 2023, 100, 101970. [Google Scholar] [CrossRef]
- Tawil, A.-R.H.; Mohamed, M.; Schmoor, X.; Vlachos, K.; Haidar, D. Trends and Challenges towards Effective Data-Driven Decision Making in UK Small and Medium-Sized Enterprises: Case Studies and Lessons Learnt from the Analysis of 85 Small and Medium-Sized Enterprises. Big Data Cogn. Comput. 2024, 8, 79. [Google Scholar] [CrossRef]
- Maćkiewicz, A.; Ratajczak, W. Principal Components Analysis (PCA). Comput. Geosci. 1993, 19, 303–342. [Google Scholar] [CrossRef]
- Bro, R.; Smilde, A.K. Principal Component Analysis. Anal. Methods 2014, 6, 2812–2831. [Google Scholar] [CrossRef]
- Abdu, H.A. Classification Accuracy and Trend Assessments of Land Cover- Land Use Changes from Principal Components of Land Satellite Images. Int. J. Remote Sens. 2019, 40, 1275–1300. [Google Scholar] [CrossRef]
- Zhang, X.; Jiang, X.; Jiang, J.; Zhang, Y.; Liu, X.; Cai, Z. Spectral–Spatial and Superpixelwise PCA for Unsupervised Feature Extraction of Hyperspectral Imagery. IEEE Trans. Geosci. Remote Sens. 2022, 60, 1–10. [Google Scholar] [CrossRef]
- Dong, W.; Woźniak, M.; Wu, J.; Li, W.; Bai, Z. Denoising Aggregation of Graph Neural Networks by Using Principal Component Analysis. IEEE Trans. Ind. Inform. 2023, 19, 2385–2394. [Google Scholar] [CrossRef]
- Singh, M.; Pant, M.; Kong, L.; Alijani, Z.; Snasel, V. A PCA-Based Fuzzy Tensor Evaluation Model for Multiple-Criteria Group Decision Making. Appl. Soft Comput. 2023, 132, 109753. [Google Scholar] [CrossRef]
- Tanim, A.H.; Goharian, E.; Moradkhani, H. Integrated Socio-Environmental Vulnerability Assessment of Coastal Hazards Using Data-Driven and Multi-Criteria Analysis Approaches. Sci. Rep. 2022, 12, 11625. [Google Scholar] [CrossRef]
- Sadatrasool, M.; Bozorgi-Amiri, A.; Yousefi-Babadi, A. Project Manager Selection Based on Project Manager Competency Model: PCA–MCDM Approach. J. Proj. Manag. 2016, 1, 7–20. [Google Scholar] [CrossRef]
- Dugger, Z.; Halverson, G.; McCrory, B.; Claudio, D. Principal Component Analysis in MCDM: An Exercise in Pilot Selection. Expert Syst. Appl. 2022, 188, 115984. [Google Scholar] [CrossRef]
- de Araújo Costa, A.P.; Terra, A.V.; de Souza Rocha Junior, C.; de Araújo Costa, I.P.; Moreira, M.Â.L.; dos Santos, M.; Gomes, C.F.S.; da Silva, A.S. Optimization of Obstructive Sleep Apnea Management: Novel Decision Support via Unsupervised Machine Learning. Informatics 2024, 11, 22. [Google Scholar] [CrossRef]
- Taghavi-Jeloudar, M.; Han, M.; Davoudi, M.; Kim, M. Review of Ancient Wisdom of Qanat, and Suggestions for Future Water Management. Environ. Eng. Res. 2013, 18, 57–63. [Google Scholar] [CrossRef]
- Chen, Y.-C. A Tutorial on Kernel Density Estimation and Recent Advances. Biostat. Epidemiol. 2017, 1, 161–187. [Google Scholar] [CrossRef]
- Shiraazi, K.; Milani, M.A.; Sadeghi, A.; Azami, E.; Azami, A. Qanat (Subterranean Canal) Role in Traditional Cities and Settlements Formation of Hot-Arid Regions of Iran. World Acad. Sci. Eng. Technol. 2012, 6, 385–390. [Google Scholar]
- Phien-wej, N.; Giao, P.H.; Nutalaya, P. Land Subsidence in Bangkok, Thailand. Eng. Geol. 2006, 82, 187–201. [Google Scholar] [CrossRef]
- Rahnema, H.; Mirassi, S. Studying Land Subsidence around the City of Shiraz. Sci. Iran. 2016, 23, 882–895. [Google Scholar] [CrossRef]
- Kouroussis, G.; Connolly, D.P.; Verlinden, O. Railway-Induced Ground Vibrations—A Review of Vehicle Effects. Int. J. Rail Transp. 2014, 2, 69–110. [Google Scholar] [CrossRef]
- Semblat, J.-F.; Lenti, L.; Jacqueline, D.; Leblond, J.-J.; Grasso, E. Railway Vibrations Induced into the Soil: Experiments, Modelling and Isolation. - Vibrations Induites Dans Les Sols Par Le Trafic Ferroviaire: Expérimentations, Modélisations et Isolation. arXiv 2011, arXiv:1108.3404. [Google Scholar]
- Remennikov, A.M.; Kaewunruen, S. A Review of Loading Conditions for Railway Track Structures Due to Train and Track Vertical Interaction. Struct. Control Health Monit. 2008, 15, 207–234. [Google Scholar] [CrossRef]
- Tang, Y.; Xiao, S.; Yang, Q. Numerical Study of Dynamic Stress Developed in the High Speed Rail Foundation under Train Loads. Soil Dyn. Earthq. Eng. 2019, 123, 36–47. [Google Scholar] [CrossRef]
- Patro, S.G.K.; Sahu, K.K. Normalization: A Preprocessing Stage. arXiv 2015, arXiv:1503.06462. [Google Scholar] [CrossRef]
- Ewart, M.; Santos, J.; Pacheco, A.; Monteiro, J.; Sequeira, C. On a New Method to Design Solar Photovoltaic Systems in Renewable Energy Communities: The Case of Culatra Island (Ria Formosa, Portugal). Energy 2023, 285, 129257. [Google Scholar] [CrossRef]
- Zhang, H.; Ji, Y.; Qu, S.; Li, H.; Li, Y. Data-Driven Robust Cost Consensus Model with Individual Adjustment Willingness in Group Decision-Making. Comput. Ind. Eng. 2023, 183, 109455. [Google Scholar] [CrossRef]
- Petroni, A.; Braglia, M. Vendor Selection Using Principal Component Analysis. J. Supply Chain Manag. 2000, 36, 63–69. [Google Scholar] [CrossRef]
- Abdi, H.; Williams, L.J. Principal Component Analysis. WIREs Comput. Stat. 2010, 2, 100. [Google Scholar] [CrossRef]
- Hwang, C.-L.; Yoon, K. Multiple Attribute Decision Making. In Lecture Notes in Economics and Mathematical Systems; Springer: Berlin/Heidelberg, Germany, 1981; Volume 186, ISBN 978-3-540-10558-9. [Google Scholar]
- Chen, S.-J.; Hwang, C.-L. (Eds.) Fuzzy Multiple Attribute Decision Making Methods. In Fuzzy Multiple Attribute Decision Making: Methods and Applications; Springer: Berlin/Heidelberg, Germany, 1992; pp. 289–486. ISBN 978-3-642-46768-4. [Google Scholar]
- Tiwari, A.; Pallavi, D.R.; Saravanan, V.; Amudha, M.; Ramachandran, M. A Study on the Selection of Commercially Available Scooters in the Indian Market Using the TOPSIS Method. In Proceedings of the Intelligent Computing and Optimization; Vasant, P., Panchenko, V., Munapo, E., Weber, G.-W., Thomas, J.J., Intan, R., Shamsul Arefin, M., Eds.; Springer: Cham, Switzerland, 2024; pp. 242–248. [Google Scholar]
- Behzadian, M.; Khanmohammadi Otaghsara, S.; Yazdani, M.; Ignatius, J. A State-of the-Art Survey of TOPSIS Applications. Expert Syst. Appl. 2012, 39, 13051–13069. [Google Scholar] [CrossRef]
- Yal, G.; Akgun, H. Landfill Site Selection and Landfill Liner Design for Ankara, Turkey. Environ. Earth Sci. 2013, 70, 2729–2752. [Google Scholar] [CrossRef]
- Wang, C.-N.; Thi Pham, T.-D.; Nguyen, D.-B. A Study of Appropriate Wave Energy Technology for Sustainable Development in Australia. J. Eng. Res. 2024. [Google Scholar] [CrossRef]
- Hanine, M.; Boutkhoum, O.; Tikniouine, A.; Agouti, T. Application of an Integrated Multi-Criteria Decision Making AHP-TOPSIS Methodology for ETL Software Selection. SpringerPlus 2016, 5, 263. [Google Scholar] [CrossRef]
- Boroushaki, S. Entropy-Based Weights for MultiCriteria Spatial Decision-Making. In Yearbook of the Association of Pacific Coast Geographers; University of Hawaii Press: Honolulu, HI, USA, 2017; Volume 79, pp. 168–187. [Google Scholar]
- Wu, R.M.X.; Zhang, Z.; Yan, W.; Fan, J.; Gou, J.; Liu, B.; Gide, E.; Soar, J.; Shen, B.; Fazal-e-Hasan, S.; et al. A Comparative Analysis of the Principal Component Analysis and Entropy Weight Methods to Establish the Indexing Measurement. PLoS ONE 2022, 17, e0262261. [Google Scholar] [CrossRef] [PubMed]
- Mukhametzyanov, I. Specific Character of Objective Methods for Determining Weights of Criteria in MCDM Problems: Entropy, CRITIC and SD. Decis. Mak. Appl. Manag. Eng. 2021, 4, 76–105. [Google Scholar] [CrossRef]


| PC1 | PC2 | PC3 | PC4 | PC5 | PC6 | |
|---|---|---|---|---|---|---|
| Eigenvalue | 0.127 | 0.029 | 0.013 | 0.001 | 4.6 × 10⁻⁴ | 3 × 10⁻⁵ |
| Proportion of Variance | 0.747 | 0.172 | 0.074 | 0.005 | 0.003 | 1.8 × 10⁻⁴ |
| Cumulative Percentage of Variance (%) | 74.659 | 91.833 | 99.194 | 99.712 | 99.982 | 100 |
| Criteria | Eigenvector | |||||
| Qanat channel density | 0.529 | −0.196 | 0.012 | 0.801 | 0.196 | −0.036 |
| Qanat well density | 0.230 | 0.316 | 0.916 | −0.076 | −0.047 | 0.008 |
| Discharge rate of the Qanat | 0.517 | −0.206 | −0.116 | −0.193 | −0.799 | 0.026 |
| Depth of the Qanat | 0.551 | −0.242 | −0.072 | −0.559 | 0.565 | 0.011 |
| Railway traffic | 0.217 | 0.605 | −0.259 | −0.024 | 0.005 | −0.721 |
| Railway passing load | 0.222 | 0.628 | −0.274 | 0.033 | 0.036 | 0.692 |
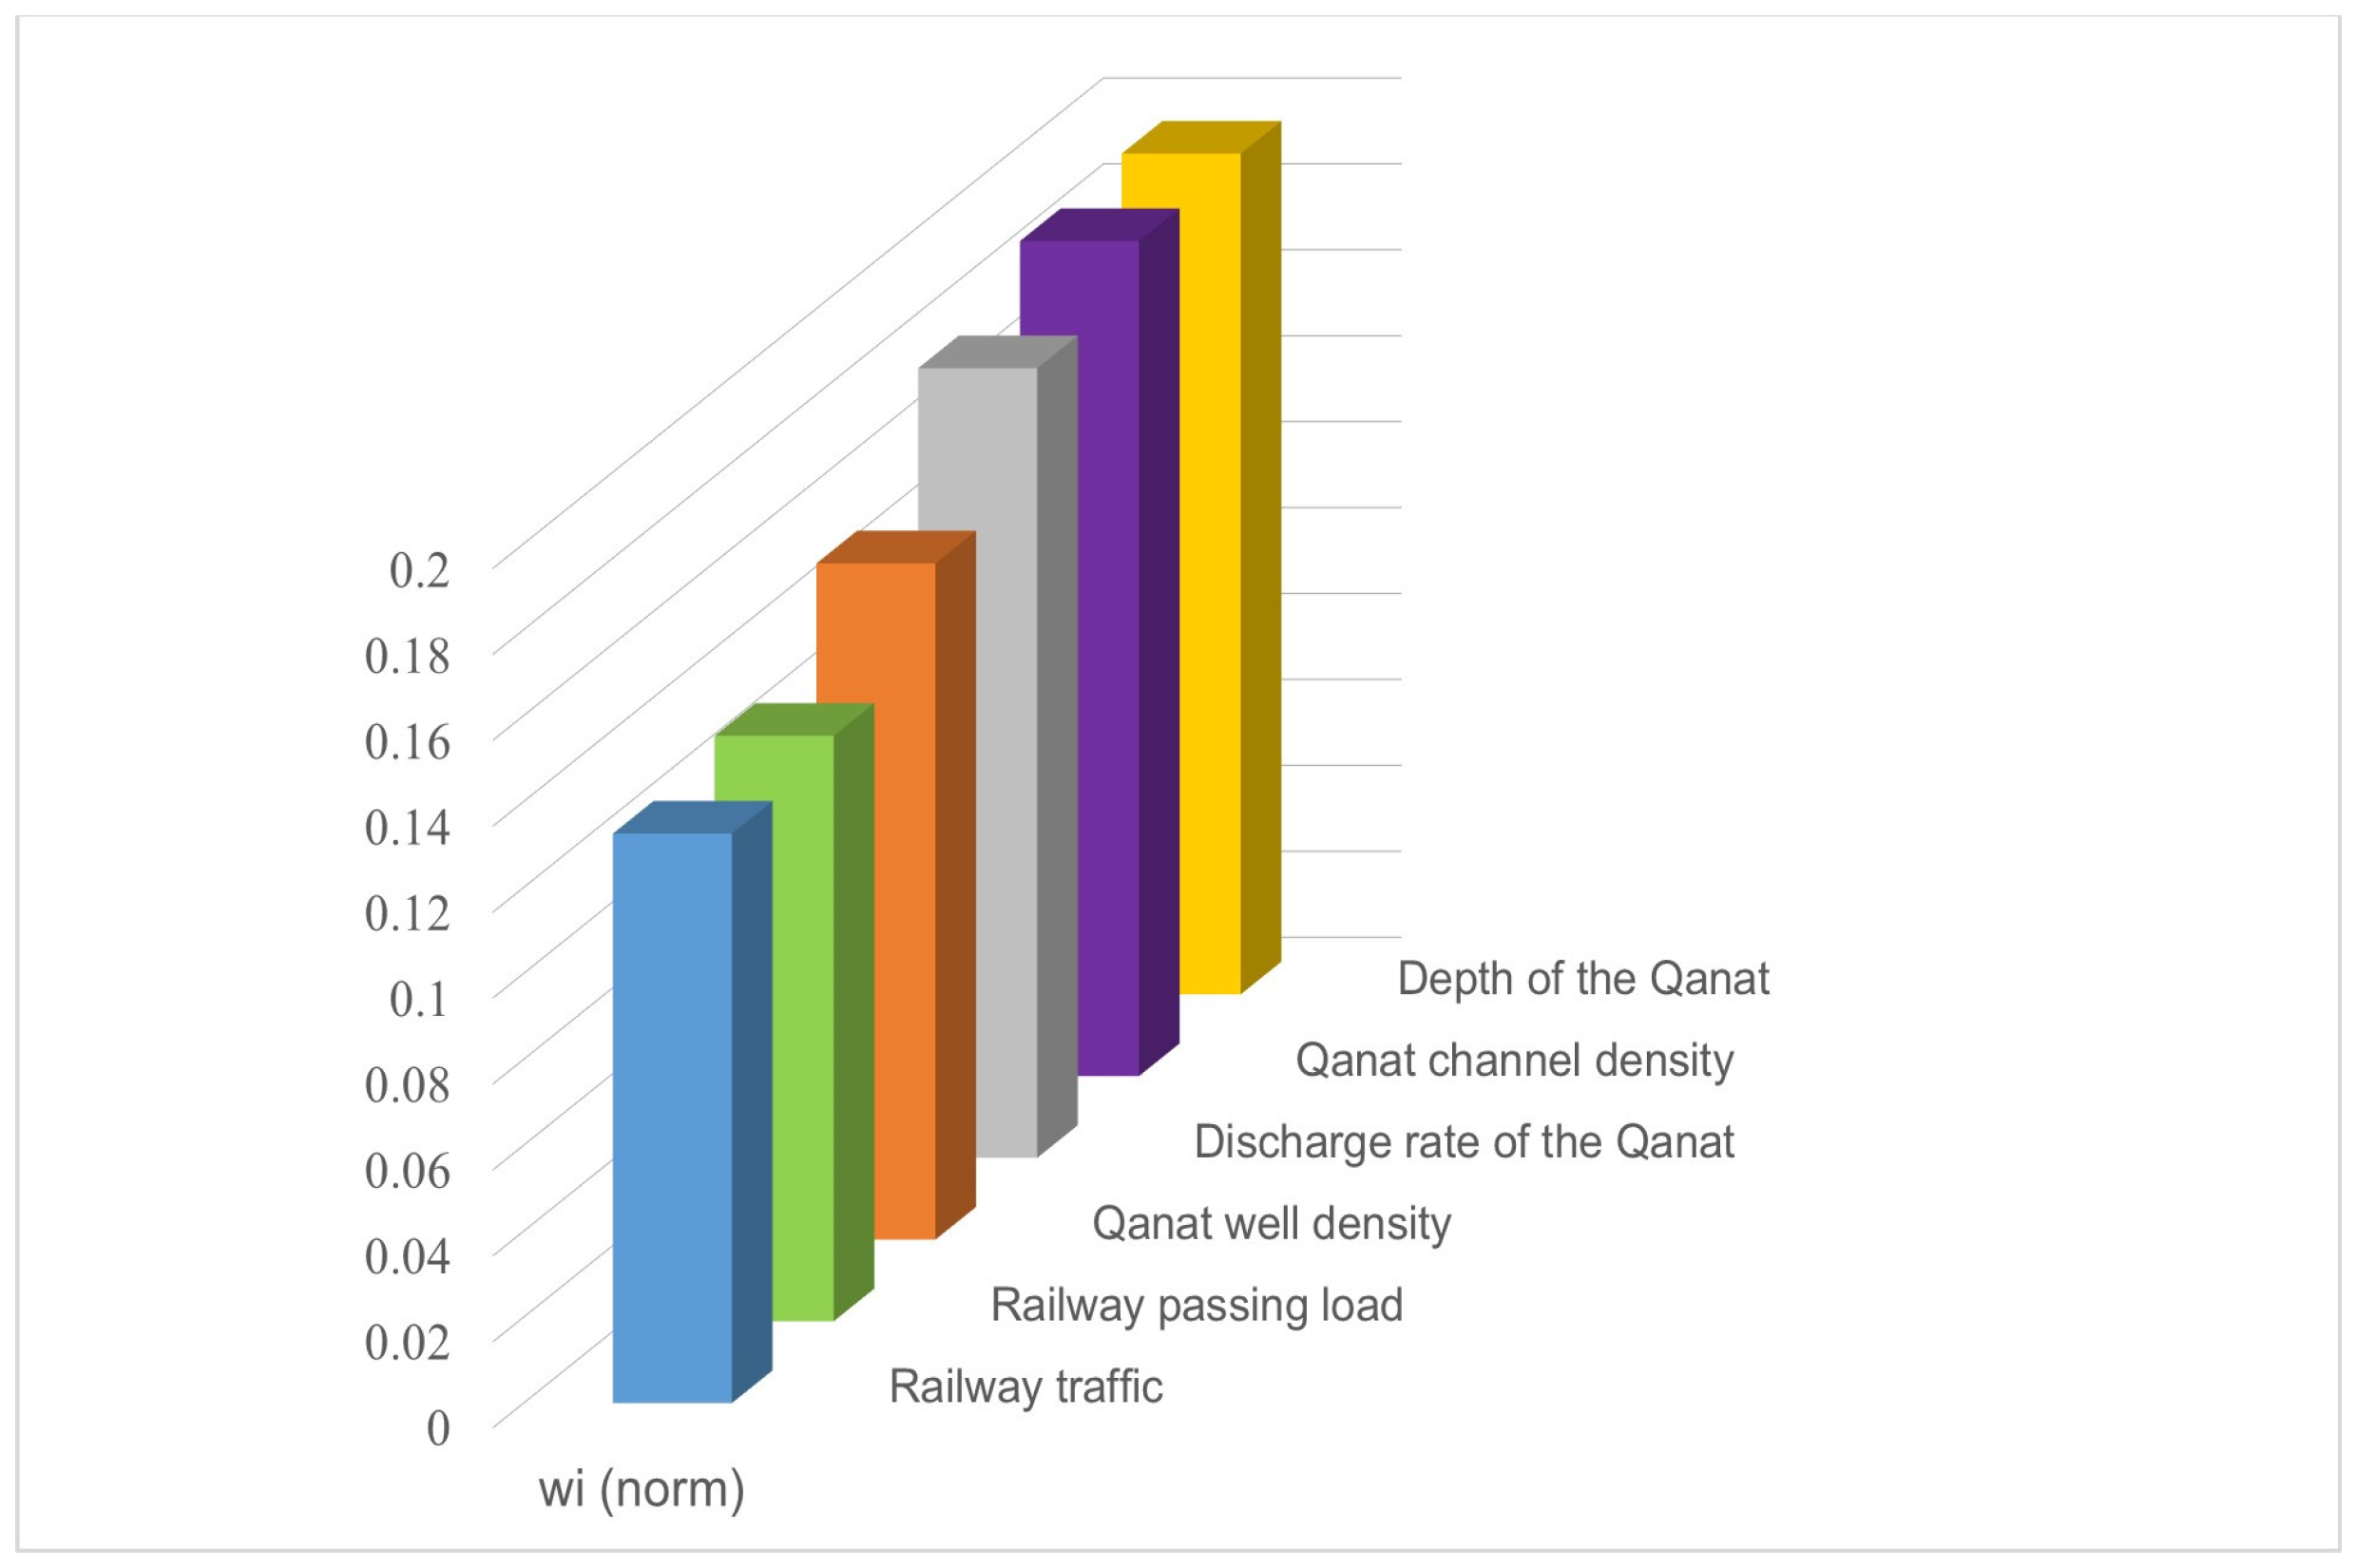
| Criteria | wi (Calculated Weight) | winorm (Proportion of wi) |
|---|---|---|
| Qanat channel density | 0.362 | 0.194 |
| Qanat well density | 0.293 | 0.157 |
| Discharge rate of the Qanat | 0.342 | 0.184 |
| Depth of the Qanat | 0.364 | 0.196 |
| Railway traffic | 0.247 | 0.133 |
| Railway passing load | 0.254 | 0.136 |
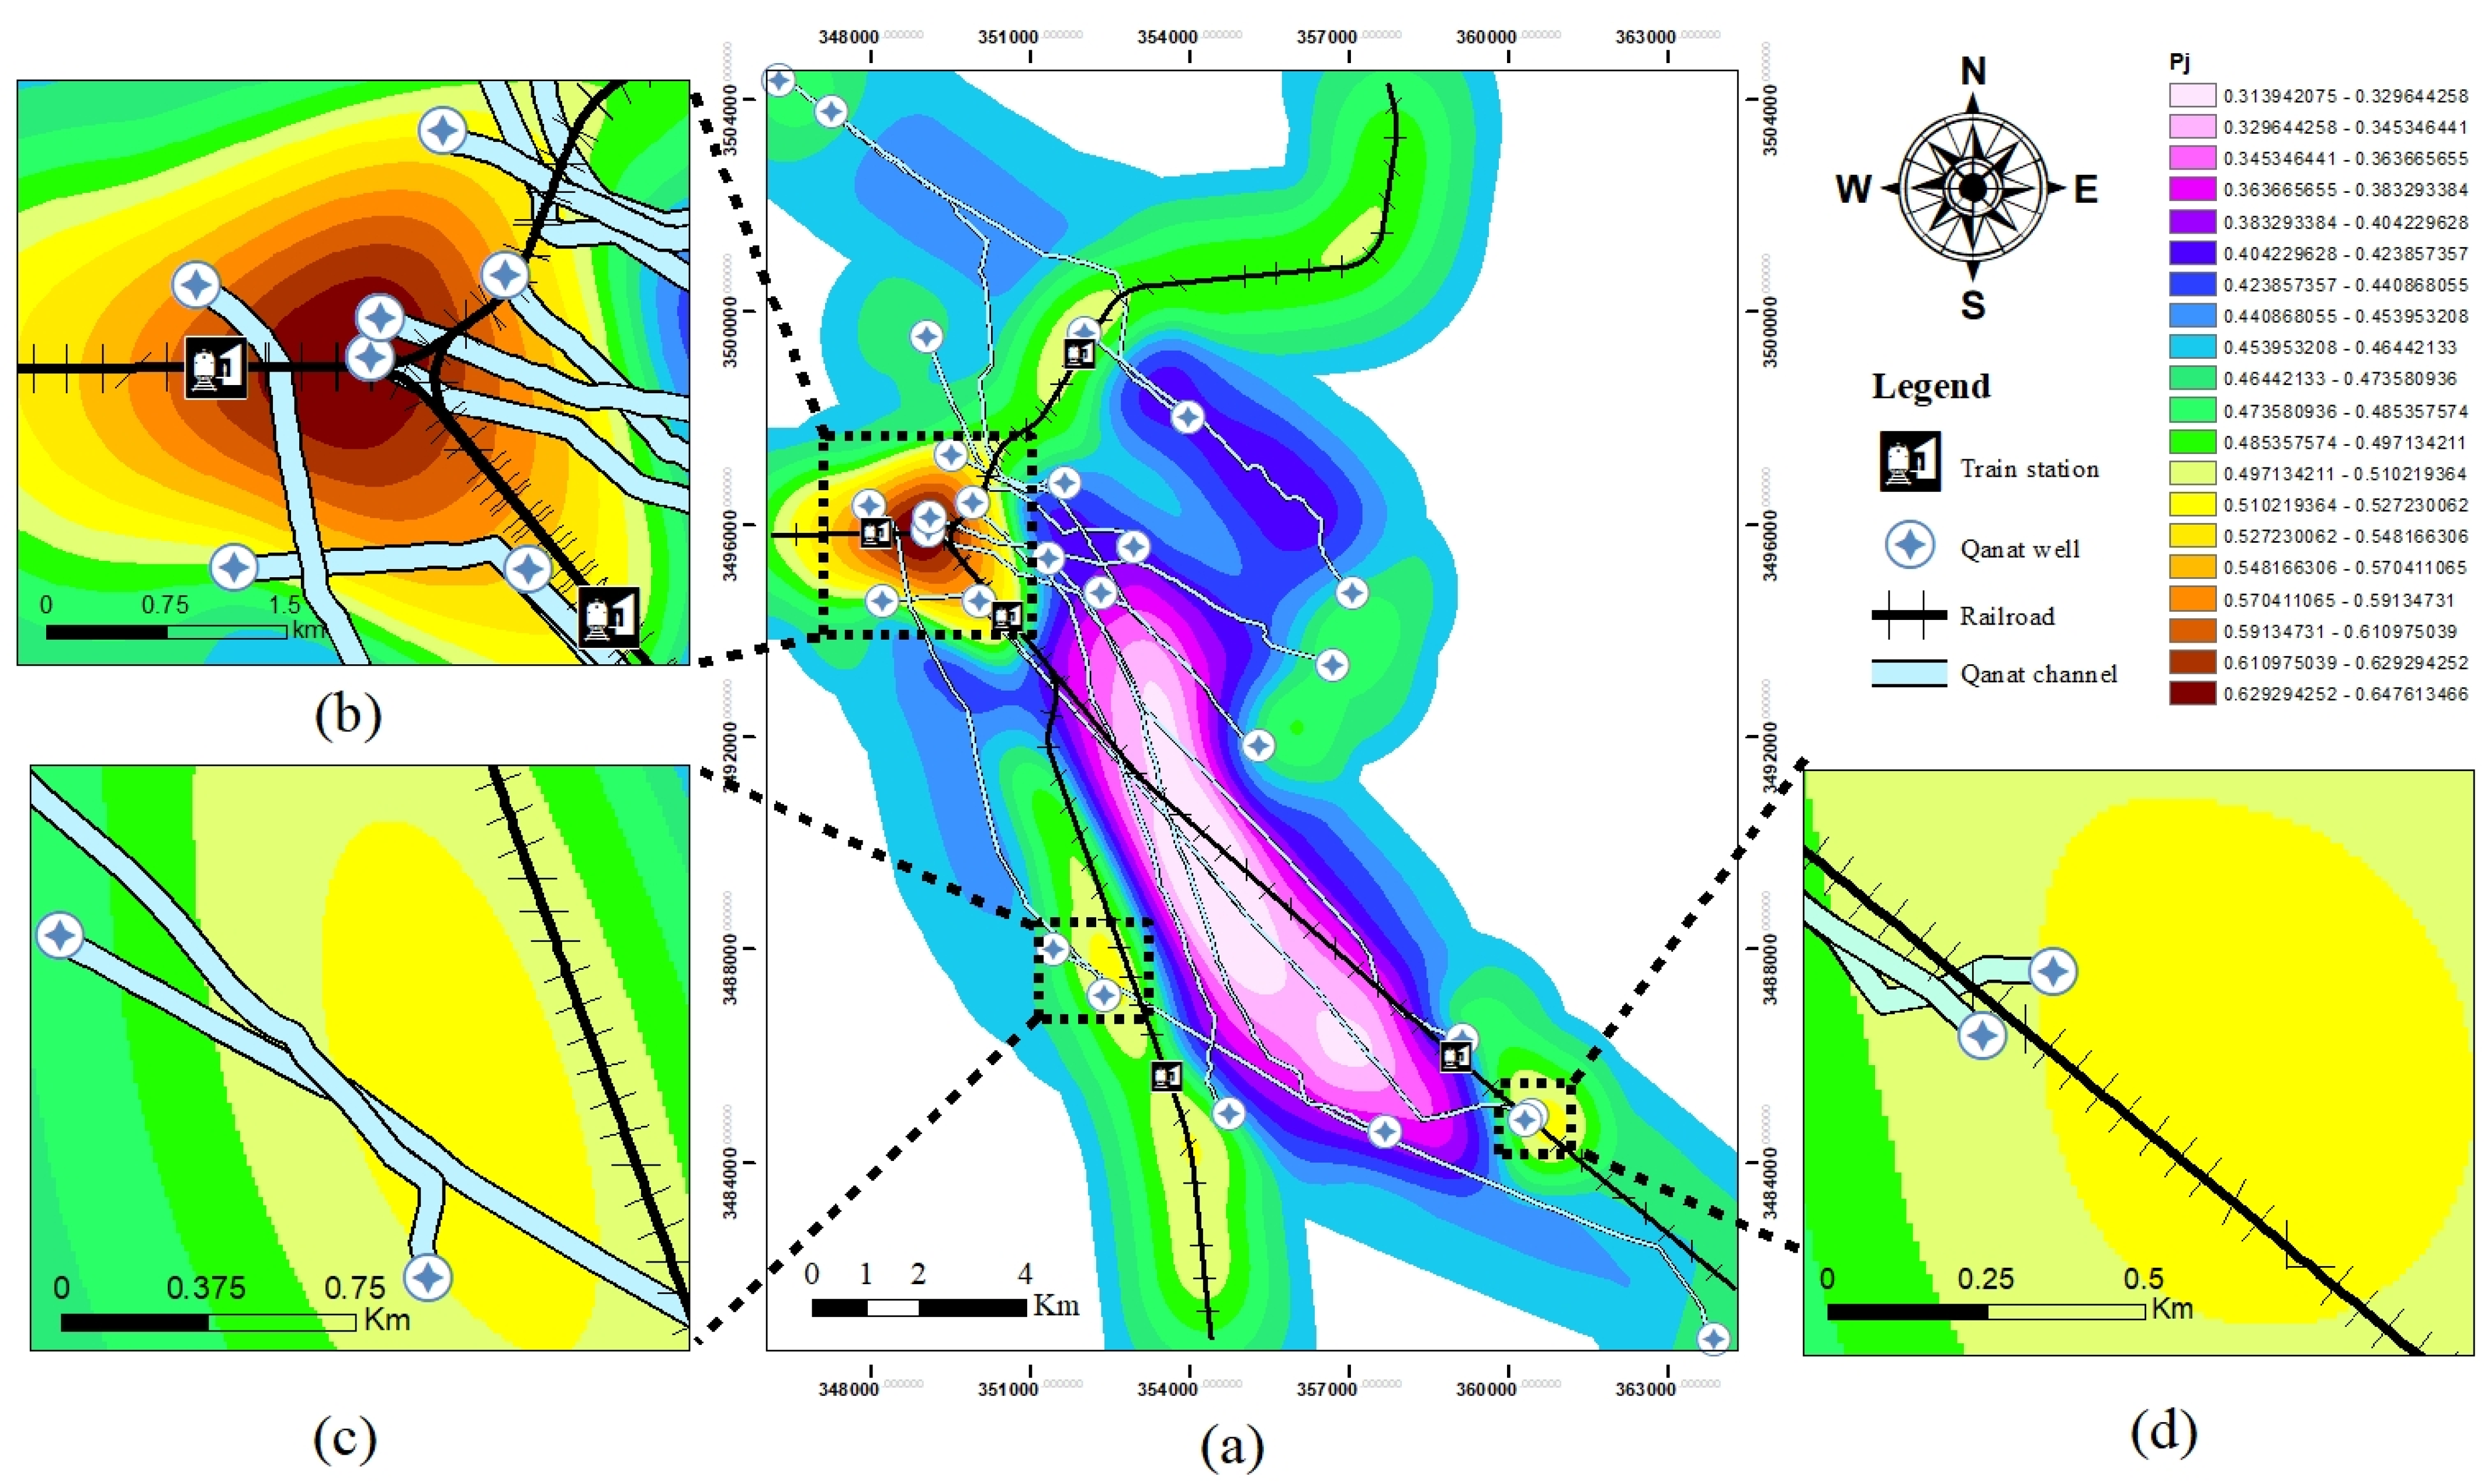
| Category | Pj (Performance Score) | Area (km2) | Length of Railway (km) | Number of Railway Stations |
|---|---|---|---|---|
| Low susceptibility | 0.314 < Pj < 0.430 | 53.4 | 11.8 | 1 |
| Moderate susceptibility | 0.430 < Pj < 0.530 | 206.4 | 34 | 3 |
| High susceptibility | 0.530 < Pj < 0.648 | 7.7 | 15 | 1 |
Disclaimer/Publisher’s Note: The statements, opinions and data contained in all publications are solely those of the individual author(s) and contributor(s) and not of MDPI and/or the editor(s). MDPI and/or the editor(s) disclaim responsibility for any injury to people or property resulting from any ideas, methods, instructions or products referred to in the content. |
© 2025 by the authors. Published by MDPI on behalf of the International Society for Photogrammetry and Remote Sensing. Licensee MDPI, Basel, Switzerland. This article is an open access article distributed under the terms and conditions of the Creative Commons Attribution (CC BY) license (https://creativecommons.org/licenses/by/4.0/).
Share and Cite
Naeimiasl, F.; Vahidi, H.; Soheili, N. Leveraging Principal Component Analysis for Data-Driven and Objective Weight Assignment in Spatial Decision-Making Framework for Qanat-Induced Subsidence Susceptibility Assessment in Railway Networks. ISPRS Int. J. Geo-Inf. 2025, 14, 195. https://doi.org/10.3390/ijgi14050195
Naeimiasl F, Vahidi H, Soheili N. Leveraging Principal Component Analysis for Data-Driven and Objective Weight Assignment in Spatial Decision-Making Framework for Qanat-Induced Subsidence Susceptibility Assessment in Railway Networks. ISPRS International Journal of Geo-Information. 2025; 14(5):195. https://doi.org/10.3390/ijgi14050195
Chicago/Turabian StyleNaeimiasl, Farzaneh, Hossein Vahidi, and Niloufar Soheili. 2025. "Leveraging Principal Component Analysis for Data-Driven and Objective Weight Assignment in Spatial Decision-Making Framework for Qanat-Induced Subsidence Susceptibility Assessment in Railway Networks" ISPRS International Journal of Geo-Information 14, no. 5: 195. https://doi.org/10.3390/ijgi14050195
APA StyleNaeimiasl, F., Vahidi, H., & Soheili, N. (2025). Leveraging Principal Component Analysis for Data-Driven and Objective Weight Assignment in Spatial Decision-Making Framework for Qanat-Induced Subsidence Susceptibility Assessment in Railway Networks. ISPRS International Journal of Geo-Information, 14(5), 195. https://doi.org/10.3390/ijgi14050195