1. Introduction
With the advancement of smartphones and wireless communication technologies, location-based social networks (LBSNs), such as Foursquare, Gowalla, and Yelp, have rapidly developed globally. Social platforms provide users with the convenience of sharing geographic locations, recording life events, and checking into points of interest (POIs), thus enabling people to explore the world around them more effectively. Meanwhile, the large amount of check-in data on these platforms—comprising geographical information (e.g., longitude and latitude), check-in timestamps, and social relationship data—has driven research into next POI recommendation systems. These systems aim to predict the next most likely POI that a user will visit based on their historical check-in sequences and other multimodal information. Such systems can enhance users’ exploration efficiency and service experience, thus attracting significant attention in both academic and commercial fields [
1].
Previous next POI recommendation methods treat user check-ins as a continuous sequence, predicting the next location by capturing dynamic user preferences and geographical factors. From traditional machine learning methods, such as Markov chains [
2,
3], matrix factorization [
4,
5], and Bayesian personalized ranking [
6,
7,
8], to deep learning-based methods, such as the use of recurrent neural networks [
9,
10,
11,
12], these methods, although capable of making predictions based on historical behavior data (such as check-in records), often overlook the social relationships between users and the underlying patterns behind their behavior. Specifically, the current next POI recommendation methods still face the following challenges.
Coarse user interest representation and neglect of intensity differences: Existing methods typically model a user’s interest in a POI as a binary variable (checked in vs. not checked in), thereby overlooking variations in interest intensity across different POIs. In practice, POIs that are visited more frequently provide a stronger signal of a user’s preferences. Consequently, leveraging check-in frequencies to model user interests at finer granularity is critical in enhancing the recommendation accuracy.
Single-faceted social modeling: Most existing methods rely solely on explicit friendship ties or compute user similarity based on behavioral patterns, without constructing a unified social graph that can capture latent influence mechanisms within the network. In reality, social networks encompass not only explicit friendships but also a wealth of implicit connections formed by shared interests and behaviors. Integrating both types of relationships into a comprehensive social graph is essential to fully exploit social information and improve the recommendation performance.
Lack of a unified framework for contextual integration: Factors such as user preferences, check-in timestamps, POI categories, and social influences all play critical roles in POI recommendation. However, existing models typically address only one or two of these aspects and lack a generalizable framework that cohesively integrates diverse contextual information.
Therefore, determining how to integrate check-in trajectories and social information to improve the accuracy of next POI prediction has become a critical challenge in recommendation systems. To address this issue, we propose a next POI prediction method based on graph neural networks and the Transformer architecture. To address Challenge (1), we first construct a global POI graph based on all users’ check-in sequences and use a graph convolutional network (GCN) to learn the representation of each POI node, capturing deep information from user trajectories. Next, we generate weighted POI embedding vectors as user representation vectors by using the check-in frequency of each POI in the user check-in matrix as weights. This method allows for a more accurate reflection of users’ interest preferences and alleviates the issues associated with binary representations in the check-in matrix, as detailed in
Section 4.1.
To address Challenge (2), we calculate the cosine similarity between the weighted POI embeddings of different users to obtain the similarity between users, which is then treated as an implicit friendship. We introduce user friendship relationships as explicit friendships, and, based on both implicit and explicit friendships, we construct a user social graph. This graph structure comprehensively represents the relationships between users and captures the potential influence of social networks on user behavior.
Building on this, we use the GraphSAGE [
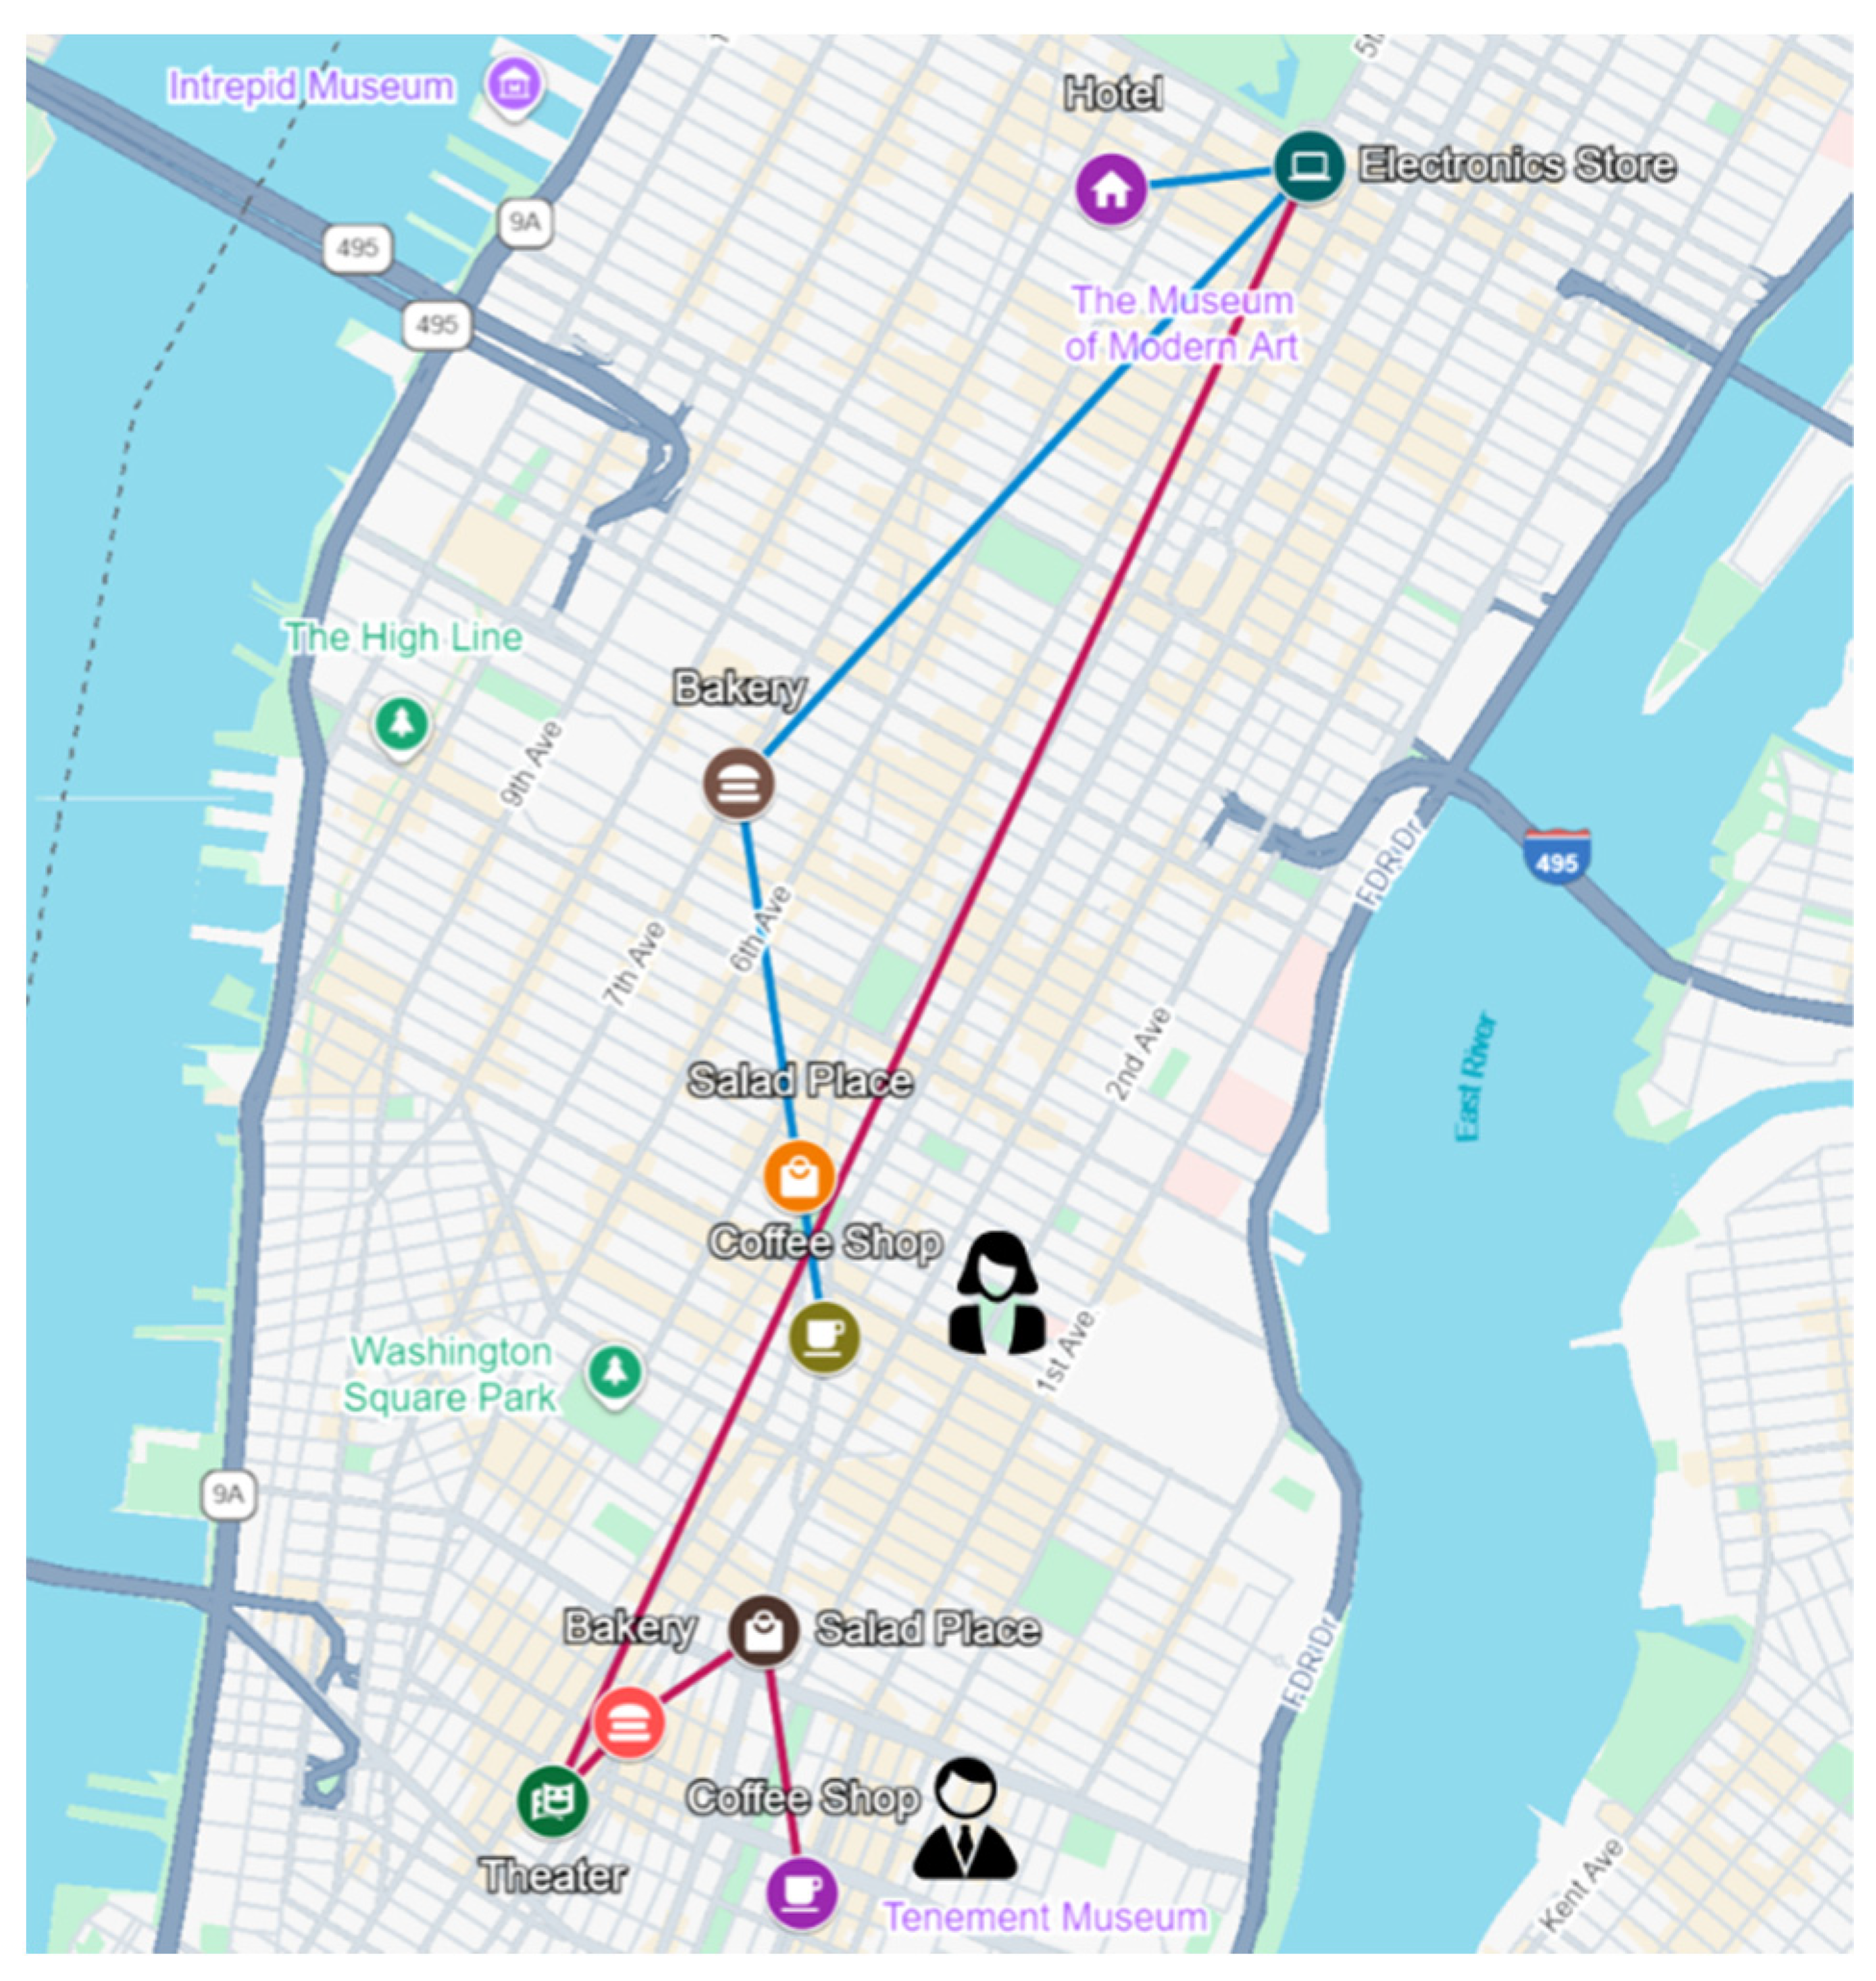
13] model for embedding learning, propagating information through graph convolutions in the social graph structure to further optimize the user embeddings. The underlying assumption of the user social graph is that a user’s behavior is influenced not only by their own historical actions but also by the actions of others within their social circle. For example, POIs recommended by friends are more likely to attract a user’s attention than those recommended by strangers. As shown in
Figure 1, two users with a friendship relationship exhibit highly similar check-in sequences. Therefore, social recommendation systems must fully leverage user similarities and social network information to improve the next POI recommendation accuracy. This approach effectively combines social relationships and behavioral data, thus enhancing the performance of social recommendation systems, as detailed in
Section 4.2.
Finally, to address Challenge (3), building upon the aforementioned innovative approach, we further adopt the Transformer architecture for next POI prediction using user embedding vectors. The encoder–decoder structure of the Transformer offers exceptional performance, being particularly suitable for the handling of sequential data and complex contextual relationships. We fuse POI embeddings, user embeddings, timestamp embeddings, and POI category embeddings and input them into the Transformer architecture for next POI prediction, as detailed in
Section 4.3.
In summary, the main contributions of this study are as follows.
We propose a novel model framework, TraFriendFormer, which is unique in its joint modeling of user check-in trajectories and their friendship relationships. This model utilizes graph neural networks and the Transformer architecture, effectively capturing user interests and the influence of friendships on their check-in behavior.
We develop a method for the construction of user representation vectors using weighted POI embedding vectors. These POI embeddings, generated with check-in frequencies as weights, serve as user representation vectors, capturing the intensity of user interest in different POIs.
We propose a novel method for the construction of a user social graph, which simultaneously considers user friendships and behavioral similarities to model the impact of social relationships on user check-ins. We use the GraphSAGE model to encode and embed the social graph.
We conduct extensive evaluation experiments on two real-world datasets to confirm the effectiveness and superiority of our model. The experimental results show that the proposed method outperforms baseline models across multiple metrics, thus demonstrating superior performance in terms of prediction accuracy and user preference capture. Additionally, we use ablation studies to validate the effectiveness of user friendship relationships.
2. Related Work
2.1. Next POI Recommendation Based on Graph Neural Networks
In recent years, with the rapid development of deep learning technologies and the promotion of complex data relationships in social networks, graph neural networks (GNNs) have garnered widespread attention [
14]. GNNs are effective tools to capture relationships between nodes in complex networks and generate high-dimensional, non-linear node representations, thereby obtaining high-quality node information. Monti et al. constructed user information as a graph structure and utilized GNNs to extract useful information from the nodes of both users and items in the network, which was then used to evaluate user preferences [
15]. Ying et al. proposed a method based on graph neural networks (GNNs) that utilizes random walks to better explore the relationships between nodes. By traversing multiple paths, more node information within these paths can be obtained, thus capturing the structural relationships between nodes in the network more effectively [
16]. Wang et al. introduced a neural graph collaborative filtering (NGCF) recommendation model, which encodes collaborative information in the form of higher-order connectivity by performing embedding propagation [
17]. Z. Zhong et al. proposed a hybrid graph convolutional network (GCN) model for POI recommendation based on a multi-head attention mechanism. This model constructs a spatial graph based on the geographical distances between POIs and uses GCNs to learn the higher-order connectivity between POIs. It not only considers spatial constraints but also overcomes the data sparsity problem [
18]. To fully leverage POI feature information, Wu et al. employed GCNs to model and learn the adjacent geographical locations of each POI. By integrating the features of adjacent POIs, this model learns the impact of geographical locations on user preferences [
18,
19]. Tang et al. proposed a region-aware POI recommendation model, which constructs a semantic space graph and uses GNNs to model the relationships between POIs within the semantic space, extracting POI regional features and user preferences [
20]. Abu et al. introduced an attention-based random walk method, which constructs a co-occurrence matrix to calculate attention weights and uses random walks to learn embedding information between nodes [
21]. Li et al. designed a POI sequence-to-graph enhanced recommendation model that jointly learns POI embeddings and infers temporal preferences, but it fails to represent global POI information [
22]. Lim et al. proposed a hierarchical multi-task graph recurrent network (HMT-GRN) method to alleviate the data sparsity issue, yet it also does not consider global information [
23].
The models mentioned above have made progress in addressing issues such as sparsity, mining higher-order adjacency information, and integrating spatiotemporal or attention mechanisms. However, they all overlook global transition patterns within users’ historical check-in sequences and lack the integration of multi-source contexts, such as trajectory flows, social relationships, and temporal categories.
2.2. Next POI Recommendation Based on User Social Networks
In next POI recommendation systems, relying solely on historical trajectories may lead to a decrease in recommendation accuracy [
24,
25]. As social beings, human decision-making is often influenced by factors such as social status, friends, neighbors, and culture, and these social influences play a significant role in users’ visits to POIs. In next POI recommendation systems, some users tend to explore new places that they have not visited before. This behavior complicates the prediction of their next move based only on historical trajectories. Therefore, when a user’s friends give positive feedback on a particular POI, the user is more likely to visit this place [
26]. To address the cold start problem, social circle information can also help the model to capture the preferences of new users. The system can improve the prediction performance by recommending POIs frequently visited by users’ friends. Thus, some methods enhance their recommendation performance by considering users’ social information [
27,
28,
29]. Kosar et al. incorporated social, geographic, and temporal information into matrix factorization (MF) and modeled predictions based on user similarities in co-check-ins and their friendship relationships [
30]. Christoforidis et al. combined social influences with spatial and temporal contexts, integrating graphs into a unified predictive model [
31]. Kefalas et al. attempted to use user reviews to capture social influences, considering that combining social influences with spatial and temporal contexts can significantly improve the recommendation quality [
32]. Fan et al. proposed a graph neural network model for social recommendations, which allows for the deeper modeling and learning of the user’s social network [
33]. L. Lim et al. constructed an undirected user–user graph, in which nodes represent users and edges represent the similarity between users [
34]. Huang et al. constructed various types of user–user social graphs based on users’ family and occupational backgrounds to improve the recommendation effectiveness [
35].
In summary, recent methods for next POI recommendation based on user social information have made progress by combining friendship relationships, social influences, and geographic–temporal contexts, achieving some success in alleviating cold start and data sparsity issues. However, these approaches often rely solely on explicit social networks or simple similarity measures, lacking the exploration of deeper social relationships. They also fail to capture global transition patterns in users’ POI visits and do not unify the integration of trajectory flows, social graphs, and spatiotemporal contexts.
3. Problem Formulation
We assume that represents the user set, represents the POI set, and represents the timestamps, where denote the number of users and POIs, respectively. represents the user, and represents the POI, with each POI containing , which represent the latitude, longitude, and category information of the POI, respectively.
Check-in: A check-in made by each user is represented as a tuple , which indicates that user visited POI at time . The check-in frequency of a user for a particular POI is represented by a matrix , where each entry represents the number of times that user checked in at POI .
Trajectory: The entire check-in sequence of user is sorted by time as , where represents the check-in record. For a more fine-grained analysis, we divide each user’s check-in sequence into weekly intervals, i.e., , where represents the check-in records of user during the week.
Next POI recommendation: Given a user’s check-in sequence , the goal of next POI recommendation is to predict the most likely POI that the user will visit next, denoted as . Specifically, the next POI recommendation system needs to select a set of POIs from that best matches the user’s next visit behavior.
4. Methods
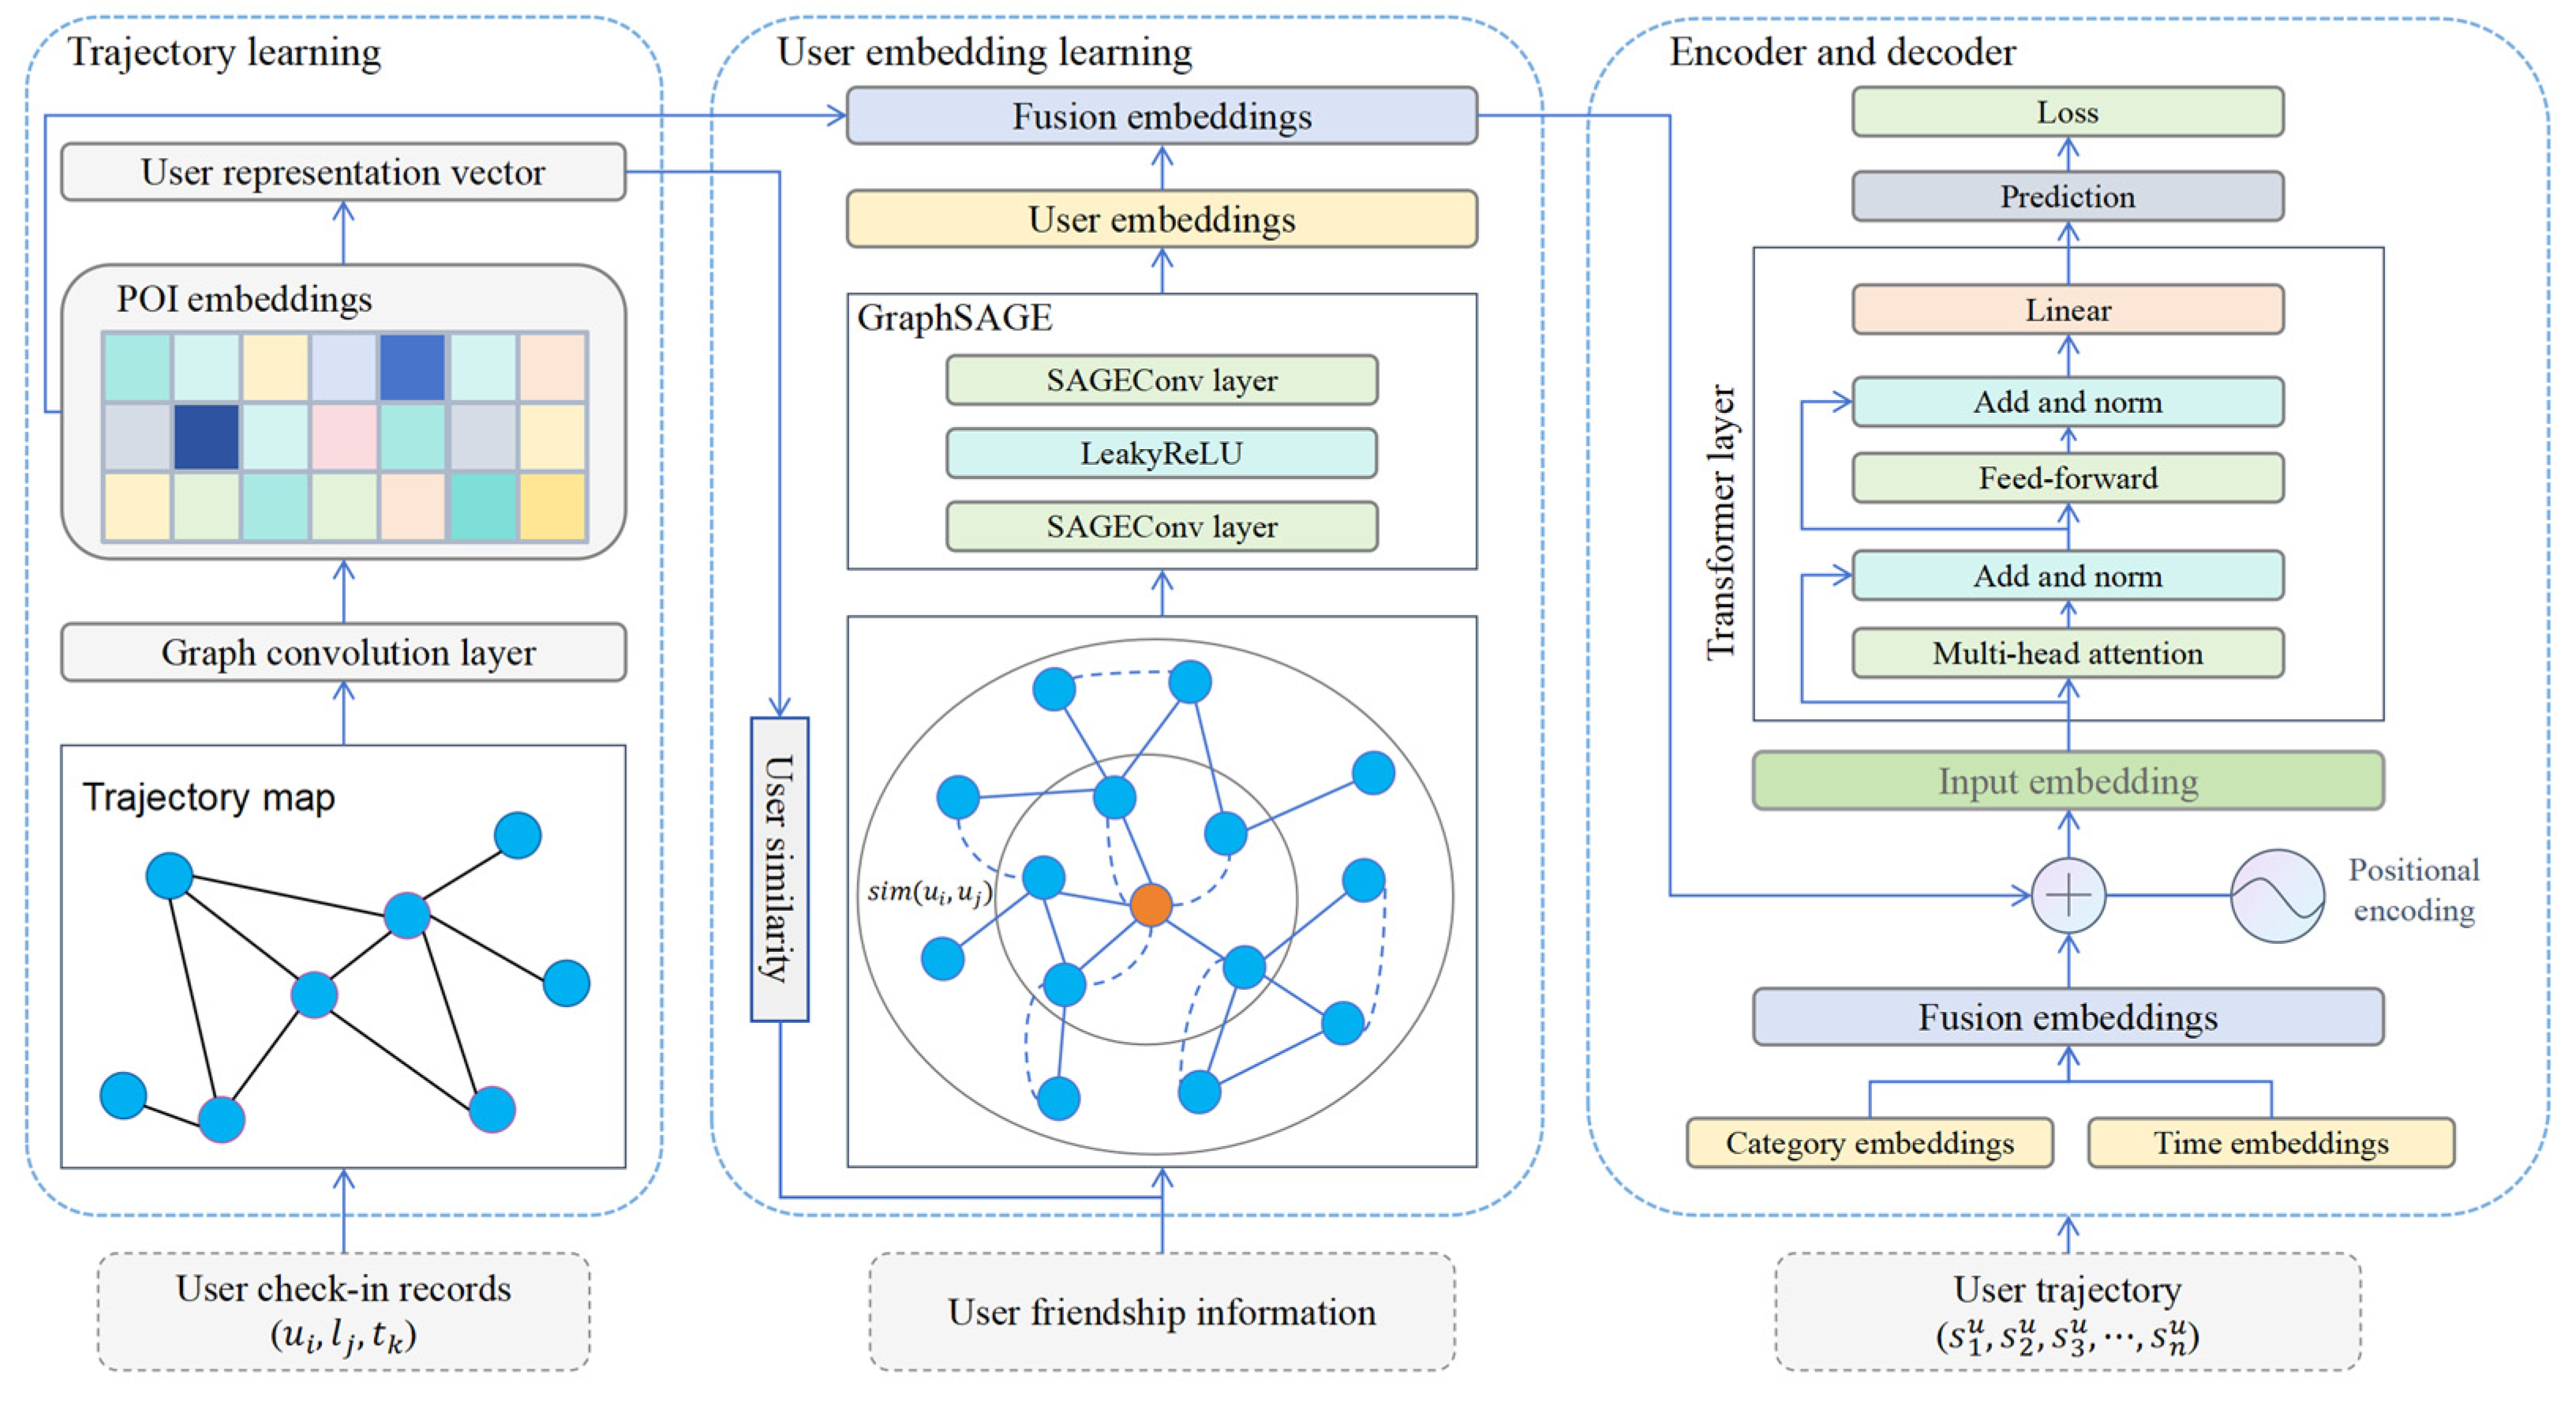
The proposed TraFriendFormer model is illustrated in
Figure 2 and consists of three components. (1) Trajectory Learning: We construct a global trajectory flow graph and use a graph convolutional network (GCN) to learn POI embeddings. Based on user check-ins, we build a weighted interest representation vector for each user. (2) User Embedding Learning: We combine implicit friendships (based on user representation vectors) and explicit friendships (based on user social relationships) to construct a user social graph. The GraphSAGE model is used to learn user embeddings. (3) Encoder–Decoder: In addition to POI embeddings and user embeddings, we also consider timestamp embeddings and POI category embeddings, which are fused into a check-in embedding vector. Finally, we use a Transformer encoder–decoder framework to output POI predictions.
4.1. POI Embedding and User Representation Learning
4.1.1. POI Embedding
A user’s check-in records are the most direct features that describe their interest preferences. Different check-in records reflect the user’s behavioral patterns in both space and time, such as frequently visited locations or occasional exploratory behaviors. To explore user behavior patterns, we construct a global POI graph based on the check-in records of all users. By modeling the access relationships between POIs, we capture the spatial transition patterns within the user’s trajectory.
In summary, although the above methods effectively utilize graph neural networks (GNNs) and user social information to enhance the next POI recommendation performance, existing approaches have not considered the combination of user trajectories and user friendship relationships, which results in the underutilization of the potential of social networks in recommendations. Furthermore, existing social information-based recommendation methods typically model user similarity through simple social matrices, lacking effective strategies to integrate user behavior data and social information. We adopt the POI embedding method proposed by Song et al. [
36], in which a global POI trajectory flow graph
is constructed, and a graph convolutional network (GCN) is used to learn the embedding representations of each POI. This method generates the transition relationships between POIs based on users’ check-in records, with the number of visits between two POIs used as the edge weight of the graph. Specifically, the weighted directed graph
is defined, where
represents the nodes in the graph;
represents the edges in the graph;
represents the node attributes, including
, where
indicates the frequency of the node’s appearance; and
represents the edge weights, which are equal to the number of visits between the two nodes.
Once the trajectory flow graph
is constructed, we use a graph convolutional network (GCN) [
14] to learn the embedding representations of POIs.
denotes the adjacency matrix of the graph
, and
represents the identity matrix. The specific calculation is as follows:
Here,
is the adjacency matrix of the graph
,
is the degree matrix, and
represents the normalized Laplacian matrix. The node embeddings are updated through the multi-layer GCN propagation rule as follows:
In this equation,
represents the input signal at the
layer,
is the input feature matrix of the nodes,
is the weight matrix of the
layer,
is the bias matrix, and
denotes the ReLU activation function. Finally, the output of the GCN module is expressed as follows:
In this equation, is the matrix representation of all POIs, with the row representing the embedding vector of POI . The POI embeddings obtained through the GCN express the common check-in patterns of all users, which will later be fused with the user embedding vectors and sequentially input into the Transformer module for prediction.
4.1.2. User Representation Learning
The embedding vectors of points of interest (POIs) derived from the graph convolutional network (GCN) module serve as general representations. To accurately capture user preferences, we construct weighted interest representation vectors by combining POI embeddings with users’ check-in behaviors. Specifically, we use check-in frequencies as weights, mapping user–POI relationships into a weighted average vector space. This method not only reflects users’ intensity of interest in specific POIs but also provides a more precise representation of their preferences while addressing the issue of information scarcity due to sparse check-in data.
The process begins with extracting the check-in record
from the check-in matrix
, which denotes the number of check-ins made by user
at all POIs. Based on
, the corresponding POI embeddings
are selected, and the check-in count for each POI
is retrieved. The user representation vector
is computed as follows:
In this equation, represents the set of POIs in which user has check-in records. If a user has no check-in history, their vector representation is omitted. The generated user representation vectors serve as fundamental data for the subsequent user similarity calculations and social graph construction.
4.2. Social Graph Modeling and User Embedding Learning
Humans are social beings, and social information significantly influences users’ interests and behaviors. To comprehensively model the relationships between users, we construct a user social graph by integrating both user behavioral preference similarity and friendship relationships and further learn user embedding representations using the GraphSAGE network.
4.2.1. Social Graph Modeling
Inspired by Kosar et al. [
30], we treat user behavioral similarity as implicit friendships and friendship relationships as explicit friendships, thus collectively constructing a user social graph
, where
represents the edges between nodes. To obtain implicit friendships, we use the cosine similarity method to calculate the similarity between user representation vectors, computed as follows:
In this equation, and represent the weighted interest vectors for users and (generated in the first part), respectively, and denotes the norm of the vector. The more similar the behaviors of two users, the closer the value of will be to 1. For a user, explicit friendships may directly influence the next POI visited through recommendations, while implicit friendships, based on behavioral similarity, provide a valuable reference for the prediction of the user’s next POI.
For explicit friendships, i.e., the direct friendship relationships between users, we use the set
to represent the direct friends of user
. Combining both explicit and implicit friendships, we then construct the user social graph
, introducing the hyperparameter
to balance the influence of explicit friendships and implicit similarity on user behavior. Specifically, we set the weight of implicit friendships as
and that of explicit friendships as
. The probability of interaction between two users is computed as follows:
In this equation,
represents the interaction weight between users
and
, reflecting the behavioral similarity between the two users. We use
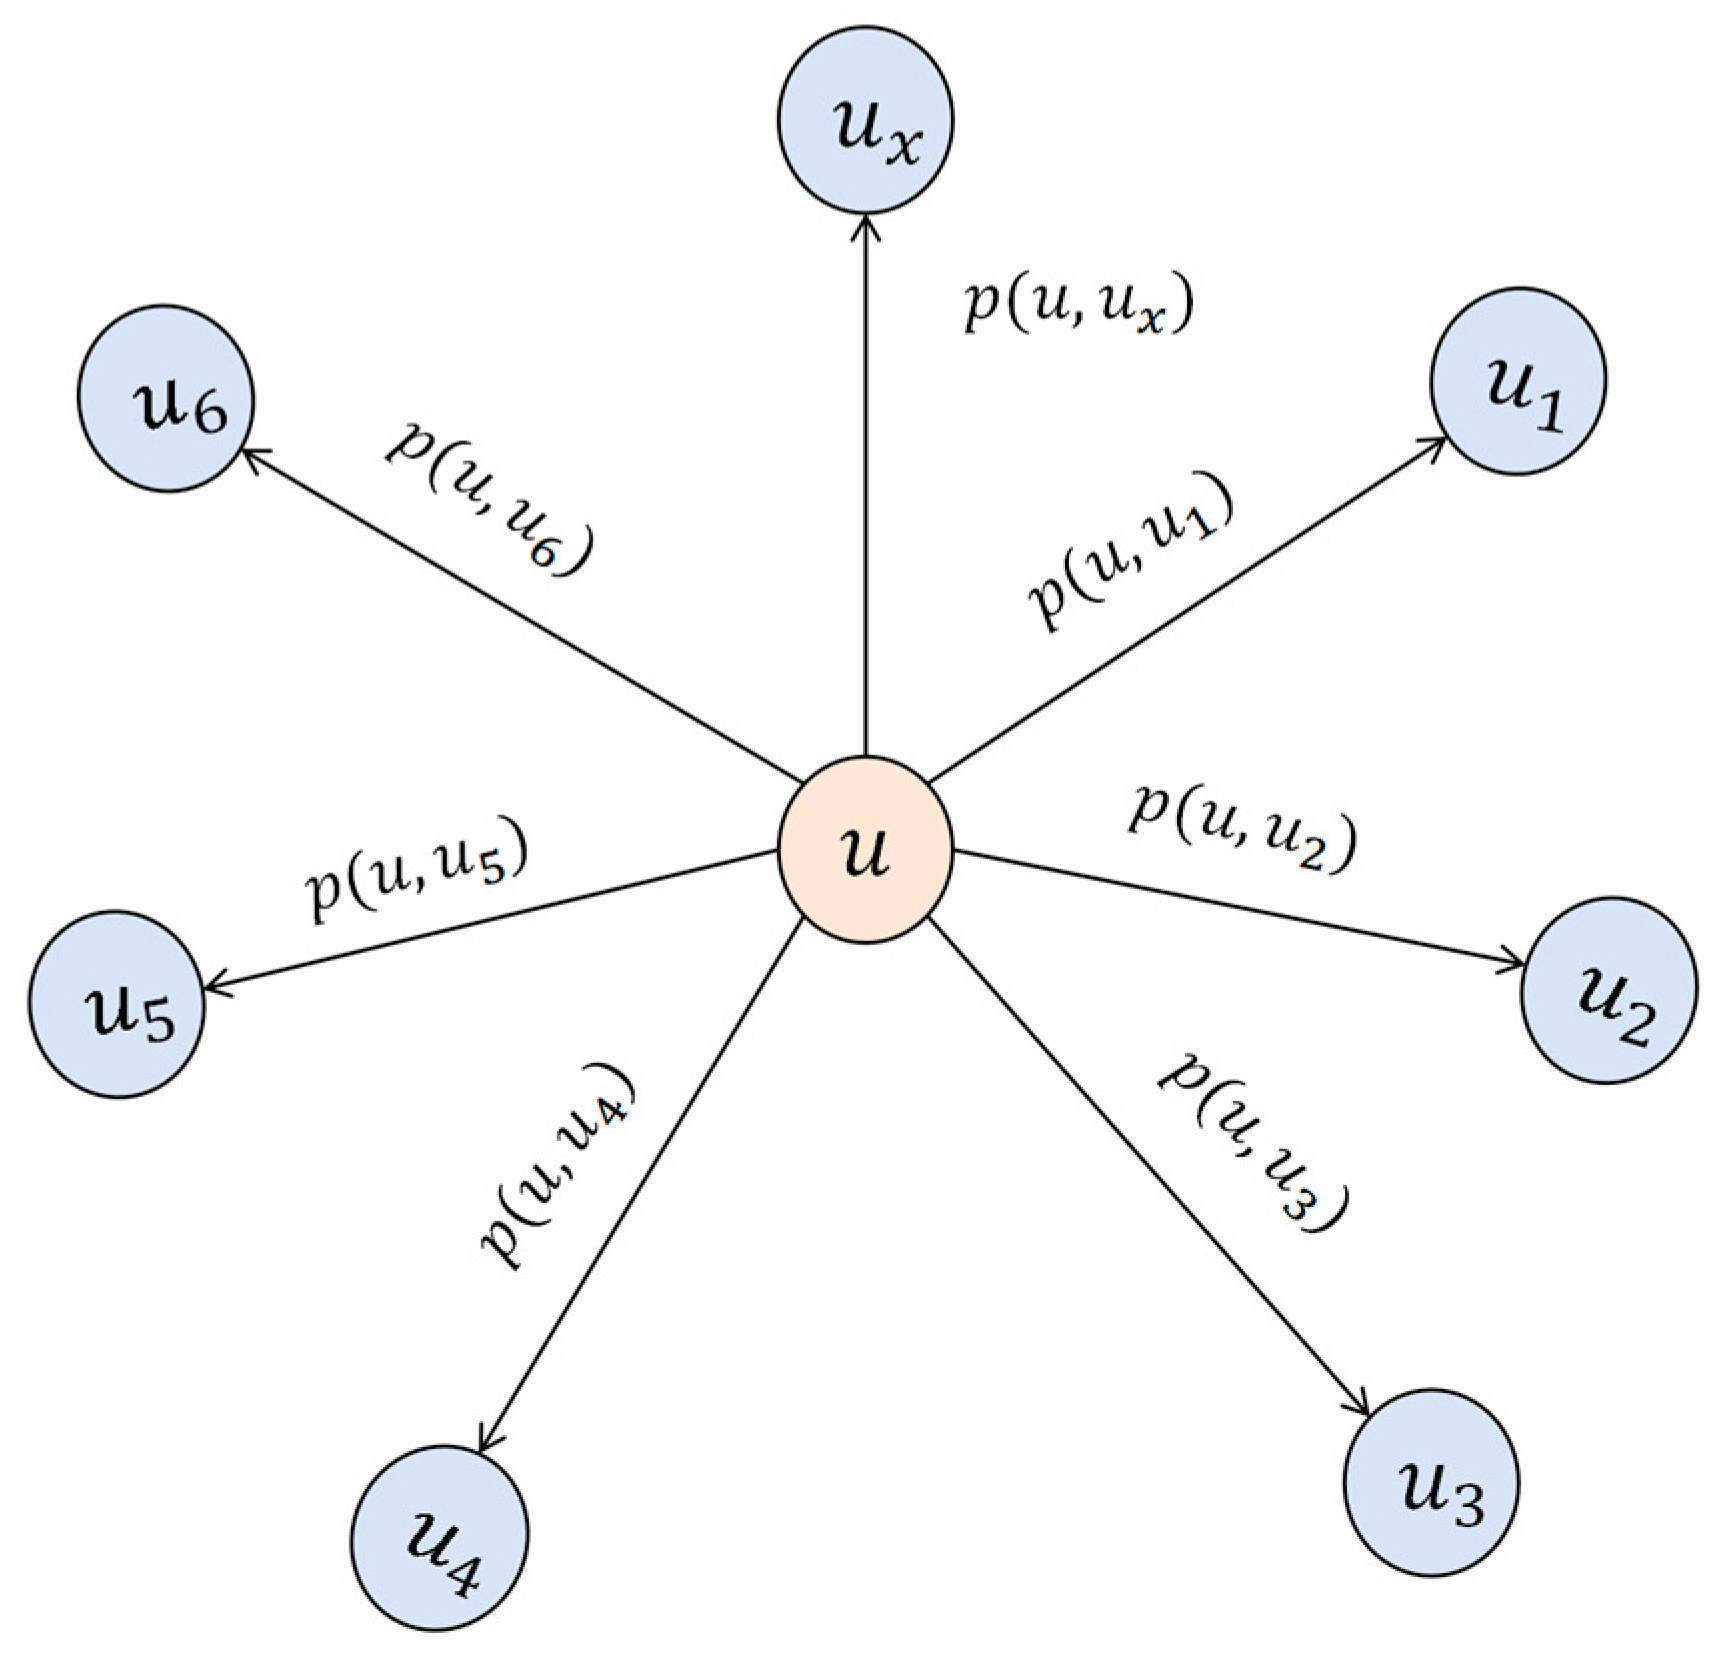
to construct the user social graph
, where nodes represent users and edges
indicate social relationships between users. A threshold
is introduced, and, if the interaction weight
exceeds
, an edge is established between the two users; if
is less than
, the edge is filtered out. The user social graph is shown in
Figure 3.
4.2.2. User Embedding Learning
After obtaining the user social graph
, our goal is to further learn the relationships between users and represent them as vectors. To achieve this, we introduce the GraphSAGE (SAmple and aggreGatE) model [
13]. Unlike graph convolutional networks (GCNs), which learn the embedding vectors of each node over the entire graph, GraphSAGE effectively aggregates the features of a node’s
hop neighbors along with its own features through a set of aggregator functions. This allows for the generation of embedding representations that are suitable for both training nodes and unseen nodes during testing.
In our implementation, the specific architecture of GraphSAGE consists of two layers of SAGEConv layers, modeling the local structure of the user social graph. After each convolution, the user embeddings are further optimized through non-linear activation functions and feature propagation. The specific computations are as follows:
Here, represents the embedding of user after aggregating the features of hop neighbors, is the LeakyReLU activation function, is the learnable weight matrix, denotes vector concatenation, and is the set of neighboring nodes of user . is the aggregation function, and we choose mean aggregation for this, which calculates the average of user surrounding neighbors’ vectors. At each iteration, the aggregation function allows the node to collect information from its neighbors, and, as the depth of iteration increases, it gathers more information. Finally, is normalized to prevent numerical instability, yielding the user embedding vector , which will be passed along with the POI embedding vectors to the subsequent Transformer model to predict the next POI.
4.3. Fusion and Prediction Based on Transformer
In this section, we introduce the Transformer framework [
37] to fuse multimodal embeddings and predict the next POI. This process consists of two steps: multimodal embedding fusion and prediction using the Transformer architecture. By combining multimodal embeddings (POI embeddings, user embeddings, timestamp embeddings, and POI category embeddings), we enhance the model’s ability to represent user behavior features. At the same time, we leverage the powerful sequential modeling capabilities of the Transformer to handle the complex dependencies within the check-in sequence. Ultimately, a multi-layer perceptron (MLP) is used to predict the user’s next action.
4.3.1. Fusion of Feature Embeddings
In addition to the previously obtained POI embedding vectors and user embedding vectors, we further introduce timestamp embeddings and category embeddings to more comprehensively describe user behavior; these reflect the temporal patterns of user check-ins and the categorical features of POIs, respectively.
Capturing the temporal patterns of user check-in behavior is crucial in modeling users’ visiting preferences. We employ Time2Vec [
38] as the time encoding model, which embeds time characteristics into a high-dimensional vector space through both linear and periodic transformations. We divide a day into 48 time slots, with the embedding representation of the
time slot defined as follows:
Here, and are trainable parameters, and represents the periodic activation function—specifically, the sine function, which learns the periodic behaviors of users. For category embeddings, we train a simple embedding layer that projects POI categories into low-dimensional vectors, represented as , where is the embedding dimension. The timestamp embeddings and category embeddings serve as supplementary features to the user’s check-ins, providing a more comprehensive understanding of the user behavior patterns and the semantic characteristics of POIs.
After obtaining all of the embedding vectors, the next step is to fuse these vectors and input them sequentially into the Transformer. To represent each check-in, we first fuse the POI embeddings and user embeddings based on the embedding dimensions, and we similarly fuse the timestamp embeddings and category embeddings. We then concatenate the two fused vectors, as shown in the following formulas:
Here,
and
represent the weights,
and
represent the biases, and
denotes vector concatenation, which doubles the dimension of the fused vector. Afterward, the concatenated vectors
and
are combined to form the vector for each check-in
as
. Next, for the input trajectory sequence
, we concatenate the check-in vectors to form the input vector
. To ensure that the model correctly utilizes the sequential order of the data, positional information must be incorporated into the sequence. To achieve this, we add positional encoding to each position in the sequence, generated using sine and cosine functions, as shown in the following formulas:
Here,
is the position index in the sequence,
is the index of the dimension, and
is the embedding dimension. The positional encoding is then added to the input vector, resulting in the final sequence embedding vector:
Here, serves as the input to the Transformer, containing all feature information of the check-in records, as well as their positional information within the sequence.
4.3.2. Transformer Sequence Encoding
After completing the processes of feature embedding fusion and positional encoding, we pass the sequence encoding into the Transformer encoder to learn the temporal relationships and dependencies in user check-ins. Through the Transformer’s multi-head self-attention mechanism and its stacked structure, we can capture complex long-range interactions in the check-in sequence. The Transformer encoder consists of multiple layers, each containing two sub-layers: a multi-head self-attention layer and a feed-forward neural network. Additionally, residual connections and layer normalization are applied after each sub-layer to enhance the model’s stability.
Given the input sequence
, we linearly project it into
different spaces and then concatenate them to generate the output. The specific calculation is as follows:
Here,
represents the projection of each head, and
are the learnable weight matrices, with
being the number of attention heads. The attention function is the scaled dot-product attention, which is calculated as follows:
In this equation,
,
, are the query, key, and value vectors, respectively. The
function ensures that the attention weights sum to 1. To introduce non-linearity between different dimensions, a fully connected feed-forward network follows the attention sub-layer, which is represented as the following:
Here,
and
represent weights, and
and
are biases. The activation function
is the ReLU activation function. Additionally, residual connections and layer normalization are applied around each sub-layer in the two layers. Therefore, the output of the encoder is as follows:
is the attention head present after the residual connection and layer normalization are applied.
4.3.3. Decoder Prediction and Loss
After completing sequence modeling with the Transformer, since next POI recommendation is a sequence prediction task, the goal is to predict the next directly relevant POI. Therefore, we choose a multi-layer perceptron (MLP) head as the decoder. To optimize the prediction performance, we design a multi-task loss function that combines the predictions of the POI, timestamp, and category for training. The formulas are as follows:
Here, are the weight matrices, with representing the number of POI categories. are the biases. For , we focus only on its last row to predict the next POI. Combining the predictions of the timestamp and category enhances the stability in predicting the next POI alone, achieving a more comprehensive recommendation objective.
For the loss function, to optimize the prediction performance for the POI, timestamp, and category simultaneously, we combine the loss functions of the POI, timestamp, and category predictions. Cross-entropy is used as the loss function for the POI and category predictions, while the mean squared error is used for timestamp prediction, with a time loss weight
. The final total loss is as follows:
5. Experiments
In this section, we evaluate the proposed model on real-world datasets.
5.1. Experimental Setup
5.1.1. Datasets
We evaluate our model on two publicly available datasets: FourSquare [
39] and Gowalla [
40]. All data used are publicly available and do not contain any personally identifiable information. Proper citations of the original authors are included. The FourSquare dataset contains global check-in data collected from April 2012 to January 2014. We selected check-in data from the New York region for our experiments. The Gowalla dataset contains global user check-ins from February 2009 to October 2010, and we filtered the dataset to include only users with mutual friendship relationships. For both datasets, we removed POIs with fewer than 10 check-ins and users with fewer than 10 check-in records. Regarding dataset preprocessing, we arranged users’ check-in records in chronological order and divided them into trajectories with one-week intervals. The datasets were then split into training, validation, and test sets with an 80%, 10%, 10% ratio. Statistical information for the preprocessed FourSquare and Gowalla datasets is shown in
Table 1.
5.1.2. Baseline Models
We compare our model with the following baseline models.
PLSPL [
41] uses attention mechanisms and LSTM to learn users’ long-term and short-term preferences.
STAN [
42] utilizes self-attention layers to capture point-to-point effects between non-adjacent locations and non-continuous check-ins in a check-in trajectory.
GETNext [
36] learns spatial transition information from users’ check-in records through a global trajectory flow graph and Transformer.
MTNet [
43] uses mobile trees and their networks, applying a multi-task training strategy for the hierarchical modeling of user check-in records and personalized preference learning.
5.1.3. Evaluation Metrics
In this study, we use two commonly used evaluation metrics—Accuracy () and the mean reciprocal rank ()—to assess the effectiveness of the recommendation models. Accuracy measures the model’s ability to include the true POI within the top k recommendations. The mean reciprocal rank () reflects whether the model places the true POI near the top of the recommendation list.
5.1.4. Experimental Settings
We developed the model using PyTorch v2.1.0 and conducted the experiments on a CentOS server configured with an NVIDIA GeForce RTX 4090 GPU and 48 GB of RAM. We maintained consistent hyperparameters across the FourSquare and Gowalla datasets. The embedding dimensions for POIs and users were set to 160, with the embedding lengths for the time and POI categories set to 48. The GCN model has three hidden layers, with 40, 80, and 160 channels in each layer. The GraphSAGE module has two hidden layers, with 40 and 160 channels in each layer. For the Transformer module, we stacked two encoder layers, with each layer consisting of two attention heads. Additionally, we used the Adam optimizer with a learning rate of 0.001 and a weight decay rate of 0.0005. We also enabled Dropout with a dropout rate of 0.3. Another important parameter is the time loss weight, which was set to 10 to balance the POI and category losses. Finally, we ran the model for 200 epochs with a batch size of 20.
5.2. Results
We first compare our model with the baseline models.
Table 2 shows the performance of the selected models on the FourSquare and Gowalla datasets. Our model outperformed the others across all metrics, demonstrating its effectiveness in the next POI recommendation task. For example, on the FourSquare dataset, we achieved top-1 accuracy of 32.29%, which represents an average improvement of 10.3% compared to the other baseline models. The Acc@10 and MRR metrics reached 69.99% and 45.18%, respectively, whereas the best baseline model, GETNext, achieved 67.32% and 43.98%, showing improvements of 3.97% and 2.9%, respectively. The effectiveness of our model is demonstrated through fine-grained user modeling based on check-in frequency and user social graph modeling, which integrates friendship relationships. This approach enables our model to better capture user check-in behavior patterns and the spatiotemporal dependencies in the global trajectory flow graph. On the Gowalla dataset, although all models performed poorly, our model achieved 12.81% and 27.96% for the Acc@1 and Acc@5 metrics, respectively, surpassing the second-best model by 11% and 28%. This result indicates that, despite the sparse check-in behavior and complex spatiotemporal characteristics of the Gowalla dataset, our model still demonstrates strong adaptability in capturing user behavior and social information. It effectively mitigates the issues present in current models, such as coarse user interest representation, simplistic social influence modeling, and the lack of the integration of spatiotemporal contextual information.
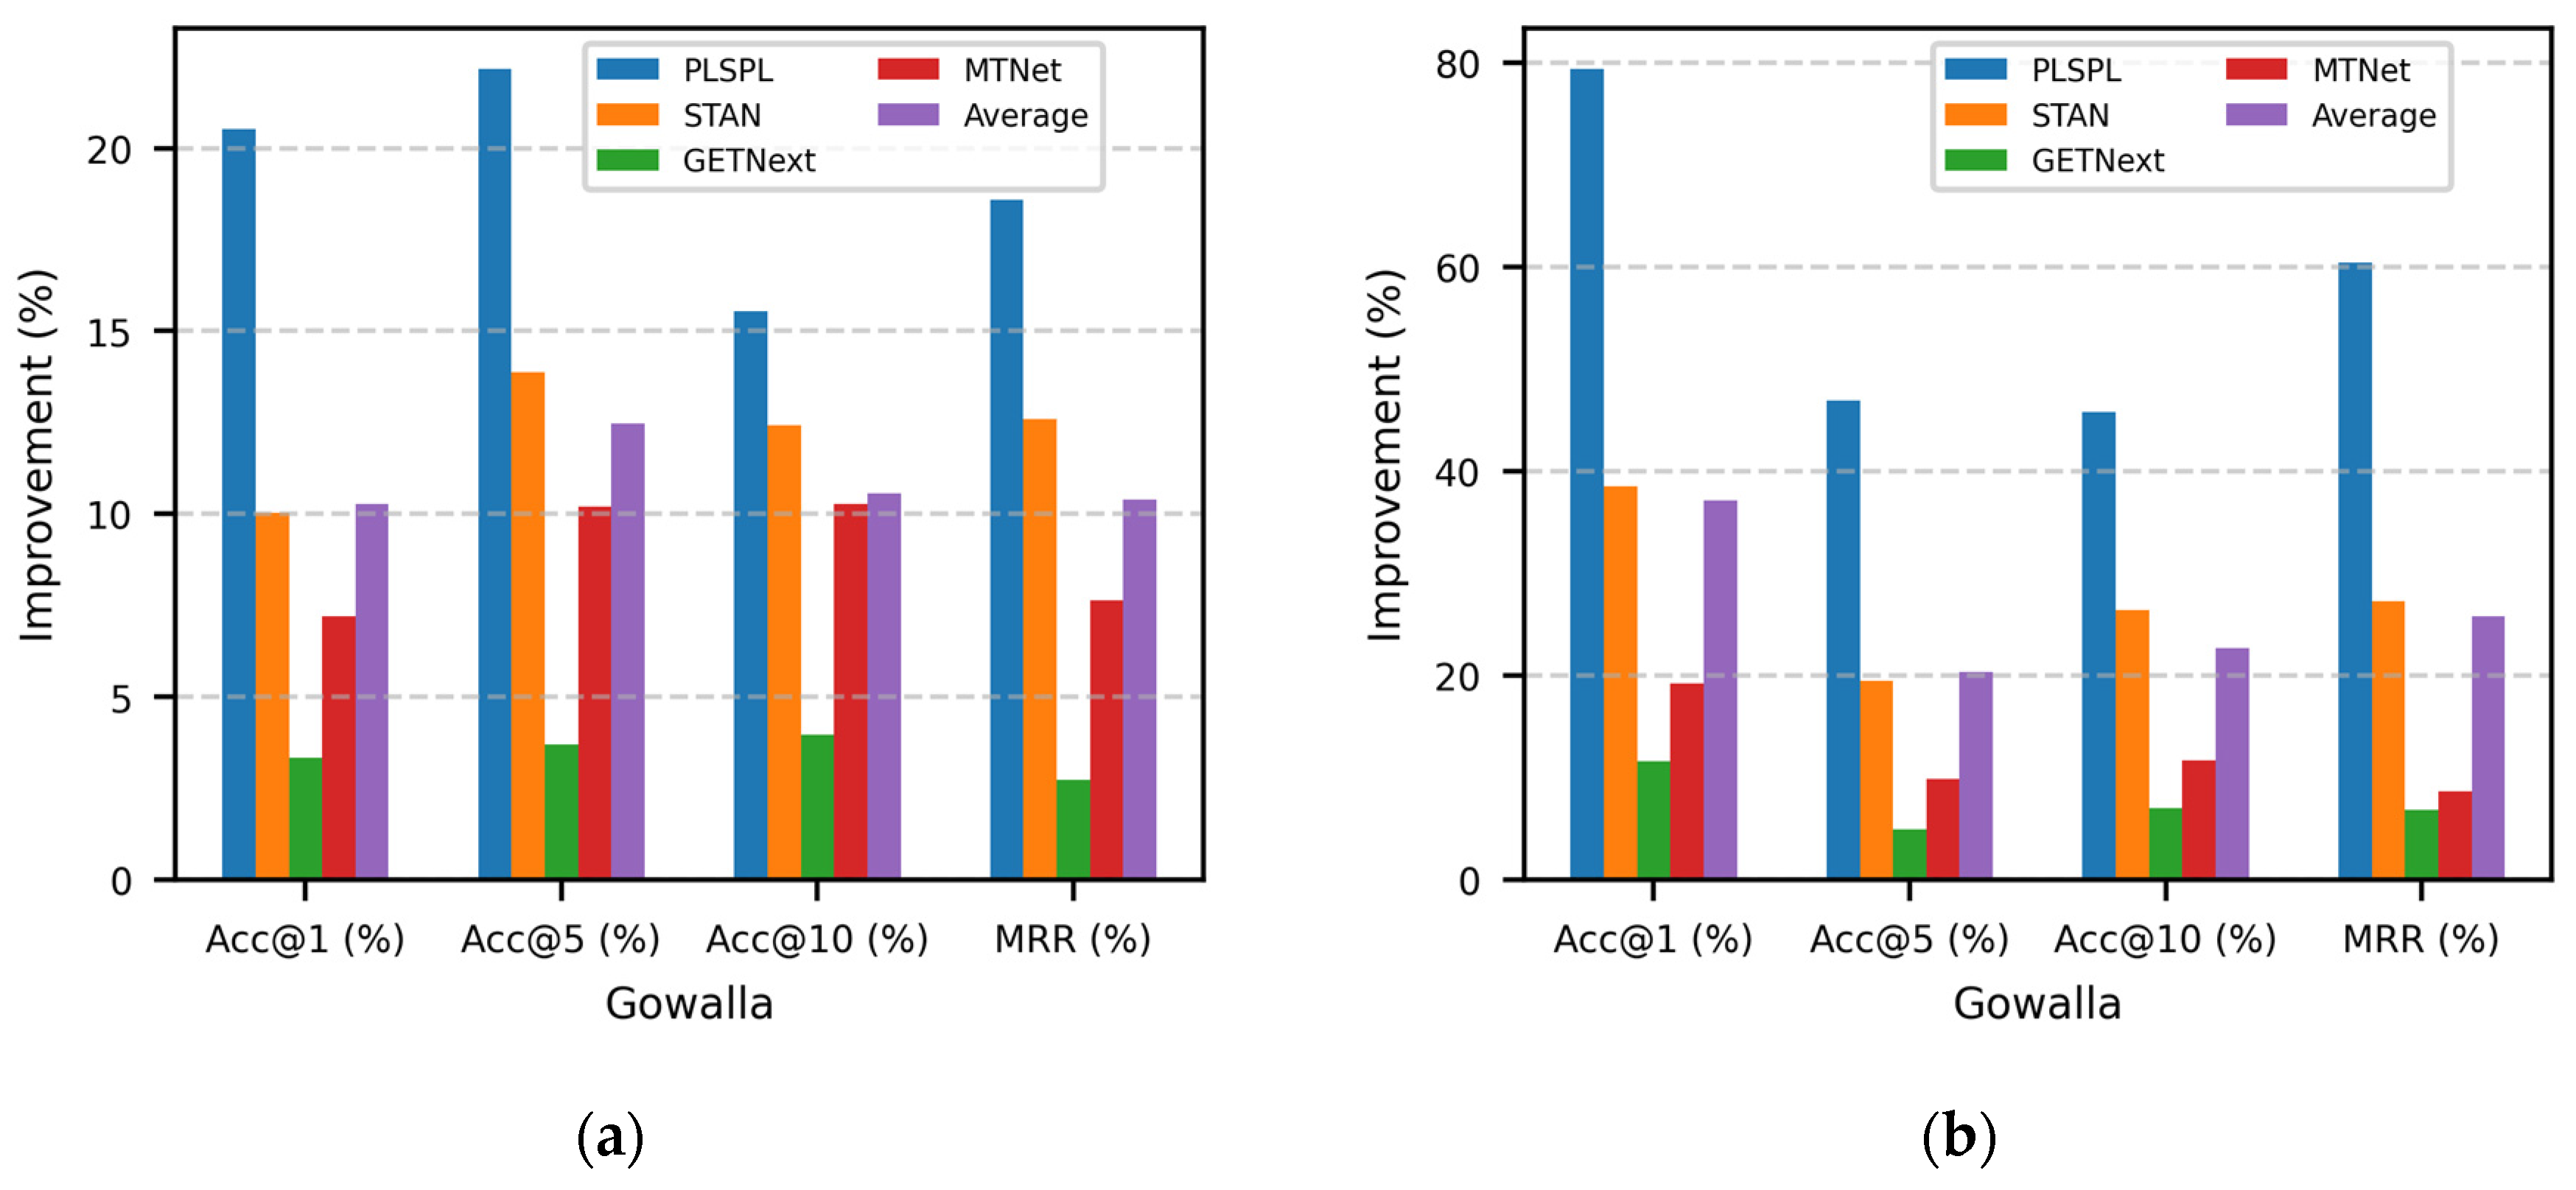
Figure 4a,b further illustrate that, on both datasets, TraFriendFormer outperforms the other baseline models by an average of 10.3% to 37.2%. The largest improvement is seen compared to the PLSPL model, as our model combines user social relationships and check-in trajectories, thus capturing more nuanced user behavior patterns. Compared to the GETNext model, the improvement is smaller, primarily because GETNext already utilizes the Transformer architecture to model spatiotemporal dependencies. However, our model performs better in handling complex and sparse data due to the introduction of additional embedding layers and social information. This also validates the hypothesis that the check-in frequency more accurately reflects user preferences and that the social circle influences user behavior. It further demonstrates that integrating the spatiotemporal context can improve the accuracy of next POI recommendations.
The poor performance of all models on the Gowalla dataset could be attributed to the fact that it contains global user check-in data, which leads to a sparser distribution of POIs and the weaker connectivity of user social relationships. Additionally, the spatiotemporal characteristics of the data are more complex, which increases the difficulty involved in models learning from this dataset, leading to overall poorer results. In contrast, the FourSquare dataset is concentrated in the New York City area, in which the check-in behavior and POI distribution are more focused and user friendship relationships are denser, allowing the model to better capture check-in patterns and user preferences.
5.3. Ablation Study
To analyze the impacts of different modules in the model, we conducted an ablation study on the FourSquare dataset. Specifically, we designed six model variants: (1) a full model; (2) a model that removed user friendship information and used an embedding layer to learn user embeddings; (3) a model that did not use the GraphSAGE model to generate user embeddings, instead using the average check-in vector as the user embedding; (4) a model with no timestamp or category information; (5) a model that removed the trajectory flow graph and used an embedding layer to learn POI features; and (6) a model that used LSTM instead of the Transformer. The experimental results are shown in
Table 3.
This table clearly shows that the full model significantly outperforms all other variants. First, the modeling of user friendship relationships plays an important role in improving the recommendation accuracy and ranking quality. When user friendship information is removed, the model’s Acc and drop by 10.63% and 9.44%, respectively, thus indicating the importance of user friendship information in recommendation tasks. User POI visits are often influenced by friends, and POIs recommended by friends are more likely to interest the user. By modeling user friendships, the model can capture the interest similarity and social influence between users, thus resulting in more accurate behavior preferences and improved user embedding quality and recommendation performance. Furthermore, when weighted averaging is used instead of GraphSAGE, the model performance declines, confirming the advantages of graph neural networks in learning both explicit and implicit friendship information. Additionally, the modeling of the trajectory flow graph plays a crucial role in POI representation learning. After removing this module, the Acc and drop by 2.77% and 3.72%, respectively, indicating that the trajectory flow graph is key to capturing the spatiotemporal dependencies of POIs. Finally, replacing the Transformer with LSTM results in a decrease of 11.47% and 6.88% in Acc and , respectively, highlighting the excellent performance of the Transformer’s self-attention mechanism in capturing complex dependencies in the check-in sequence.
Overall, user friendship relationships, trajectory flow graphs, and Transformers are the core modules that enhance the model’s performance. These components significantly strengthen the model’s ability to model user check-in behavior.
5.4. Effects of Model Parameters
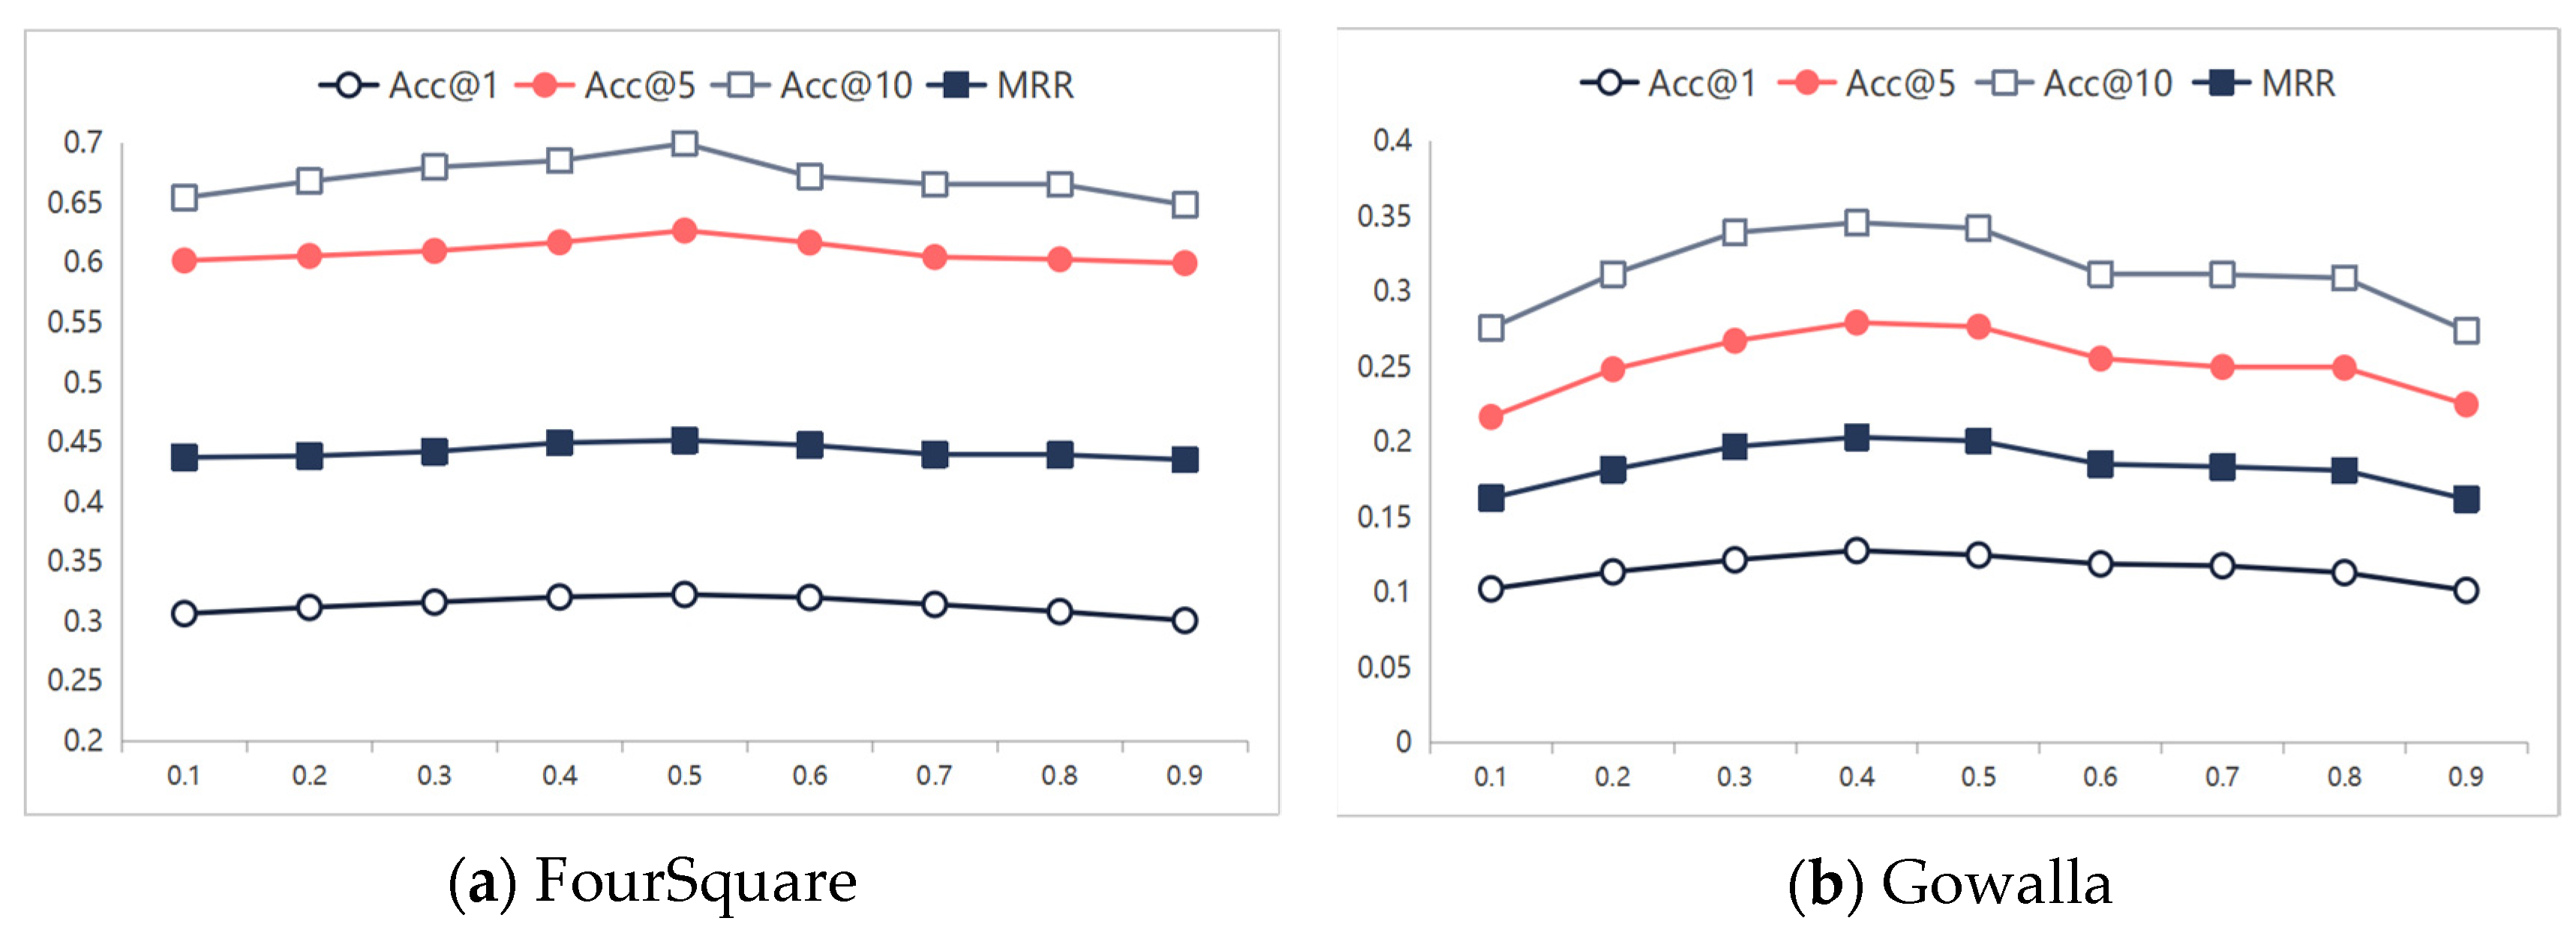
5.4.1. Effects of Threshold
To evaluate the impact of the threshold
on the performance of the TraFriendFormer model, we trained our model within the range of 0.1 to 0.9 while keeping all other parameters fixed (see
Figure 5).
Figure 5 clearly shows that the best performance of TraFriendFormer occurs with
= 0.4 on the FourSquare dataset and
= 0.5 on the Gowalla dataset. The results show that setting a threshold that is too small introduces excessive noisy edges when constructing the social graph, while setting a threshold that is too large leads to a sparse social graph. A moderate threshold retains enough connecting edges to reflect genuine social influence while avoiding the interference of noisy edges.
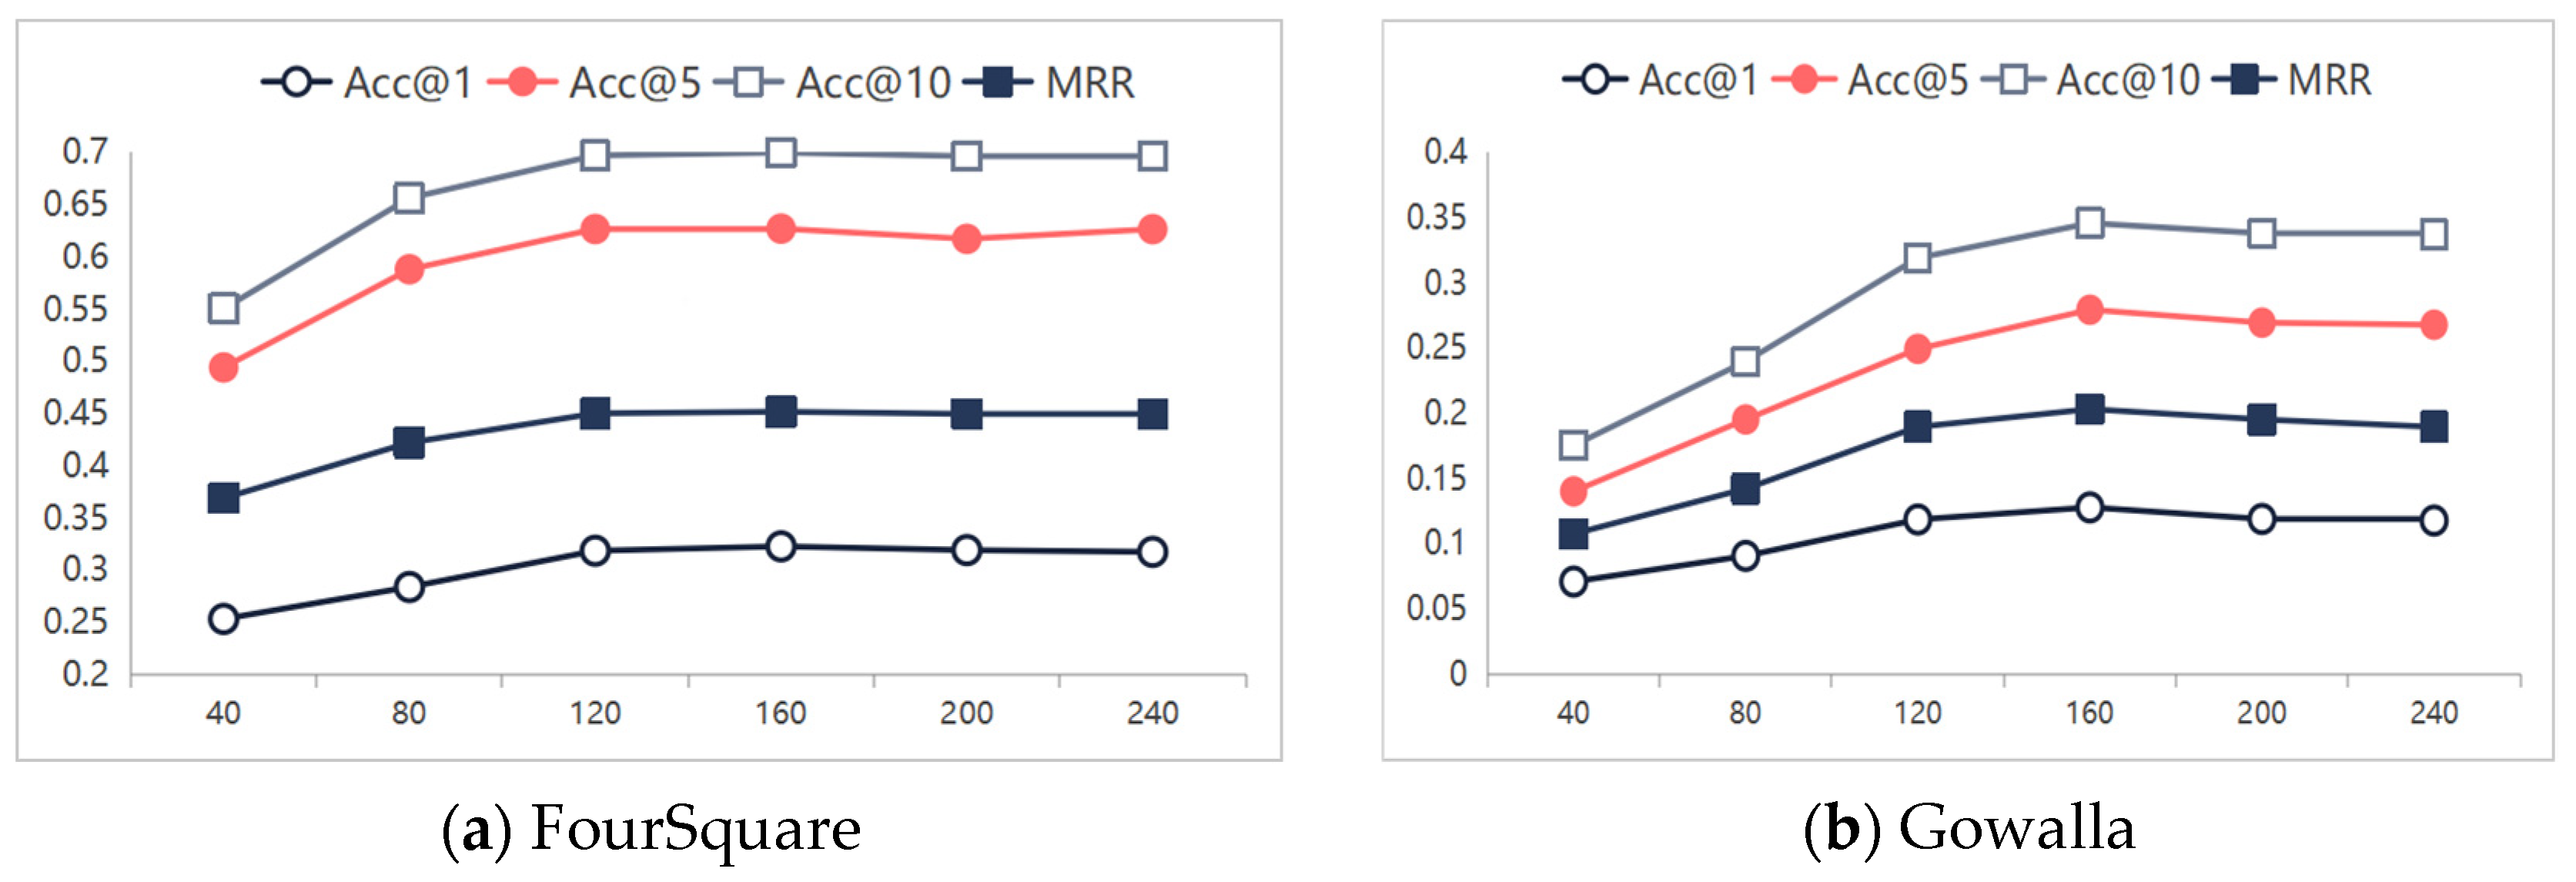
5.4.2. Effects of Embedding Dimension
In this section, we demonstrate the impact of the POI and user embedding dimensions on the model performance, where the POI and user embedding dimensions are set to be equal. Generally, larger embedding dimensions provide stronger expressive power, but excessively large dimensions may lead to overfitting. We varied the dimension
from 40 to 240, with a step size of 40. In terms of Acc
and
, the results of TraFriendFormer with different embedding dimensions are shown in
Figure 6. It is evident that, as the embedding dimension increases, the performance gradually improves, and, after 120 dimensions, it starts to converge. The performance reaches its peak when
= 160. Further increasing the dimension to 200–240 causes slight fluctuations or a minor decline in the metrics, indicating that excessively high dimensions may lead to overfitting and increase the computational overhead.
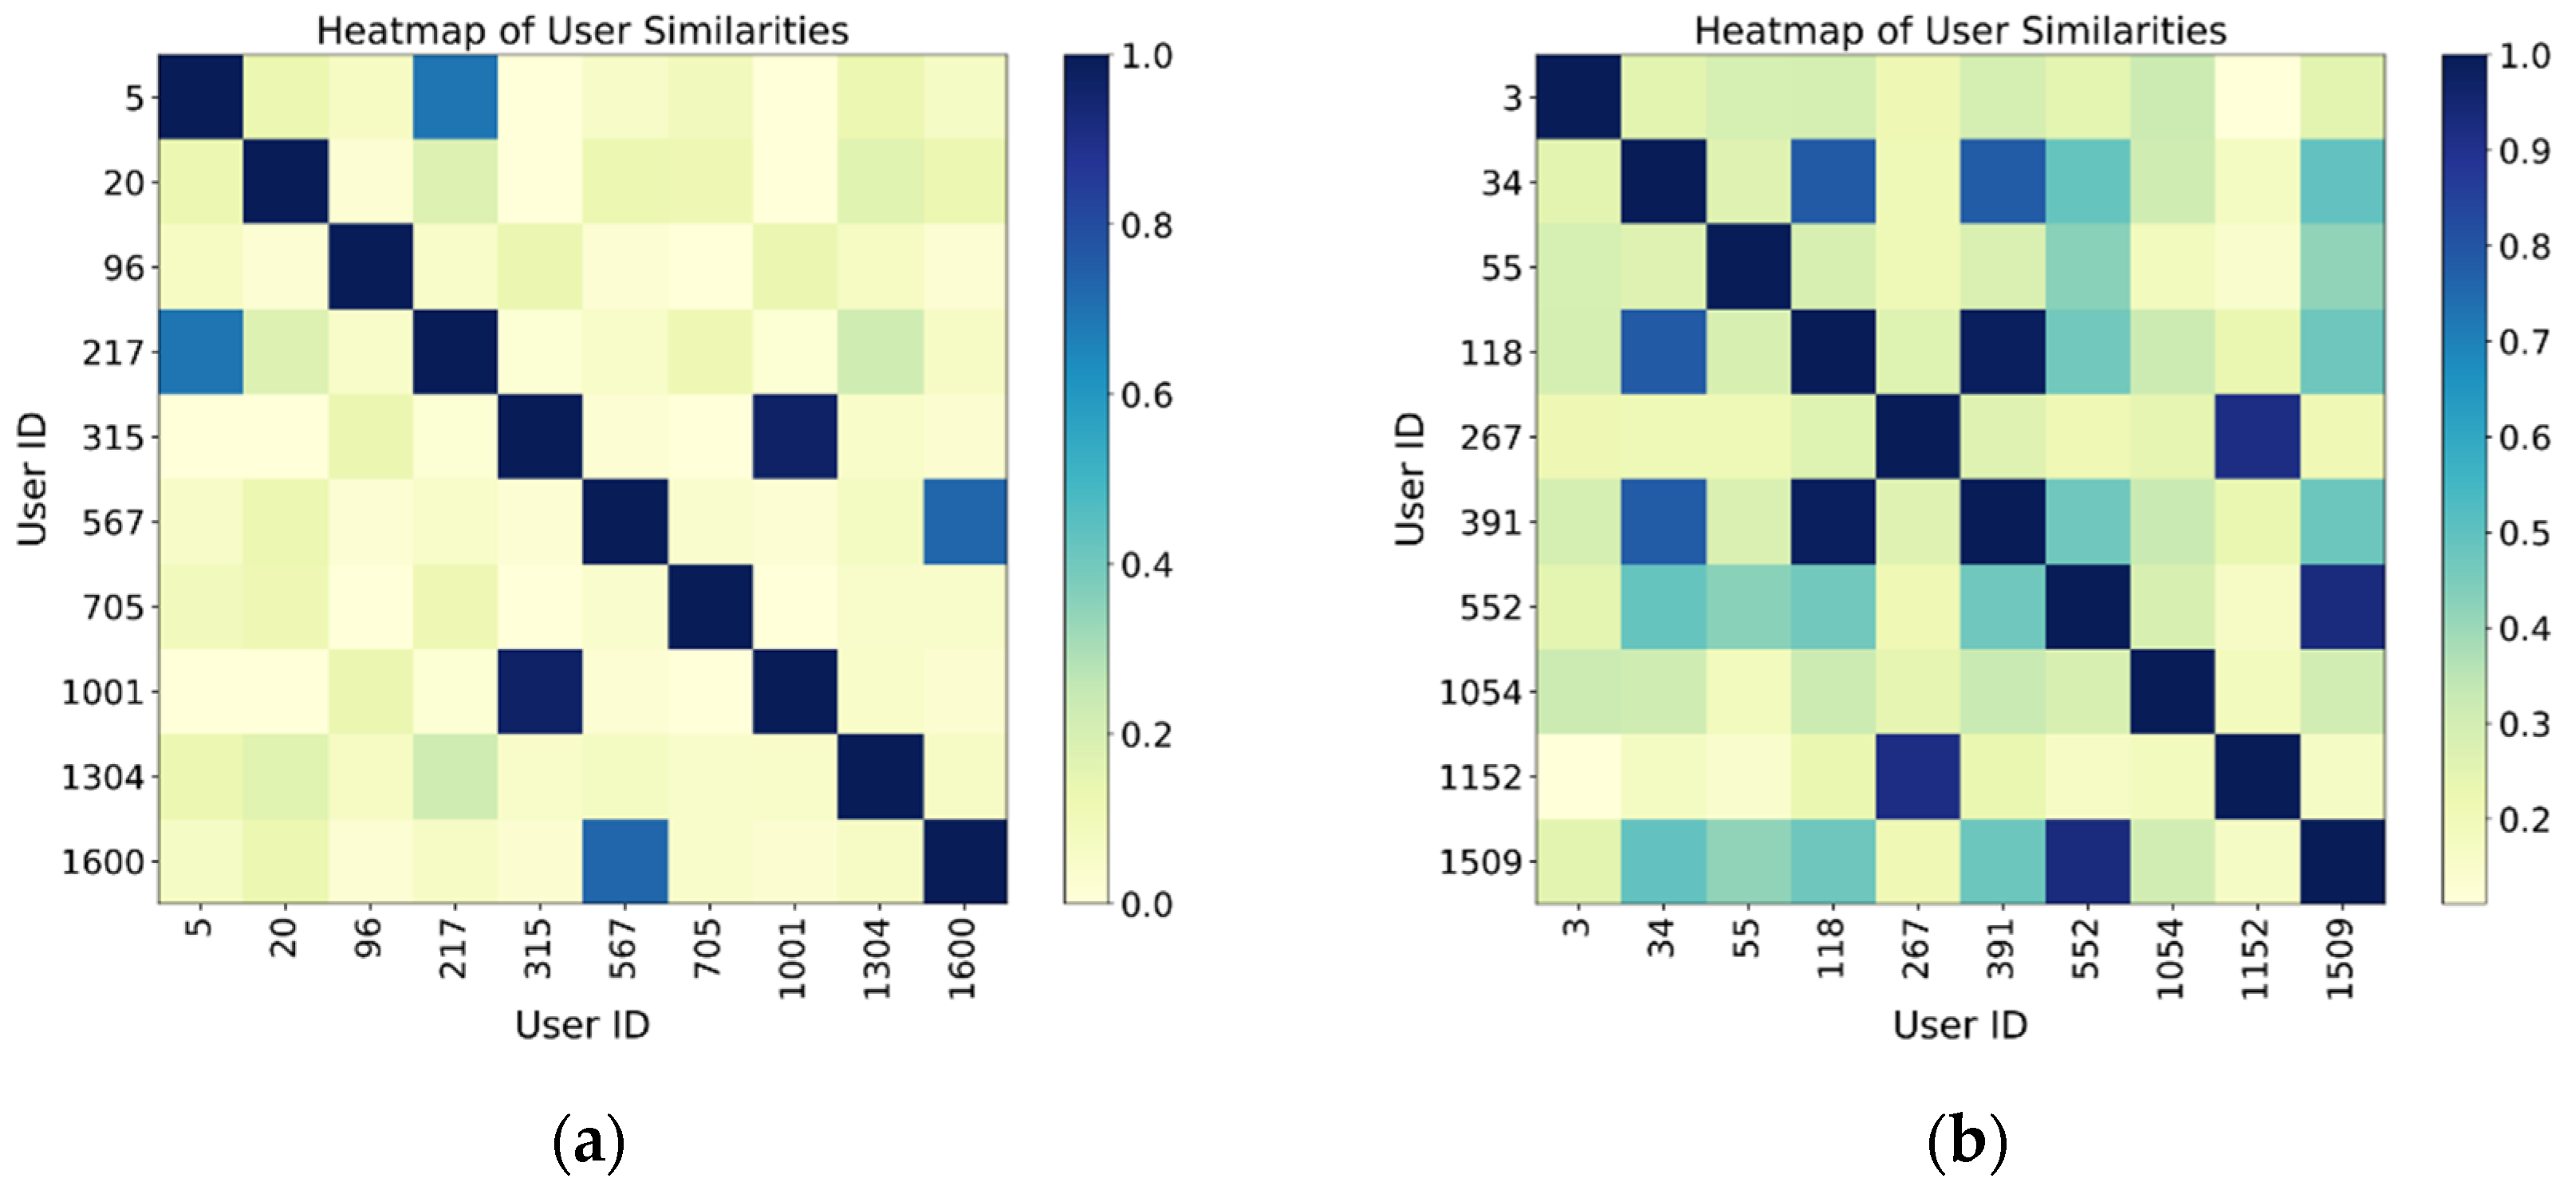
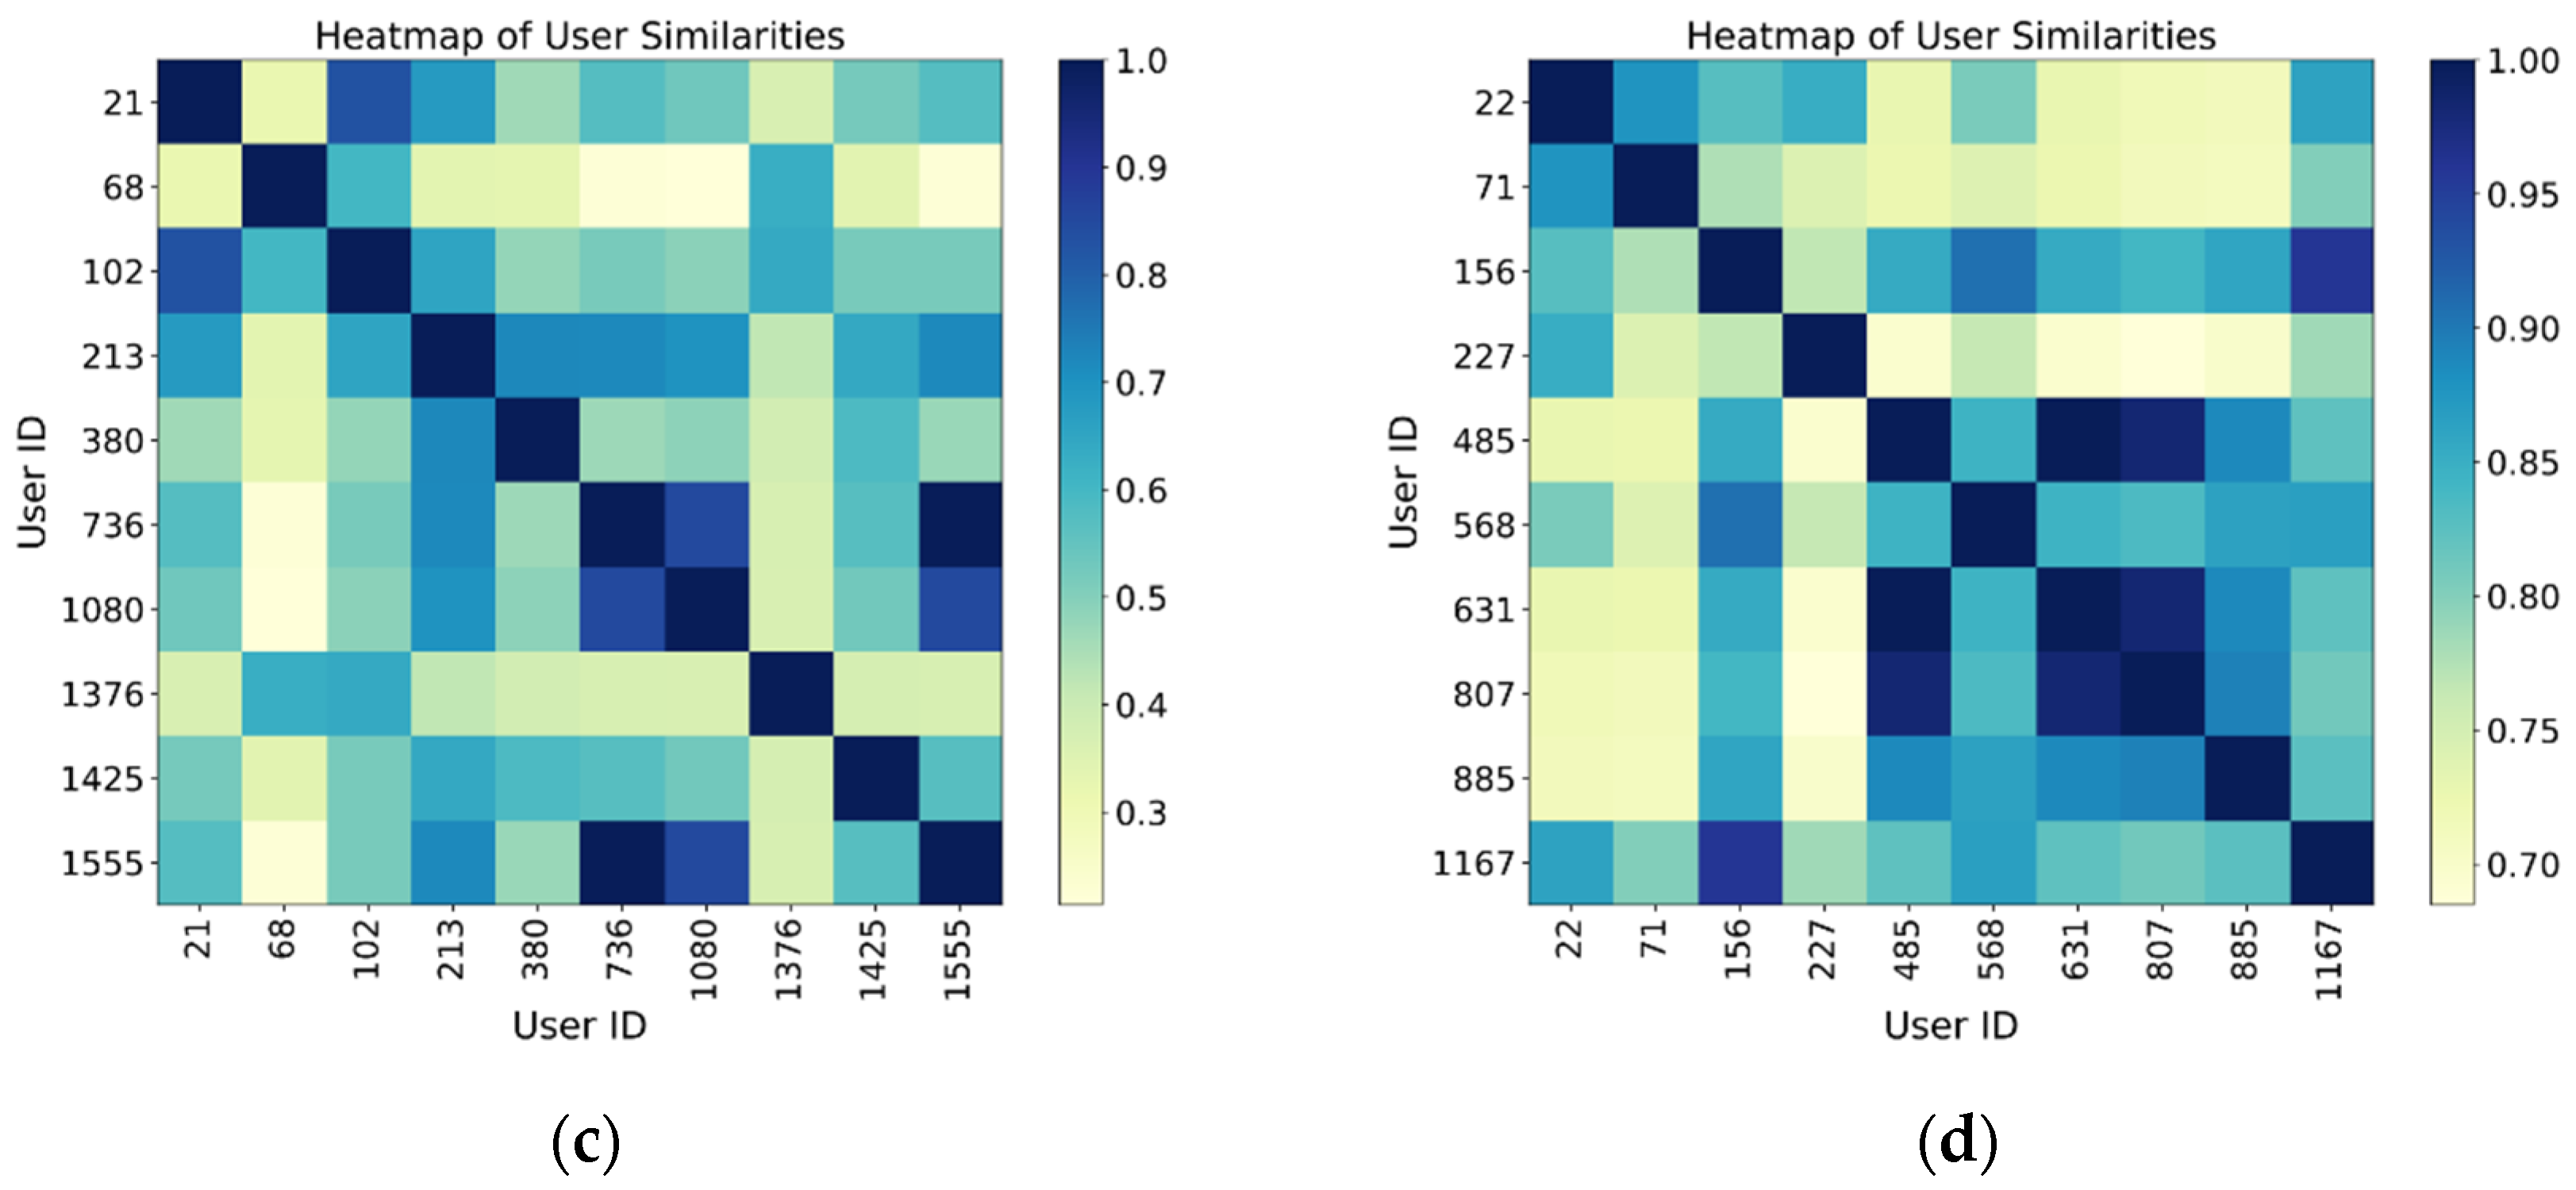
5.5. Analysis of Impact of User Friendship Count
To validate the model’s ability to learn user social relationships, we conducted a visualization analysis of the user embedding vectors trained on the FourSquare dataset. We selected four groups of users based on the number of friends: fewer than 100 (a), 100 to 200 (b), 200 to 400 (c), and more than 400 (d). Users with more than 200 friends had mutual friendships, and we calculated the cosine similarity of their embedding vectors, presenting the results via a heatmap. The analysis reveals that user groups with fewer friends exhibit lower similarity, as indicated by the more scattered color regions in the heatmap. This suggests that the social relationships between these users are weak, and their check-in behavior is less influenced by social factors, as shown in
Figure 7a,b. Due to the sparsity of their social networks, the model finds it difficult to capture strong social dependencies, thus leading to weaker performance in POI recommendation for these users. In contrast, user groups with more friends show higher embedding similarity and a more structured pattern. In user groups with high social connectivity, the embedding vectors of users exhibit regularity in the spatial representation, bringing together users with similar interests and behaviors. This reflects the potential influence of social networks on user behavior, as shown in
Figure 7c,d.
This result demonstrates that our model not only recognizes and aggregates user check-in behaviors but also uncovers potential areas of interest that overlap through social relationships. It highlights the model’s effectiveness in capturing the impact of social relationships on check-ins, with particularly significant performance in large-scale social networks.
6. Conclusions
In this study, we propose TraFriendFormer, a next POI recommendation model that combines trajectory information with user friendship relationships. It utilizes a trajectory flow graph to globally model users’ spatiotemporal check-in behaviors to capture trajectory dependencies. We also construct a user social graph through both explicit and implicit friendship relationships, using the GraphSAGE model to generate user embeddings and fully explore the interest similarities between users. To further improve the recommendation accuracy, we fuse user embeddings, POI embeddings, timestamp embeddings, and category embeddings, which are then input into the Transformer. The self-attention mechanism of the Transformer is employed to model the check-in sequence and capture the complex temporal relationships in user behavior. We conducted experiments on two real-world datasets (FourSquare and Gowalla), demonstrating that our model outperformed the other evaluated models in terms of Acc and . Ablation studies further validated the contribution of each module to the overall performance. The experimental results indicate that the combination of trajectory flow graphs, user friendship relationships, and the Transformer architecture plays a crucial role in enhancing the model’s performance.
For future work, we will further optimize the model architecture to reduce its complexity, accelerating the model’s convergence speed and thus lowering the computational costs, making it more feasible and efficient for practical applications. Additionally, we plan to incorporate more user social information, such as comments, opinions, and other semantic data, to further enhance the recommendation quality of the model.


