1. Introduction
1.1. Research Background
Spatial pattern recognition serves as a critical tool for extracting hidden, high-level spatial information and acquiring geometric/structural knowledge from spatial data [
1]. It specifically identifies spatial distribution patterns that describe the arrangement characteristics of geographic features. For instance, building groups may exhibit linear, grid-like, or irregular configurations [
2,
3], while road networks demonstrate grid-type [
4] or irregular patterns [
5].
In urban maps, geographic elements often exist as grouped entities [
1,
2,
3,
4,
5], particularly road networks [
4,
5] and building groups [
1,
2,
3]. These spatial patterns mirror human cognitive understanding of geographic environments [
2,
3] and embody sophisticated spatial structural knowledge. They form essential research foundations across multiple domains: urban planning/analysis [
6], map matching [
7], map generalization [
8], multi-scale representation [
8], and geospatial data modeling [
9]. Recognizing such group patterns enhances both the acquisition/representation of spatial knowledge and the processing/mining of geographic information [
10].
1.2. Literature Review
With accelerated urbanization and continuous advancements in spatial data acquisition technologies, the recognition of spatial distribution patterns in geographic element groups has become a research focus across multiple domains including geographic information science, urban planning, and intelligent transportation systems. Current research primarily focuses on pattern recognition methods for building groups and road networks in urban spaces. This study aims to systematically review existing research on typical spatial distribution patterns of urban map groups, particularly building groups and transportation networks, with applications in map generalization and urban structure analysis.
- (1)
Building group Pattern Recognition
Research on building group pattern recognition has primarily focused on two methodological approaches: traditional geometric methods and machine learning-based techniques.
Traditional geometric methods formulate rules based on topological relationships and geometric feature similarities between adjacent building groups to identify spatial patterns. For example, Christophe et al. [
11] defined templates using a series of rules to identify linear patterns. Zhang et al. [
12] proposed two methods for detecting center distribution alignment and edge distribution alignment of buildings to recognize linear and grid-like patterns. Machine learning approaches typically utilize classifiers to categorize building groups. For instance, Zhang et al. [
13] applied Support Vector Machines (SVMs) to cluster buildings; He et al. [
14] employed Random Forest to classify building groups into regular and irregular patterns; Yan [
15] leveraged a Graph Convolutional Neural Network (GCN) model to distinguish regular and irregular patterns within building groups. Zhao et al. [
16] modeled buildings using graph structures and applied a Graph Convolutional Network (GCN) to learn from both the graph topology and individual building features. Their method classifies entire building groups, providing an effective approach for building group pattern recognition.
- (2)
Road Network Pattern Recognition
Currently, road network pattern recognition can be divided into two categories: edge-node structure-based methods using road segments and polygon group structure-based methods using meshes.
Road segment-based pattern recognition focuses on geometric metrics and graphic structural features. For instance, He [
4] divided road networks into grid cells and identified grid patterns by calculating feature parameters of each cell. Heinzle et al. [
17] employed the Hough transform to detect grid-aligned road segments. Heinzle [
18] treated all road network nodes as potential radiation centers, then identified radial patterns by counting extended roads within a node’s range using Dijkstra’s algorithm, and finally extracted ring roads via a stroke detection algorithm.
Mesh-based pattern recognition methods primarily rely on statistical classification of metrics. For example, Yang et al. [
10] identified grid patterns using mesh shape metrics and road orientation features, though their method only recognized grid patterns at the smallest mesh units. Wang [
19] established multi-level mesh recognition rules to detect linear and grid-type mesh groups. Such approaches often struggle with globally regular but locally fragmented road networks, as existing mesh pattern recognition algorithms predominantly target minimal mesh units and pay limited attention to the arrangement patterns of mesh groups.
1.3. Research Gaps
A review of existing research on map group pattern recognition reveals several achievements but also highlights unresolved challenges, which are summarized as follows:
(1) To summarize the above review, the current methods for identifying building groups and road network patterns can be divided into two categories [
11,
12,
13,
14,
15,
16]. The first method involves extracting geometric structural features and establishing recognition rules based on these features [
11,
12,
20]. However, this method faces challenges such as difficulty in determining feature thresholds and complexity in defining recognition rules [
21,
22]. The second type uses machine learning or deep learning models [
15,
16], where appropriately selected feature parameters are used for pattern recognition. However, this method has encountered limitations, including complex data preprocessing, high model complexity, poor interpretability, and limited generalization ability [
23,
24].
(2) There is a lack of unified methods for recognizing patterns across all map elements, making it challenging to achieve multi-pattern recognition for different types of map groups using a single algorithm.
1.4. Research Objectives
To address these issues, a primary challenge lies in constructing a consistent geometric model structure that accommodates both building groups and road networks, despite their differing forms and adjacency relationships. In previous studies, scholars have often used edge-node geometric models to represent the adjacency relationships of geographic elements [
25,
26]. For instance, Delaunay triangulation and minimum spanning tree (MST) models have been applied to building groups [
25], while road network connectivity graphs and dual graphs have been employed for road networks [
26]. Among these methods, MST models and road network connectivity graphs are particularly effective in representing adjacency relationships due to their simplicity. By constructing MSTs for building groups and connectivity graphs for road networks, these two distinct geographic element groups can be uniformly transformed into edge-node structures, providing a foundation for multi-pattern recognition algorithms across different elements.
Directional entropy, a measure derived from information entropy, serves as a quantitative indicator for evaluating the spatial distribution of geographic data [
27]. It effectively captures the regularity and disorder of spatial patterns and has been widely applied in urban planning and analysis [
28]. Unlike other feature extraction algorithms, directional entropy does not require predefined thresholds, making it both convenient and flexible. By introducing directional entropy into map group pattern recognition, it becomes possible to quantitatively describe the disorder and regularity of spatial distributions in edge-node geometric models constructed for building groups and road networks [
29]. This approach offers a robust and efficient means to evaluate the spatial patterns of geographic elements with greater precision.
In this study, we focus on two types of geographic element groups: building groups and road networks. By constructing edge-node geometric model structures and introducing directional entropy and node degree as feature parameters, we propose a graph-based multi-pattern recognition method for map group patterns. This approach aims to efficiently and accurately identify distribution patterns, including linear, grid, irregular, and curved types for building groups, as well as grid and irregular patterns for road networks.
2. Methodology
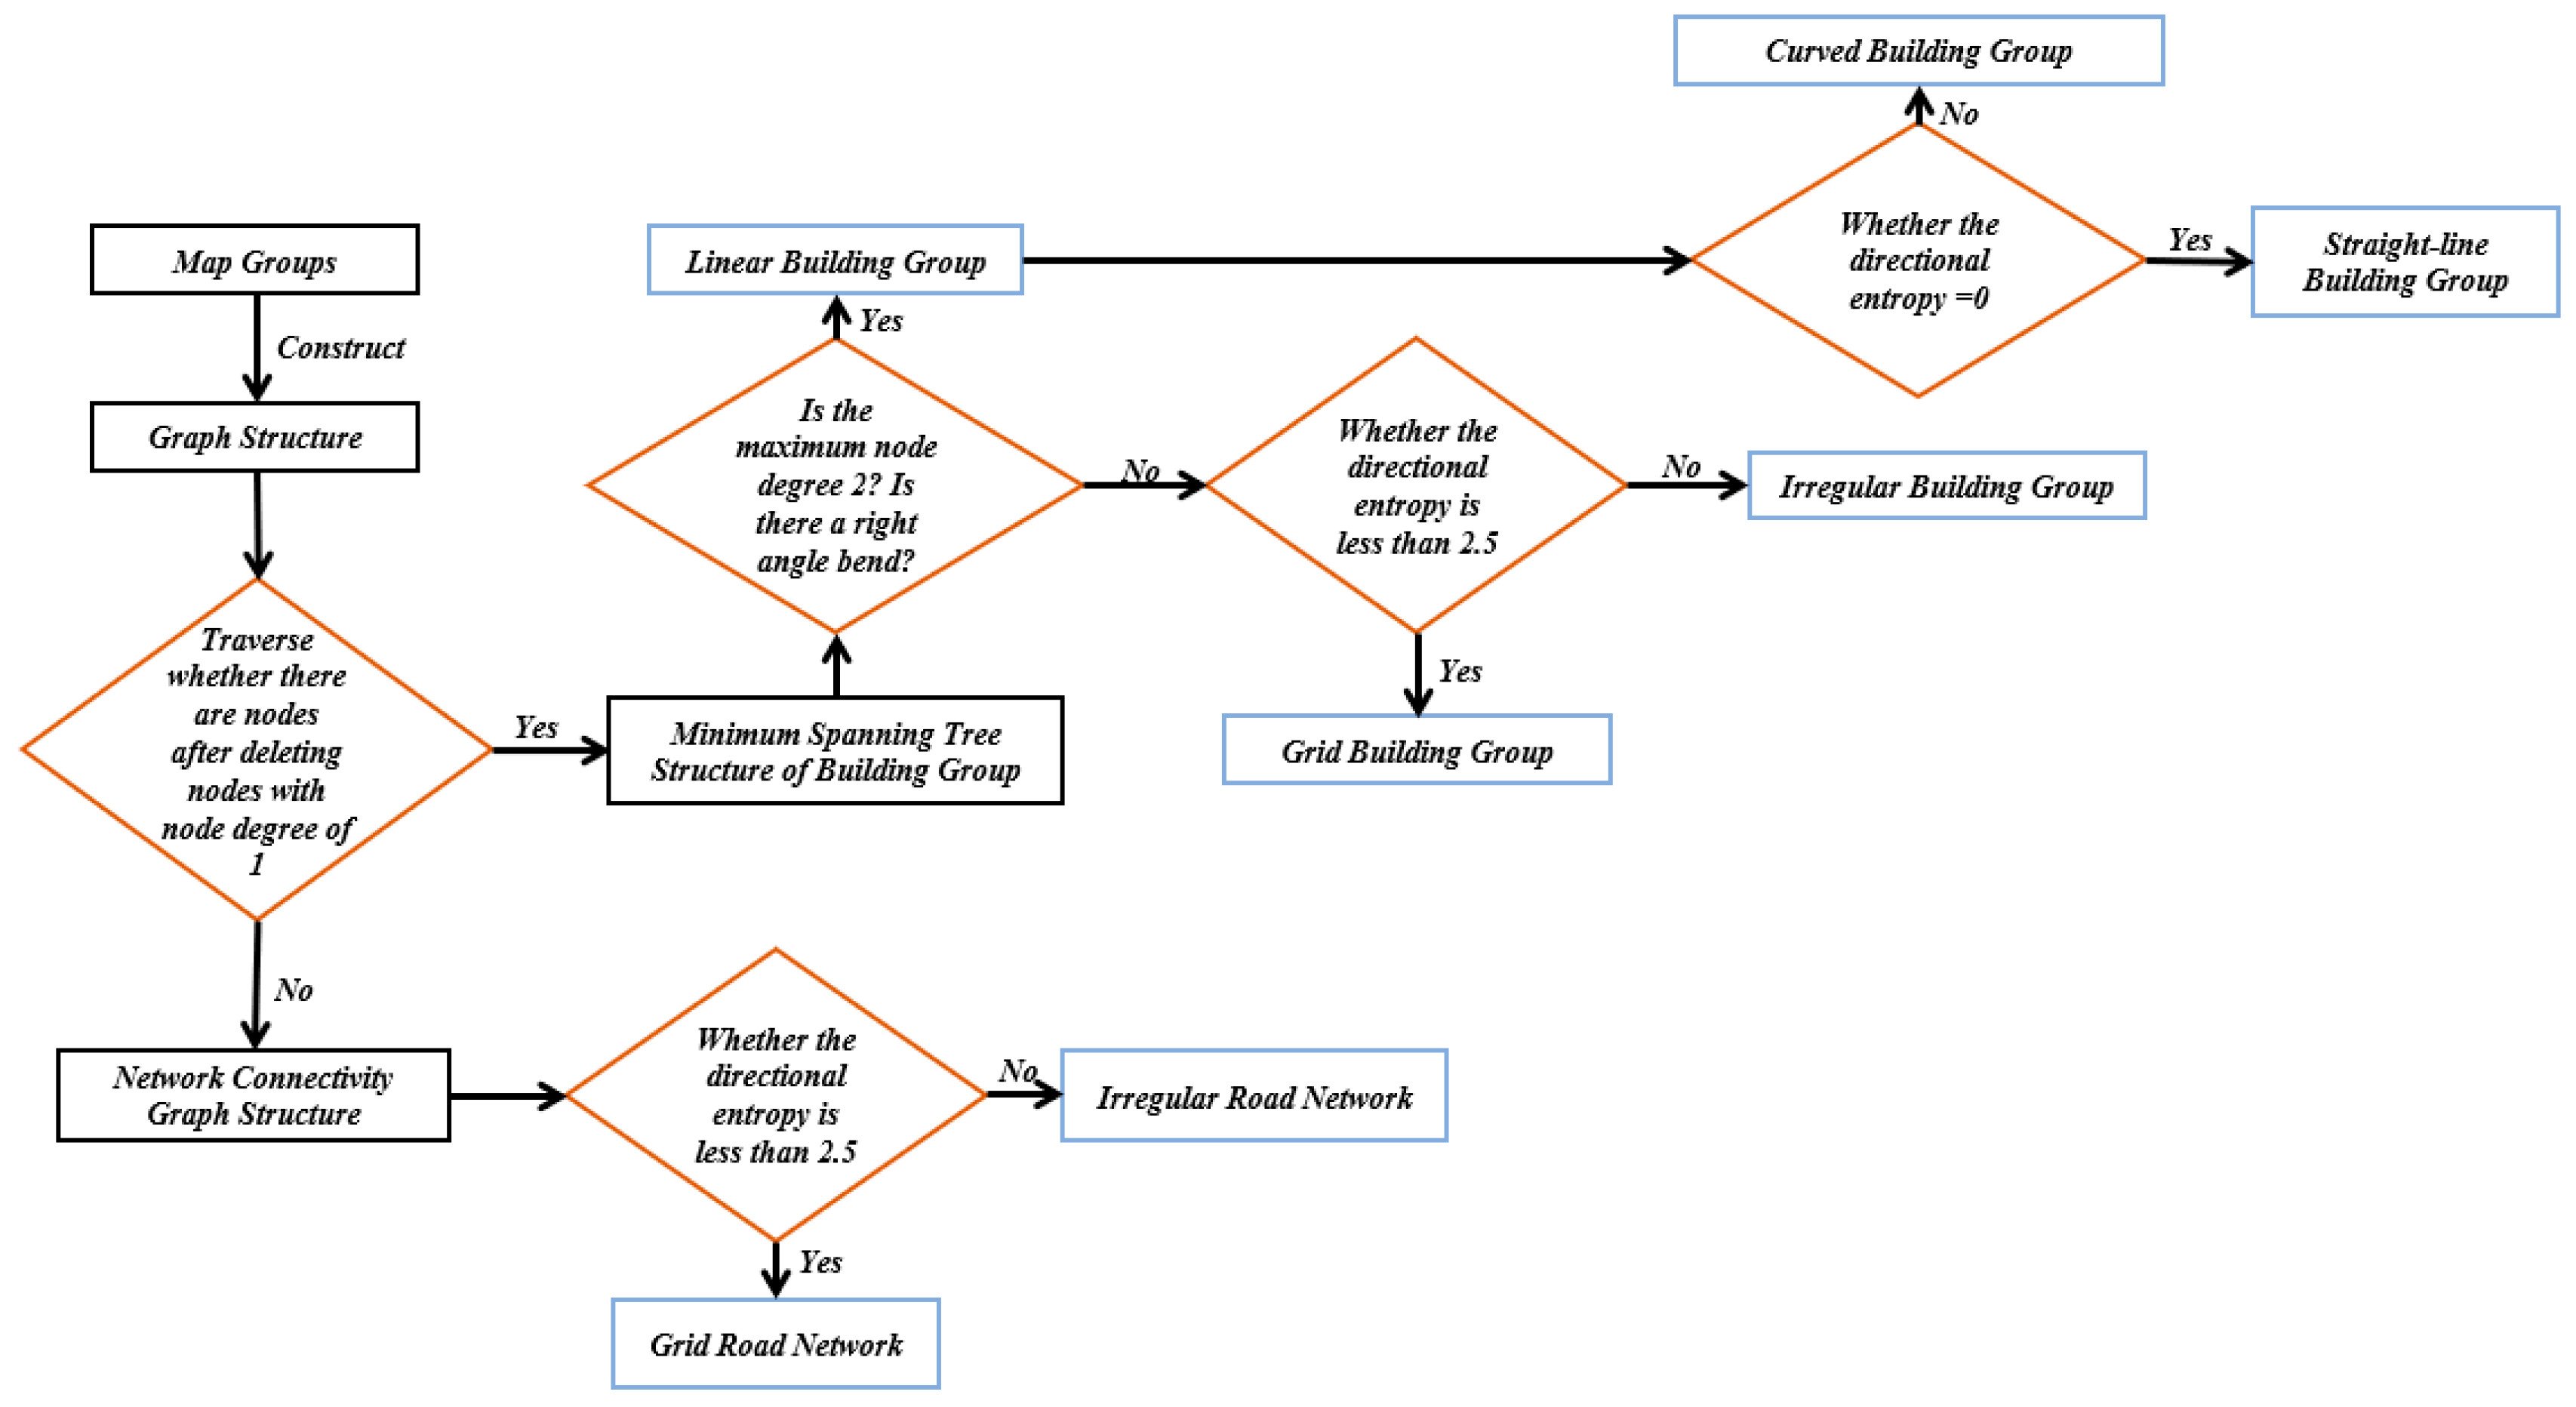
This study aims to construct edge-node structural geometric models for building groups and road networks, leveraging the strengths of directional entropy in describing the spatial distribution of geographic elements. By incorporating feature parameters such as node degree, this research develops a simple and efficient algorithm for multi-pattern recognition of map group targets, including building groups and road networks. Given that linear, curved, grid, and irregular building group patterns, along with grid and irregular road network patterns, are the most common, this study focuses on recognizing these six types of map group patterns.
The algorithm workflow, illustrated in
Figure 1, comprises several key steps: map group construction, geometric model construction, feature parameter calculation, threshold setting, recognition rule formulation, and pattern classification.
These steps are detailed as follows:
(1) Geographic element acquisition: Vector data including buildings and road segments are obtained from OpenStreetMap.
(2) Map group construction: Use natural visual methods to group building data. Construct road network samples through manual pruning and road network optimization (linear segmentation and deletion of level 1 terminal nodes). Then, manually annotate the constructed map group.
(3) Edge-node geometric model construction: For building groups, minimum spanning trees are generated using Prim’s algorithm based on building centroids. For road networks, connection graphs are built by extracting intersections and turning points through linear segmentation.
(4) Sample set preparation: The processed samples are divided into two equal sets (Sample Set 1 and Sample Set 2) for parameter tuning and algorithm validation.
(5) Feature parameter calculation: Directional entropy and node degree are computed based on the constructed edge-node models.
(6) Threshold determination: Statistical analysis of angular bins, node degrees, and entropy values from Sample Set 1 establishes thresholds for multi-pattern recognition.
(7) Recognition rule formulation: Identification rules are developed using the obtained thresholds and structural patterns observed in edge-node models.
(8) Pattern classification: The rules are applied to Sample Set 2 to validate effective classification of building groups (linear, curved, grid, irregular) and road networks (grid, irregular). Results are compared with manual annotations to verify recognition accuracy.
3. Map Group Construction and Edge-Node Geometric Model Building
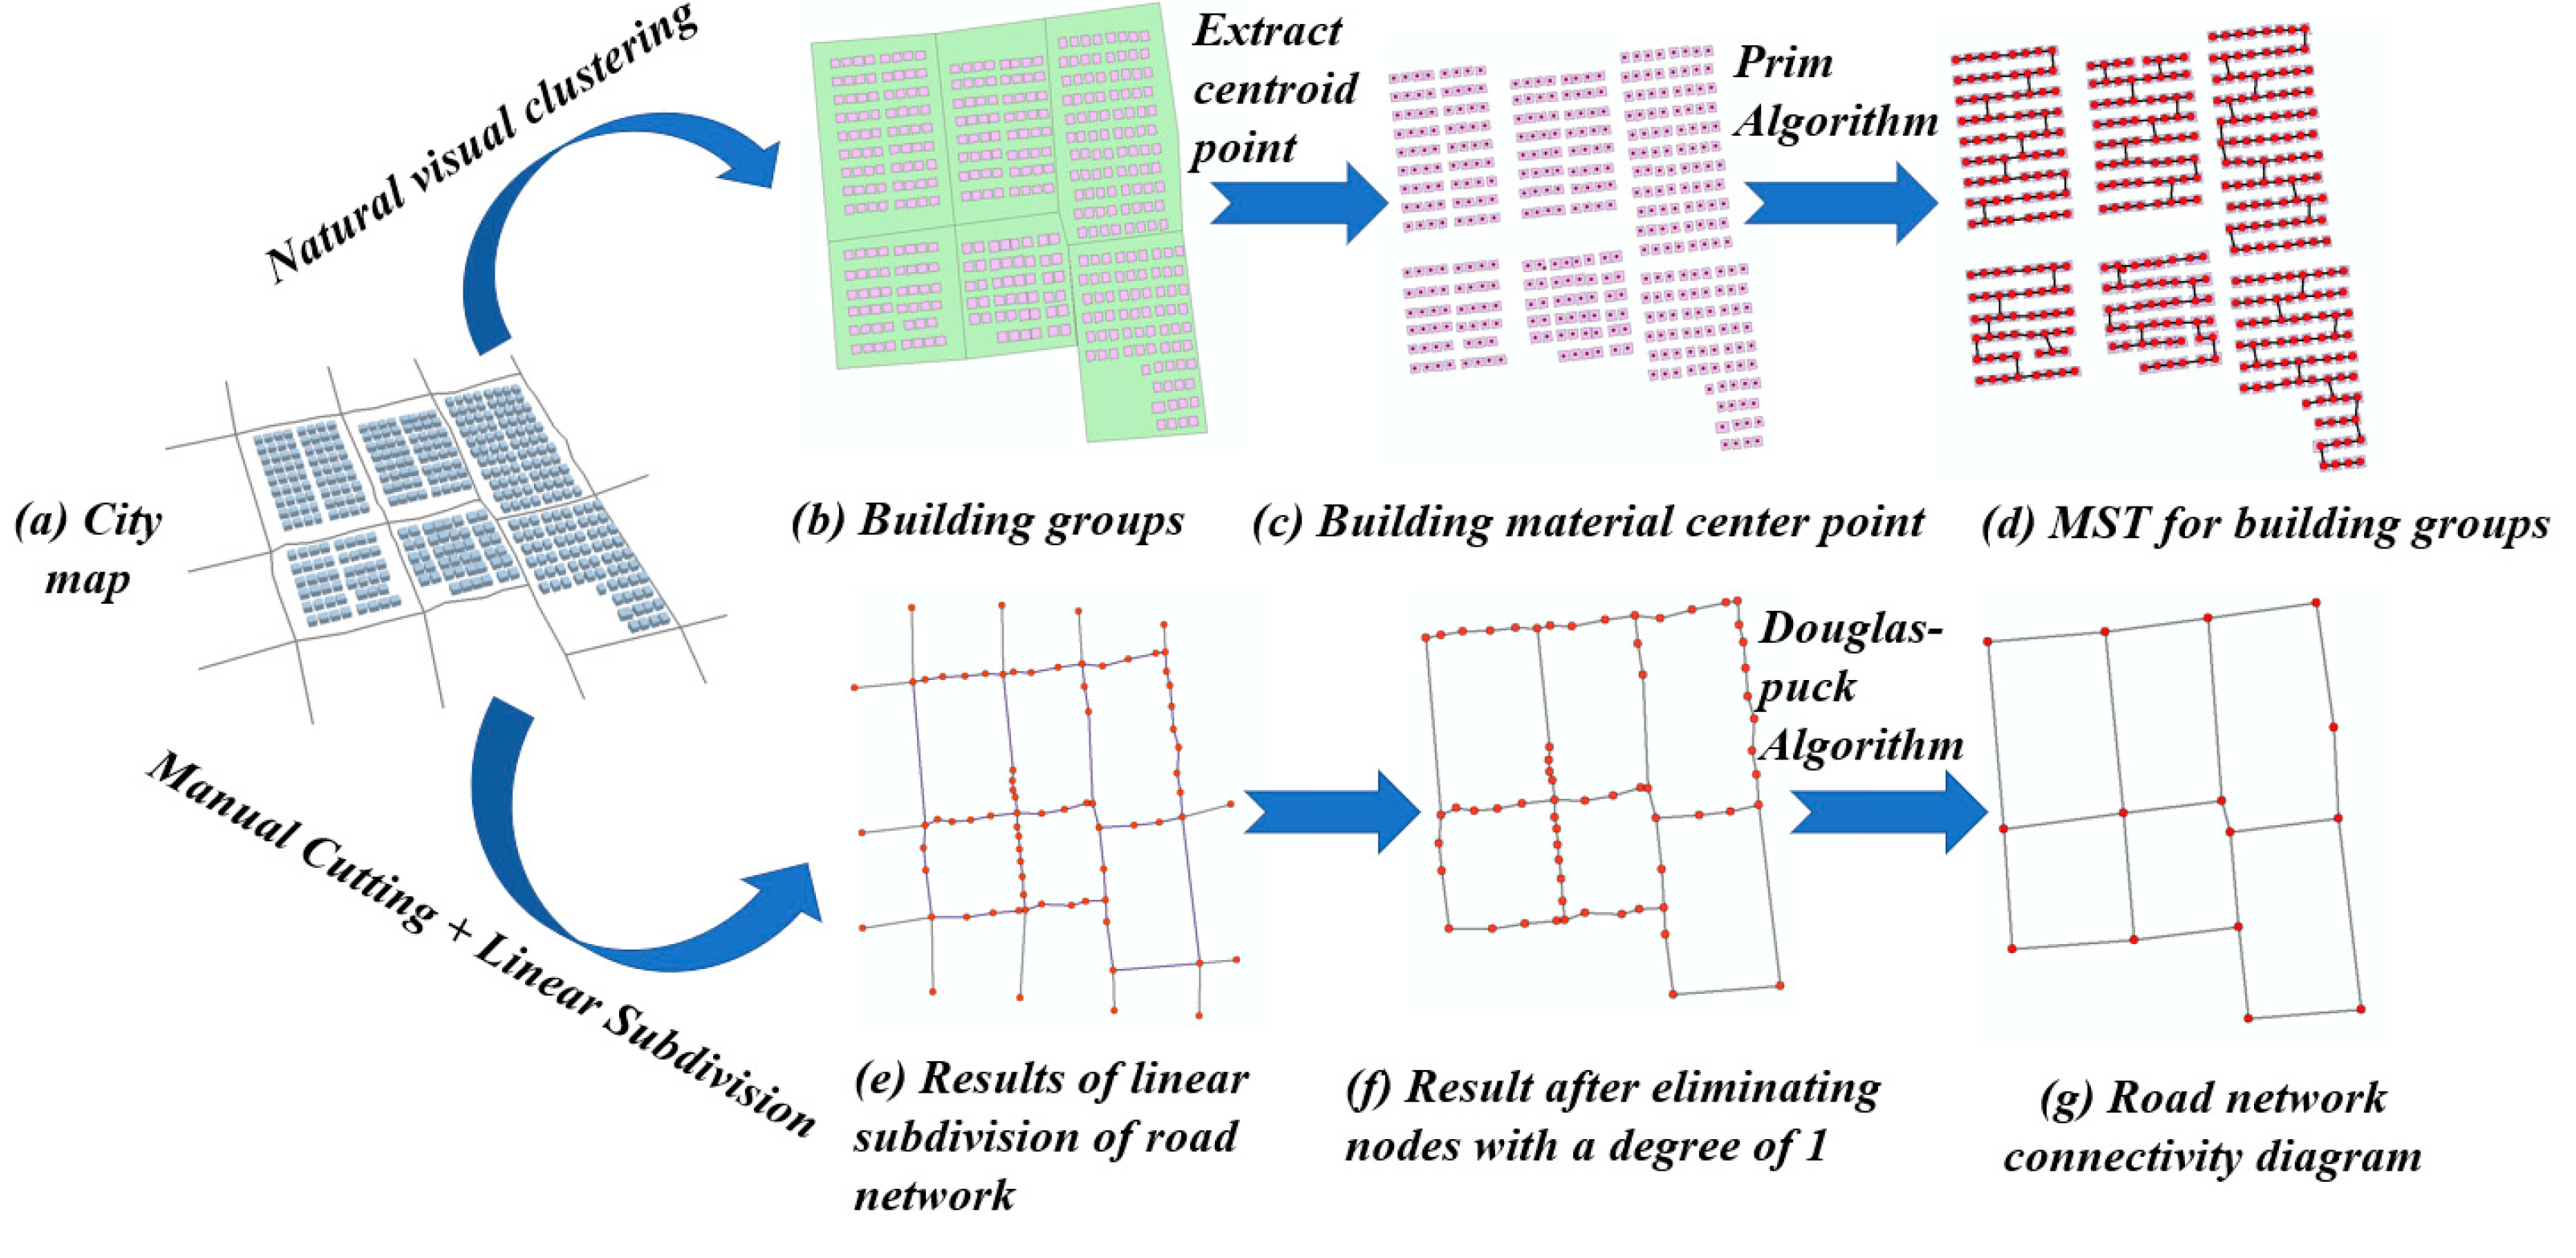
In this study, given the inherent differences in types and adjacency relationships between building and road network data elements, distinct methods are employed to construct map groups and their corresponding edge-node geometric models. The detailed processes are illustrated in
Figure 2.
Since building data typically do not have explicit connectivity relationships and are often distributed in clusters in urban maps, this study first clusters buildings to form building groups and then represents the proximity relationships between buildings using a graph structure. The specific process is as follows:
(1) Building Clustering: Use a natural visual clustering method to divide buildings into multiple building groups by utilizing road networks or rivers as separators (
Figure 2b).
(2) Centroid Extraction: Extract the centroids of each building within each building group to form a cluster of building centroids (
Figure 2c).
(3) Minimum Spanning Tree Generation: Apply Prim’s algorithm to the cluster of building centroids to generate the minimum spanning tree corresponding to each building group (
Figure 2d).
(4) Edge-Node Structural Model Completion: Complete the construction of the building group and its edge-node structural model.
In comparison to buildings, road segment data naturally possess connectivity relationships. However, road networks often include minor road segments (such as sidewalks or bike paths), and the original road network data usually have a certain degree of curvature (as shown in
Figure 2a). Therefore, when constructing road network samples and connectivity graphs, it is necessary to optimize the original data. The specific process is as follows:
(1) Sample Division: Divide the road data obtained from OpenStreetMap into multiple raw road network samples through manual cropping.
(2) Linear Segmentation: Perform linear segmentation on the raw road network samples based on intersection points and inflection points, dividing the road network into multiple road segments (
Figure 2e).
(3) Exclusion of Minor Road Segments: Iteratively traverse the segmented road network samples and sequentially remove road segments where both endpoints have a degree of 1 until there are no nodes with a degree of 1 remaining in the sample (
Figure 2f).
(4) Road Segment Simplification: Apply the Douglas–Peucker algorithm to simplify the road segments in the optimized road network data.
(5) Completion: Complete the construction of the road network samples and their connectivity graphs.
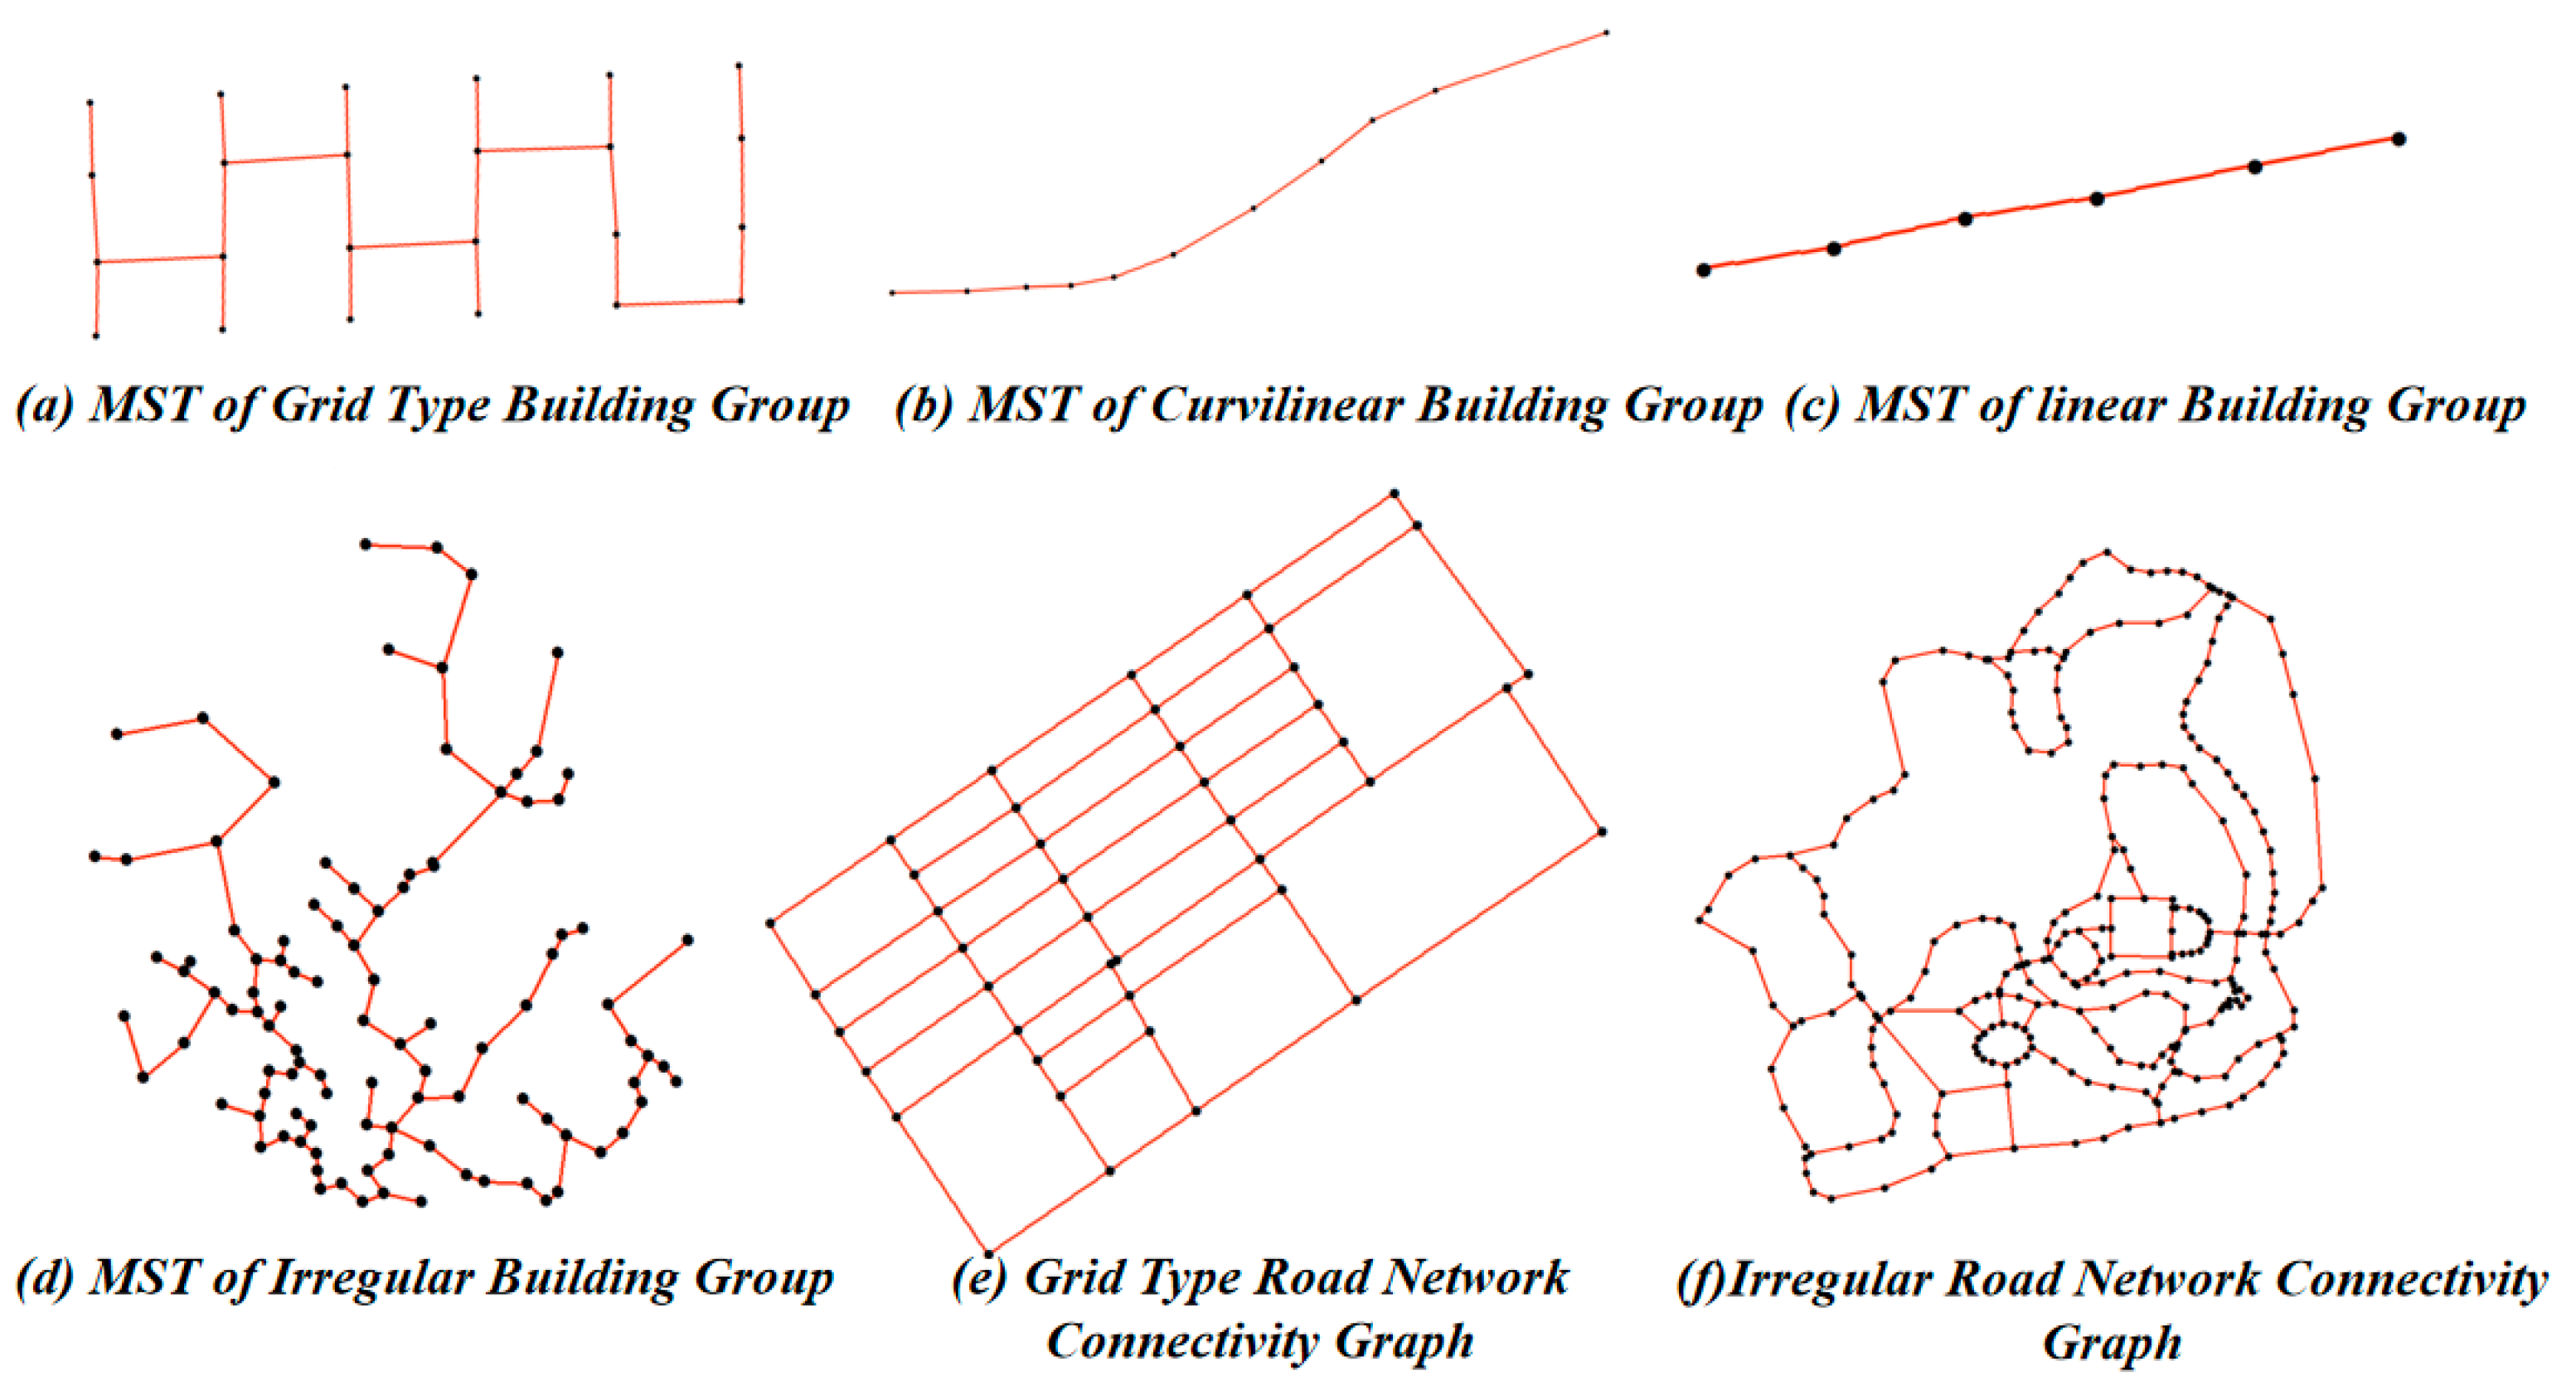
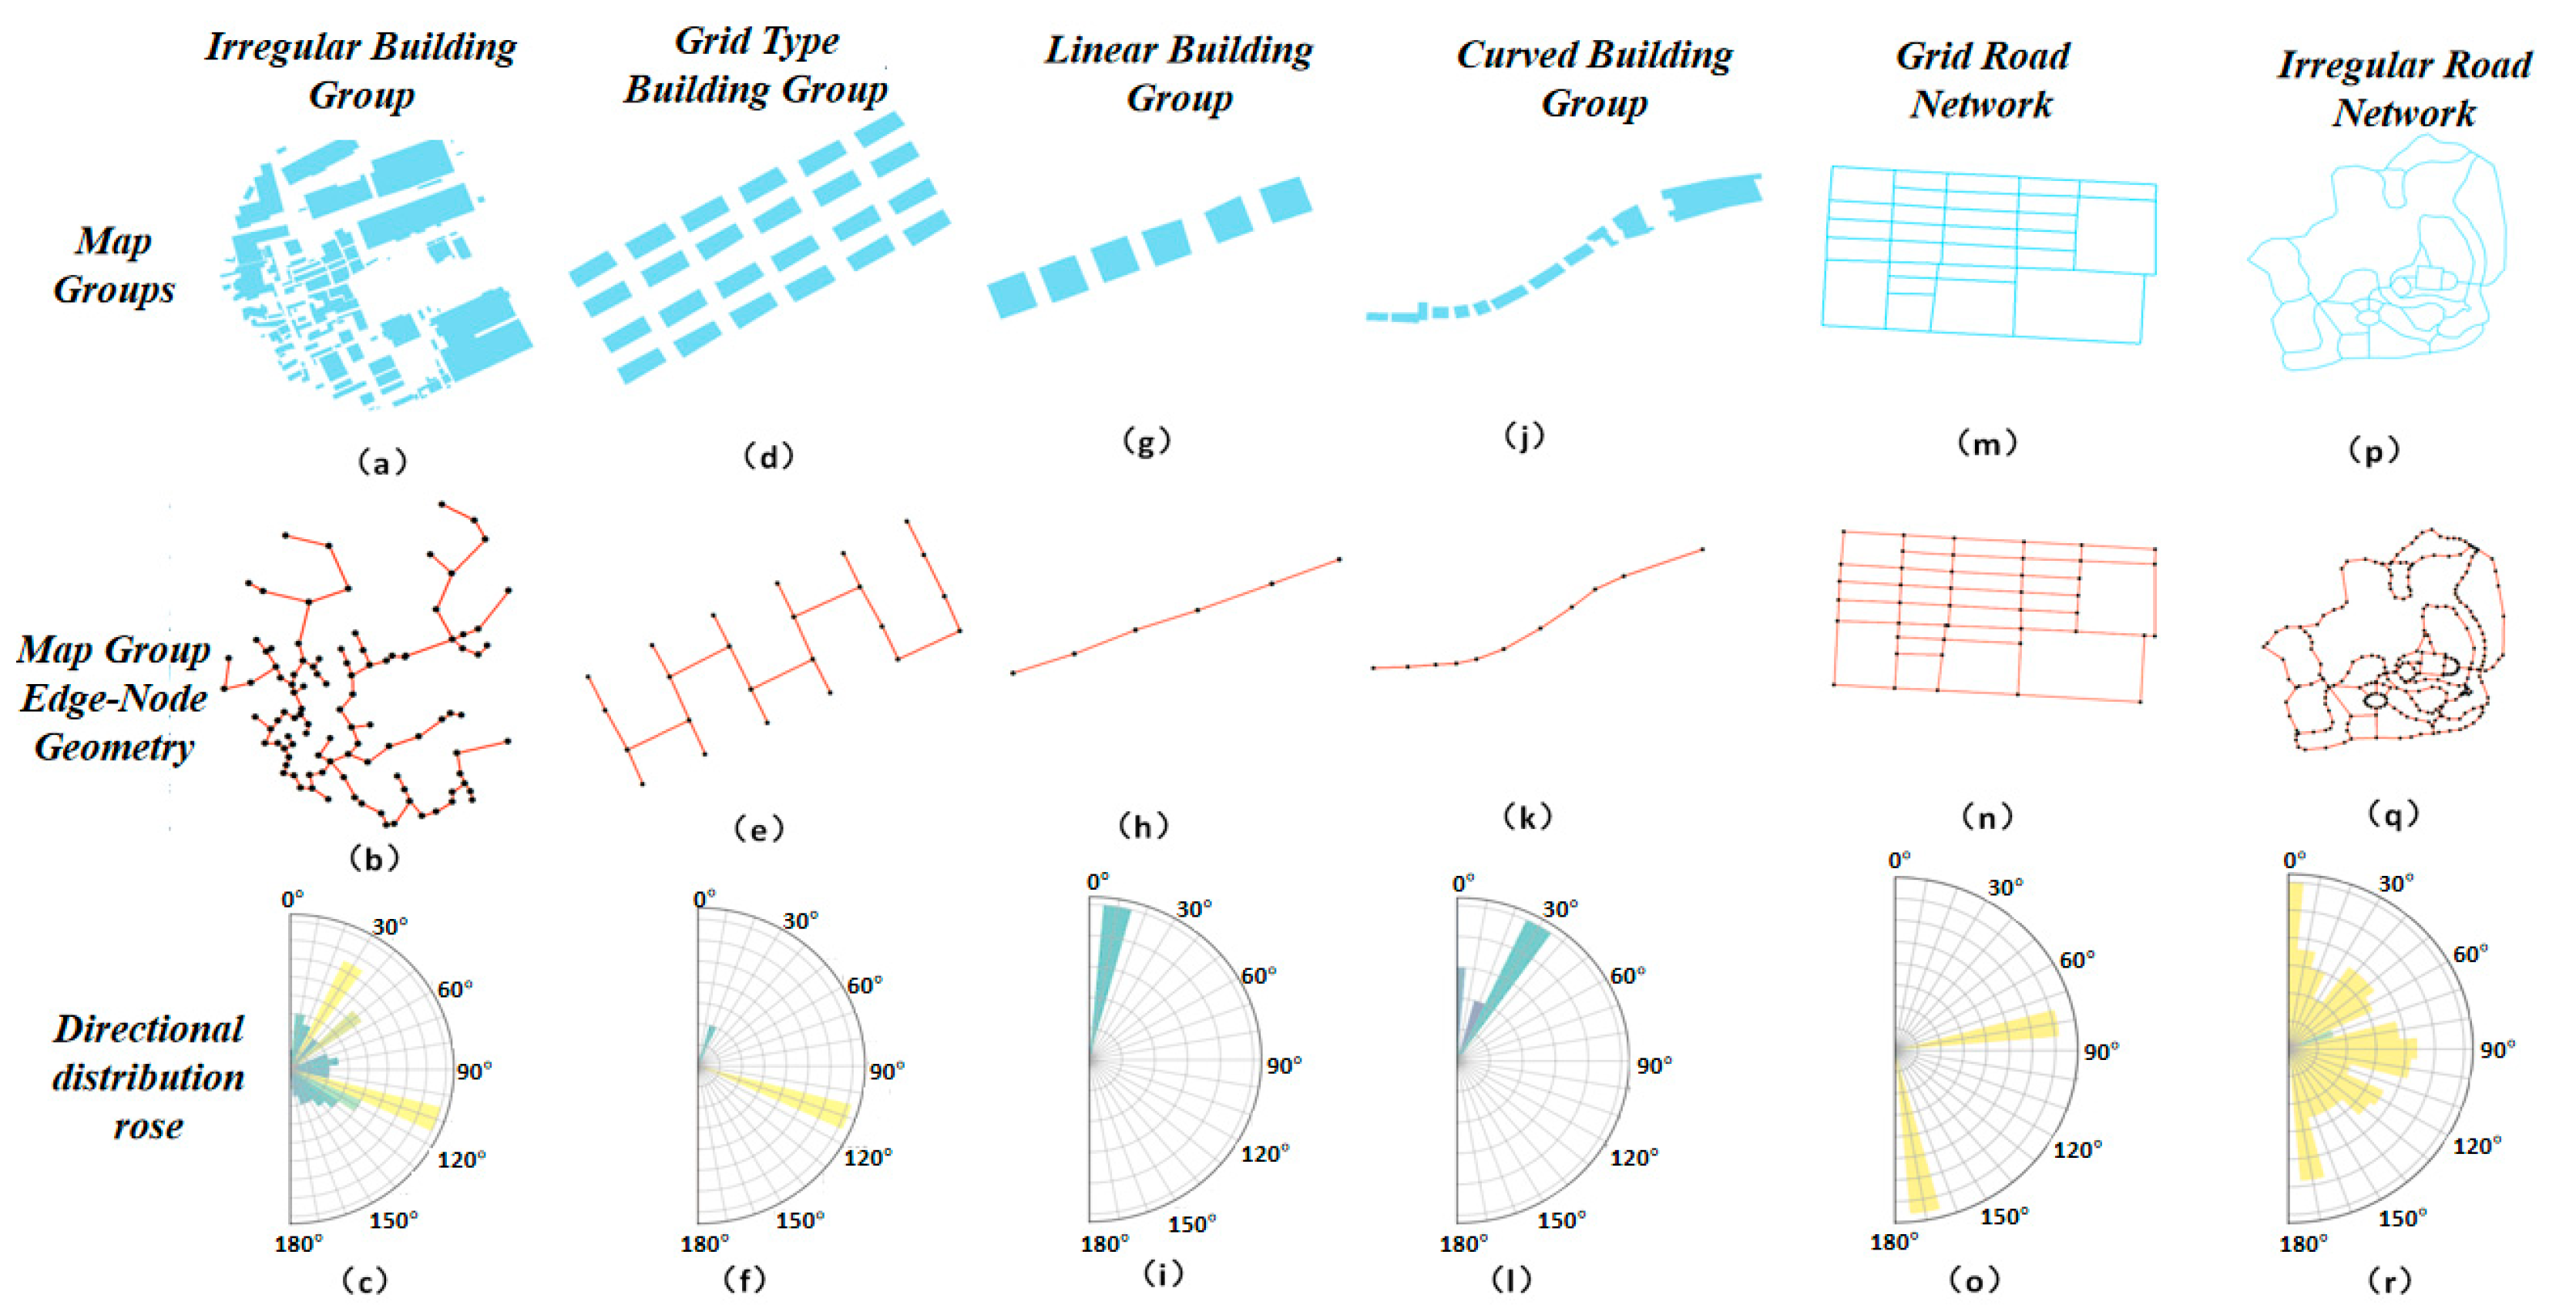
Figure 3 showcases the performance of six common map group types after constructing their edge-node structural geometric models. By analyzing the minimum spanning trees or road network connectivity graphs generated from different pattern map groups, the following conclusions can be drawn:
(1) Grid-Type Building Groups (
Figure 3a) and Grid-Type Road Networks (
Figure 3e): The minimum spanning trees or road network connectivity graphs of both grid-type building groups and grid-type road networks are constructed from multiple parallel, orthogonal, or oblique straight lines. The minimum spanning tree of a grid-type building group is not closed, whereas the connectivity graph of a grid-type road network is closed.
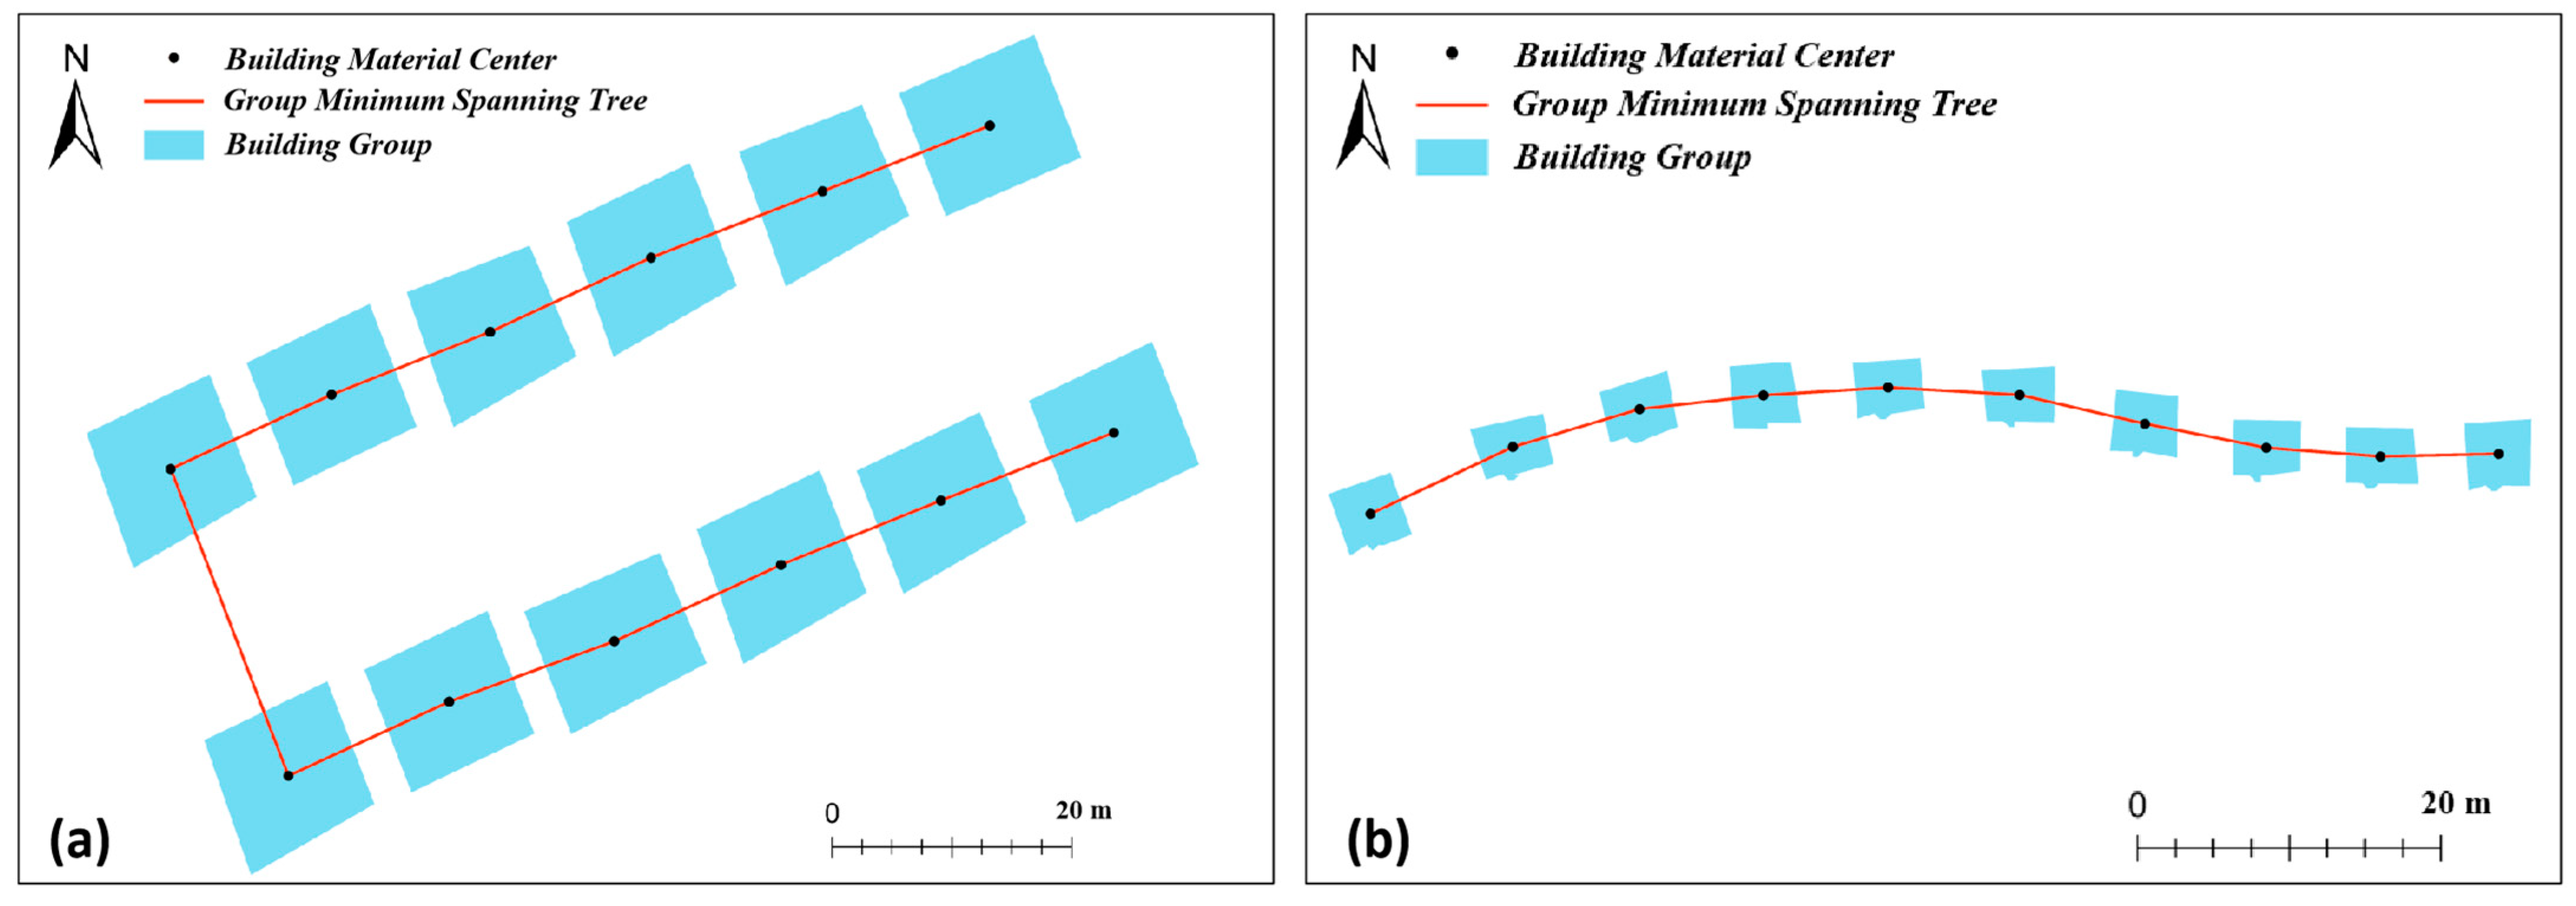
(2) Curved-Type Building Groups (
Figure 3b) and Linear-Type Building Groups (
Figure 3c): The minimum spanning trees of both curved-type building groups and linear-type building groups are constructed from a single line segment. The primary difference between these two types of building groups lies in the orientation of their minimum spanning trees. The minimum spanning tree of a linear-type building group is straight and directionally concentrated, forming a single straight-line segment. In contrast, the line segments in the minimum spanning tree of a curved-type building group shift with the curve, resulting in a more dispersed directional distribution.
(3) Irregular-Type Building Groups (
Figure 3d) and Irregular-Type Road Networks (
Figure 3f): The nodes in the minimum spanning tree of an irregular-type building group and the connectivity graph of an irregular-type road network are scattered, with edge directions lacking any specific pattern, resulting in a chaotic structure. The most significant difference between these two edge-node structures is that one is unclosed, while the other forms a geometric structure.
4. Feature Parameter Calculation
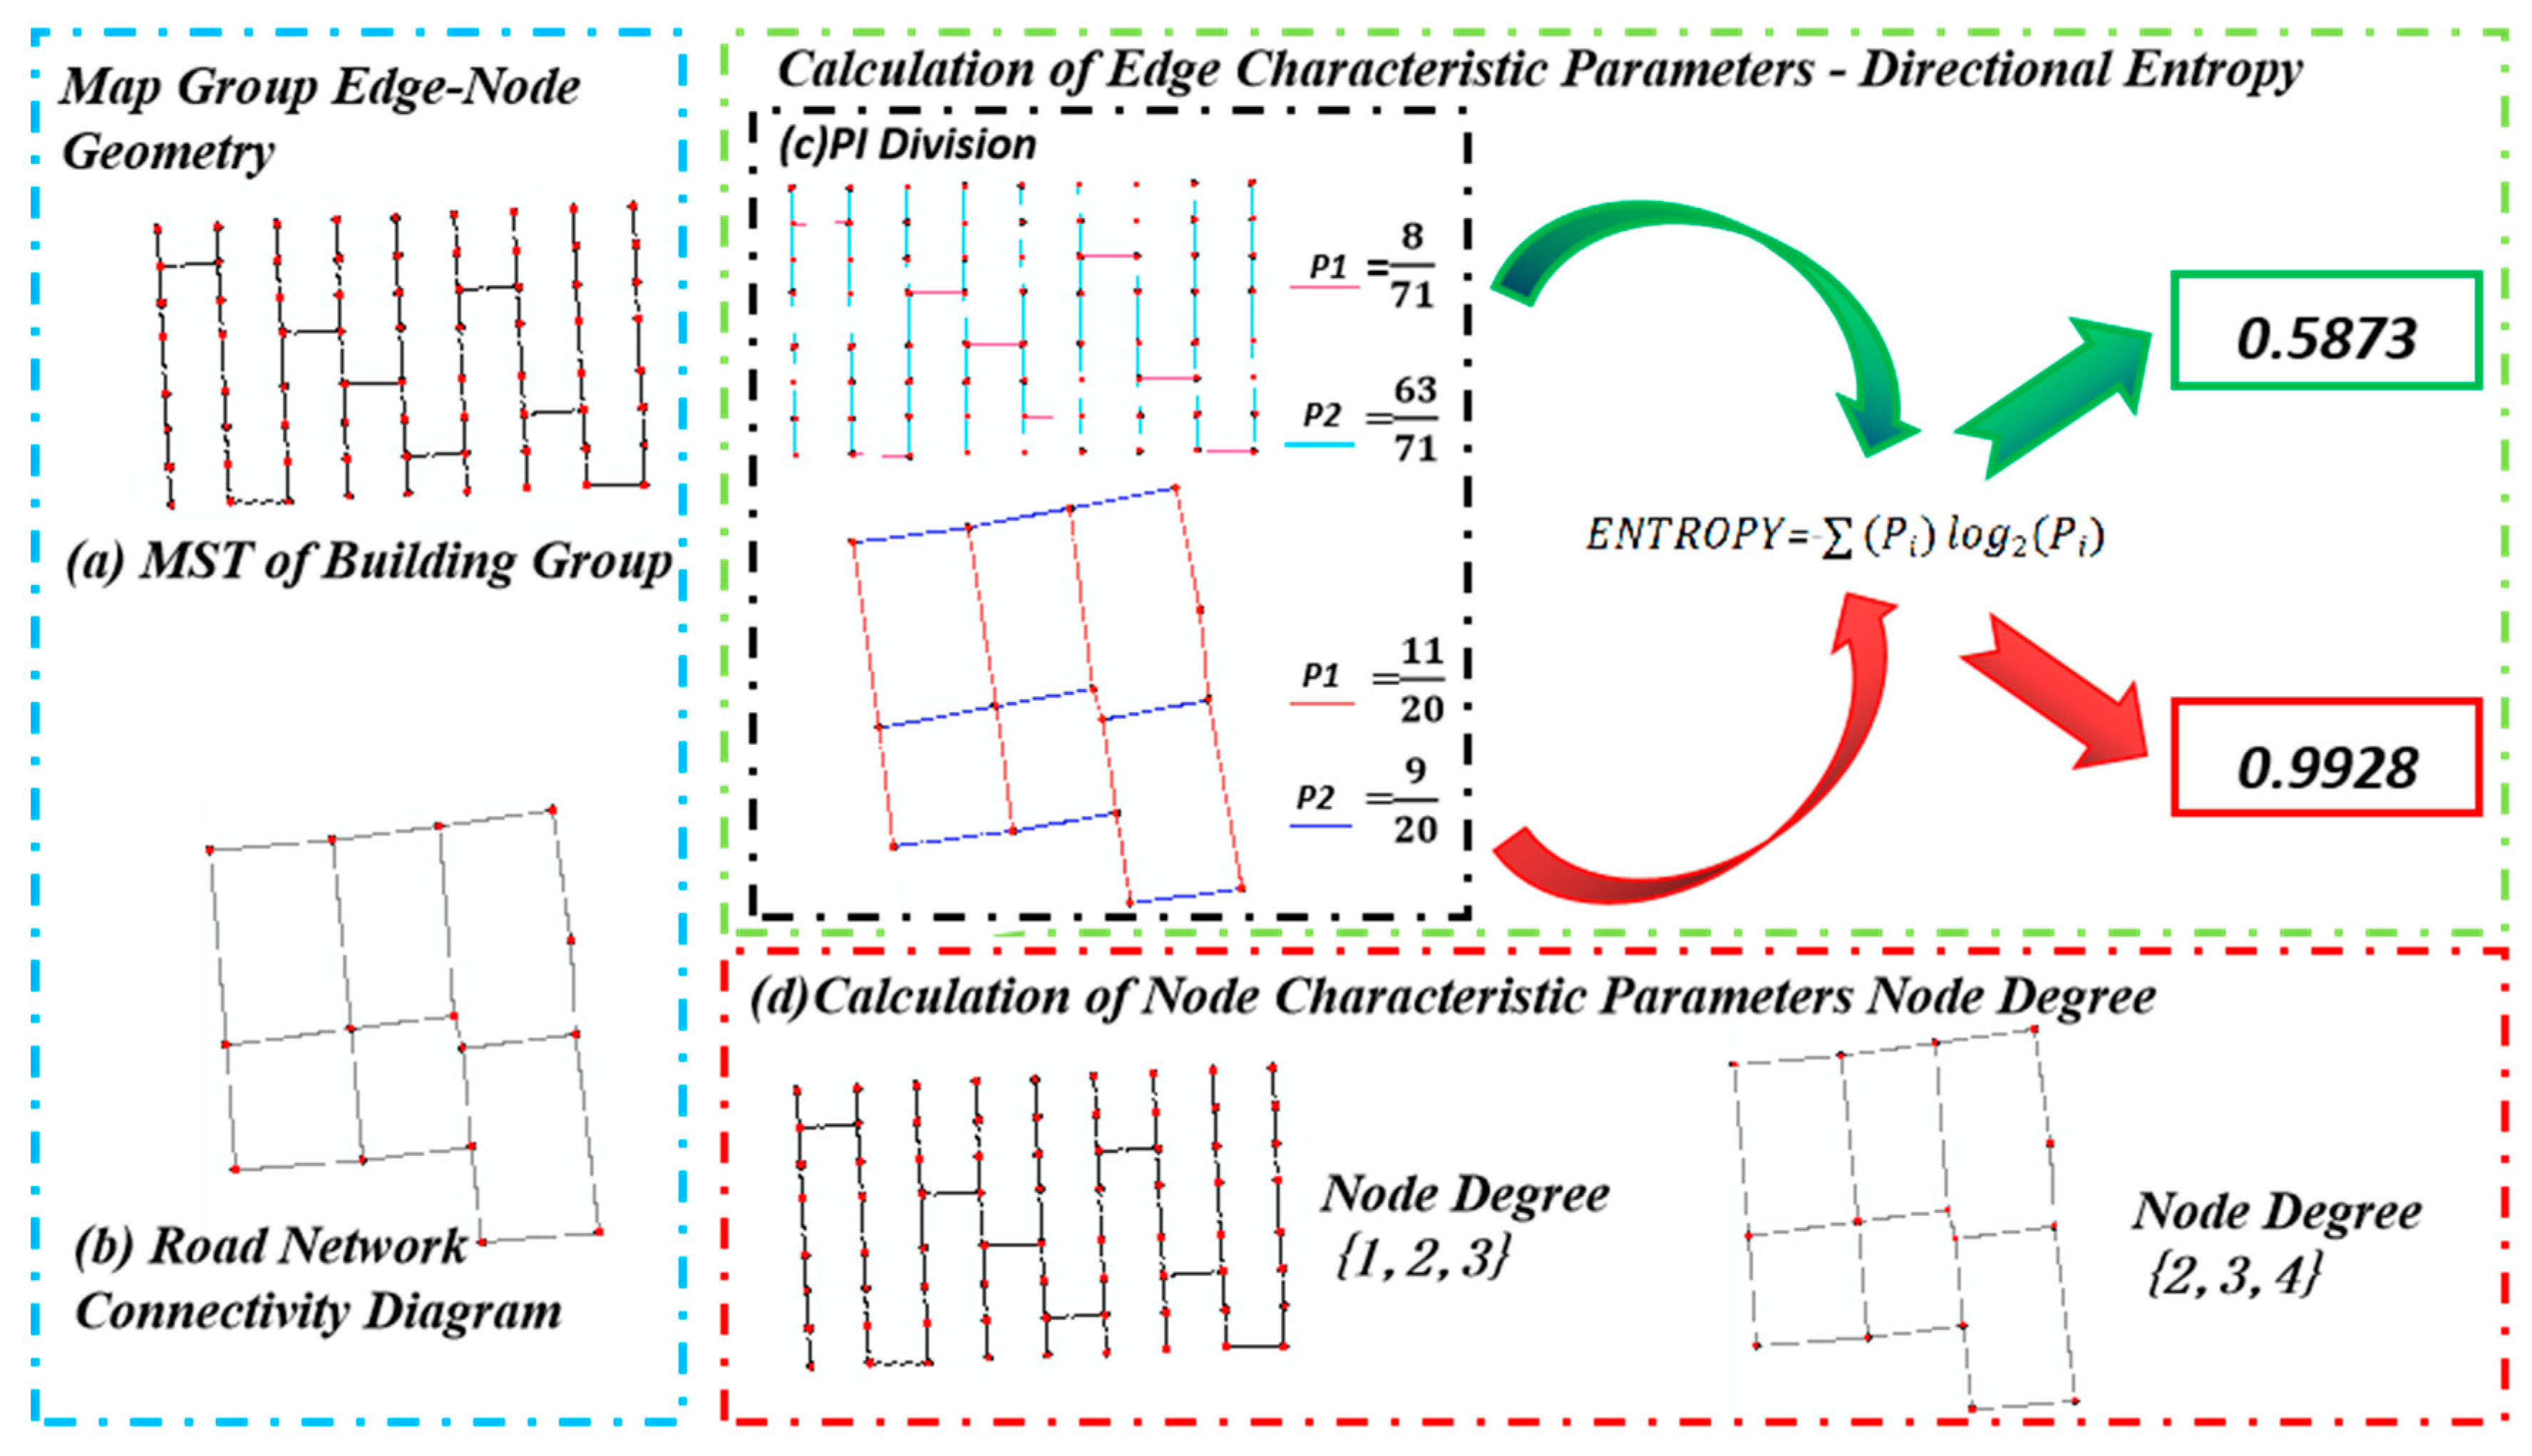
After completing the construction of the edge-node geometric model structure for map groups, the direction entropy and node degree of edges and nodes in the geometric models of road networks and building groups are calculated to uncover the regularity characteristics of different map group patterns. The process of calculating feature parameters is illustrated in
Figure 4.
4.1. Calculation of Directional Entropy
Directional entropy is an indicator used to quantify the directional distribution of spatial data. When there are
n data points in space, whether represented by latitude and longitude or planar coordinates, if these points exhibit a specific spatial distribution direction, directional entropy can be calculated to quantify this directionality. The process involves first arranging all data points in a particular order, then calculating the angle between each pair of adjacent data points. These angles are treated as variables, and by analyzing the equilibrium distribution of the variables
Xi, the value of directional entropy can be obtained, as shown in the following formula:
In the above formula, the
represents the total number of angle values within a certain range to the total number of all angle values, which means it represents the ratio of each variable
to the sum of all variables
, as shown in the following Equation (2):
When applying directional entropy to the recognition of map group object patterns, it is first necessary to establish a relative order for each edge in the road network connectivity graph and the minimum spanning tree of building groups. The variable represents the angle value of each edge in the minimum spanning tree or road network connectivity graph, while represents the total number of edges in the road network connectivity graph or minimum spanning tree.
From a mathematical perspective, if each Xi falls into a distinct partition interval, the value Pi will be minimized, and the directional entropy will reach its maximum, log2(Pi). This indicates that the edge arrangement in the edge-node geometric model of the map group is in a completely random distribution state. Conversely, if Xi are concentrated in a few partition intervals, Pi will increase, resulting in a smaller directional entropy value, which suggests that the edge arrangement in the edge-node geometric model of the map group exhibits a certain degree of directionality.
As shown in
Figure 4, the specific calculation process of directional entropy in map group pattern recognition is as follows:
(1) According to the type of map group, construct the corresponding edge-node geometric model structure.
(2) Construct a reference plane coordinate system, select an edge from the edge-node geometric model of the map group as the starting edge, and use the vector dot product formula to calculate the relative angle value of each edge. In the above formula:
and
are the vertical coordinates of the start and end nodes of the edge in the road segment and the minimum spanning tree, respectively;
and
represent the horizontal coordinates, and
θ denotes the angle of the edge.
(3) According to Formula (3), calculate the angle value θ for each road segment in the road network and each edge in the minimum spanning tree of the building group in the map group. Based on the differences in angle values, divide them into multiple intervals , and then use Formula (1) to calculate the directional entropy value of the map group.
As shown in
Figure 4, it displays the minimum spanning tree of grid-type building groups (
Figure 4a) and the connectivity graph of grid-type road networks (
Figure 4b). After constructing the corresponding planar coordinate system, angle calculations are performed for both types of edge-node structural geometric models using Formula (3), and the direction distribution of each edge is statistically analyzed, as shown in
Figure 4c. For the minimum spanning tree of grid-type building groups, it is divided into two
:
is 8/71 and
is 63/71. These values are then substituted into Formula (1) to calculate the directional entropy value, resulting in 0.8573, as shown in
Figure 4a. Similarly, the connectivity graph of grid-type road networks is divided into two
: 11/20 and 9/20. These
are also substituted into Formula (1) to calculate the directional entropy value, resulting in 0.9928, as shown in
Figure 4b.
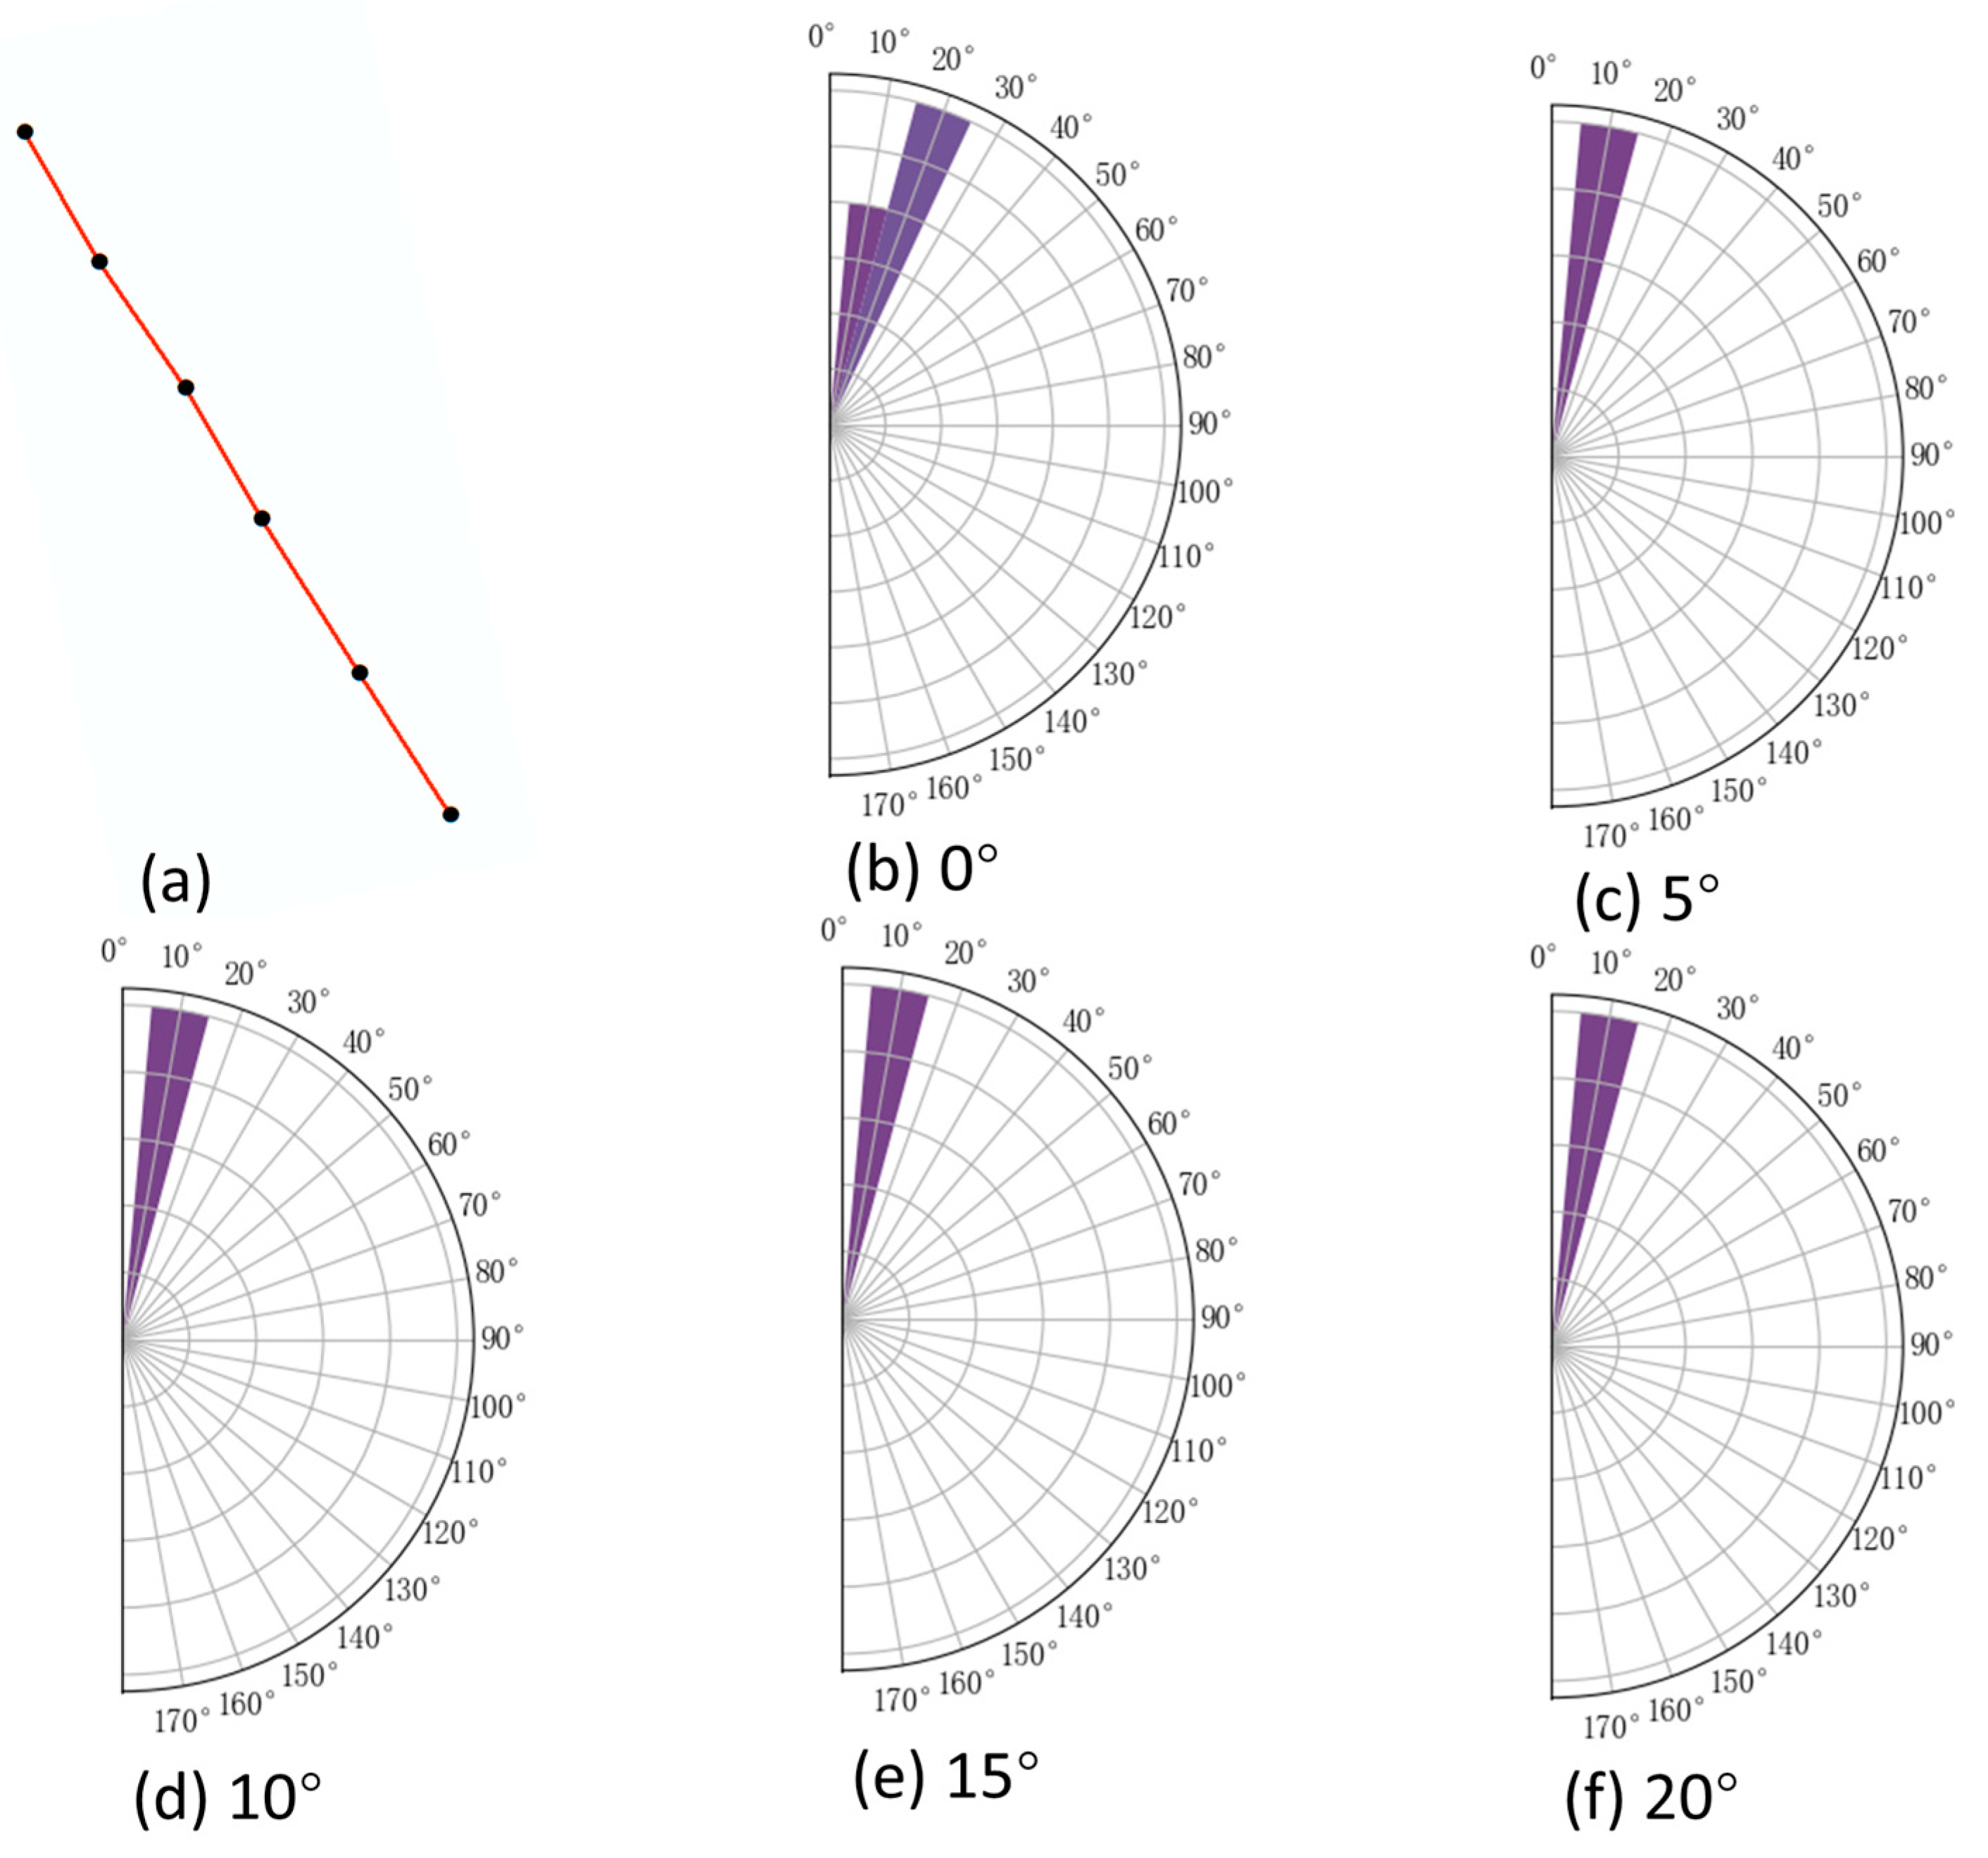
In urban environments, perfectly regular grid-like minimum spanning trees (MSTs) of building groups and grid-like road network connectivity graphs are relatively rare. Due to various influencing factors, even in structured patterns, slight directional variations often occur in the edges of MSTs and road network graphs. These variations increase the number of and raise entropy values in directional entropy calculations, necessitating an appropriate angular threshold for proper classification.
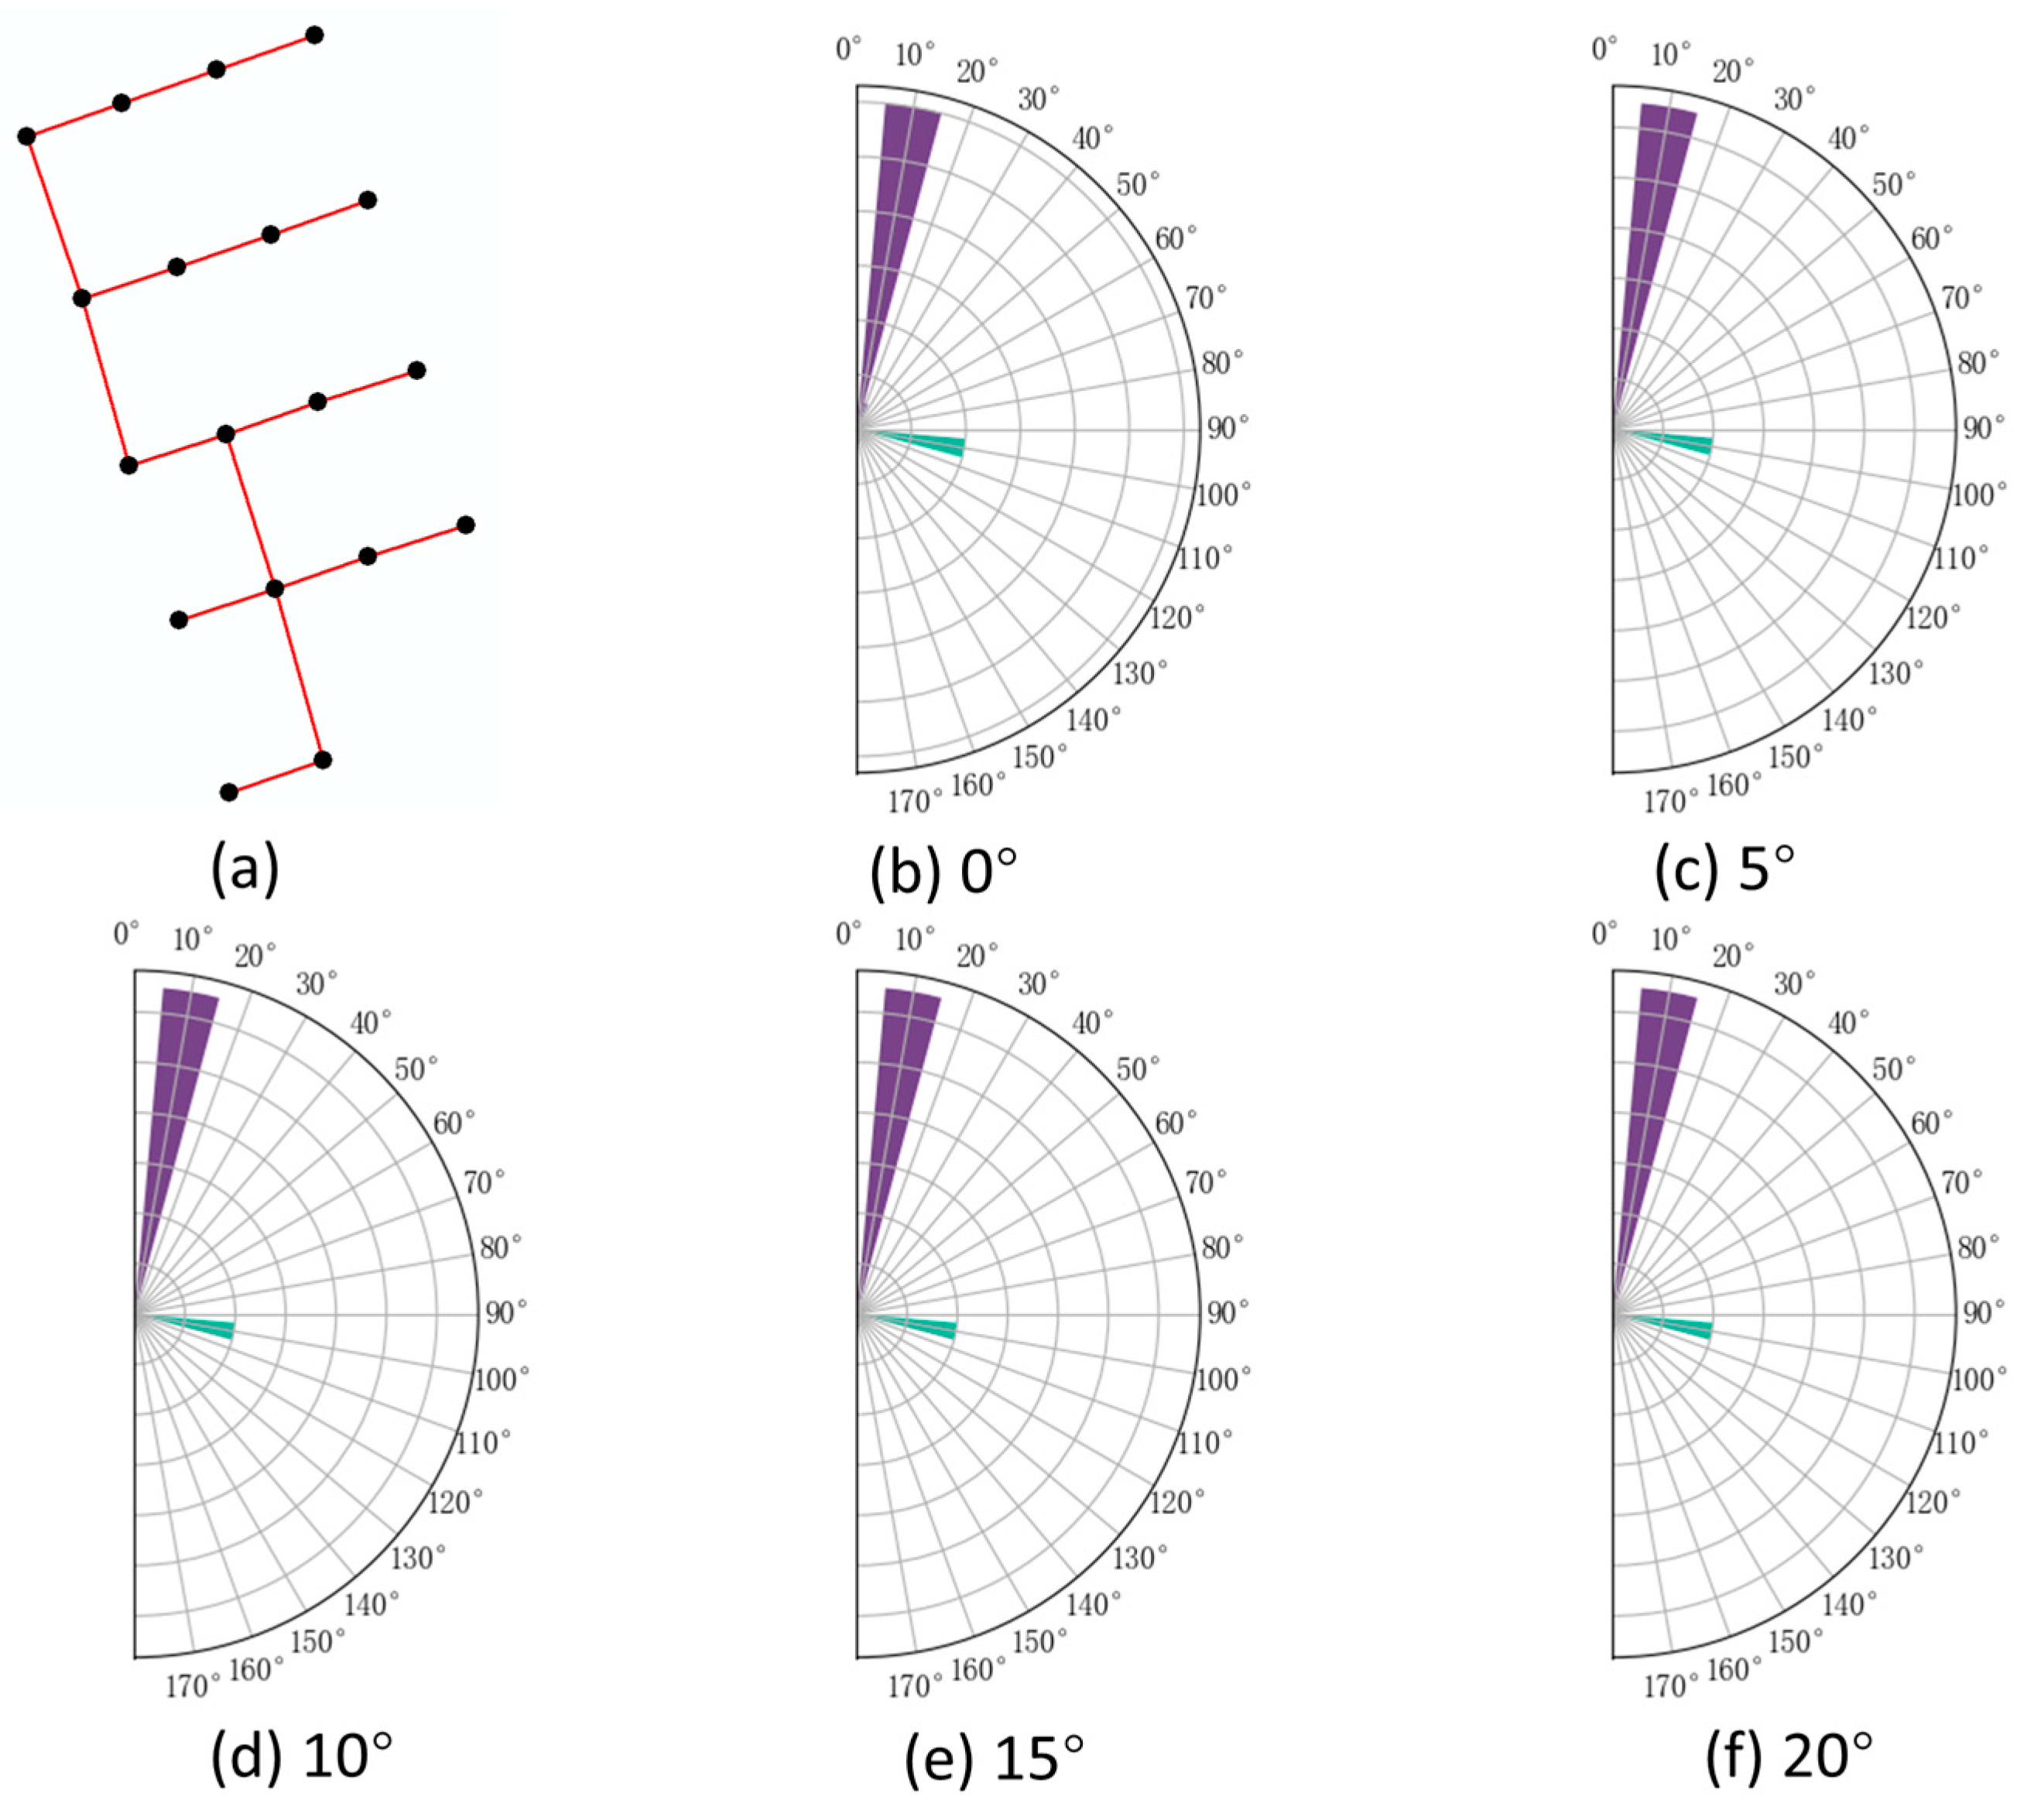
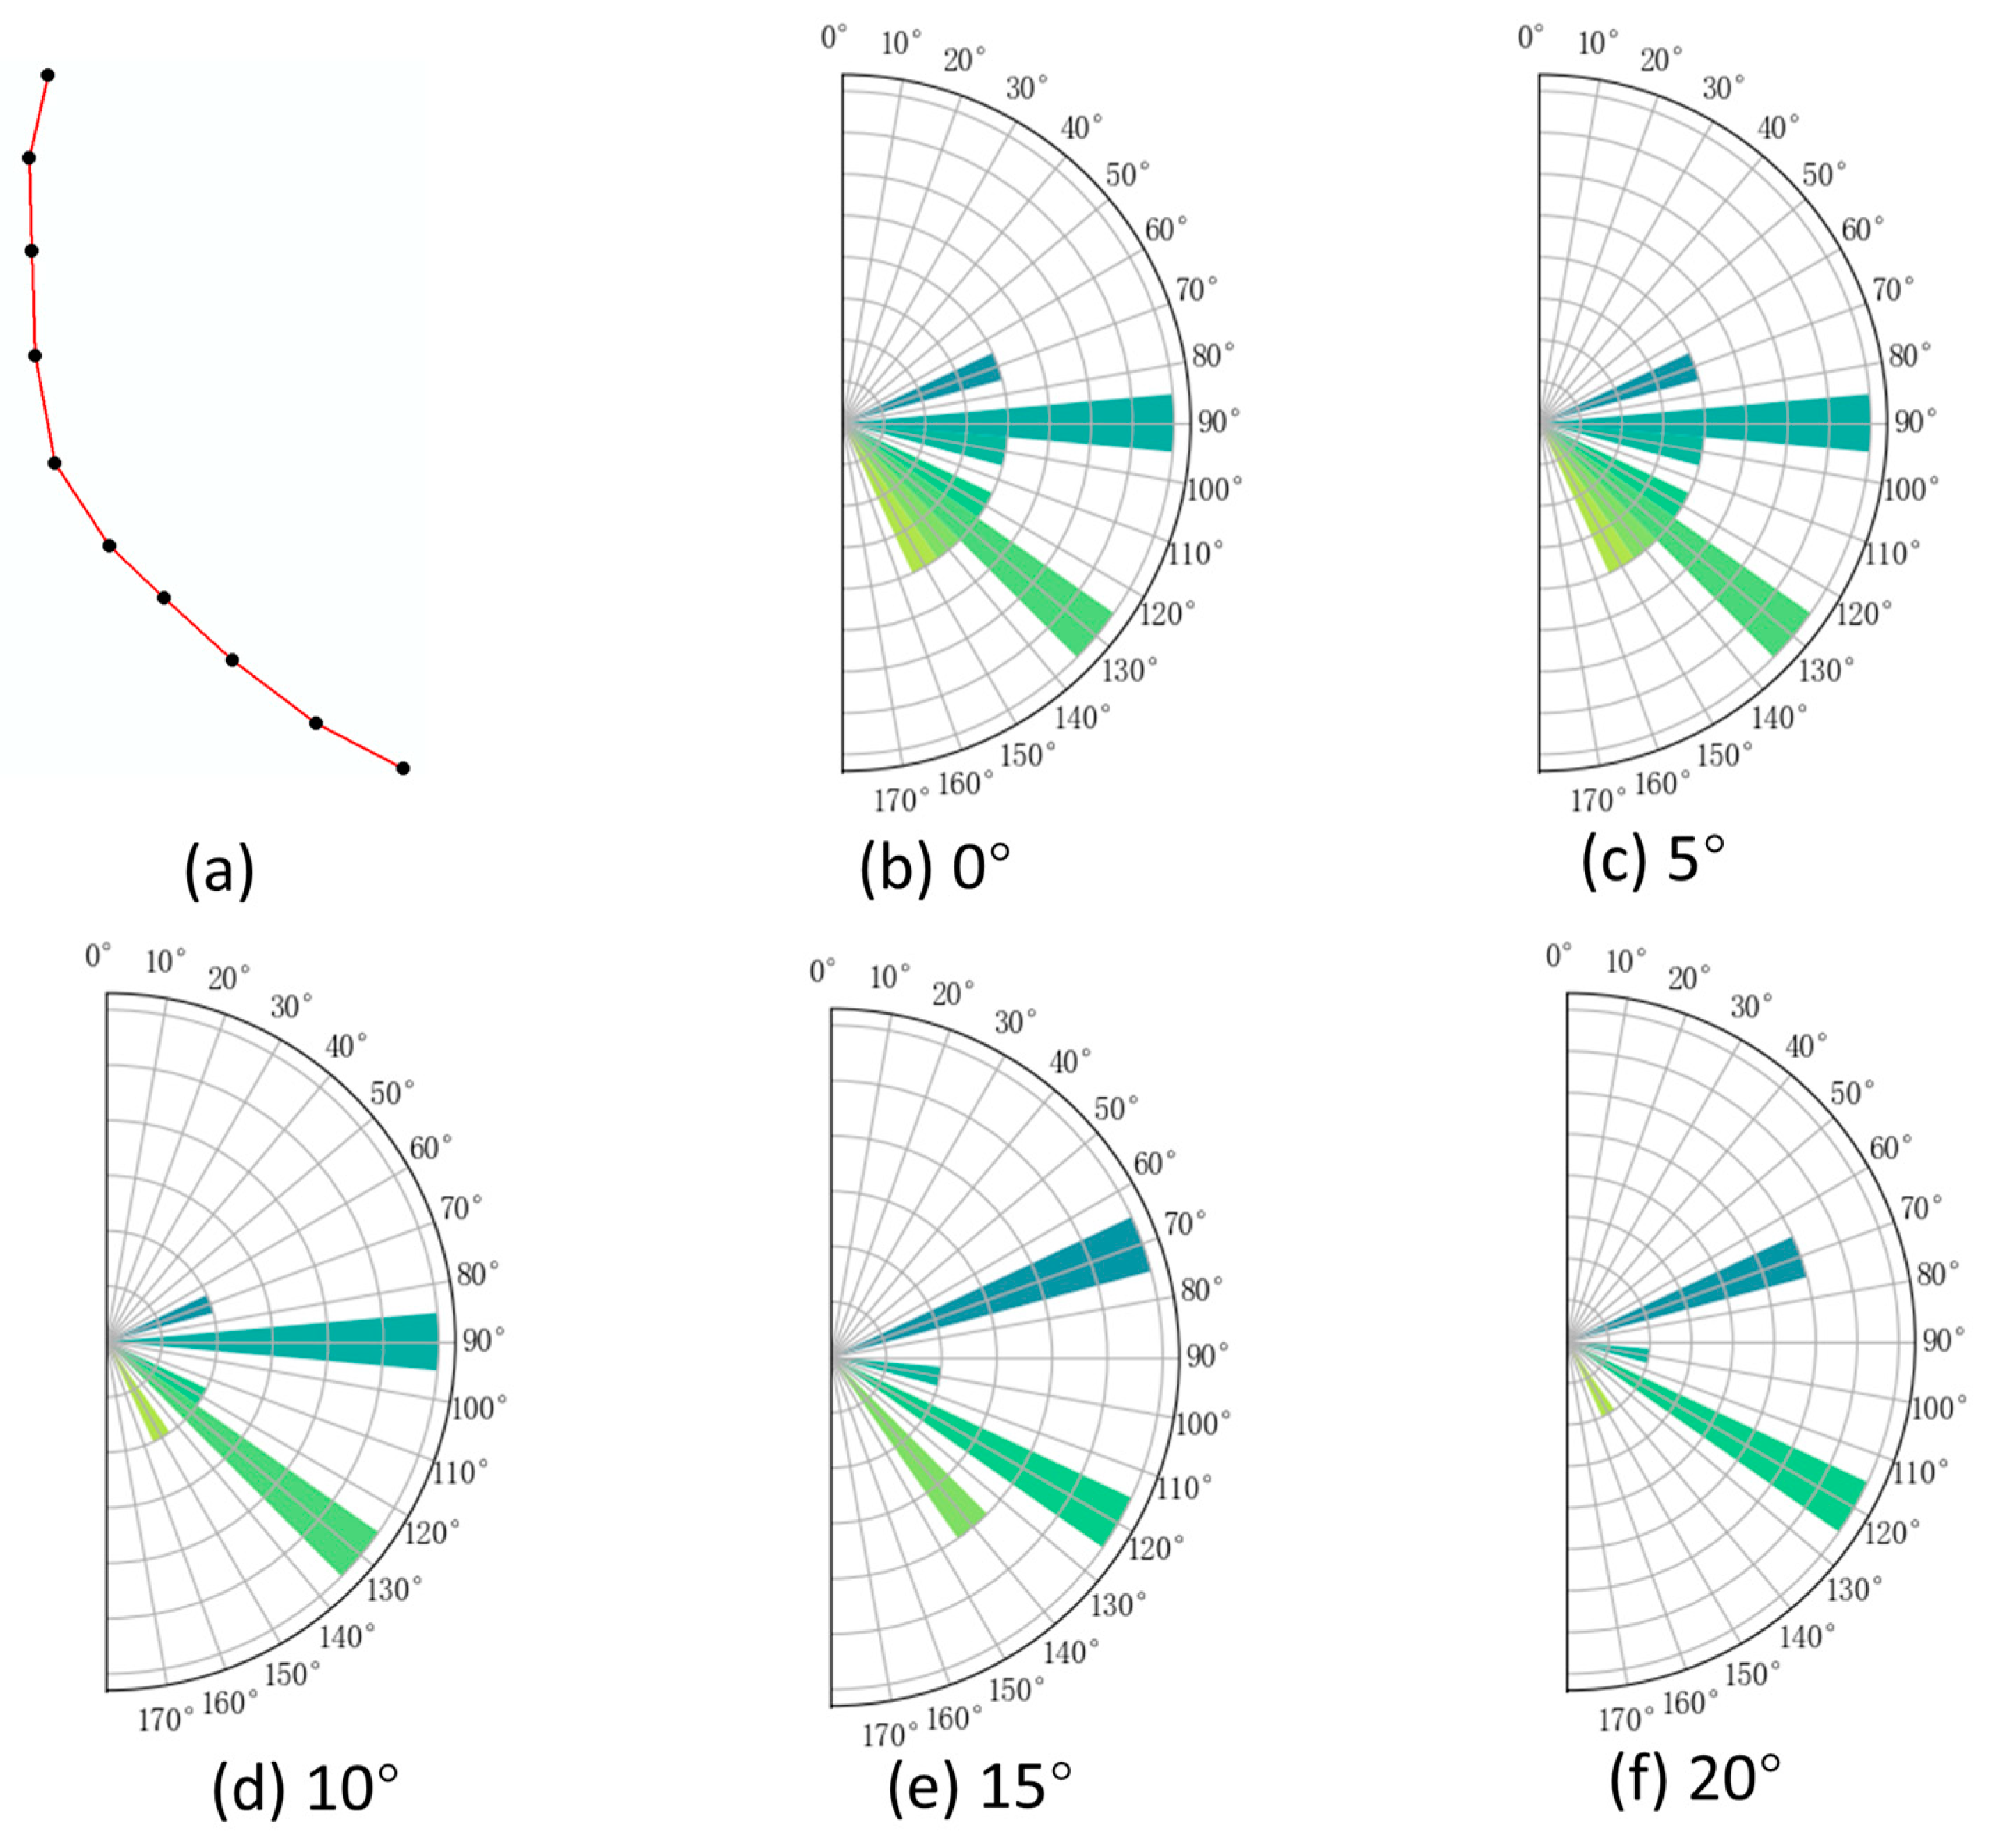
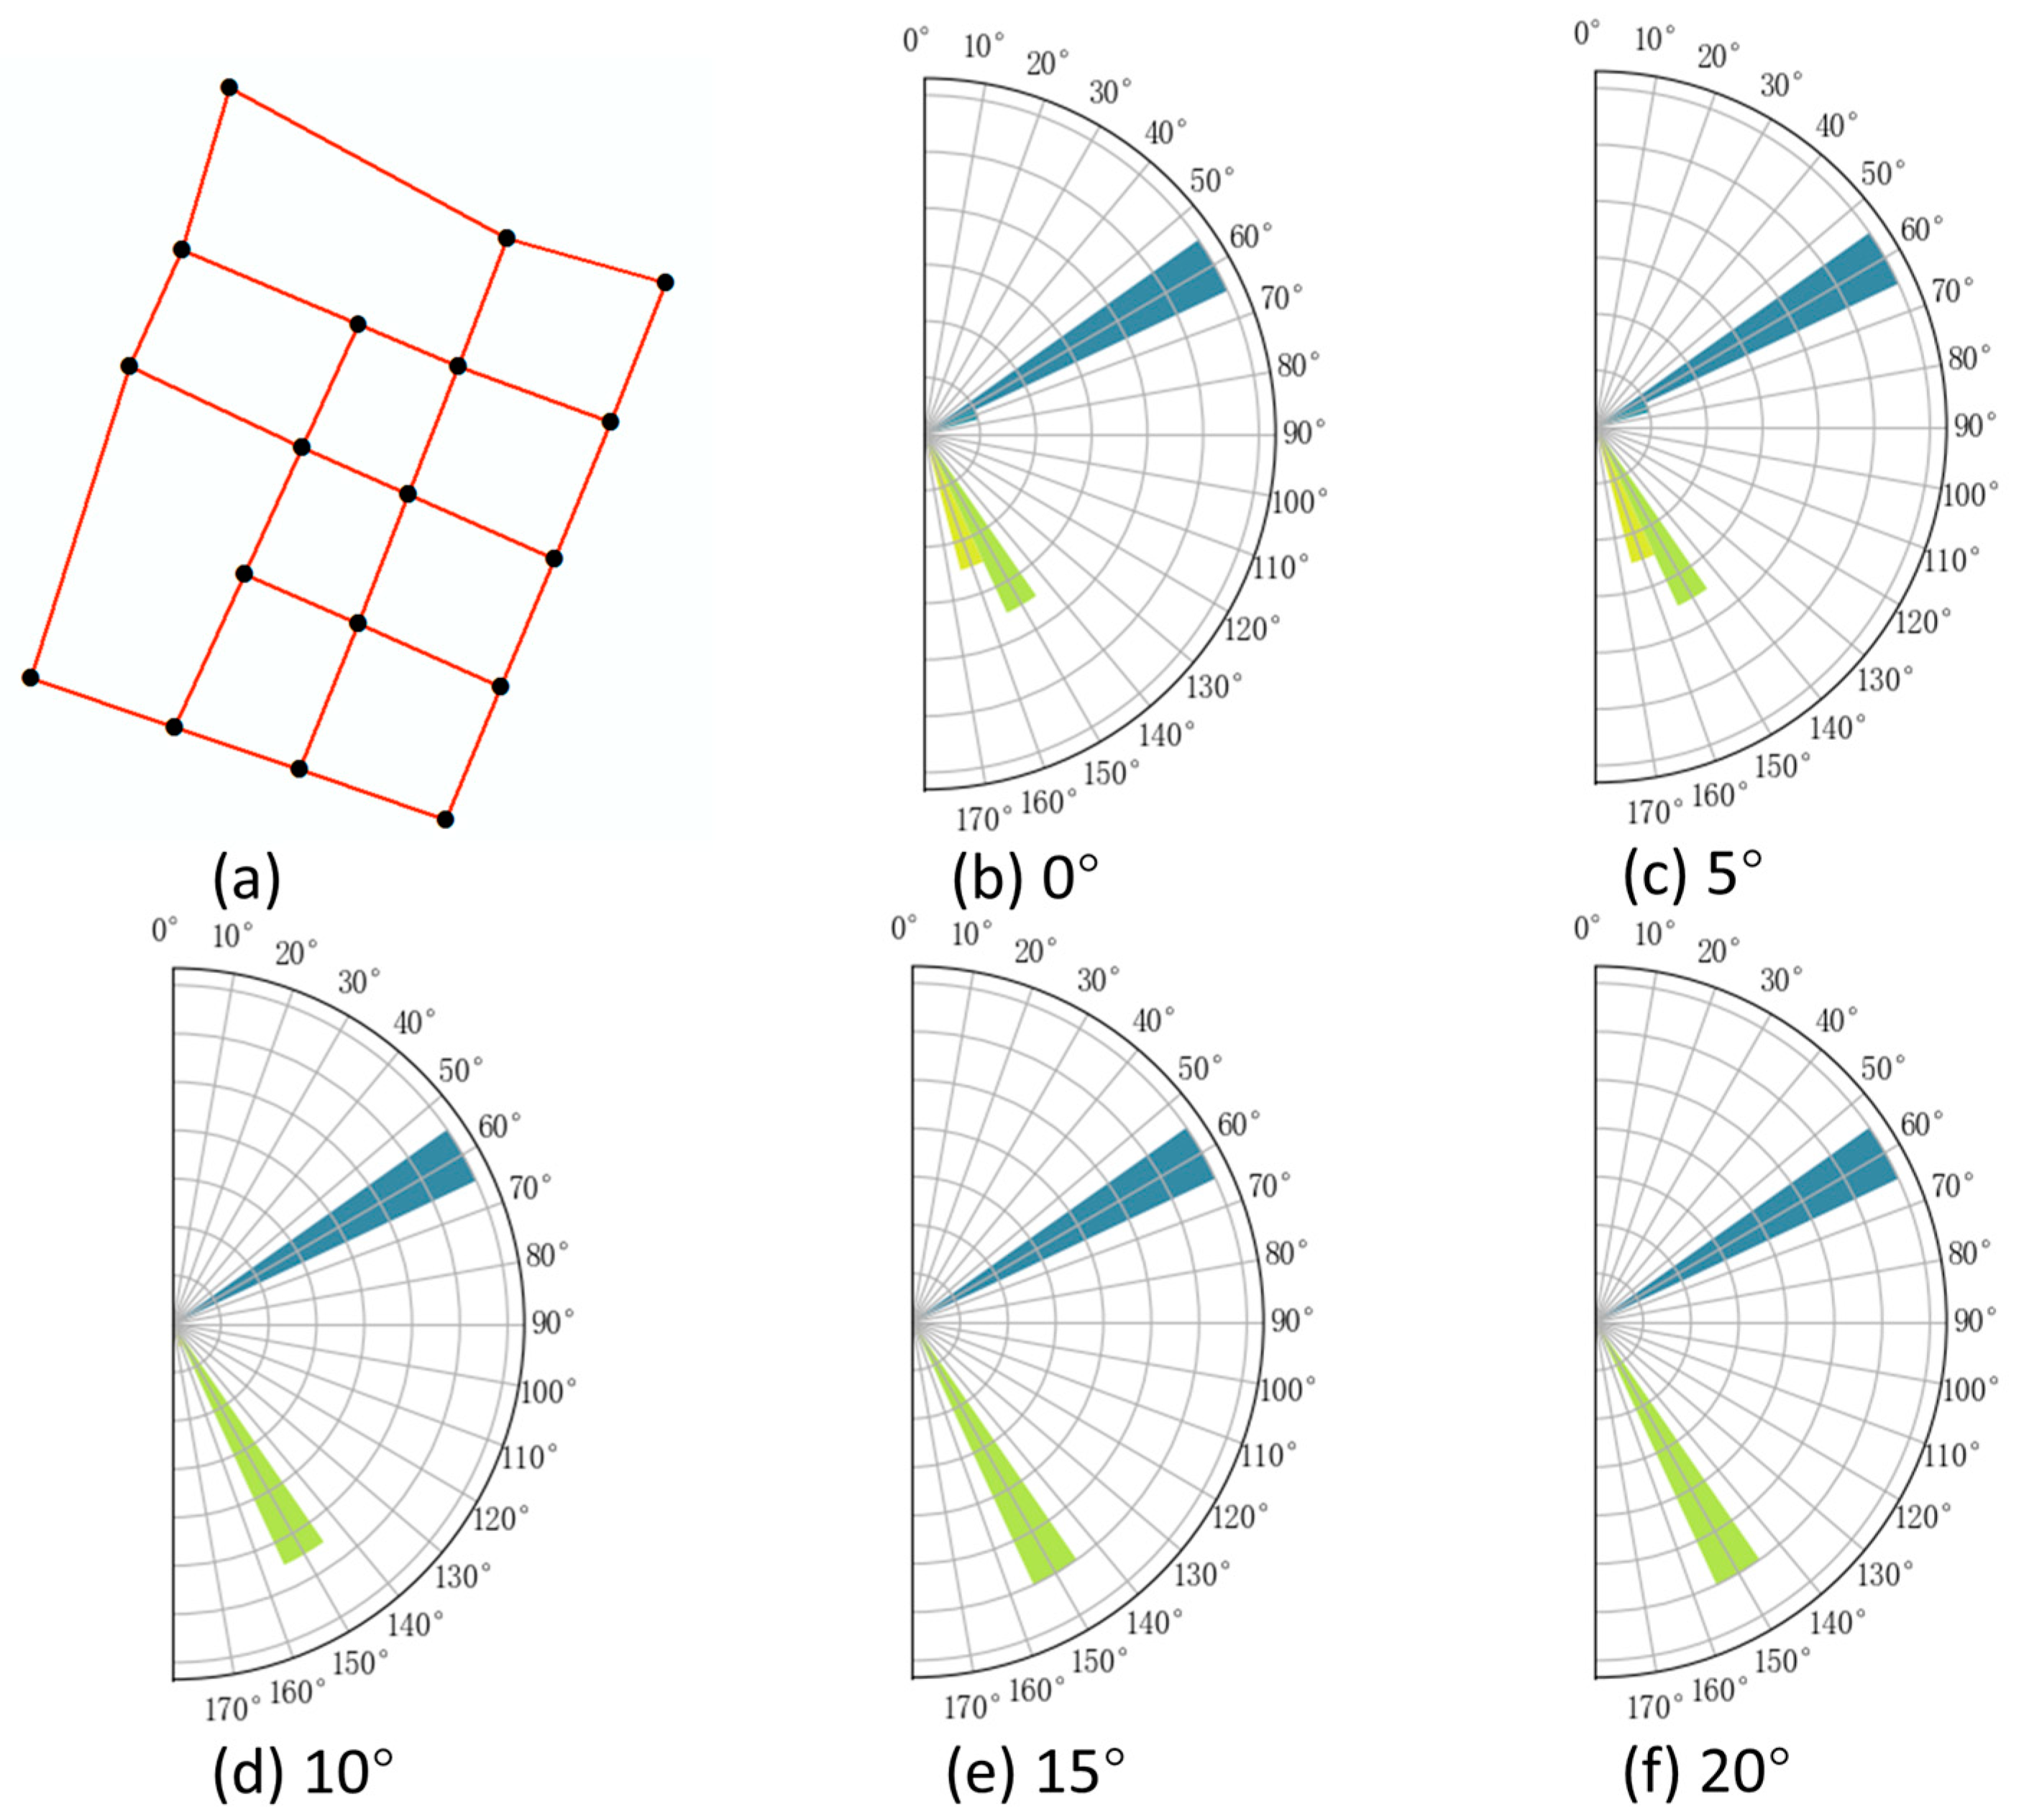
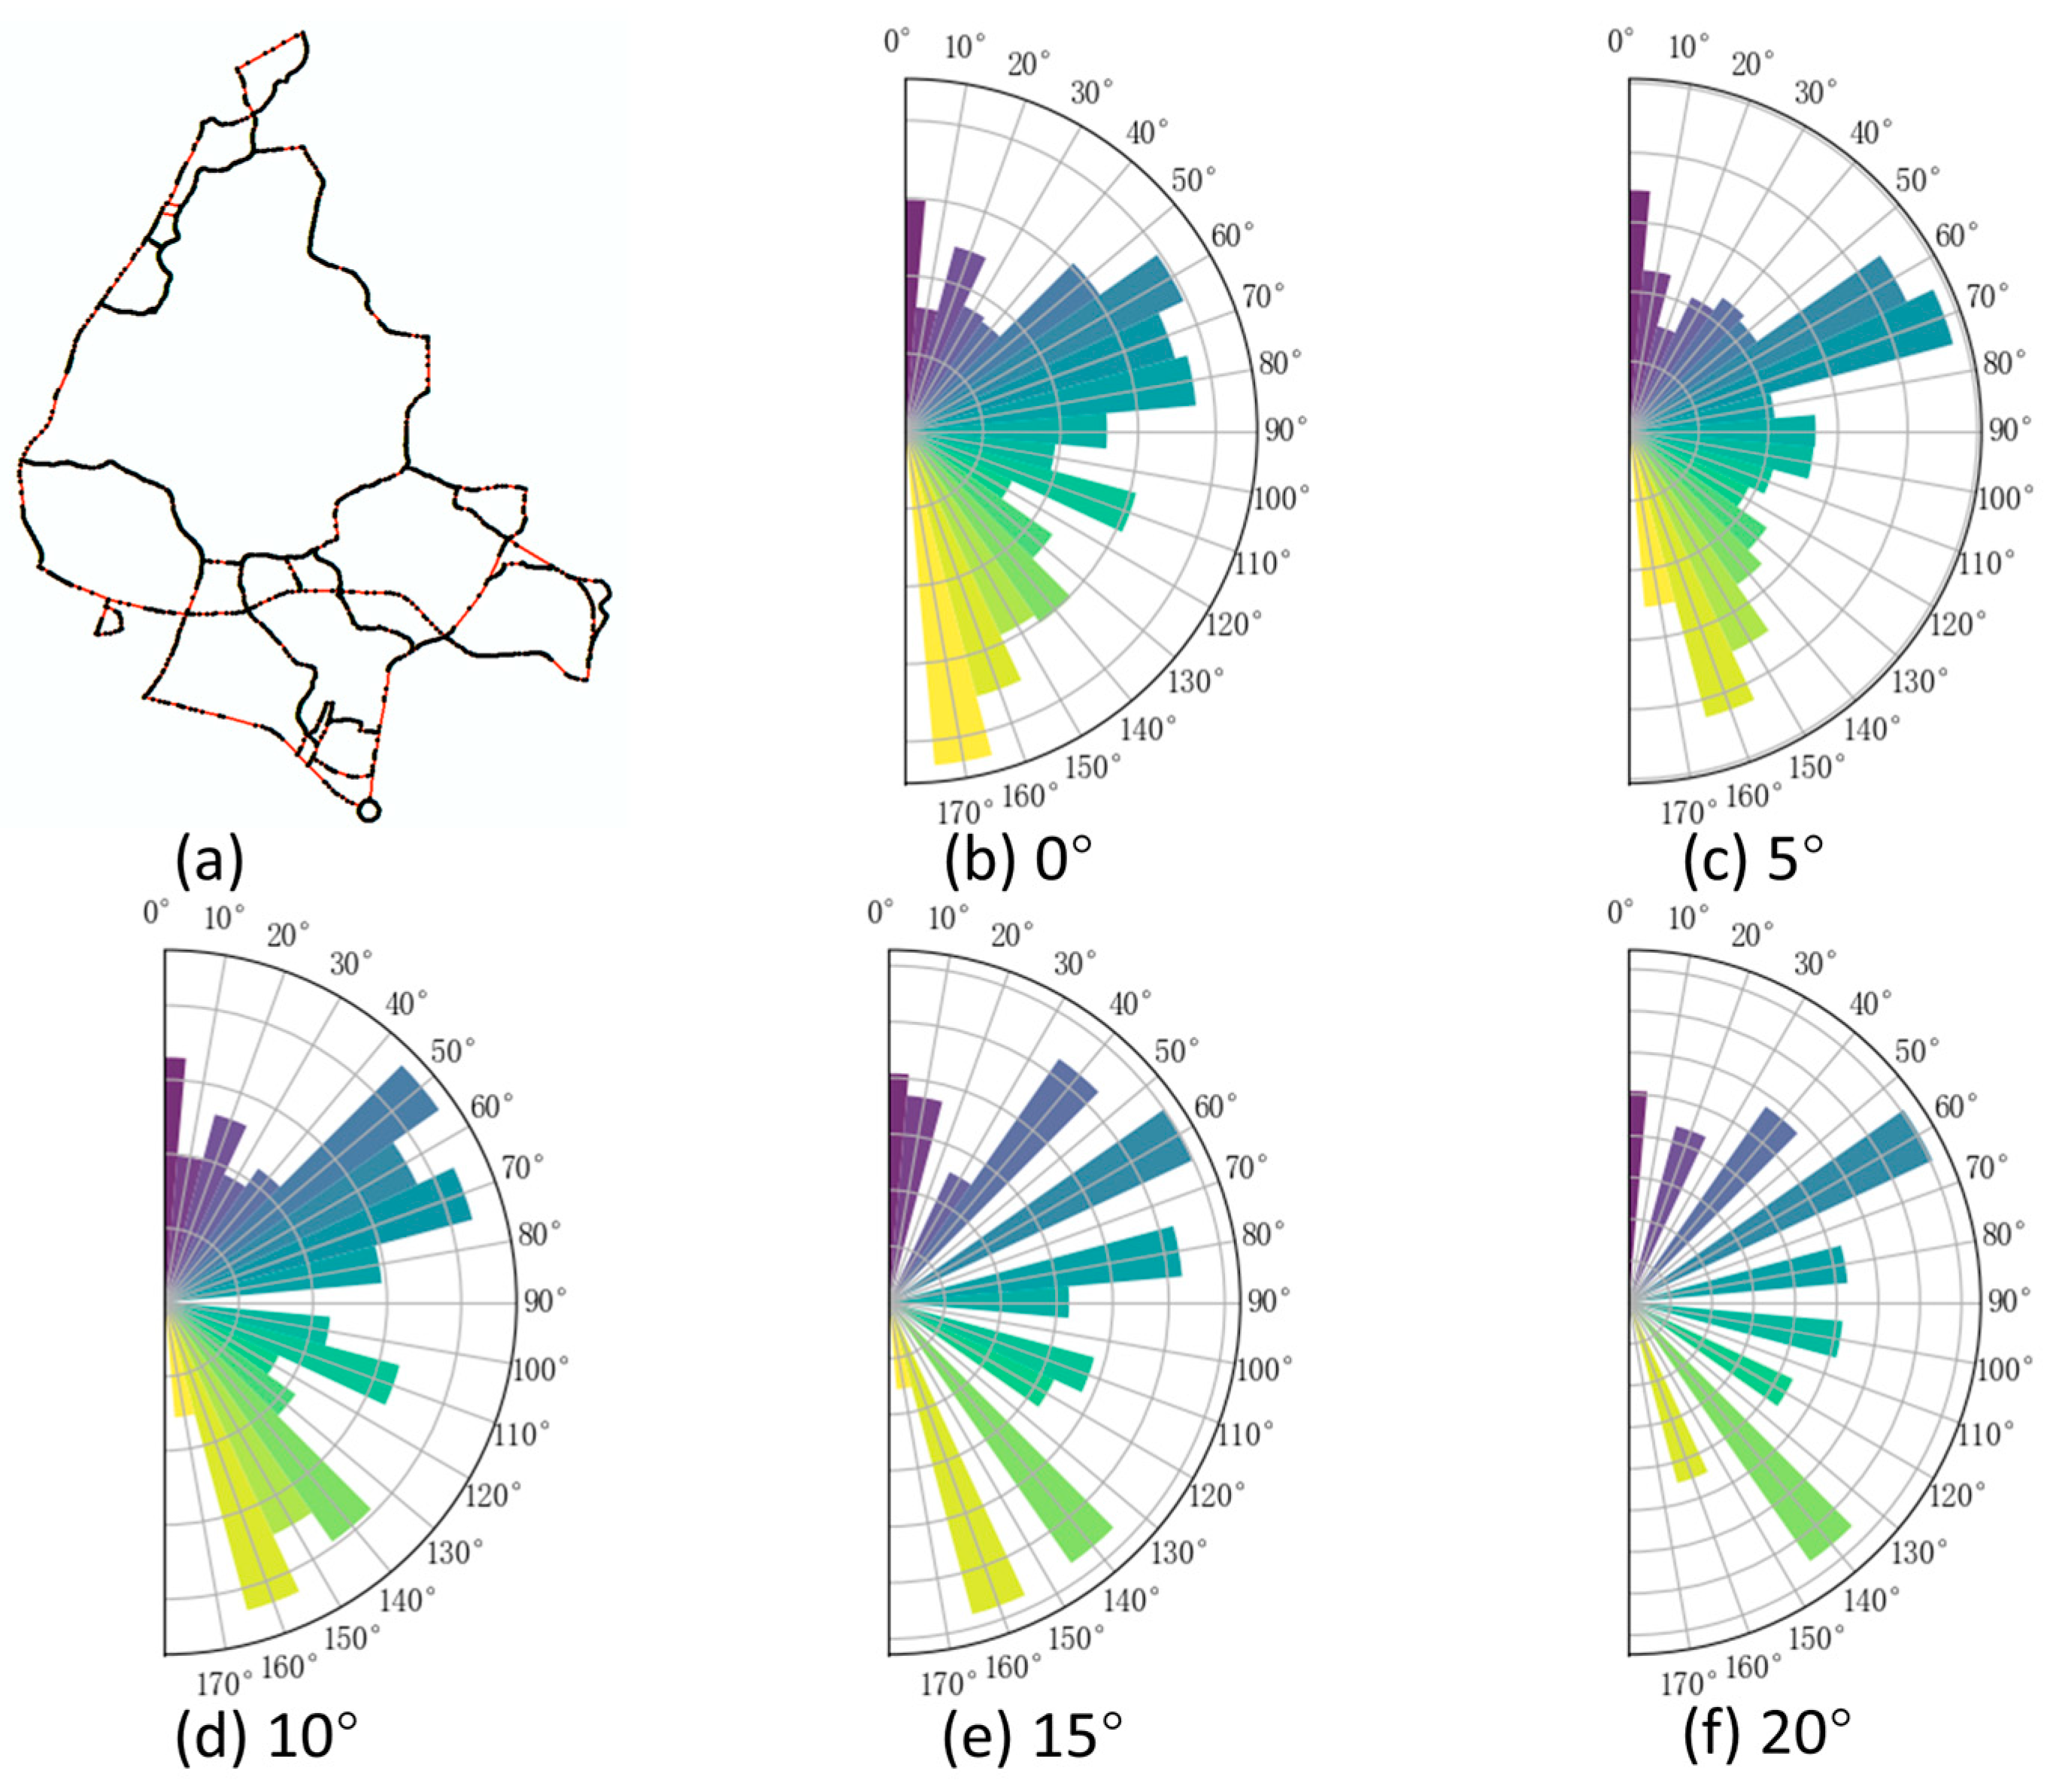
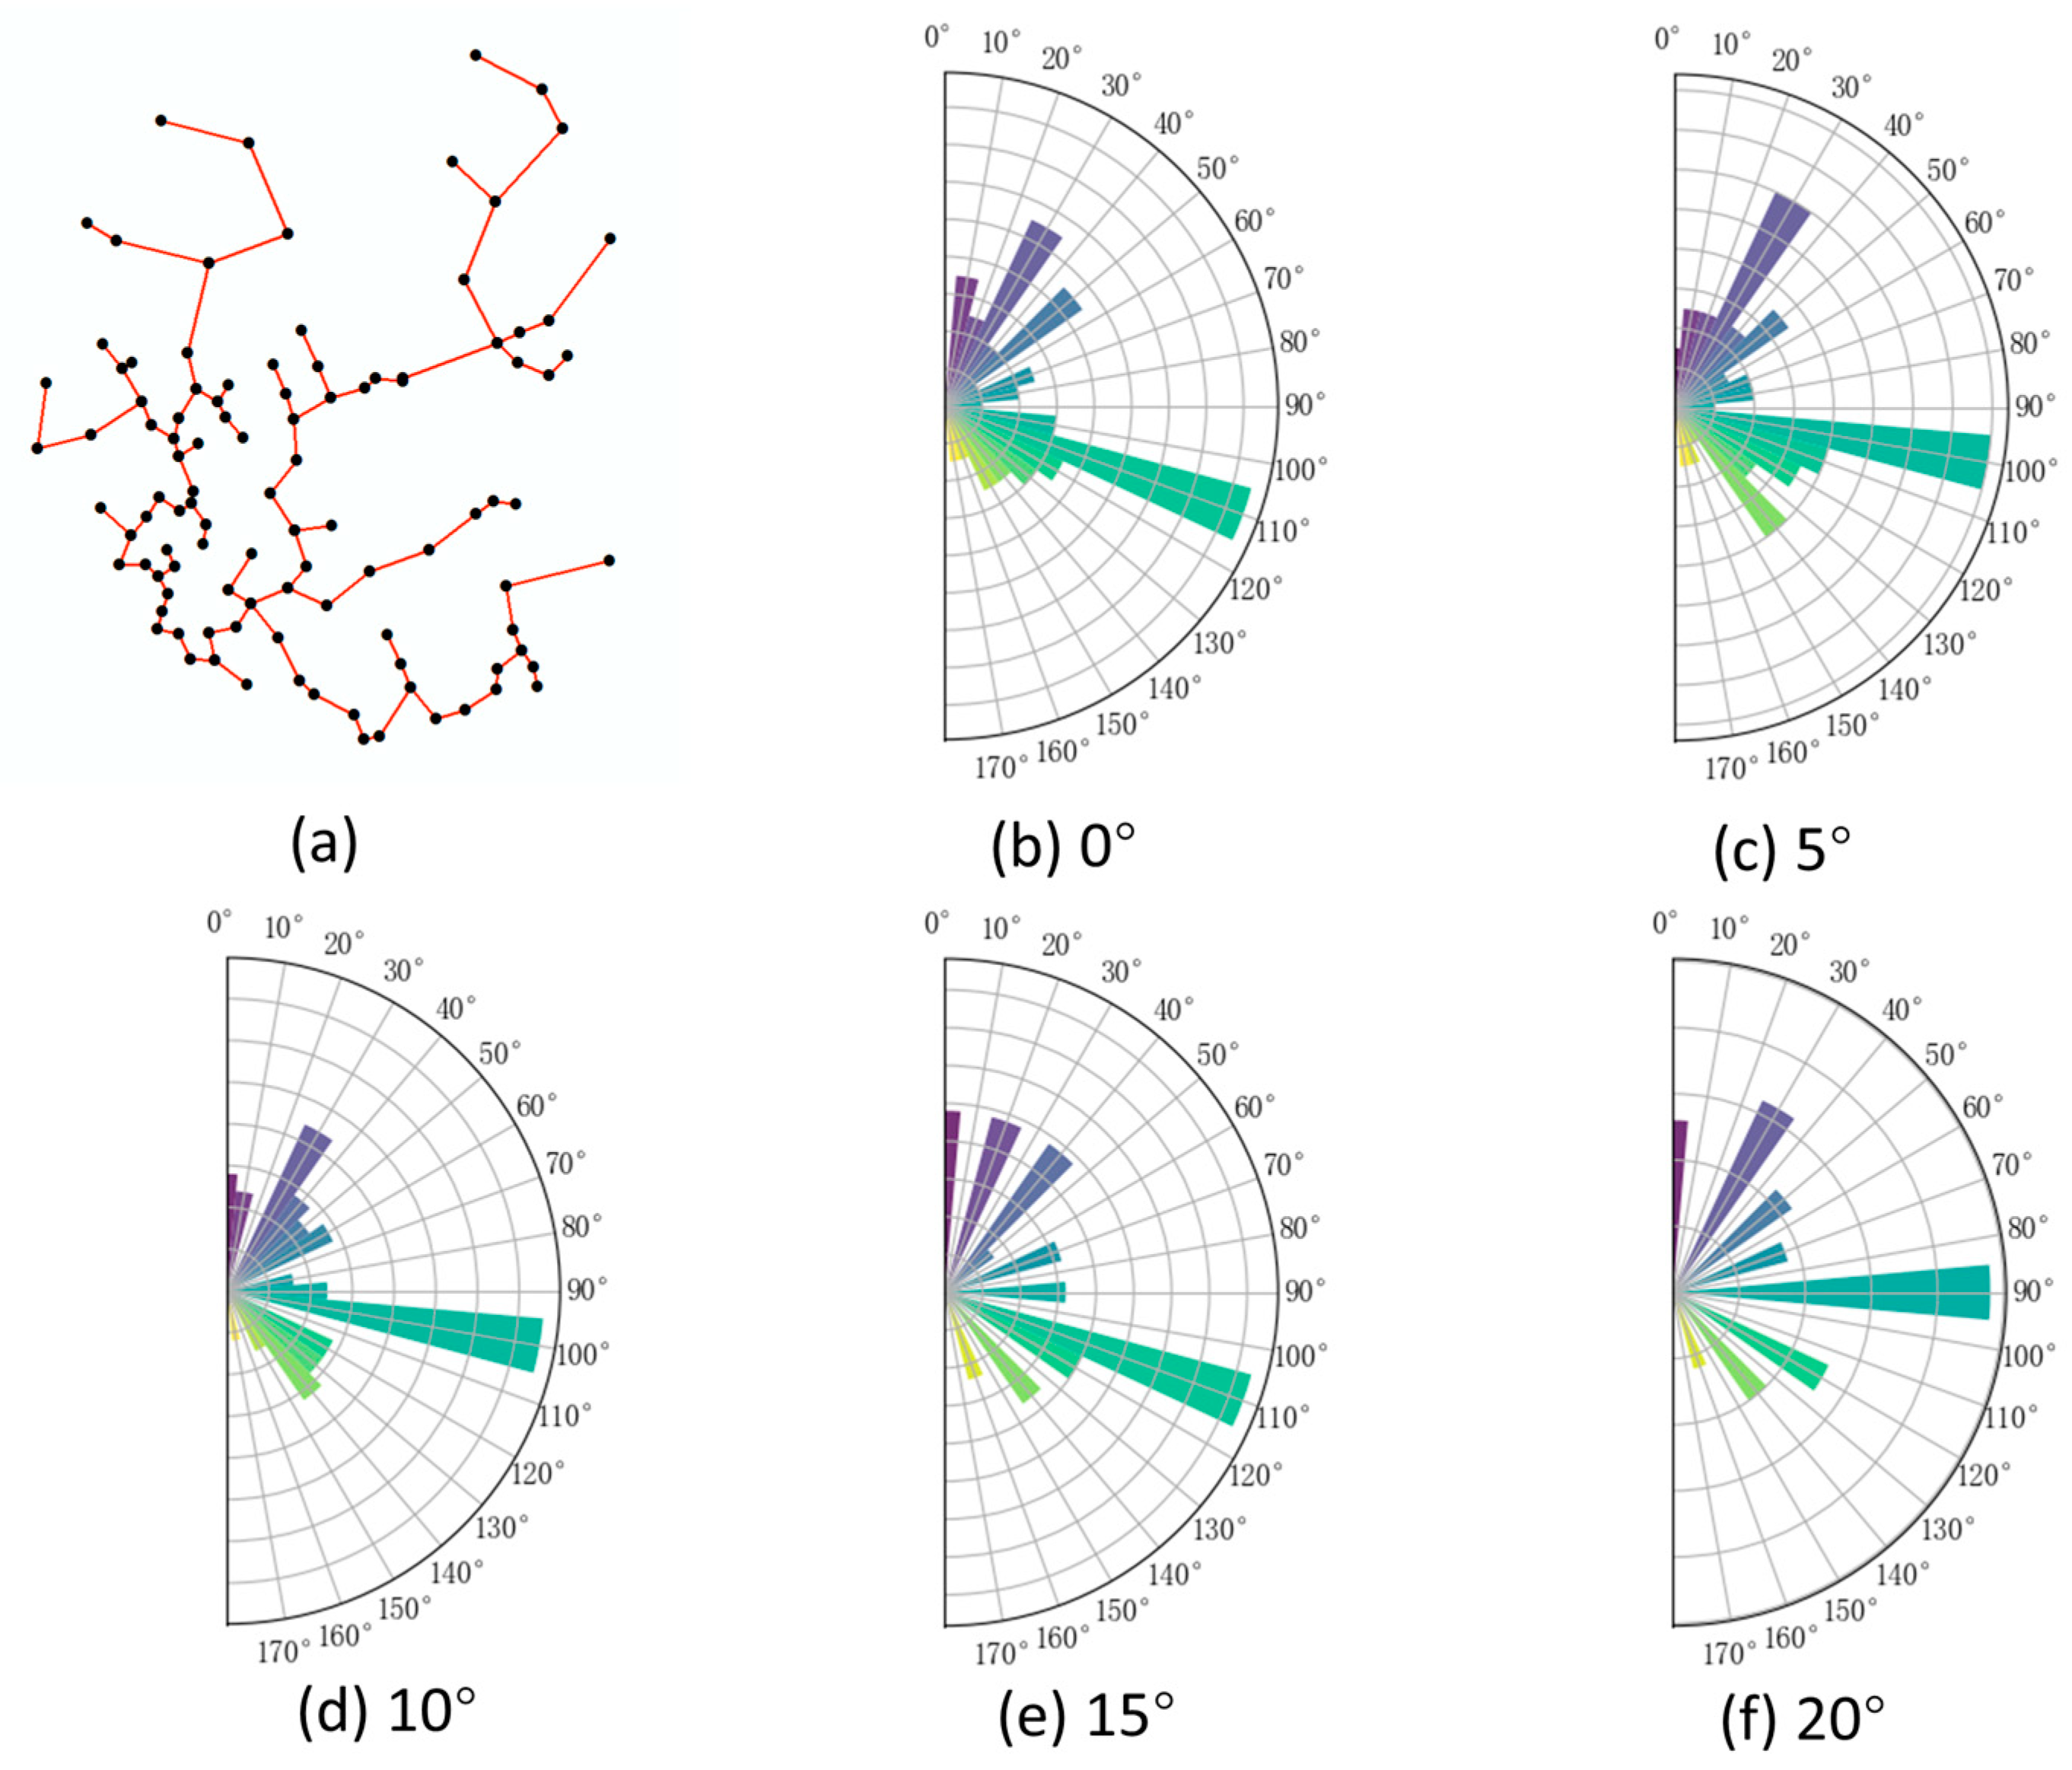
As shown in
Figure 5,
Figure 6,
Figure 7,
Figure 8,
Figure 9 and
Figure 10, the
classification results are presented for MSTs of linear, curvilinear, grid-like, and irregular building clusters, as well as for grid-like and irregular road network connectivity graphs under different angular thresholds. Observations reveal that the
classification remains largely stable for linear and grid-like MSTs and grid-like road networks across varying thresholds. In contrast, curvilinear and irregular MSTs, as well as irregular road networks, exhibit a merging process of
as the angular threshold increases. At a threshold of 20°,
achieves clear and reasonable classification for these non-regular patterns. Therefore, for subsequent directional entropy calculations of various building cluster MSTs and road network connectivity graphs, an angular threshold of 20° is uniformly applied for
classification.
4.2. Node Degree Calculation
Node degree is a concept in the analysis of complex networks. In graph theory, a network is typically represented as a graph
, where
V denotes the set of nodes and
E denotes the set of edges. The node degree
represents the number of connections of node
i, the number of nodes directly connected to node
i. For an undirected graph, the definition of node degree is as follows:
A denotes the adjacency matrix of the network, where indicates whether there is an edge between nodes i and j. If there is an edge, = 1; otherwise, = 0.
During the process of recognizing group targets on maps using the group target recognition mode, by calculating the node degrees of minimum spanning trees or road network connectivity graphs, we can reveal the topological structure and connectivity of the edge-node geometric models in map groups. This not only helps in optimizing road network structures but also aids in uncovering the underlying patterns hidden in the group structures of geographic spaces, thereby providing theoretical support for achieving multi-modal recognition of map group targets.
Taking
Figure 4 as an example,
Figure 4a illustrates a grid-type building group, and
Figure 4b shows a grid-type road network connectivity graph. Statistical analysis of their node degree distributions reveals the following results:
(1) In the minimum spanning tree of the grid-type building group, the node degree ranges from 1 to 3, with the maximum node degree being 3 and the minimum node degree being 1.
(2) The road network connectivity graph underwent optimization during its construction, so there are no nodes with a degree of 1. Its node degree ranges from 2 to 4, with the maximum node degree being 4 and the minimum node degree being 2.
These results indicate that the characteristics of node degree distribution can reflect the differences in geometric model structures of map groups, providing quantitative evidence for further multi-modal recognition.
5. Map Group Target Pattern Recognition
Directional entropy is a key parameter in the pattern recognition of map group targets, as it quantitatively describes the orientation and spatial distribution of edges in road network connectivity graphs and building group minimum spanning trees. Node degree, on the other hand, measures the connectivity of nodes within the edge-node geometric model structure. By calculating the directional entropy and node degree of building group minimum spanning trees and road network connectivity graphs, distinct spatial patterns of different map group types can be effectively identified.
Irregular building groups and road network connectivity graphs exhibit edges that appear randomly arranged and spatially disordered, lacking any evident structure. In contrast, the minimum spanning trees of grid-type building groups and the connectivity graphs of grid-type road networks are composed of approximately perpendicular or parallel line segments, demonstrating a high degree of regularity. Similarly, the minimum spanning tree of a linear building group forms a straight line, while that of a curved building group consists of curved segments that align with the group’s overall shape.
By analyzing these six common map group types—grid-type building groups, grid-type road networks, linear building groups, curved building groups, irregular building groups, and irregular road networks—it becomes evident that their unique characteristics can be revealed through variations in directional entropy and node degree. Irregular patterns are marked by high directional entropy and uneven node degree distributions, reflecting their random orientation and spatial arrangement. Grid patterns exhibit lower directional entropy and consistent node degree distributions, indicative of their organized and structured nature. Linear and curved patterns occupy intermediate positions, with linear groups showing concentrated directional traits and curved groups displaying more dispersed orientations. These distinctions enable a systematic and quantitative approach to recognizing and classifying map group patterns.
(1) Irregular-type building groups (
Figure 11a) and irregular-type road networks (
Figure 11p), when generating corresponding minimum spanning trees for building groups (
Figure 11b) and road network connectivity graphs (
Figure 11q), exhibit similar edge-node geometric models from an edge perspective. In both the minimum spanning tree and the road network connectivity graph, the internal edge orientation distribution is chaotic (
Figure 11c,r). Therefore, the edge-node combination model structure of irregular-type building groups and irregular-type road networks has relatively high directional entropy values. As shown in
Figure 11b,q, the minimum spanning tree of irregular-type building groups and the irregular-type road network connectivity graph have directional entropy values of 3.904 and 4.102, respectively. From a node perspective, due to the absence of cyclic structures within the minimum spanning tree, nodes with a node degree of 1 exist in the minimum spanning tree of building groups. However, because road network optimization operations are performed, the road network connectivity graph does not include nodes with a node degree of 1. In
Figure 5b, the minimum spanning tree of building groups has a maximum node degree of 3 and a minimum node degree of 1. In contrast, in
Figure 11q, the road network connectivity graph has a maximum node degree of 4 and a minimum node degree of 2.
(2) The minimum spanning tree of grid-type building groups (
Figure 11e) and the connectivity graph of grid-type road networks (
Figure 11n) have similar structures, both composed of parallel, perpendicular, or diagonally intersecting edges. Ideally, the edge orientations in the minimum spanning tree of grid-type building groups and the connectivity graph of grid-type road networks are concentrated in two directions (
Figure 11f,n). Therefore, the directional entropy values are relatively low. As shown in
Figure 11e,n, the directional entropy values of the minimum spanning tree of grid-type building groups and the connectivity graph of grid-type road networks are 0.755 and 1.088, respectively. From a node perspective, the nodes in the minimum spanning tree of grid-type building groups generally have node degrees ranging from 1 to 4, while the nodes in the connectivity graph of grid-type road networks generally have node degrees ranging from 2 to 4. As shown in
Figure 11e,n, the node degree ranges for the minimum spanning tree of grid-type building groups and the connectivity graph of grid-type road networks are {1, 2, 3} and {2, 3, 4}, respectively.
(3) From a node perspective, the minimum spanning trees of both linear and curved building groups (
Figure 11g,j) shown in
Figure 11h,k have a maximum node degree of 2 and minimum node degree of 1. From an edge geometry perspective, the MST edges of linear building groups show concentrated directional distribution along one primary orientation (
Figure 11i), while curved groups exhibit more dispersed edge orientations (
Figure 11l). Directional entropy analysis reveals the linear group MST (
Figure 11h) has edges within only one directional bin, resulting in zero entropy, whereas the curved group MST (
Figure 11k) contains edges distributed across multiple bins, yielding an entropy value of 1.4855.
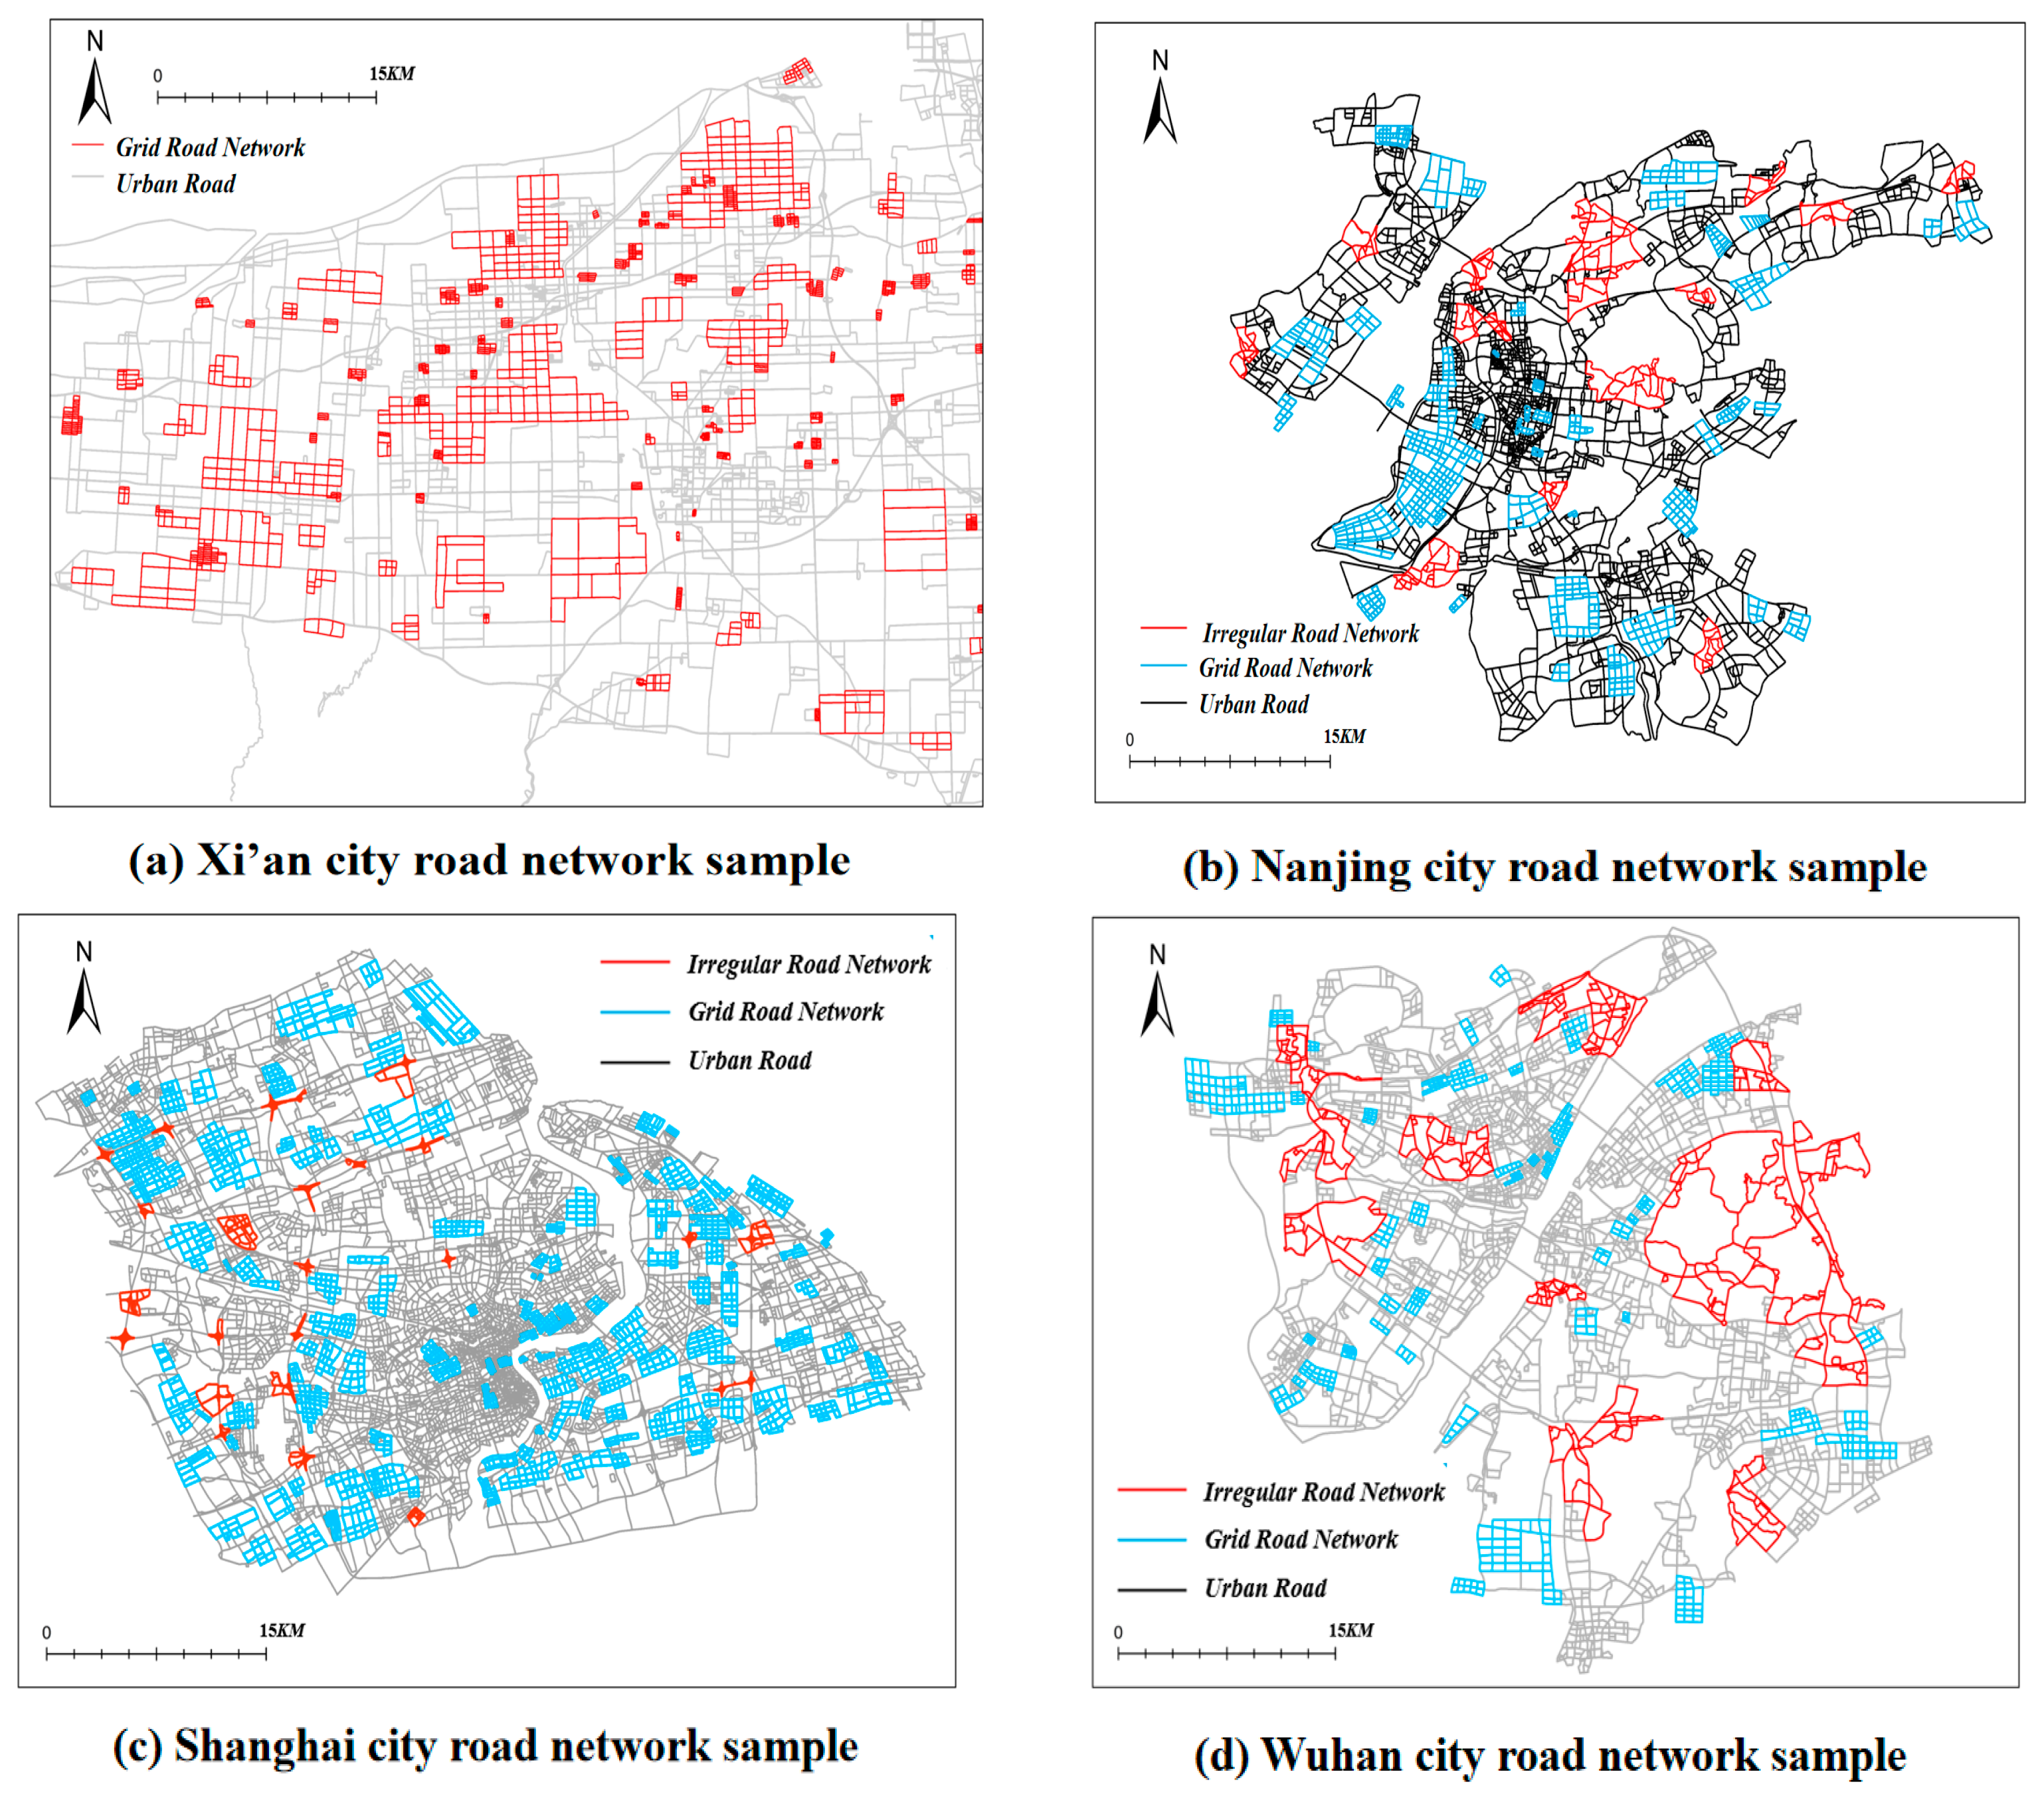
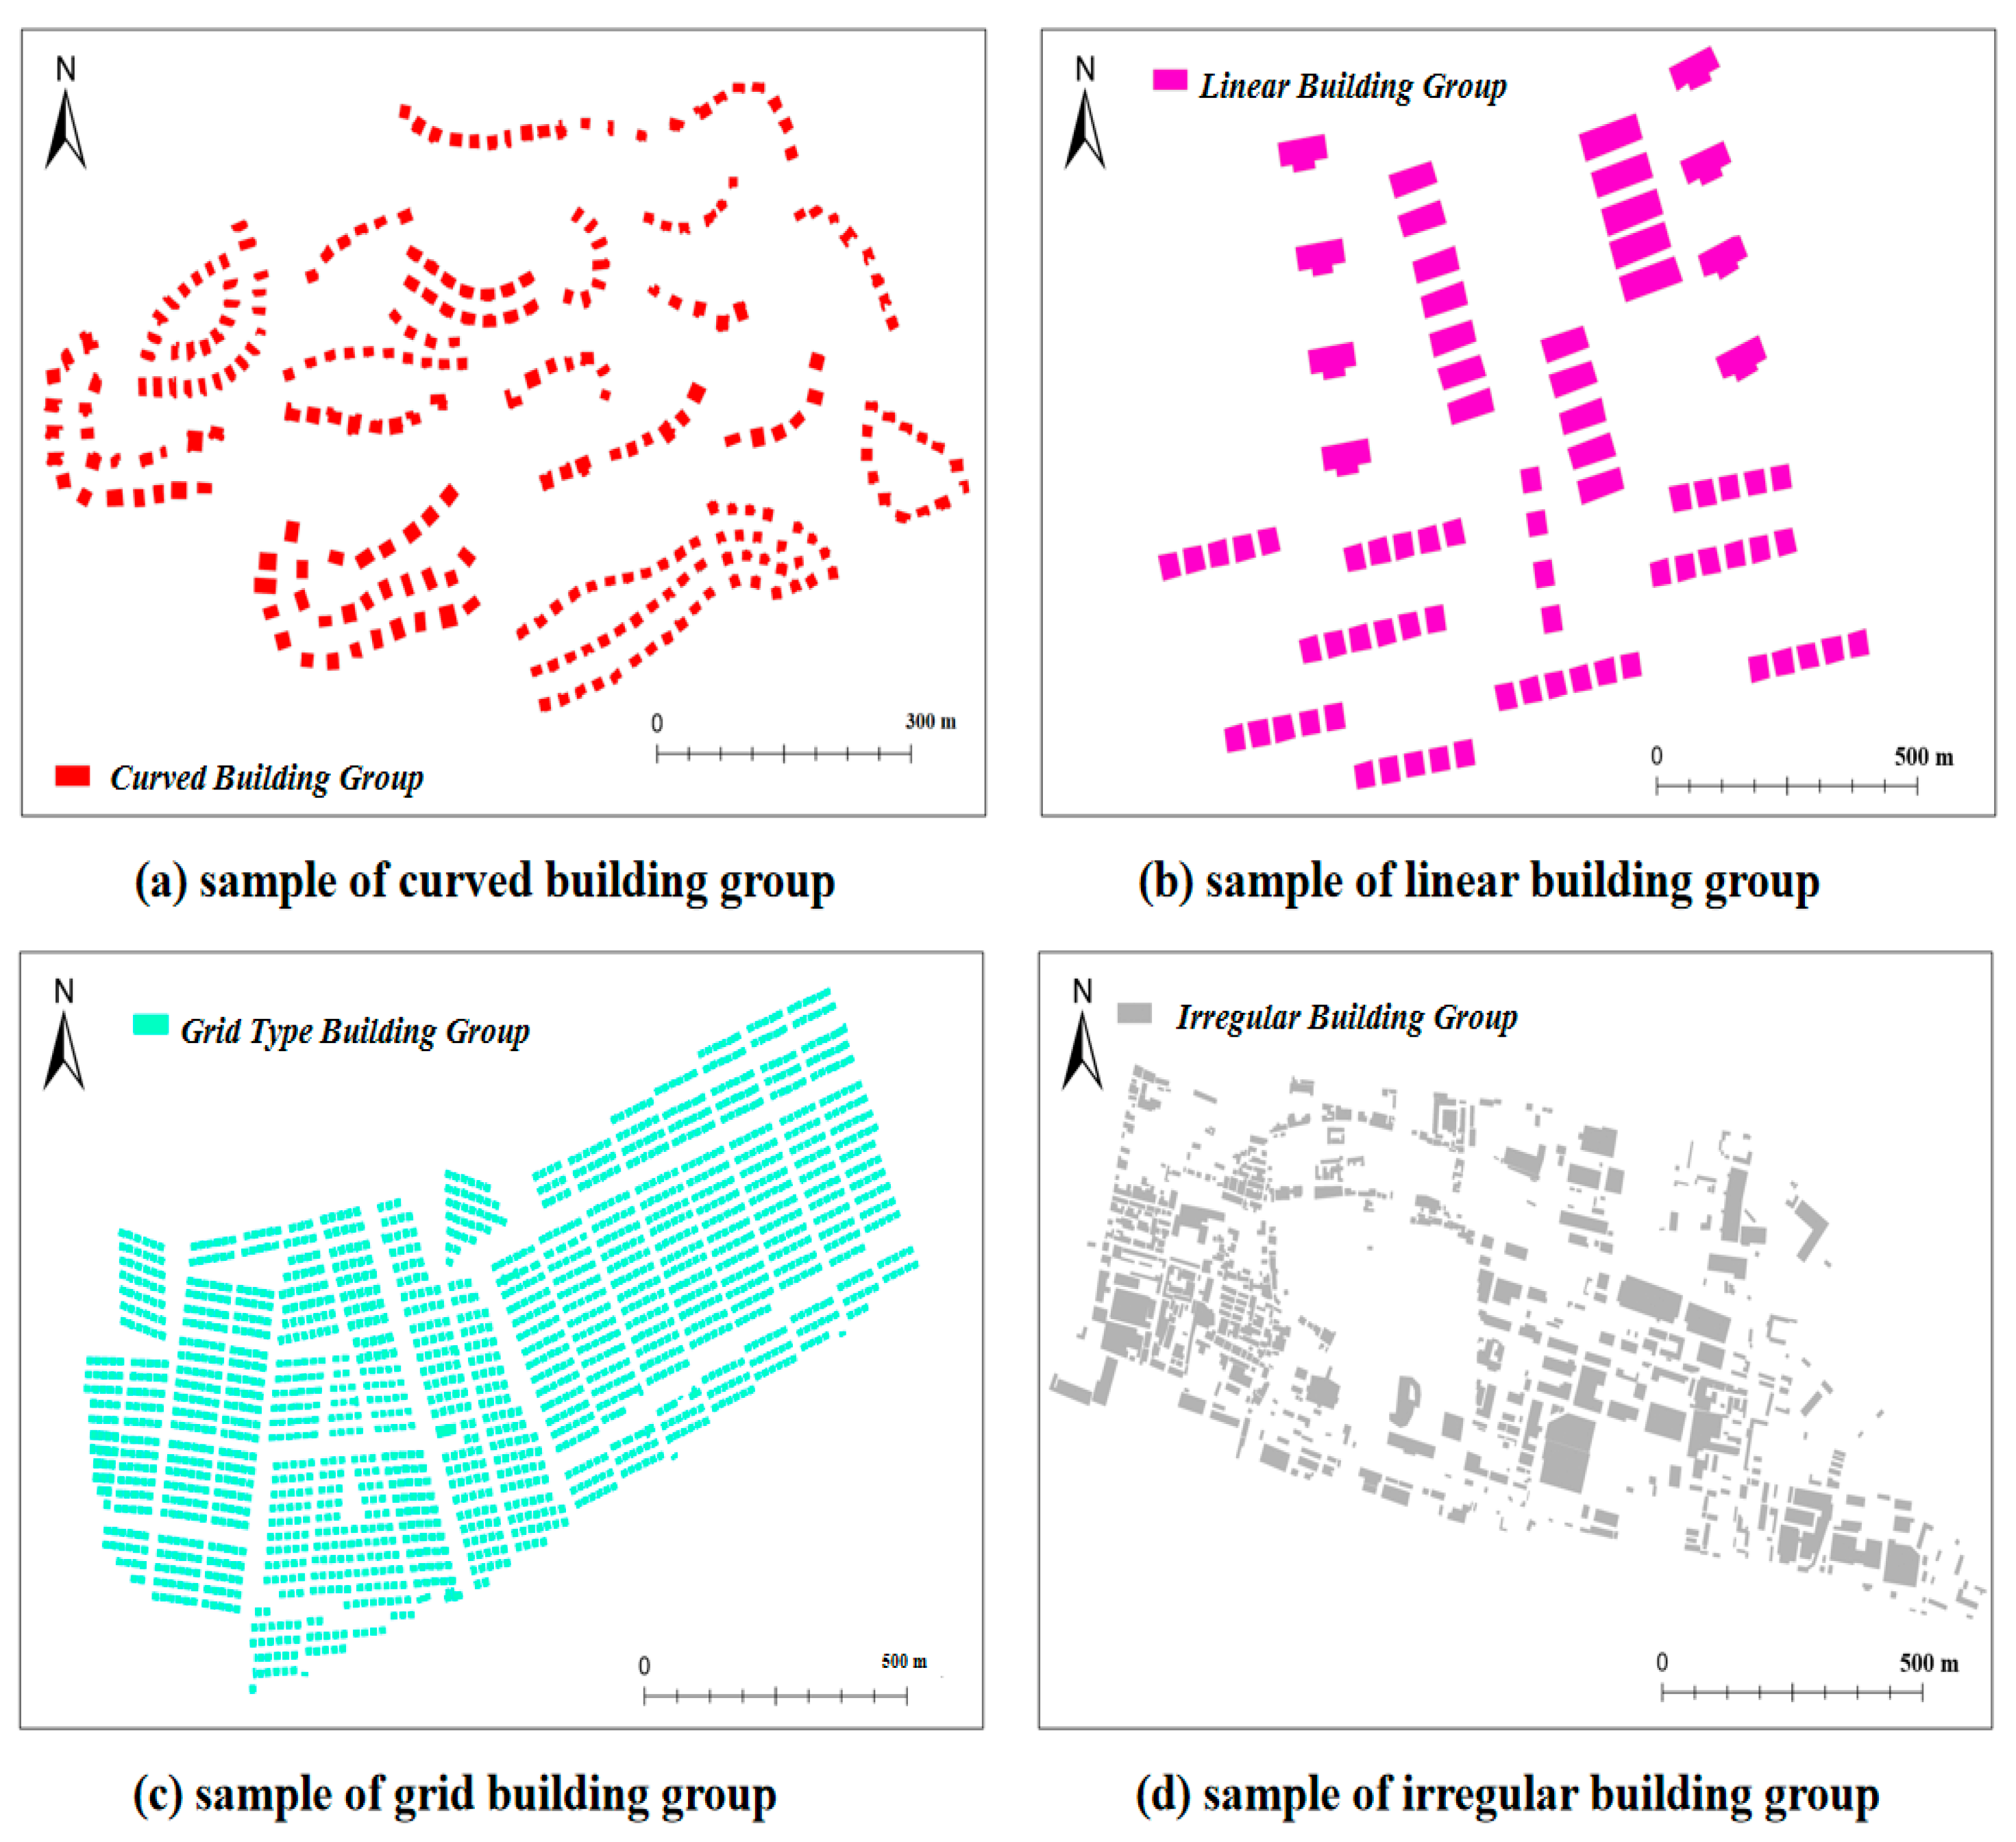
6. Experiments and Analysis
This study utilized road and building vector data from Xi’an, Nanjing, Wuhan, and Shanghai as experimental subjects. Using natural visual clustering and manual cropping methods, the building and road networks were segmented into multiple geographic feature groups, as illustrated in
Figure 12 and
Figure 13. A total of 600 map group samples were generated and labeled, comprising 100 samples each of linear-type, curved-type, grid-type, and irregular-type building groups, as well as 100 samples each of grid-type and irregular-type road networks. To ensure accurate pattern classification, these samples were manually annotated based on human cognition.
Following the annotation process, the minimum spanning tree for each building group and the connectivity graph for each road network were constructed, resulting in their respective edge-node geometric model structures. The samples were then divided equally into two datasets: Sample Set 1 and Sample Set 2. Sample Set 1 was used to statistically analyze edge-node feature parameters, establish threshold values, and formulate pattern recognition rules. Sample Set 2 was employed to validate the effectiveness of these thresholds and rules in recognizing and classifying linear-type, curved-type, grid-type, and irregular-type building groups, as well as grid-type and irregular-type road networks.
The subsequent analysis focuses on the determination of thresholds, formulation of recognition rules, experimental validation of map group pattern recognition, comparison of results, and psychological questionnaire surveys, among other aspects.
6.1. Threshold Setting
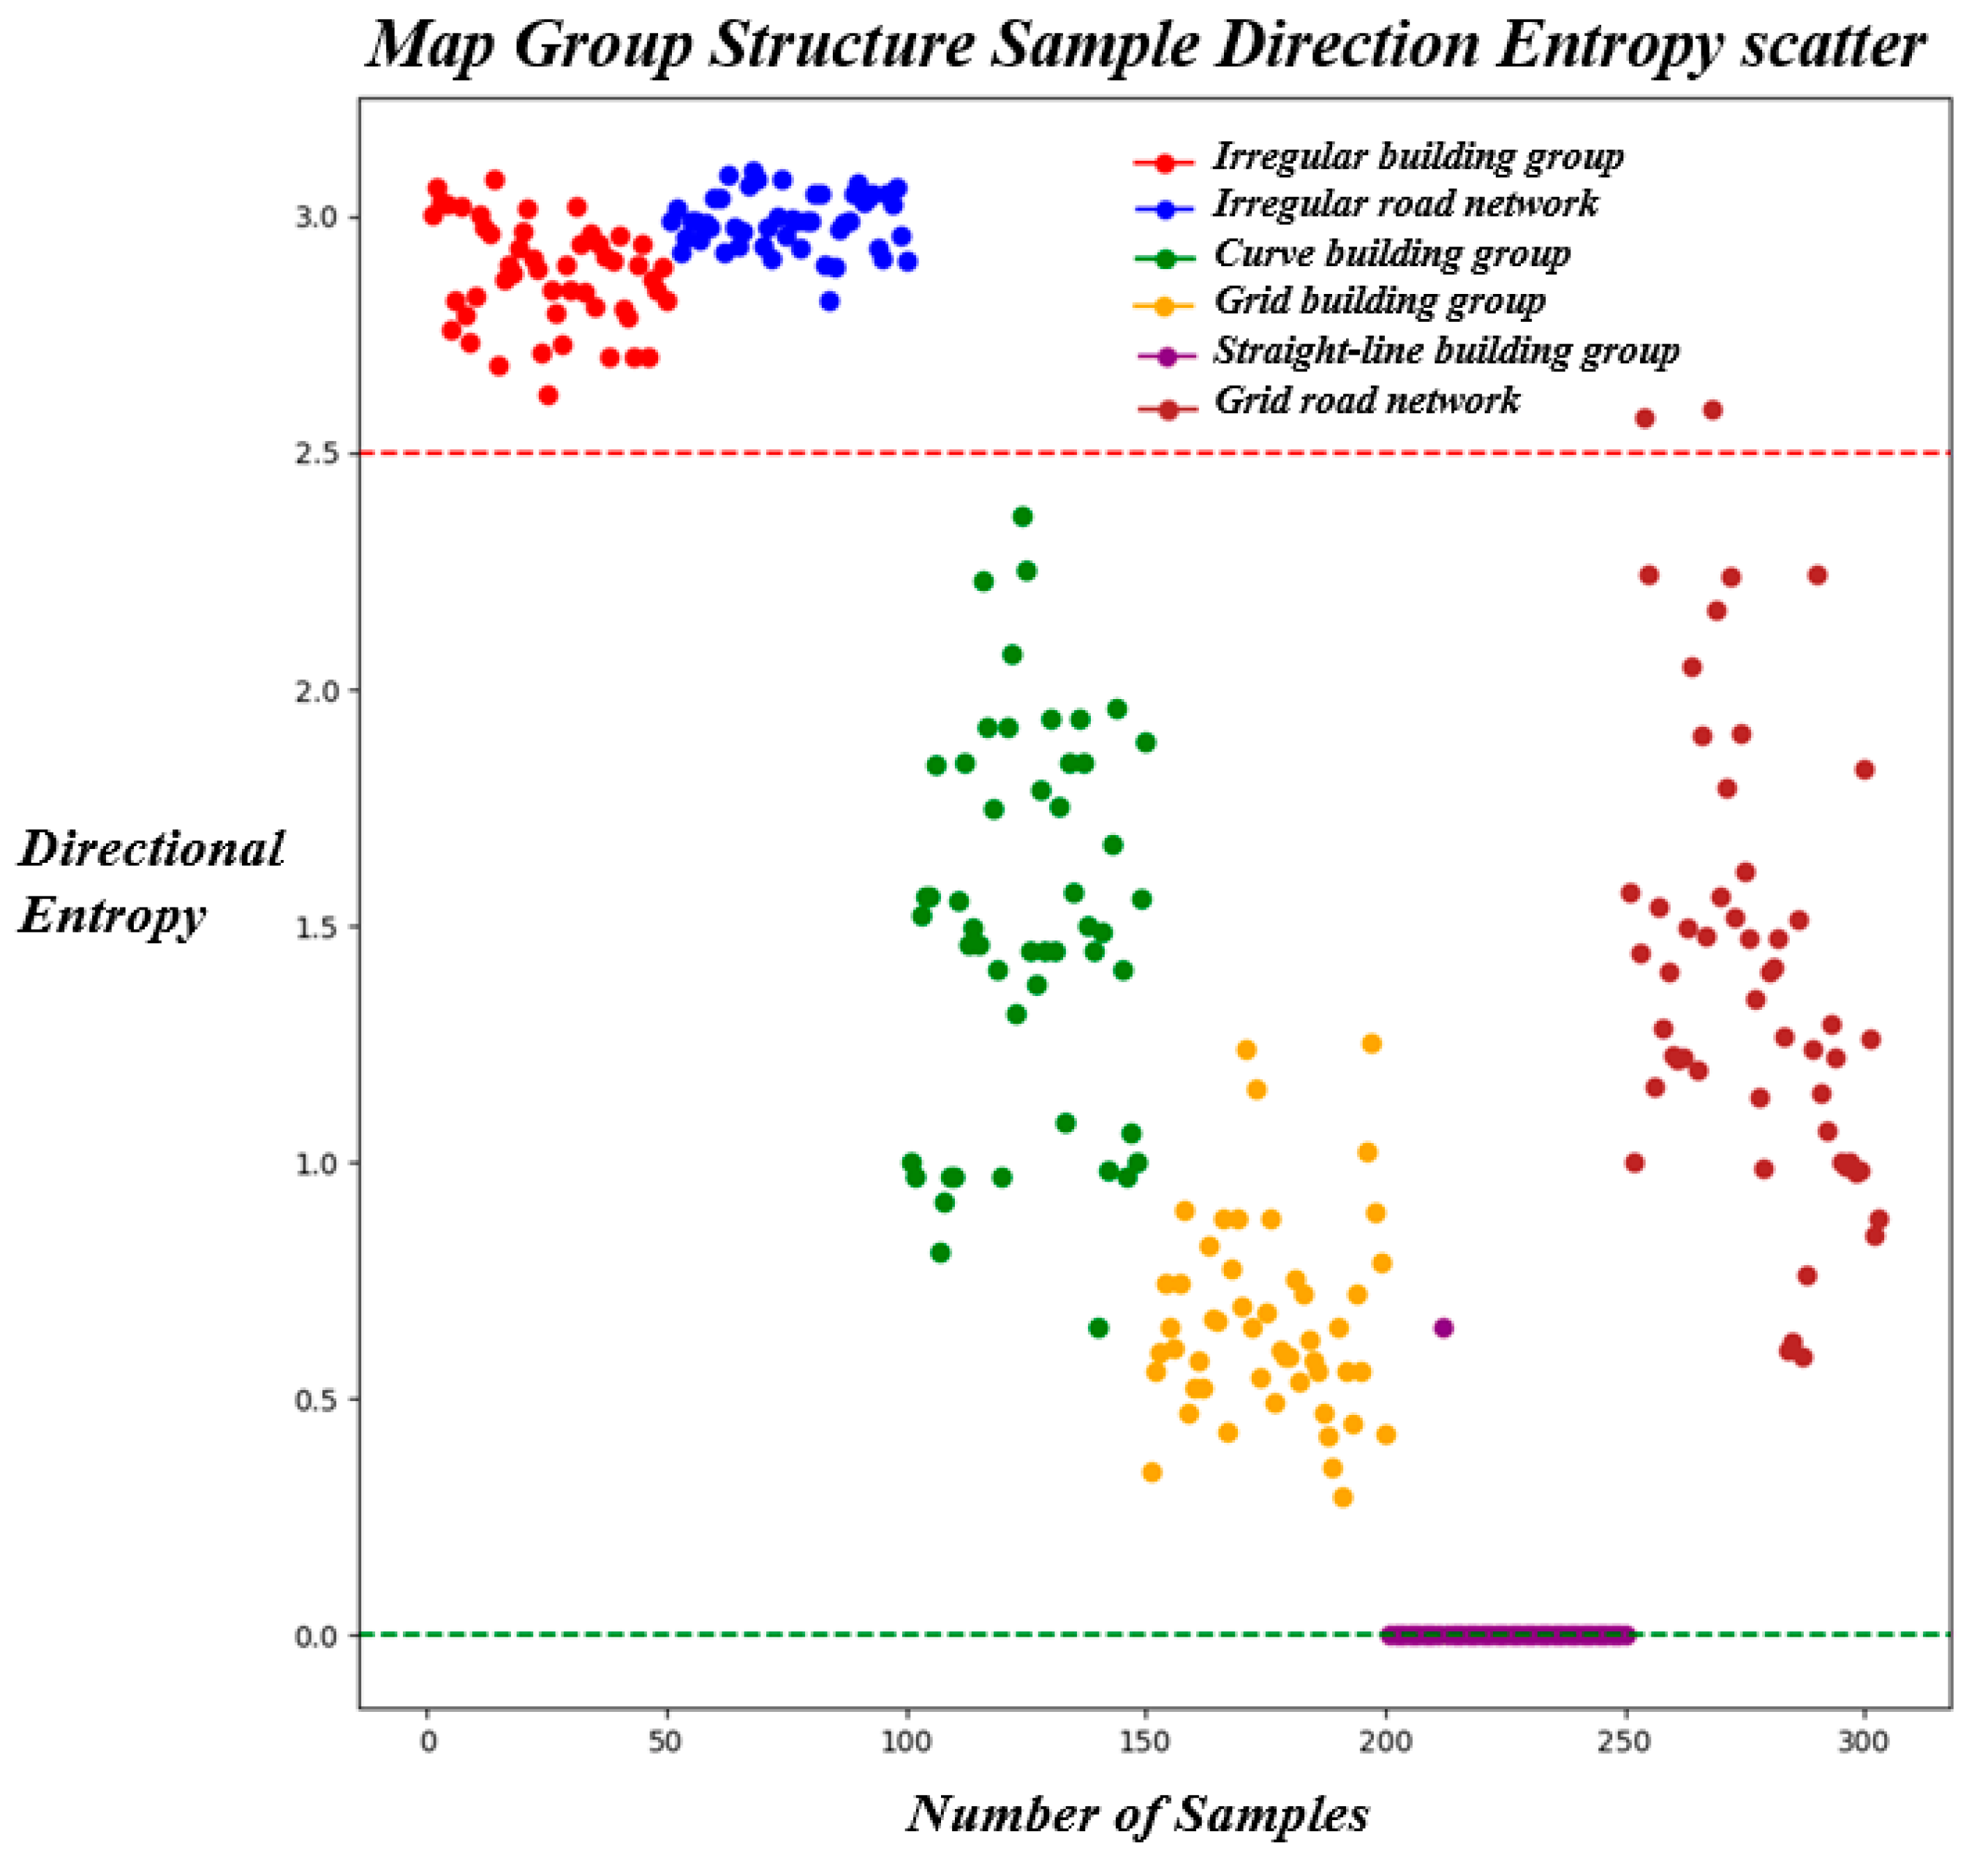
To distinguish the six types of map groups and evaluate whether the combination of directional entropy and node degree produces pattern recognition outcomes consistent with expectations, directional entropy calculations and node degree statistics were conducted on 300 group targets with well-constructed edge-node structural geometric models from Sample Set 1. The results of the directional entropy calculations for the six map group patterns are presented in
Figure 8.
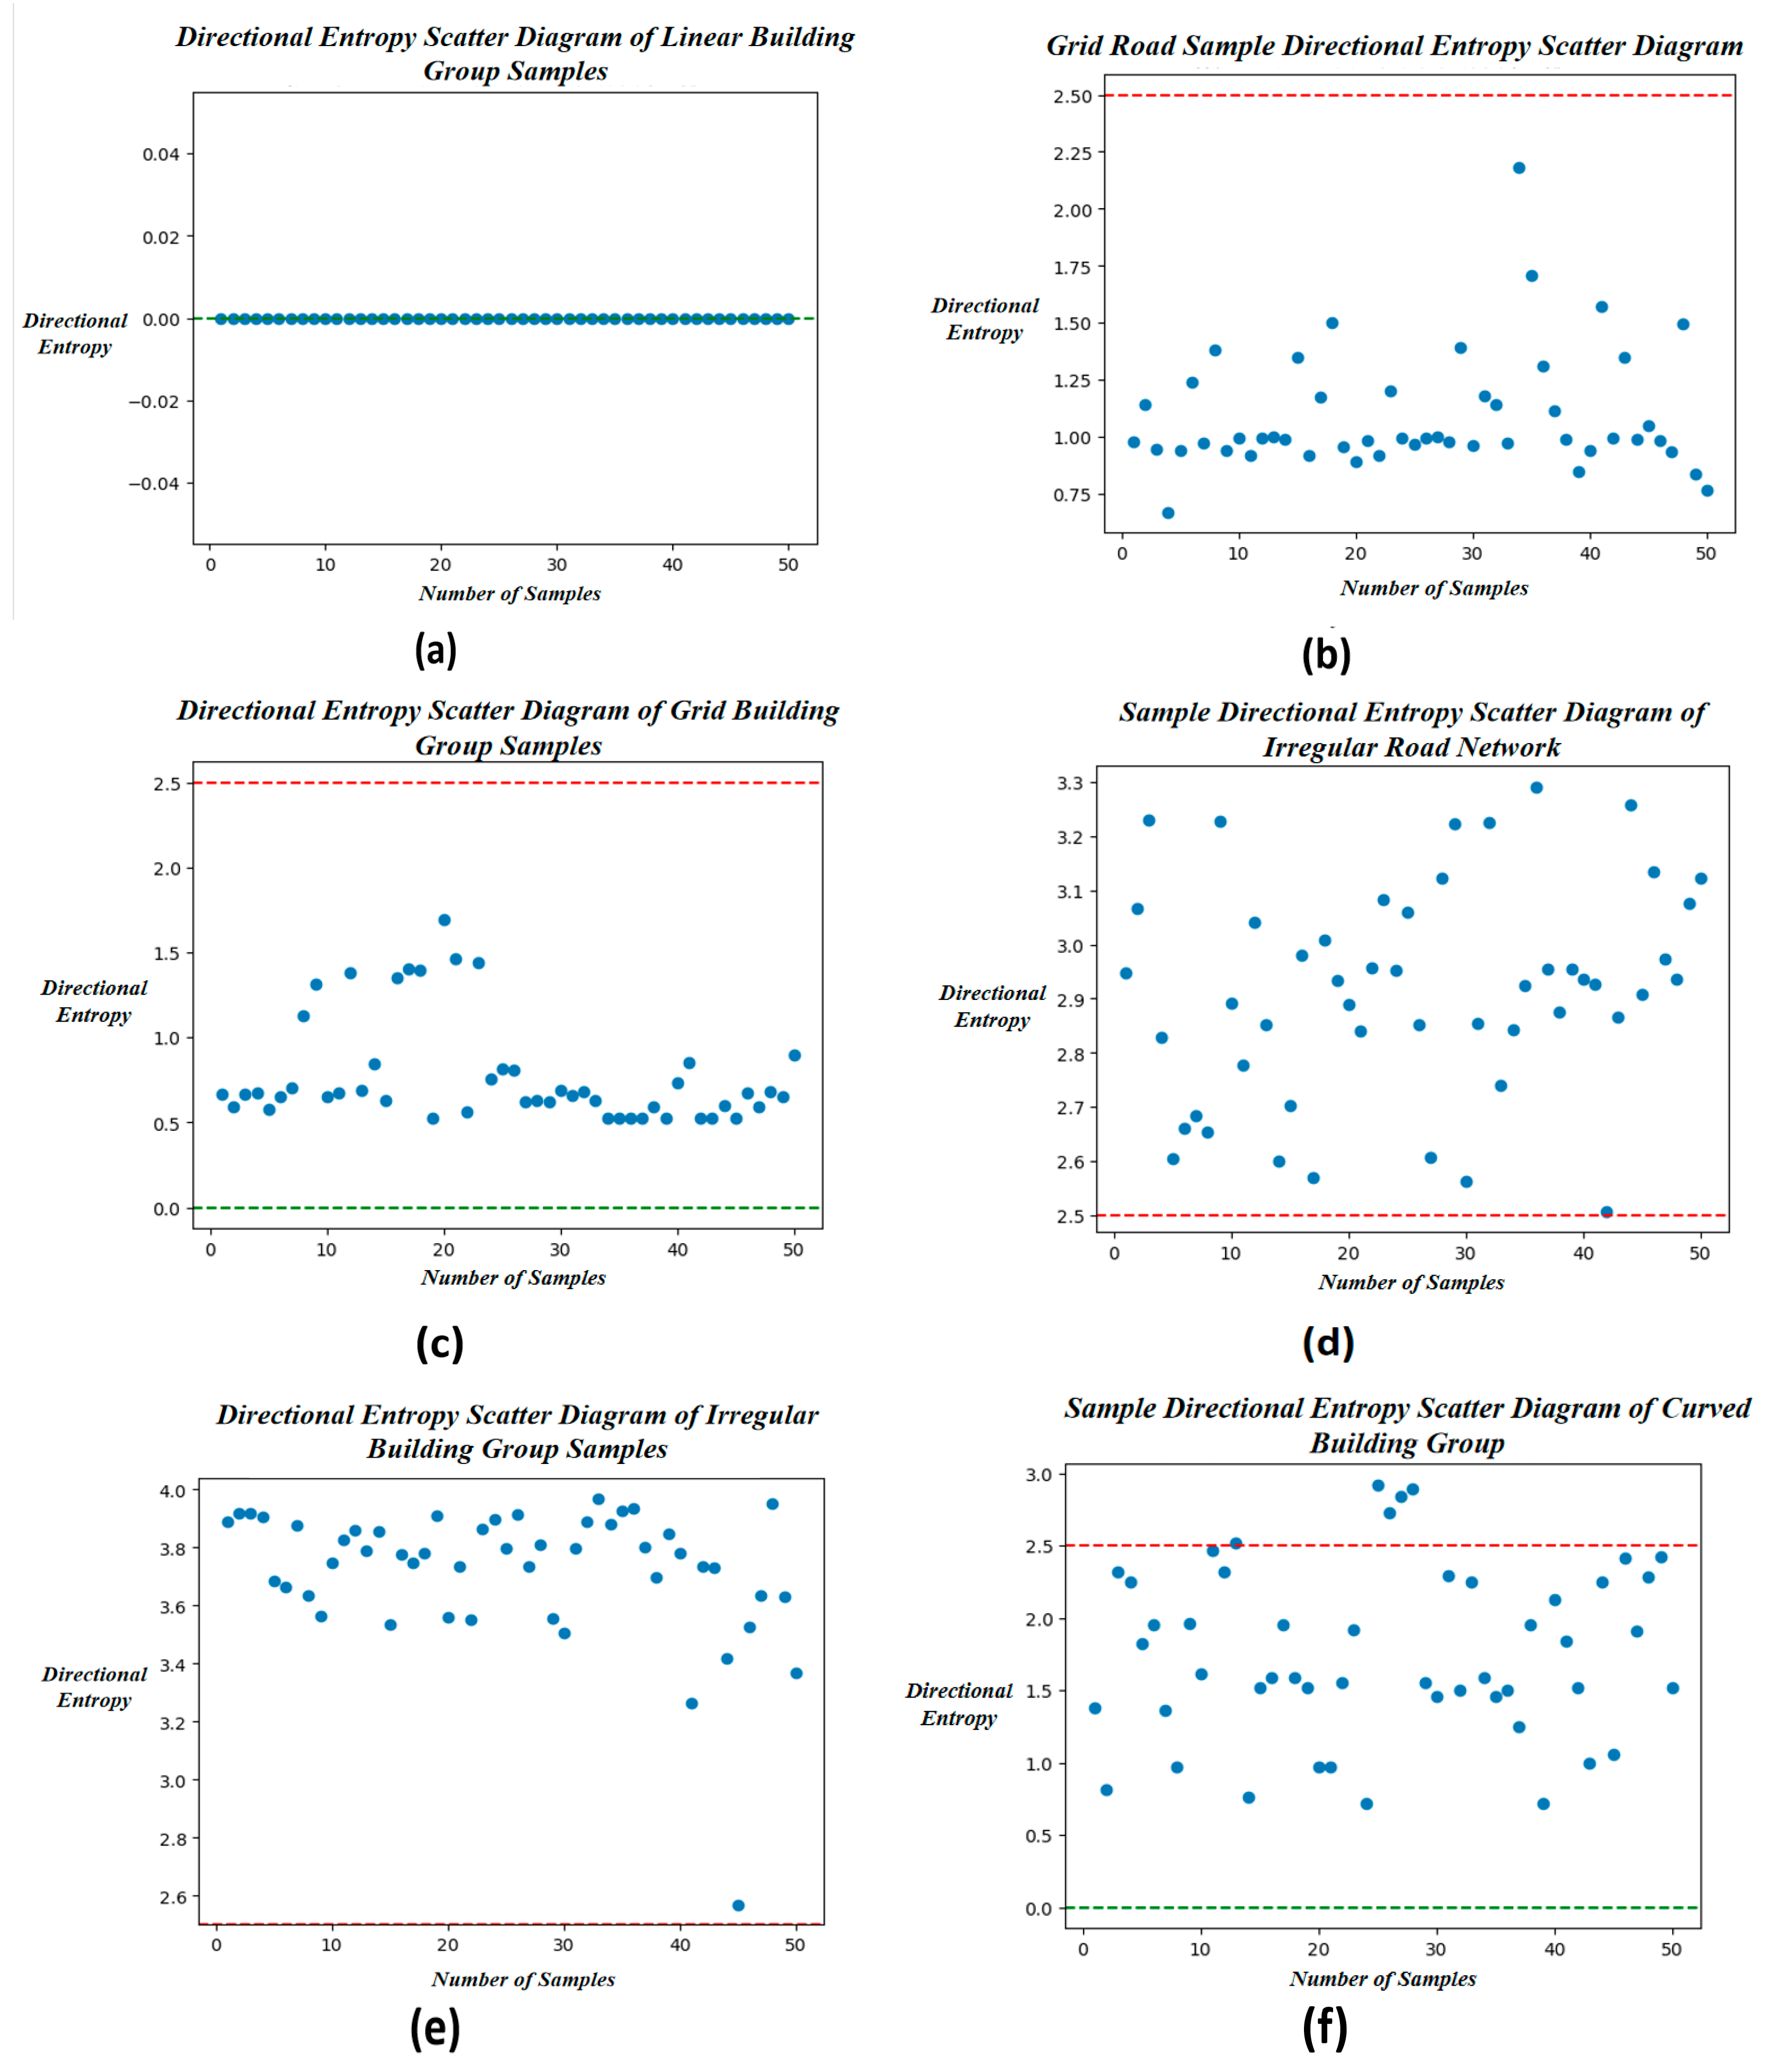
According to the principles of directional entropy calculation, the value for the minimum spanning tree constructed from linear-type building groups should be 0. As shown in
Figure 14a, all directional entropy values for the minimum spanning trees of linear-type building groups are indeed 0, aligning with the directional entropy distribution pattern characteristic of linear point groups. For the minimum spanning trees of grid-type building groups and the connectivity graphs of grid-type road networks, the edge orientations are ideally concentrated in two directions, resulting in relatively low directional entropy values within the range [0, 1]. However, due to occasional variations in node arrangements within the groups, the directional entropy threshold for grid-type map groups was expanded. As illustrated in
Figure 14b,c, the directional entropy values for these structures fall within the range (0, 2.5]. In contrast, the directional entropy values for irregular-type building group minimum spanning trees and irregular-type road network connectivity graphs are significantly higher than those of grid-type geometric models.
Figure 14d,e demonstrate that these values consistently exceed 2.5. Meanwhile, for curved-type building group minimum spanning trees, edge orientations are distributed across multiple intervals, resulting in directional entropy values greater than 0, as depicted in
Figure 14f.
In summary, the directional entropy threshold for the minimum spanning trees of linear-type building groups is 0. For curved-type building group minimum spanning trees, the directional entropy is greater than 0, while for grid-type edge-node geometric models, the threshold lies between 0 and 2.5. For irregular-type edge-node geometric models, the directional entropy exceeds 2.5.
In the process of map group pattern recognition, relying solely on directional entropy is insufficient to fully differentiate between the six types of map groups. While directional entropy provides insight into the orderliness of the edge-node structure, it cannot distinguish whether a sample is a road network connectivity graph or a building group’s minimum spanning tree. Furthermore, the statistical analysis of directional entropy values reveals that curved-type building groups exhibit entropy values greater than 0. However, this alone does not provide enough distinction from grid-type or irregular-type map groups.
Considering the structural differences between building group minimum spanning trees and road network connectivity graphs—such as the presence or absence of cyclic structures—and the variability in node connectivity across different patterned edge-node geometric models, node degree serves as a critical metric. It helps differentiate between road network connectivity graphs and building group minimum spanning trees, as well as between linear-type building group minimum spanning trees and other edge-node geometric structures. For each map group sample in Sample Set 1 with constructed edge-node structural geometric models, maximum and minimum node degrees were calculated, as summarized in
Table 1. The minimum node degree for all building group minimum spanning trees is 1, whereas for road network connectivity graphs, it is 2. In the case of minimum spanning trees for both linear-type and curved-type building groups, the maximum node degree is 2, and the minimum node degree is 1.
6.2. Formulation of Pattern Recognition Rules for Map Group Targets
This paper achieves multi-pattern recognition of linear-type, curved-type, grid-type, and irregular-type building groups, as well as grid-type and irregular-type road networks, by constructing edge-node geometric model structures for map group targets and utilizing feature parameters such as directional entropy and node degree. These two parameters complement each other. Directional entropy effectively evaluates the degree of disorder in the edge arrangement of the edge-node geometric model structure but cannot differentiate between building groups and road networks or distinguish linear-type building groups from other patterns. Relying solely on directional entropy for pattern recognition may result in errors. Conversely, node degree, which describes the connectivity of nodes in the geometric model, lacks intrinsic capability to classify patterns. However, by leveraging structural differences, such as those between building group minimum spanning trees and road network connectivity graphs, node degree can effectively separate these categories. Additionally, it distinguishes linear-type building group minimum spanning trees from grid-type and irregular-type counterparts.
The combined use of directional entropy and node degree can effectively distinguish between different patterns and types of building groups. However, as shown in
Table 1, the maximum node degree of grid-pattern building group MSTs may be 2. This may lead to misclassification of grid-pattern groups as curved-pattern groups when using only node degree and directional entropy for pattern recognition.
For example, the grid-pattern sample in
Figure 15a yields an MST with maximum node degree 2, minimum node degree 1, and directional entropy 0.4395. The curved-pattern sample in
Figure 15b produces an MST with identical node degrees (max = 2, min = 1) but higher directional entropy (1.3924). Due to their similar feature parameters, relying solely on these recognition rules would cause errors.
By examining edge orientation distributions, it is found that grid-pattern MSTs consist of n distinct straight lines arranged in parallel, oblique, or orthogonal configurations. Except for obvious right-angle turns, their edge orientations remain concentrated. In contrast, curved-pattern MSTs form smoother curves where edges meeting at degree-2 nodes tend to create acute angles. Therefore, incorporating the angle between adjacent edges as a constraint during pattern recognition enables more accurate differentiation between grid and curved building group patterns.
In summary, by analyzing the edge-node geometric model structure of map groups, this study calculates and derives thresholds for directional entropy and node degree for different map group types. This approach successfully distinguishes linear-type, curved-type, grid-type, and irregular-type building groups, as well as grid-type and irregular-type road networks. The specific algorithm flow is detailed in
Figure 16.
6.3. Pattern Recognition for Map Group Targets
To validate the robustness of the feature parameter thresholds determined from Sample Set 1 and to assess the transferability of the constructed pattern recognition rules, an experiment was conducted using 300 labeled map group samples from Sample Set 2 with well-defined edge-node structural geometric models. The statistical results are presented in
Figure 17 and
Table 2. Among the 50 samples labeled as linear-type building groups, 49 exhibited a directional entropy value of 0, while 1 sample had a value between 0 and 2.5. All these samples had a maximum node degree of 2 and a minimum node degree of 1. For the 50 grid-type building group samples, directional entropy values ranged between 0 and 2.5, with seven samples having a maximum node degree of 2, 40 samples a maximum node degree of 4, and three samples a maximum node degree of 3. All grid-type building group samples had a minimum node degree of 1.
The irregular-type building group samples exhibited directional entropy values exceeding 2.5, with six samples having a maximum node degree of 3 and 44 a maximum node degree of 4. All had a minimum node degree of 1. The curved-type building group samples showed directional entropy values between 0 and 2.5, and all had a maximum node degree of 2 and a minimum node degree of 1. Grid-type and irregular road network samples both had a maximum node degree of 4 and a minimum node degree of 1. Among the grid-type road network samples, 48 had directional entropy values between 0 and 2.5, while 2 exceeded this range. All 50 irregular road network samples exhibited directional entropy values above 2.5.
Using the pattern recognition rules derived from
Figure 16, all map group samples in Sample Set 2 underwent classification. The recognition outcomes, as shown in
Table 3, achieved complete accuracy for grid-type, irregular-type, and curved-type building groups, as well as irregular road network samples. However, one linear-type building group sample was misclassified as a curved-type building group, and two grid-type road network samples were incorrectly identified as irregular road networks. Analysis of the misclassified grid-type road network samples revealed that their directional entropy values exceeded the grid-type threshold due to the presence of nearly circular arc segments in the road network connectivity graph (
Figure 18a,d). These arcs disrupted the directional distribution after linear segmentation (
Figure 18b,c,e,f), resulting in directional entropy values of 2.885 and 2.820, respectively. Similarly, the misclassification of a linear-type building group sample as a curved-type building group stemmed from strict directional entropy thresholds. As shown in
Figure 18g–i, large node offsets in the group’s minimum spanning tree caused edge directions to concentrate in two orientations, yielding a directional entropy value of 0.69. This led to the incorrect recognition.
In summary, the algorithm derived from
Figure 16 demonstrated high accuracy in classifying map group samples from Sample Set 2. With only one linear-type building group sample and two grid-type road network samples misclassified, the algorithm’s results closely aligned with manual annotations. This validated the effectiveness of combining directional entropy and node degree to recognize linear-type, curved-type, grid-type, and irregular-type building groups, as well as grid-type and irregular road networks. As shown in
Table 4, the algorithm achieved accuracy, precision, recall, and F1 scores exceeding 97% across all six patterns, highlighting its excellent generalization capability and reliable classification performance.
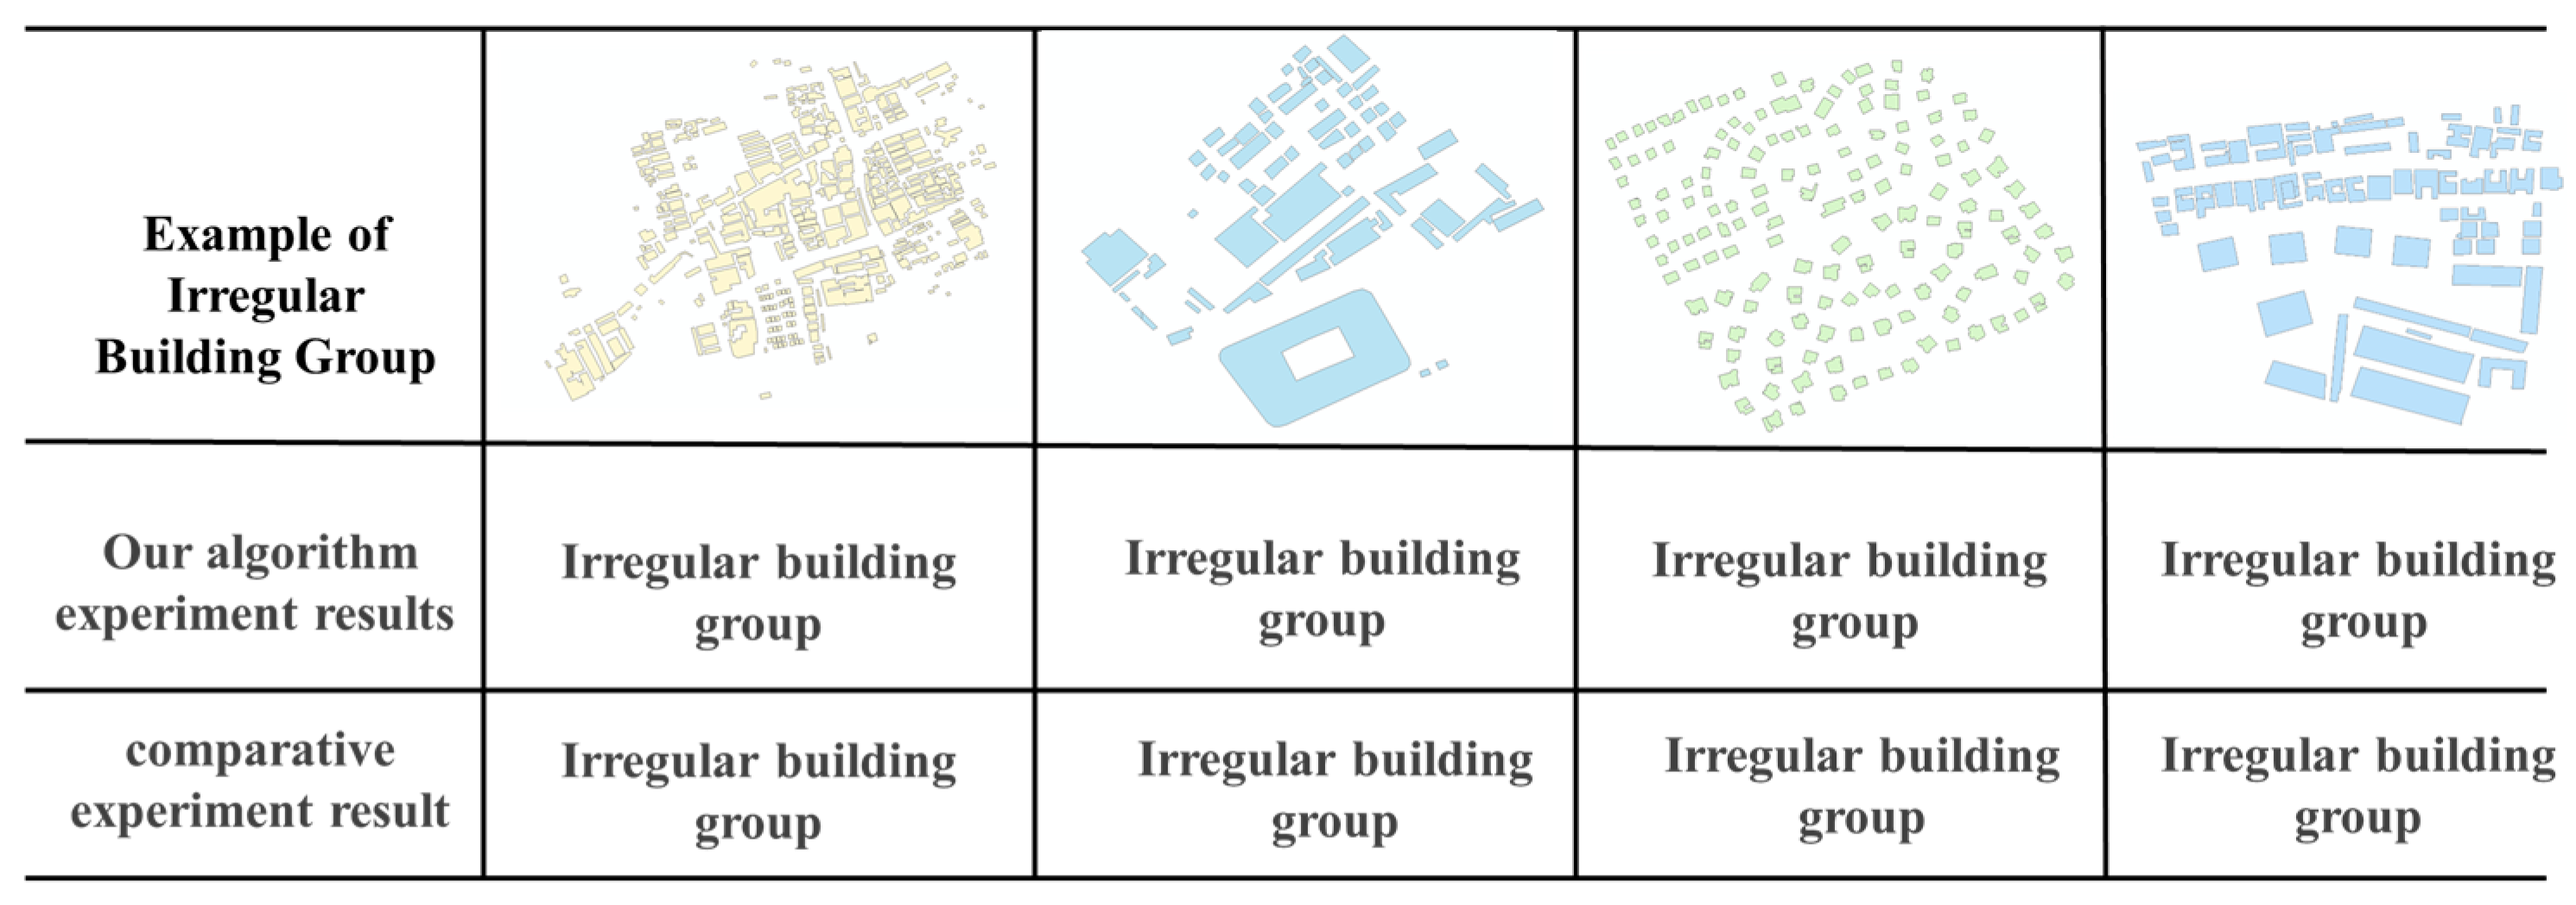
6.4. Comparative Experiment
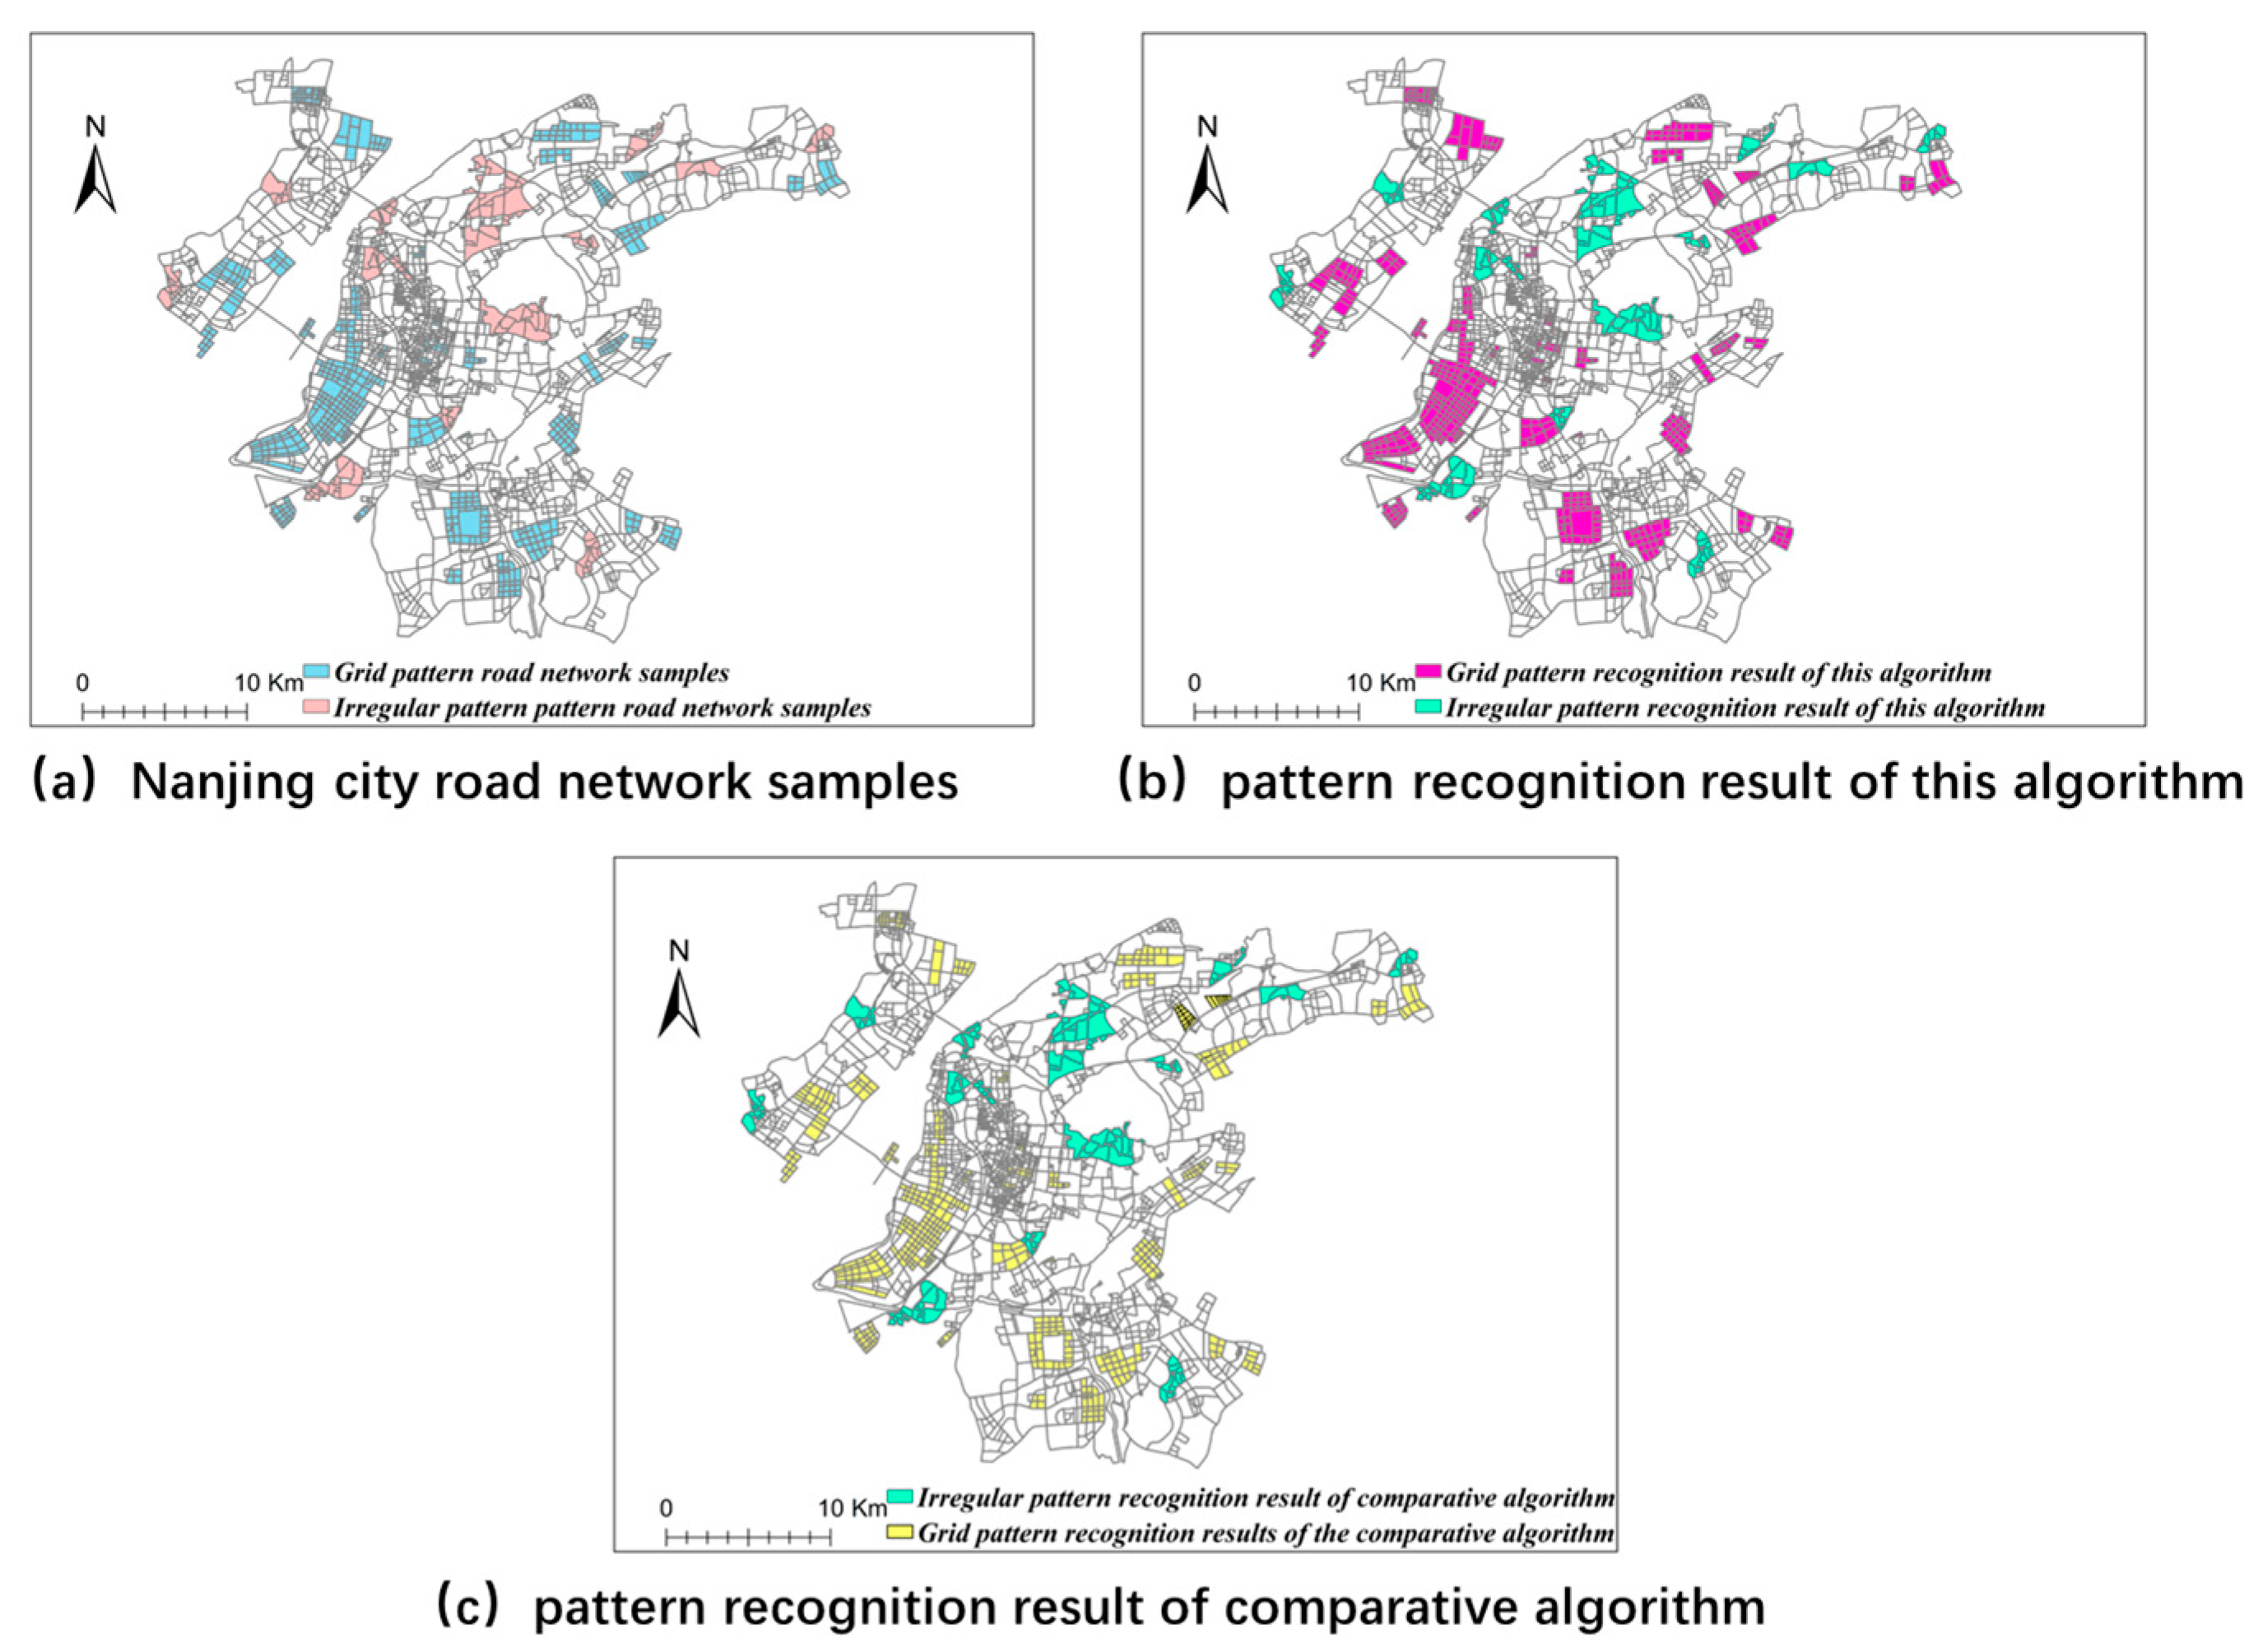
To validate the effectiveness of the proposed method, we conducted comparative experiments using two datasets. First, 80 annotated grid road network samples and 20 irregular road network samples were selected from the Nanjing dataset, and compared with the automatic road network pattern detection method proposed by Heinzle [
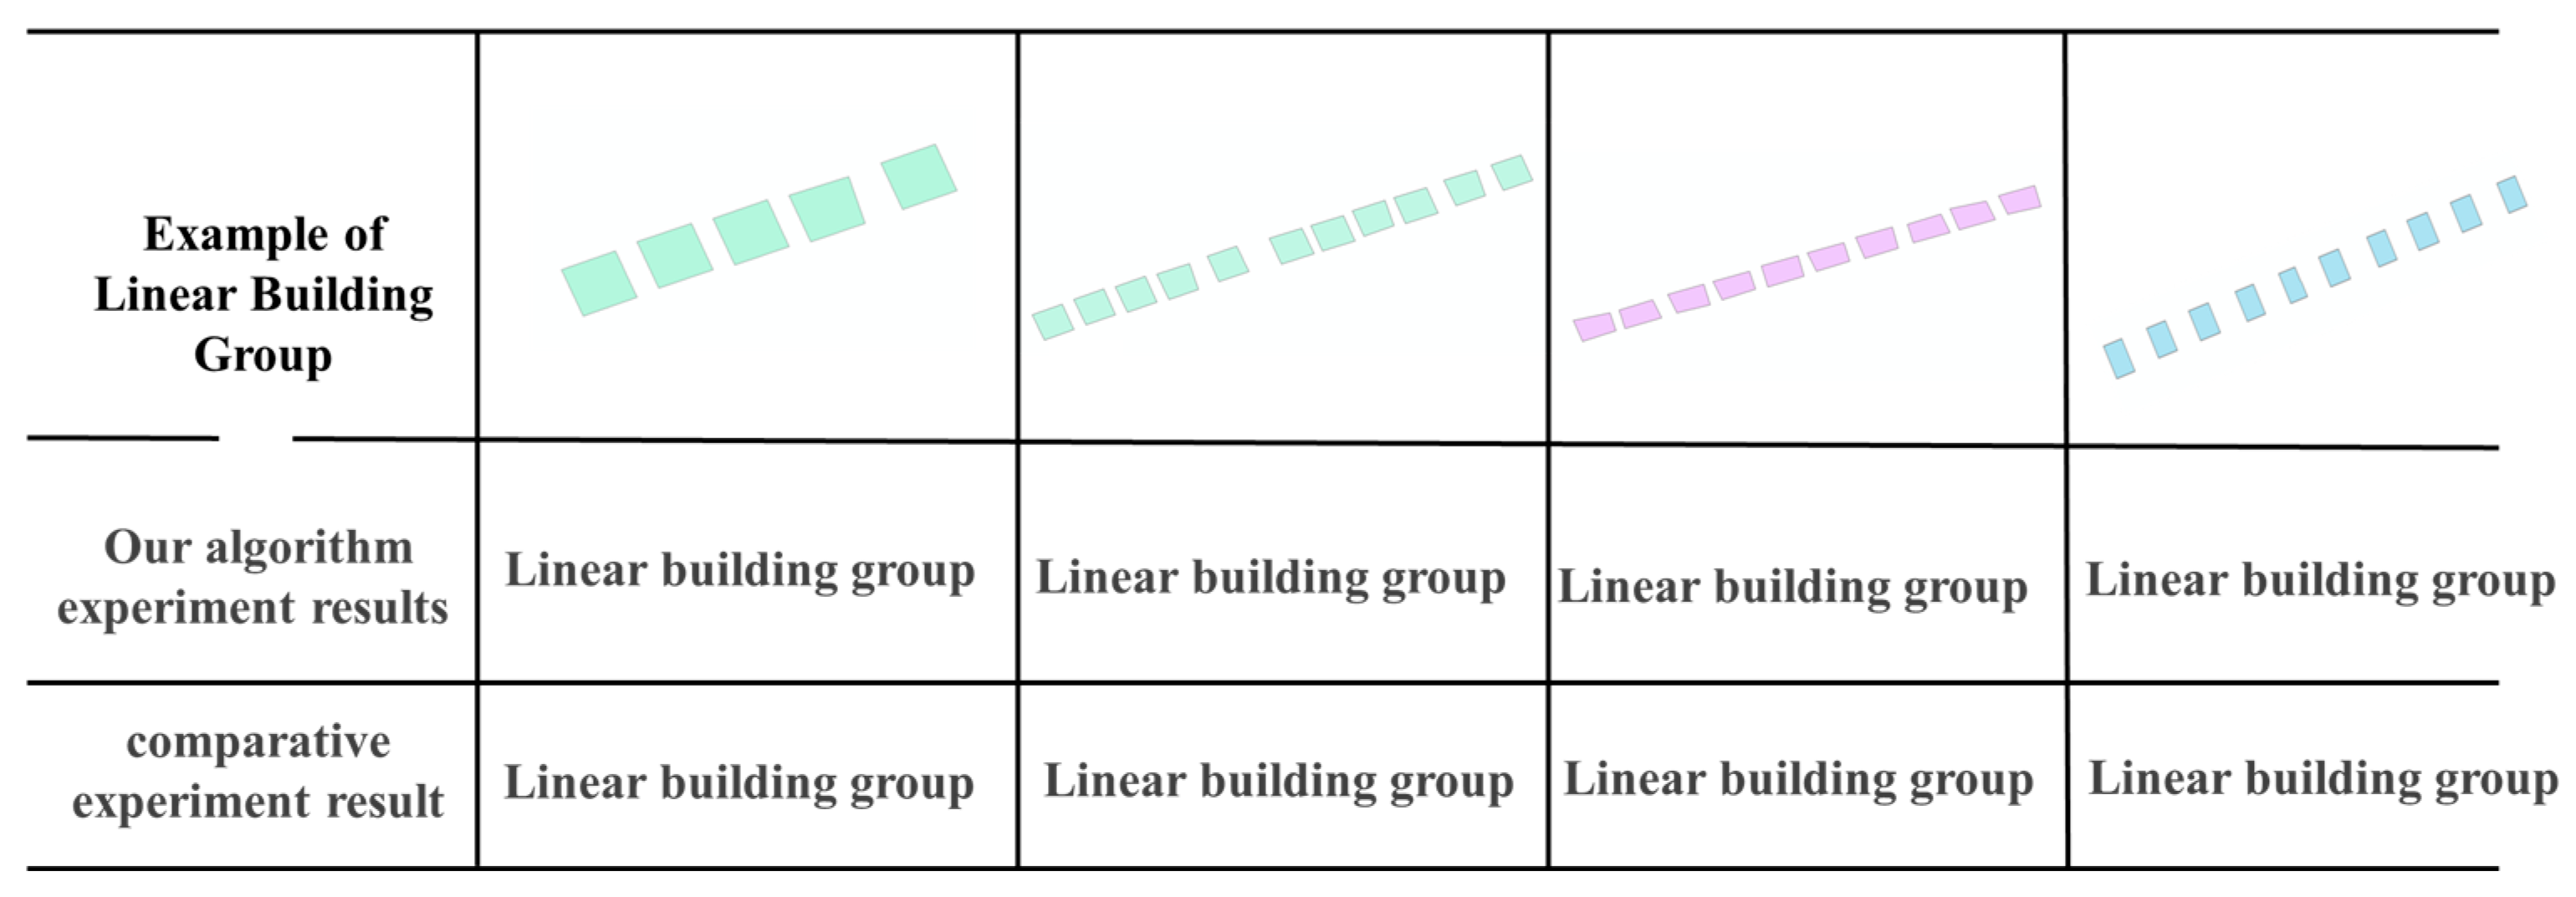
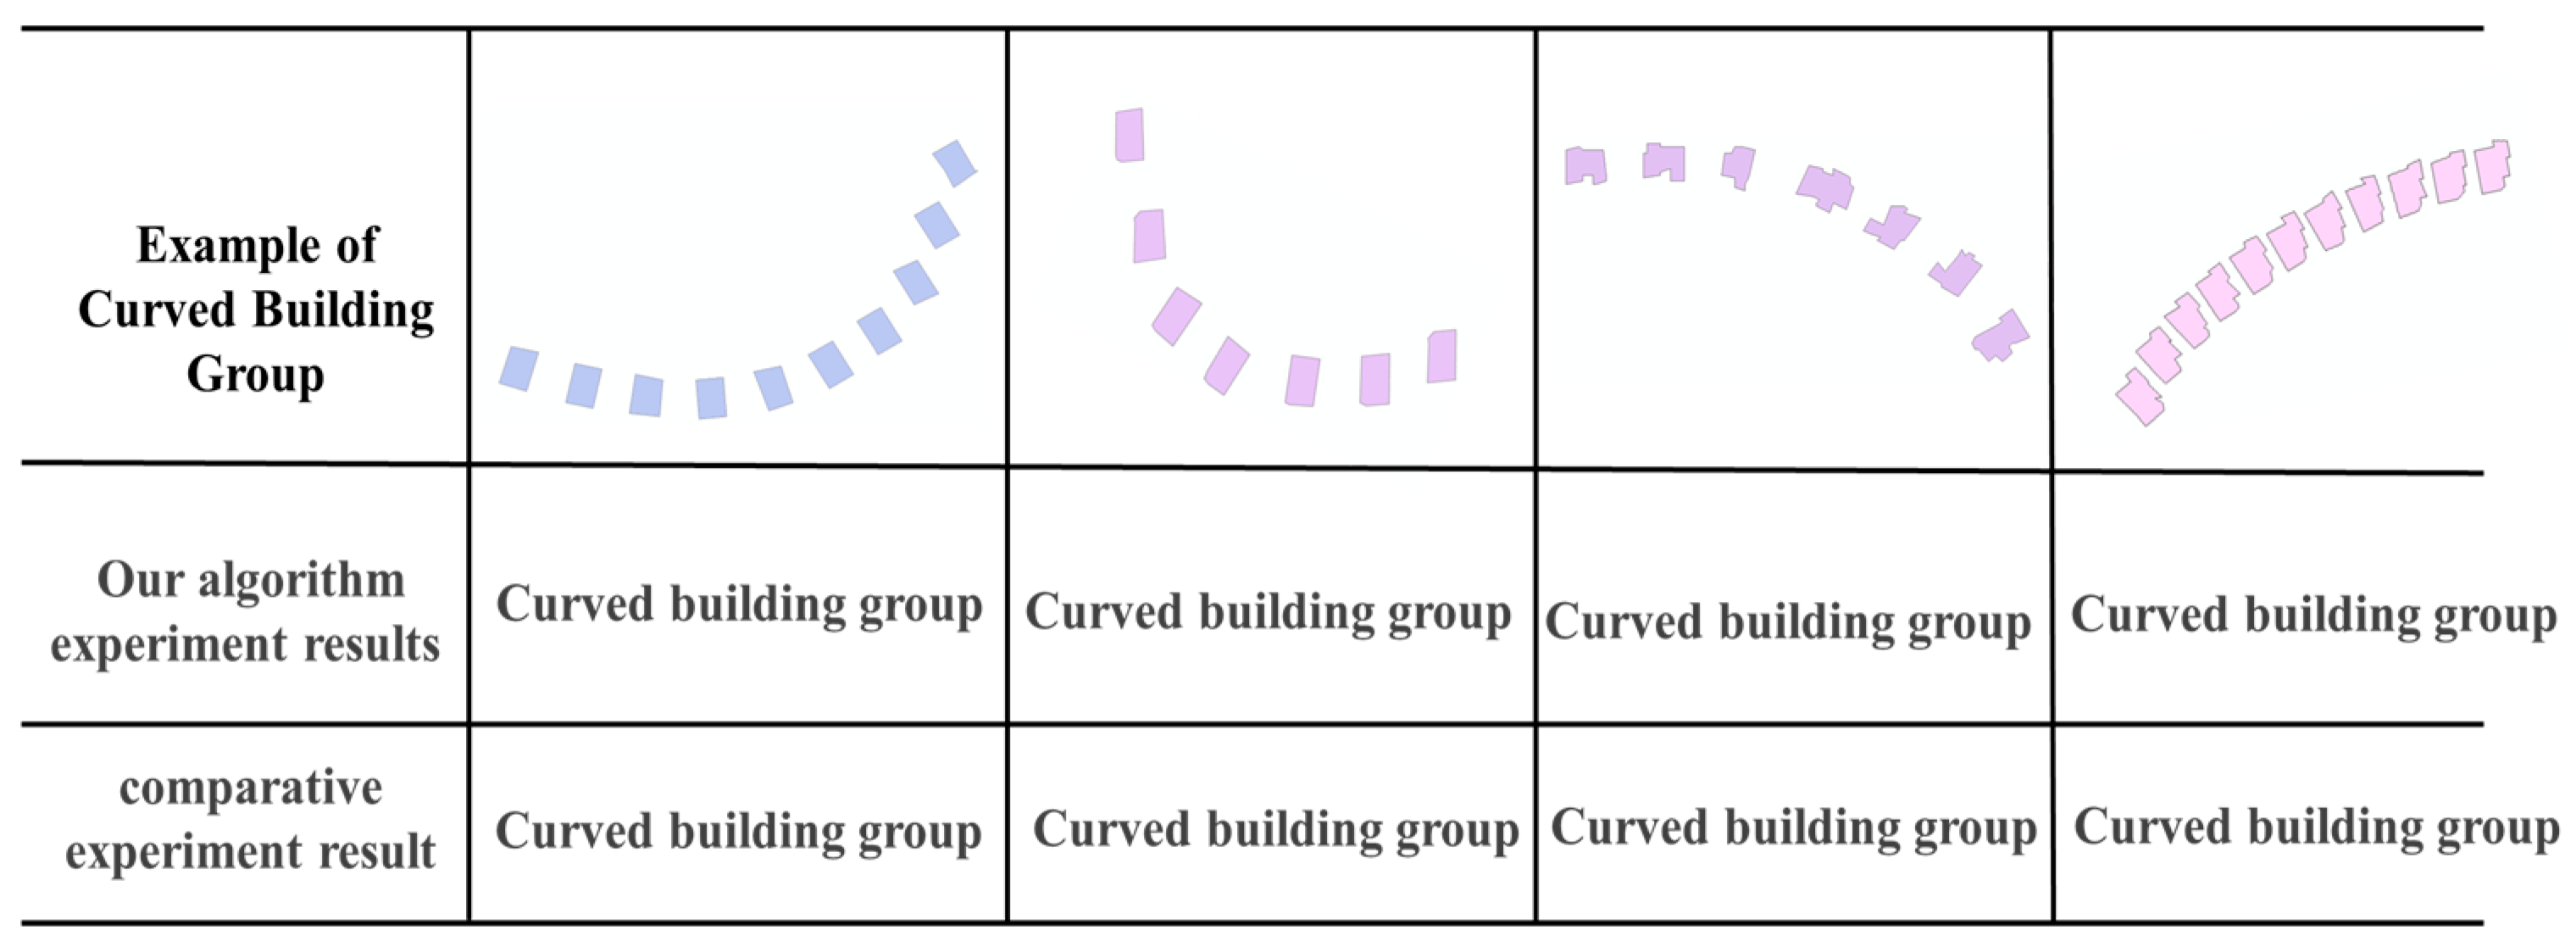
18]. Second, 25 samples each of linear, curvilinear, grid-type, and irregular building groups were selected from the Shanghai building group dataset, and compared with the building group pattern recognition algorithm proposed by Du [
16]. The comparative experimental results are shown in the following
Figure 19,
Figure 20,
Figure 21,
Figure 22,
Figure 23 and
Figure 24.
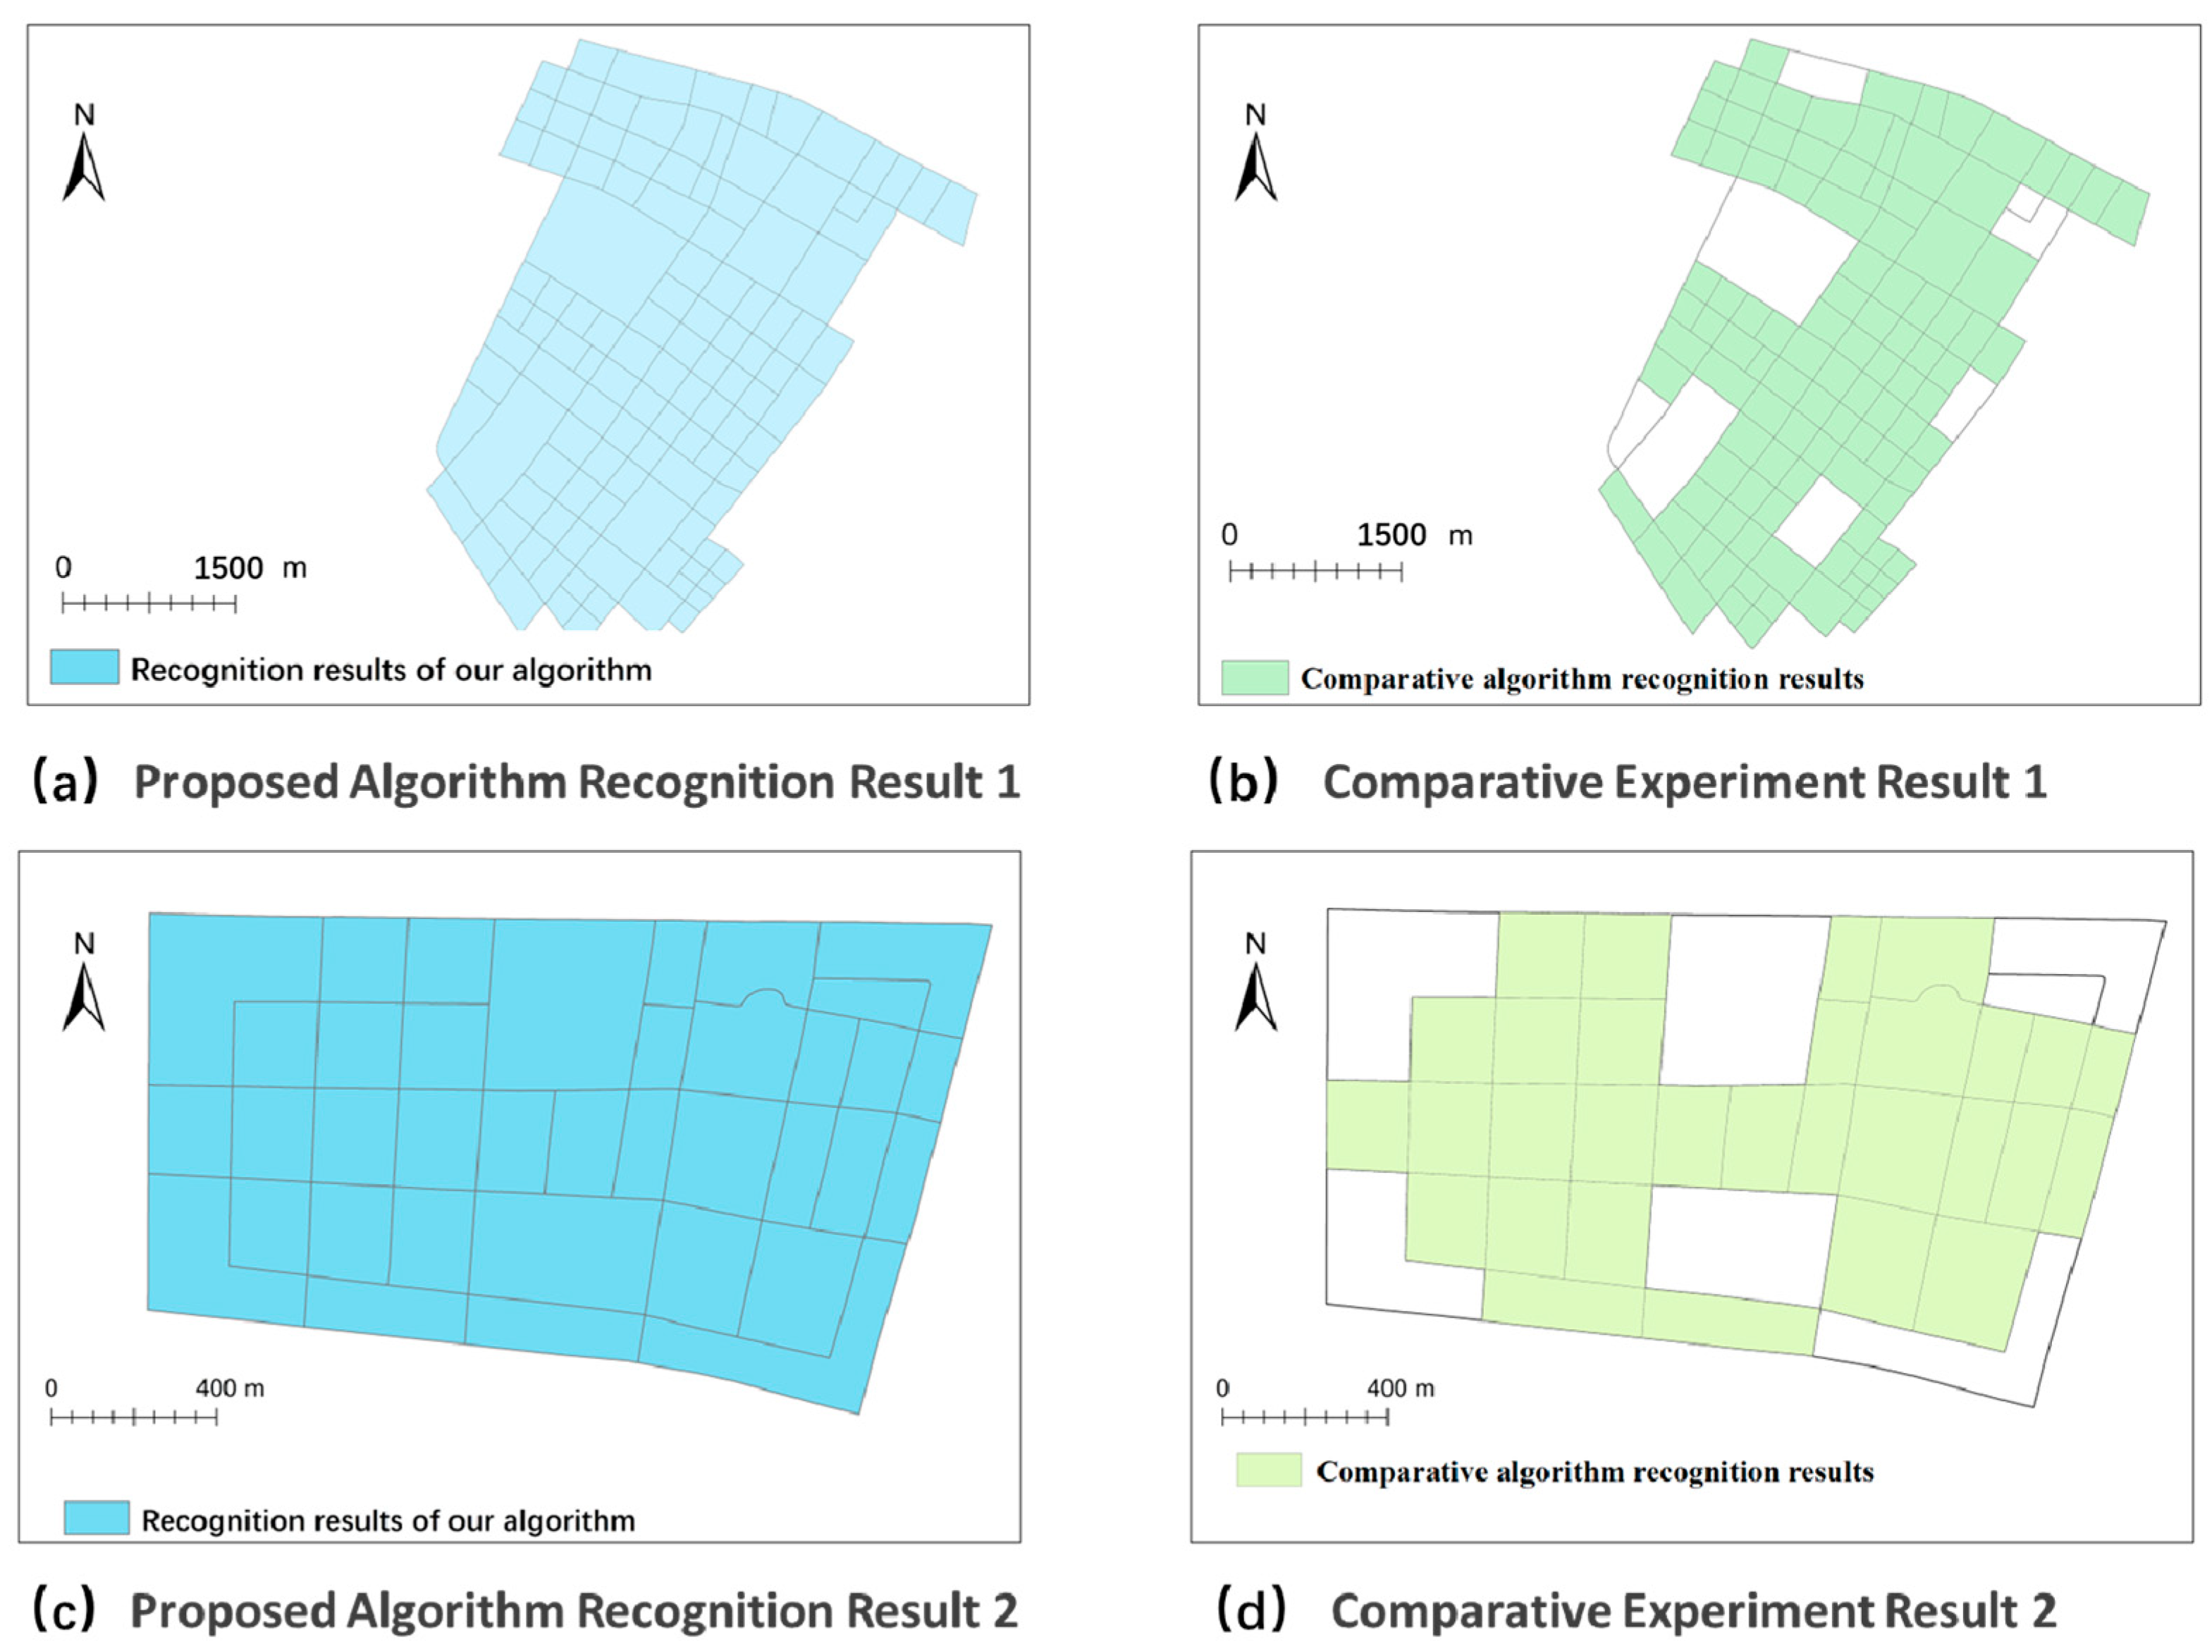
Heinzle’s road grid pattern recognition algorithm operates as follows: First, extract meshes from the road network. Next, calculate the similarity of each mesh. Subsequently, extract mesh centroids and detect grid structures formed by regularly arranged parallel road intersections by translating centroids of adjacent road polygons and verifying their spatial proximity. While this algorithm effectively extracts grid road networks composed of rectangular meshes with similar shapes, it has two limitations: (1) inability to recognize road network samples holistically; (2) failure to achieve accurate identification when adjacent meshes exhibit insufficient overlap area ratios or non-coinciding centroids after translation (see
Figure 20a,b).
Du’s building pattern recognition algorithm proceeds in two stages: First, establish adjacency relationships between building groups using modified Delaunay triangulation. Then, identify collinear, curvilinear, and grid patterns through parameter calculations and threshold settings. Although this algorithm achieves precise recognition of linear, curvilinear, grid, and irregular building patterns, it suffers from two drawbacks: (1) computational complexity in parameter calculations and algorithmic rules; (2) misclassification of grid-type building groups lacking orthogonal collinear patterns (see
Figure 23).
Compared with these algorithms, the proposed method demonstrates four advantages: (1) Better incorporates Gestalt principles by characterizing directional distributions of road segments and building group minimum spanning trees through directional entropy. (2) Achieves efficient classification of road network connectivity graphs and minimum spanning trees using node degree parameters. (3) Enables simultaneous pattern recognition for both road networks and building groups with a unified framework. (4) Effectively addresses the limitations of the aforementioned algorithms, as demonstrated in
Figure 20 and
Figure 23. To validate the effectiveness of the proposed algorithm, we conducted a quantitative evaluation of classification accuracy using annotated samples (
Table 5,
Table 6,
Table 7,
Table 8,
Table 9,
Table 10 and
Table 11). The results demonstrate that our algorithm can effectively identify and classify various patterns, including grid-type and irregular road networks, as well as linear, irregular, grid-type, and curved building groups.
6.5. Questionnaire Analysis
To validate the effectiveness, feasibility, and consistency with human cognition of the pattern recognition rules constructed for classifying map group patterns, this section involves the reconstruction of edge-node structure geometric models for 17 map group samples. These samples comprise three minimum spanning trees (MSTs) of linear-type building groups, three MSTs of grid-type building groups, three MSTs of curved-type building groups, two MSTs of irregular-type building groups, three connectivity graphs of irregular road networks, and three connectivity graphs of grid-type road networks. These models are depicted in
Figure 25.
To evaluate whether the pattern recognition results of the proposed algorithm align with human perception, a questionnaire survey was conducted with 100 students who had experience in cartography. The questionnaire included detailed explanations and illustrative figures for each type of point group, clarifying the characteristics of linear-type, grid-type, irregular-type, and curved-type building group minimum spanning trees, as well as grid-type and irregular-type road network connectivity graphs. For each map group sample, participants were given seven options: linear-type MST, grid-type MST, irregular-type MST, curved-type MST, grid-type road network connectivity graph, irregular-type road network connectivity graph, and other patterns. They were instructed to select the pattern that best matched their cognitive understanding based on the provided explanations and visual references. As shown in
Table 12, the survey results demonstrate that the outcomes of the proposed algorithm closely align with human cognition, validating the algorithm’s ability to recognize map group patterns in a manner consistent with expert interpretation.
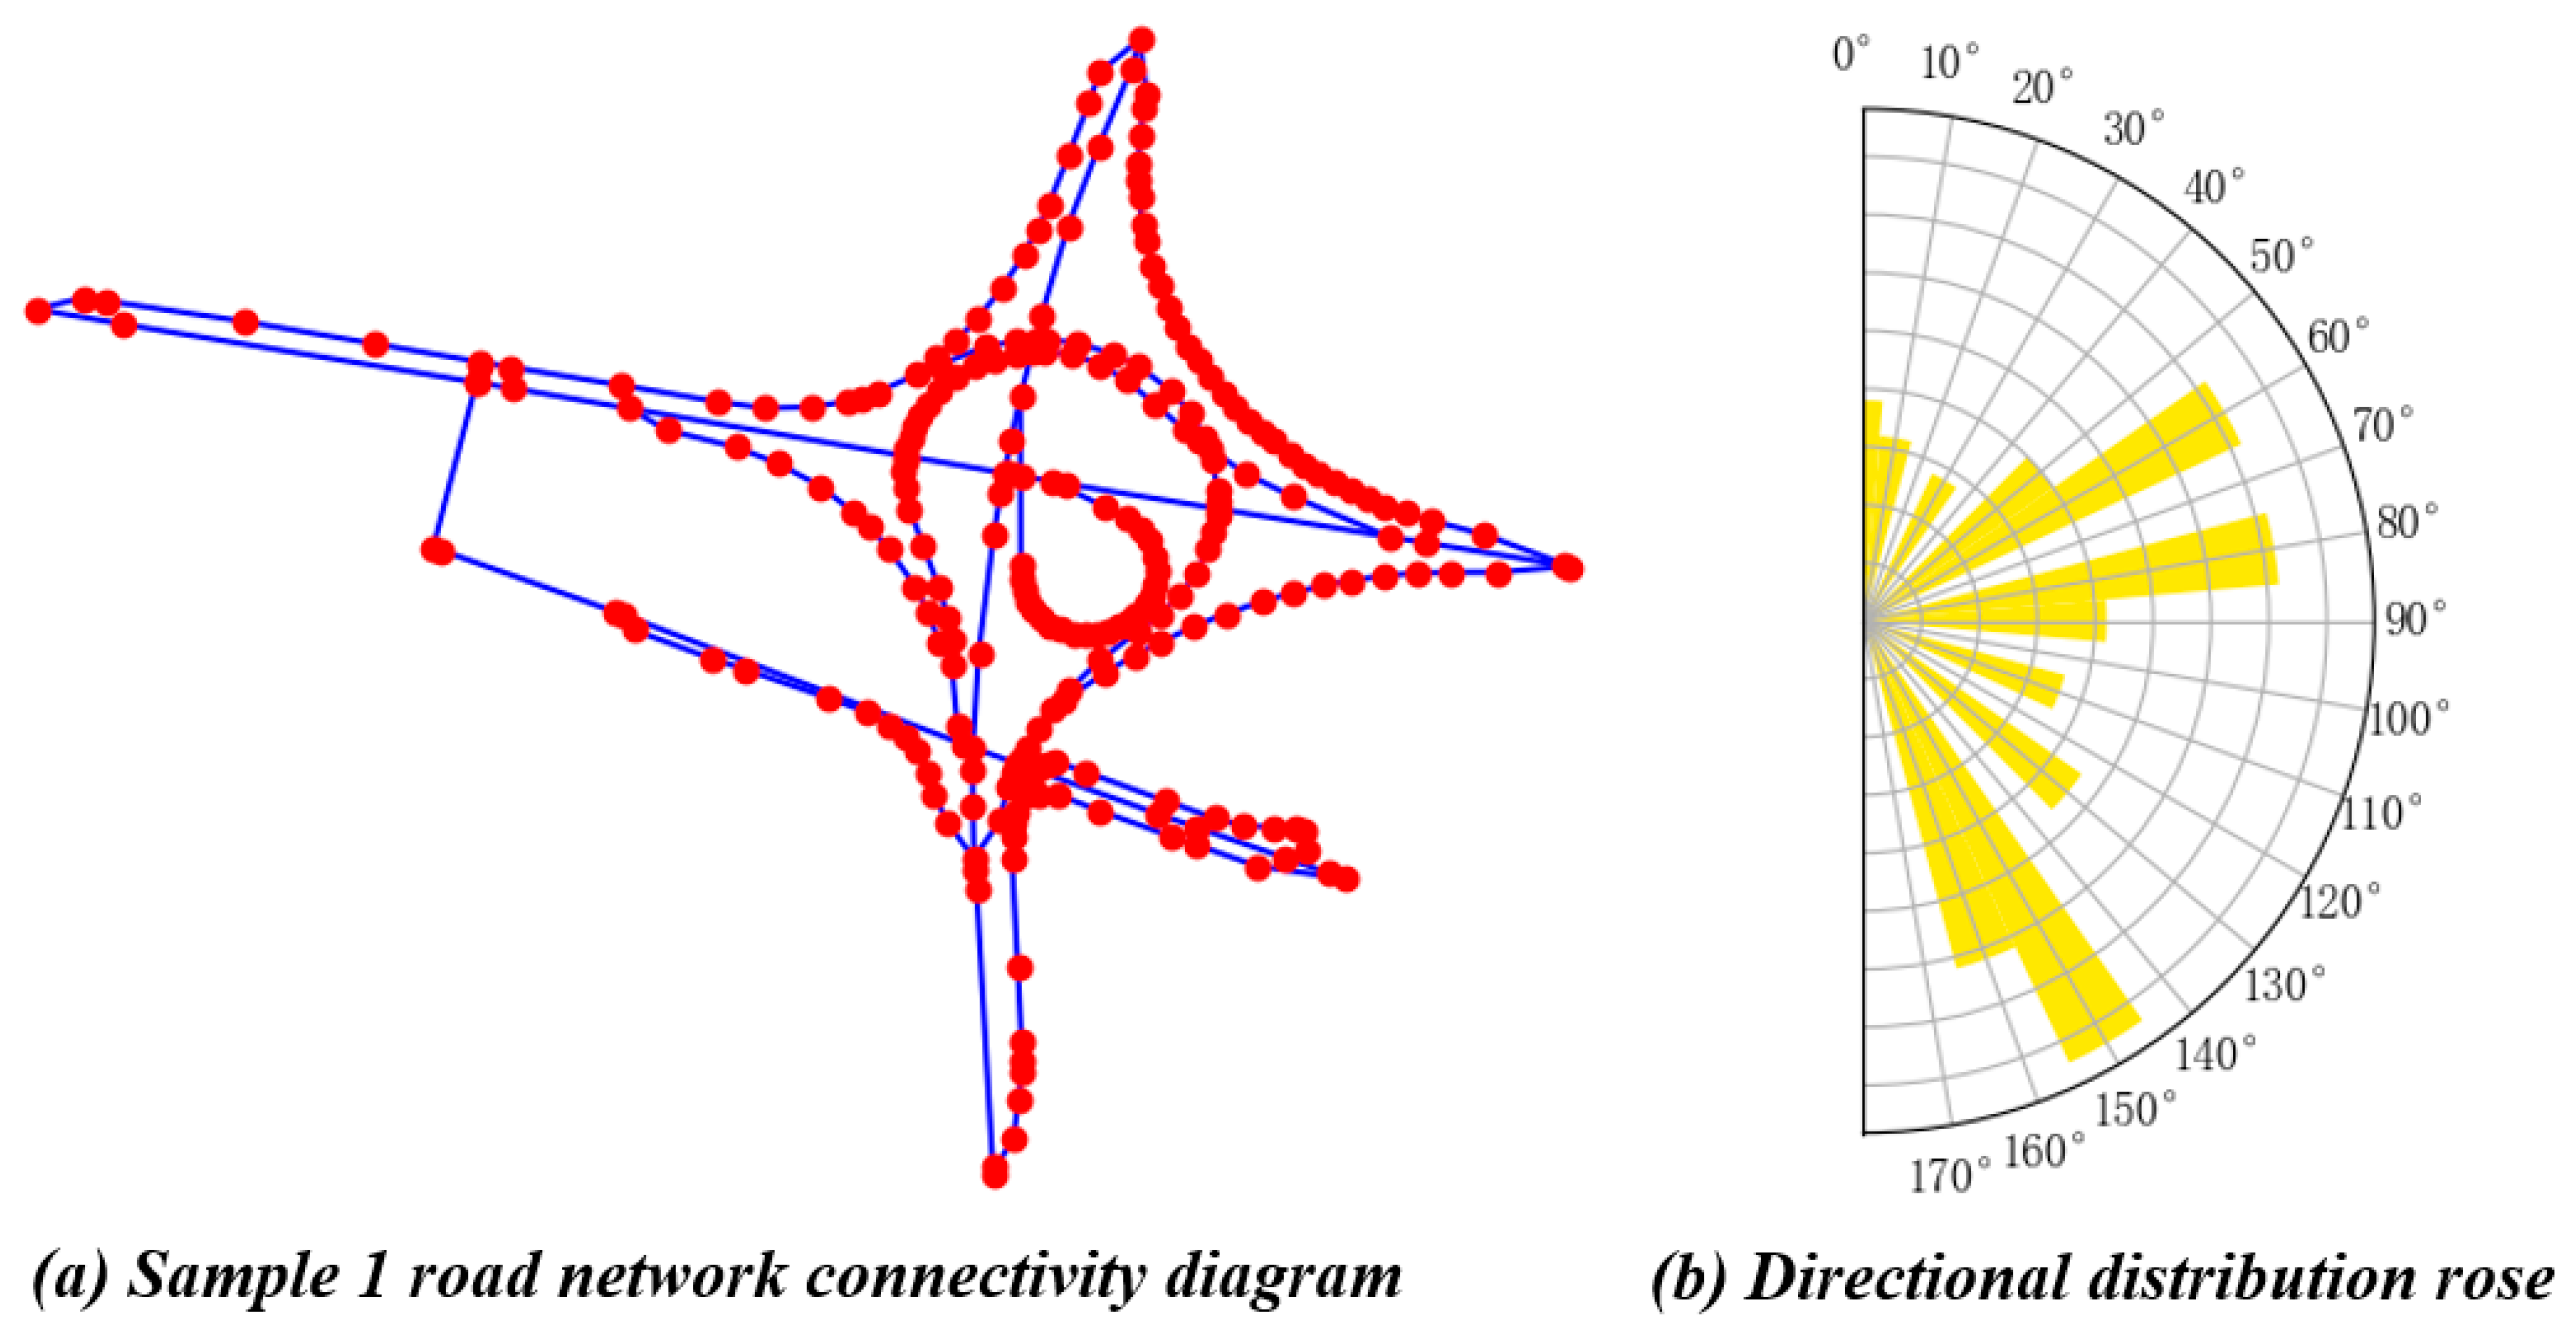
An analysis of the map group samples used in the questionnaire survey revealed that the first irregular road network sample (Sample 1) was perceived as an interchanging pattern by participants. Consequently, 75 out of 100 participants categorized this sample as “other pattern”. However, when the proposed algorithm was applied to Sample 1, it identified multiple curved segments within the road network connectivity graph (
Figure 26b), resulting in a highly disordered overall directional distribution. The directional entropy value of the sample was calculated to be 3.59. Based on the road network pattern recognition rules outlined in
Figure 10, the algorithm classified this sample as an irregular road network.
7. Conclusions
Pattern recognition of map groups has broad applications across various fields, including map generalization, map matching, spatiotemporal data mining, and urban planning analysis. However, existing pattern recognition algorithms face several challenges, such as complex preprocessing requirements, reliance on predefined thresholds, limited recognition capabilities, high algorithm complexity, and poor transferability. Furthermore, current algorithms struggle to achieve effective multi-mode recognition for diverse types of map groups. To address these challenges, this study focused on road networks and building data as research subjects. By optimizing the road network structure and applying the Prim algorithm, the two data types were unified into a structurally similar edge-node geometric model. Building on features such as directional entropy and node degree, a simple yet efficient multi-mode recognition method for multiple map groups was proposed, successfully recognizing typical group patterns in both building groups and road networks. Through empirical analysis, the following research results were obtained:
(1) Direction Entropy as a Descriptive Tool: Direction entropy has significant advantages in describing the regularity and characteristics of the spatial distribution of geographic features. In pattern recognition of map group targets, direction entropy can quantitatively describe the regularity of edge arrangements in building group minimum spanning trees (MSTs) and road network connectivity graphs. For example:
Linear-type building groups have a directional entropy value of 0. Grid-type building group MSTs and road network connectivity graphs exhibit directional entropy values ranging from 0 to 2.5. Irregular-type building groups and road network connectivity graphs have directional entropy values exceeding 2.5.
(2) Node Degree as a Differentiating Factor: Although node degree alone cannot complete map group pattern recognition, the maximum and minimum node degrees of edge-node geometric models for different types and patterns of map groups exhibit corresponding rules. For instance: The minimum node degree for building group MSTs is always 1. The minimum node degree for road network connectivity graphs is always 2. Linear-type building group MSTs have a maximum node degree of 2 and a minimum node degree of 1. By combining the quantitative advantages of direction entropy in describing the regularity of edge-node structure arrangements with the ability of node degree to differentiate between building groups and road networks, as well as between linear-type and other pattern building groups, a single algorithm was effectively used to recognize four building group patterns and two road network patterns.
(3) Validation of the Proposed Algorithm: Six hundred map group samples were divided in a 5:5 ratio into sample set 1 and sample set 2. Sample set 1 was used to determine the threshold intervals for different pattern parameters and to formulate the pattern recognition rules based on these thresholds. Sample set 2 was used to validate the feasibility and transferability of the proposed algorithm. Experimental results demonstrated that the developed pattern recognition algorithm has high recognition accuracy and strong transferability.
(4) Human Cognition Alignment: Through visual cognition comparison and psychological questionnaire surveys, it was found that the map group target pattern recognition results obtained using the proposed algorithm align with human cognitive understanding.
In conclusion, this study overcomes the limitations of existing pattern recognition algorithms by proposing a unified edge-node geometric model and a simple yet efficient multi-mode recognition method. The results demonstrate the algorithm’s effectiveness in recognizing various map group patterns and confirm its alignment with human cognition.
Despite the contributions of this study, the proposed algorithm has several limitations. For instance, when grid-like road networks contain nearly circular arcs, the direction distribution of edges becomes more dispersed, leading to higher directional entropy values. This can result in the misclassification of grid-type road networks as irregular-type ones. Additionally, the algorithm may mistakenly identify overpass patterns in road networks as irregular patterns. To address these issues, future research could explore the incorporation of additional feature parameters or improvements in the graph construction methods. These optimization strategies will be the focus of subsequent studies in this field.


