Article

Spatiotemporal Distribution and Evolution of Global World Cultural Heritage, 1972–2024

1
Department of Urban Construction, Beijing University of Technology, Beijing 100124, China
2
College of Architecture, Nanyang Institute of Technology, Nanyang 473006, China
*
Author to whom correspondence should be addressed.
ISPRS Int. J. Geo-Inf. 2025, 14(5), 190; https://doi.org/10.3390/ijgi14050190
Submission received: 3 March 2025 / Revised: 12 April 2025 / Accepted: 16 April 2025 / Published: 30 April 2025

Abstract

:
Taking 992 world cultural heritage (WCH) sites as the research object, the spatial distribution and evolution characteristics of WCH were analyzed by kernel density analysis, mathematical statistics, standard deviation ellipse, among other methods, and nine correlation factors were selected to explore the mechanism underlying the spatial and elevation-dependent distribution patterns of WCH and their sensitivity to climate change by using geographic detectors and multi-scale geographically weighted regression (MGWR) models. The results show the following: (1) The spatial distribution type of WCH is aggregation, and 80% of WCH are clustered below 500 m, with Europe and Asia-Pacific as the primary hotspots. (2) The distribution of WCH tends to be global and in the direction of “W-WN” to “E-ES”, and the average center movement direction is “E → EN → ES → E”. There is a trend of positive east–west distribution on the whole. (3) Road density, per capita GDP, and other factors are the dominant factors affecting the spatial pattern of world cultural heritage, and the interaction between the factors shows a nonlinear enhancement or two-factor enhancement trend. (4) There are spatial differences in the mechanisms of the factors, with river density contributing positively, aspect rate and forest cover contributing negatively, population density, per capita GDP, and road density mainly contributing positively to the spatial distribution of the WCH, annual precipitation mainly contributing negatively, and the positive and negative effects of altitude and GDP being comparable. Based on the above-mentioned differences in spatial distribution, evolutionary characteristics, and mechanism of action, the causes are discussed, and some suggestions for developing and protecting the world cultural heritage are presented.

1. Introduction

In the 1950s and 1960s, the world witnessed significant threats to cultural and natural heritage due to wars, natural disasters, and large-scale development projects. One of the most notable examples was the construction of the Aswan High Dam in Egypt, which threatened to submerge ancient Nubian monuments, including the iconic Abu Simbel temples. In response, UNESCO launched the “Nubia Campaign” in 1960, a massive international effort that successfully relocated these monuments to higher ground [1]. This campaign not only saved the sites but also demonstrated the potential for international cooperation in heritage preservation. In 1972, the 17th General Conference of UNESCO adopted the “Convention Concerning the Protection of the World Cultural and Natural Heritage” (commonly known as the World Heritage Convention) [2]. This landmark treaty defined the concept of “World Heritage” and established a framework for its identification, protection, and conservation. The Convention categorizes world heritage into three types—cultural, natural, and mixed properties. Cultural heritage includes monuments, groups of buildings, and sites, while natural heritage encompasses natural features, geological and physiographical formations, and areas of outstanding universal value from the perspectives of science, conservation, or natural beauty [3]. The first World Heritage List was published in 1978, featuring 12 sites, including the Aachen Cathedral in Germany and the Galápagos Islands in Ecuador [4]. Since then, the list has grown significantly, with new sites being added annually through the deliberations of the World Heritage Committee.
World cultural heritage (WCH) provides critical insights into past civilizations, revealing societal evolution through archaeological studies. Research on construction techniques also guides modern conservation efforts. Understanding how these sites were built and maintained in the past is crucial for developing effective preservation strategies [5]. Research on cultural heritage sites is vital for informing sustainable development practices and ensuring that economic growth does not compromise cultural and natural resources. This includes developing guidelines for responsible tourism, urban planning, and infrastructure development. Engaging local communities in the research and management of these sites is crucial for their long-term sustainability, as community-based research can provide valuable insights into traditional knowledge and practices that are essential for preservation [6,7]. Studying the vulnerability of cultural heritage sites to climate change is critical. Research on the impacts of rising temperatures, sea-level rise, and extreme weather events helps develop adaptation and mitigation strategies, ensuring the protection and resilience of these invaluable assets. In summary, research on cultural heritage is essential for historical and cultural understanding, modern conservation, sustainable development, community engagement, and climate change resilience.
WCH is uniquely vulnerable to the impacts of human production and life activities. This susceptibility stems from their intrinsic characteristics, which make them distinct from natural heritage sites. Cultural heritage sites are often composed of buildings, monuments, and artifacts that are the result of human creativity and craftsmanship. The materials used in cultural heritage sites, such as stone, wood, metal, and ceramics, can be highly sensitive to environmental conditions and human activities. Cultural landscapes, including both urban and rural settings, are shaped by long-term human interaction with the environment, which reflects how societies have adapted to and modified their surroundings over time. The integrity of cultural landscapes is often tied to their broader context, including the surrounding environment, traditional practices, and community use [8,9]. Changes in this context, such as urban expansion or agricultural intensification, can significantly alter the site’s character and authenticity. High levels of tourism can lead to the physical wear and tear of cultural sites. Overcrowding, vandalism, and the strain on local infrastructure can all contribute to the deterioration of these sites. While tourism can bring economic benefits, it can also lead to gentrification, the displacement of local communities, and changes in the traditional use of the site. Balancing tourism with the preservation of the site’s integrity is a significant challenge [10,11].
While the vulnerability of cultural heritage is widely acknowledged, its spatial heterogeneity and driving mechanisms remain poorly understood. For instance, sub-Saharan Africa faces the dual threats of looting and natural disasters due to limited monitoring technologies and extreme climate events, whereas Europe, despite its economic advantages, grapples with commercialization risks from overtourism and urbanization [10,12]. The existing studies often focus on single-scale analyses (global or local), neglecting cross-scale interactions between natural and socioeconomic factors. To address this, our study integrates geographic detectors and multi-scale geographically weighted regression [4], aiming to unravel the multi-layered drivers of vulnerability and inform context-specific conservation strategies.
Recent advances in digital technologies have further expanded the methodologies for studying cultural heritage [13]. Notably, social media platforms have emerged as innovative data sources for analyzing public engagement [14] and spatial–temporal visitation patterns. For instance, geotagged photos from tourism platforms were used to map visitor flows at UNESCO sites [15], revealing seasonal overcrowding risks in heritage hotspots. Similarly, a sentiment analysis of social media content combined with GIS tools provided insights into community perceptions of heritage authenticity and value [4]. These approaches demonstrate how user-generated content can complement traditional datasets (e.g., satellite imagery or census data) by capturing dynamic human behaviors and intangible cultural dimensions. However, challenges remain in integrating social media’s real-time granularity with long-term preservation strategies, particularly for balancing tourism promotion and conservation priorities [10].
Research on the geospatial aspects of World Heritage sites around the world has become increasingly important for understanding their distribution, vulnerability, and management. One key direction is spatial analysis and mapping, which uses Geographic Information Systems (GIS) and remote sensing to map and analyze the physical and environmental characteristics of these sites [16,17]. For example, the use of satellite imagery to identify and monitor Egyptian archaeological sites revealed previously unknown structures and helped to protect these sites from looting and urban encroachment [13]. Another significant area is spatial distribution and clustering, which examines the patterns and concentrations of World Heritage sites. For example, using standard deviation ellipses and kernel density estimation, scholars analyzed the distribution of World Heritage sites in China and identified hotspots and regions of high cultural and natural significance [15]. Additionally, geospatial risk assessment focuses on evaluating the vulnerability of these sites to natural and human-induced threats [18]. Finally, community-based geospatial research involves engaging local communities in the mapping and management of heritage sites. For example, scholars have compared approaches to community participation in cultural heritage management around the following four themes: participating communities, methods of participation, levels of participation, and measures taken in cultural heritage management [14]. These diverse geospatial research directions collectively contribute to a more comprehensive and nuanced understanding of World Heritage sites, supporting their effective conservation and management.
Research on the spatial distribution of World Heritage sites reveals a complex interplay of geopolitical, economic, cultural, environmental, and policy factors. First, in terms of geopolitical and economic influences, scholars used mixed methods to show how political stability and economic development have significantly affected the designation and management of these sites [12]. Second, case studies were used to emphasize the role of local governance, cultural significance, and environmental protection efforts [19,20]. Third, on the policy and regulatory side, scholars used comparative analysis to assess the impact of international policy and regulatory frameworks on the designation process [21]. These diverse research directions collectively provide a comprehensive understanding of the factors that shape the global distribution of World Heritage sites, supporting their effective management and preservation.
While prior research has significantly advanced our understanding of cultural heritage distribution patterns and influencing factors, the following three aspects warrant further exploration to deepen multi-scale spatial analysis and conservation applications: (1) Does the global distribution of world cultural heritage exhibit significant multi-scale heterogeneity, such as divergent effects of natural factors (e.g., elevation, precipitation) and socioeconomic factors (e.g., road density, per capita GDP) across geographic scales [19]? (2) How do natural and socioeconomic factors interact across scales (e.g., nonlinear or two-factor enhancement) to shape heritage spatial patterns, and are these interactions modulated by regional cultural or historical contexts? (3) How can multi-scale mechanisms inform differentiated conservation strategies to address compound pressures from climate change and human activities?
This study takes global WCH as the research object and comprehensively applies the methods of metrological geographic analysis, GIS spatial analysis, and probes to analyze and quantify the spatial distribution of world cultural heritage and explore the main influencing factors (Figure 1), which will help protect world cultural heritage in a more scientific manner and provide a suitable foundation and reference point for its conservation in the future [22].

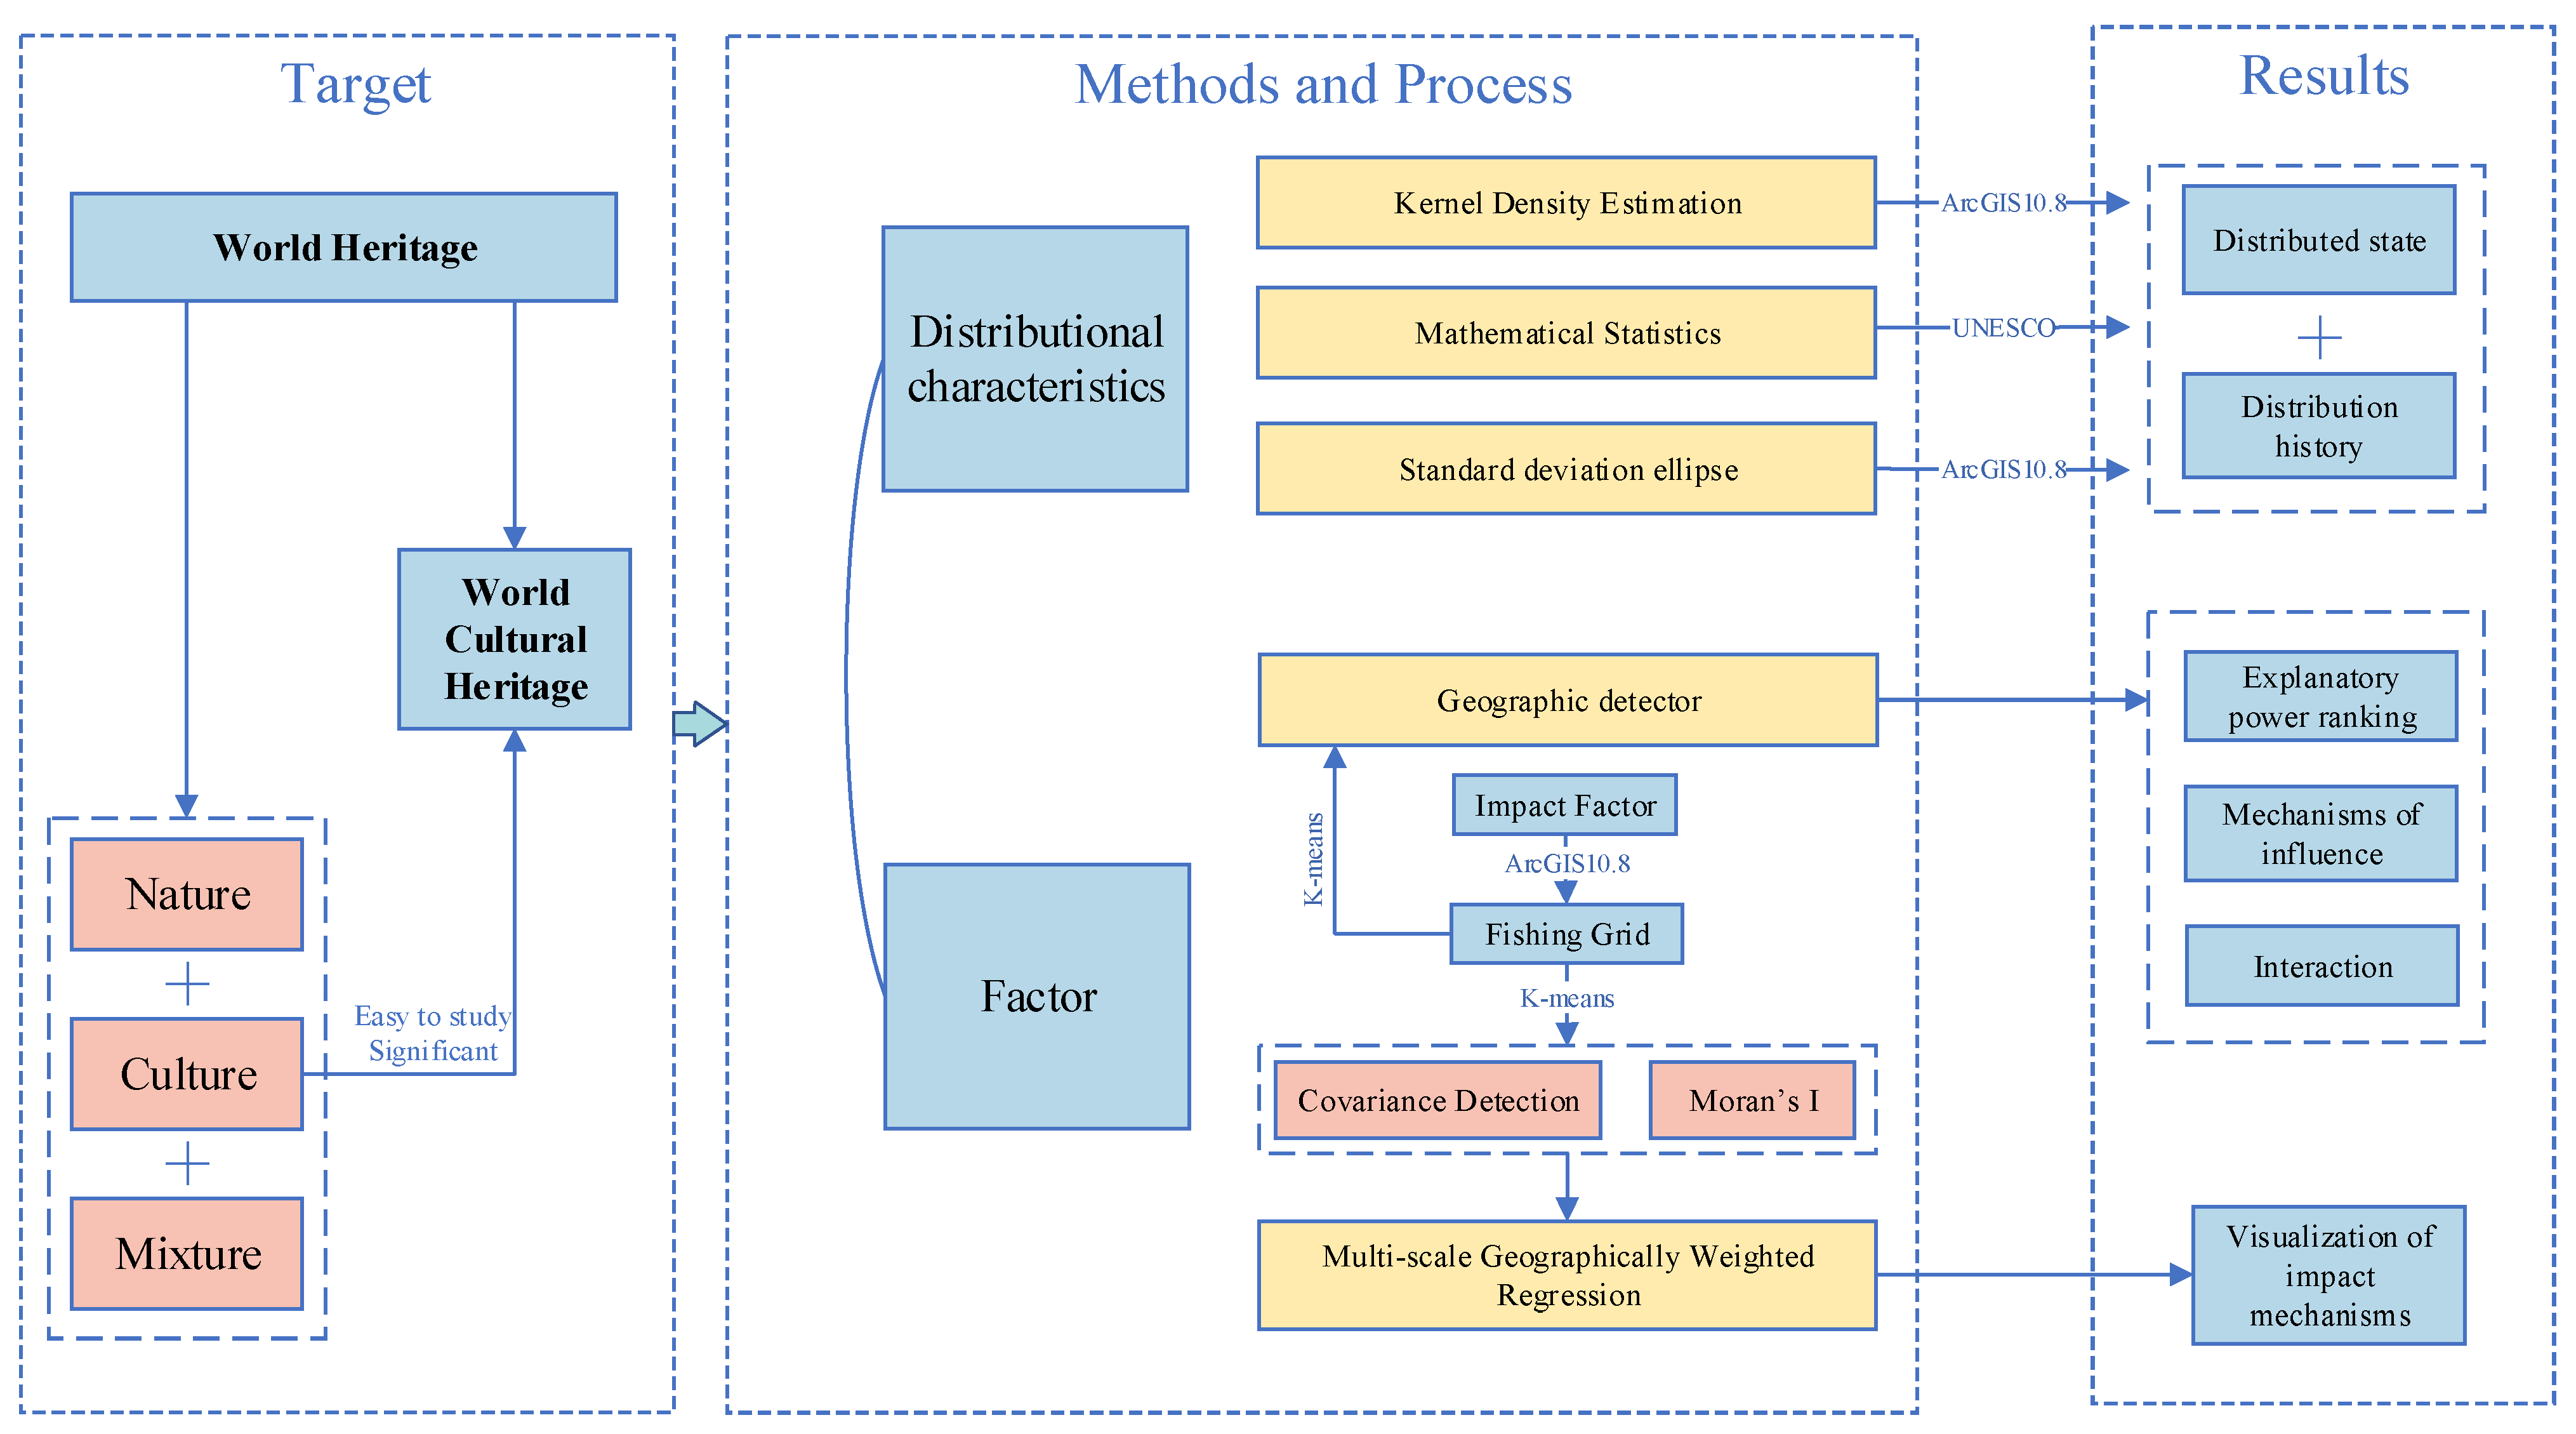
2. Materials and Methods

2.1. Materials and Data Processing

The WCH initiative is an international convention established by the United Nations and implemented by UNESCO, which is aimed at safeguarding natural and cultural sites of exceptional universal value to humanity across the globe. From historical, artistic, or scientific perspectives, WCH encompasses a collection of edifices, inscriptions, and paintings that possess outstanding universal significance, as well as individual or interconnected groups of buildings distinguished by their architectural style, uniform distribution, or harmonious integration with the surrounding landscape. Furthermore, from historical, aesthetic, ethnographic, or anthropological perspectives, a WCH site may also represent places of exceptional universal value, such as remarkable feats of human engineering or collaborative works of nature and humanity, including significant archaeological sites.
As of December 2024, a total of 1223 properties have been inscribed on the World Heritage List, comprising 952 cultural heritage sites, 231 natural sites, and 40 that embody a blend of both cultural and natural heritage. This research specifically examines 992 WCH, inclusive of 952 cultural heritage sites and 40 mixed heritage sites. The data utilized in this study incorporate the following: (1) The World Heritage List published by the UNESCO World Heritage Center, from which a total of 992 sites (as of 2024) with cultural attributes (including geocoordinates and inscription years) were extracted [23]; (2) natural factors such as the Global 60-arcsecond-resolution Digital Elevation Model (DEM) data, derived from the ETOPO Global Relief Model, which serve to extract elevation, slope, aspect, and other topographical variables [24], as well as data on annual precipitation (NASA), forest cover (MODIS), and river density (HydroSHEDS) at a 1 km resolution; (3) socioeconomic data including population density (LandScan), GDP (World Bank), and road density (Open Street Map), partially at a 250 m resolution. To harmonize the multi-source data spatially and ensure comparability, this study adopted a 250 × 250 km2 grid as the unified analytical unit, justified by physical geography data (e.g., DEM, precipitation) from high-resolution remote sensing (1–10 km2) and socioeconomic data (e.g., GDP, population) aggregated by administrative units, which were balanced at 250 km2 to retain environmental details while enabling cross-source comparability. With 13,861 global cities [25] and 16,382 grid units, the 1:1 coverage ratio mitigates sampling biases from uneven urban distribution.
To study the evolution of the spatial equilibrium of distribution among the WCH sites, they are divided into five distinct time periods from 1978 to 2024, each spanning ten years as follows: 1978–1984 (Stage I), 1985–1994 (Stage II), 1995–2004 (Stage III), 2005–2014 (Stage IV), and 2015–2024 (Stage V).

2.2. Methods

2.2.1. Kernel Density Estimation

KDE is a spatial statistical technique that estimates the concentration of point features (e.g., cultural heritage sites) across a study area. It generates a smoothed density surface, where higher values indicate greater clustering, providing an intuitive representation of the degree of clustering and spatial distribution of WCH across various types and developmental stages. KDE identified high-density clusters (e.g., Europe) and low-density regions (e.g., Africa) of WCH. As outlined in Equation (1), the density of each WCH within a specified central distance is computed and then superimposed at identical locations to generate a comprehensive density distribution map [20].
  f ( x ) = 1 n h i = 1 n k ( x x i h )
In this formula, x is the position of the WCH to be estimated; x i represents the position of the i -th estimated WCH that falls within the range of a circle with x as the center and h as the radius; and k ( x x i h ) is the kernel function. The larger the value of f ( x ) , the denser the concentration of points, and the higher the probability of occurrence.

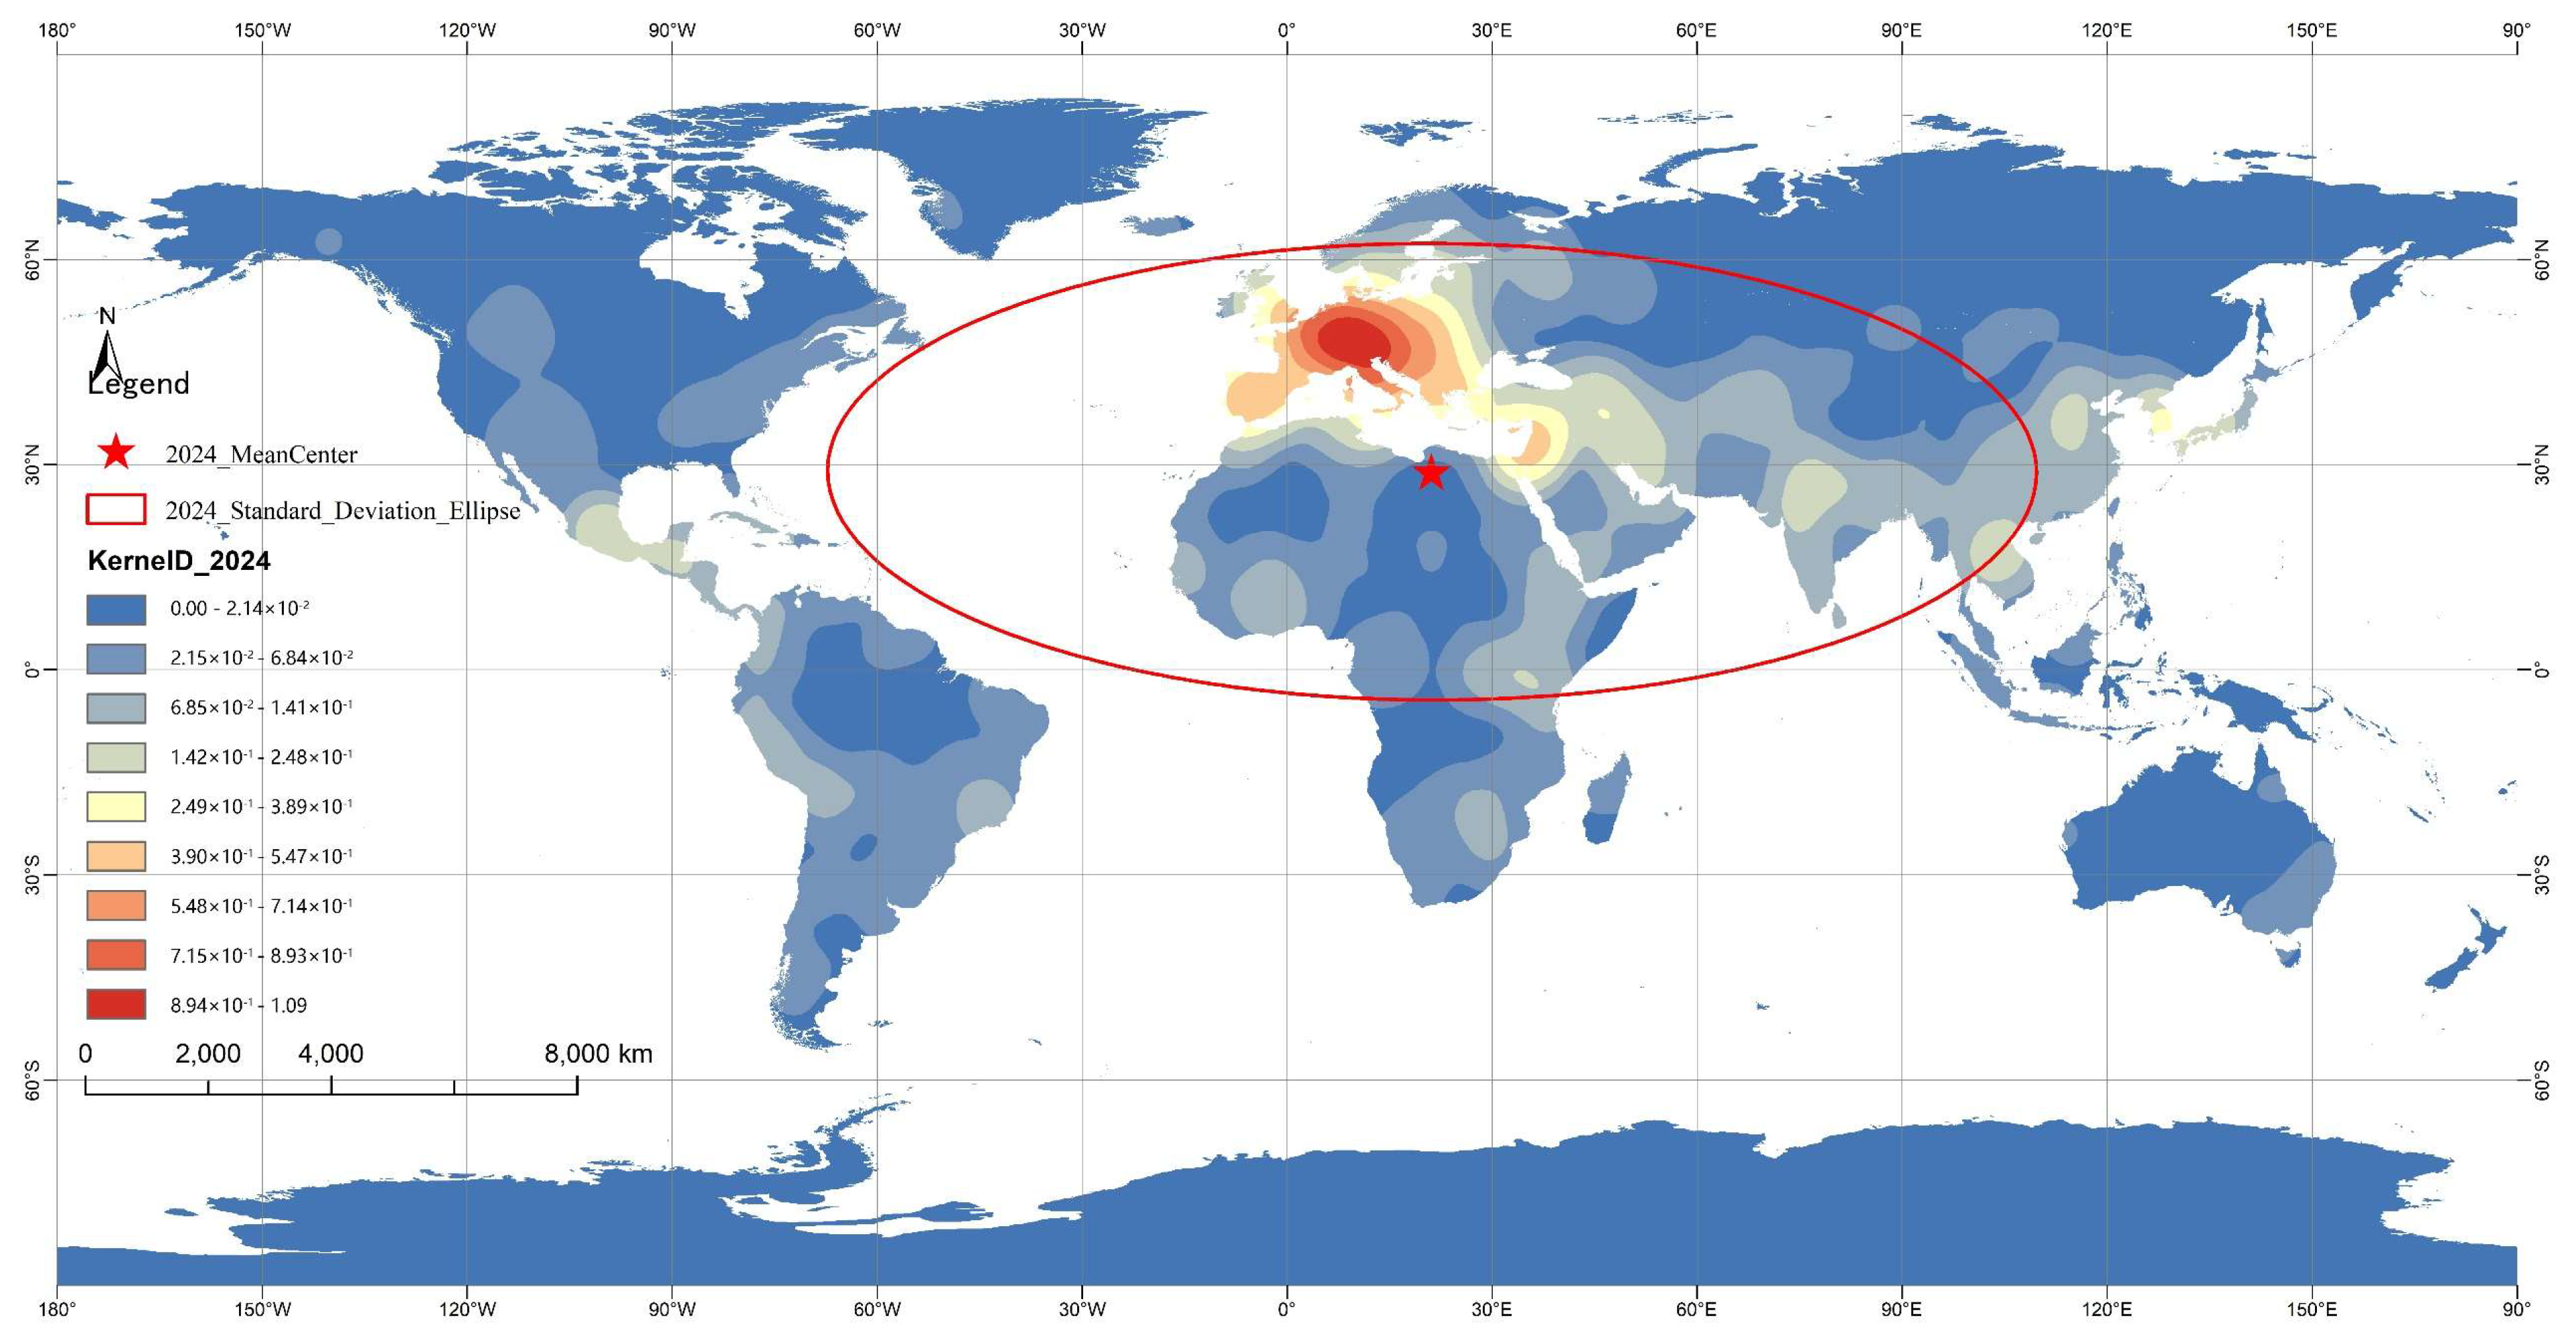
2.2.2. Standard Deviation Ellipse

The standard deviation ellipse constitutes a spatial statistical technique that quantitatively characterizes the spatial and temporal distribution attributes of the research subject [26]. This method focuses on the center of gravity of the spatial distribution of WCH as its focal point, utilizing the lengths of the long and short axes and the azimuth angle as fundamental parameters. Specifically, the center of gravity denotes the average center, the long axis indicates the primary trend direction, and the short axis delineates the range of distribution. By calculating the standard deviations of the long and short axes of the ellipse, one can elucidate the directional changes and distribution patterns of WCH [27]. The formulas pertinent to the center of the ellipse, azimuth, and the X and Y axes are delineated in Equations (2)–(4).
S D E x = i = 1 n ( x i X ¯ ) 2 n , S D E y = i = 1 n ( y i Y ¯ ) 2 n
σ x = 2 i = 1 n ( x i ˜ cos θ y i ˜ sin θ ) 2 n ,   σ y = 2 i = 1 n ( x i ˜ sin θ y i ˜ cos θ ) 2 n
tan θ = ( i = 1 n x i ˜ 2 y i ˜ 2 ) + ( i = 1 n x i ˜ 2 i = 1 n y i ˜ 2 ) 2 + 4 ( i = 1 n x i ˜ y i ˜ ) 2 2 i = 1 n x i ˜ y i ˜
where x i ,   y i are the center coordinates of each legacy, x i ˜ , y i ˜ is the difference between the mean center and the X and Y coordinates of the i -th WCH, θ is the elliptical azimuth (the angle formed by rotating from due north along the clockwise direction to the main axis), X ¯ , Y ¯ are the arithmetic mean centers, and n is the total number of different types of WCH.

2.2.3. Geographic Detector

Geographic detector is a research method for analyzing the formation mechanism, driving factors, and interaction degree of the spatial hierarchical heterogeneity of geographical phenomena. In this paper, factor detection and interaction detection were used to study the influencing factors of the spatial distribution differences of world cultural heritage and the degree of interaction between them [28]. Factor detection, which can quantitatively explain the degree to which the independent variable explains the spatial differentiation of the dependent variable, is as follows:
q = 1 SSW SST = 1 h = 1 L N h σ h 2 N σ 2
where q = 1 , ,   L is the partition of the dependent variable (built heritage) or independent variables (influencing factors); N h and N are the number of units in layer h and the total area, σ h 2 and   σ 2   a are the variances of the dependent variable in layer h and the total area, SSW and SST are the within-layer variances and the total variance of the entire area; and q ranges from 0 to 1, with larger values indicating stronger explanatory power of the independent variable on the dependent variable, and smaller values indicating weaker explanatory power. The interaction detection model is used to identify the interactions between different driving factors and analyze the degree of influence of interaction enhancement or weakening on the spatio-temporal evolution, which mainly reflects five kinds of results, including nonlinear weaken q ( X 1 X 2 ) < m i n [ q ( X 1 ) ,   q ( X 2 ) ] ) , one-factor nonlinear weaken ( m i n [ q ( X 1 ) ,   q ( X 2 ) ] < q ( X 1 X 2 ) < m a x [ q ( X 1 ) ,   q ( X 2 ) ] ), two-factor enhancement ( q ( X 1 X 2 ) > m a x [ q ( X 1 ) ,   q ( X 2 ) ] ), independent interactions ( q ( X 1 X 2 ) = q ( X 1 ) + q ( X 2 ) ), and nonlinear enhancement ( q ( X 1 X 2 ) > q ( X 1 ) + q ( X 2 ) ).

2.2.4. Multi-Scale Geographically Weighted Regression
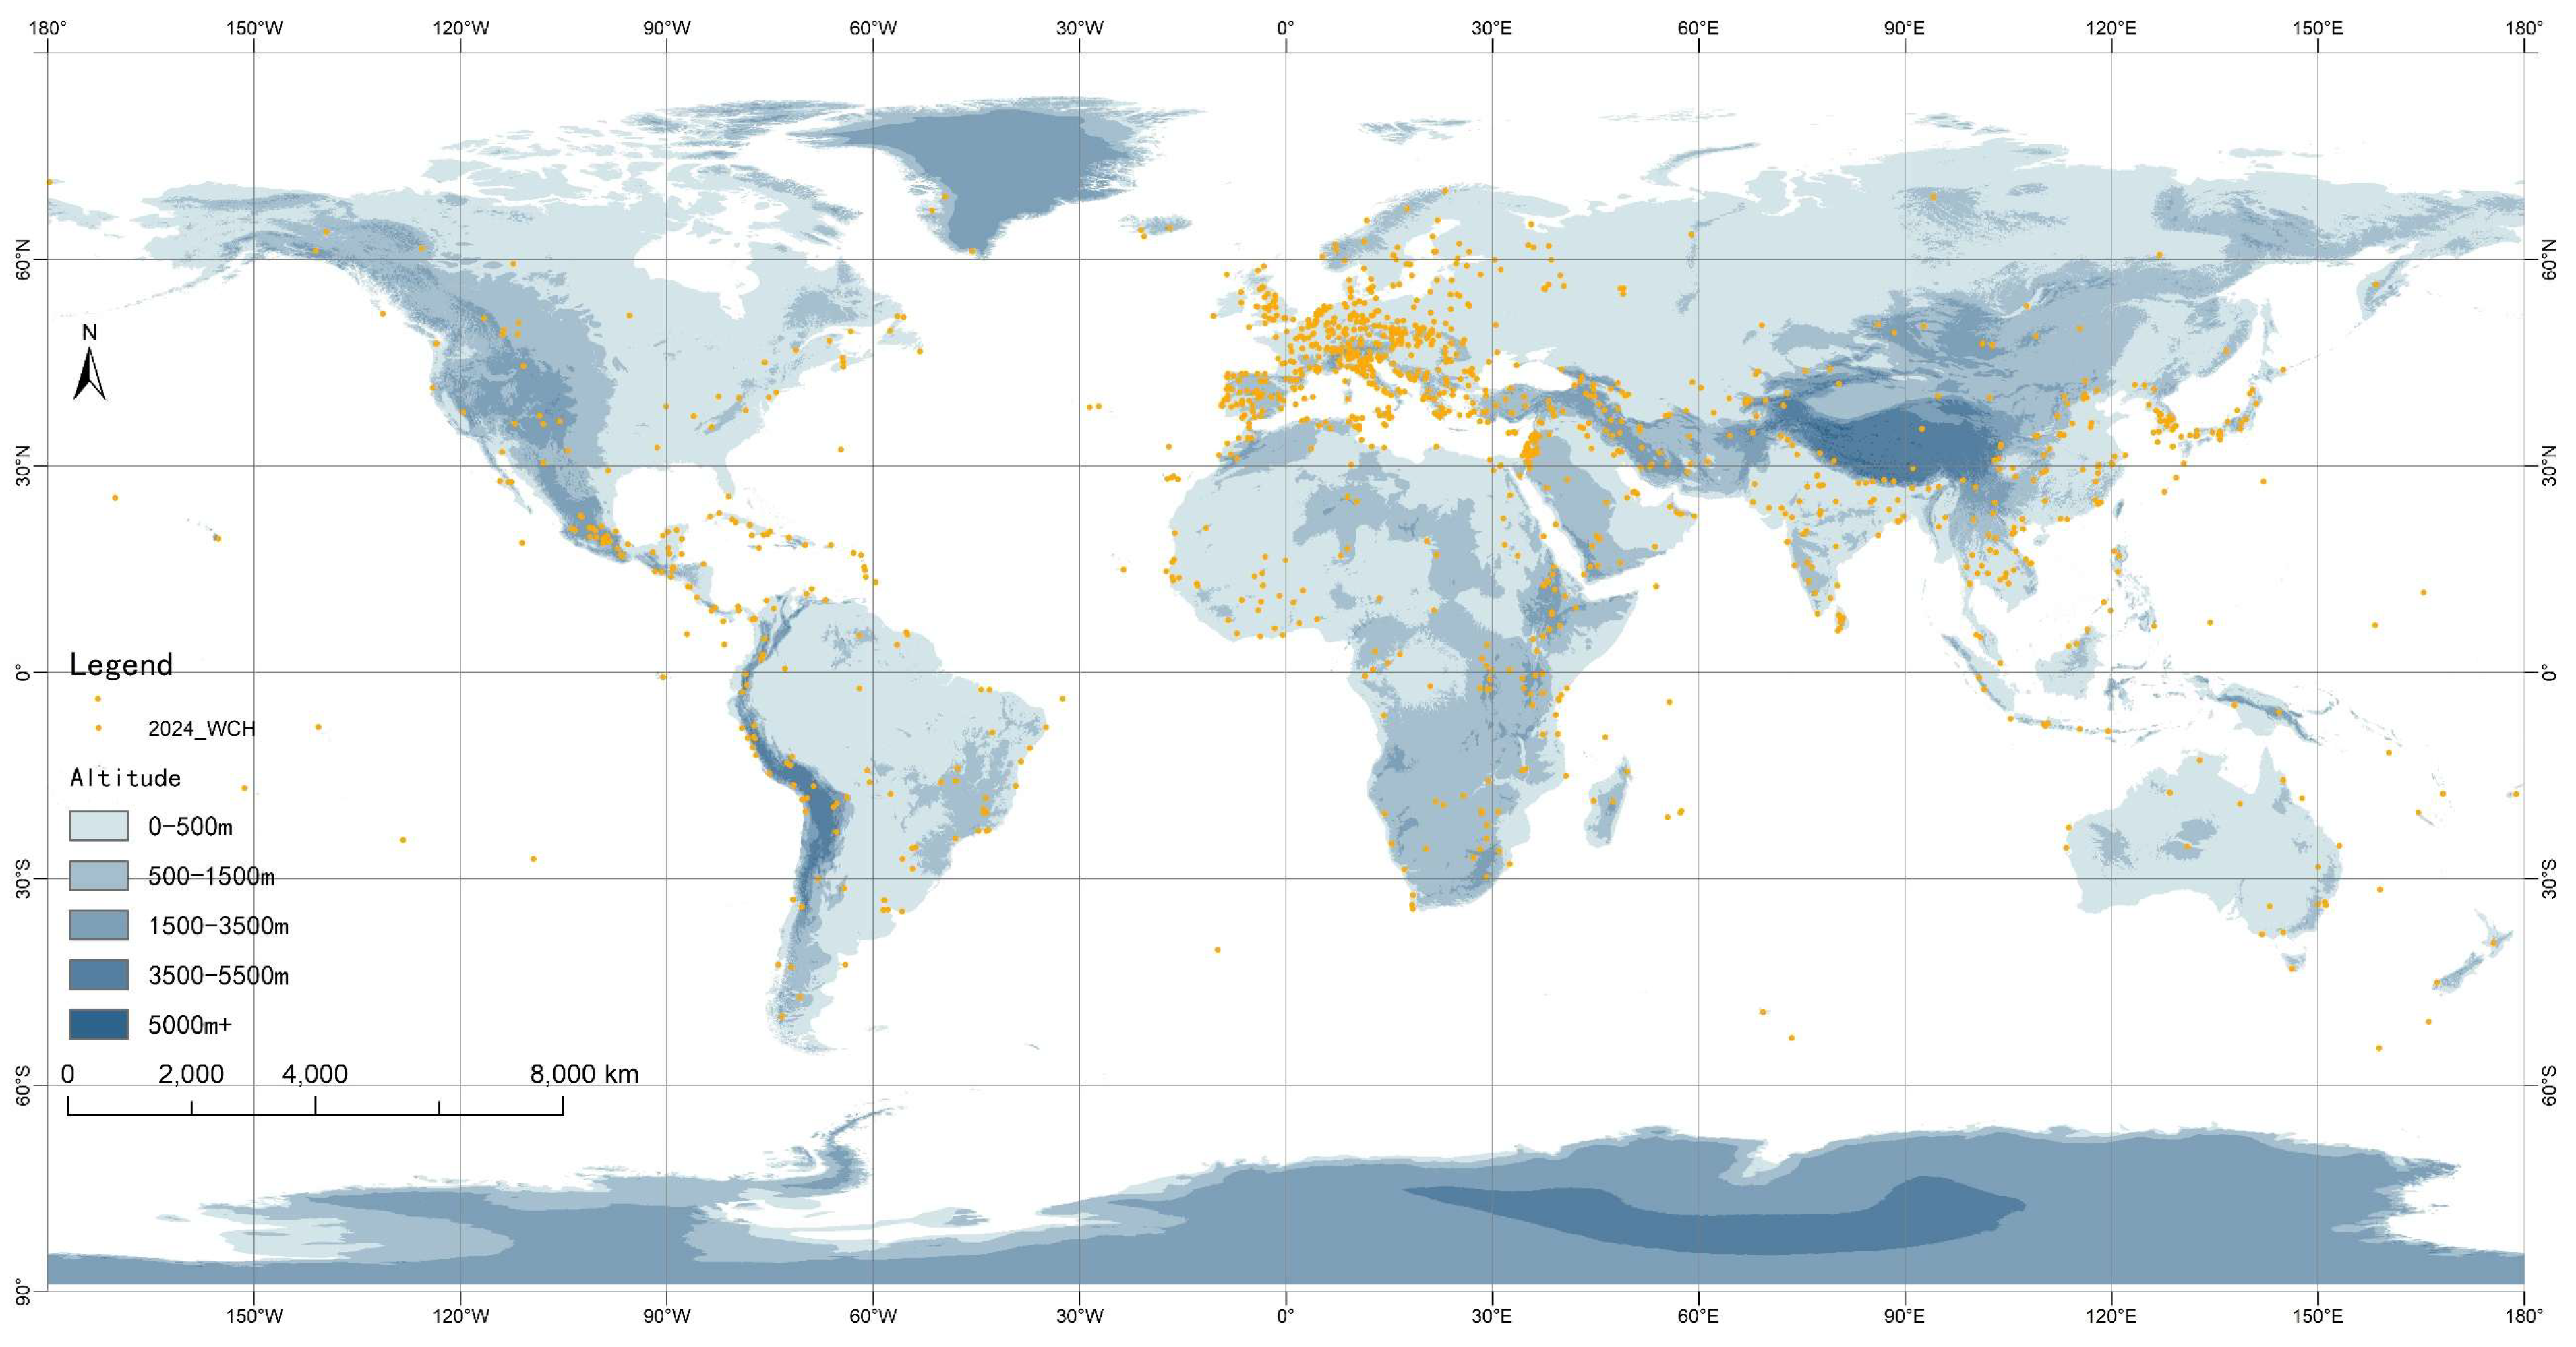
Multi-scale geographically weighted regression (MGWR) is a regression model proposed by Fotheringham, based on GWR, that considers the spatial bandwidth of differences in independent variables, which improves the limitations of bandwidth selection, enables different variables to choose different bandwidth values, better reflects the spatial heterogeneity between variables, and improves the accuracy of regression analysis [29]; it can be expressed as follows:
  Y i = β i 0 + k β i k X k i + ε i ,     i = 1 , 2 , , n .
Y i = β i 0 , b + k β i k , b X k i + ε i ,     i = 1 ,   2 ,     ,     n
Equation (6) is a classical geographically weighted regression model, where β i k is the regression coefficient of the sample point-i corresponding to the k-th independent variable, ε i is the random error term, k is the independent variable parameter in the following table, and n is the sample size to be calculated. Equation (7) is a multi-scale geographically weighted regression model, where β i k , b is the regression coefficient of the k-th variable under the condition of b bandwidth, and the rest of the magnitude means the same as Equation (6).

3. Results

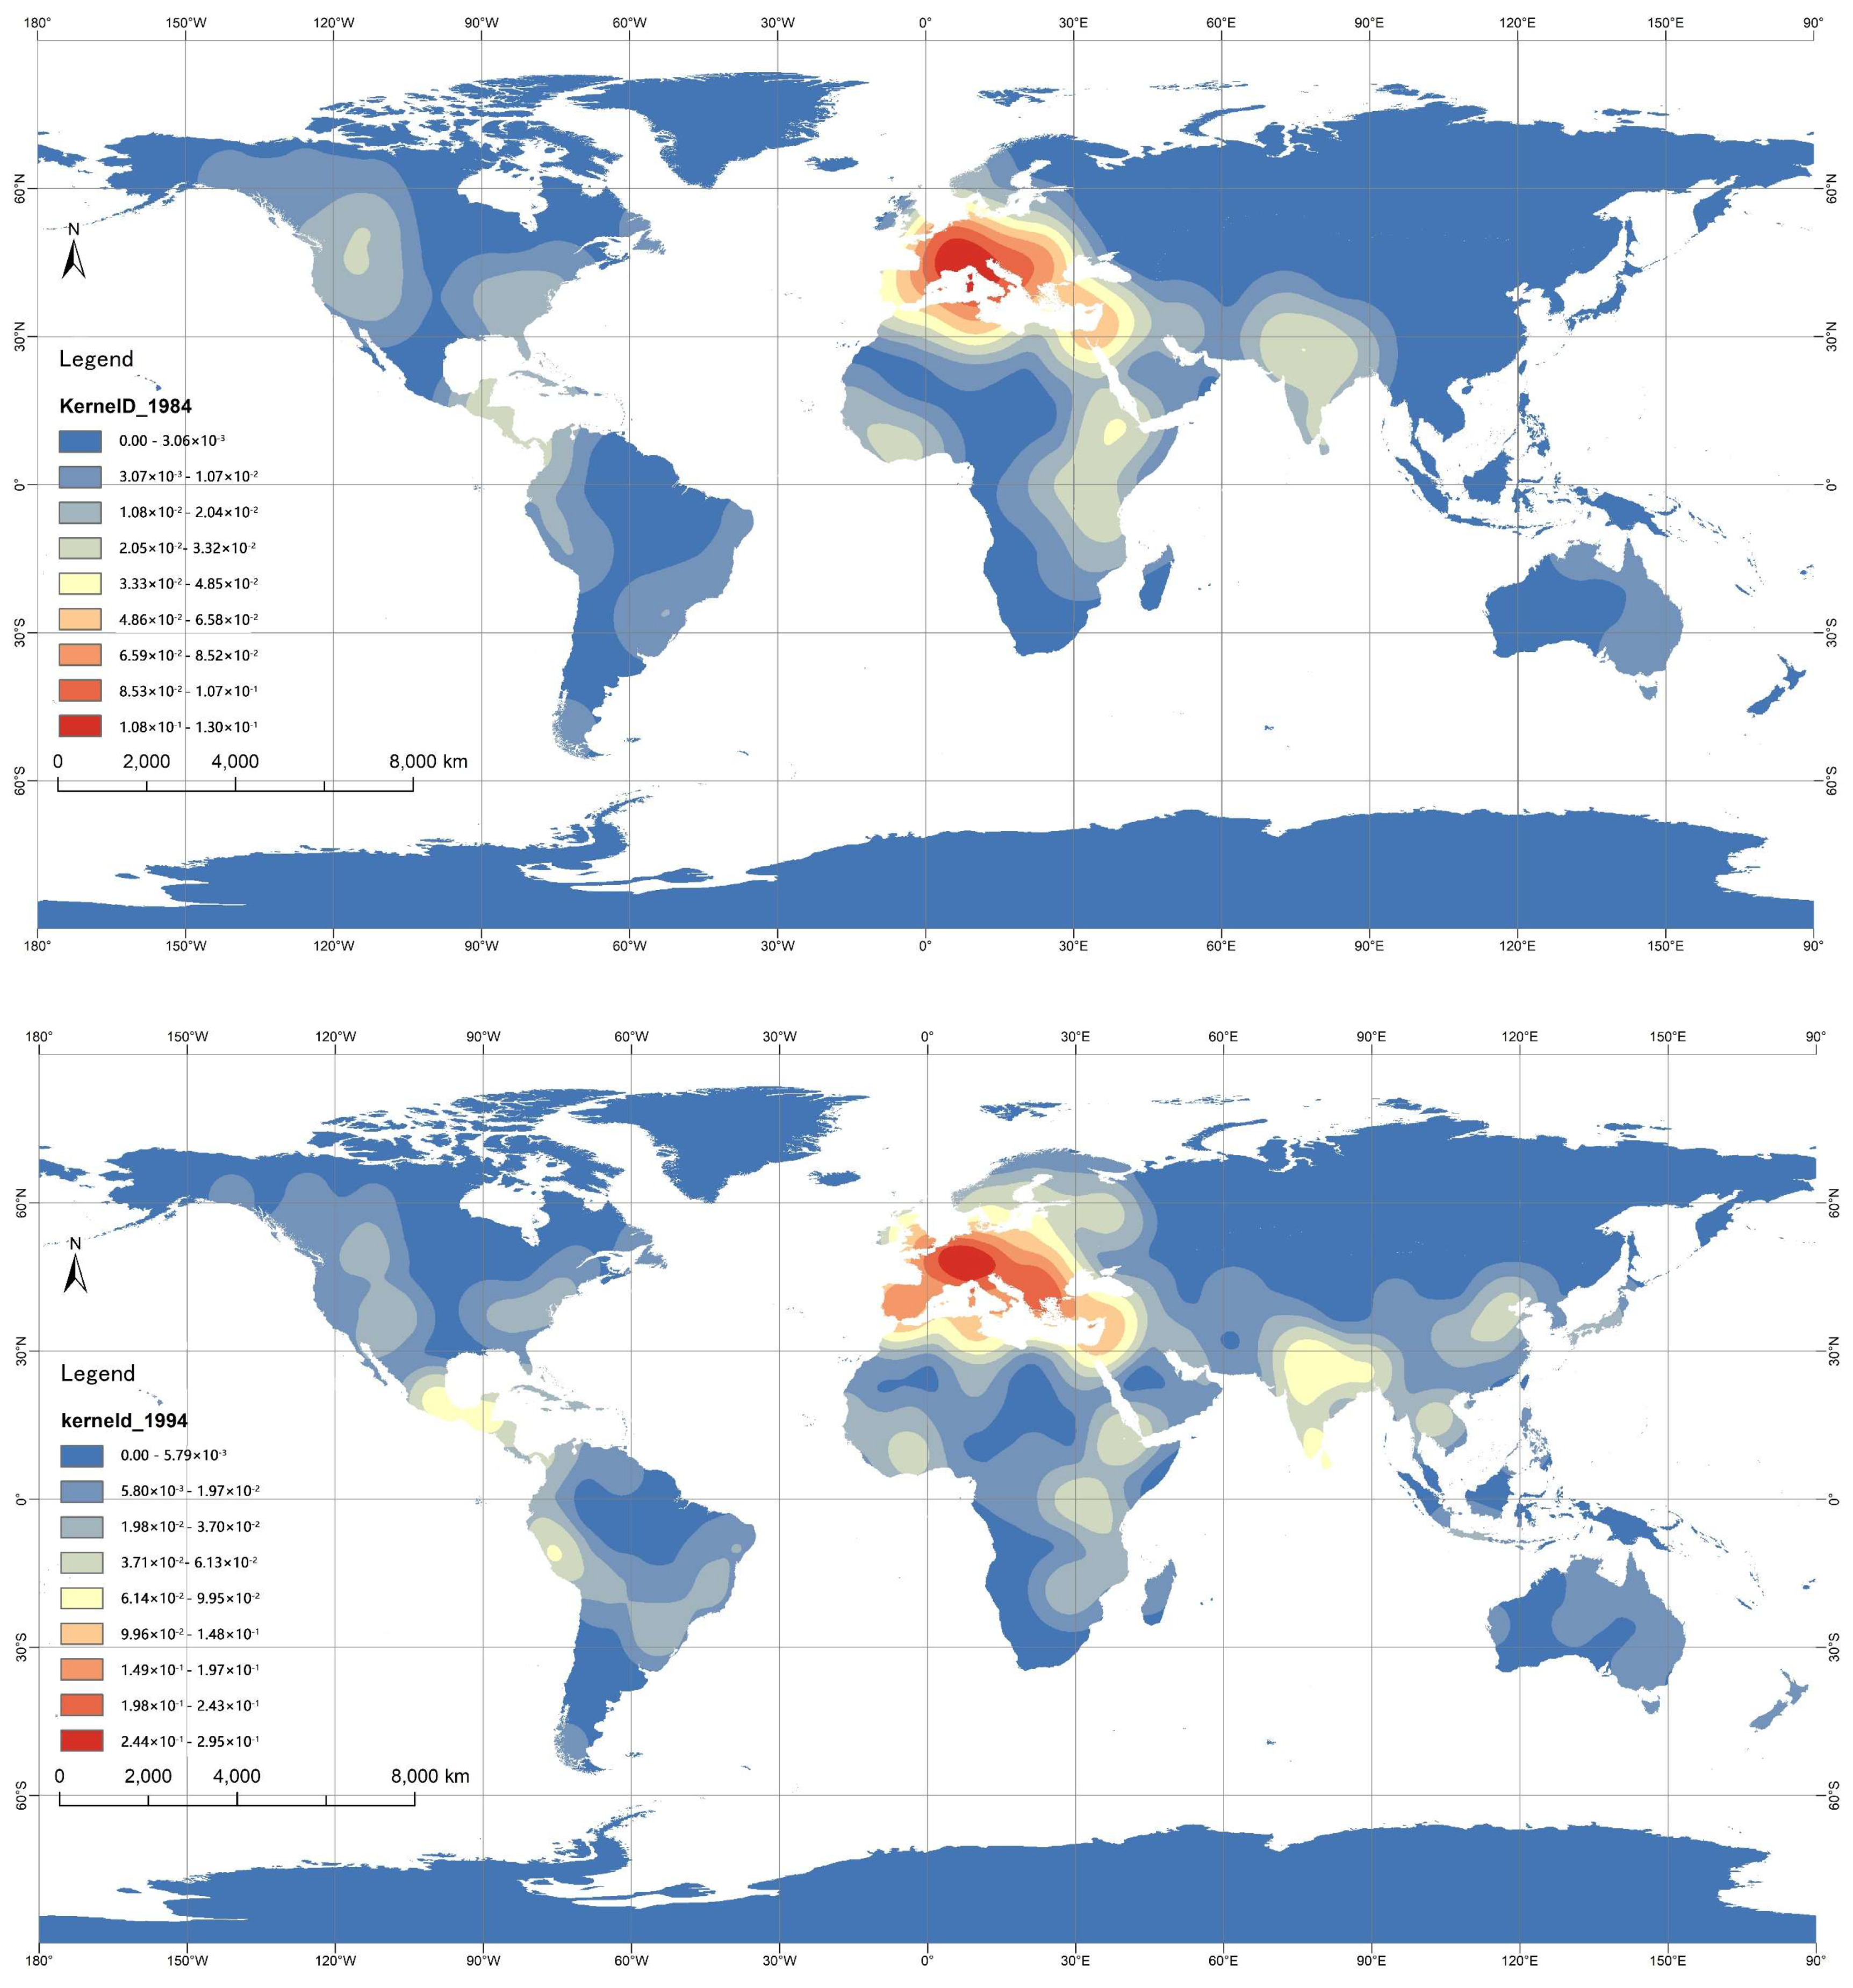
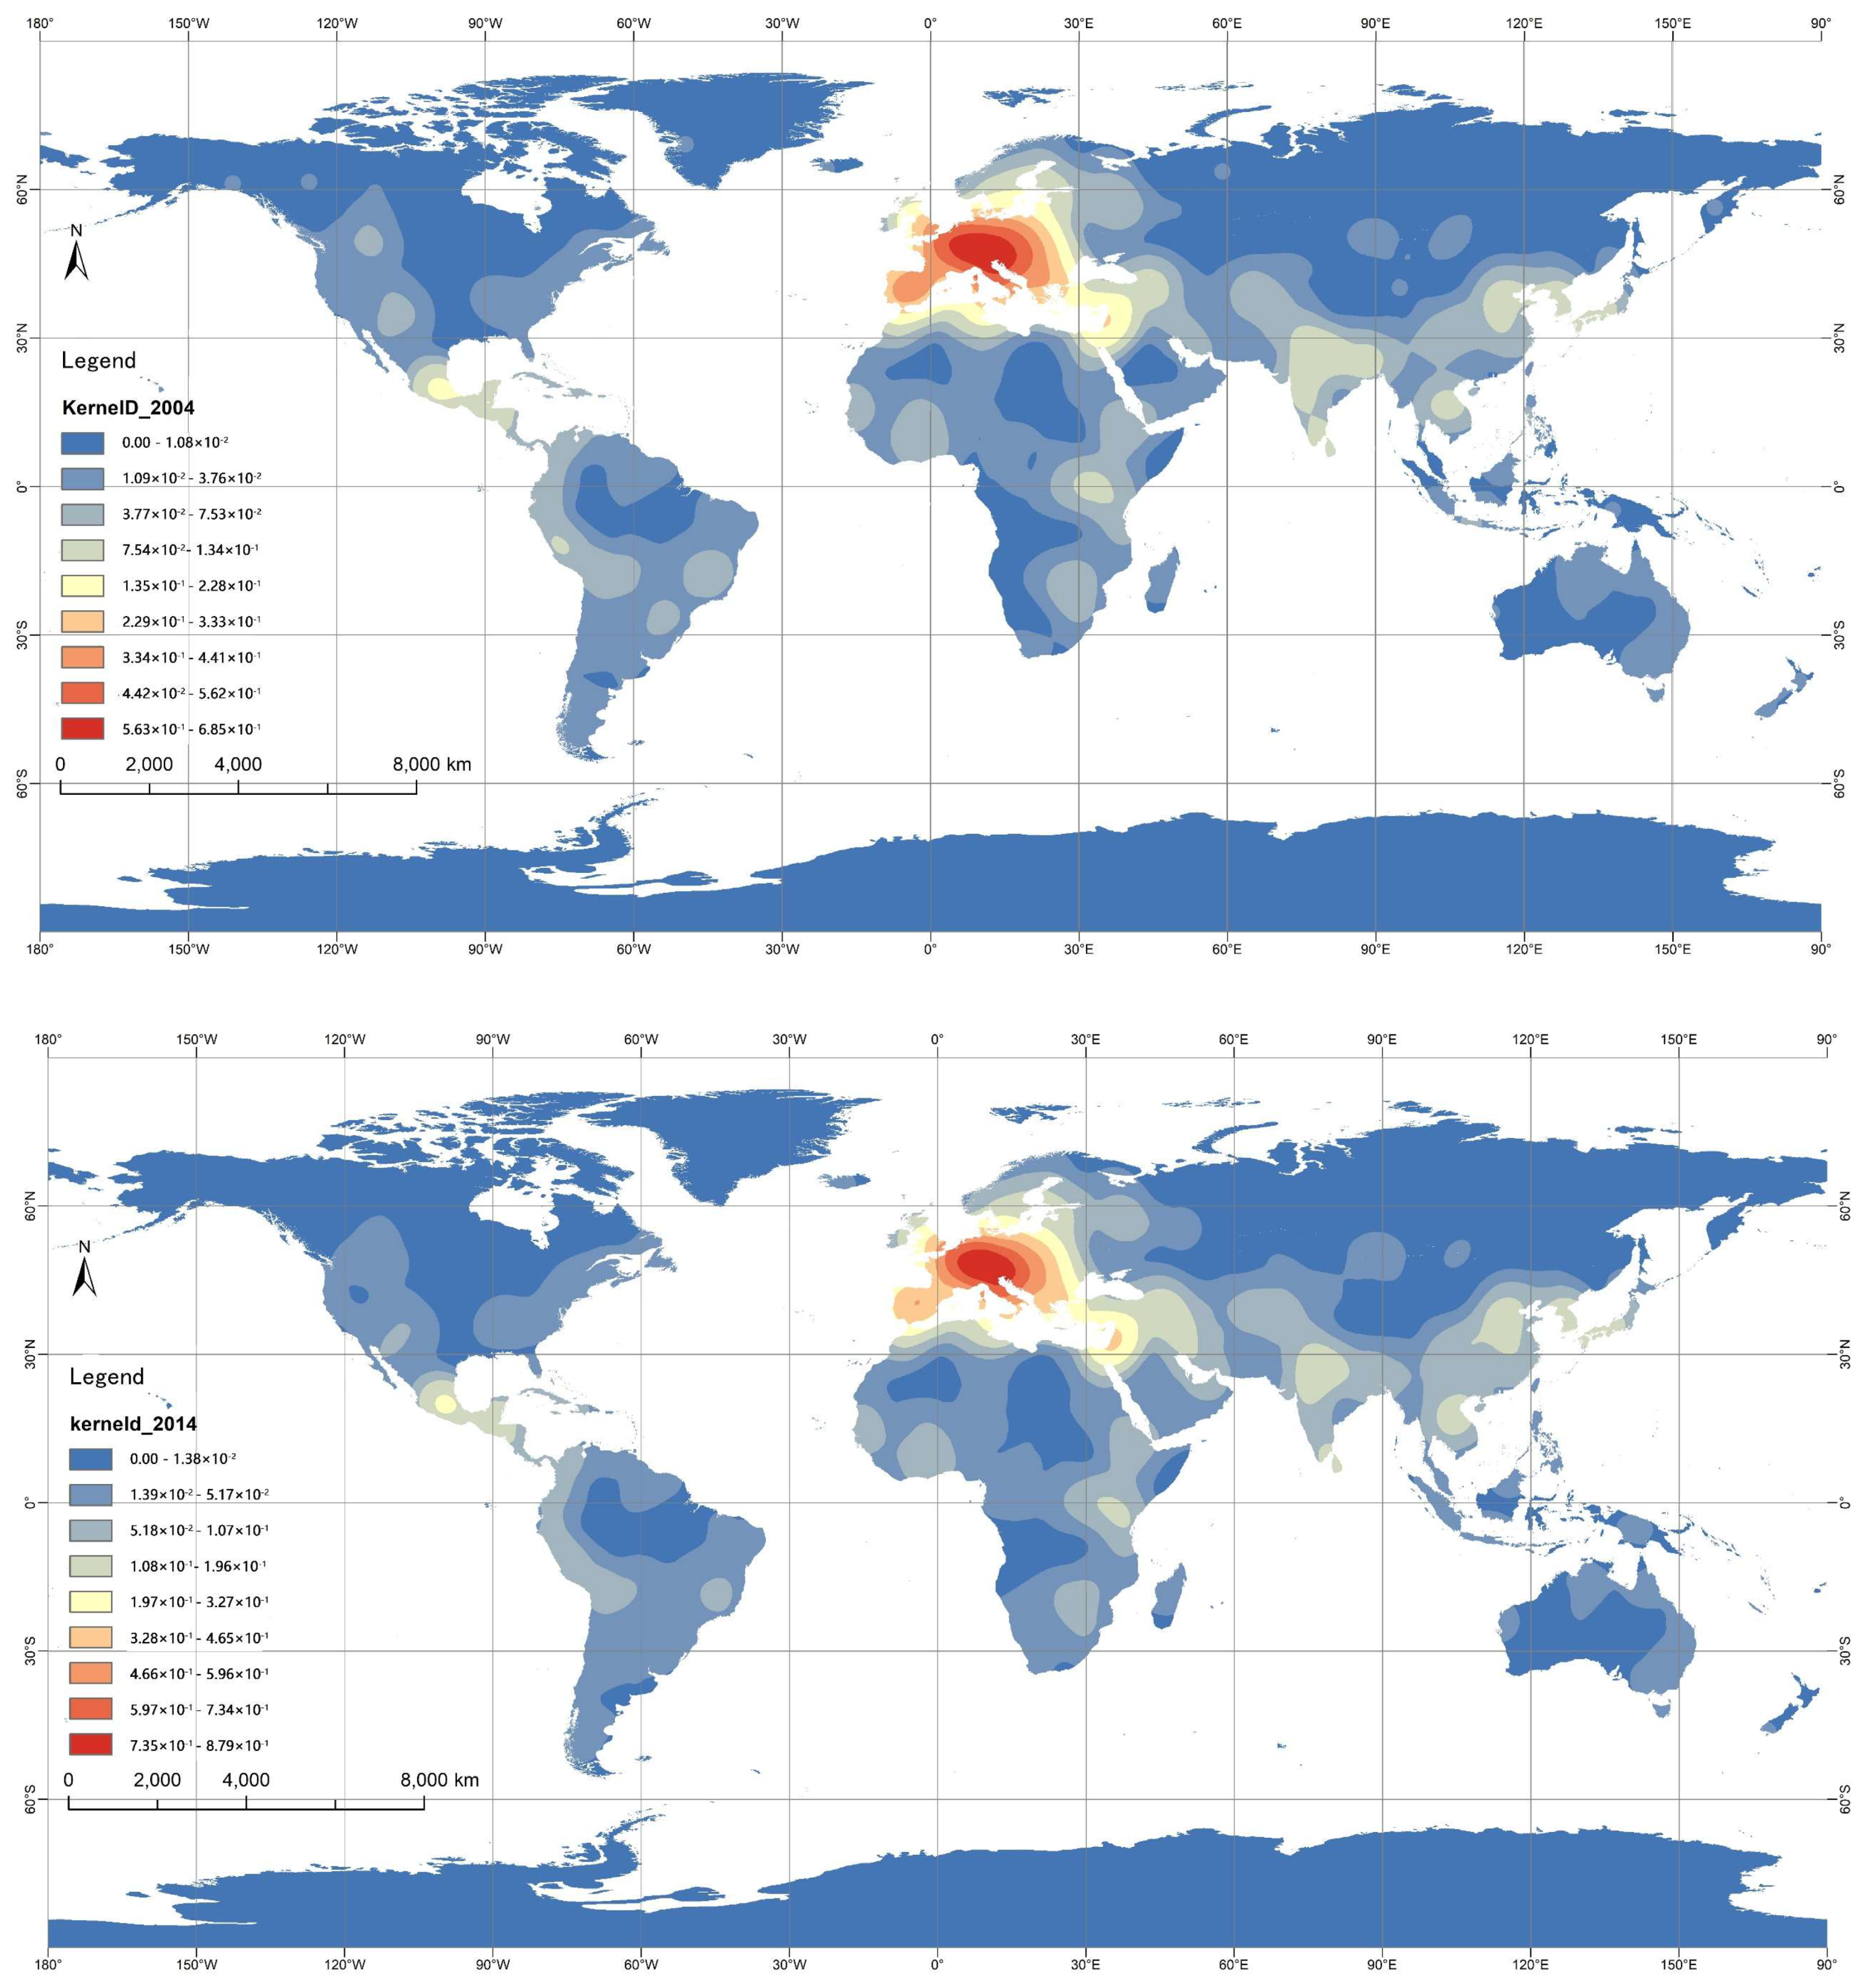
3.1. Spatial Distribution Characteristics

UNESCO categorizes World Heritage properties into the following five regions (Table 1): Latin America and the Caribbean (Area-A), Europe and North America (Area-B), Asia and the Pacific (Area-C), Arab States (Area-D), and Africa (Area-E). This classification builds on a geographical framework but adapts to cultural, linguistic, and administrative needs. Table 1 shows the number of WCH and WMH sites in the above-mentioned five regions. From the statistical results, it can be seen that the WCH sites are mainly distributed in Europe and North America, with a total of 573 sites, accounting for 46.85% of the world. This is followed by Asia and the Pacific (hereinafter referred to as Asia-Pacific) and Latin America and the Caribbean with 296 and 150 sites, respectively, accounting for 24.2% and 12.26% of the world. The Arab States and African regions have a smaller number of WCH sites. In addition, according to the International Common Classification of Altitude, the global land mass can be divided into low altitude (0–500 m), medium altitude (500–1500 m), high altitude (1500–3500 m), and extremely high altitude (above 3500 m), depending on the altitude. From the distribution results of WCH at different elevation levels (Figure 2), it can be seen that over 80% of WCH (675 sites) are distributed below 500 m, with a sharp decline observed at higher elevations, as follows: 500–1500 m (213 sites, 21.5%), 1500–3500 m (91 sites, 9.1%), and above 3500 m (0.12%). More than 80% of WCH sites in Area-A and Area-B are located at middle and low altitudes, with a small amount distributed at high altitudes, and none at the extremely high altitudes. Most of the WCH sites in the Asia-Pacific region, Africa, and Arab countries also exist at middle and low altitudes. Still, unlike Europe and the United States, the WCH sites of these regions have a certain distribution at high altitudes. There are also WCH sites at extremely high altitudes of the Asia-Pacific region and Africa. Overall, WCH sites tend to be at low and medium altitudes and decrease with increasing altitude.
To further explore the global distribution of WCH, the spatial distribution characteristics of WCH, including density and pattern, were calculated using kernel density analysis, average nearest neighbor, and statistical analysis in ArcGIS 10.8. To ensure a rigorous interpretation of the density patterns, we implemented the Natural Breaks (Jenks) classification method, dividing kernel density values into nine scientifically validated tiers, as follwos: high-density (top three tiers, KDM > 0.65), medium-density (middle three tiers, 0.21 ≤ KDM ≤ 0.65), and low-density areas (bottom three tiers, KDM < 0.21). This approach optimally captures spatial gradients while maintaining statistical validity. The results of kernel density analysis and mean nearest neighbor index show that WCH is unevenly distributed globally (z-value = 570.164 and Moran’s I = 0.636), with one high-density aggregation area, two medium-density aggregation areas, and multiple low-density aggregation areas formed globally (Figure 3). The high-density core area is located in Europe, with the patch enclosed by Italy, France, and Germany (KDM = 1.087) as the main agglomeration area with high density and some continuity. The medium-density agglomerations are mainly found in the northern part of the Arabian Peninsula (KDM = 0.470) and in Korea (KDM = 0.273). The low-density clusters are found in eastern China (KDM = 0.160), Southeast Asia (KDM = 0.204), northern India (KDM = 0.185), and Mexico (KDM = 0.204). North America and Eastern Europe failed to form an agglomeration area. In addition, the standard deviation ellipse analysis shows that WCH is distributed in the northwest–southeast direction (θ = 90.128) (Table 2), with the mean center located in the northeastern region of Libya (Figure 3).

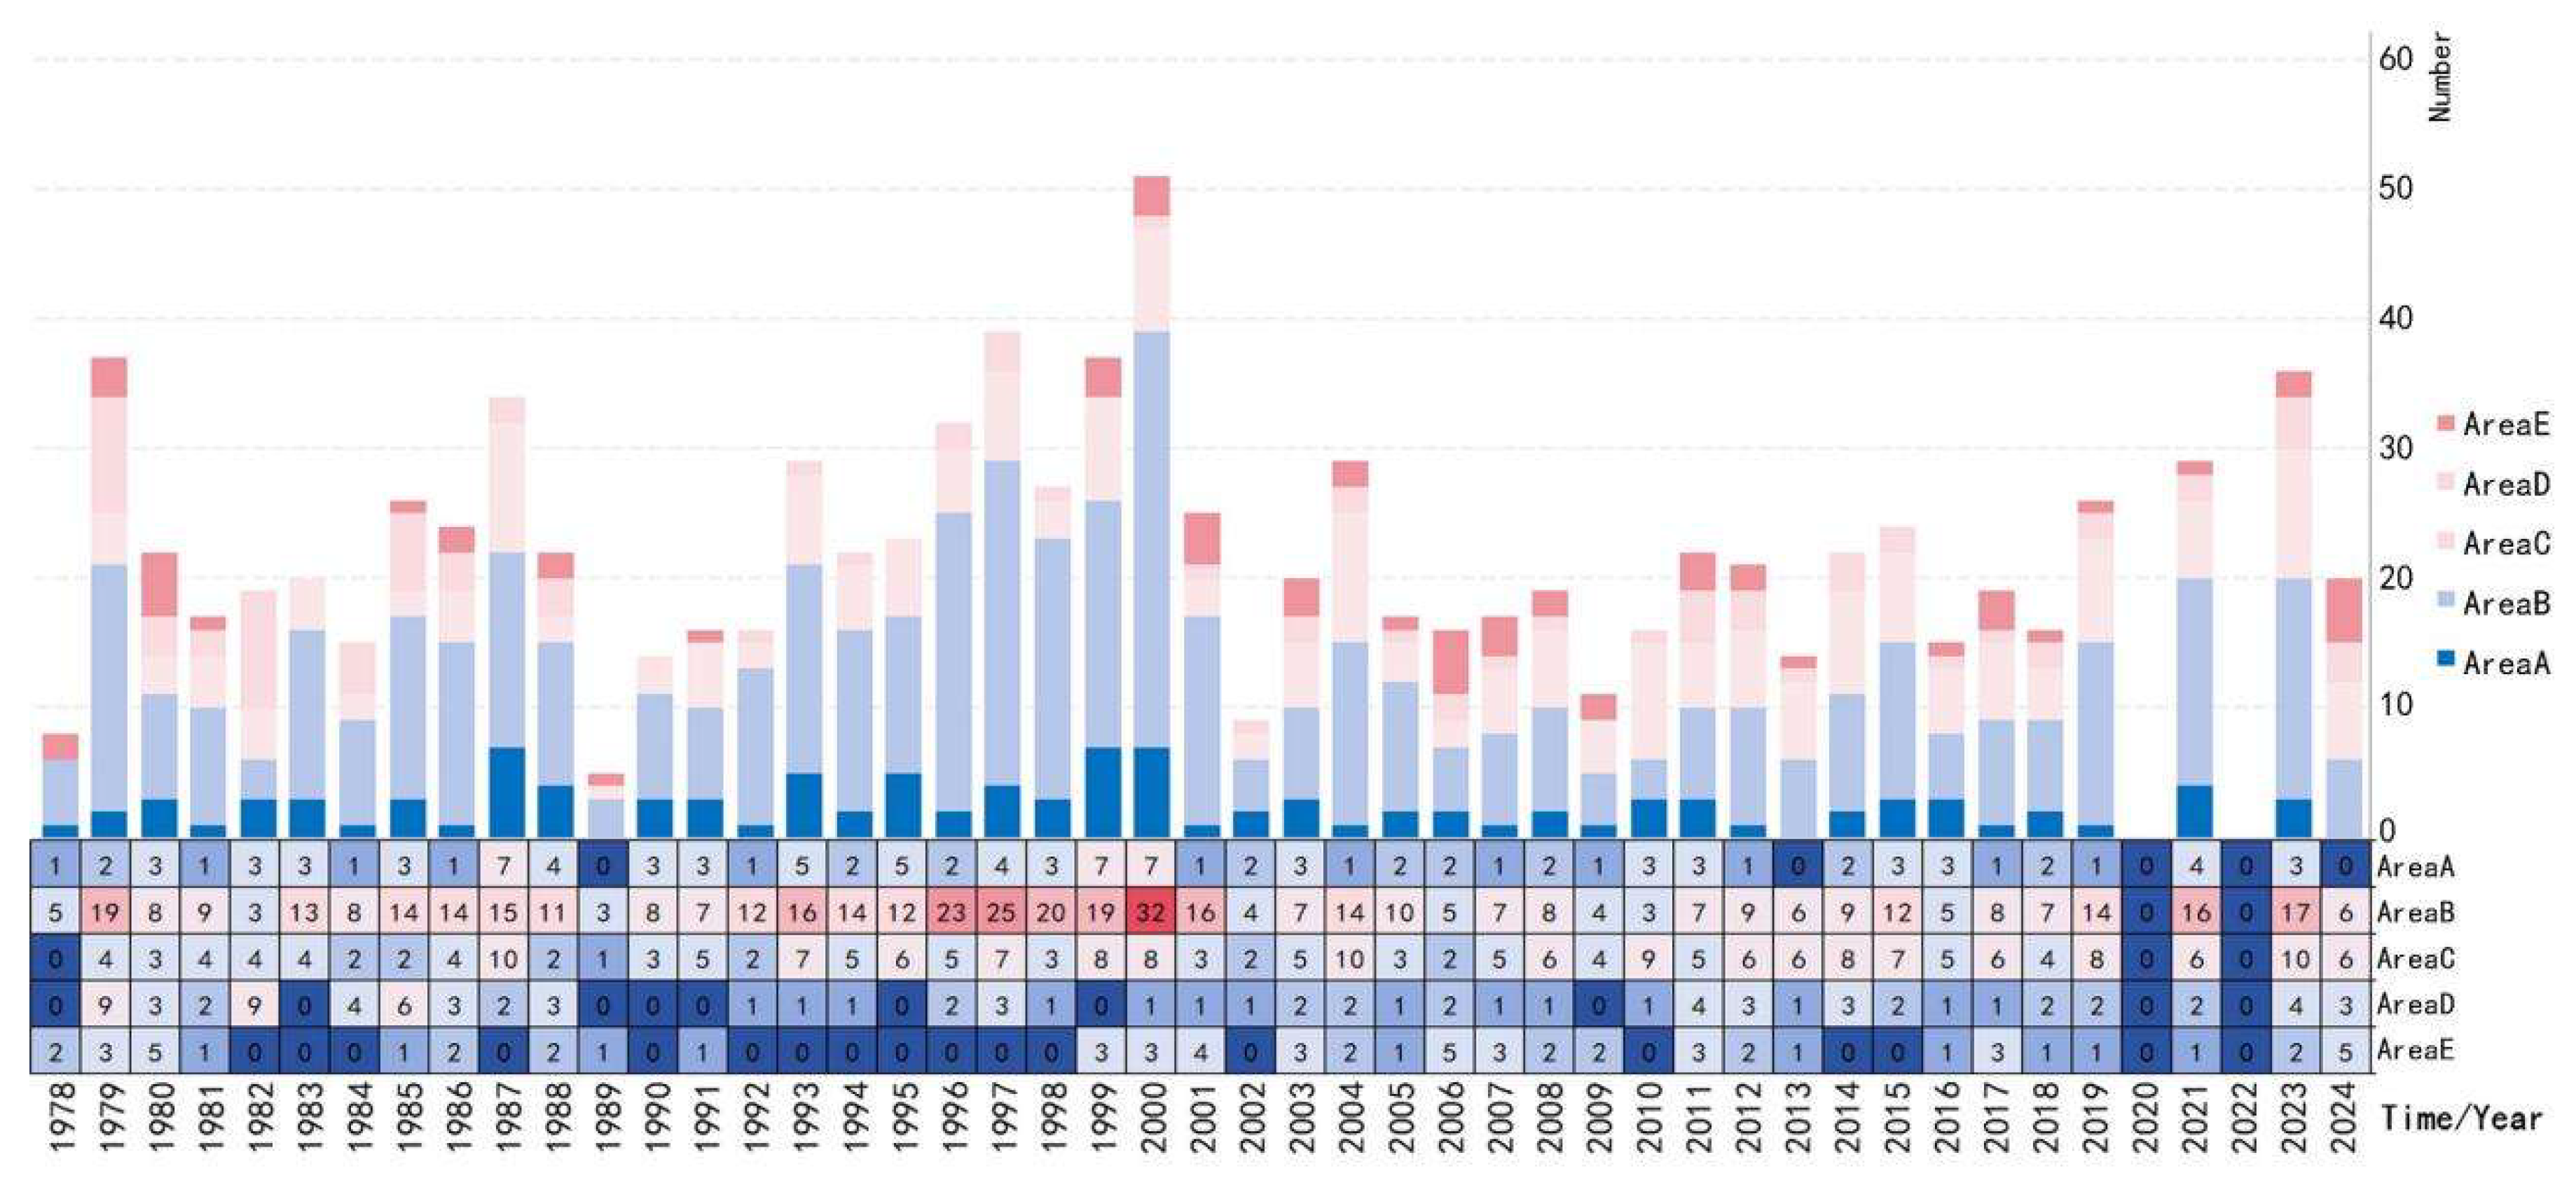
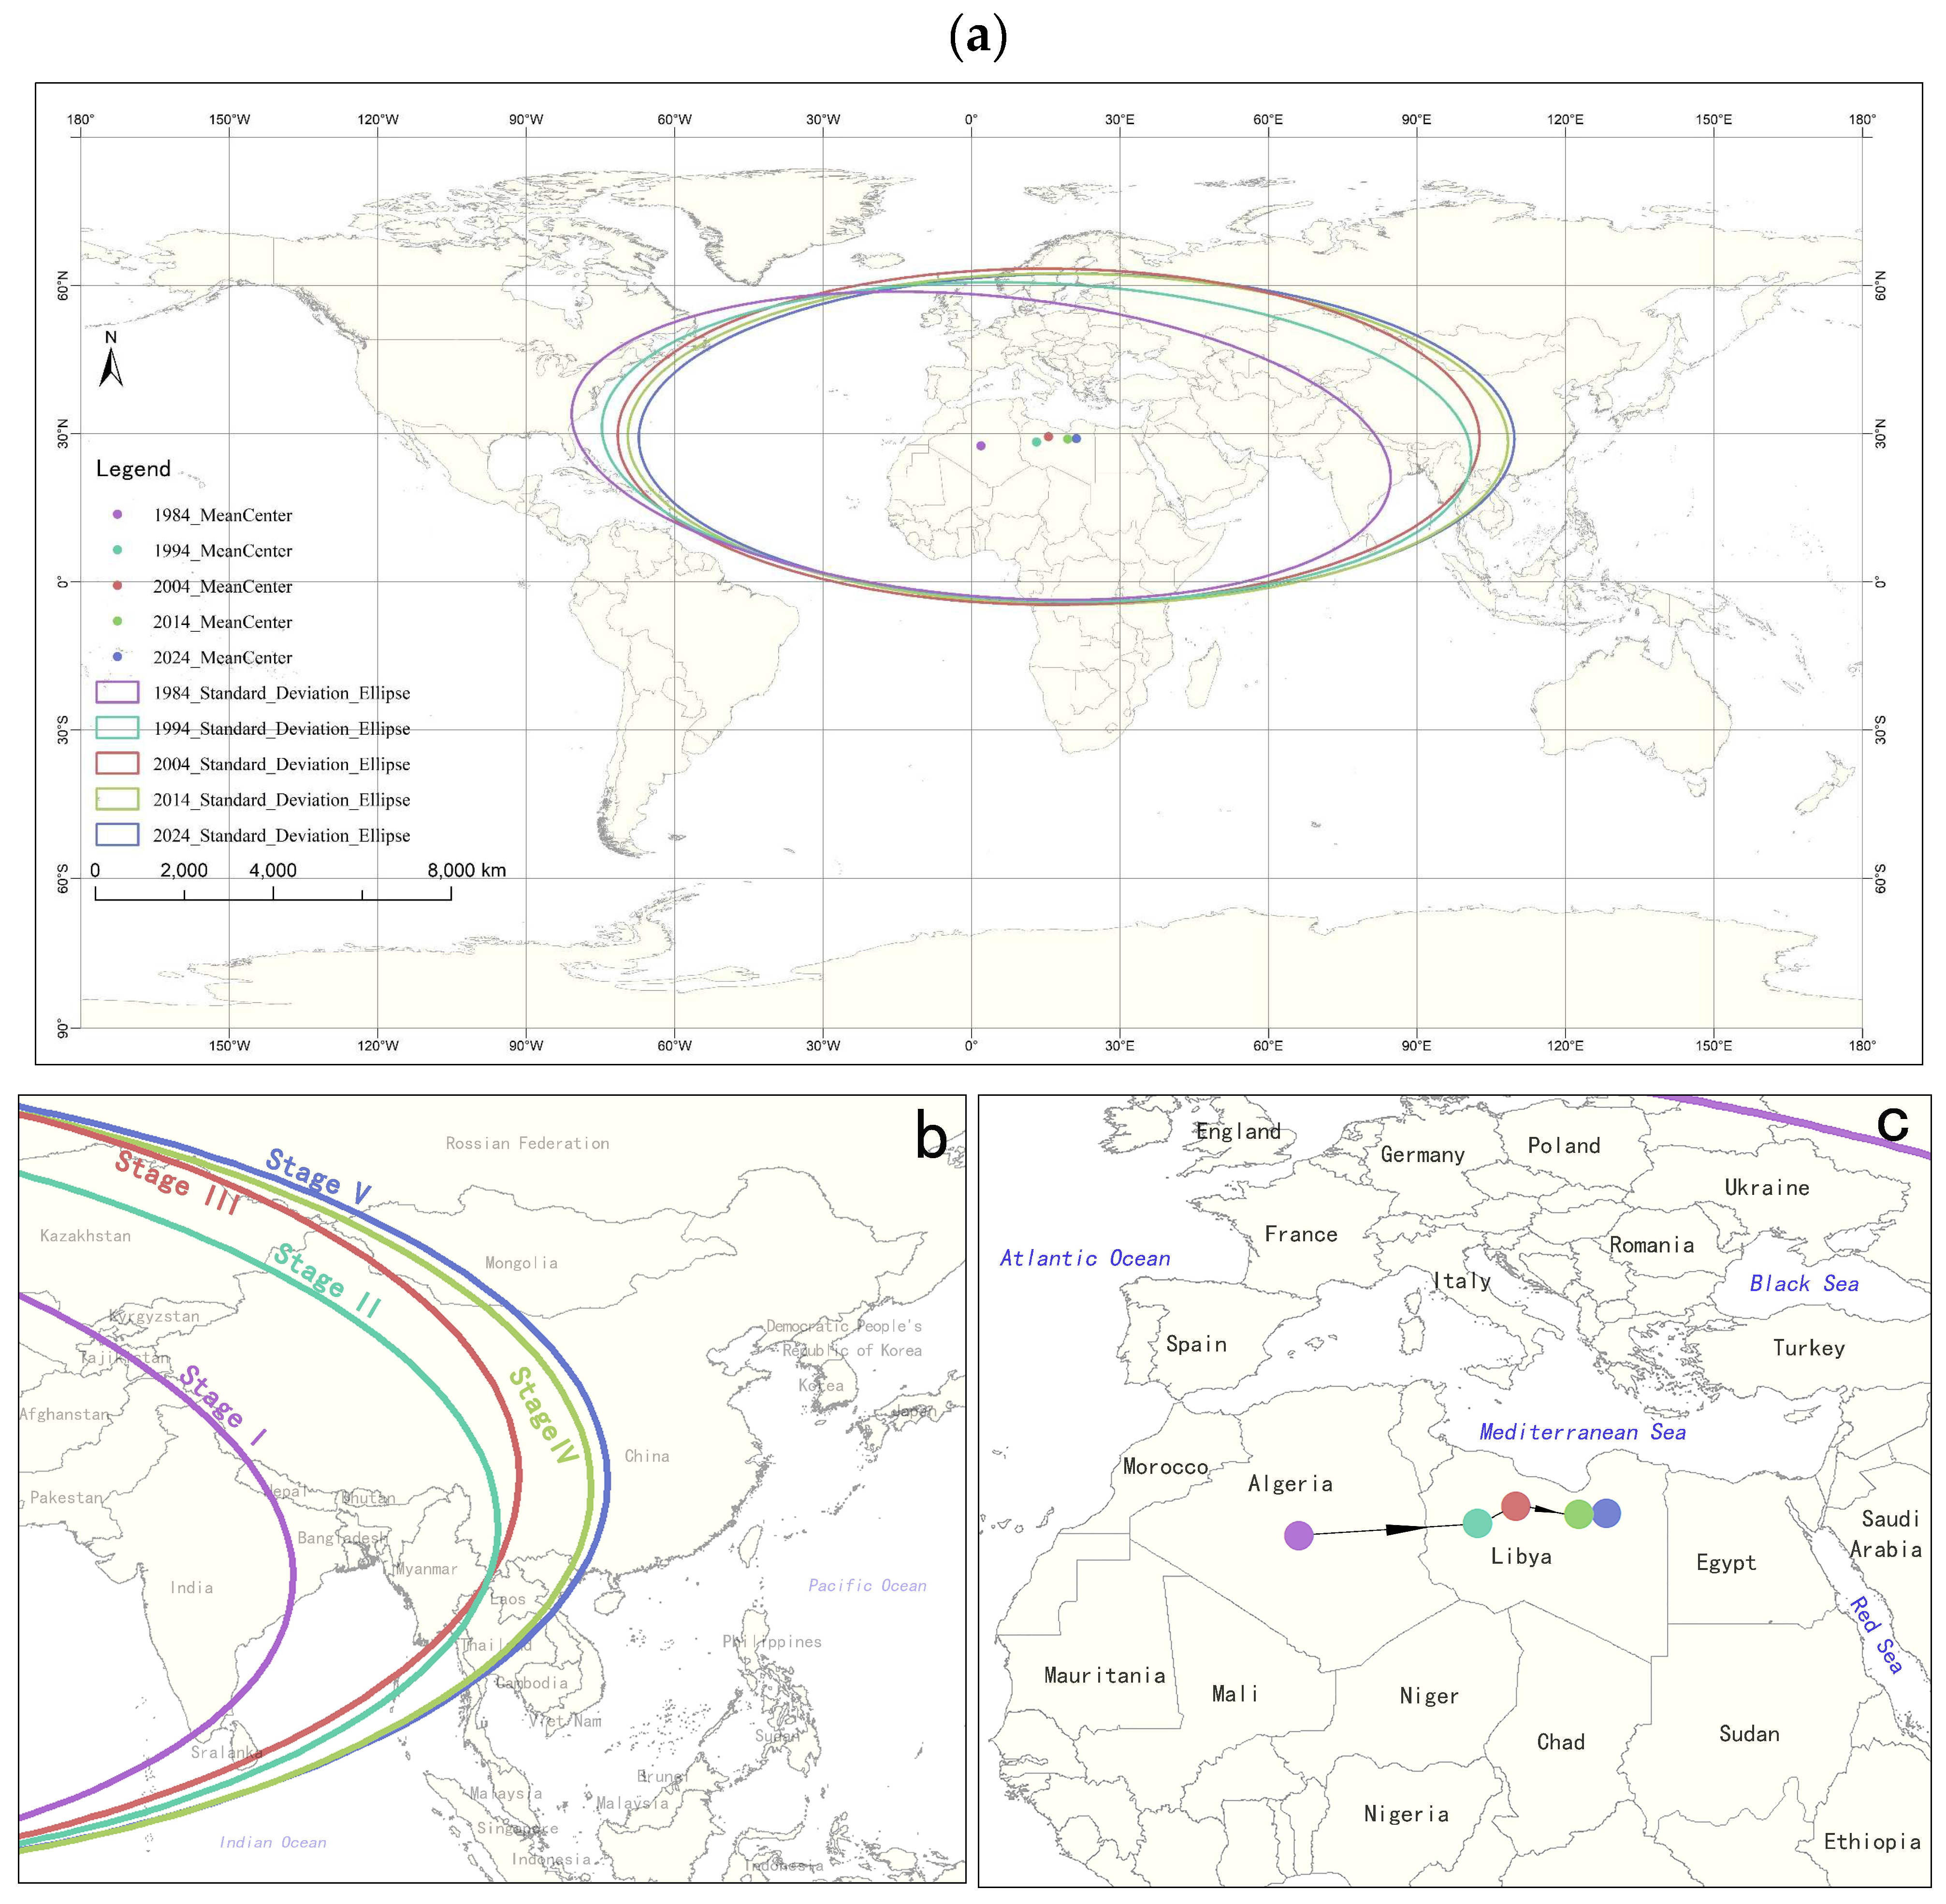
3.2. Spatial–Temporal Evolution Characteristics

3.2.1. Evolutionary Characteristics from Regions

Figure 4 illustrates the evolution of the number of WCH sites across various global regions since 1978, reflecting a substantial increase in international interest and investment in the protection of these invaluable cultural and natural treasures. At the beginning of 1978, there were only 8 designated WCH, whereas, by the end of 2024, this number has surged to 992 (including sites of mixed heritage). This remarkable growth underscores the burgeoning commitment of the international community to the preservation of humanity’s shared heritage.
Notably, it is important to highlight that by 2020, only a total of eight new sites had been inscribed on the World Heritage List that year. Additionally, in both 2020 and 2022, the number of new properties added was zero, a situation that can be attributed to significant global events, such as the outbreak of the COVID-19 pandemic, which adversely impacted the normal review process for nominations. Some peak periods in site inscription were also observed, such as in 2000, which witnessed an unprecedented influx of 61 new World Heritage properties (including cultural, natural, and mixed sites) in a single year, and 2023, which recorded 45 new inscriptions, reflecting an intensification of conservation efforts in recent years.
Examining the regional contributions, North America and Europe (Area-B) stand out as the leading regions in terms of new additions, particularly exceling in the years 2000, 2019, and 2021. This success highlights the richness of the historical and cultural heritage resources available in these regions, as well as their active participation in the international nomination process. The Latin America and Caribbean region (Area-A) has exhibited a more stable growth trajectory, punctuated by periods of significant increase in 2000 and 2010. The Asia and Pacific region (Area-C), while recording fewer additions overall, experienced notable surges in 1987 and 2000. In contrast, the Arab region (Area-D) has seen fewer sites overall, with a slower growth rate characterized by only modest increases in 1979 and 1982. Africa (Area-E), conversely, has faced challenges regarding the nomination of World Heritage sites, as evidenced by its limited additions and multiple years with no new inscriptions.
From Figure 5, it is evident that, from 1978 to 1984, cultural heritage densities were notably high in Europe (Area-B), the northern Arabian area (Area-D), and North Africa, with particularly pronounced concentrations along the coastal nations of the Mediterranean and Red Seas. In contrast, the kernel densities of the world cultural heritage sites in the Asia-Pacific (Area-C) region were relatively low, exhibiting clustering predominantly in India. Similarly, the cultural heritage densities in Latin America and the Caribbean (Area-A) were also diminished, establishing a foundational pattern for the spatial distribution of world cultural heritage.
A comparative analysis of the kernel density results from 1984 to 2024 reveals several noteworthy trends in the global spatial distribution of world cultural heritage (Figure 3 and Figure 5). The kernel density in Europe and northern Africa has remained consistently high throughout the five stages. However, it is generally on a downward trajectory. Conversely, the kernel density within the Asia-Pacific region (Area-C) has exhibited a continuous increase over these stages, particularly in specific regions of China and India. In the Latin American and Caribbean regions (Area-A), density levels have remained low overall; however, there has been localized growth in certain areas, such as Mexico, while other regions have remained relatively stable.
Notably, in 1994, world cultural heritage sites began coalescing into multiple small aggregation centers, resulting in an overall sparsity and broader distribution of these sites across the globe (Figure 3 and Figure 5). However, unlike other regions, North America has experienced a decline in the size and number of its cultural heritage sites, with a marked convergence of heritage distributions toward the Caribbean. These developments reflect the varying degrees of conservation and development efforts directed towards world cultural heritage across different regions, as well as the ongoing progress and challenges associated with global heritage conservation.

3.2.2. Evolutionary Characteristics from the Holistic Perspective

By calculating the standard deviation ellipse along with the latitude and longitude coordinates of the central point across the five stages of WCH and examining their directional movement, distance traveled, and other characteristic parameters, we gain a comprehensive understanding of the spatial patterns of global world cultural heritage. The findings are presented in Figure 6 and Table 2. Initially, the area of the ellipse in Stage I measures 9.84 × 10⁷ km2, exhibiting a marked increase compared to the ellipse areas of Stages II through V, which remain relatively stable, ranging from 1.10 × 10⁸ km2 to 1.16 × 10⁸ km2. These results indicate a distinct trend of expansion in the distribution range of world cultural heritage, which is particularly pronounced following 1994. Furthermore, examining the azimuth reveals that the azimuth angle in Stage I is 95.107°, transitioning to an angle of 92.292° in Stage II, which suggests a spatial distribution pattern oriented from “West–Northwest” to “East–Southeast”. Notably, the azimuth angles for Stages III–V converge closely to 90 degrees, indicating a spatial alignment more aligned with a positive east–west orientation. Additionally, the flattening ratio of the ellipse exhibits a pattern of shrinking first and then growing bigger, signifying that the distribution of world cultural heritage is evolving predominantly in the east–west direction while maintaining a consistent area and shape. Finally, from the perspective of the mean center, the center for Stage I is located in Algeria, North Africa. In contrast, Stage II marks a significant shift from the mean center of Stage I, with an offset distance of 1250 km. Stages III to V exhibit a moderate eastward shift, averaging about 300 km, culminating in the mean center for Stages II–V, positioned in Libya, which is also in North Africa. This trajectory illustrates the following historical migratory trend: “EN → EN → ES → EN” (Figure 6c). Overall, the results reveal that the distribution range and migratory patterns of world cultural heritage correlate closely with the geographical evolution of high-density areas.

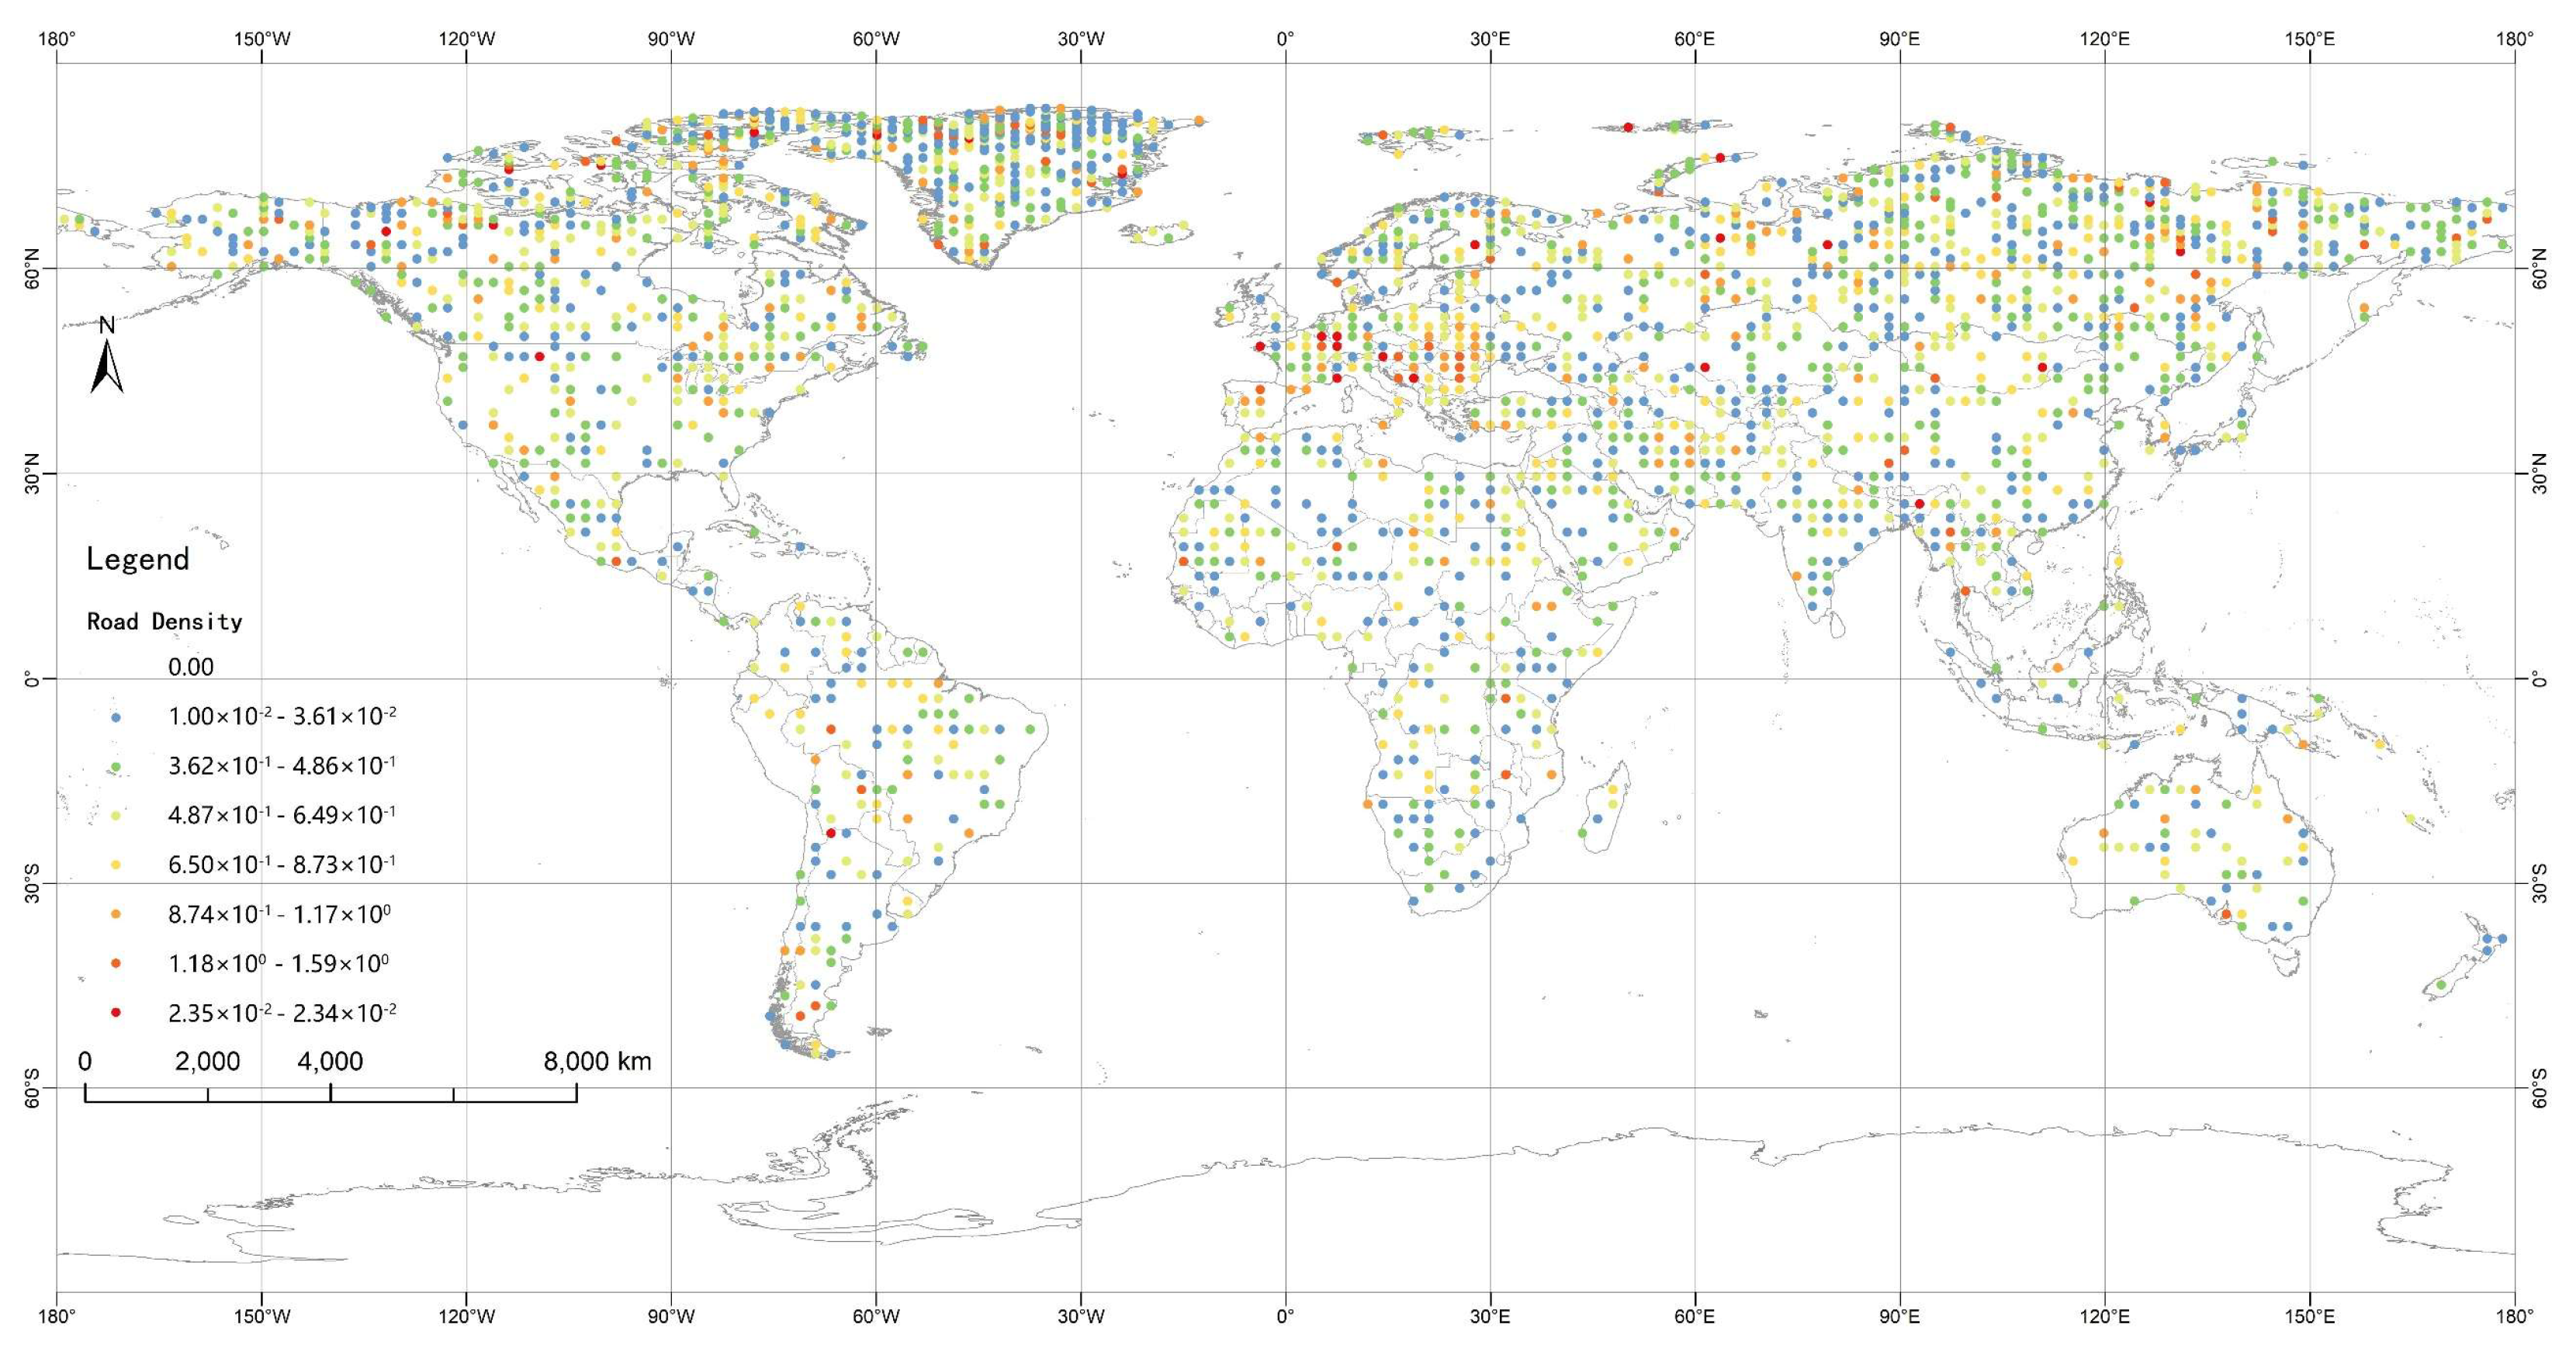
3.3. Affecting Factors of Spatial Distribution

3.3.1. Affecting Factor Selection and Data Processing

As a quintessential representation of the vestiges of humanity’s enduring survival activities, WCH is shaped and influenced by a multitude of both natural factors and human endeavors. This study has identified nine pertinent natural and social environmental factors (Table 3) that quantitatively delineate the primary influencing factors on the spatial differentiation of world cultural heritage, utilizing geographic detectors for analysis. Among the identified factors, natural elements serve as the foundational basis for spatial differentiation, encompassing topography, climate, hydrology, and vegetation, along with transportation networks. The following six specific influencing factors were selected for this analysis: road density (X1), water density (X2), aspect ratio (X3), forest coverage (X4), elevation (X5), and annual precipitation (X6). Conversely, the social factors considered include global economic development and population metrics, with the following three influential factors selected: gross domestic product GDP (X7), population density (X8), and per capita GDP (X9) [30]. Subsequently, using the ArcGIS 10.8 software, the globe was segmented into 16,382 grids measuring 250 by 250 km each, within which the raster data for the aforementioned nine influencing factors were aggregated. Tests on 100 km2 and 500 km2 grids showed that the 250 km2 grid optimized heritage density modeling and factor explanatory power. Aspect ratio quantified the proportion of aspects receiving maximum solar exposure. The Northern Hemisphere included the Southeast (SE), Southwest (SW), and South (S) aspects, while the Southern Hemisphere included the Northeast (NE), Northwest (NW), and North (N) aspects. This metric was calculated from aspect data (extracted from DEM) to reflect solar radiation intensity, which may influence vegetation patterns and human settlement preferences. Road density and water system density were calculated as the ratio of the total length of roads and rivers within each grid to its corresponding area, while the forest coverage rate was determined as the ratio of forest cover area to the area of the respective grid. The remaining factors were quantified within each grid unit.

3.3.2. Influencing Factor Ranking and Interaction Detection Results

Geodetectors offer superior algorithms for categorical variables compared to those for continuous variables. To analyze each influencing factor, K-Means cluster analysis was conducted using SPSS 27.0 software. Subsequently, the geographic detector developed by Wang et al. was employed to assess the individual factors and their interactions, with the results presented in Table 3 and Table 4. The q-values from the single-factor detection were ranked, indicating road density as the most influential factor affecting the spatial differentiation of WCH sites. Per capita GDP and water density also ranked prominently, signifying that these three elements are the primary determinants of WCH’s spatial differentiation. Following these, elevation, annual precipitation, and aspect ratio also contributed to this differentiation, albeit to a lesser extent. Conversely, population density and GDP were shown to have a minimal impact on the spatial differentiation of WCH.
The interaction detection results, detailed in Table 4, reveal that the relationships among the factors are predominantly enhanced, encompassing both two-factor enhancements and nonlinear enhancements, without any instances of independent or weakening relationships. This suggests that the interaction of any two factors amplifies the explanatory power regarding the spatial differentiation of world cultural heritage, indicating that this phenomenon is a result of the combined influences of multiple factors. Notably, 10 pairs of factors exhibited two-factor enhancements, accounting for 27.778% of the total interactions, which included the following: GDP (X7) per capita GDP (X9); GDP (X7) aspect ratio (X3); annual precipitation (X6) vegetation index (X4); GDP (X7) vegetation index (X4); population density (X8) vegetation index (X4); per capita GDP (X9) vegetation index (X4); GDP (X7) altitude (X5); GDP (X7) annual precipitation (X6); population density (X8) annual precipitation (X6); and per capita GDP (X9) annual precipitation (X6). Interactions involving other factors exhibited two-factor enhancements as well, comprising 72.222% of the total.
Additionally, the combination of road density and per capita GDP yielded the most significant effect, with road density (X1)   per capita GDP (X9) exhibiting the strongest explanatory power regarding spatial differentiation (q = 0.400). This was followed by the interactions of road density (X1) river density (X2) (q = 0.327) and per capita GDP (X9) river density (X2) (q = 0.323). These findings further corroborate that road density, per capita GDP, and river density are the predominant influencing factors in the spatial differentiation of world cultural heritage. Furthermore, the synergistic effect of these three factors, in conjunction with other elements, extensively elucidates the spatial differentiation of world cultural heritage.

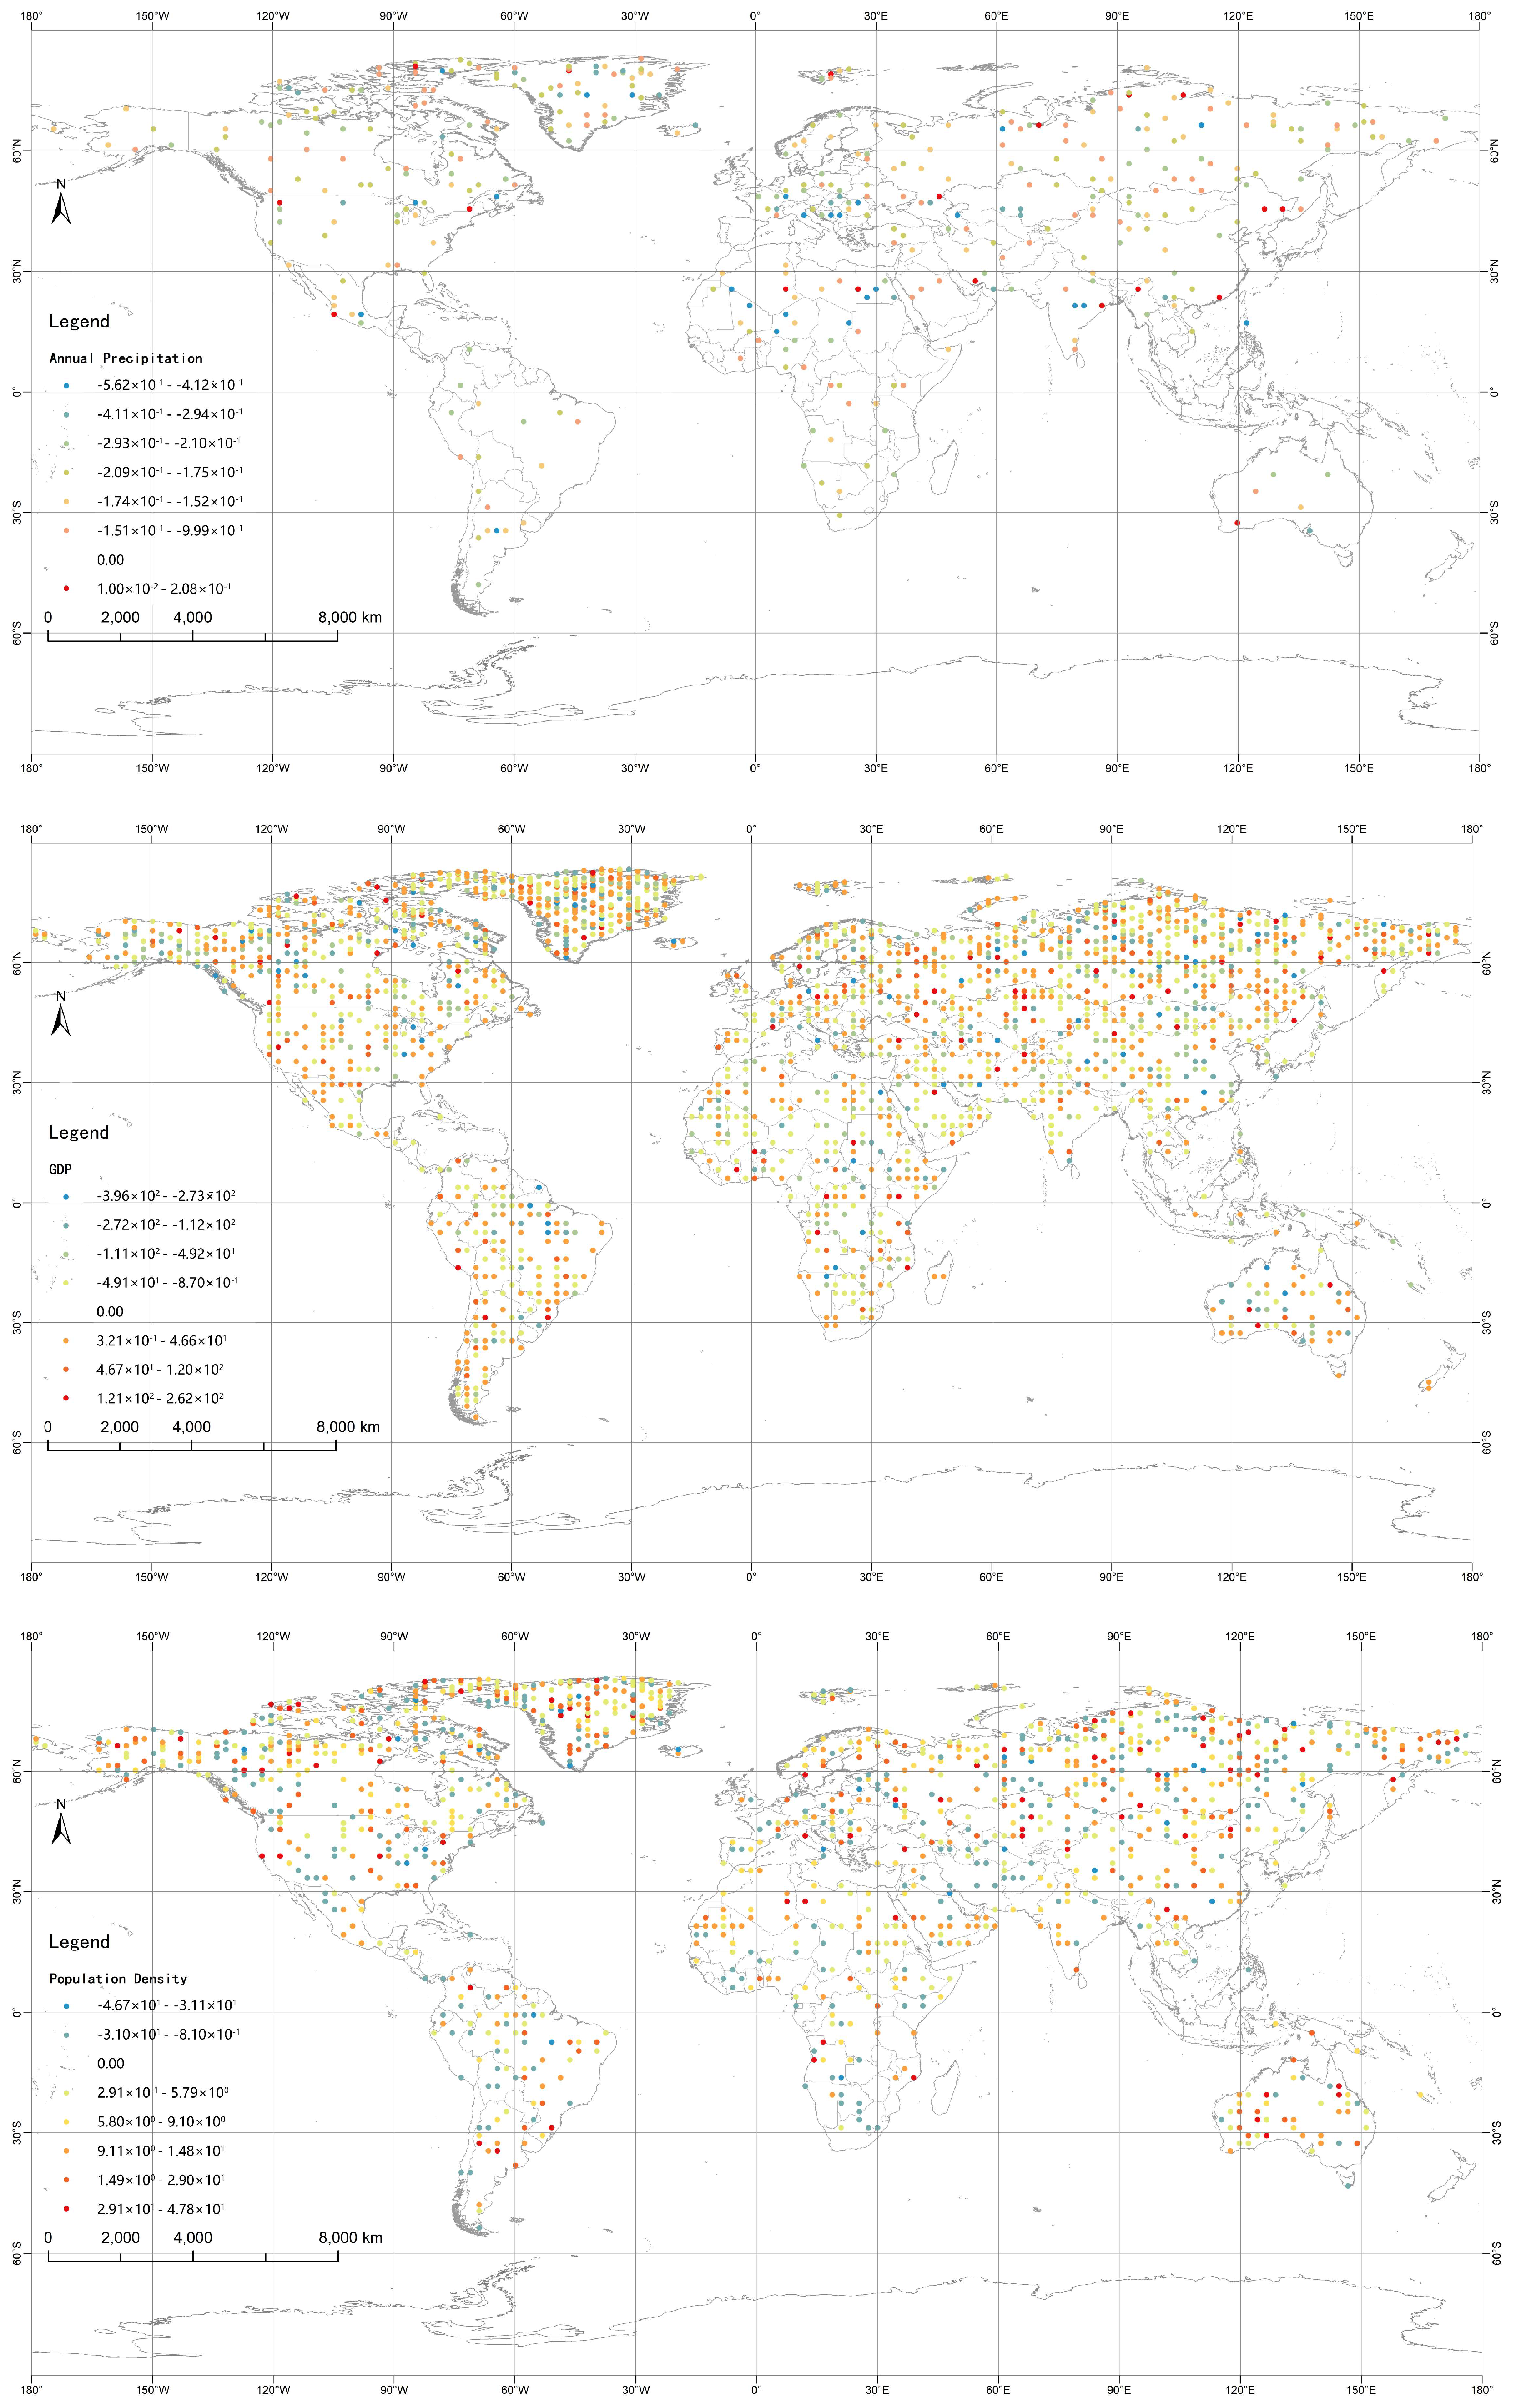
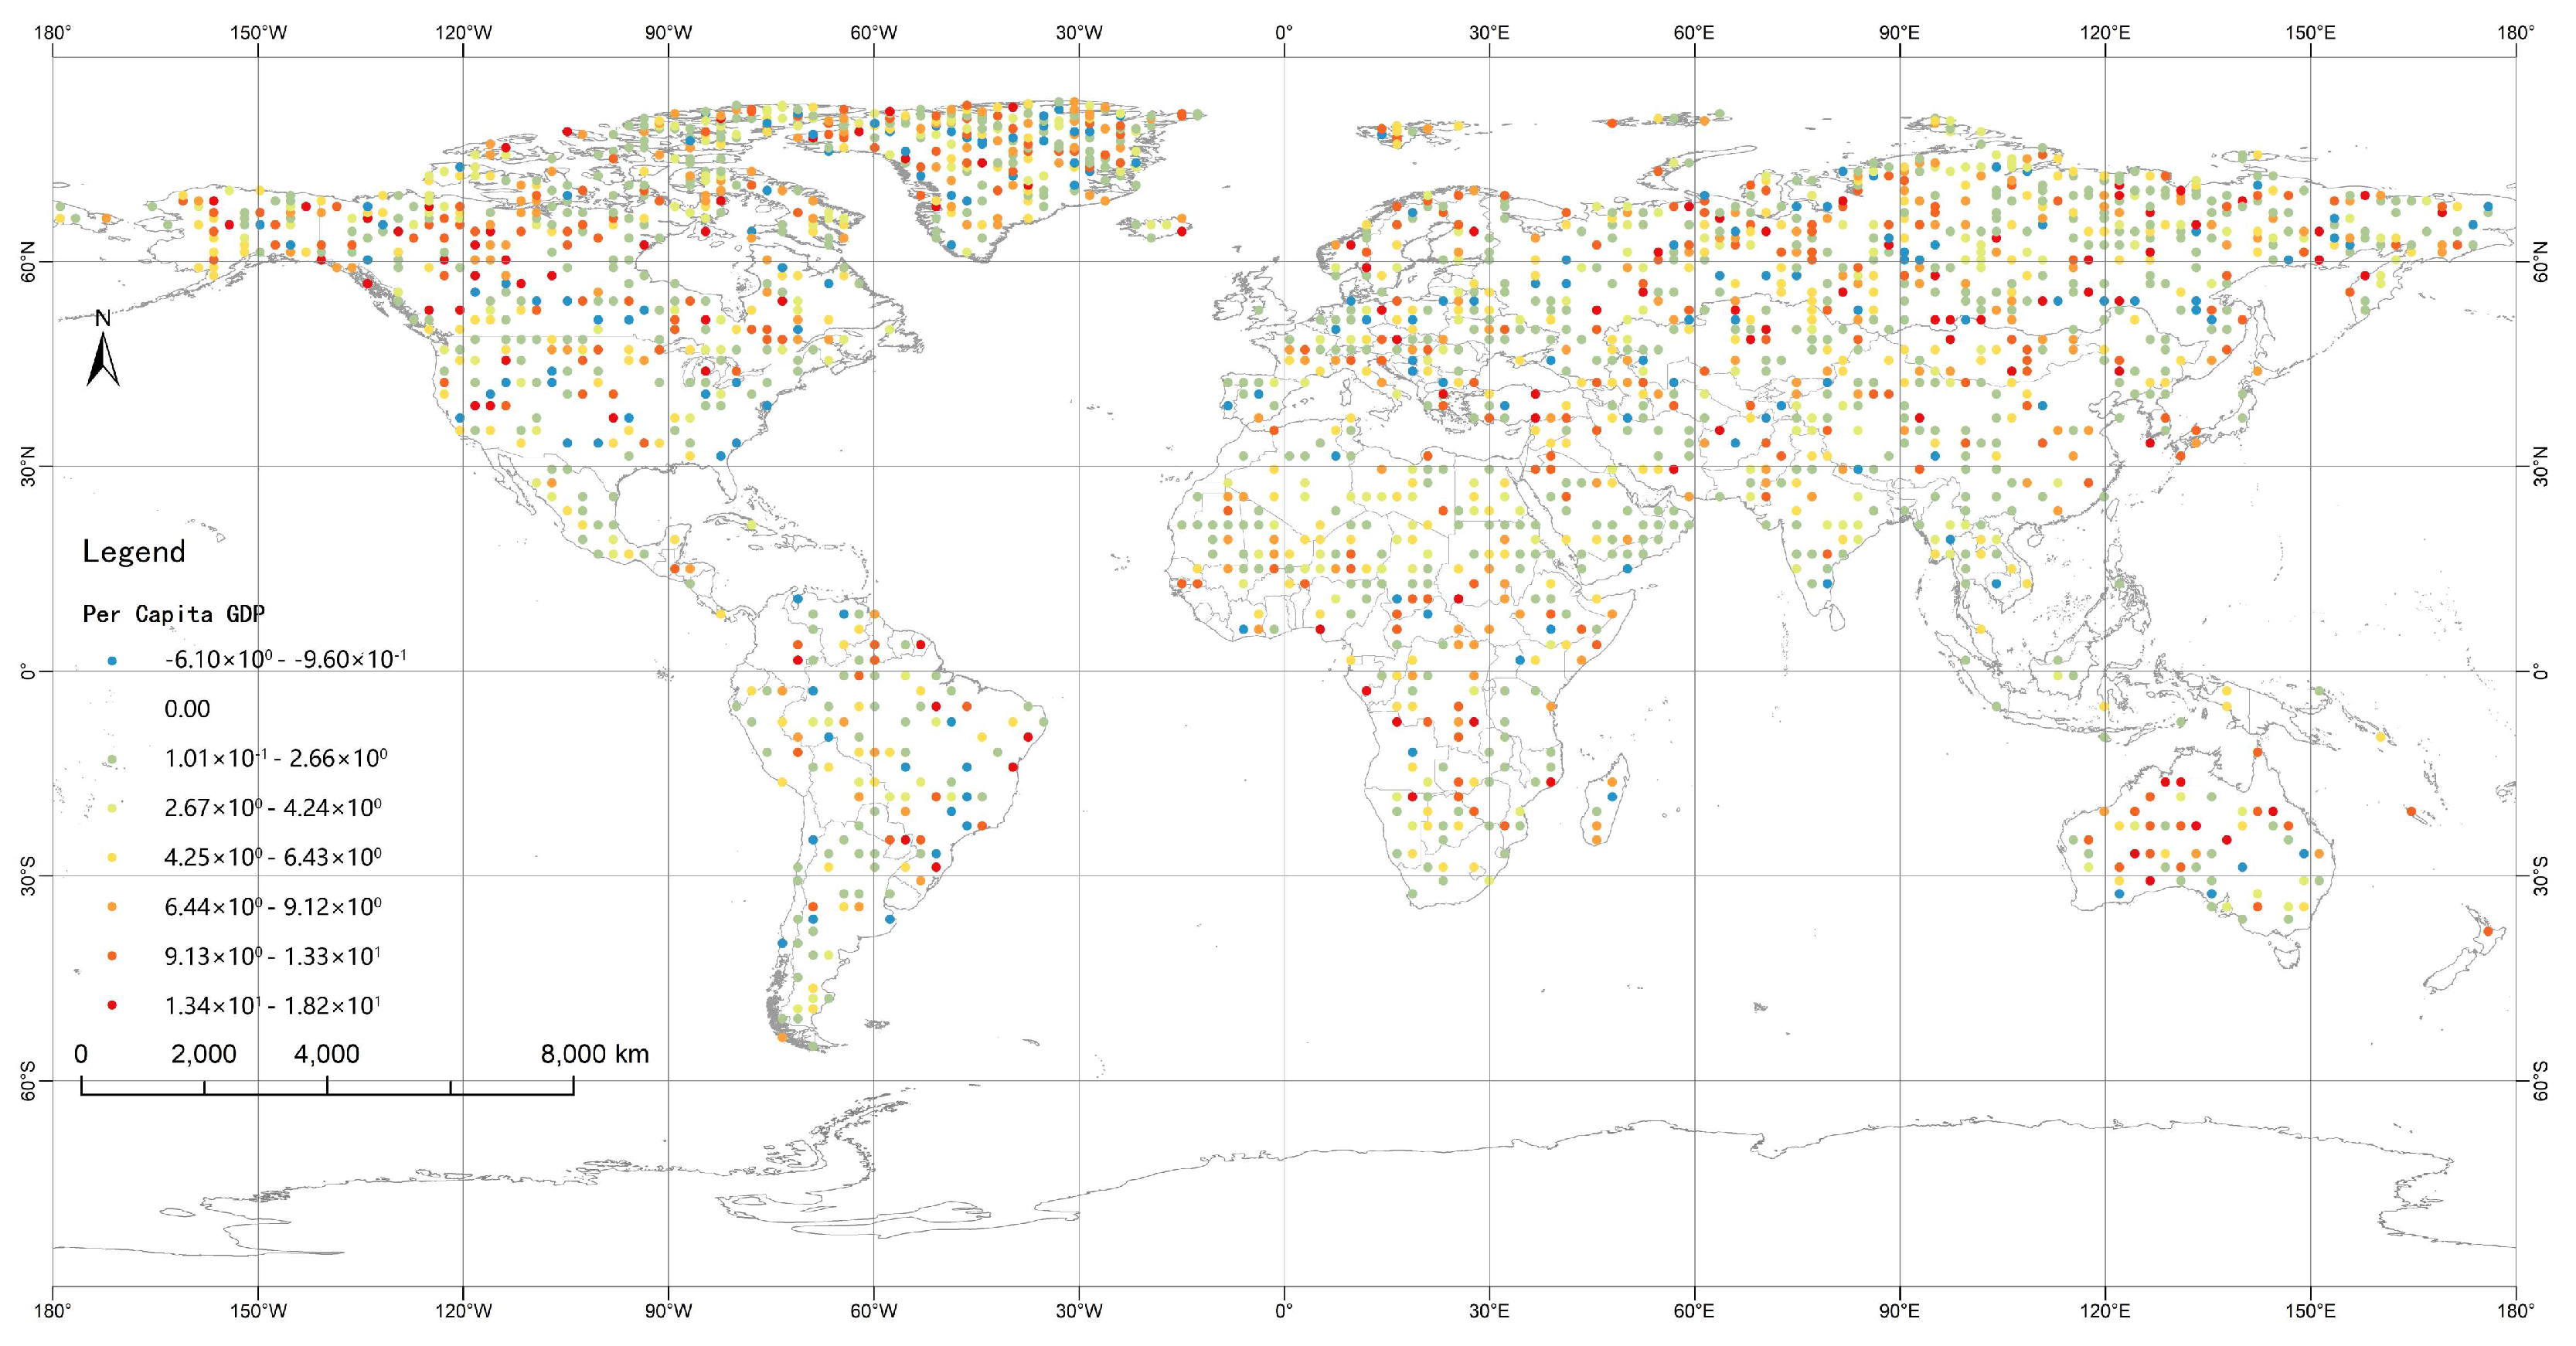
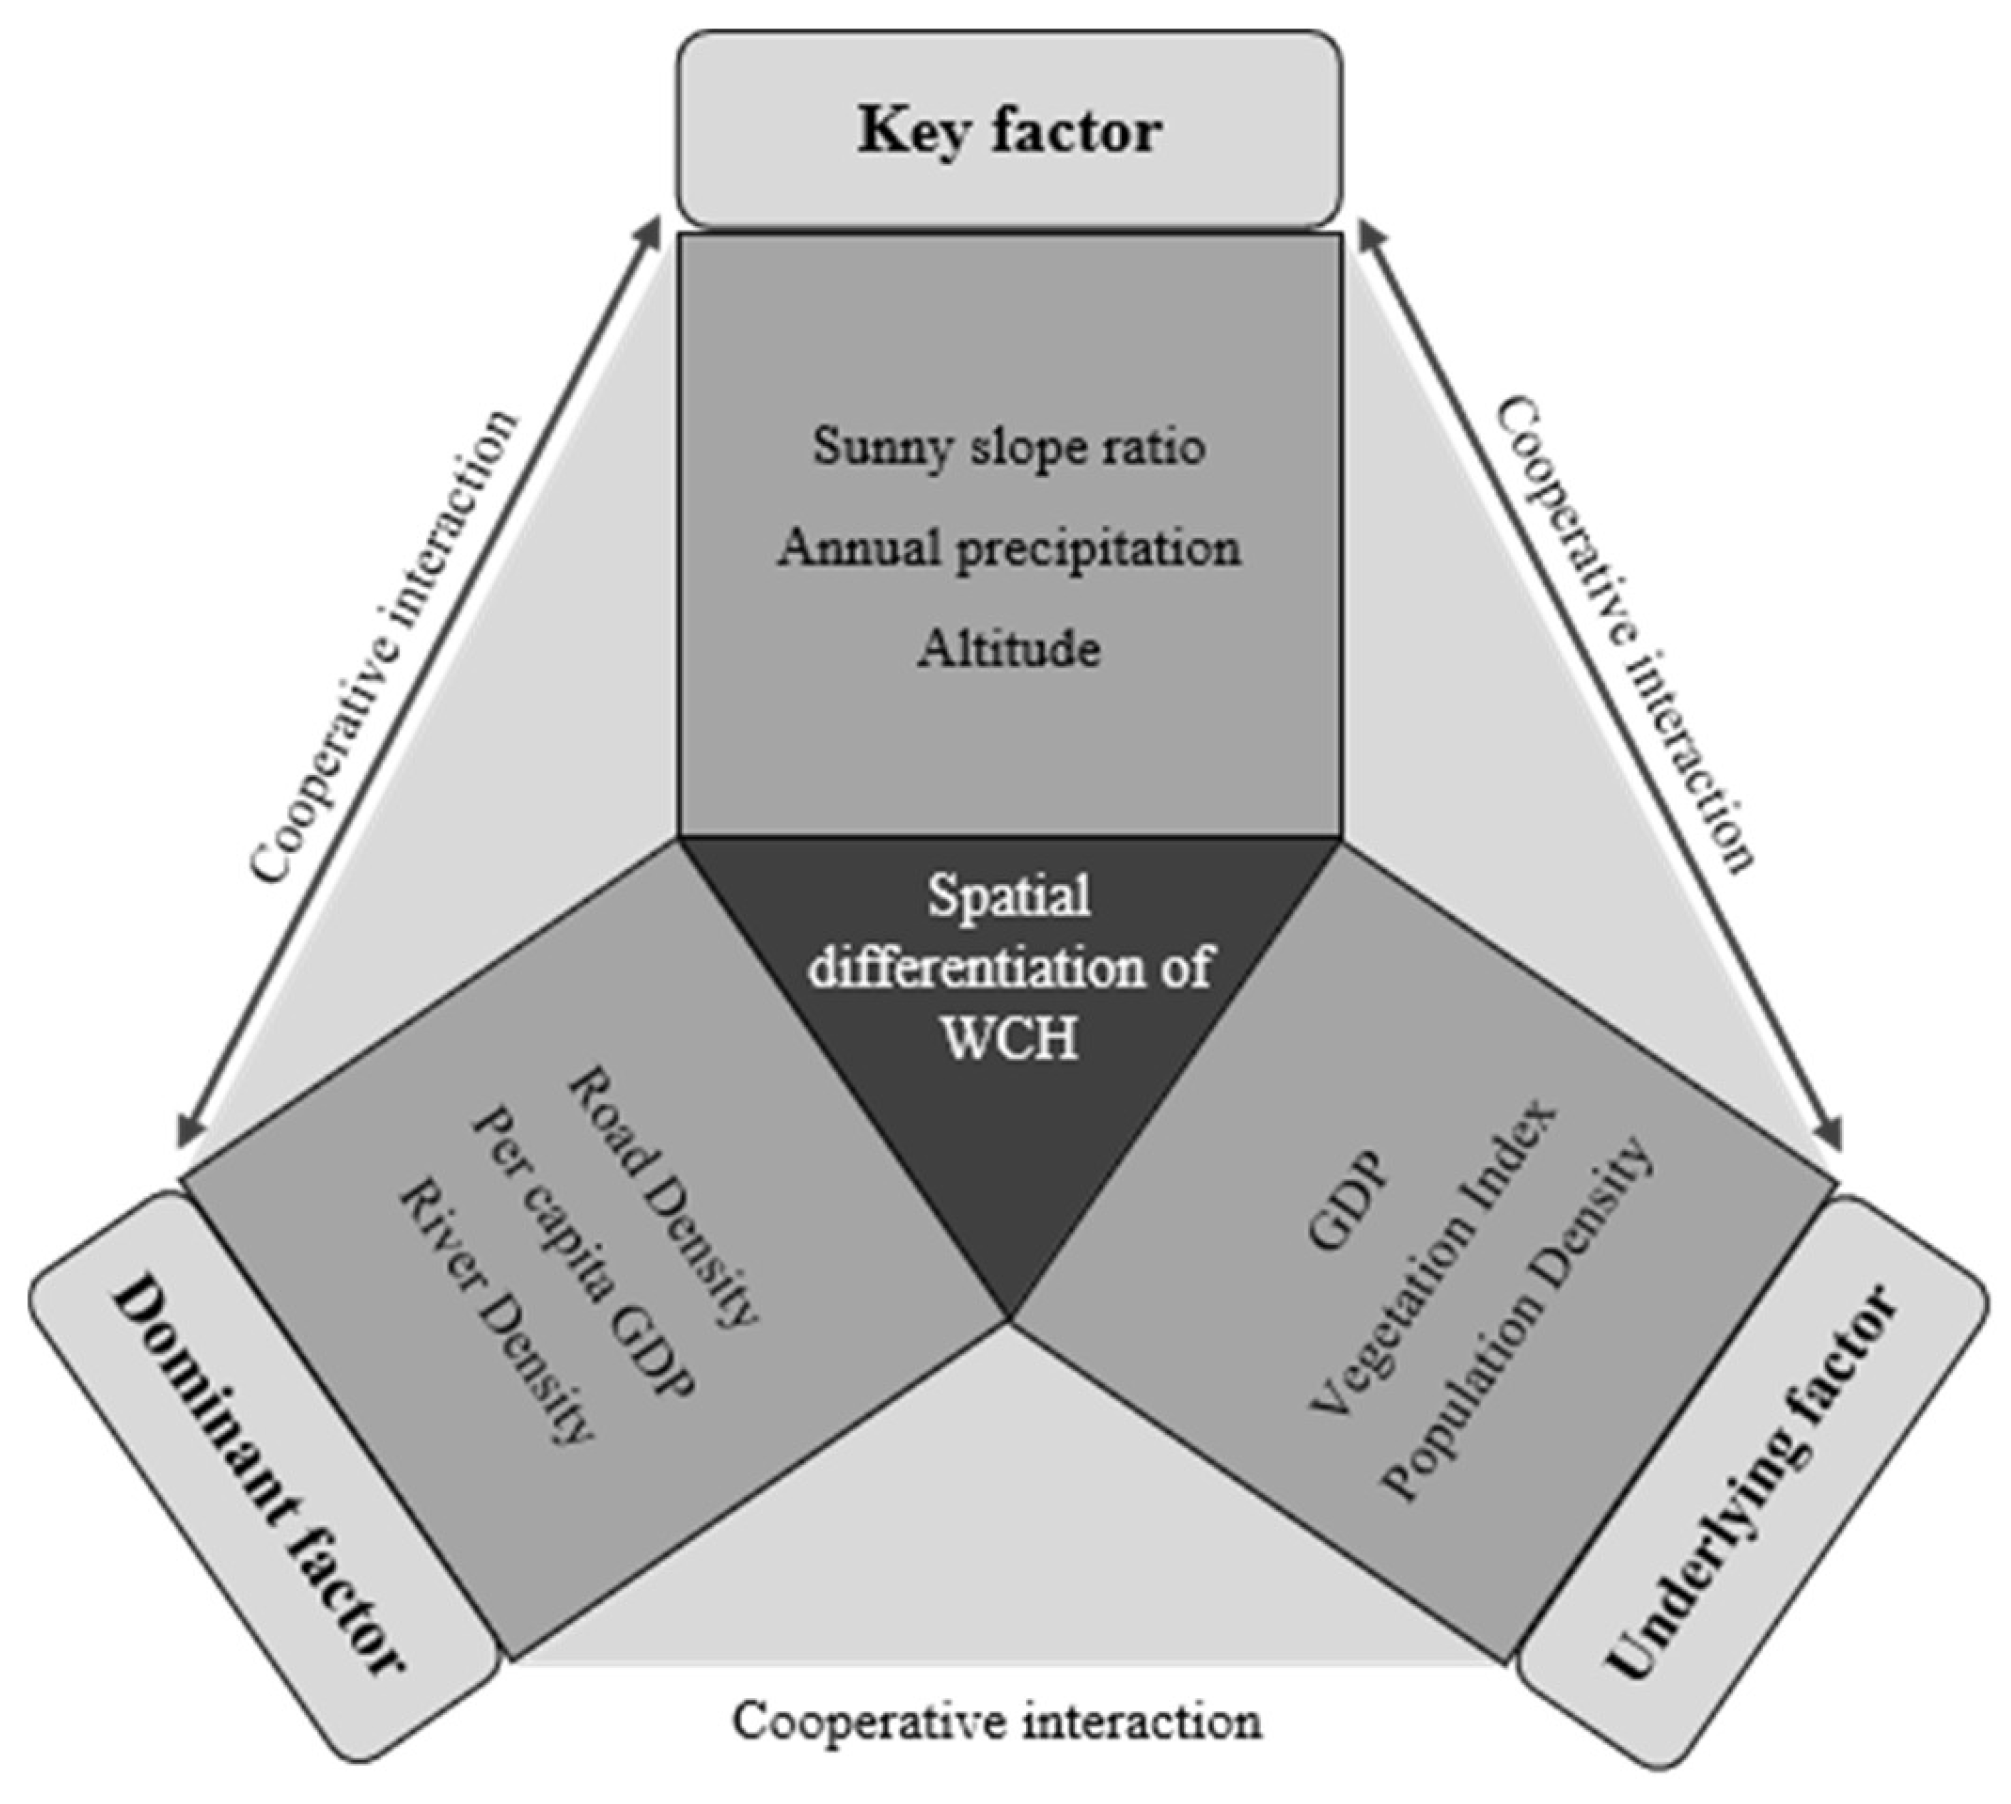
3.3.3. The Spatial Mechanism of Influencing Factors

The correlation coefficient assessing the impact of each factor on the research subject across various fishnet grid was calculated using MGWR to elucidate the spatial mechanisms governing the influence of these factors on WCH. Given that a high correlation among independent variables can lead to invalid model estimations or diminished predictive accuracy, a multicollinearity test and a spatial correlation assessment were conducted on the nine model variables prior to establishing the MGWR model. Utilizing SPSS 27.0, the variance inflation factor (VIF) and tolerance values for each index were derived through the collinearity diagnostic tool. A tolerance value of less than 0.1 or a VIF exceeding 5 signifies the presence of collinearity among the factors. The results presented in Table 5 indicate that the tolerance values for each factor range between 0.499 and 0.978, while VIF values range from 1.023 to 2.002, confirming the absence of collinearity and thus validating the variables for subsequent modeling.
Employing the spatial autocorrelation tool in the ArcGIS 10.8 software, Moran’s I was calculated to be 0.635596 for WCH. This indicates a significant positive correlation with spatial distribution, which renders the data suitable for further analysis of the influencing factors via MGWR.
In this analysis, the kernel density of WCH served as the dependent variable, while nine influencing factors functioned as independent variables, which were incorporated into both the GWR and MGWR models for a detailed examination. Table 6 reveals that the GWR analysis’ combined bandwidth is 81.000; however, varying bandwidths are observed for different factors in the MGWR model. Notably, the optimal bandwidths for road density and GDP are the smallest, indicating a heightened sensitivity to the spatial heterogeneity of WCH. In contrast, the optimal bandwidths for river density, aspect ratio, and vegetation coverage are the largest, each measuring 5580.000, suggesting a lower sensitivity to the spatial heterogeneity associated with WCH. In addition, Table 6 shows the positive and negative proportions of the correlation coefficients for the nine explanatory variables in the MGWR calculations. Figure 7 visualizes the correlation coefficients of the eight explanatory variables satisfying the significance test in the MGWR calculation results, which is helpful in exploring the spatial mechanisms of their influence on WCH.
The positive regression coefficient for road density (X1) constituted 98%, while the negative coefficient represented 2%. The analysis units that met the significance criterion accounted for 43.25%, with coefficients ranging from 0.198 to 2.195. The relative difference between the maximum and minimum regression coefficients was measured at 1.997, indicating a uniform spatial distribution, albeit with an inconspicuous spatial difference. In contrast, the regression coefficients for river density (X2) were uniformly positive, with only 0.54% of analysis units satisfying the significance test. These coefficients ranged from 0.0228 to 0.0234, reflecting a minimal relative difference of 0.0006.
Both the aspect ratio (X3) and vegetation index (X4) yielded negative regression coefficients, with the respective percentages of analysis units meeting the significance threshold at 42.93% and 100%. The coefficients for the former varied from −0.022 to −0.019, producing a relative difference of 0.003, while the latter ranged from −0.032 to −0.022, resulting in a relative difference of 0.010. Notably, there was an absence of spatial difference in the overall interaction mechanism between these two variables; all significant units exhibited inhibitory effects, which were particularly pronounced in Northern Europe.
The regression coefficients of altitude (X5) were evenly split, with positive and negative values each accounting for 50%, but with none of the analysis units satisfying the significance test. In terms of annual precipitation (X6), the positive regression coefficient represented 34%, while the negative value accounted for 66%. The units satisfying the significance criterion constituted 7.57%, with coefficients ranging from −0.562 to 0.208, resulting in a relative difference of 0.770.
For GDP (X7), the regression coefficients indicated 48% positive and 52% negative values, with 38.81% of units meeting the significance test. These coefficients ranged from −396.23 to 262.32, reflecting a substantial relative difference of 658.55. Population density (X8) showed a positive regression coefficient of 64% and a negative value of 36%, with 23.66% of units fulfilling the significance criterion, and coefficients ranging from −46.681 to 47.776, yielding a relative difference of 94.457. Lastly, the regression coefficient for per capita GDP (X9) indicated a positive value of 73% and a negative value of 27%, with the units achieving sufficient significance accounting for 339.61%, and coefficients ranging from −6.100 to 18.222, resulting in a relative difference of 24.322. It is worth mentioning that GDP reflects the macro-economic capacity, enabling institutional investments in heritage conservation, whereas per Capita GDP correlates with the public cultural engagement, as higher individual wealth fosters tourism and community stewardship [30,31].

4. Discussion

4.1. Spatial Distribution and Evolution of WCH

From a historical perspective, Europe stands as the cradle of global cultural heritage preservation, a legacy deeply intertwined with its rich historical tapestry and early cultural self-awareness. In modern times, European nations have enacted numerous laws and established several institutions dedicated to the safeguarding of cultural artifacts. Notable examples include the United Kingdom’s “Antiquities Act” [32] and France’s “Historic Buildings Act”, which have collectively laid the groundwork for the protection of world cultural heritage. Consequently, the high density of WCH in Europe is a testament to this historical accumulation. This distribution underscores the necessity of integrating long-term cultural identity into policy frameworks. For example, the UK’s Antiquities Act and France’s Historic Buildings Act institutionalized heritage protection, demonstrating that legal mechanisms are critical for sustaining cultural legacies across generations.
Northern Africa, particularly countries bordering the Mediterranean such as Egypt and Morocco, is replete with ancient civilization sites whose historical value is widely acknowledged by the international community [33,34]. This recognition has led to a significant number of these sites being designated as WCH sites. The Asia-Pacific, with China and India as prime examples, boasts a population and cultural richness that translate into a high quantity and quality of cultural heritage. As economic development in these nations has advanced, so too has the awareness and commitment to preserving their cultural legacies, resulting in an increasing number of sites being nominated and inscribed on the WCH List. This growth reflects the synergy between economic development and globalization-driven cultural diversity initiatives. For instance, China’s “Belt and Road Initiative” leverages heritage diplomacy to enhance global influence, highlighting how economic power and international engagement are pivotal drivers of heritage conservation. In contrast, Latin America and the Caribbean, despite their abundant cultural heritage, have a relatively modest number of WCH. This disparity can be attributed to various factors, including economic conditions, political stability, and the level of international attention. This disparity underscores the need for international collaboration to address resource inequities. Programs like UNESCO’s Global Heritage Fund could prioritize capacity-building in under-resourced regions, ensuring that cultural heritage conservation aligns with sustainable development goals. However, Mexico, a cultural powerhouse, has been recognized for its efforts in heritage preservation, thereby maintaining a prominent presence in the region [35].
The initial stage (1978–1984) of WCH accreditation marked the advent of WCH assessments, thereby establishing a foundational framework for subsequent evaluations. Since that period, the density of WCH sites in Europe and North Africa has remained consistently high, although a gradual decline in overall numbers has become evident. In contrast, the Asia-Pacific region (Area-C) has witnessed a steady increase in site density across five distinct phases, with particularly notable growth in select regions of China and India. Meanwhile, Latin America and the Caribbean (Area-A) have sustained a relatively low density of sites throughout these five stages, with only a few exceptional increases in particular locales, such as Mexico, while many other areas have shown minimal change. Notably, from 1994 onward, the WCH framework began to cultivate multiple small-scale agglomeration centers, leading to a more dispersed and widespread distribution of sites on a global scale.
From a global standpoint, the distribution and evolution of WCH mirror the broader shifts occurring within the global political, economic, and cultural landscape. In the wake of the Cold War, the rapid acceleration of globalization catalyzed initiatives aimed at safeguarding cultural diversity, prompting numerous nations to place increased emphasis on their cultural heritage and to engage more actively in the nomination process [36,37]. This resulted in a diversification of WCH site distribution, characterized by the emergence of several small clusters. Simultaneously, certain developed regions, notably North America, experienced a concentration of WCH within the Caribbean, likely influenced by the interrelated factors of tourism and cultural promotion. The distinctive culture and rich history of the Caribbean serve as a magnet for global tourists, thereby positioning the preservation and development of cultural heritage as a central focal point in the region.
The standard deviation ellipse (SDE) analysis further corroborates these trends (Table 2, Figure 6). The expansion of the ellipse area from 9.84×10⁷ km2 (Stage I: 1978–1984) to 1.15 × 10⁸ km2 (Stage V: 2015–2024) highlights a significant broadening of the spatial scope of WCH, aligning with the increased diversity of heritage nominations in non-European regions under globalization. The convergence of the azimuth angle from 95.1° (StageI) to 90.1° (StageV) indicates a shift in spatial orientation from “northwest–southeast” to a predominantly “east–west” alignment, reflecting the rebalancing effect of rising heritage numbers in the Asia-Pacific region (e.g., China, India). Additionally, the migration trajectory of the mean center from Algeria to eastern Libya (“E → EN → ES → E”) underscores the decentralization of Europe’s core clusters and the emergence of new heritage hotspots. These findings collectively demonstrate that the distribution of WCH is not merely a product of historical accumulation but also a spatial manifestation of shifting global cultural power dynamics.

4.2. Mechanism of Action of the Effect Factor

The multi-scale geographically weighted regression (MGWR) model further elucidates the spatial heterogeneity of the influencing factors (Table 6, Figure 7). Bandwidth analysis reveals distinct scales of influence: road density (44 km) and GDP (44 km) exhibit localized sensitivity, driven by regional socioeconomic heterogeneity, while river density (5580 km) demonstrates global-scale connectivity, emphasizing the cross-regional cultural significance of water systems. Spatial variations in regression coefficients provide additional insights; for instance, per capita GDP shows a strong positive effect in Europe (β = 18.2) but negative values in parts of sub-Saharan Africa (β = −6.1), reflecting the dual role of economic development (enhanced conservation capacity in affluent regions versus risks of over-commercialization through excessive tourism). This spatial heterogeneity underscores the need for heritage conservation strategies to balance global principles with local specificity, avoiding uniform policy approaches.
Road density, per capita GDP, and river density are pivotal factors influencing the spatial differentiation of WCH, yet their roles must be contextualized within both historical and modern frameworks to avoid oversimplification. Historically, ancient trade routes such as the Silk Road initially clustered WCH by connecting civilizations, while modern transportation networks enhance accessibility but simultaneously intensify tourism pressures and urban encroachment [31]. Similarly, per capita GDP historically supported heritage construction through agrarian labor-intensive practices like the Banaue Rice Terraces, but today’s tourism-driven economic growth funds conservation while risking commodification, as seen in the overcrowding at Angkor Wat. River density historically provided water resources and natural defense for early settlements such as Nile Valley civilizations, yet contemporary dam construction and pollution now threaten riparian heritage ecosystems [38,39]. This dual-temporal perspective underscores that the spatial mechanisms of WCH are not static but evolve dynamically with shifting socio-environmental contexts (Figure 8).
Elevation, annual precipitation, and aspect ratio are crucial determinants of the spatial differentiation of WCH. Elevation not only shapes topography and climatic conditions but also exhibits dual temporal effects; historically, higher elevations provided defensive advantages and stable microclimates, while currently, climate extremes accelerate erosion at high-altitude sites. Annual precipitation further interacts with elevation; moderate rainfall historically supported agricultural surplus in mid-altitude zones, yet current anomalies disrupt heritage hydrological systems. Similarly, aspect ratio facilitated crop cultivation on sunny aspect, but overexposure to solar radiation now degrades organic materials. These factors collectively drive spatial heterogeneity in heritage quantity, structural adaptation, and socio-cultural practices.
Vegetation index, population density, and GDP fundamentally shape WCH differentiation through context-dependent mechanisms. High vegetation index historically supplied timber for monumental architecture [40], yet modern agricultural expansion fragments forested heritage landscapes. Population density exhibits dual roles; positively, historical demographic hubs enabled collective construction, but negatively, urbanization pressures degrade heritage integrity. GDP’s impacts are equally paradoxical, as economic growth funds advance conservation technologies, yet tourism-driven revenue often prioritizes commercialization over authenticity. The nonlinear interactions among these factors amplify both preservation opportunities and systemic threats to heritage sustainability.

4.3. Suggestion and Limitations

4.3.1. Policy Recommendations

Given the diverse criteria for identifying different types of WCH, several considerations must be addressed in the identification and protection of future WCH. As the negative impacts of GDP and vegetation index necessitate a balanced approach to cultural heritage and economic activities, such as tourism and commercial development. It is imperative to develop emergency plans and protective measures to mitigate the threats posed by natural and climate-related disasters to cultural heritage. The protection and distribution of WCH are dynamic processes influenced by a myriad of historical, cultural, political, and economic factors. Future research should delve into the specific reasons behind regional differences and evaluate the effectiveness of policy measures to achieve a more balanced and harmonious approach to cultural heritage protection and development.
Building on spatial heterogeneity findings (e.g., 80% of WCH below 500 m, road density dominance q = 0.280, per capita GDP divergence β = 18.2 in Europe vs. β = −6.1 in Africa), we propose the following tiered conservation strategy: 1) Revise the UNESCO Guidelines to mandate geographic sensitivity parameters (aspect, precipitation exposure) in nominations, prioritize coastal lowlands in monitoring, and establish a “Global Heritage Resilience Fund” (5% ticket revenue + aid), allocating 70% to African monitoring networks and 30% to European anti-commercialization tech; 2) Enact HIAs in high-density zones (e.g., Europe) to mitigate road infrastructure impacts and deploy CNN drones for real-time crack detection (92% accuracy in Mediterranean arid zones), while integrating indigenous techniques (e.g., Sana’a mud-brick restoration, 30% longevity gain) with AR digitization in low-density regions; 3) Leverage river density’s global effect (bandwidth: 5580 km) to establish “Riverine Heritage Corridors” (e.g., Nile Basin) with shared AI flood prediction and tourism equity; 4) Employ GANs for virtual restoration and multilingual AR tours to reduce visitation pressure, balancing preservation and sustainable access.

4.3.2. Limitations

The long history and cultural diversity of the world often limit access to local historical materials, regional customs, and traditional cultural resources. Consequently, this study was unable to comprehensively analyze the influencing factors of WCH spatial elements from multiple perspectives, nor did it delve into the micro-characteristics of specific case sites within the study area. Additionally, the analysis results of geographic detectors and multi-scale geographically weighted regression (MGWR) are significantly influenced by the scale of the analysis unit. The selection of the analysis unit primarily depends on the characteristics of the underlying data. Currently, much of the physical geography data rely on satellite remote sensing, which is not constrained by administrative boundaries, and the accuracy of the analysis unit is directly proportional to the reliability of the geographic detector results. In contrast, socio-economic data are often limited by administrative divisions. This study employed a 250 × 250 grid as the analysis unit for geographic detectors, considering both administratively restricted and unrestricted data. However, the grid unit may not be optimally suited for exploring the spatial elements of WCH. While the 250 km2 grid integrates multi-source data effectively, it may oversimplify local cultural landscapes (e.g., linear corridors, micro-communities). Future work could adopt nested grids (e.g., global 250 km2 + hotspot 50 km2) or vector boundaries (e.g., watersheds, cultural regions) to refine the analysis units.
The MGWR model’s sensitivity to spatial scale and data resolution may further explain the observed limitations. For example, the low significance ratio of river density (only 0.54% of grids showed statistical significance) could stem from its uniform global distribution or nonlinear interactions with modern conservation mechanisms, which the current grid-based analysis may fail to capture. Similarly, socioeconomic variables constrained by administrative boundaries (e.g., GDP) might mask localized cultural or historical dynamics. Therefore, future analyses of the distribution and influencing factors of world-class cultural heritage should carefully select the scale of the analysis unit based on the characteristics and requirements of the underlying data. To address the constraints identified here, future work should integrate historical hydrology (e.g., paleo-river mapping) and longitudinal socio-cultural datasets to validate and contextualize the spatial mechanisms revealed by MGWR.

5. Conclusions

The exploration of the spatial distribution, evolution, and influencing factors of world cultural heritage (WCH) holds significant theoretical and practical value for the protection and transmission of these invaluable resources. In this study, we analyzed the spatial distribution and evolutionary mechanisms of WCH using kernel density and standard deviation ellipse methods. Additionally, we employed multi-geographic detectors and a multi-scale geographically weighted regression model (MGWR) to explore the influencing factors and mechanisms underlying the spatial distribution of WCH. The following conclusions were drawn:
(1) The highest degree of WCH agglomeration is observed in Europe, with Italy, France, and Germany forming the primary concentration areas, characterized by high density and a certain degree of continuity. China and the Arab countries are the main regions forming the secondary agglomeration areas. In contrast, North America, Eastern Europe, and Russia have a lower distribution of WCH and fail to form large-scale agglomeration areas.
(2) The standard deviation ellipse area in the first stage (1978–1984) is significantly smaller than in the subsequent four stages, indicating a trend towards global distribution and expanding coverage. The spatial distribution of WCH generally follows a direction from “West–Northwest” to “East–Southeast,” showing a trend of east–west dispersion. In the second stage (1984–1994), the average center shifted notably to the east compared to the previous stage, and in the third to fifth stages, there was a slight eastward shift, reflecting a historical migration pattern of “East → East–North → East--South → East” over the five periods.
(3) Among the factors influencing the spatial distribution of WCH, road density exhibits the strongest explanatory power, while population density has the weakest. This suggests that the spatial distribution of WCH is significantly influenced by the density of the road network, whereas the impact of population density is less pronounced. The results from the factor interaction detector indicate that the spatial distribution of WCH is not the result of independent and direct interactions, but rather the product of the interplay of various factors with spatial heterogeneity.
(4) There is evident spatial heterogeneity in the global distribution of WCH, with different influencing factors exhibiting varied mechanisms. Road density has a predominantly positive effect, which is most pronounced in Europe. Overall, river density also has a positive effect, particularly near the equator. The aspect ratio and vegetation rate show contrasting effects, with the former showing no significant spatial differences and the latter being more notable in Europe and North Africa. The positive and negative effects of elevation and GDP are nearly balanced, with the positive effect of GDP being more prominent near the Tropic of Cancer. Annual precipitation has a primarily negative effect, which is most evident in the Sahara region. Population density and per capita GDP generally have a positive effect, with no significant spatial differences in their mechanisms.
(5) Building on the multi-scale heterogeneity and interaction mechanisms, we propose a differentiated conservation framework (Figure 8). For high-density core zones, priority should be given to dynamic tourist flow monitoring and commercialization controls. Medium-density transitional zones require community-participatory governance to synergize heritage conservation with regional economies. Low-density buffer zones should focus on climate adaptation technologies and international monitoring networks. This framework provides scientific support for contextualizing the World Heritage Convention.

Author Contributions

Yangyang Lu: Study design, data curation, writing, funding coordination. Qingwen Han: Visualization, literature review. Jian Dai: Methodological guidance, validation. Zhong Sun: Project administration and spatial analysis. Zheng Zhang: Project administration, funding coordination. All authors have read and agreed to the published version of the manuscript.

Funding

This work was supported by the Humanities and Social Sciences Research Project of Henan Provincial Department of Education, China (Grant No. 2025-ZDJH-427) and the Philosophy and Social Sciences Planning Project of Henan Province, China (Grant No. 2024XWH00832).

Data Availability Statement

The original datasets supporting this study are publicly available and have been described in detail within the manuscript. Processed data (e.g., cleaned, integrated, or analyzed datasets) are available from the corresponding author upon reasonable request.

Conflicts of Interest

The authors declare no conflict of interest.

References

  1. Hill, A. ‘The Battle for Abu Simbel’: Archaeology and Postcolonial Diplomacy in the Unesco Campaign for Nubia. J. Contemp. Hist. 2021, 56, 502–521. [Google Scholar] [CrossRef]
  2. UNESCO. Convention for the Protection of the World Cultural and Natural Heritage (World Heritage Convention)(1); UNESCO: Paris, France, 1972. [Google Scholar]
  3. Rouhi, J. Definition of Cultural Heritage Properties and Their Values By the Past. Asian J. Sci. Technol. 2017, 8, 7109–7114. [Google Scholar]
  4. Zwegers, B. Aachen Cathedral and the Beginnings of World Heritage; Springer International Publishing: Cham, Switzerland, 2022. [Google Scholar] [CrossRef]
  5. Erb-Satullo, N.L. Archaeomaterials, Innovation, and Technological Change. Adv. Archaeomater. 2020, 1, 36–50. [Google Scholar] [CrossRef]
  6. Liang, W.; Ahmad, Y.; Mohidin, H.H.B. The Development of the Concept of Architectural Heritage Conservation and Its Inspiration. Built Herit. 2023, 7, 21. [Google Scholar] [CrossRef]
  7. Hong, Y. Influence of Architectural Heritage on the Identity and Present-day Value of American-designed Universities’ Campuses in Asia. Built Herit. 2020, 4, 15. [Google Scholar] [CrossRef]
  8. O’Donnell, P.M. Cultural Landscapes: Integrating Culture and Nature to Uplift Global Sustainability Through the Lenses of the Un Sdgs 2030 Agend; Springer: Singapore, 2023; pp. 61–78. [Google Scholar]
  9. Zerbe, S. Traditional Cultural Landscapes—A Theoretical Framework; Springer International Publishing: Berlin/Heidelberg, Germany, 2022. [Google Scholar] [CrossRef]
  10. Elgin, C.; Elveren, A.Y. Unpacking the Economic Impact of Tourism: A Multidimensional Approach to Sustainable Development. J. Clean. Prod. 2024, 478, 143947. [Google Scholar] [CrossRef]
  11. Damnjanović, I. Overtourism Effects: Positive and Negative Impacts for Sustainable Development; Springer International Publishing: Berlin/Heidelberg, Germany, 2020. [Google Scholar] [CrossRef]
  12. Bertacchini, E.; Liuzza, C.; Meskell, L.; Saccone, D. The Politicization of Unesco World Heritage Decision Making. Public Choice 2016, 167, 95–129. [Google Scholar] [CrossRef]
  13. Keay, S.J.; Parcak, S.H.; Strutt, K.D. High Resolution Space and Ground-based Remote Sensing and Implications for Landscape Archaeology: The Case From Portus, Italy. J. Archaeol. Sci. 2014, 52, 277–292. [Google Scholar] [CrossRef]
  14. Li, J.; Krishnamurthy, S.; Roders, A.P.; van Wesemael, P. Community Participation in Cultural Heritage Management: A Systematic Literature Review Comparing Chinese and International Practices. Cities 2020, 96, 102476. [Google Scholar] [CrossRef]
  15. Wang, X.; Wei, J.; Hu, C. The Spatial Distribution of World Heritages in China. Geogr. Res. 2010, 29, 2080–2088. Available online: https://www.dlyj.ac.cn/EN/10.11821/yj2010110016 (accessed on 15 July 2024).
  16. Ying, G.; Wang, X.; Fan, X.; Shao, Y.; Guo, H.; Wang, C.; Liu, H. Geographical Distribution Characteristics of African World Heritages. Prog. Geogr. 2013, 32, 958–966. [Google Scholar]
  17. Yin, G. Statistical Analysis on Geographical Distribution of World Heritage. Geogr. Geo-Inf. Sci. 2009, 25, 104–108. [Google Scholar]
  18. Van Westen, C.J. Remote Sensing and Gis for Natural Hazards Assessment and Disaster Risk Management; Elsevier: Amsterdam, The Netherlands, 2013. [Google Scholar] [CrossRef]
  19. Katapidi, I. The Role of Conservation Policies in Local Understandings of Heritage in Living Heritage Places: A Greek Testimony. Int. J. Herit. Stud. 2023, 29, 275–293. [Google Scholar] [CrossRef]
  20. Liu, Y.; Wang, Y.; Dupre, K.; McIlwaine, C. The Impacts of World Cultural Heritage Site Designation and Heritage Tourism on Community Livelihoods: A Chinese Case Study. Tour. Manag. Perspect. 2022, 43, 100994. [Google Scholar] [CrossRef]
  21. Adam, C.; Hurka, S.; Knill, C. Four Styles of Regulation and Their Implications for Comparative Policy Analysis. J. Comp. Policy Anal. Res. Pract. 2017, 19, 327–344. [Google Scholar] [CrossRef]
  22. Hu, J.; Teng, Y.; Fan, Y. Spatial Distribution and Influencing Factors of Traditional Villages in Guangxi Zhuang Autonomous Region. J. Guilin Univ. Technol. 2021, 41, 580–588. [Google Scholar]
  23. UNESCO. World Heritage List. 2024. Available online: https://whc.unesco.org/en/list/ (accessed on 20 January 2025).
  24. National Centers for Environmental Information. Geoid Height Geotiff. 2022. Available online: https://www.ncei.noaa.gov/products/etopo-global-relief-model (accessed on 15 July 2024).
  25. Esrimitchel, A. The Esri Guide to Gis Analysis, Volume 2: Spartial Measurements and Statistics. In Esri Guide to Gis Analysis; ESRI Press: Redlands, CA, USA, 2005. [Google Scholar]
  26. Fisher, N.I.; Lewis, T.; Embleton, B.J.J. Statistical Analysis of Spherical Data; Cambridge University Press: Cambridge, UK, 1987. [Google Scholar] [CrossRef]
  27. Zhao, J.; Zhang, Y. Study on the Spatial Distribution Characteristics and Promotion Approach of Network Concern of China’s World Heritage Sites. J. Yanshan Univ. Philos. Soc. Sci. 2023, 24, 78–87. [Google Scholar] [CrossRef]
  28. Zhou, S.; Peng, S. Study on the Spatial Distribution of Traditional Villages and Their Influencing Factors in Guizhou Province Based on Geodetectors. Agric. Technol. 2024, 44, 106–112. [Google Scholar] [CrossRef]
  29. Fotheringham, A.S.; Yang, W.; Kang, W. Multiscale Geographically Weighted Regression (mgwr). Ann. Am. Assoc. Geogr. 2017, 107, 1247–1265. [Google Scholar] [CrossRef]
  30. Yang, R.; Luo, X.; Chen, Y. Spatial Pattern and Influencing Factors of Rural Multifunctionality at County Level in China. Prog. Geogr. 2019, 38, 1316–1328. [Google Scholar] [CrossRef]
  31. Shen, W.; Chen, Y.; Cao, W.; Yu, R.; Rong, P.; Cheng, J. Spatial Pattern and Its Influencing Factors of National-level Cultural Heritage in China. Herit. Sci. 2024, 12, 384. [Google Scholar] [CrossRef]
  32. Congressional Research Service; Benjamin Hayes. The Antiquities Act: History, Current Litigation, and Considerations for the 116th Congress; 20. Available online: https://purl.fdlp.gov/GPO/gpo137783 (accessed on 16 April 2025).
  33. Ennahid, S. Africa, North: Historical Archaeology; Elsevier: Amsterdam, The Netherlands, 2024. [Google Scholar] [CrossRef]
  34. Watts, I. Blood Symbolism at the Root of Symbolic Culture? African Hunter-gatherer Perspectives. J. Anthropol. Archaeol. 2024, 76, 101627. [Google Scholar] [CrossRef]
  35. Varela, S.L.L. Mexico’s Heritage and Management; Springer International Publishing: Berlin/Heidelberg, Germany, 2018. [Google Scholar] [CrossRef]
  36. DeSoucey, M.; Elliott, M.A.; Schmutz, V. Rationalized Authenticity and the Transnational Spread of Intangible Cultural Heritage. Poetics 2019, 75, 101332. [Google Scholar] [CrossRef]
  37. Santa, E.D.; Tiatco, S.A. Tourism, Heritage and Cultural Performance: Developing a Modality of Heritage Tourism. Tour. Manag. Perspect. 2019, 31, 301–309. [Google Scholar] [CrossRef]
  38. Zhang, P.; Li, S. Associative Cultural Landscape Approach to Interpreting Traditional Ecological Wisdom: A Case of Inuit Habitat. Front. Archit. Res. 2024, 13, 79–96. [Google Scholar] [CrossRef]
  39. Irfan, M.; Mir, S.A.; Bali, B.S.; Afzal, A.; Bhat, N.A.; Bhat, N.; Bashir, A.; Nazir, M. Unveiling the Geoheritage, Cultural Geomorphology and Geotourism Potential of Zanskar Region, Nw Himalaya, India. Geomorphology 2024, 462, 109354. [Google Scholar] [CrossRef]
  40. Zhang, Y.; He, Y. Human-land Relationship in the Construction of Historical Settlements Based on Complex Adaptive System (cas) Theory: Evidence From Shawan in Guangfu Region, China. Herit. Sci. 2024, 12, 173. [Google Scholar] [CrossRef]
Figure 1. Flowchart of the proposed method.
Ijgi 14 00190 g001
Figure 2. Distribution at Different Elevations.
Ijgi 14 00190 g002
Figure 3. Kernel density of WCH global distribution.
Ijgi 14 00190 g003
Figure 4. Number by region in different years. Note: Data reflect the distribution of world cultural heritage (WCH) sites only.
Ijgi 14 00190 g004
Figure 5. Kernel density of different stages.
Ijgi 14 00190 g005aIjgi 14 00190 g005b
Figure 6. Migration trend of standard deviation ellipse with mean center for the five stages after superimposition. (a) Global scale; (b) Variation in the ellipse; (c) Trajectory of the mean center.
Ijgi 14 00190 g006
Figure 7. Spatial distribution of regression coefficients for significant explanatory variables in the MGWR model. Note: Subplots use independent scales to optimize spatial pattern legibility; factor strength rankings are provided in Table 4.
Ijgi 14 00190 g007aIjgi 14 00190 g007bIjgi 14 00190 g007cIjgi 14 00190 g007d
Figure 8. Mechanisms influencing the spatial differentiation of WCH.
Ijgi 14 00190 g008
Table 1. Number in different regions.
AreaArea TypeNumber of WCHNumber of WMHProportion (%)
Latin America and the CaribbeanArea-A103812.26
Europe and North AmericaArea-B4901246.85
Asia and the PacificArea-C2111224.20
Arab StatesArea-D8737.85
AfricaArea-E6158.83
Total 95240100
Note: UNESCO’s regional divisions are rooted in geography but adapted for cultural and operational coherence.
Table 2. Standard deviation ellipse and mean center index of five stages.
YearStageAzimuth AngleArea (km2)Long Axis (km)Short Axis(km)OblatenessMean CenterChange Direction and Distance
1984Stage I95.1079.841 × 1079242.7183389.1910.633E 1°55′13″, N 27°31′42″——
1994Stage II92.2921.101 × 1089783.1743582.1180.634E 13°6′44″, N 28°17′31″EN, 1249.005 km
2004Stage III90.2431.153 × 1089692.1703787.4360.609E 15°33′5″, N 29°22′16″EN, 297.223 km
2014Stage IV90.5001.159 × 1089898.1343728.7820.623E 19°26′45″, N 28°54′19″ES, 436.373 km
2024Stage V90.1281.150 × 1089846.9383718.6630.622E 21°12′11″, N 28°57′42″EN, 195.922 km
Table 3. The type and parameters of the influencing factors.
TypeFactorNumberCalculation MethodUnit
Natural FactorsRoad DensityX1Gridded road miles/Gridded areakm/km2
River DensityX2Gridded water system miles/Gridded areakm/km2
Aspect RatioX3Gridded aspect area/Gridded area%
Vegetation IndexX4ArcGIS raster extraction%
AltitudeX5ArcGIS raster extractionm
Annual precipitationX6ArcGIS raster extractionmm
Societal FactorGDPX7ArcGIS raster extractionMillion
Population DensityX8Gridded population/Gridded areapcs/km2
Per capita GDPX9GDP/PopulationUSD
Table 4. Single-factor geographic detection results.
Factorq-Value and Rankingp-Value and Significance Level
Road Density (X1)0.28010.0000.01
Per capita GDP (X9)0.18320.0000.01
River Density (X2)0.16230.0000.01
Altitude (X5)0.07040.0000.01
Annual Precipitation (X6)0.05150.0000.01
Aspect Ratio (X3)0.04760.0000.01
Vegetation Index (X4)0.04470.0000.01
GDP (X7)0.04380.0000.01
Population Density (X8)0.03490.0000.01
Note: Factors are ordered by descending q-values, with higher values indicating stronger explanatory power.
Table 5. Two-factor interactive detection results.
X1X2X3X4X5X6X7X8X9
X10.280
X20.327 ↗0.162
X30.297 ↗0.167 ↗0.047
X40.313 ↗0.171 ↗0.076 ↗0.044
X50.295 ↗0.171 ↗0.094 ↗0.088 ↗0.070
X60.315 ↗0.182 ↗0.072 ↗0.097 ↖0.097 ↗0.051
X70.312 ↗0.200 ↗0.093 ↖0.093 ↖0.113 ↖0.101 ↖0.043
X80.300 ↗0.189 ↗0.080 ↗0.081 ↖0.100 ↗0.090 ↖0.064 0.034
X90.400 0.323 ↗0.241 ↖0.259 ↖0.247 ↗0.267 ↖0.203 ↗0.211 ↗0.183
Note: ↖ nonlinear enhanced relationships; ↗ Two-factor enhanced relationship.
Table 6. Collinearity test results and MGWR analysis parameters.
FactorGWR BandwidthMGWR Analysis Parameters and Results
BandwidthPositive Negative Proportion of p ≤ 0.05
Road Density (X1)81.00044.00098%2%43.25%
River Density (X2)5580.000100%0%0.54%
Aspect Ratio (X3)5580.0000%100%42.93%
Vegetation Index (X4)5580.0000%100%100%
Altitude (X5)3854.00050%50%0%
Annual Precipitation (X6)107.00034%66%7.57%
GDP(X7)44.00048%52%38.81%
Population Density (X8)55.00064%36%23.66%
Per Capita GDP (X9)55.00073%27%39.61%
Disclaimer/Publisher’s Note: The statements, opinions and data contained in all publications are solely those of the individual author(s) and contributor(s) and not of MDPI and/or the editor(s). MDPI and/or the editor(s) disclaim responsibility for any injury to people or property resulting from any ideas, methods, instructions or products referred to in the content.

