Abstract
Scientific site selection for urban parks is an important way to increase urban resilience and safeguard people’s well-being. Aiming at the lack of systematic consideration in the traditional park siting research, this study utilizes geographically weighted regression to explore the various characteristic factors affecting the spatial distribution of parks, and based on this, combines the random forest model and the interpretable model to accurately assess the potential of parks on urban land in Shenzhen and provide the basis for site selection. The study indicates that: ① Shenzhen’s parks exhibit complex differentiation characteristics in terms of natural landscape elements and the intensity of economic activities; ② The geographically weighted random forest (GWRF) model has better learning and generalization capabilities compared to the random forest (RF) model, and the average accuracy of the GWRF model is improved by 0.04 compared to the traditional RF model; ③ The park’s development potential is divided according to the results of the GWRF model, with 52.01% denoted as the potential incubation zone, 21.15% the potential accumulation zone, 8.25% the potential growth zone, and 18.59% the potential core zone; ④ Through interpretability analysis, it is identified that vegetation coverage, the density of tourist attractions or points of interest (POI), slope, elevation, and nighttime light intensity are the most significant factors affecting park development potential, while the distance to roads and the distance to bodies of water are the least influential factors. The research systematically explores a quantitative evaluation framework for the development potential of Shenzhen’s parks, opening new theoretical pathways and practical paradigms for the sustainable development planning of Shenzhen under the “Park City” concept.
1. Introduction
Amid the accelerating global urbanization process, the rational planning and efficient utilization of urban spaces have become indispensable for sustaining urban development. As a crucial element of the urban green infrastructure system, urban parks not only significantly benefit the ecological environment, such as improving urban microclimates [1], mitigating the urban heat island effect [2], and reducing stormwater runoff to lower flood risks [3], but also greatly contribute to social well-being by promoting residents’ physical and mental health [4], enhancing community cohesion [5], and increasing surrounding property values [6]. However, as urban boundaries continue to expand, the scarcity of land resources becomes increasingly prominent, posing higher demands on the scientific evaluation and rational layout of urban parks. Precisely identifying and assessing potential areas for park construction has thus become a core issue in current urban planning practices.
Over the years, scholars worldwide have conducted extensive foundational research on the development potential and site selection of urban public service facilities. This line of inquiry can be traced back to 1909, when the renowned German economist Alfred Weber proposed the industrial warehouse location model in Theory of the Location of Industries [7]. Regarding the assessment and site selection of park development potential, research has evolved from qualitative analysis to various quantitative methods, including the analytic hierarchy process (AHP) [8] and GIS-based suitability evaluation [9]. Regarding research methodology, current studies primarily rely on constructing comprehensive evaluation indicator systems to assess development suitability. However, these methods still exhibit subjectivity in indicator selection and weight determination, along with limitations in handling complexity. Regarding research accuracy, most studies abstract facilities as point elements due to data availability constraints [9,10], representing parks based on entrance locations or geometric centers while paying less attention to the spatial configuration of park areas. In terms of research scale, existing studies predominantly focus on macro-level analyses at the municipal [8,10] or district levels [11], with limited attention to finer-scale grid-based site selection. Meanwhile, recent advancements in big data and artificial intelligence have introduced new perspectives and tools for urban spatial analysis. Machine learning methods such as gradient-boosted decision trees (GBDT), random forest (RF), and multilayer perceptrons (MLP) [10,11,12], as well as deep learning techniques like generative adversarial networks (GAN) and deep neural networks (DNNs) [13,14], have gained traction in urban research due to their strong data processing capabilities and predictive accuracy. However, certain limitations remain. Existing model integration strategies tend to emphasize global evaluation frameworks, potentially overlooking the impact of regional characteristics on facility potential assessment. Moreover, while “black-box” models are efficient, they compromise interpretability, reducing decision-making transparency [15,16].
Based on this, the following study takes Shenzhen as a case study and employs a hexagonal grid with a 300 m edge-to-center distance as the basic analytical unit. By integrating multi-source data and explicitly considering the spatial configuration of park areas, we apply geographically weighted regression (GWR) analysis to examine the spatial heterogeneity of Shenzhen’s existing park distribution. Building on this foundation, we select a series of indicators that characterize park spatial distribution as evaluation factors. We then utilize a geographically weighted random forest (GWRF) model combined with interpretable modeling techniques to assess the park development potential of each analytical unit and explore the underlying influencing factors. This approach provides a refined and scientifically grounded decision-making framework for park site selection.
2. Materials and Methods
2.1. Study Area
Shenzhen is located in the coastal region of southern Guangdong Province and is one of the core cities of the Guangdong-Hong Kong-Macao Greater Bay Area. Geographically, it lies between 22°27′ and 22°52′ N latitude and 113°46′ and 114°37′ E longitude. As one of China’s most urbanized cities, Shenzhen features a high population density and a compact land-use structure (Figure 1), resulting in a significant demand for park development. As a representative city in China’s park-oriented urban development, Shenzhen had built and put into use a total of 1238 parks by the end of 2021 (excluding the Shenshan Special Cooperation Zone), with the number of parks ranking among the top cities in the country and being widely distributed (Figure 2), in which the scope of the park refers to the extent of urban park area of interest (AOI) data, and the scope of research refers to the city area where the development potential of the whole Shenzhen city is measured. The city is actively working to further integrate and optimize its existing “City of a Thousand Parks” framework, aiming to transition toward a more advanced “City of One Park” model.
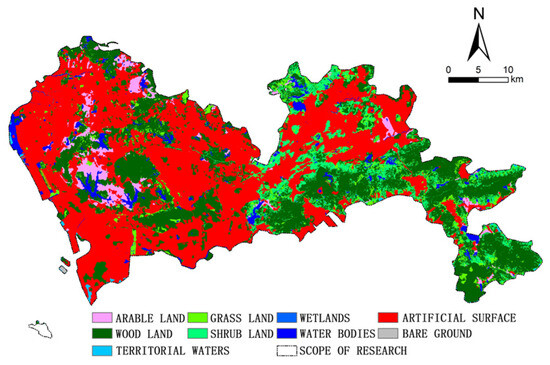
Figure 1.
Land use map of Shenzhen.
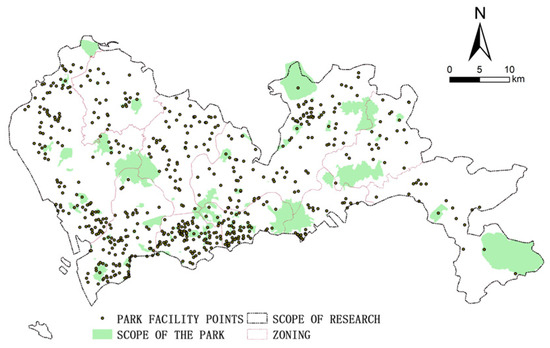
Figure 2.
Distribution of parks in Shenzhen.
2.2. Multi-Source Urban Data
This study used multi-source, multi-level geographic information data involving six dimensions related to park development potential: natural, economic, facility, transportation, ecological, and safety. The specific years, sources, and relevant explanations of the data are provided in Table 1. Among them, the POI (Point of Interest) data were categorized based on the Baidu Map classification standards and, following the research by Wang Xiaochun et al. [17], fourteen types of POI data were selected, including catering facilities, accommodation services, sports and leisure, etc., resulting in a total of 437,587 facility data points (Table 2). The obtained data cover 10 administrative districts and 74 streets in Shenzhen, laying the data foundation for subsequent research and ensuring the accuracy and reliability of the analysis.

Table 1.
Sources of data for the study.
Table 2.
POI data classification and quantity.
2.3. Data Preprocessing
According to the Urban Green Space Classification Standard (CJJ/T 85-2017), which specifies a community park service radius of 300–500 m, and Shenzhen’s “300 m Green Vision” urban park development goal, this study establishes a hexagonal research grid with a 300 m edge-to-edge distance at a micro-scale level. This approach divides the entire Shenzhen area into 6670 research units (Figure 3). Multiple-source data within each research unit grid were cleaned and preprocessed, including filling in missing values and standardizing data, to ensure the accuracy and consistency of the data. Target assignment was conducted for the research grid units. When there is a park within the current research grid, it is assigned a value of 1 and categorized as a positive class. When there is no urban park within the research grid, it was assigned a value of 0 and categorized as a negative class. This conversion transforms the algorithm model training into a binary classification problem, facilitating the model to achieve better training results.
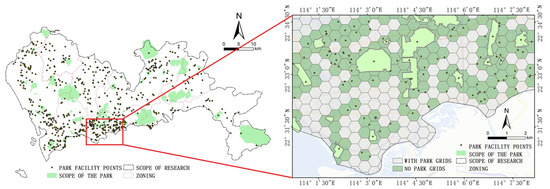
Figure 3.
The division of the urban park grid and local diagram of Shenzhen City.
2.4. Feature Matrix Construction
In the process of using machine learning for problem-solving, the effectiveness of feature engineering has a decisive impact on the accuracy and scientific validity of the final model predictions. Various types of features represent influencing factors. Based on the research of scholars like Huang Jiujun et al. [18], through a detailed integration of data analysis and field investigations, it was found that urban parks in Shenzhen are often located in areas with excellent ecological environments, good economic foundations, and convenient citizen travel. Combining the current research results and considering the reliability and availability of data, this study constructed a feature matrix from six aspects: natural attributes, socio-economic factors, surrounding facilities, transportation location, ecological environment, and spatial security. When determining various feature elements, reference was made to the research of scholars such as Zhang Guozhuang et al. [19], Zaheer et al. [14], and Huang Qin et al. [20]. Finally, the Shenzhen Urban Park Spatial Potential Assessment Index System (Table 3) was constructed, including 30 feature factors such as elevation, water area proportion, population density, density of various types of POI facilities, road network density, vegetation coverage rate, and street safety index.
Table 3.
Selection of park development potential characterization factors.
2.5. Methodology
This study establishes a framework for measuring the spatial potential of urban parks (Figure 4). By analyzing the spatial differentiation characteristics of existing parks and incorporating the random forest (RF) algorithm model, model tuning and evaluation are conducted. An interpretable model is used to analyze feature factors and calculate the contribution value of each feature to the final prediction results, ensuring the scientific validity and accuracy of the model predictions. The predicted results of the model are then compared with the current park layout, ultimately yielding the spatial potential measurement results for parks in Shenzhen.
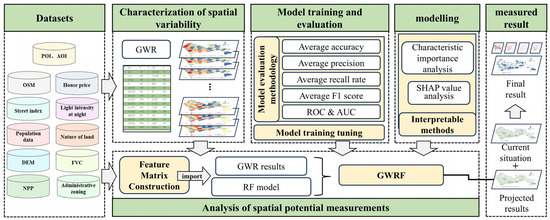
Figure 4.
Roadmap of the Park Spatial Potential Measurement Framework.
2.5.1. Geographically Weighted Regression
Geographically weighted regression (GWR) can obtain local regression coefficients based on different geographic spatial units, effectively reflecting the spatial heterogeneity of driving factors and the variations in their direction and intensity across different areas [21]. The calculation formula is as follows:
where is the observed value of the dependent variable at the geographic location , is the observed value of the -th independent variable at the same location, represents the local regression coefficient of the -th independent variable at this geographic location, and is the random error term.
2.5.2. The Random Forest
The random forest (RF) model, proposed by Breiman [22], is a classical machine learning algorithm based on the ensemble of multiple decision tree algorithms to enhance predictive performance and generalization ability. This algorithm is primarily used for classification and regression tasks, predicting the final result through voting (for classification problems) or averaging (for regression problems). The calculation formula for the RF model can be expressed as:
where is the predicted result, is the indicator function used for logical judgment, represents the prediction from the -th base decision tree model in the ensemble, and indicates the target variable, which is the prediction result generated by each individual decision tree.
2.5.3. The Geographically Weighted Random Forest
The geographically weighted random forest (GWRF) model is an extension of the random forest (RF) model in the field of geography [23]. This model allows for the consideration of spatial context within the neighborhood of each prediction point or area by assigning higher weights to nearby observation points. This enables the model parameters to reflect variations in spatial locations. The simplified formula for GWRF can be expressed as:
where is the predicted result at geographic location , is the total number of decision trees in the forest, represents the weight assigned to the -th observation based on its proximity to location , and is the prediction from the -th base decision tree model.
2.5.4. Shapley Additive Explanations
The feature importance method [24] is a common choice for explaining random forest algorithms, but it cannot clearly reveal how the model makes specific decisions based on these features. Therefore, this study chose to incorporate SHAP (SHapley Additive exPlanations) to enhance the interpretability of the random forest model [25]. SHAP is a prediction model-agnostic technique that assigns importance values to input features based on their contribution to the prediction results [15]. For a model with M features predicting the output of a specific sample x, the SHAP value for each feature i can be calculated using the following formula:
where represents the output predicted by the model on the feature subset , and the feature values not in in are set to some baseline value. denotes the number of features in the set .
3. Results
3.1. Characterization of the Spatial Differentiation of the Current Situation
To delve into the underlying causes of spatial differentiation in current park spaces, this study systematically examined the spatial variation characteristics of various factors using the GWR method. Before conducting GWR analysis, to eliminate estimation bias caused by interactions between factors, ordinary least squares (OLS) regression was performed with the 30 pre-selected feature factors as independent variables. Considering the limitations of GWR in binary classification problems, park POI kernel density was selected as the dependent variable for collinearity testing analysis. The results (see Table 4) showed that the variance inflation factor (VIF) values for 10 feature factors, such as life service POI density and transportation facility POI density, exceeded 7.5, indicating multicollinearity issues requiring exclusion. Additionally, eight feature factors, including vegetation coverage rate, street safety index, environmental hygiene index, air pollution index, distance to roads, land nature, traffic congestion index, and distance to bodies of water, were not suitable for geographically weighted processing due to low spatial resolution, poor accuracy, and the presence of dummy variables, necessitating removal.
Table 4.
Statistics of OLS covariance test results.
Following variable selection, the remaining 12 feature factors, such as water area proportion, population density, and nighttime light intensity, were chosen as explanatory variables for GWR model analysis. Based on their reflection of environmental and socio-economic characteristics, these twelve key factors can be categorized into natural landscape elements and economic activity intensity (Figure 5 and Figure 6).
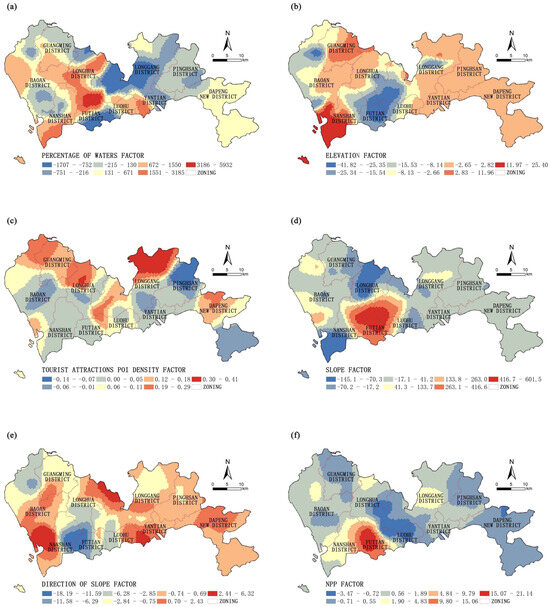
Figure 5.
Spatial differentiation of natural landscape factor coefficients. (a) Percentage of waters factor; (b) Elevation factor; (c) Tourist attractions POI density factor; (d) Slope factor; (e) Direction of slope factor; (f) NPP factor.
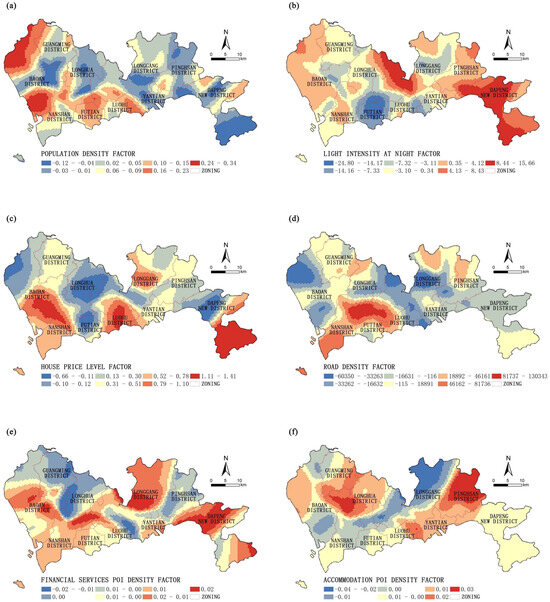
Figure 6.
Spatial differentiation of economic activity factor coefficients. (a) Population density factor; (b) Light intensity at night factor; (c) House price level factor; (d) Road density factor; (e) Financial Services POI density factor; (f) Accommodation POI density factor.
The results from GWR and OLS indicate that the akaike information criterion corrected (AICc) value for GWR, 110,914.81, is lower than the AICc value for OLS, 115,484.12. Additionally, the R2 value for GWR, 0.91, is higher than the R2 value for OLS, 0.81. These findings suggest that GWR exhibits better goodness of fit compared to OLS.
3.1.1. Differentiation of Natural Landscape Elements
The proportion of bodies of water positively influence the overall development potential of parks, as is particularly evident in the districts of Nanshan, Bao’an, Longhua, Luohu, and Yantian. In these areas, abundant water resources not only enrich the natural landscape of parks but also promote the integration of ecological and leisure functions. Conversely, in the southern part of Futian District and the central part of Longgang District, bodies of water often restrict park development. In Futian District, characterized by the highest economic density in Shenzhen, the limited availability of water areas resulted from highly developed land use patterns. Additionally, bodies of water in Longgang District mainly consist of reservoirs or water source protection zones, unsuitable for park green space conversion.
Elevation exhibits a predominantly negative impact on park development potential across most regions, particularly significant at the border areas of the Futian, Longhua, Longgang, and Luohu districts. This suggests that higher altitudes in these regions may be associated with unfavorable terrain conditions, soil stability issues, and increased construction costs. However, in the southern coastal areas of Nanshan District and the eastern part of Guangming District, elevation positively influences park development potential. Especially in the southern part of Nanshan District, increasing elevation correlates with a more pronounced positive impact on park development. This phenomenon may be attributed to the unique geographical features of these areas, such as the undulating coastline, providing natural viewing platforms and diverse ecosystems that enhance the aesthetic value and ecological functions of parks.
The density coefficient of tourist attraction POI exhibits significant north-south differentiation, with its impact on park development potential gradually increasing from south to north. In the northern parts of the Guangming, Longhua, Longgang, and Dapeng New districts, the positive impact of tourist attraction POI density on park development potential is more pronounced. Despite the potentially relatively lagging economic development in these areas, the abundance of tourist resources significantly influences the planning and construction of parks. In contrast, negative impacts are observed in areas such as Nanshan, Futian, and Yantian, indicating that the concentrated distribution of tourist attractions in these economically intensive and highly modernized central urban areas does not directly translate into positive momentum for park development, but rather limits the expansion and optimization of park green spaces.
Overall, the regional differences in the development potential of parks in Shenzhen are significantly influenced by various features of natural landscapes, exhibiting complex yet traceable patterns of interaction.
3.1.2. Differentiation of Economic Activity Variations
The influence of population density on the development potential of parks exhibits significant regional characteristics, forming a pattern of higher density in the west and lower density in the east, as well as an imbalance between the north and south. Significant positive impacts are observed in the northern and southern parts of Bao’an District, followed by the border areas of the Futian, Luohu, and Longgang districts, indicating a strong positive driving force for park construction. This underscores the urgent demand for public green spaces in densely populated areas. Conversely, significant negative impacts are evident in the southern part of Dapeng New District and the central-eastern part of Bao’an District, closely related to the natural geographical features of these areas, where vast natural parks and continuous mountainous terrain result in sparse populations.
Nighttime light intensity, as an indirect reflection of urban vitality and economic activities, exhibits significant spatial heterogeneity in its impact on park development potential within Shenzhen. Specifically, areas with positive impacts are mainly distributed along the northern parts of Bao’an District, central parts of Nanshan District, eastern parts of Longhua District, northern parts of Longgang District, Pingshan District, and Dapeng New District, forming a belt-shaped distribution. This indicates that these regions, characterized by active nighttime economic activities, have increased demand for park green spaces, reflecting the potential value of parks in enhancing urban nightscapes and residents’ nighttime leisure activities. In contrast, areas with negative impacts are concentrated at the borders of the Futian, Longhua, and Luohu districts, forming a point-nucleated distribution. This may be attributed to land resource constraints resulting from highly developed urban functions and high-density development in these areas, thereby limiting the spatial expansion of park green spaces.
Overall, the level of housing prices exhibits a positive impact on park development potential, particularly evident in the southern parts of Bao’an District, Nanshan District, Luohu District, and Dapeng New District, as well as the northern parts of Longgang District. These areas with higher housing prices not only reflect stronger economic vitality and purchasing power but also indicate higher demand for ecological and recreational facilities such as park green spaces. In contrast, the northern parts of Bao’an District, Longhua District, Futian District, and Dapeng New District exhibit a negative impact on park development potential. This may be attributed to the high land costs in these areas, which limit the supply of green spaces. Economic considerations often prioritize ecological and public space development, resulting in bottlenecks in park development in these regions.
Road density overall exhibits a positive impact on park development potential, primarily significant in areas at the borders of Nanshan District, as well as the Longhua, Futian, Luohu, and Longgang districts. In these areas, higher road density not only improves park accessibility but also promotes the development of surrounding plots and economic activities, indirectly enhancing the economic feasibility and social demand for park development. Conversely, areas with negative impacts are mainly found in the northern parts of Bao’an District and central parts of Longgang District. These areas, serving as hubs of urban road transportation, bear a significant volume of transit traffic, leading to the primary use of road networks for transportation functions rather than meeting the slow-moving needs of local communities.
The overall density of financial services and accommodation services POI exhibits a weak positive impact on park development potential. However, their effects on positive and negative impact zones are exactly opposite. Specifically, areas with higher density of financial services POI usually coincide with areas of lower density of accommodation services POI, indicating a positive promoting effect on park development potential, and vice versa. Furthermore, the impact patterns of these factors are not randomly distributed but exhibit belt-shaped distributions, closely aligned with administrative district boundaries. This reflects the unique functional positioning of each administrative district in Shenzhen and, to some extent, highlights the issue of residential and occupational separation in various districts.
In conclusion, there is a significant correlation between the development potential of parks in Shenzhen and the intensity of economic activities in different regions. This correlation is reflected through various feature factors, collectively constituting a complex yet patterned interactive mode.
3.2. Measurement of Park Development Potential
The spatial heterogeneity coefficients of various feature factors obtained from the GWR model were strategically weighted for the random forest (RF) model. Specifically, the spatial heterogeneity coefficient of each feature output from the GWR model is used as a weighting factor and applied to the corresponding feature values in the RF model. It is essentially a spatial correction of feature importance, so that the model can more closely reflect the differences in the influence of each feature on urban park siting in different geographic locations, and then construct a geographically weighted random forest (GWRF) model.
3.2.1. Model Training and Evaluation
During the training process of the RF and GWRF models using current data, to optimize model performance and prevent overfitting, a grid search method was employed to tune the model parameters. The optimal parameters for the random forest model were estimated to be 150 estimators and a maximum depth of 30. This parameter combination effectively balanced model complexity and generalization capability. To further enhance model generalization performance and reduce the possibility of overfitting, ten-fold cross-validation strategy was adopted. This involved calculating the average of the ten-fold prediction results to compare and evaluate the robustness and reliability of the models’ predictions.
Through ten-fold cross-validation (Figure 7 and Figure 8), it was observed that there was a significant difference between the third and fourth folds, indicating some non-stationarity within the dataset. Additionally, during the ten-fold cross-validation process, violin plots were used to visualize the performance of the four metrics (Figure 9 and Figure 10). It was evident that there was less fluctuation in the performance of the GWRF model compared to the RF model, indicating its superior generalization capability. This implies that the GWRF model’s predictions are equally reliable in unseen data or new scenarios.
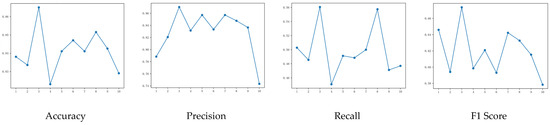
Figure 7.
RF model cross-validation results.
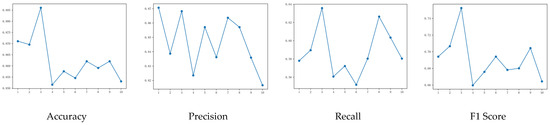
Figure 8.
GWRF model cross-validation results.
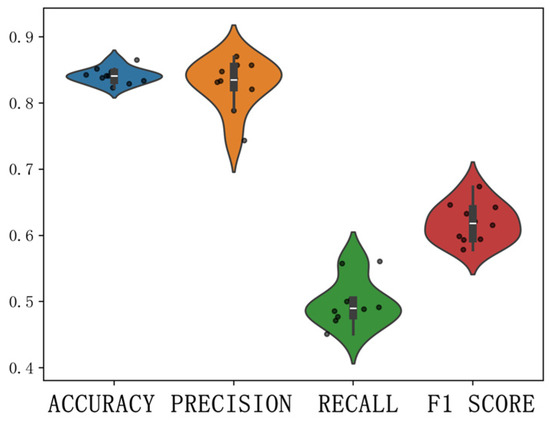
Figure 9.
RF model cross-validation violin plot.
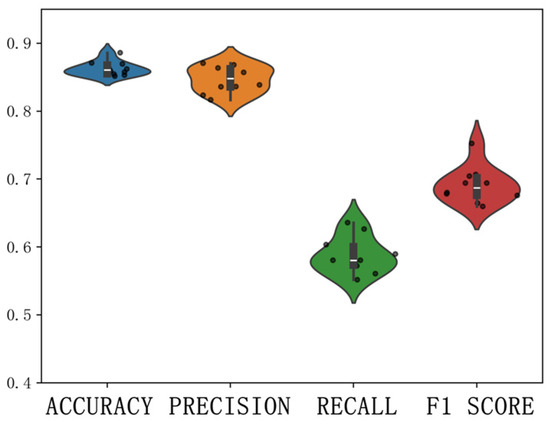
Figure 10.
GWRF model cross-validation violin plot.
By computing the average values of the four metrics (Table 5), it was found that the average accuracy of the traditional random forest (RF) model was 0.83, with an average precision of 0.82, an average recall of 0.47, and an average F1 score of 0.60, indicating good predictive performance. In contrast, the geographic weighted random forest (GWRF) model achieved an average accuracy of 0.87, an average precision of 0.85, an average recall of 0.60, and an average F1 score of 0.70. These metrics represent improvements over the traditional RF model, suggesting that GWRF is a more suitable model for assessing park potential.
Table 5.
Comparison of RF and GWRF model metrics assessment.
Building upon this, the receiver operating characteristic (ROC) curve and area under curve (AUC) metrics were incorporated to enhance the comprehensiveness of the evaluation. The AUC metric measures the probability that the model correctly distinguishes between positive and negative samples, with values closer to 1 indicating better classification performance across all possible positive-negative sample pairs. According to the evaluation results (Figure 11 and Figure 12), the AUC value of the traditional random forest model was 0.85, while the geographically weighted random forest model achieved an AUC value of 0.89, indicating a noticeable improvement in predictive performance.
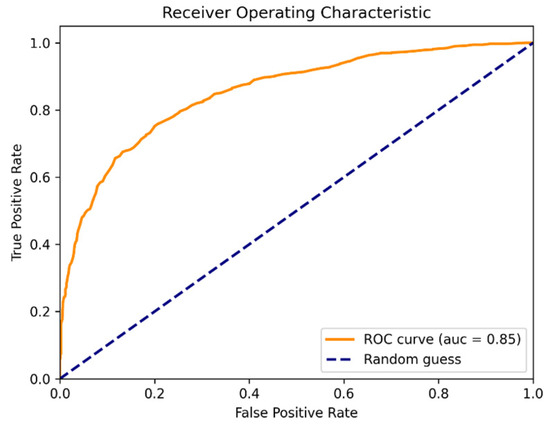
Figure 11.
RF model ROC graph.
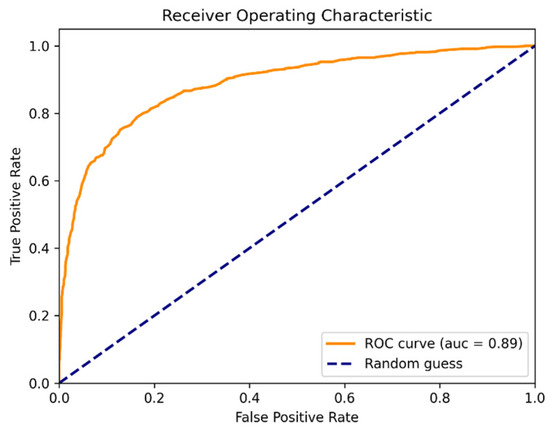
Figure 12.
GWRF model ROC graph.
Based on the comprehensive evaluation results, whether through a detailed examination of individual metrics or utilizing the ROC area (AUC value) assessment, the geographic weighted random forest (GWRF) model demonstrates superior predictive performance compared to the traditional random forest (RF) model. This indicates that the GWRF model exhibits higher learning efficiency and stronger adaptability when handling geographical spatial heterogeneity features, allowing for more accurate identification and modeling of non-uniformity and variability information within geographical spaces.
3.2.2. Development Potential Measurement Results
Using the optimal parameter configuration of the GWRF model, the original data was analyzed to measure the potential for park development in land use across Shenzhen. This analysis yielded predicted probability values for each grid unit, where the magnitude of the probability values represents the potential for park development in each grid.
To further deepen the analysis and refine the classification of potential development areas, a natural breakpoint classification method was adopted. The predicted probability results were divided into four intervals: Incubation Zone (0–0.23), Potential Accumulation Zone (0.23–0.46), Growth Zone (0.46–0.76), and Core Potential Zone (0.76–1). These divisions were compared with the actual situation and current patterns, and then subjected to secondary verification and optimization adjustments. Finally, the Park Development Potential Assessment Map of Shenzhen was constructed (Figure 13).
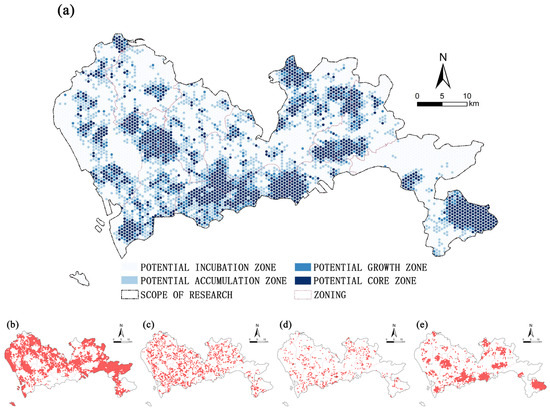
Figure 13.
Mapping of Park Development Potential Measurement in Shenzhen City. (a) Park Potential Measurement Results; (b) Potential Incubation Zone; (c) Potential Accumulation Zone; (d) Potential Growth Zone; (e) Potential Core Zone.
Potential Incubation Zone: The GWRF model predicts very low development potential in this area, with a total of 3469 grid units, accounting for 52.01% of the total grid units. It is mainly distributed in Bao’an District, the eastern part of Guangming District, Longhua District, the central part of Longgang District, the eastern part of Pingshan District, and Dapeng New District. The park development potential in these areas is relatively low. Most of the low potential areas are constrained by natural conditions and current land use, such as water source protection areas (such as Tiegang Reservoir in Bao’an District, Gongming Reservoir in Guangming District, and Qiankeng Reservoir in Longhua District), airports, sports and leisure facilities (such as golf courses, tennis centers), undeveloped mountainous areas (such as the central part of Longgang District and Dapeng New District), and green spaces within large enclosed communities or hotels. The possibility of converting these areas into park spaces is relatively low. When planning park construction in these areas, the cost-effectiveness ratio needs to be carefully considered. However, regions with significant ecological advantages, such as Dapeng New District, may have lower feasibility for park development in the near term due to their relatively lagging urbanization process. Nonetheless, they hold good long-term prospects in urban planning.
Potential Accumulation Zone: The GWRF model predicts relatively low development potential in this area, with a total of 1411 grid units, accounting for 21.15% of the total grid units. Its geographical distribution characteristics show that it is closely adjacent to the existing layout of parks and exhibits a relatively concentrated clustering form. These areas are typically surrounded by mature urban infrastructure and enjoy relatively high-quality spatial environments. Some areas benefit from higher levels of economic development. Although they demonstrate some feasibility for conversion into park spaces compared to areas with very low potential, they are still constrained by various conditions. Therefore, a comprehensive assessment approach is needed in future planning, along with exploring innovative strategies to activate their potential for green development.
Potential Growth Zone: The GWRF model predicts moderate development potential in this area, with a total of 550 grid units, accounting for 8.25% of the total grid units. Its distribution characteristics appear scattered and lack clear organizational patterns. Compared to the current park layout, most of these areas are either already constructed or under construction as parks. The remaining areas have excellent ecological backgrounds and significant potential for growth, indicating vast opportunities for development and enhancement in terms of greening construction. Therefore, these areas not only demonstrate strong feasibility for park construction but also possess favorable development conditions and reasonable investment return expectations. They should rightly become the core focus in the mid-term planning strategies.
Potential Core Zone: The GWRF model predicts a relatively high development potential in this area, with a total of 1240 grid units, accounting for 18.59% of the total grid units. Its geographical distribution pattern shows a significant tendency towards concentration, highly aligning with the existing spatial layout of parks. It’s worth noting that large parks are mainly concentrated in the southern region, while the northern region, although with fewer large parks, also boasts high-quality ecological conditions, characterized by high vegetation coverage within grid units and abundant natural capital. These areas, with their outstanding natural endowments, superior geographical locations, and the urgent demand for social development, demonstrate a high degree of suitability for park construction, as indicated by the prominent prediction probabilities.
3.2.3. Interpretability Analysis
Based on the optimal parameters of the GWRF model, an interpretability analysis was conducted by comparing feature importance with SHAP, explaining and analyzing the factors influencing park development potential.
From the results of the feature importance analysis (Figure 14), it can be seen that elevation (6.02%), tourist attraction POI density (5.76%), vegetation coverage rate (5.40%), slope (5.35%), nighttime light intensity (4.78%), and housing price level (4.52%) have the greatest impact on park development potential. Indicators with lower feature importance, such as distance to roads (0.43%), land nature (0.88%), and distance to bodies of water (1.24%), contribute less to the model’s performance. In addition, other features with low contribution rates have weaker direct correlations with park spatial development potential, insufficient to provide sufficient learning information during model training.
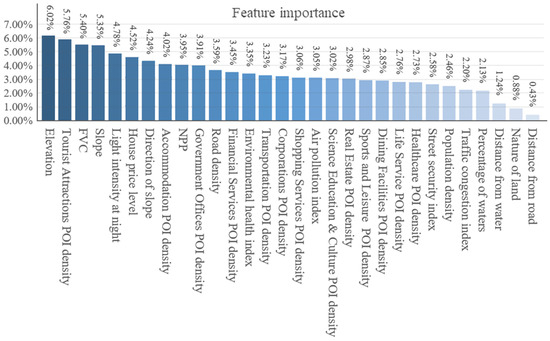
Figure 14.
Feature importance map.
The scatter plot analysis of SHAP results (Figure 15) reveals the contribution of each feature factor to the model’s predicted output. Further sorting the mean absolute values of SHAP values allows us to obtain the importance sequence of each feature in predicting park development potential. The results (Figure 16) show that factors such as vegetation coverage rate, slope, nighttime light intensity, elevation, tourist attraction POI density, and street safety index are considered to have a significant impact on park development potential. In comparison, factors such as population density, distance to bodies of water, and distance to roads have a certain positive impact on park development potential, but their overall influence is limited. It is worth noting that the distribution of most features exhibits significant asymmetry, indicating relatively weak discriminative ability of these features when predicting non-park land (i.e., negative class samples). Additionally, features such as air pollution index, traffic congestion index, density of financial service POI, and density of company and enterprise POI exhibit negative correlations with park development potential, suggesting that the suitability of park development may be limited in areas with these high conditions.
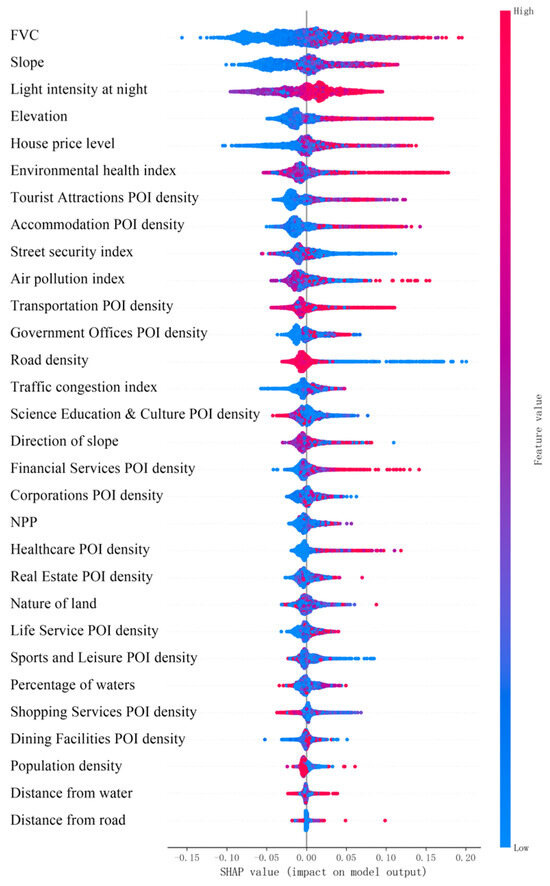
Figure 15.
Scatter plot of SHAP values.
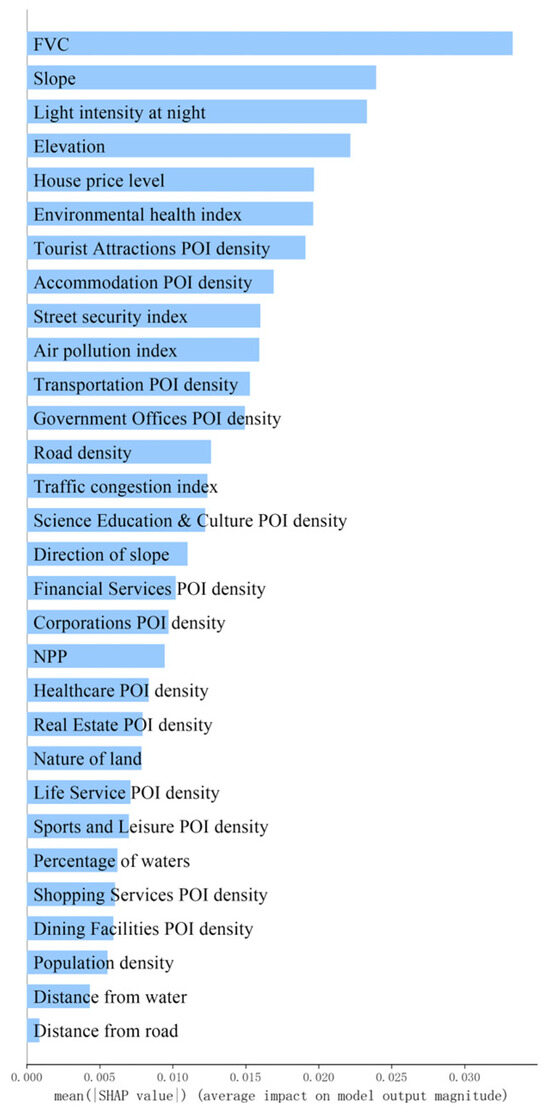
Figure 16.
Plot of SHAP mean absolute value ranking.
Combining the results of feature importance and SHAP analysis, we can identify the five most significant driving factors influencing urban park space potential. These are vegetation coverage rate, tourist attraction POI density, slope, elevation, and nighttime light intensity. At the same time, the analysis also reveals two categories of factors with the weakest influence, which are distance to roads and distance to bodies of water.
4. Discussion
Parks, as indispensable public space resources within cities, serve multiple functions for residents’ daily leisure and social activities [26]. The measurement of their potential constitutes a highly complex and systemic decision-making issue. Although this study achieved good predictive results during the measurement process, there are still several limitations to consider. Firstly, the datasets used in the study were not fully aligned in terms of time series and spatial resolution. Additionally, the street-related index data had a coarse spatial granularity, which could not accurately reflect the micro-level spatial differences. Secondly, the study adopted a simplified approach to park type classification, treating all parks as homogeneous categories, thus overlooking the functional, scale, and facility differences among parks. Furthermore, there was a lack of exploration regarding whether there are differences between grid cells inside parks and those at the edges. Lastly, when applying the GWR model for spatial heterogeneity analysis, limitations arose due to the inability to handle dummy variables and the limited precision of the original data. This resulted in some key features not being effectively incorporated into the GWR framework for heterogeneity analysis, potentially affecting the predictive efficacy of the model and reducing its explanatory power and predictive accuracy regarding the spatial variability of park development potential.
Future research could focus on deepening the subdivision of park types, optimizing and expanding the feature indicator system, and introducing more advanced data analysis techniques to provide more solid methodological support for the scientific measurement of urban park potential.
5. Conclusions
The study conducted a measurement of urban park development potential in Shenzhen by integrating multi-source spatial data with a geographically weighted random forest (GWRF) model, providing both methodological insights and practical paradigms for urban park site selection. The principal findings are summarized as follows:
The spatial distribution of existing parks in Shenzhen demonstrates co-influences from natural landscape elements and economic activity intensity. The coefficients of influencing factors exhibit significant spatial heterogeneity across different geographical regions, indicating that park construction follows discernible spatial patterns governed by multifactorial interactions.
In the development potential assessment, the GWRF model demonstrated superior learning capacity and generalization performance compared to conventional random forest (RF) models. Based on GWRF analysis results, Shenzhen’s park development potential reveals a four-tier spatial differentiation: potential incubation zones predominantly located in suburban areas face natural constraints and land use limitations, showing lower cost-effectiveness for near-term development; potential accumulation zones adjacent to existing parks benefit from mature infrastructure, making them optimal targets for mid-term planning; potential growth zones with fragmented distribution demonstrate moderate potential and investment returns, warranting focused attention in the near- to mid-term; potential core zones concentrated in southern regions exhibit superior natural conditions and locational advantages, representing priority areas for immediate park development.
Comprehensive analysis combining feature importance metrics and SHAP values identifies vegetation coverage rate, POI density of tourist attractions, slope gradient, elevation, and nighttime light intensity as the most significant determinants of park development potential. Conversely, distance to roads and bodies of water showed minimal influence. These findings suggest prioritizing the analysis of high-impact factors in future park site selection processes.
The study advances urban green space planning through a spatially explicit evaluation framework combining multi-source geospatial analytics and hybrid machine learning. The proposed GWRF-enhanced methodology not only improves predictive accuracy in development potential mapping but also elucidates spatially heterogeneous drivers of park suitability. The stratified zoning strategy derived from multidimensional potential assessments offers a replicable template for balancing ecological preservation and recreational demand in high-density cities.
Translating these findings into planning practice requires policymakers as well as urban planning experts to strategically align development objectives with spatial potential and ecological constraints. Immediate investment should be directed toward the core potential zones, where favorable natural conditions and urban accessibility converge, ensuring a high return on investment and public benefit. In the accumulation zones, the synergy between existing parks and mature infrastructure presents an opportunity to efficiently extend green space networks while minimizing additional costs.
Although incubation zones currently face constraints due to topography or land use, they represent strategic reserves for future green infrastructure. Integrating these areas into long-term ecological planning through land preservation policies and preparatory interventions can help safeguard urban resilience and spatial equity. Given the spatial heterogeneity of influencing factors, particularly the varied impacts of vegetation, terrain, and urban activity intensity across regions, planning frameworks should adopt flexible, context-sensitive approaches. These approaches can support refined spatial governance that better responds to localized development needs and ecological characteristics. Moreover, the strong predictive power of indicators such as vegetation coverage and POI density underscores the importance of incorporating such high-impact variables into planning tools and spatial decision-support systems. Doing so can enable data-informed site selection and policy evaluation, fostering more intelligent, adaptive urban park development strategies.
Overall, this research provides a scientific basis for advancing the vision of “park cities” by promoting ecologically sensitive, demand-responsive, and spatially balanced green infrastructure planning. It contributes to the evolving discourse on sustainable urban transformation and offers actionable guidance for cities aiming to enhance both environmental quality and human well-being.
Author Contributions
Conceptualization, Haihong Li; Methodology, Li He. All authors have read and agreed to the published version of the manuscript.
Funding
This research was funded by the Natural Science Foundation of Hubei Province: Study on Simulation Forecasting and Application of Expansion Mode of Mono-city Cluster Based on Spatial Interaction (2019CFB355) and the Jingzhou Think Tank Project: Study on Rural Revitalisation Planning Strategies for Jingzhou Suburban Integration Villages in the Context of Co-Creation (Jzsk-yk2313).
Data Availability Statement
The original data source of the article can be found in the main text. Further inquiries can be directed to the corresponding author.
Conflicts of Interest
The authors declare no conflict of interest.
References
- Jamei, E.; Rajagopalan, P.; Seyedmahmoudian, M.; Jamei, Y. Review on the impact of urban geometry and pedestrian level greening on outdoor thermal comfort. Renew. Sustain. Energy Rev. 2016, 54, 1002–1017. [Google Scholar] [CrossRef]
- Liao, W.; Guldmann, J.M.; Hu, L.; Cao, Q.; Gan, D.; Li, X. Linking urban park cool island effects to the landscape patterns inside and outside the park: A simultaneous equation modeling approach. Landsc. Urban Plan. 2023, 232, 104681. [Google Scholar] [CrossRef]
- Lai, Y.; Lu, Y.; Ding, T.; Sun, H.; Li, X.; Ge, X. Effects of Low-Impact Development Facilities (Water Systems of the Park) on Stormwater Runoff in Shallow Mountainous Areas Based on Dual-Model (SWMM and MIKE21) Simulations. Int. J. Environ. Res. Public Health 2022, 19, 14349. [Google Scholar] [CrossRef] [PubMed]
- Browning, M.H.E.M.; Rigolon, A.; McAnirlin, O. Where greenspace matters most: A systematic review of urbanicity, greenspace, and physical health. Landsc. Urban Plan. 2022, 217, 104233. [Google Scholar] [CrossRef]
- Jennings, V.; Bamkole, O. The relationship between social cohesion and urban green space: An avenue for health promotion. Int. J. Environ. Res. Public Health 2019, 16, 452. [Google Scholar] [CrossRef]
- Hussain, T.; Abbas, J.; Zou, W.; Ahmad, S.; Bi, X.; Zhu, G. Impact of urban village disamenity on neighboring residential properties: Empirical evidence from Nanjing through hedonic pricing model appraisal. J. Urban Plan. Dev. 2021, 147, 04020055. [Google Scholar] [CrossRef]
- Brandeau, M.L.; Chiu, S.S. An overview of representative problems in location research. Manag. Sci. 1989, 35, 645–674. [Google Scholar] [CrossRef]
- Yan, S.; Liang, L.; Yu, R.; Wang, W. The Indicator System for the Suitability Evaluation of Theme Park Construction in Urban Areas in China. Sci. Geogr. Sin. 2016, 36, 213–221. [Google Scholar]
- Xiao, Z.; Liu, P.; Liu, Y.; Hu, F.; Peng, H.; Zhang, Z.; Gao, P. Evaluation and Selection of Potential Scenic View-point Distribution Areas Based on GIS and Fuzzy Analytic Hierarchy Process—An Example from Jiulangshan Mountain Park in Zhuzhou. For. Resour. Manag. 2020, 01, 158–165. [Google Scholar]
- Xia, C.; Zhai, G. Research on Dynamic Mechanism of Territorial Space Evolution in Yangtze River Delta Based on GBDT Machine Learning Algorithm. Urban Dev. Stud. 2022, 29, 12–19. [Google Scholar]
- Hou, Y.; Wang, Q.; Zhou, K.; Zhang, L.; Tan, T. Integrated machine learning methods with oversampling technique for regional suitability prediction of waste-to-energy incineration projects. Waste Manag. 2024, 174, 251–262. [Google Scholar] [CrossRef]
- Yousefi, S.; Avand, M.; Yariyan, P.; Goujani, H.J.; Costache, R.; Tavangar, S.; Tiefenbacher, J.P. Identification of the most suitable afforestation sites by Juniperus excels specie using machine learning models: Firuzkuh semi-arid region, Iran. Ecol. Inform. 2021, 65, 101427. [Google Scholar] [CrossRef]
- Hu, Y.; Wen, W.; Liu, Y.; Zheng, H. Location Optimization of Urban Express Pickup Service Facilities Based on GAN. J. Tianjin Univ. Sci. Technol. 2022, 55, 1237–1248. [Google Scholar]
- Zaheer, N.; Hassan, S.U.; Ali, M.; Shabbir, M. Optimal school site selection in Urban areas using deep neural networks. J. Ambient. Intell. Humaniz. Comput. 2022, 13, 1–15. [Google Scholar] [CrossRef]
- Awadh, M.A.; Mallick, J. A decision-making framework for landfill site selection in Saudi Arabia using explainable artificial intelligence and multi-criteria analysis. Environ. Technol. Innov. 2024, 33, 103464. [Google Scholar] [CrossRef]
- Rao, S.; Mehta, S.; Kulkarni, S.; Dalvi, H.; Katre, N.; Narvekar, M. A Study of LIME and SHAP Model Explainers for Autonomous Disease Predictions. In Proceedings of the 2022 IEEE Bombay Section Signature Conference (IBSSC), Mumbai, India, 8–10 December 2022; pp. 1–6. [Google Scholar]
- Wang, X.; Xiong, F.; Wang, Z.; Chen, S.; Zhang, Z.; Peng, L. Planning and Layout of Facilities for the Elders Based on POI and Machine Learning: A Case Study of Wuhan. Econ. Geogr. 2021, 41, 49–56. [Google Scholar]
- Huang, J.; Lin, Y.; Tao, Z.; Yang, J. Evaluation of park green space accessibility in Shenzhen from the perspective of social equity. Sci. Geogr. Sin. 2022, 42, 896–906. [Google Scholar]
- Zhang, G.; Zhao, D.; Sun, L.; Li, X. The analysis of spatial suitability and multi-objective optimal location of Urtan Pocket Park. Sci. Surv. Mapp. 2022, 47, 224–234. [Google Scholar]
- Huang, Q.; Yang, B.; Xu, X.; Hao, H.; Liang, L.; Wang, M. Location selection and prediction of SexyTea store in Changsha City based on multisource spatial data and random forest model. J. Geo-Inf. Sci. 2022, 24, 723–737. [Google Scholar]
- Mei, Z.; Zhang, Y.; Huang, X.; Liu, Z. Ecological risk assessment and its influencing factors of spatial heterogeneity based on ecosystem services in Qinghai Lake Basin. Acta Ecol. Sin. 2024, 44, 4973–4986. [Google Scholar]
- Breiman, L. Random forests. Mach. Learn. 2001, 45, 5–32. [Google Scholar] [CrossRef]
- Georganos, S.; Grippa, T.; Niang Gadiaga, A.; Linard, C.; Lennert, M.; Vanhuysse, S.; Mboga, N.; Wolff, E.; Kalogirou, S. Geographical random forests: A spatial extension of the random forest algorithm to address spatial heterogeneity in remote sensing and population modelling. Geocarto Int. 2021, 36, 121–136. [Google Scholar] [CrossRef]
- Belgiu, M.; Drăguţ, L. Random forest in remote sensing: A review of applications and future directions. ISPRS J. Photogramm. Remote Sens. 2016, 114, 24–31. [Google Scholar] [CrossRef]
- Mangalathu, S.; Hwang, S.H.; Jeon, J.S. Failure mode and effects analysis of RC members based on machine-learning-based SHapley Additive exPlanations (SHAP) approach. Eng. Struct. 2020, 219, 110927. [Google Scholar] [CrossRef]
- Chen, Y.; Deng, M.; Wang, C. Spatial-temporal Differentiation and Influencing Mechanism of Accessibility of Park Green Spaces: A Case Study Based on Shenzhen City. South Archit. 2023, 7, 66–76. [Google Scholar]
Disclaimer/Publisher’s Note: The statements, opinions and data contained in all publications are solely those of the individual author(s) and contributor(s) and not of MDPI and/or the editor(s). MDPI and/or the editor(s) disclaim responsibility for any injury to people or property resulting from any ideas, methods, instructions or products referred to in the content. |
© 2025 by the authors. Published by MDPI on behalf of the International Society for Photogrammetry and Remote Sensing. Licensee MDPI, Basel, Switzerland. This article is an open access article distributed under the terms and conditions of the Creative Commons Attribution (CC BY) license (https://creativecommons.org/licenses/by/4.0/).