

A Study of the Non-Linear Relationship Between Urban Morphology and Vitality in Heritage Areas Based on Multi-Source Data and Machine Learning: A Case Study of Dalian
Abstract
1. Introduction
- What is the spatial distribution of urban morphology elements and vitality in Dalian’s heritage areas and urban districts?
- How do morphology elements in heritage areas and urban areas influence daytime and nighttime vitality, and what are the nonlinear effects?
2. Research Framework
2.1. Measuring Urban Vitality
2.2. Measurement of Urban Morphology
2.3. Research Methodology
3. Research Area and Dataset
3.1. Research Area
3.2. Research Dataset
4. Research Results
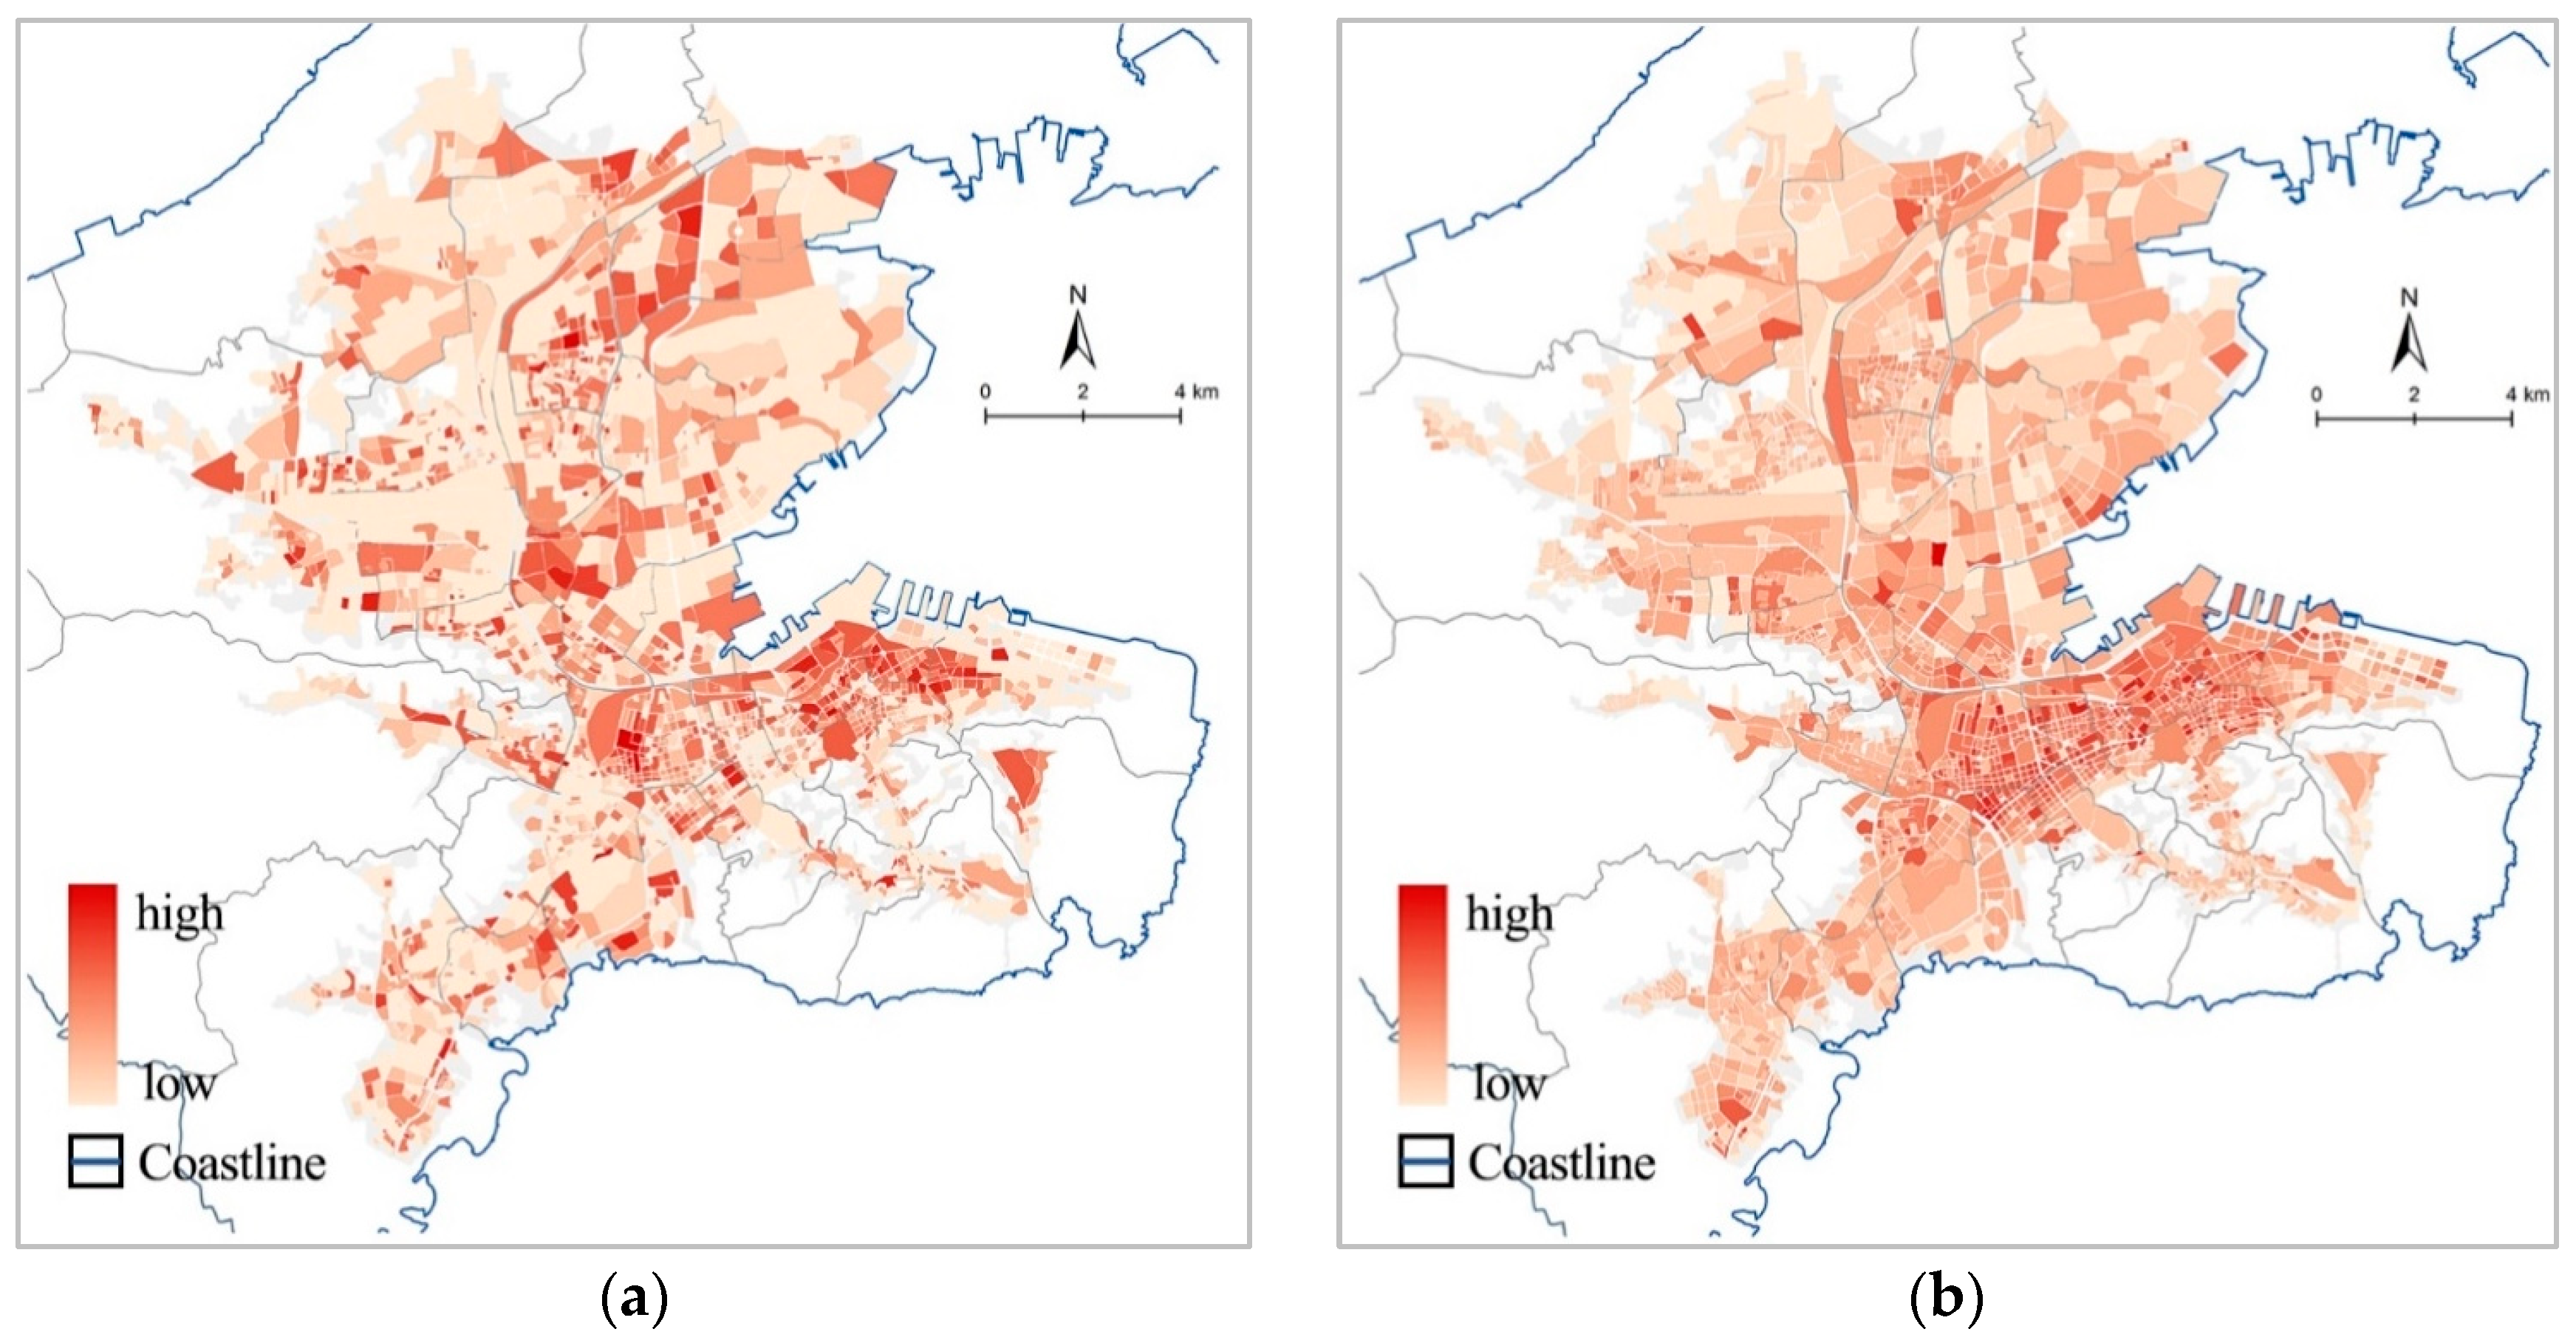
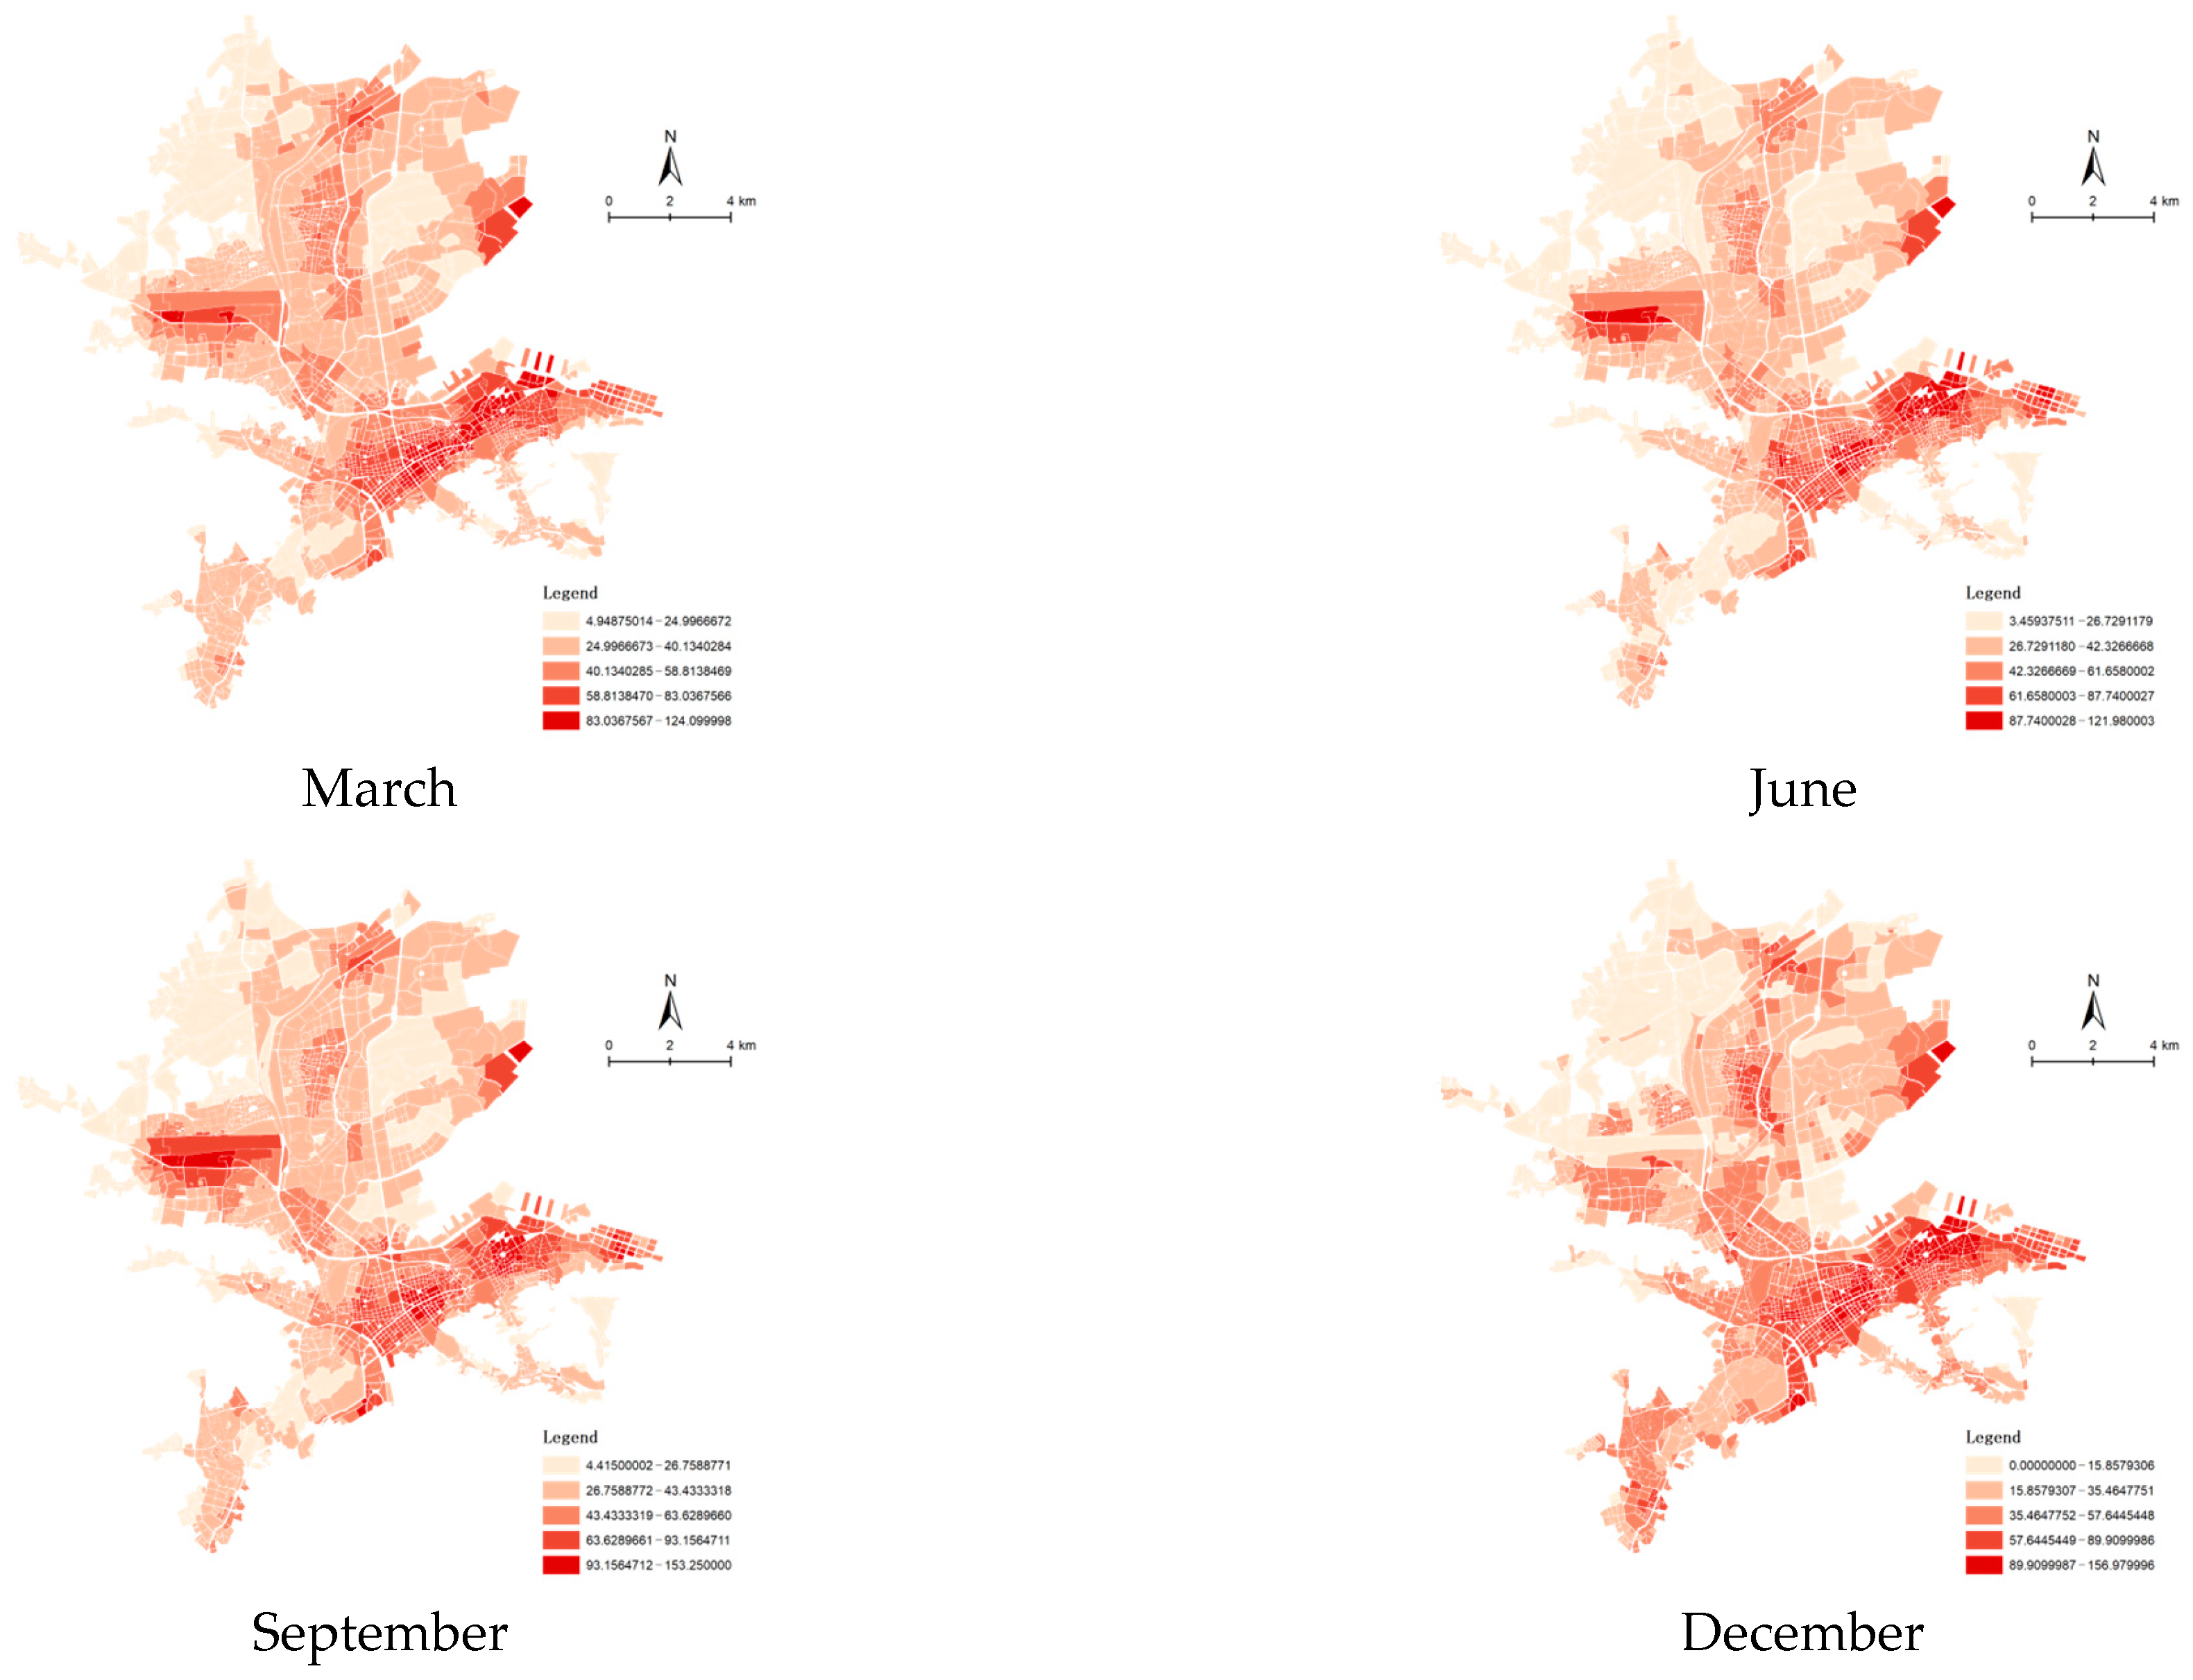
4.1. Analysis of the Spatial Distribution of Vitality
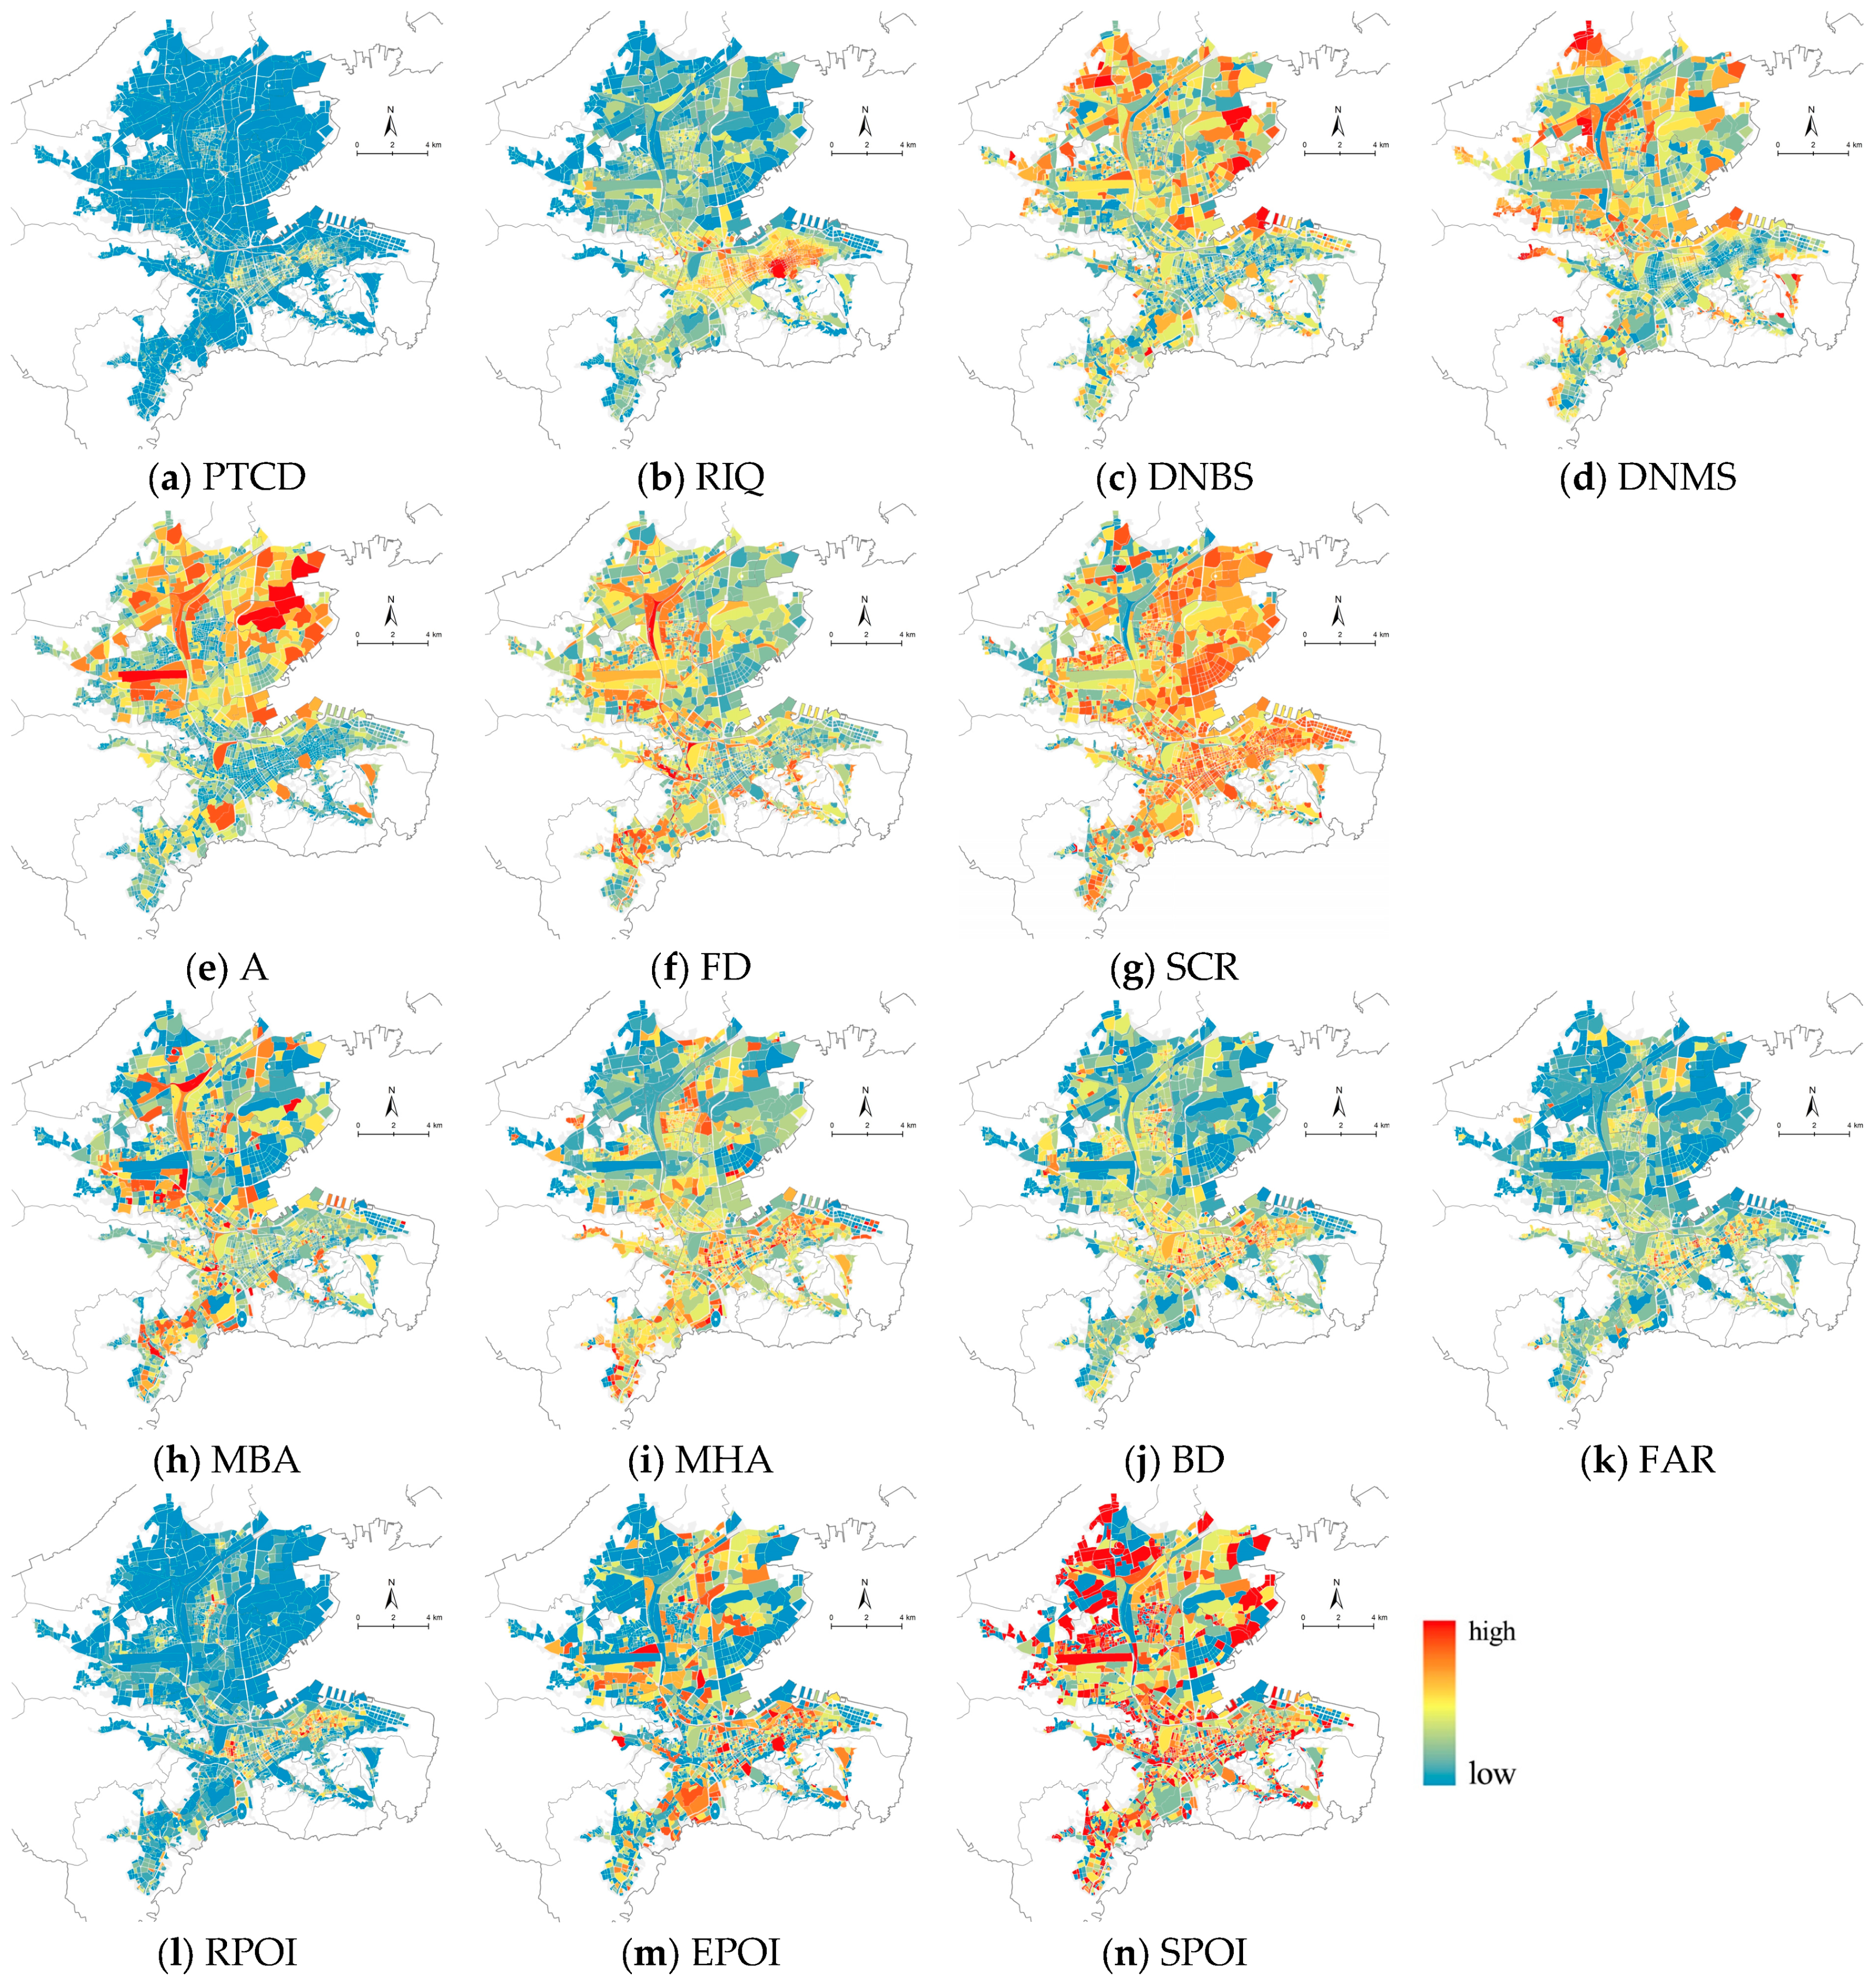
4.2. Analysis of the Spatial Distribution of Urban Form
4.3. Influences on Heritage Areas and Urban Areas
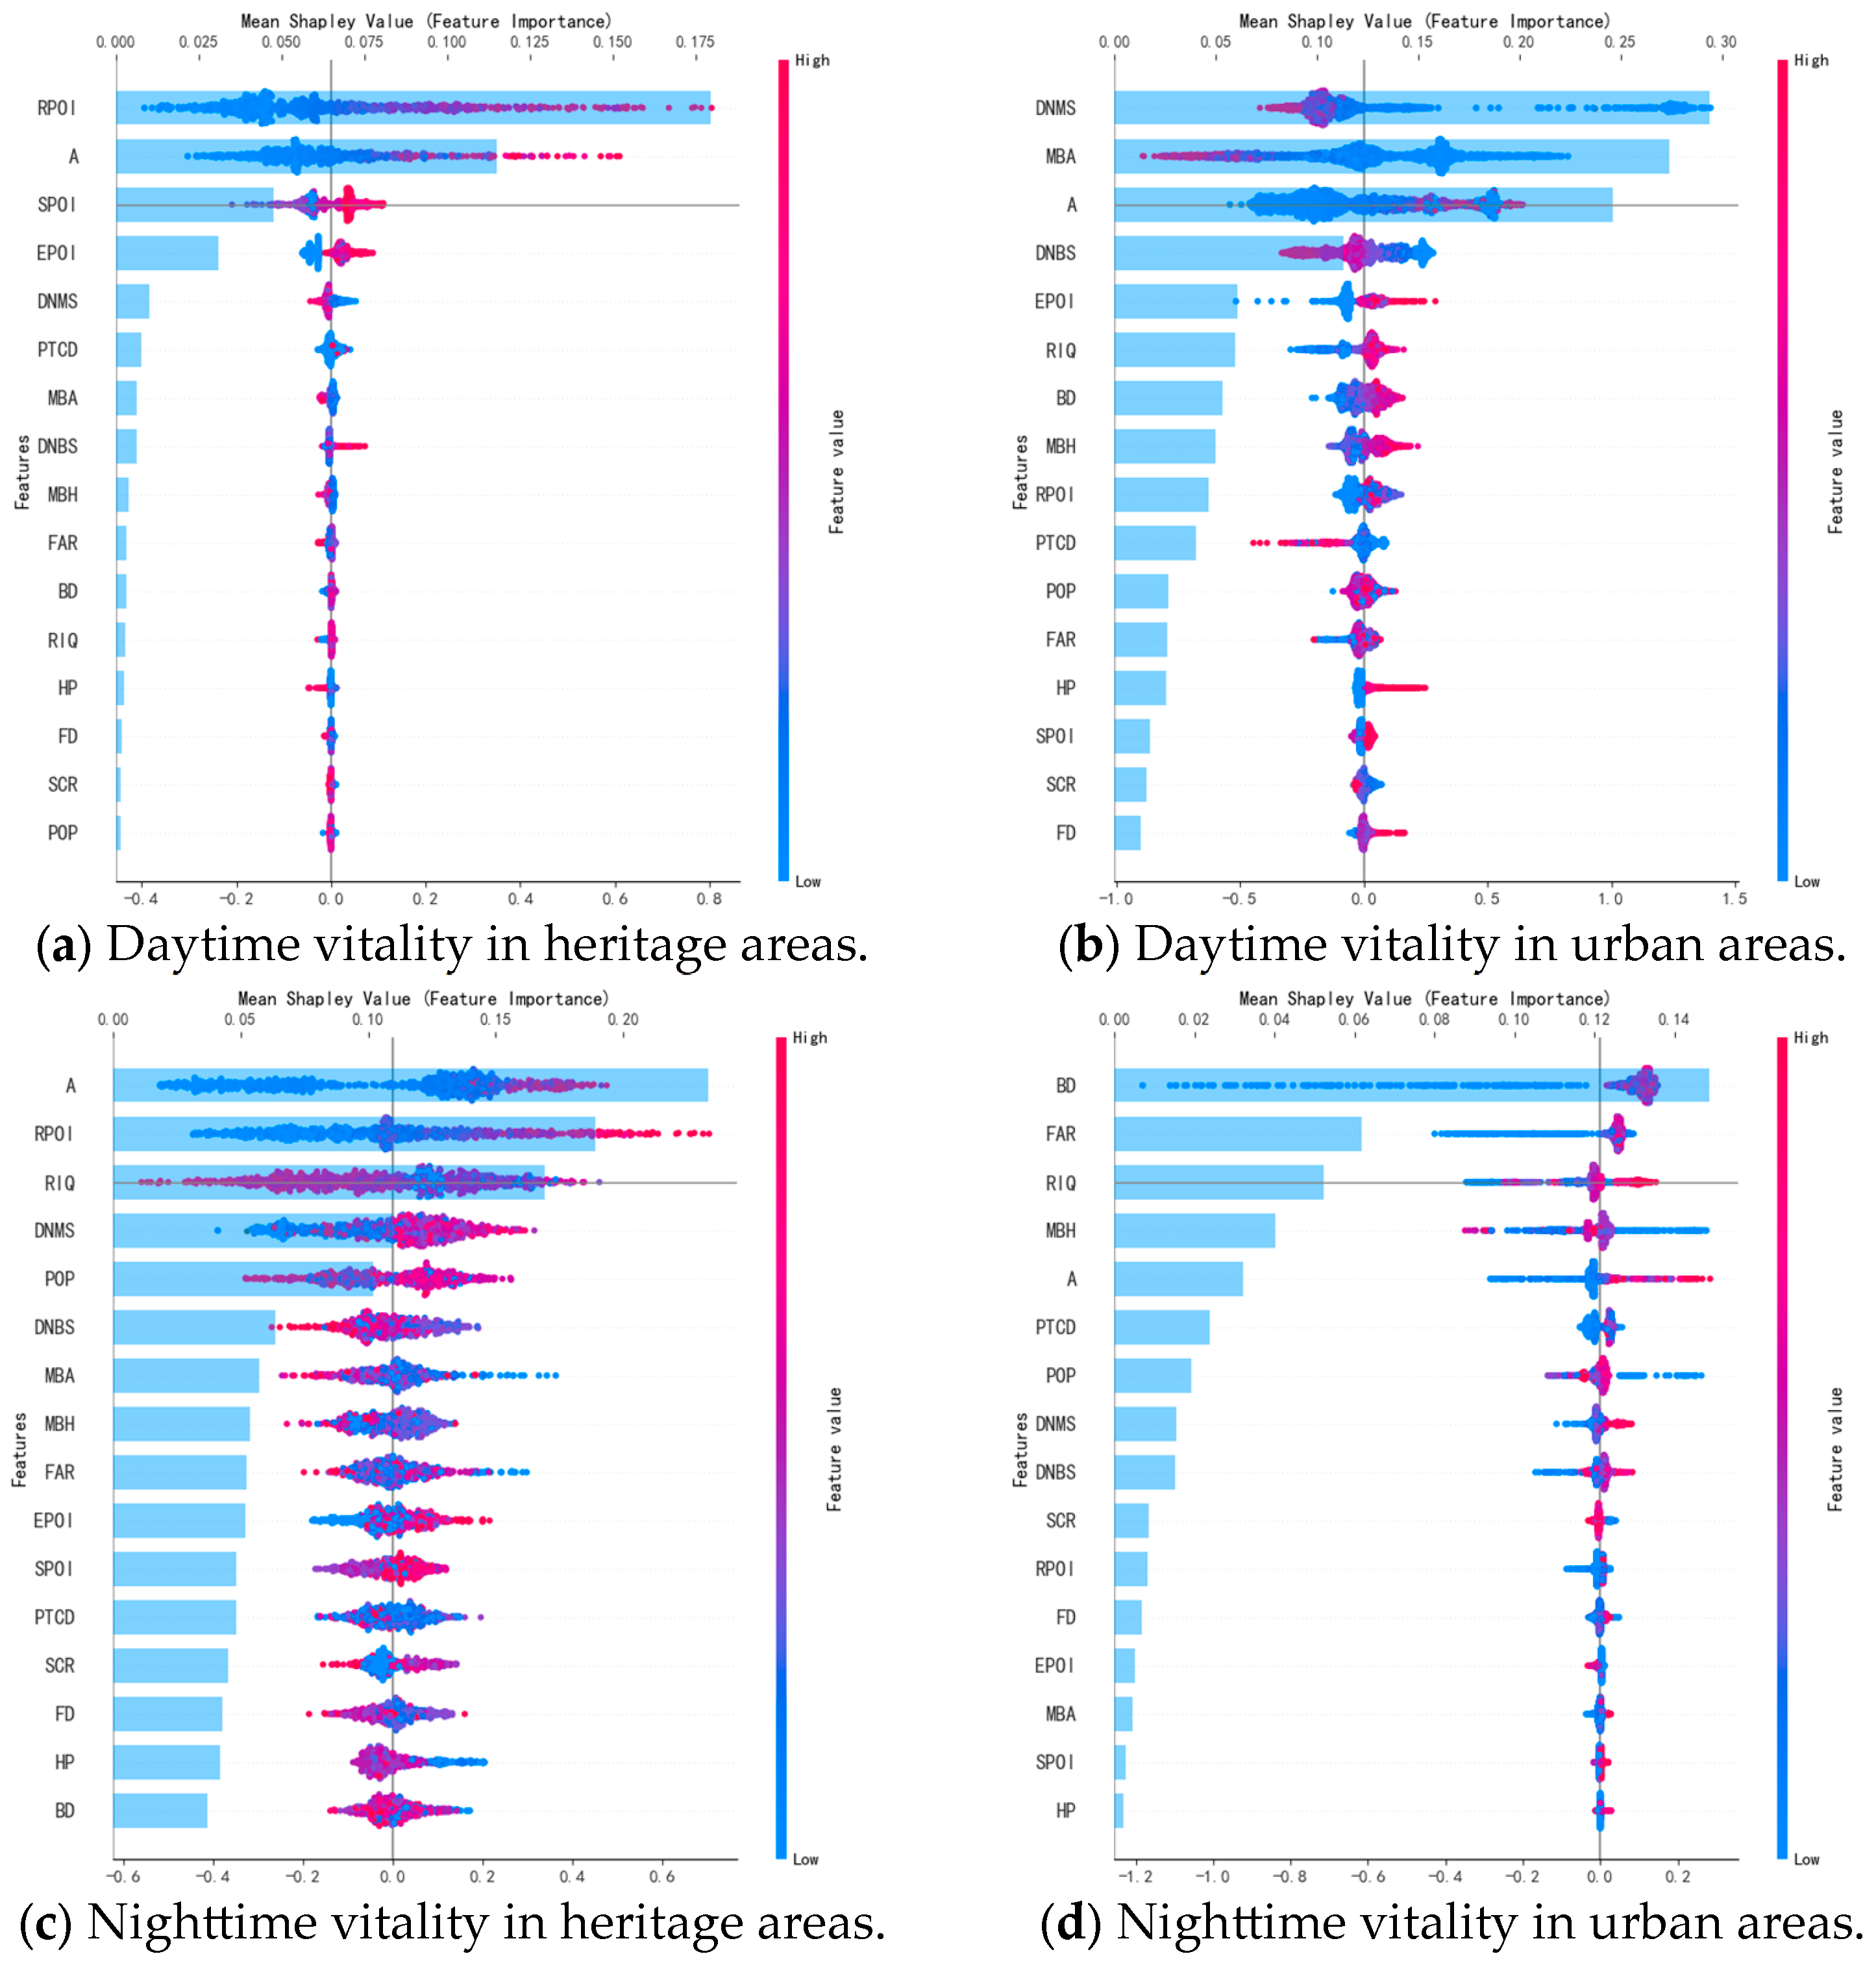
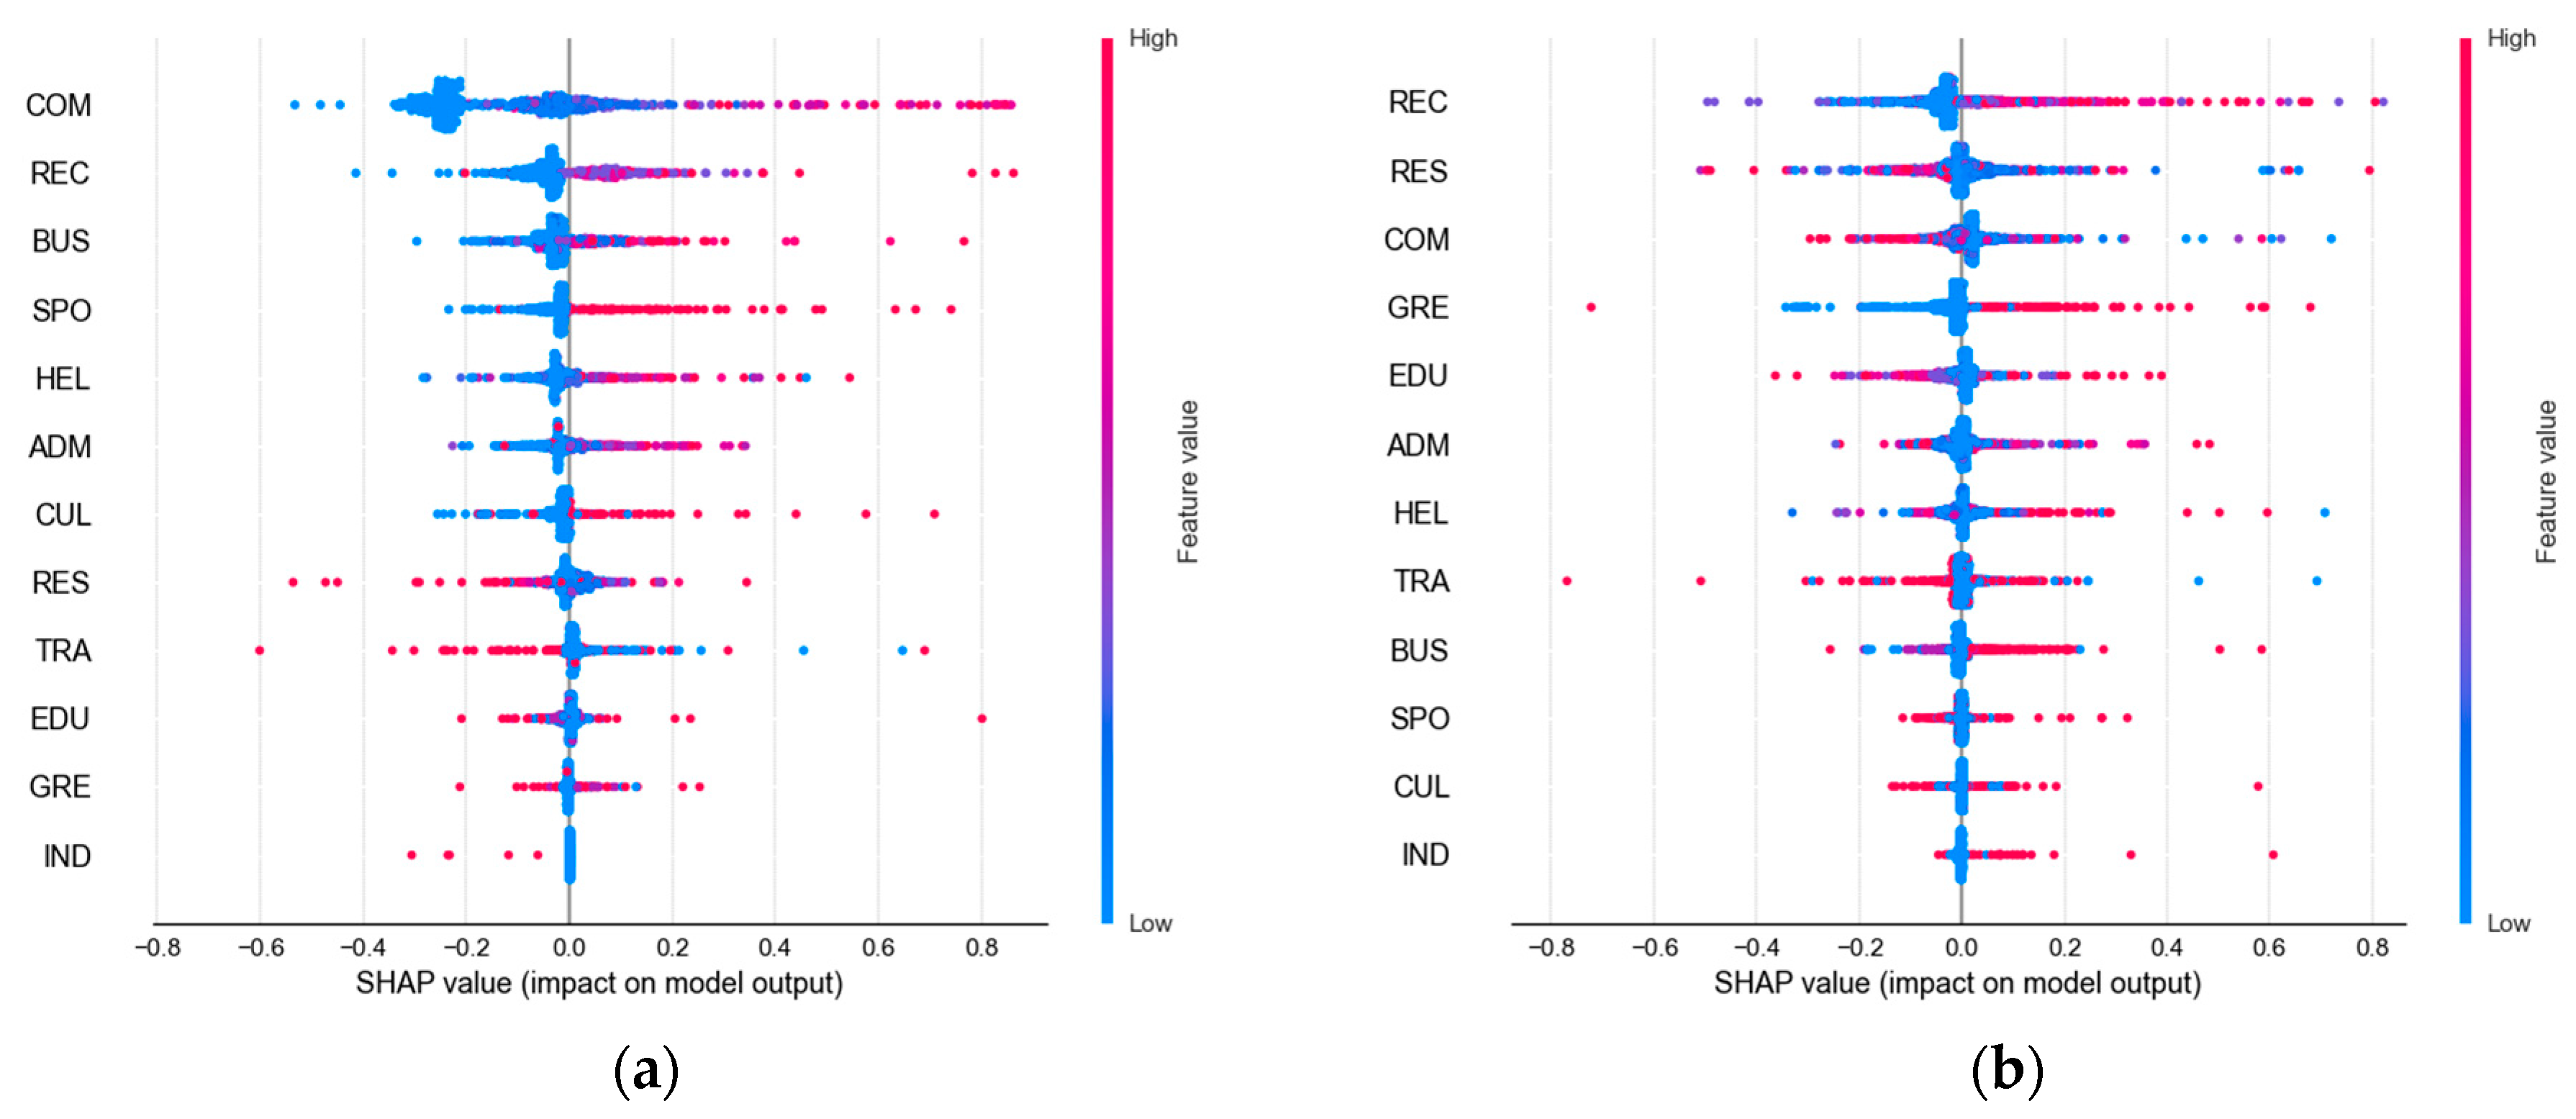
4.3.1. Importance of SHAP Variables
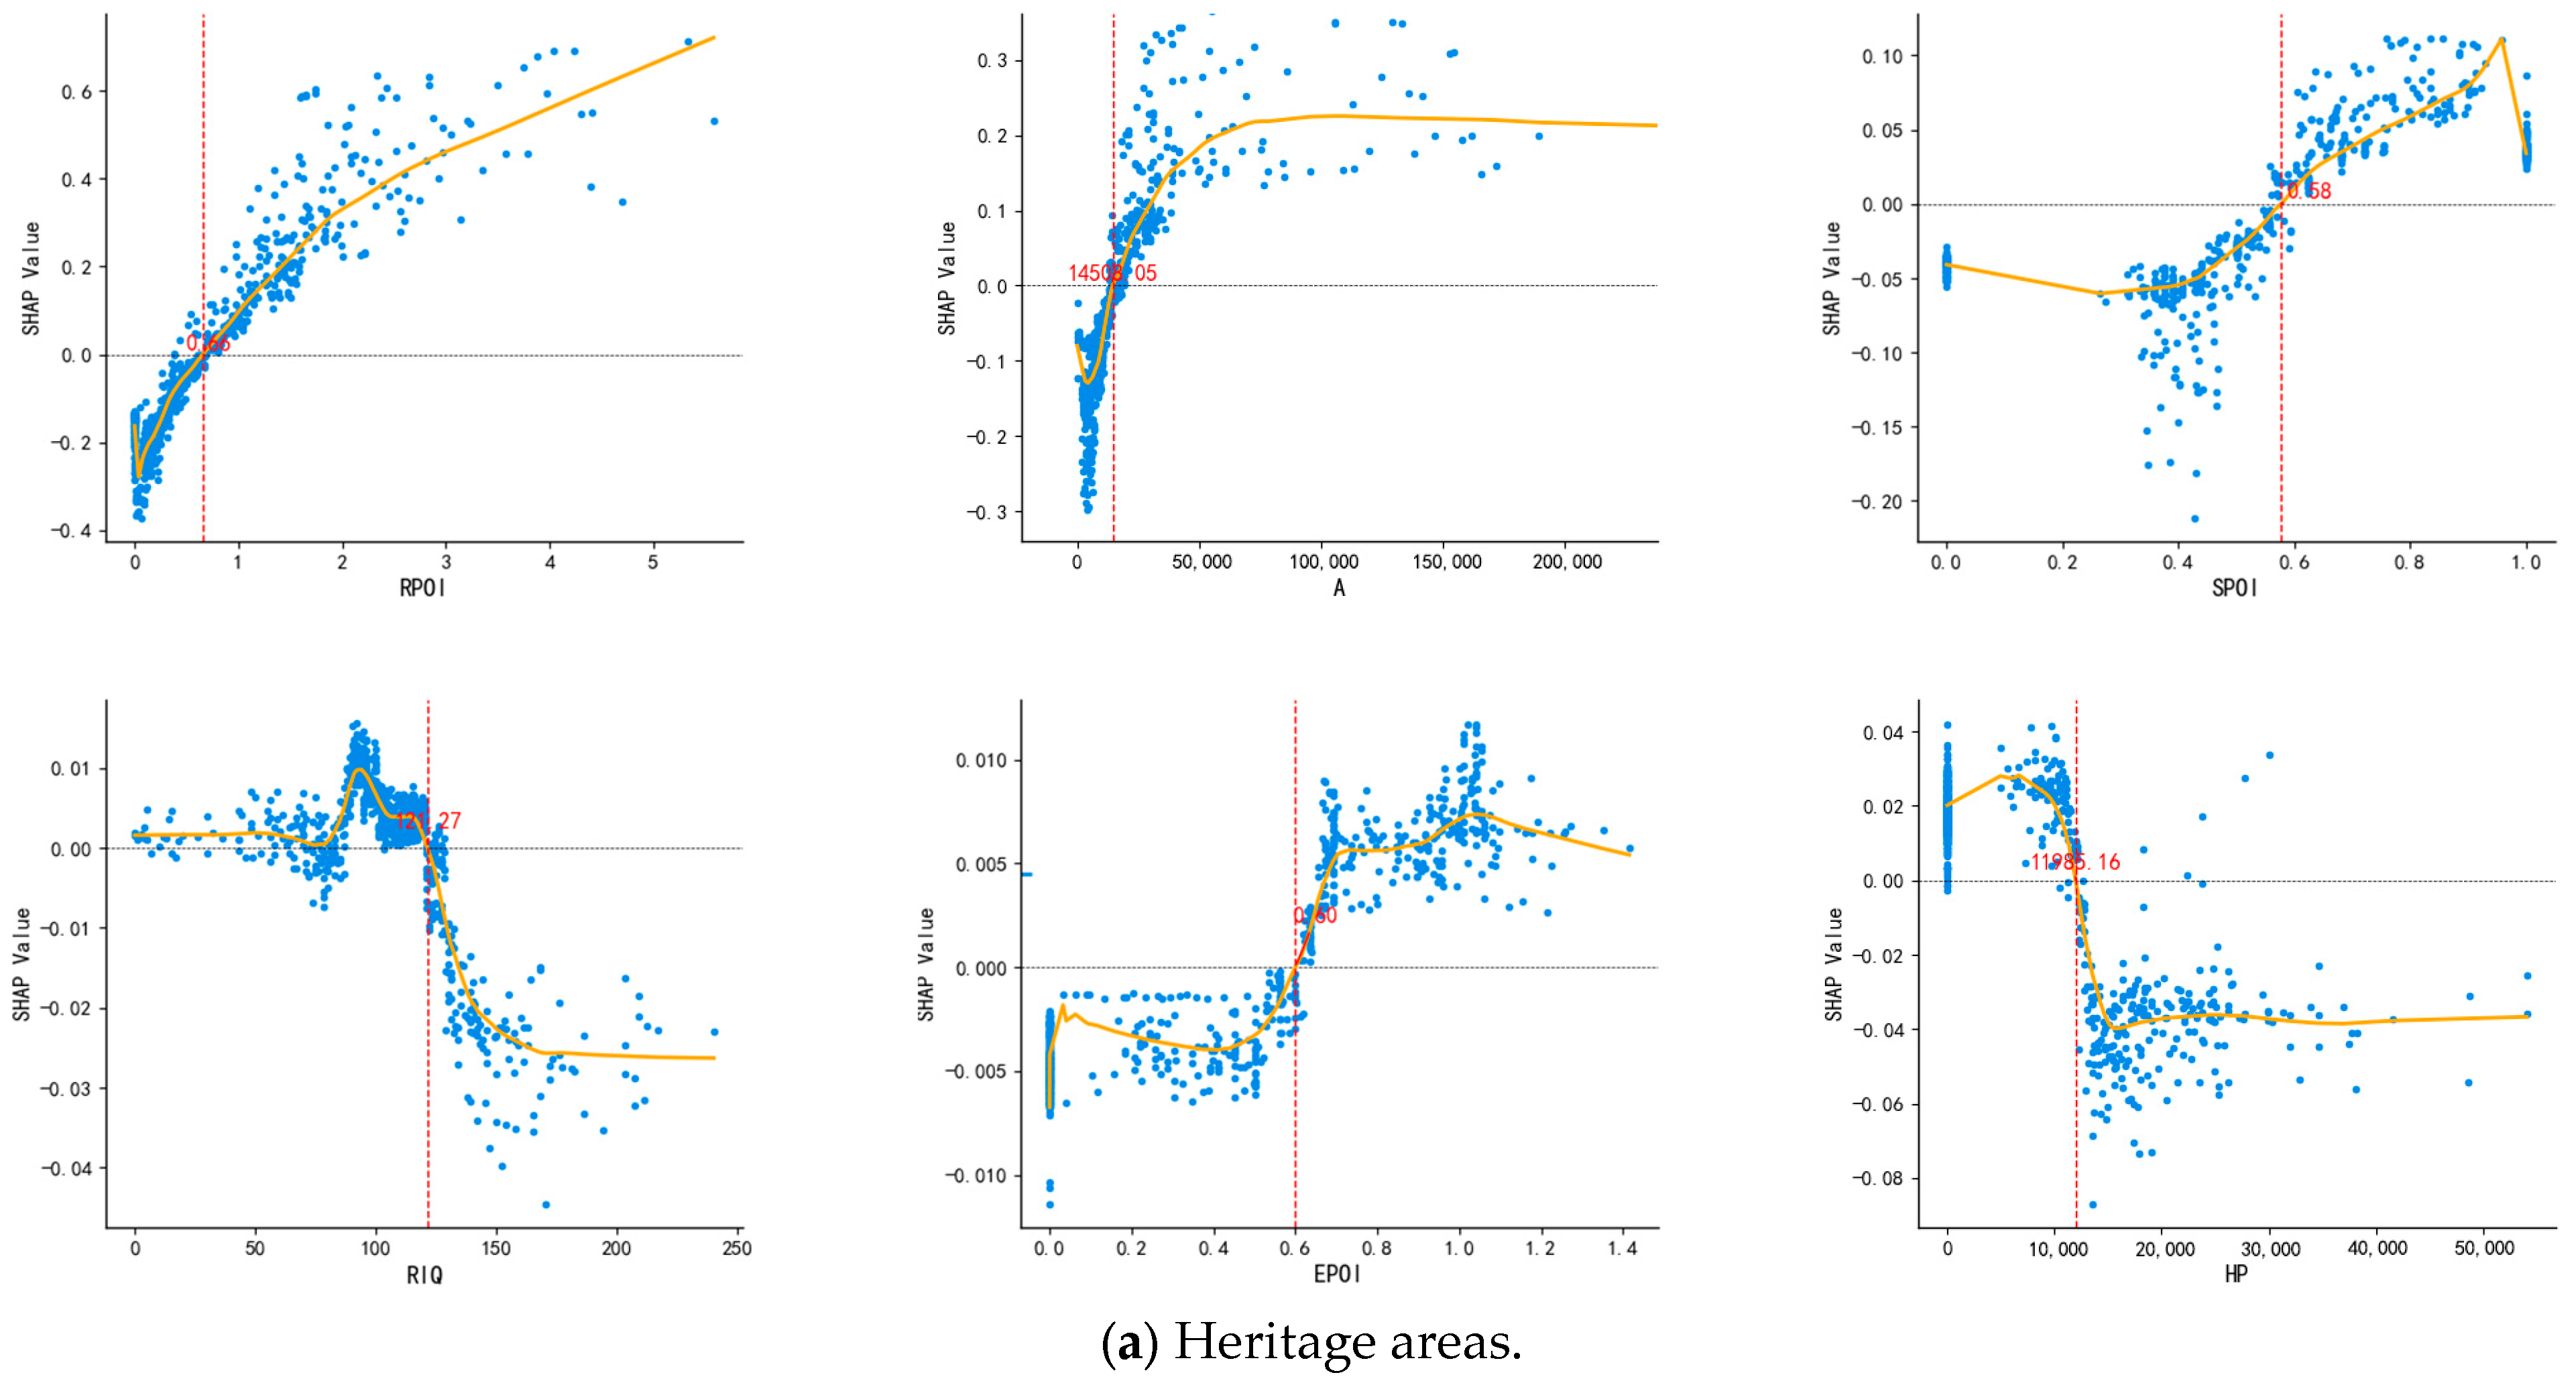
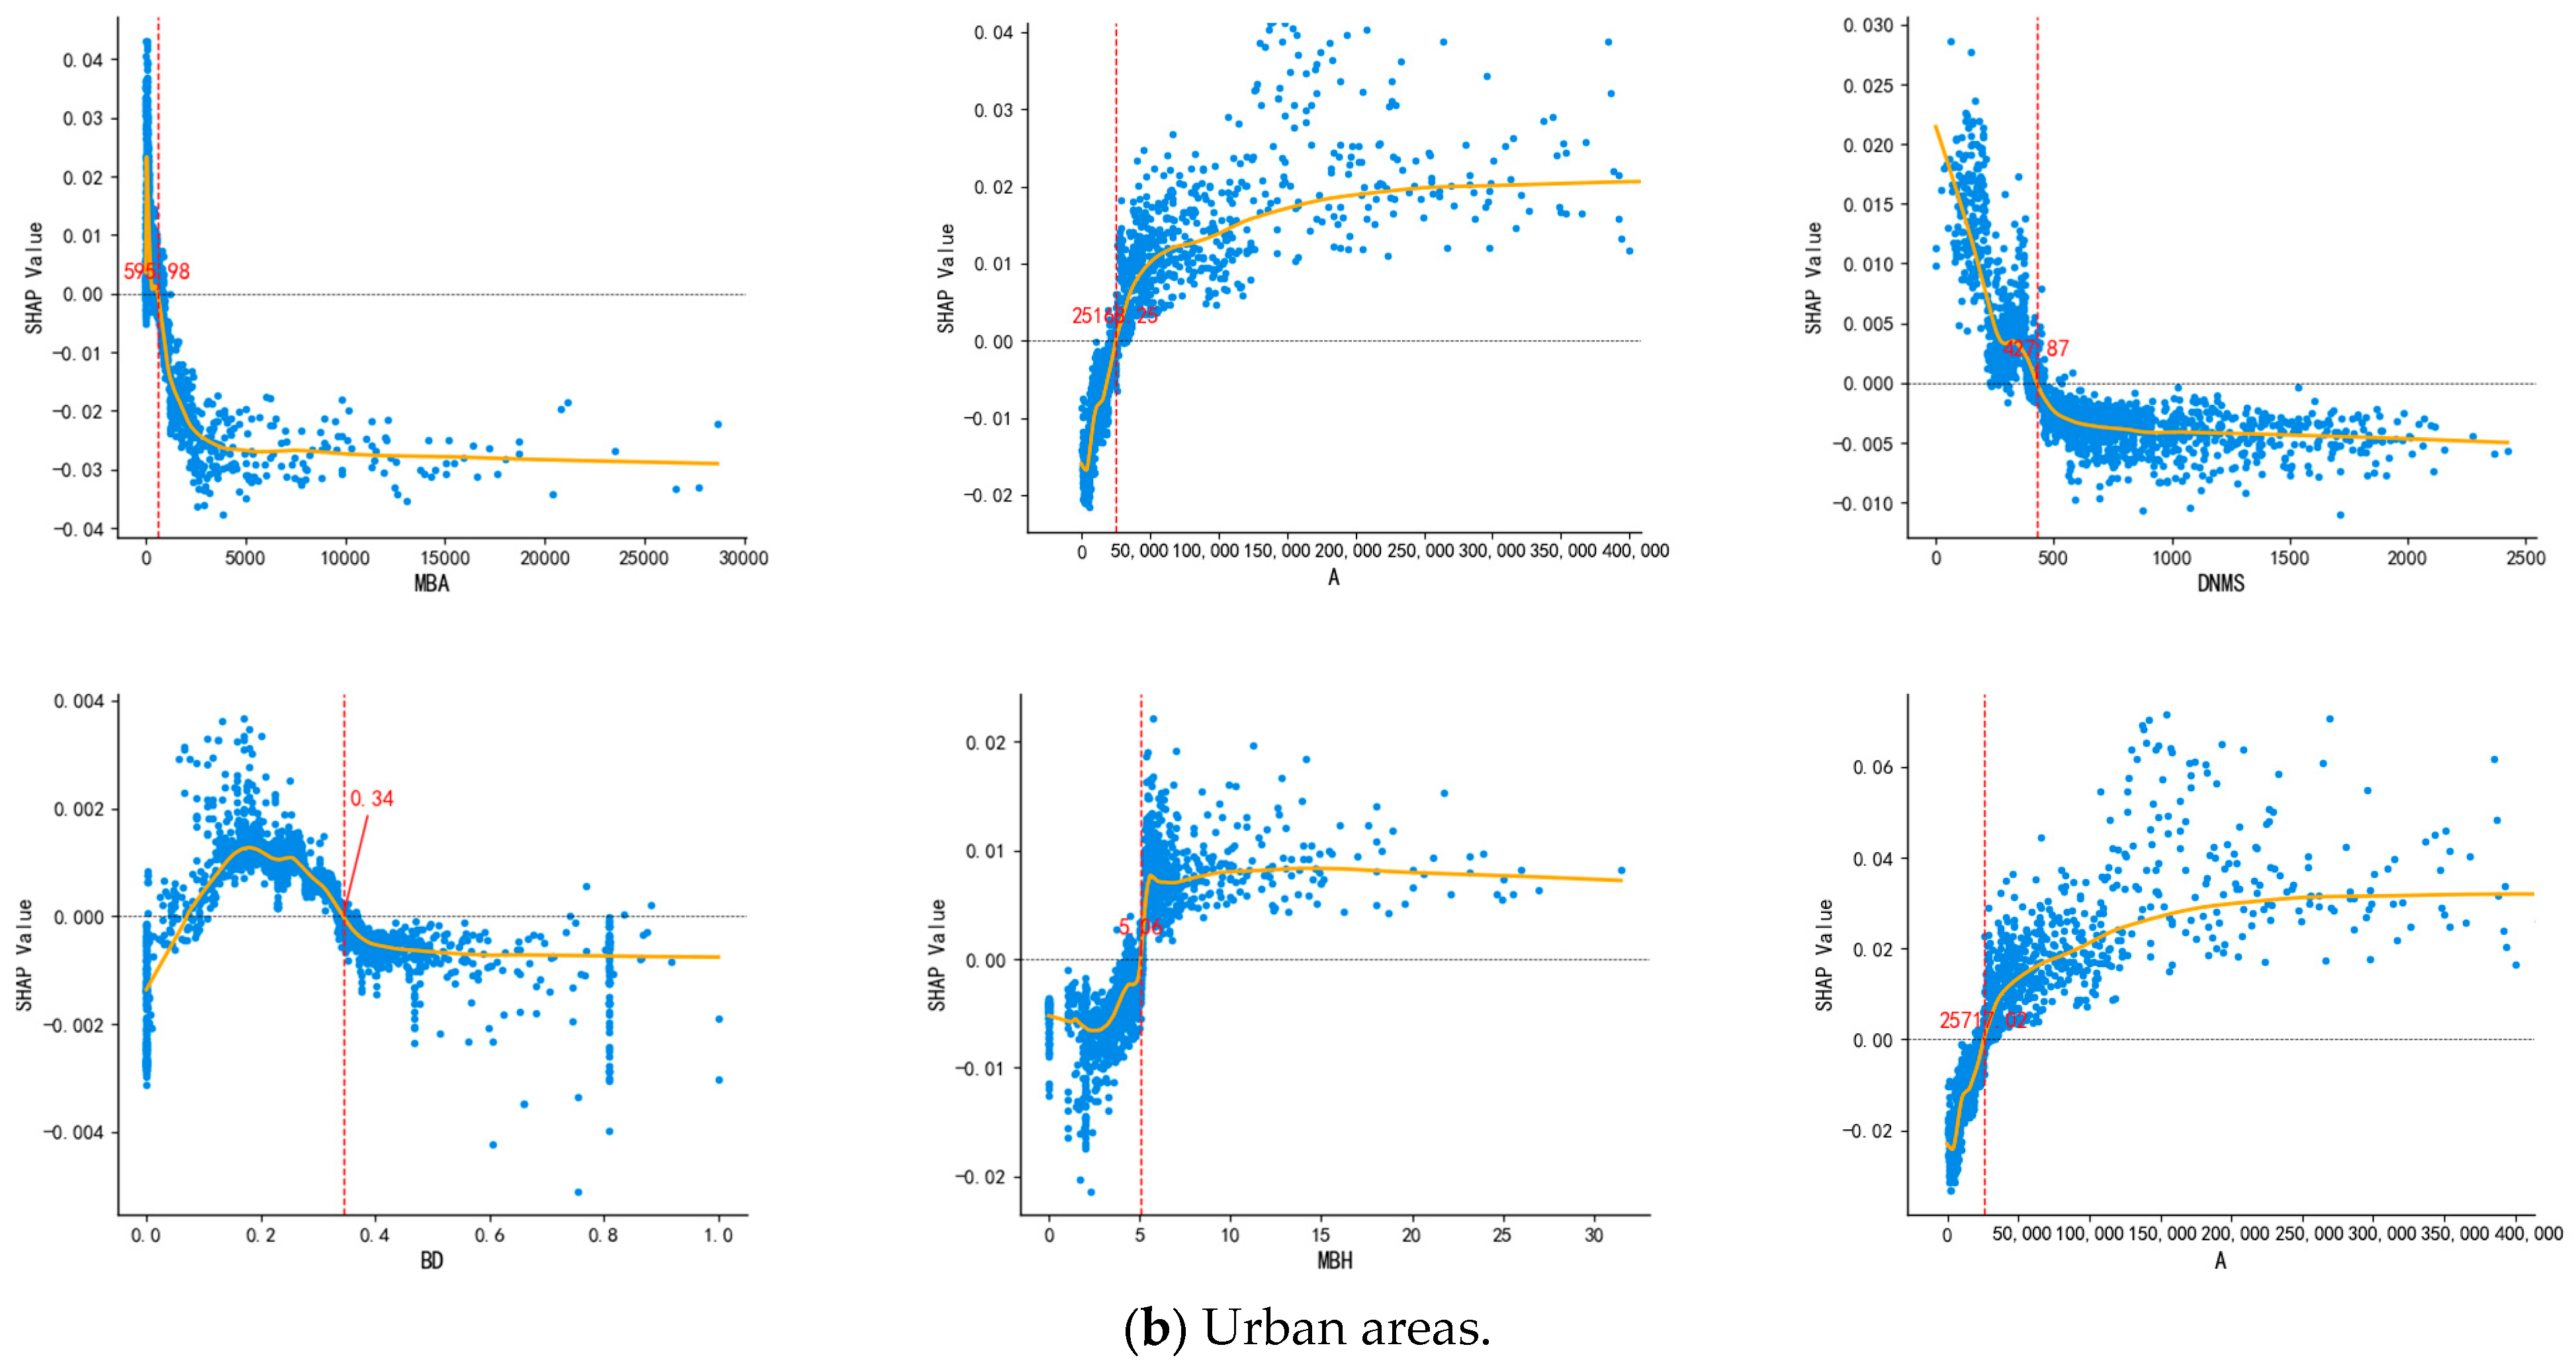
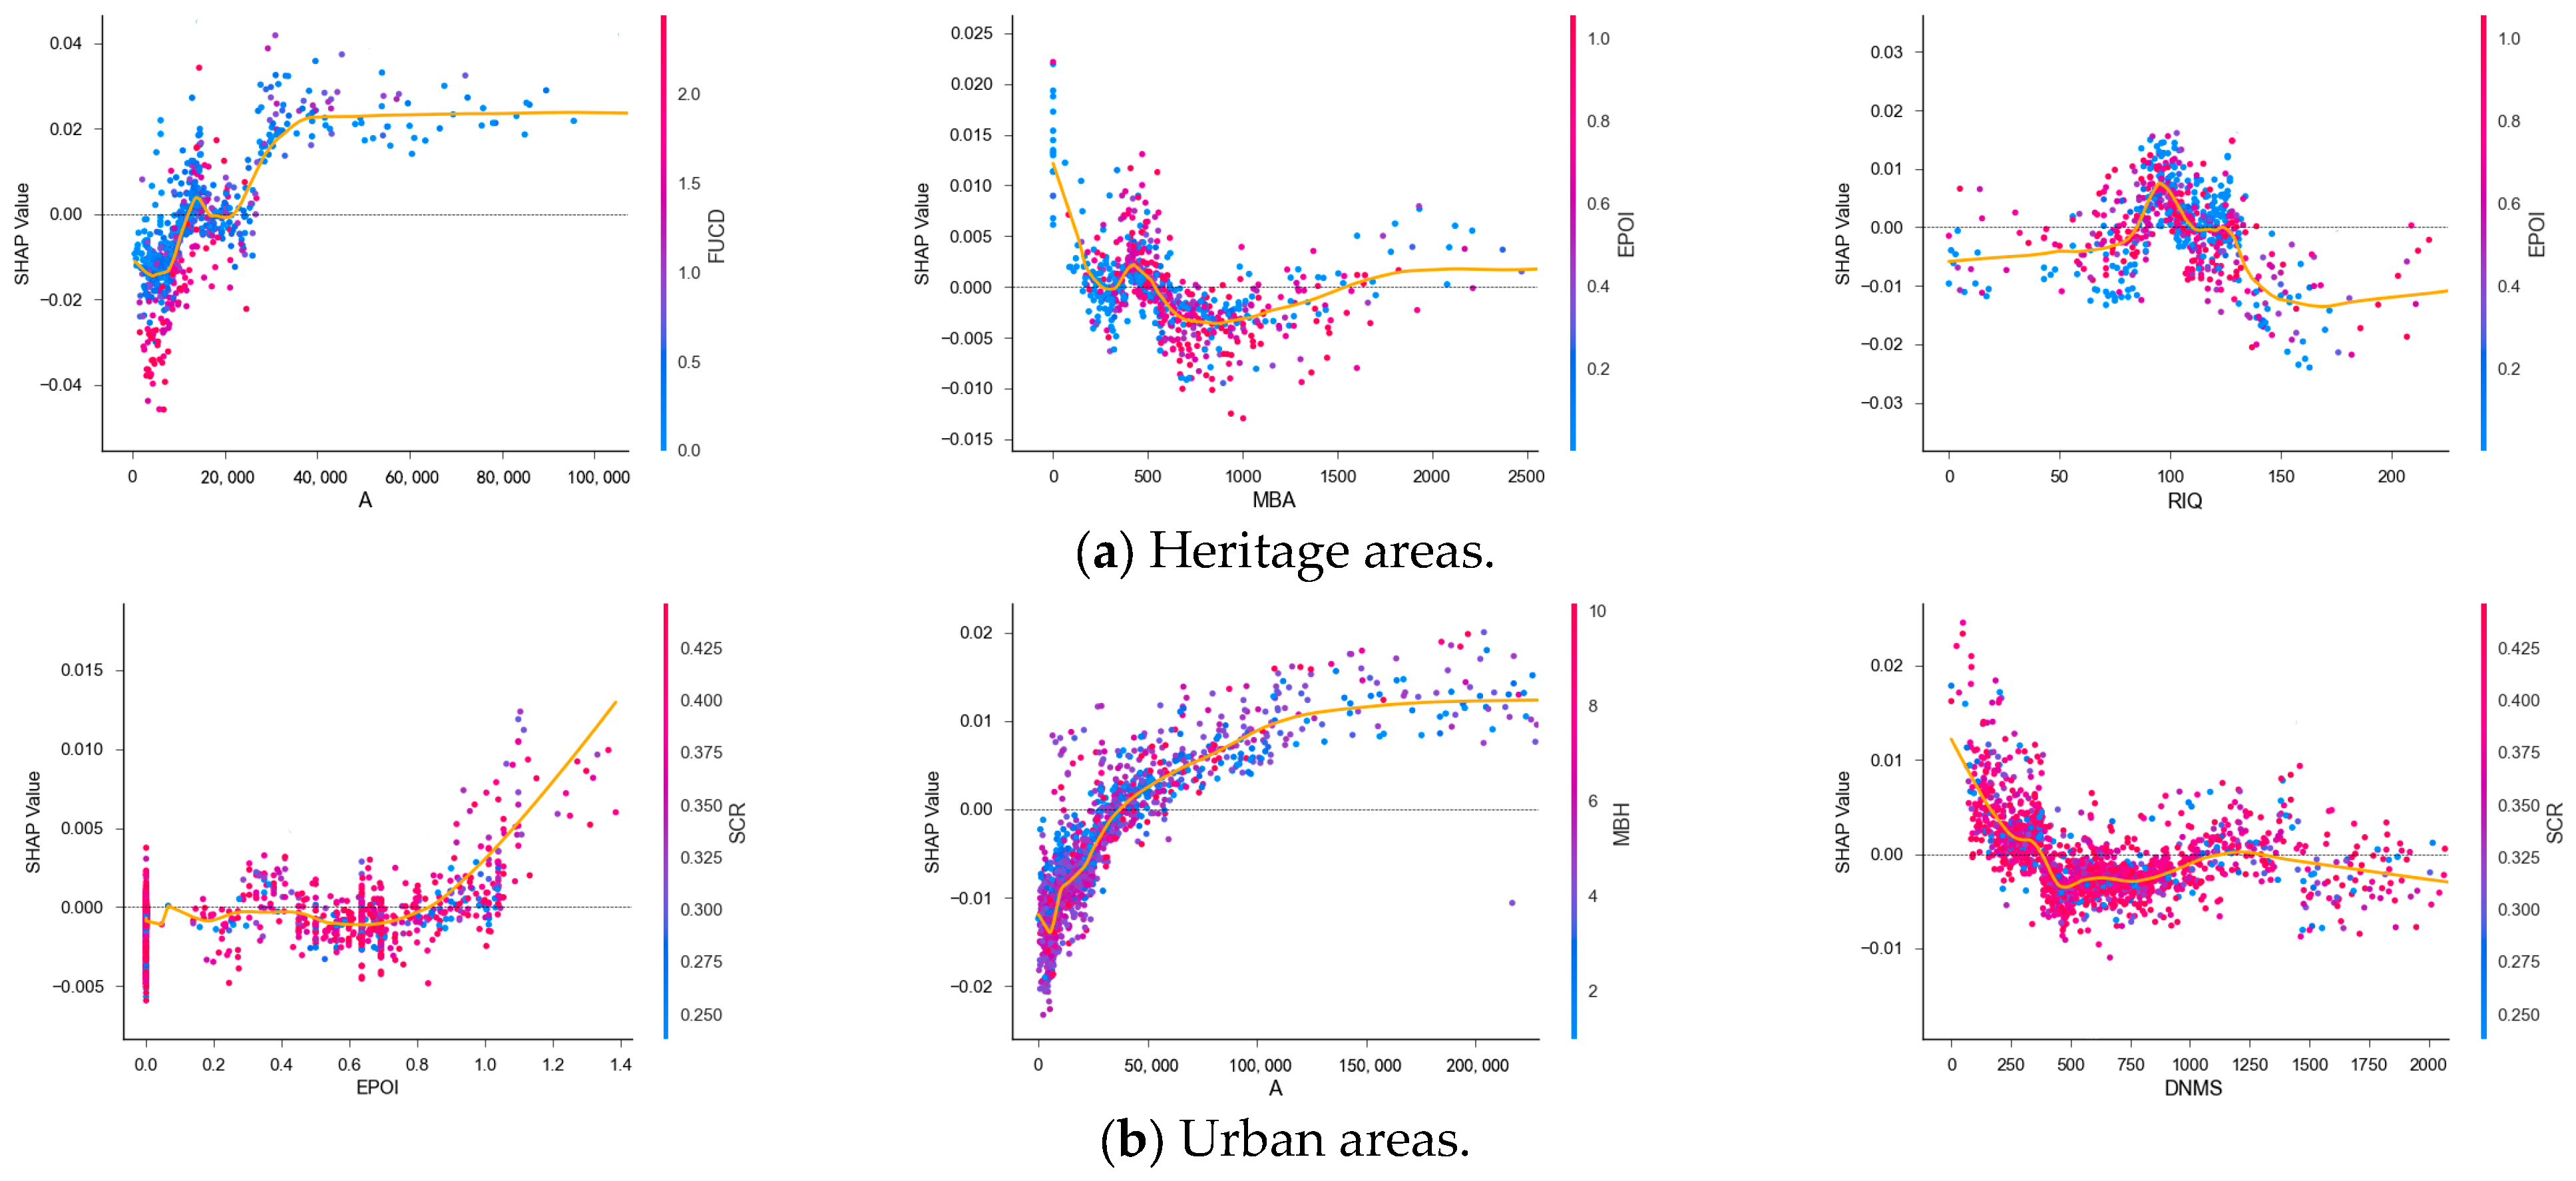
4.3.2. Non-Linear Effects of Variables
4.3.3. Interaction Effects Between Key Variables
4.4. Planning Recommendations
4.4.1. Planning Strategies
4.4.2. Practical Applications
5. Conclusions and Discussion
Author Contributions
Funding
Informed Consent Statement
Data Availability Statement
Conflicts of Interest
References
- Tyler, N.; Tyler, I.R.; Ligibel, T.J. Historic Preservation: An Introduction to Its History, Principles, and Practice, 3rd ed.; W. W. Norton & Company: New York, NY, USA, 2018; ISBN 978-0-393-71298-8. [Google Scholar]
- Wu, J.; Lu, Y.; Gao, H.; Wang, M. Cultivating Historical Heritage Area Vitality Using Urban Morphology Approach Based on Big Data and Machine Learning. Comput. Environ. Urban Syst. 2022, 91, 101716. [Google Scholar] [CrossRef]
- Ringbeck, B. The World Heritage Convention and Its Management Concept. In Aspects of Management Planning for Cultural World Heritage Sites: Principles, Approaches and Practices; Makuvaza, S., Ed.; Springer International Publishing: Berlin/Heidelberg, Germany, 2018; pp. 15–24. ISBN 978-3-319-69856-4. [Google Scholar]
- Dalmas, L.; Geronimi, V.; Noël, J.-F.; Tsang King Sang, J. Economic Evaluation of Urban Heritage: An Inclusive Approach under a Sustainability Perspective. J. Cult. Herit. 2015, 16, 681–687. [Google Scholar] [CrossRef]
- Wang, F.; He, J.; Xue, P.; Hu, X. The Adaptation of Cultural Heritage in Built Environments. Indoor Built Environ. 2024, 33, 781–786. [Google Scholar] [CrossRef]
- Bowitz, E.; Ibenholt, K. Economic Impacts of Cultural Heritage–Research and Perspectives. J. Cult. Herit. 2009, 10, 1–8. [Google Scholar] [CrossRef]
- Grimshaw, L.; Mates, L. ‘It’s Part of Our Community, Where We Live’: Urban Heritage and Children’s Sense of Place. Urban Stud. 2022, 59, 1334–1352. [Google Scholar] [CrossRef]
- Lak, A.; Gheitasi, M.; Timothy, D.J. Urban Regeneration through Heritage Tourism: Cultural Policies and Strategic Management. J. Tour. Cult. Change 2020, 18, 386–403. [Google Scholar] [CrossRef]
- Labadi, S.; Giliberto, F.; Rosetti, I.; Shetabi, L.; Yildirim, E. Heritage and the Sustainable Development Goals: Policy Guidance for Heritage and Development Actors; ICOMOS: Paris, France, 2021; pp. 1–69. ISBN 978-2-918086-87-1. [Google Scholar]
- Landry, C. Urban Vitality: A New Source of Urban Competitiveness. Archis 2000, 12, 8–13. [Google Scholar]
- Montgomery, J. Making a City: Urbanity, Vitality and Urban Design. J. Urban Des. 1998, 3, 93–116. [Google Scholar] [CrossRef]
- Doan, Q.C. Nonlinear and Threshold Effects of the Built Environment, Road Vehicles and Air Pollution on Urban Vitality. Landscape Urban Plan. 2025, 253, 105204. [Google Scholar] [CrossRef]
- Jiang, Y.; Huang, Z.; Zhou, X.; Chen, X. Evaluating the Impact of Urban Morphology on Urban Vitality: An Exploratory Study Using Big Geo-Data. Int. J. Digit. Earth. 2024, 17, 2327571. [Google Scholar] [CrossRef]
- Meng, Y.; Xing, H. Exploring the Relationship between Landscape Characteristics and Urban Vibrancy: A Case Study Using Morphology and Review Data. Cities 2019, 95, 102389. [Google Scholar] [CrossRef]
- Xia, C.; Zhang, A.; Yeh, A.G.O. The Varying Relationships between Multidimensional Urban Form and Urban Vitality in Chinese Megacities: Insights from a Comparative Analysis. Ann. Am. Assoc. Geogr. 2022, 112, 141–166. [Google Scholar] [CrossRef]
- Liu, Z.; Wang, S.; Wang, F. Isolated or Integrated? Planning and Management of Urban Renewal for Historic Areas in Old Beijing City, Based on the Association Network System. Habitat Int. 2019, 93, 102049. [Google Scholar] [CrossRef]
- Micelli, E.; Pellegrini, P. Wasting Heritage. The Slow Abandonment of the Italian Historic Centers. J. Cult. Herit. 2018, 31, 180–188. [Google Scholar] [CrossRef]
- Wang, S.; Zhang, J.; Wang, F.; Dong, Y. How to Achieve a Balance between Functional Improvement and Heritage Conservation? A Case Study on the Renewal of Old Beijing City. Sustain. Cities Soc. 2023, 98, 104790. [Google Scholar] [CrossRef]
- Jackson, J.; Forest, B.; Sengupta, R. Agent-Based Simulation of Urban Residential Dynamics and Land Rent Change in a Gentrifying Area of Boston. Trans. GIS 2008, 12, 475–491. [Google Scholar] [CrossRef]
- Yung, E.H.K.; Zhang, Q.; Chan, E.H.W. Underlying Social Factors for Evaluating Heritage Conservation in Urban Renewal Districts. Habitat Int. 2017, 66, 135–148. [Google Scholar] [CrossRef]
- Zhang, H.; Wang, F.; Guo, F.; Cai, J.; Dong, J. Urban Built Heritage Protection and Realistic Dilemmas: The Development Process, Protection System, and Critical Thinking of Historic Districts in Dalian. Built Herit. 2023, 7, 25. [Google Scholar] [CrossRef]
- Chen, W.; Wu, A.N.; Biljecki, F. Classification of Urban Morphology with Deep Learning: Application on Urban Vitality. Comput. Environ. Urban Syst. 2021, 90, 101706. [Google Scholar] [CrossRef]
- Chen, Y.; Yu, B.; Shu, B.; Yang, L.; Wang, R. Exploring the Spatiotemporal Patterns and Correlates of Urban Vitality: Temporal and Spatial Heterogeneity. Sustain. Cities Soc. 2023, 91, 104440. [Google Scholar] [CrossRef]
- Yang, J.; Cao, J.; Zhou, Y. Elaborating Non-Linear Associations and Synergies of Subway Access and Land Uses with Urban Vitality in Shenzhen. Transp. Res. Part A Policy Pract. 2021, 144, 74–88. [Google Scholar] [CrossRef]
- Jalaladdini, S.; Oktay, D. Urban Public Spaces and Vitality: A Socio-Spatial Analysis in the Streets of Cypriot Towns. Procedia Soc. Behav. Sci. 2012, 35, 664–674. [Google Scholar] [CrossRef]
- Sulis, P.; Manley, E.; Zhong, C.; Batty, M. Using Mobility Data as Proxy for Measuring Urban Vitality. J. Spat. Int. Sci. 2018, 16, 137–162. [Google Scholar] [CrossRef]
- Kim, Y.-L. Seoul’s Wi-Fi Hotspots: Wi-Fi Access Points as an Indicator of Urban Vitality. Comput. Environ. Urban Syst. 2018, 72, 13–24. [Google Scholar] [CrossRef]
- Yue, Y.; Zhuang, Y.; Yeh, A.G.O.; Xie, J.-Y.; Ma, C.-L.; Li, Q.-Q. Measurements of POI-Based Mixed Use and Their Relationships with Neighbourhood Vibrancy. Int. J. Geogr. Inf. Sci. 2017, 31, 658–675. [Google Scholar] [CrossRef]
- Li, F.; Li, F.; Li, S.; Long, Y. Deciphering the Recreational Use of Urban Parks: Experiments Using Multi-Source Big Data for All Chinese Cities. Sci. Total Environ. 2020, 701, 134896. [Google Scholar] [CrossRef]
- Xia, C.; Yeh, A.G.-O.; Zhang, A. Analyzing Spatial Relationships between Urban Land Use Intensity and Urban Vitality at Street Block Level: A Case Study of Five Chinese Megacities. Landsc. Urban Plan. 2020, 193, 103669. [Google Scholar] [CrossRef]
- Ye, Y.; Li, D.; Liu, X. How Block Density and Typology Affect Urban Vitality: An Exploratory Analysis in Shenzhen, China. Urban Geogr. 2018, 39, 631–652. [Google Scholar] [CrossRef]
- Dong, L.; Ratti, C.; Zheng, S. Predicting Neighborhoods’ Socioeconomic Attributes Using Restaurant Data. Proc. Natl. Acad. Sci. USA 2019, 116, 15447–15452. [Google Scholar] [CrossRef]
- Wang, L.; Wang, S.; Zhou, Y.; Liu, W.; Hou, Y.; Zhu, J.; Wang, F. Mapping Population Density in China between 1990 and 2010 Using Remote Sensing. Remote Sens. Environ. 2018, 210, 269–281. [Google Scholar] [CrossRef]
- Levin, N.; Zhang, Q. A Global Analysis of Factors Controlling VIIRS Nighttime Light Levels from Densely Populated Areas. Remote Sens. Environ. 2017, 190, 366–382. [Google Scholar] [CrossRef]
- Conzen, M.R.G. Alnwick, Northumberland: A Study in Town-Plan Analysis. In Transactions and Papers (Institute of British Geographers); George Philip: London, UK, 1960; p. iii–122. [Google Scholar]
- Chi, J.; Jiao, L.; Dong, T.; Gu, Y.; Ma, Y. Quantitative Identification and Visualization of Urban Functional Area Based on POI Data. J. Geomat 2016, 41, 68–73. [Google Scholar]
- Wang, M. Polycentric Urban Development and Urban Amenities: Evidence from Chinese Cities. Environ. Plan B Urban Anal. City Sci. 2021, 48, 400–416. [Google Scholar] [CrossRef]
- Fan, C.; Rey, S.J.; Myint, S.W. Spatially Filtered Ridge Regression (SFRR): A Regression Framework to Understanding Impacts of Land Cover Patterns on Urban Climate. Trans. GIS 2017, 21, 862–879. [Google Scholar] [CrossRef]
- Ding, C.; Cao, X.; Liu, C. How Does the Station-Area Built Environment Influence Metrorail Ridership? Using Gradient Boosting Decision Trees to Identify Non-Linear Thresholds. J. Transp. Geogr. 2019, 77, 70–78. [Google Scholar] [CrossRef]
- Tao, T.; Wang, J.; Cao, X. Exploring the Non-Linear Associations between Spatial Attributes and Walking Distance to Transit. J. Transp. Geogr. 2020, 82, 102560. [Google Scholar] [CrossRef]
- Wang, Z.; Liu, Y.; Luo, X.; Tong, Z.; An, R. Nonlinear Relationship between Urban Vitality and the Built Environment Based on Multi-Source Data: A Case Study of the Main Urban Area of Wuhan City at the Weekend. Prog. Geogr 2023, 42, 716–729. [Google Scholar] [CrossRef]
- Wang, Z.; Liu, S.; Lian, H.; Chen, X. Investigating the Nonlinear Effect of Land Use and Built Environment on Public Transportation Choice Using a Machine Learning Approach. Land 2024, 13, 1302. [Google Scholar] [CrossRef]
- Xi, Y.; Hou, Q.; Duan, Y.; Lei, K.; Wu, Y.; Cheng, Q. Exploring the Spatiotemporal Effects of the Built Environment on the Nonlinear Impacts of Metro Ridership: Evidence from Xi’an, China. ISPRS Int. J. Geo-Inf. 2024, 13, 105. [Google Scholar] [CrossRef]
- Liu, X.; Long, Y. Automated Identification and Characterization of Parcels with OpenStreetMap and Points of Interest. Environ. Plann. B Plann. Des. 2016, 43, 341–360. [Google Scholar] [CrossRef]
- He, Q.; He, W.; Song, Y.; Wu, J.; Yin, C.; Mou, Y. The Impact of Urban Growth Patterns on Urban Vitality in Newly Built-up Areas Based on an Association Rules Analysis Using Geographical ‘Big Data’. Land Use Policy 2018, 78, 726–738. [Google Scholar] [CrossRef]
- Jacobs, J. The Death and Life of Great American Cities; Knopf Doubleday Publishing Group: New York, NY, USA, 1961; ISBN 978-0-679-74195-4. [Google Scholar]
- Lindal, P.J.; Hartig, T. Architectural Variation, Building Height, and the Restorative Quality of Urban Residential Streetscapes. J. Environ. Psychol. 2013, 33, 26–36. [Google Scholar] [CrossRef]
- Ji, Y.; Wang, Z.; Zhu, D. Exploring the Impact of Urban Amenities on Business Circle Vitality Using Multi-Source Big Data. Land 2024, 13, 1616. [Google Scholar] [CrossRef]
- Mouratidis, K.; Poortinga, W. Built Environment, Urban Vitality and Social Cohesion: Do Vibrant Neighborhoods Foster Strong Communities? Landsc. Urban Plan. 2020, 204, 103951. [Google Scholar] [CrossRef]
- Currie, G.; Stanley, J. Investigating Links between Social Capital and Public Transport. Transp. Rev. 2008, 28, 529–547. [Google Scholar] [CrossRef]
- Li, Z.; Zhao, G. Revealing the Spatio-Temporal Heterogeneity of the Association between the Built Environment and Urban Vitality in Shenzhen. ISPRS Int. J. Geo-Inf. 2023, 12, 433. [Google Scholar] [CrossRef]
- Zumelzu, A.; Barrientos-Trinanes, M. Analysis of the Effects of Urban Form on Neighborhood Vitality: Five Cases in Valdivia, Southern Chile. J. Hous. Built Environ. 2019, 34, 1–29. [Google Scholar] [CrossRef]
- Bandarin, F.; Van Oers, R. The Historic Urban Landscape: Managing Heritage in an Urban Century; John Wiley & Sons: Hoboken, NJ, USA, 2012; ISBN 0-470-65574-7. [Google Scholar]


| Author (Year) | Data Source and Method | Advantages | Disadvantages |
|---|---|---|---|
| Jalaladdini, S.; Oktay, D. 2012 [25] | Counting the number of pedestrians on the street | The street vitality each hour can be recorded with high accuracy. | Requires significant resources and is challenging for large-scale measurements. |
| Kim., 2018 [27] | Density of Wi-Fi access points provided by government and network operators | Allows comparison between virtual and physical space vitality. | Does not account for private Wi-Fi access points, and may introduce errors for younger and older users. |
| Jiang et al., 2024 [13] | Demographic data and OD flow data derived from cell phone | Offers large amounts of accurate data, with mobile location records correlating well with population density. | The socioeconomic characteristics and activity types of users at a specific time and place cannot be identified. |
| Wu et al., 2022 [2]; Xia et al., 2020 [30]; Ye et al., 2018 [31] | Geotagged small food facilities | Reflects changes in human activities, representing urban economic vitality. | Only captures a specific aspect of urban vitality, limiting its overall representativeness. |
| Components | Indicators | Calculation Method | |
|---|---|---|---|
| Ground plan | Street system | Public transportation convenience degree (PTCD) | Ratio of the number of transport stops (bus stops and metro stations) to the size of the block within 500 m |
| Road inter section quantities (RIQ) | |||
| Distance to nearest bus stop (DNBS) | Distance from the center of mass of the block to the nearest bus stop is the nearest bus stop longitude coordinates | ||
| Distance to the nearest metro station (DNMS) | The calculation formula is the same as for the distance to the nearest bus stop | ||
| Block pattern | Area (A) | ||
| Fractal dimension (FD). | Complexity of block shape is the perimeter of the block | ||
| Spatial compact ratio (SCR) | Compactness of the block shape | ||
| Building form pattern | Mean of building area (MBA) | Average of all building footprints in the block is the sum of building footprints, is the total number of buildings in the block. | |
| Mean of building height (MBH) | is the sum of building heights. | ||
| Building density (BD) | Ratio of total building footprint to total block area | ||
| Floor area ratio (FAR) | Ratio of the total volume of the building to the total area of the block is the sum of building volume | ||
| Land use pattern | Richness (RPOI) | Ratio of total number of POIs to block size M is the number of POI categories | |
| Entropy (EPOI), | Information entropy values for all POI function types | ||
| Simpson (SPOI) | Simpson’s index of POI function types | ||
| Types of Function | Explanation | |
|---|---|---|
| Residential services | Residential and related services; | |
| Administration and public services | Administration and office | Offices of government, social groups, institutions, etc., and their related facilities |
| Cultural facilities | Facilities for cultural public activities such as books and exhibitions | |
| Education and research facilities | Educational facilities such as higher education, secondary vocational education, etc., and scientific research institutions and their research facilities | |
| Sports facilities | Facilities such as stadiums and sports training bases | |
| Health and hygiene | Medical, preventive, health, nursing, rehabilitation, first aid, hospice and other facilities | |
| Commercial and business facilities | Commercial facilities | Retail and wholesale markets, catering, hotels and other services |
| Business facilities | Comprehensive office facilities for finance, insurance, art and media | |
| Recreation facilities | Various recreational and sports facilities | |
| Green and open space | Public open spaces such as parks, protected green spaces, squares, etc. | |
| Industrial | Production workshops, warehouses and ancillary facilities of industrial and mining enterprises | |
| Transportation facilities | Railway, road and other transport facilities and their ancillary facilities | |
| Model | Indicator | Heritage Areas | Urban Areas | ||
|---|---|---|---|---|---|
| Day Vitality | Night Vitality | Day Vitality | Night Vitality | ||
| OLS | R2 | 0.418 | 0.355 | 0.392 | 0.390 |
| MAE | 0.035 | 0.114 | 0.063 | 0.051 | |
| RMSE | 0.067 | 0.157 | 0.094 | 0.075 | |
| RF | R2 | 0.579 | 0.572 | 0.585 | 0.630 |
| MAE | 0.071 | 0.091 | 0.046 | 0.036 | |
| RMSE | 0.029 | 0.126 | 0.087 | 0.061 | |
| XGBoost | R2 | 0.694 | 0.595 | 0.629 | 0.740 |
| MAE | 0.024 | 0.090 | 0.041 | 0.031 | |
| RMSE | 0.061 | 0.122 | 0.082 | 0.051 | |
| Indicator | Heritage Areas | Urban Areas | ||
|---|---|---|---|---|
| Day Vitality | Night Vitality | Day Vitality | Night Vitality | |
| learning_rate | 0.065 | 0.084 | 0.05 | 0.074 |
| max_depth | 3 | 4 | 3 | 3 |
| n_estimators | 646 | 316 | 497 | 222 |
| Indicator | Heritage Areas | Urban Areas | ||
|---|---|---|---|---|
| Day Vitality | Night Vitality | Day Vitality | Night Vitality | |
| R2 | 0.778 | 0.605 | 0.676 | 0.653 |
| 95%CI | (0.716, 0.851) | (0.510, 0.655) | (0.620, 0.732) | (0.598, 0.721) |
| Heritage Areas | Urban Areas | ||
|---|---|---|---|
| Patterns of Functional Mixing | Percentages | Patterns of Functional Mixing | Percentages |
| Administration | 10.24% | Residence | 17.63% |
| Commercial | 8.56% | Residence and Commercial | 10.50% |
| Residence | 7.01% | Commercial | 8.96% |
| Residence and Commercial | 5.33% | Education | 3.71% |
| Business | 3.65% | Administration | 3.54% |
| Health and hygiene | 3.09% | Residence and Administration | 3.24% |
| Administration and Commercial | 2.81% | Residence and Health and hygiene | 2.95% |
| Residence and Health and hygiene | 2.66% | Health and hygiene | 2.36% |
| Health and hygiene and Education | 2.38% | Commercial and Business | 2.30% |
| Business and Administration | 2.24% | Health and hygiene and Commercial | 2.06% |
Disclaimer/Publisher’s Note: The statements, opinions and data contained in all publications are solely those of the individual author(s) and contributor(s) and not of MDPI and/or the editor(s). MDPI and/or the editor(s) disclaim responsibility for any injury to people or property resulting from any ideas, methods, instructions or products referred to in the content. |
© 2025 by the authors. Published by MDPI on behalf of the International Society for Photogrammetry and Remote Sensing. Licensee MDPI, Basel, Switzerland. This article is an open access article distributed under the terms and conditions of the Creative Commons Attribution (CC BY) license (https://creativecommons.org/licenses/by/4.0/).
Share and Cite
Li, H.; Miao, L. A Study of the Non-Linear Relationship Between Urban Morphology and Vitality in Heritage Areas Based on Multi-Source Data and Machine Learning: A Case Study of Dalian. ISPRS Int. J. Geo-Inf. 2025, 14, 177. https://doi.org/10.3390/ijgi14040177
Li H, Miao L. A Study of the Non-Linear Relationship Between Urban Morphology and Vitality in Heritage Areas Based on Multi-Source Data and Machine Learning: A Case Study of Dalian. ISPRS International Journal of Geo-Information. 2025; 14(4):177. https://doi.org/10.3390/ijgi14040177
Chicago/Turabian StyleLi, He, and Li Miao. 2025. "A Study of the Non-Linear Relationship Between Urban Morphology and Vitality in Heritage Areas Based on Multi-Source Data and Machine Learning: A Case Study of Dalian" ISPRS International Journal of Geo-Information 14, no. 4: 177. https://doi.org/10.3390/ijgi14040177
APA StyleLi, H., & Miao, L. (2025). A Study of the Non-Linear Relationship Between Urban Morphology and Vitality in Heritage Areas Based on Multi-Source Data and Machine Learning: A Case Study of Dalian. ISPRS International Journal of Geo-Information, 14(4), 177. https://doi.org/10.3390/ijgi14040177