Article

Mapping Spatial Inequity in Urban Fire Service Provision: A Moran’s I Analysis of Station Pressure Distribution

Department of Urban Planning, Southeast University, Nanjing 211102, China
*
Author to whom correspondence should be addressed.
ISPRS Int. J. Geo-Inf. 2025, 14(4), 164; https://doi.org/10.3390/ijgi14040164
Submission received: 10 February 2025 / Revised: 7 April 2025 / Accepted: 8 April 2025 / Published: 10 April 2025

Abstract

:
Fire security is an important part of the urban infrastructure system. In existing quantitative application research, fire stations have always used a maximally covered approach to optimize the layout of urban functions. With this planning, different fire stations face different firefighting pressures (FPs) because of the different distributions of fires. On the basis of FPs, we explored the characteristics of firefighting behavior at fire stations in Nanjing using Moran’s I. We found that a large portion of the stations are in the periphery of high-fire-risk areas, which tend to experience infrequent fires near the stations. These stations organize inter-regional firefighting to reduce the risk of fires in urban areas in general. We attempt to change the maximally covered approach so that it can be used to quantitatively solve the problem of fire planning.

1. Introduction

Fire stations constitute a critical urban infrastructure, the equitable response of which is a priority area in urban construction. Considerable research has been conducted in the field of planning, with previous studies making significant advancements in socioeconomic and fire record correlation research, as well as in optimization algorithms for fire station layouts [1,2,3]. A critical gap persists in fire stations’ planning methods and firefighting pressures (FPs, defined as the ratio of fire accidents that occurred in past years in certain urban areas), which is seldom a concern in real planning situations [4,5]. This disconnection has resulted in the potential inequity of firefighting services in urban governance.
In the existing fire station layout strategy, the maximum coverage principle is the predominant logic [6,7] and is the main reason for the disparity observed in spatial services. Ferreira, T. M. et al.’s findings on urban historical cores in fire occurrences fundamentally highlight the limitations of the maximum coverage assumption that service demand is spatially uniform [8]. Svensson, S. reported that fire risk is always propagated based on neighborhoods [9]. Particularly in high-value urban cores, higher housing rents correlate closely with fire records [10]. The static boundaries of fire services need further optimization.
Under the maximum coverage strategy, some fire stations may be responsible for many fires, whereas others have few fires in their jurisdiction, which aggravates the inequality of firefighting services [4]. Maximum coverage does not mean that the station must adopt a settled coverage area [11,12,13]. Recent studies propose micro-fighting points [14] and POI-driven optimization [15]; these solutions remain reactive rather than preventive. Fire stations should adopt a flexible strategy for FPs in urban areas, which enables planning to safely deal with the dynamic urban fabric and enhances the plan’s validity.
In terms of planning practice, fire stations cannot freely select their location because of the complexity of the central urban area [16]. According to research from Corcoran J., Higgs G., and Higginson A., urban policy strategies emerge from different social groups because of these groups’ spatial heterogeneity, which causes different FPs [17]. Tian F et al. simulated urban construction’s complexity to identify the fire service boundary and found that the community has totally different FPs in the same urban area [18]. We need to change our focus from maximizing coverage to allocating resources based on demand.
This study pioneered an analytical framework to quantify the spatial correlation between fire station locations and historical fire incidents. Through Moran’s I analysis, we achieve the following:
  • Identify the FPs faced by different fire stations in Nanjing.
  • Identify the stations’ service strategy for inequivalent FPs in urban areas and check the strategies’ significance.
  • Compare the characteristics of different strategies via the spatial autocorrelation check and illustrate the advantages.
Considering the gap resulting from the maximum coverage method, we provide a method with a service-balanced approach to urban planning.

2. Application of Spatial Autocorrelation Methods in Infrastructure Planning

To measure FPs’ characteristics at fire stations, it is essential to explore the spatial autocorrelation between fire distribution and fire station distribution. Moran’s I is a commonly used approach in spatial autocorrelation detection [19]. This function is influenced by two aspects: the spatial adjacencies between statistical units and the feature’s value. From a quantitative geographic perspective, the statistical units and statistical elements are indifferent. However, as the differences between statistical units and statistical elements are emphasized, Moran’s I can respond to more complex spatial phenomena. Xingxing et al. used Moran’s I, which is based on changes in the collection area, to characterize the spatial aggregation of innovation. The study measured clustered innovative companies’ spillover effects in urban areas via a changing capture radius [20]. Fu, Q. et al. studied the spatial autocorrelation created by the movement of crowds [21]. The statistical units in the time series are constant. We researched the trends in Moran’s I in a time series. Such a trend can reflect time-based spatial autocorrelation in urban space. Moran’s I can flexibly respond to the extent of spatial autocorrelation, and the FPs of fire stations can be measured in a similar way.
Moran’s I can measure a decreasing characteristic of spatial autocorrelation. Spatial autocorrelation changes in response to changes in the research conditions, a characteristic that is considered a spillover effect. The physical elements show a decreasing distribution due to changes in location, and this distribution can help to formulate planning policies [22]. Zhang et al. studied how green spaces are important for different groups of people based on their location patterns [23]. They also suggest plans for improving urban green spaces. It is possible to optimize the efficiency of green space use in urban areas.
Existing studies focus on efficiency issues arising from the maximization of coverage of fire rescue, finding that it is difficult to guide the planning of firefighting. Floderus, P., Lingas, A., and Persson, M. used a blocking method to describe fighting fires in urban areas, which focuses more on the ability to respond to a fire than on maximizing coverage [24]. Shaikh, M. K. reviewed current research and found it necessary to optimize the firefighting response based on firefighting behavior [25].
In our research, we adopt the changing effect of spatial autocorrelation. The fire station will use the sampled fire records as the FP and estimate the trend of Moran’s I. With fire stations choosing different areas of responsibility, the number of fire records captured will reflect different trends, which is an ideal indicator for identifying FPs in urban areas.

3. Data and Methodology
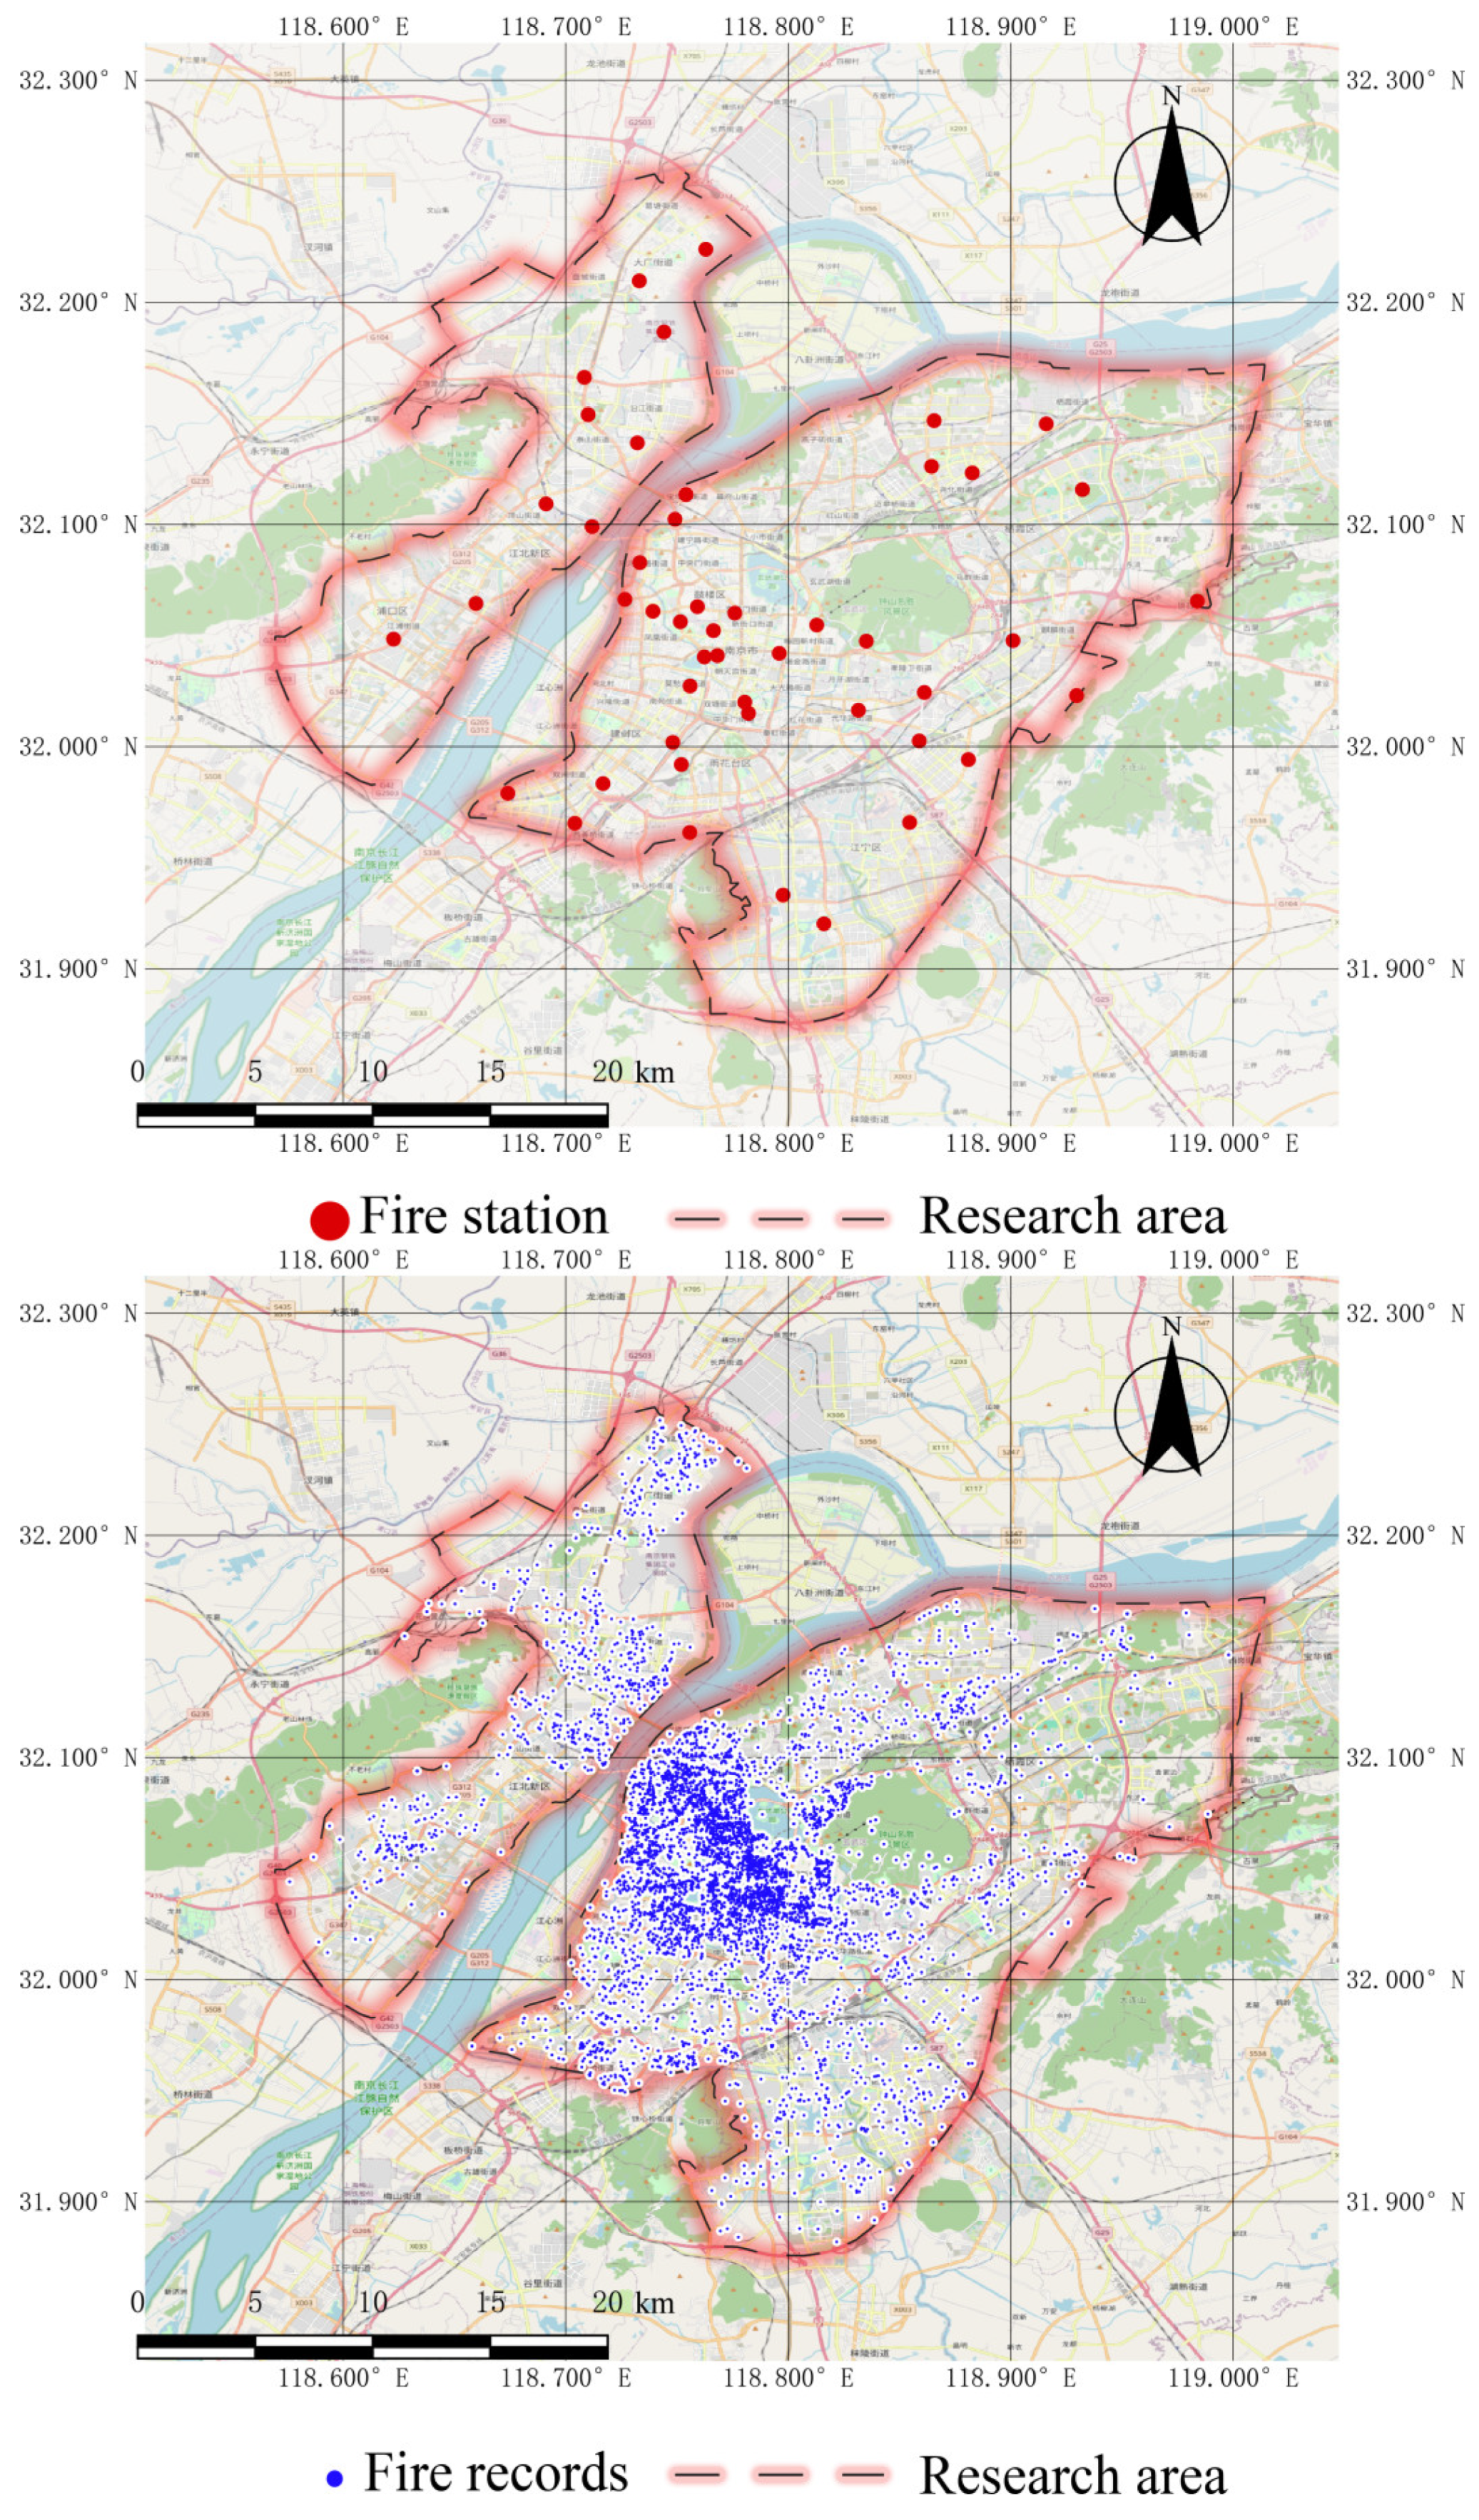
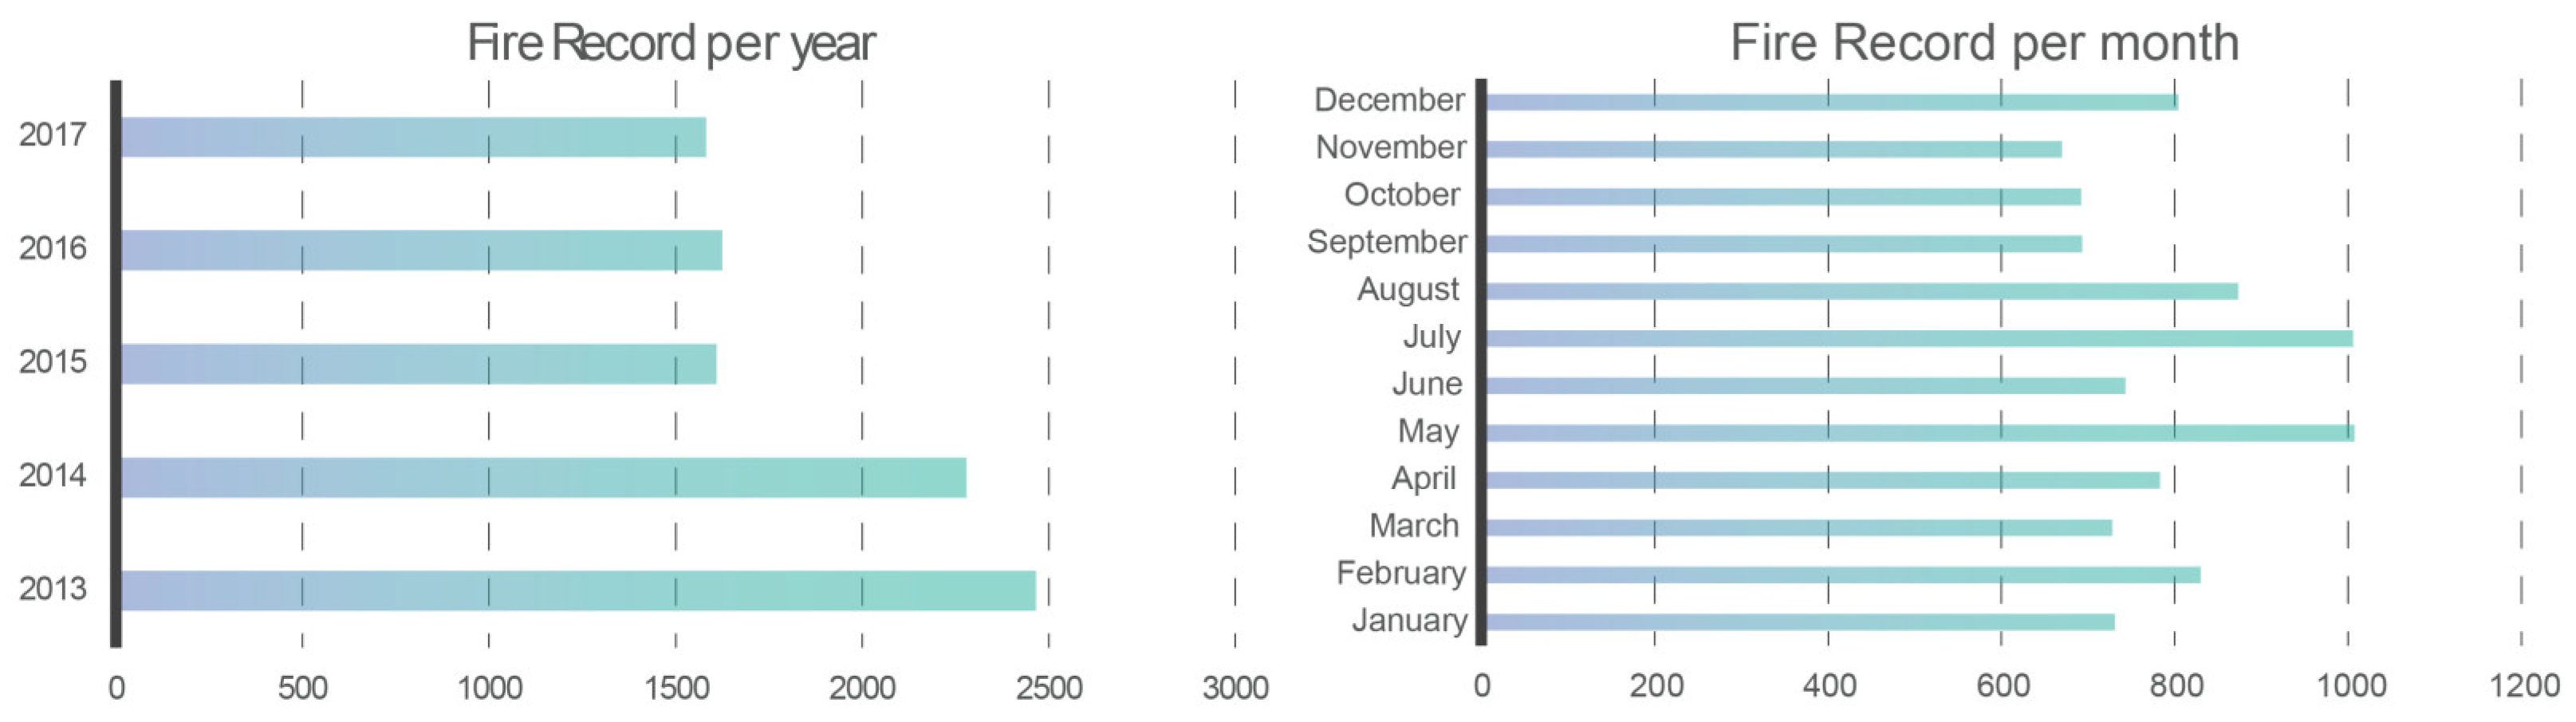
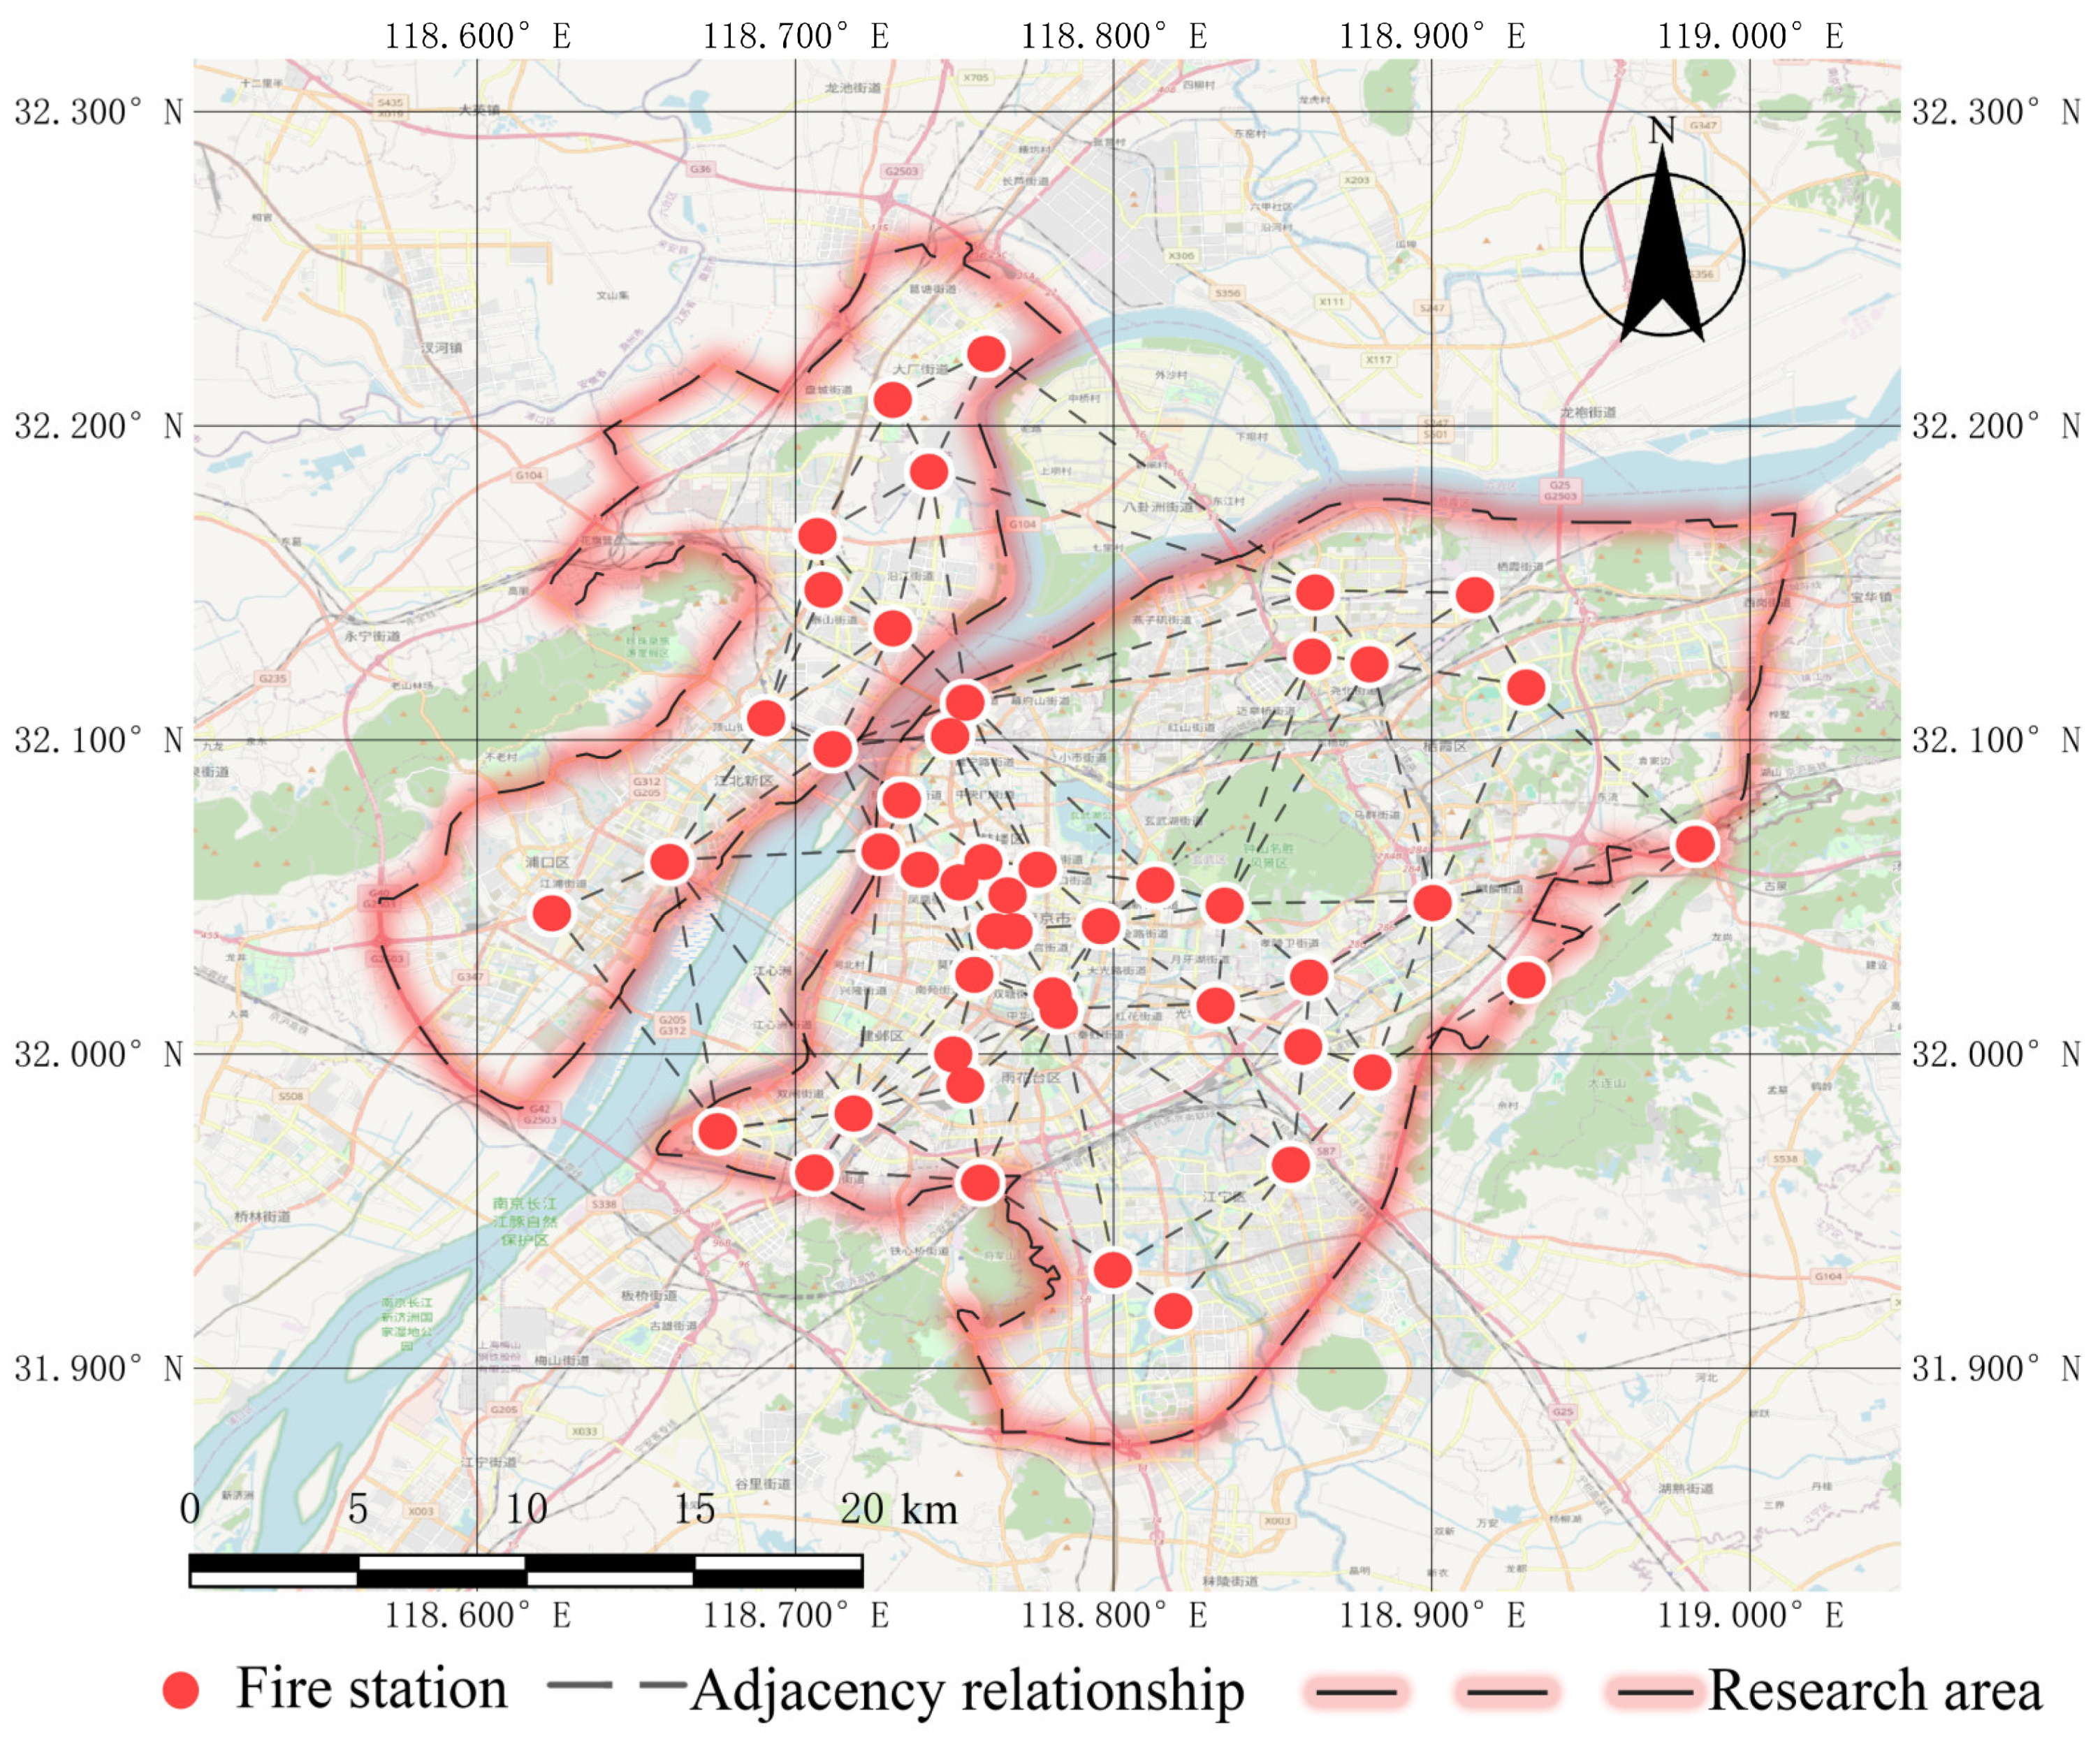
3.1. Data

In this study, we use fire records from 2013 to 2017 in Nanjing, Jiangsu, China, an area supported by the Nanjing government. The records contain information regarding all fire-related occurrences in Nanjing, including residential fires, industrial fires, and wildfires, with residential fire records accounting for the majority, which is shown in Figure 1.
Gaode Maps was used to show the location of the fire station; this is one of the biggest online map providers in China, and its location services are widely used in the current research. We adopted Nanjing’s downtown region as the research area, where the infrastructure is well constructed. Moreover, micro fire stations are adopted to compare the micro station strategy with the inter-regional strategy. These micro stations are responsible for sudden fires and are governed by the nearest professional fire station, which is from Gaode Maps, during the same period. No significant urban constructions or fire station locations changed during the research period.
Figure 2 shows the fire record characteristics in different periods. Over the years, the number of fire records decreased because of the optimization of urban fire services. In terms of seasons, there are more fire records in summer, with no significant preference for other seasons. Overall, fire records do not have significant temporal heterogeneity.
We adopt housing price and POI data to check the FP’s socioeconomic characteristics in urban areas, which can support the strategy if it is significant. The POI data are from Gaode, which is also in the same period, and the price data are from Lianjia, which is one of the largest online housing markets in China. The period of these data is 2017, which is the earliest online rent data in China. If socioeconomic data are closely correlated with FPs, planners can develop flexible logic migration.

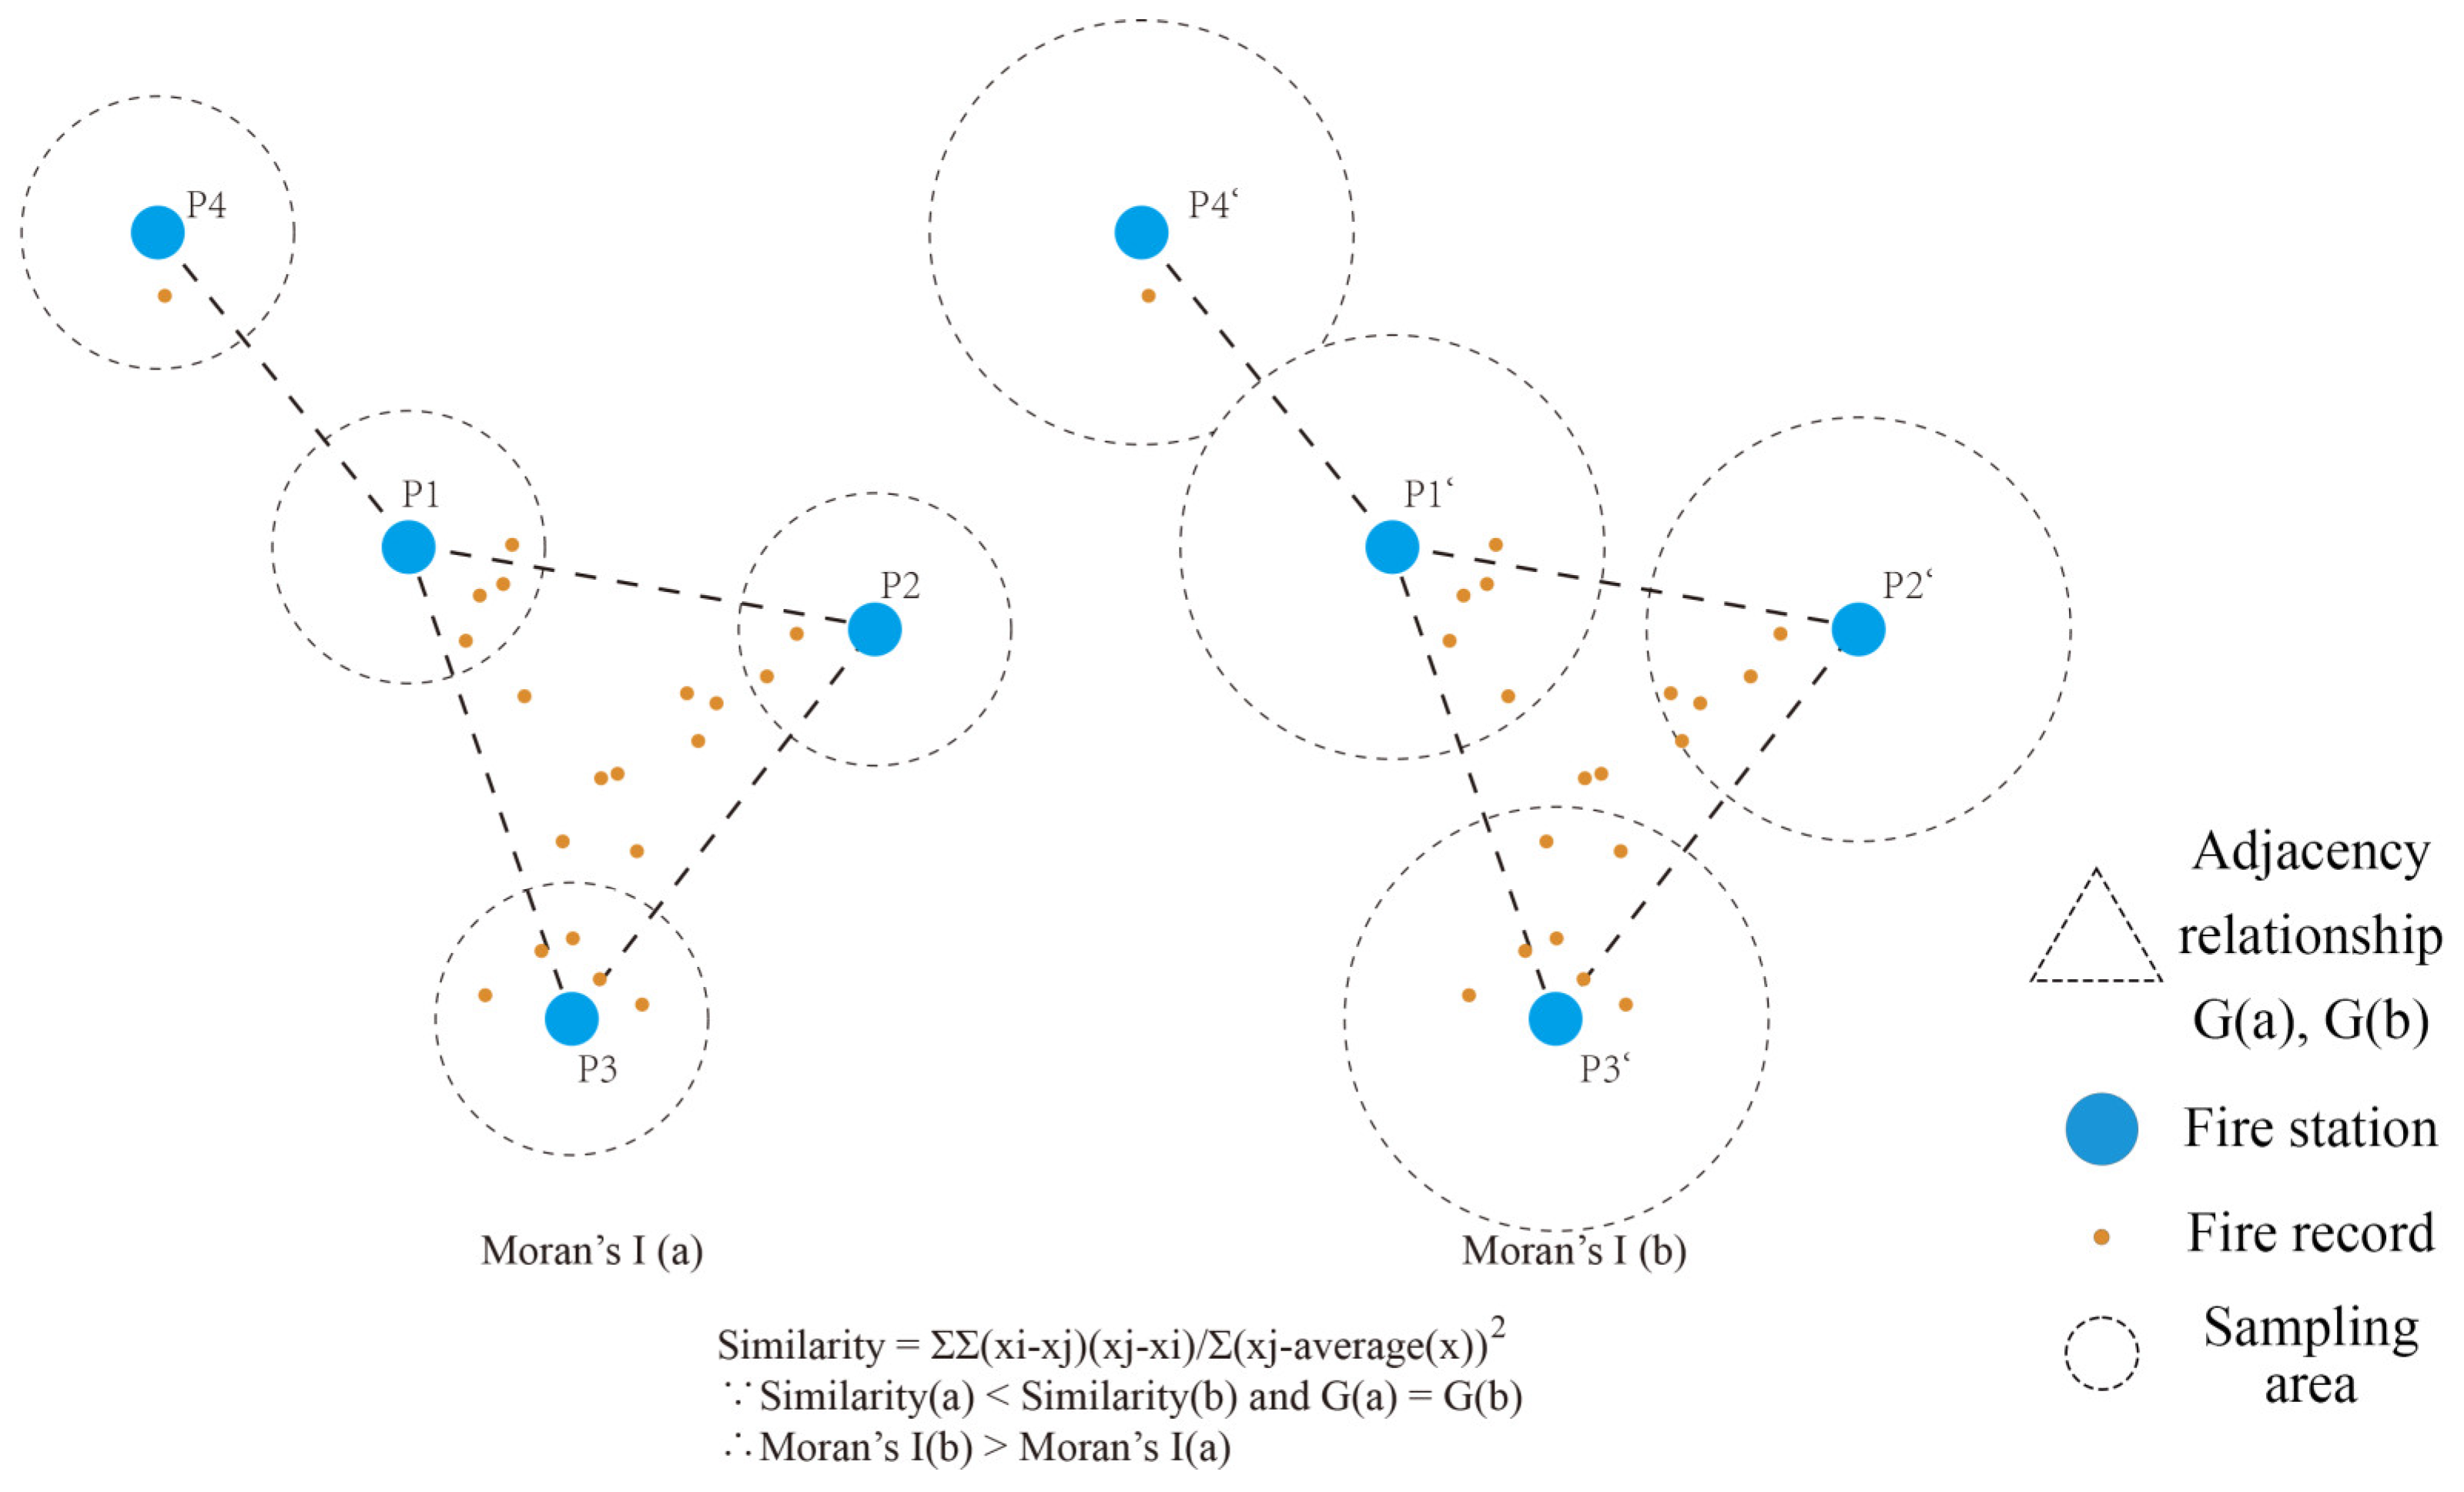
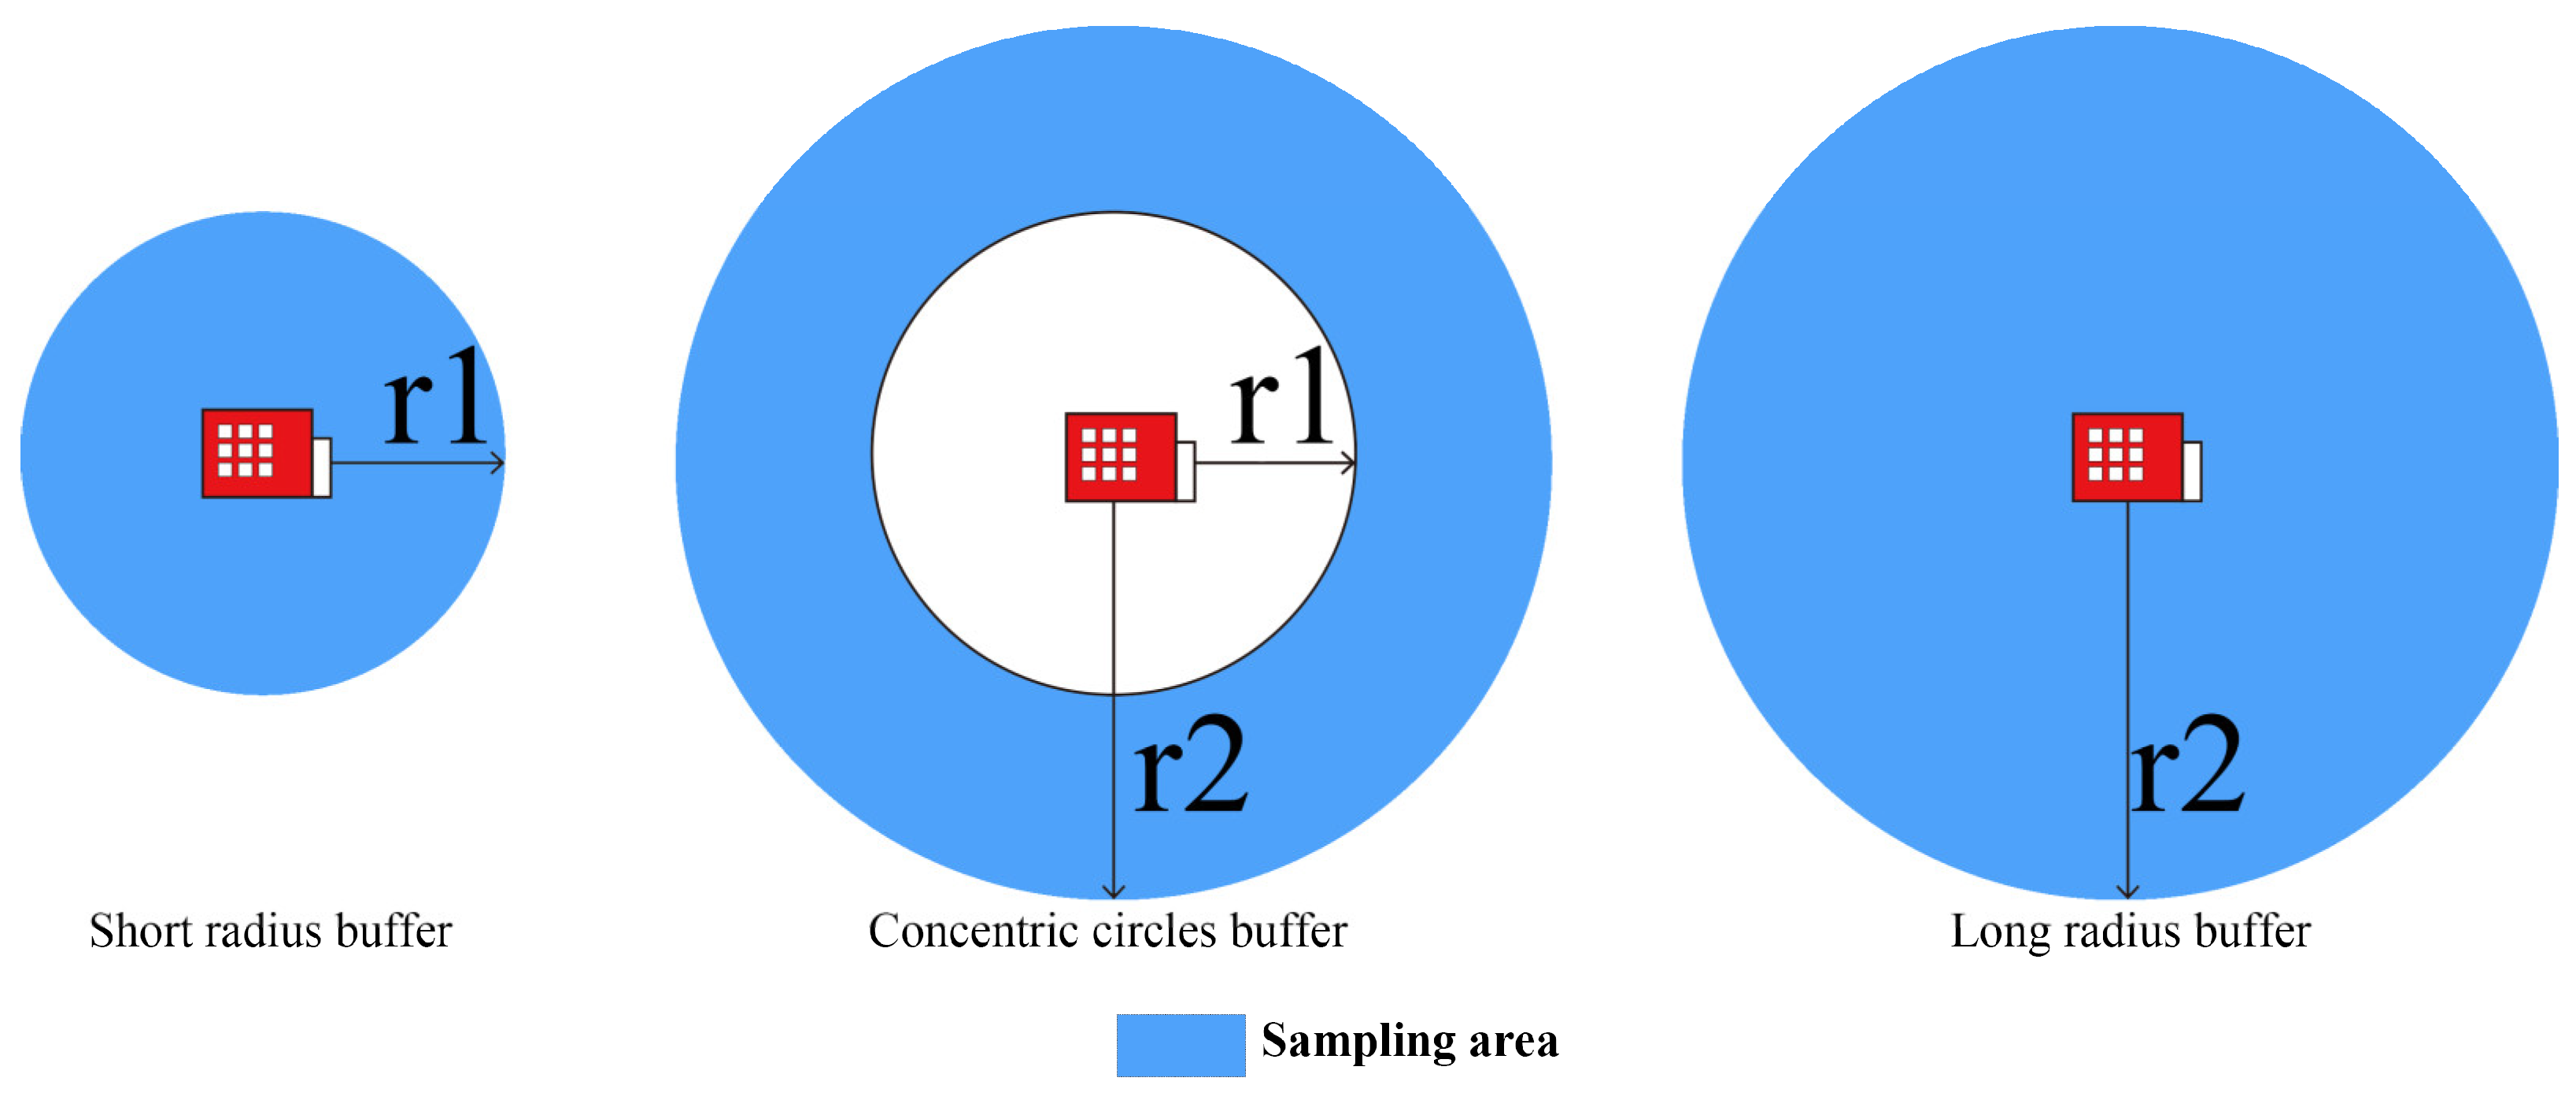
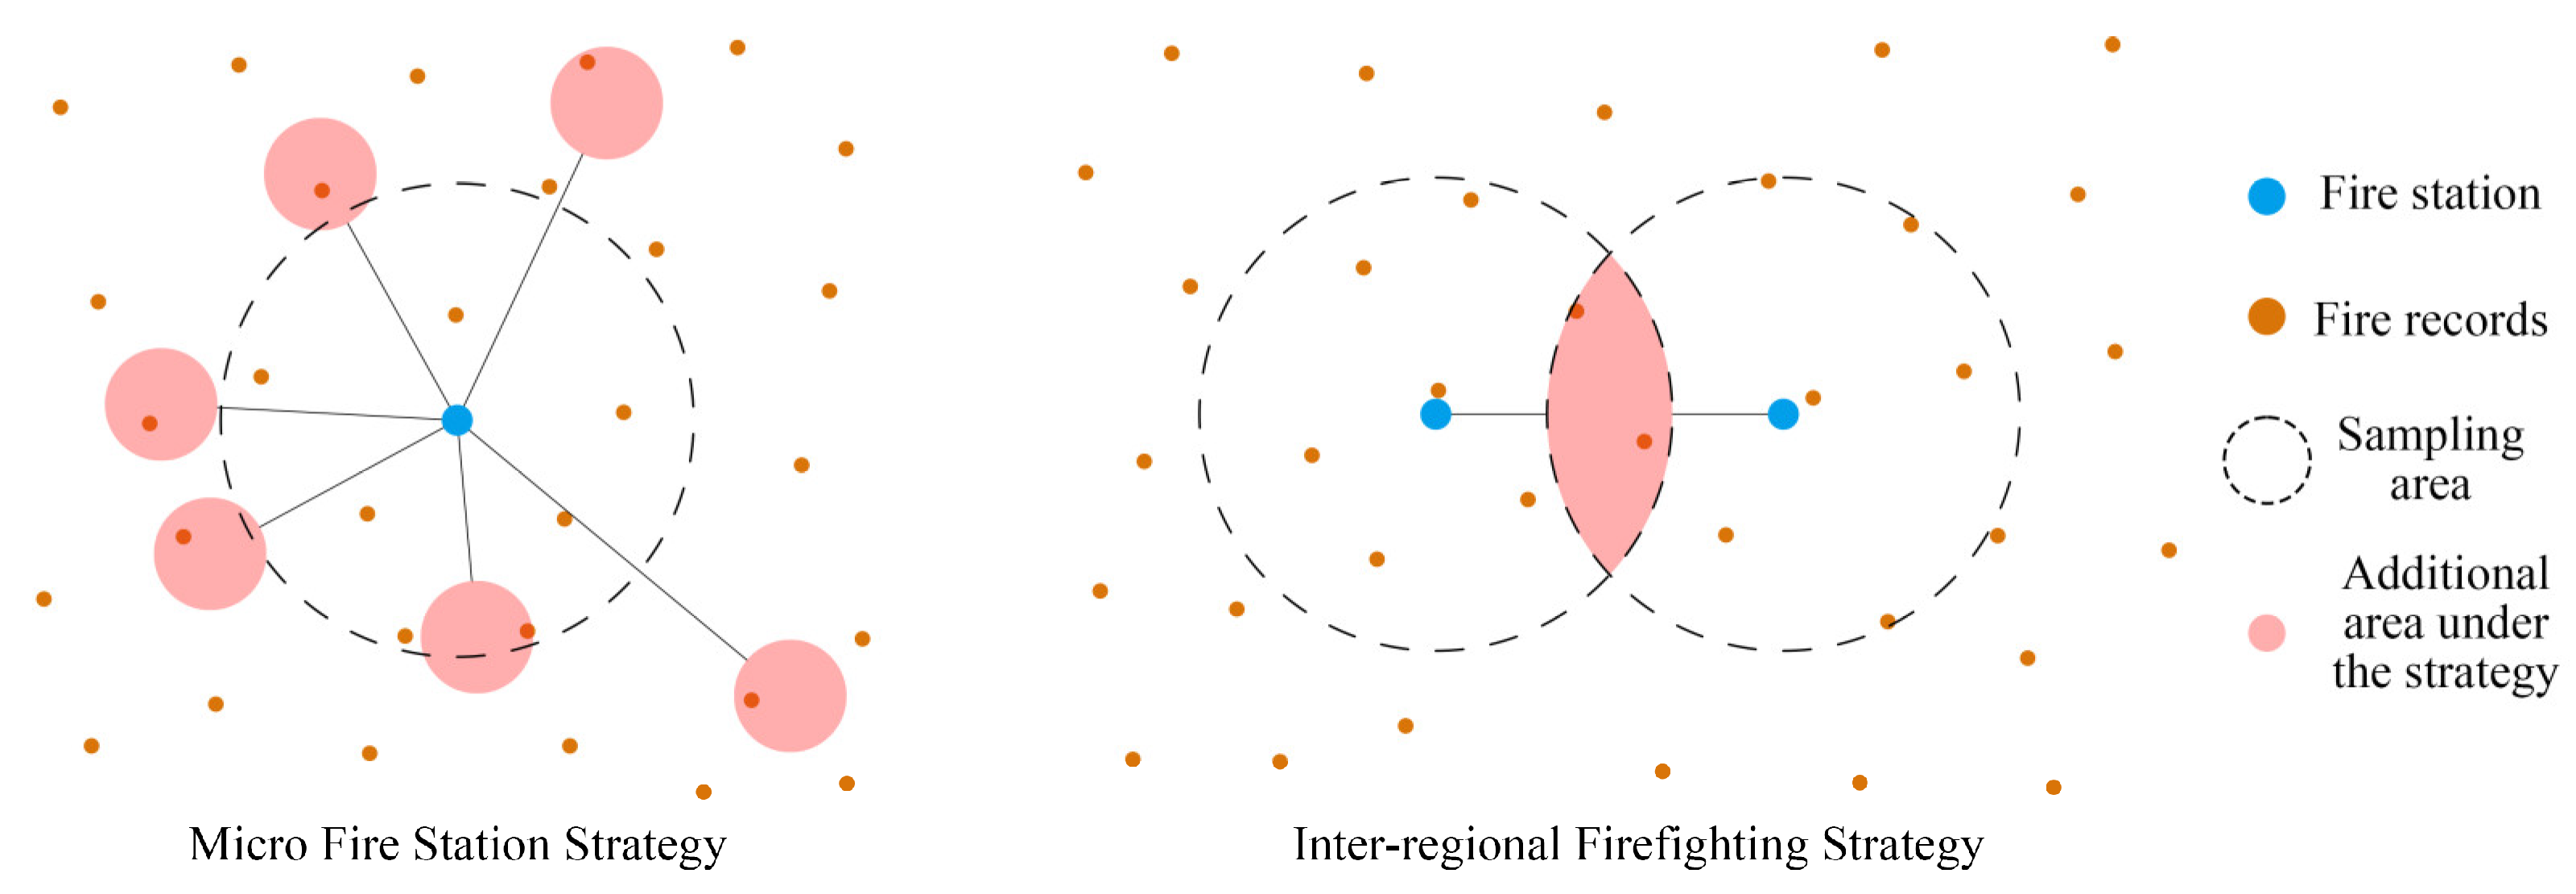
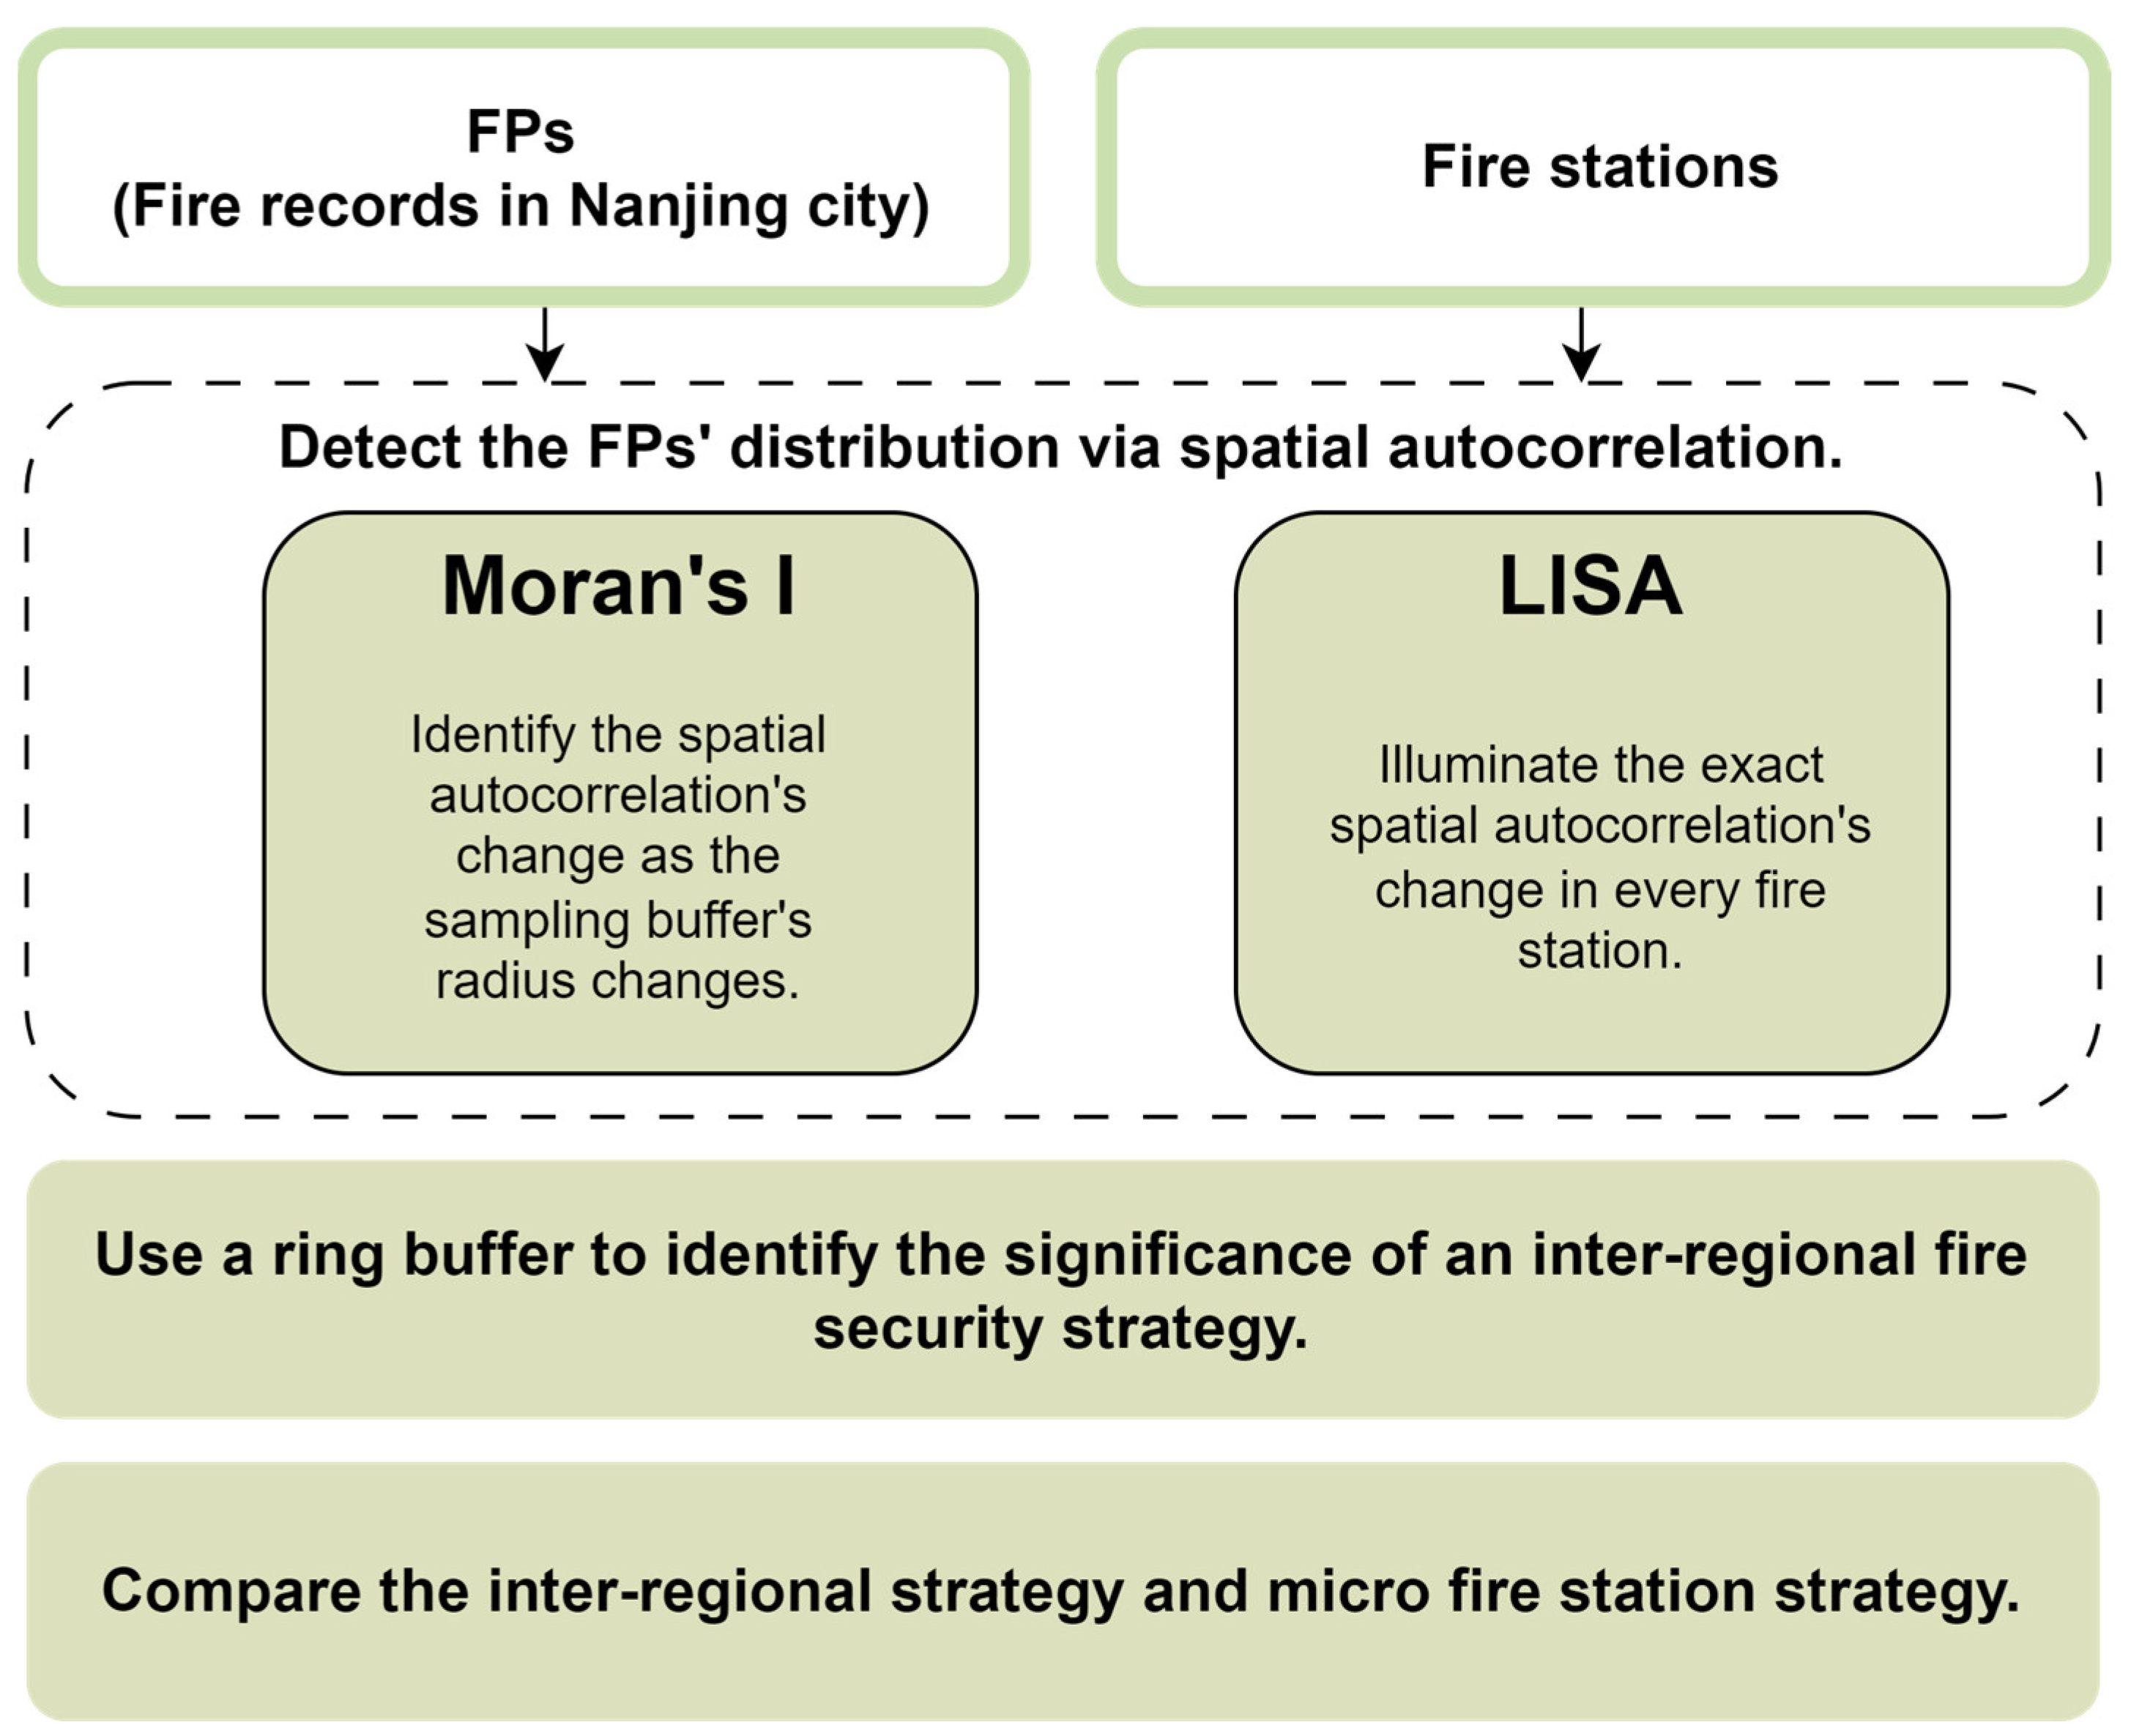
3.2. Methodology and Research Structure

Moran‘s I is designed to measure the relationship between geographical units and collected elements within a certain catch area, and its formula is shown in Equation (1).
I = N i n j n w i , j z i z j W i n z i 2 ,
z i = x i x ¯ ,
where w i , j denotes a neighboring relationship. Both z i and z j are measured values minus their mean values. N is the number of geographical units. W is the sum of w i , j . Moran’s I is used for the z score and the p value to indicate whether they are significant. The p value is based on the z score, and the z value is calculated as in Equations (3)–(5).
z I = I E I V I ,
E I = 1 N 1 ,
V I = E I 2 E [ I ] 2 ,
where E I is the mean value of Moran’s I in expectation, and where V I is the variance of Moran’s I. The z value measures whether the spatial distribution of a variable contradicts an equilibrium distribution, whereas Moran’s I indicates whether the spatial autocorrelation of variability is high or low. Under normal conditions (e.g., few spatial units and no differences in the distributions of the values), z values tend to have characteristics similar to those reflected by Moran’s I. That is, the z values of Moran’s I as it approaches 1 and −1 also tend to be significant. If its spatial autocorrelation is insignificant, Moran’s I will be close to 0.
Localized Moran’s I (local indicators of spatial association, LISA) is a method that can react to the layout of spatial units.
I i = N z i j n w i j z j i n z i 2 ,
Equation (6) is the calculation of LISA. The parameters in Equation (6) are similar to those in Equation (1). In Equation (6), w i , j denotes a neighboring relationship between i and j . Neighboring is 1, non-neighboring is 0. Both z i and z j are measured values minus their mean values. N is the number of geographical units. W is the sum of w i , j . For Equation (6), the denominator does not change, which is the sum of all z i 2 . Therefore, the more units neighboring the current unit and the higher the value of the variable, the higher the LISA of this unit.
For I i , researchers can adopt z j as the x-axis and j n w i j z j as the y-axis to divide the four quadrants, which is a tool to identify the aggregation situation around the unit. The aggregation situations can be classified into four types: high-high (H-H), high-low (H-L), low-high (L-H), and low-low (L-L), which reflect the spatial autocorrelation between the current unit and the surrounding neighboring units. LISA can also use the significant check via p value and z value.
z I i = I i E I i V I i ,
E I i = j n w i j N 1 ,
  V I i = E I i 2 E [ I i ] 2 ,
In Equation (7), E I i is the representation of LISA in a random neighboring situation, and V I i is the variance of LISA on the current cell. The significance validation is the same as the global Moran’s I.
The fire station needs to sample fire records from the surrounding area, and the fire sampling radii are 150, 200, 250, 300, 600, 1200, 1800, 2400, 3000, 3600, and 4200 m. The records show different fire station rescue times. The speed of an auto is approximately 15 m per second in Nanjing, and in this research, the boundaries of the fire services are set to 10, 20, 40, 80, 120, 160, 200, 240, and 280 s, representing radii of 150, 300, 600, 1200, 1800, 2400, 3000, 3600, and 4200 m, respectively. Time–speed-based service boundaries are commonly seen in fire research [16,26]. Meanwhile, we split the domain from 150 m to 300 m, considering the scale of the urban block. The boundary lengths of individual blocks are often based on 50 m [27,28]. Consequently, this analysis adopts lengths of 200 m and 250 m to show the change effect of spatial autocorrelation in block size.
On the basis of the different sampling radii, it is possible to determine the likelihood of the occurrence of fires within certain radii. The changes in Moran’s I are shown below in Figure 3.
As the buffer area increases, the number of fires increases in P1, P2, and P3. The spatial autocorrelation among the stations is enhanced. The links to the four sites remain unchanged, so Moran’s I has increased. The z score increases significantly.
With such an increase, the LISA can reflect the detailed FP situation, and the meaning of “high” or “low” in the LISA can also delineate a new explanation, which is shown in Figure 4.
To determine the fire stations’ co-defense relationship, we used the rook neighbors to build an adjacent matrix. The neighborhood relationship is shown in Figure 5.
Then, an analysis was conducted to validate the existence of the inter-region strategy in urban research. A differentiation buffer method was set up for the fire stations. We categorized the sites into three types, as shown in Figure 6. These sites build their buffers in different ways, as can be seen from the figure.
The shortest buffering represents a fire station in a high-risk area, which directly faces the fire and protects high-value infrastructure. The use of a ring buffer represents fire stations located near high-fire-risk areas. These stations need to provide inter-regional fire services to these areas. Since the high-fire-risk areas are in the neighboring area rather than the local area, it is necessary to use a method to simulate the rescue preferences. The largest buffer represents fire stations located in low-risk areas, where many fires are not distributed around them.
The ring buffer demonstrates the inter-regional fire station, which will focus on fires at a distance because of the low frequency of the surrounding fire records. If the ring buffer can sample the fire records in a high-risk area, the total number of stations that can reflect the fire aggregation will increase. Moran’s I will increase under this effect, which validates the stations under the strategy that can sample most of the fire records.
After validating the significance of inter-regional fire services, we compared the performance enhancement between the inter-regional strategy and a micro-fighting strategy, which can identify the advantages of different fire enhancement methods. The method is shown in Figure 7.
The enhancing strategy, essentially, is an enhancement of the fire station’s coverage capacity. We adopt the following enhancement method in the analysis to compare strategy features in quantitative validation.
The aim of the micro-fighting strategy is to enhance fire services in limited locations. These fire services are not as significant as a professional fire station. This strategy is expressed as a two-step sampling process. First, the micro fire station and professional fire station will sample the fire records via different sampling radii. Then, the fire records from the micro station will be added to the professional station. The result indicates the serviceability of the professional fire station. The service radius of the micro fire station is set to 100 m. For the inter-regional strategy, because of the increase in the same area of responsibility, the number of fire records added to the fire station in this area would double.
The structure of our analysis is shown in Figure 8.

4. Results and Discussion

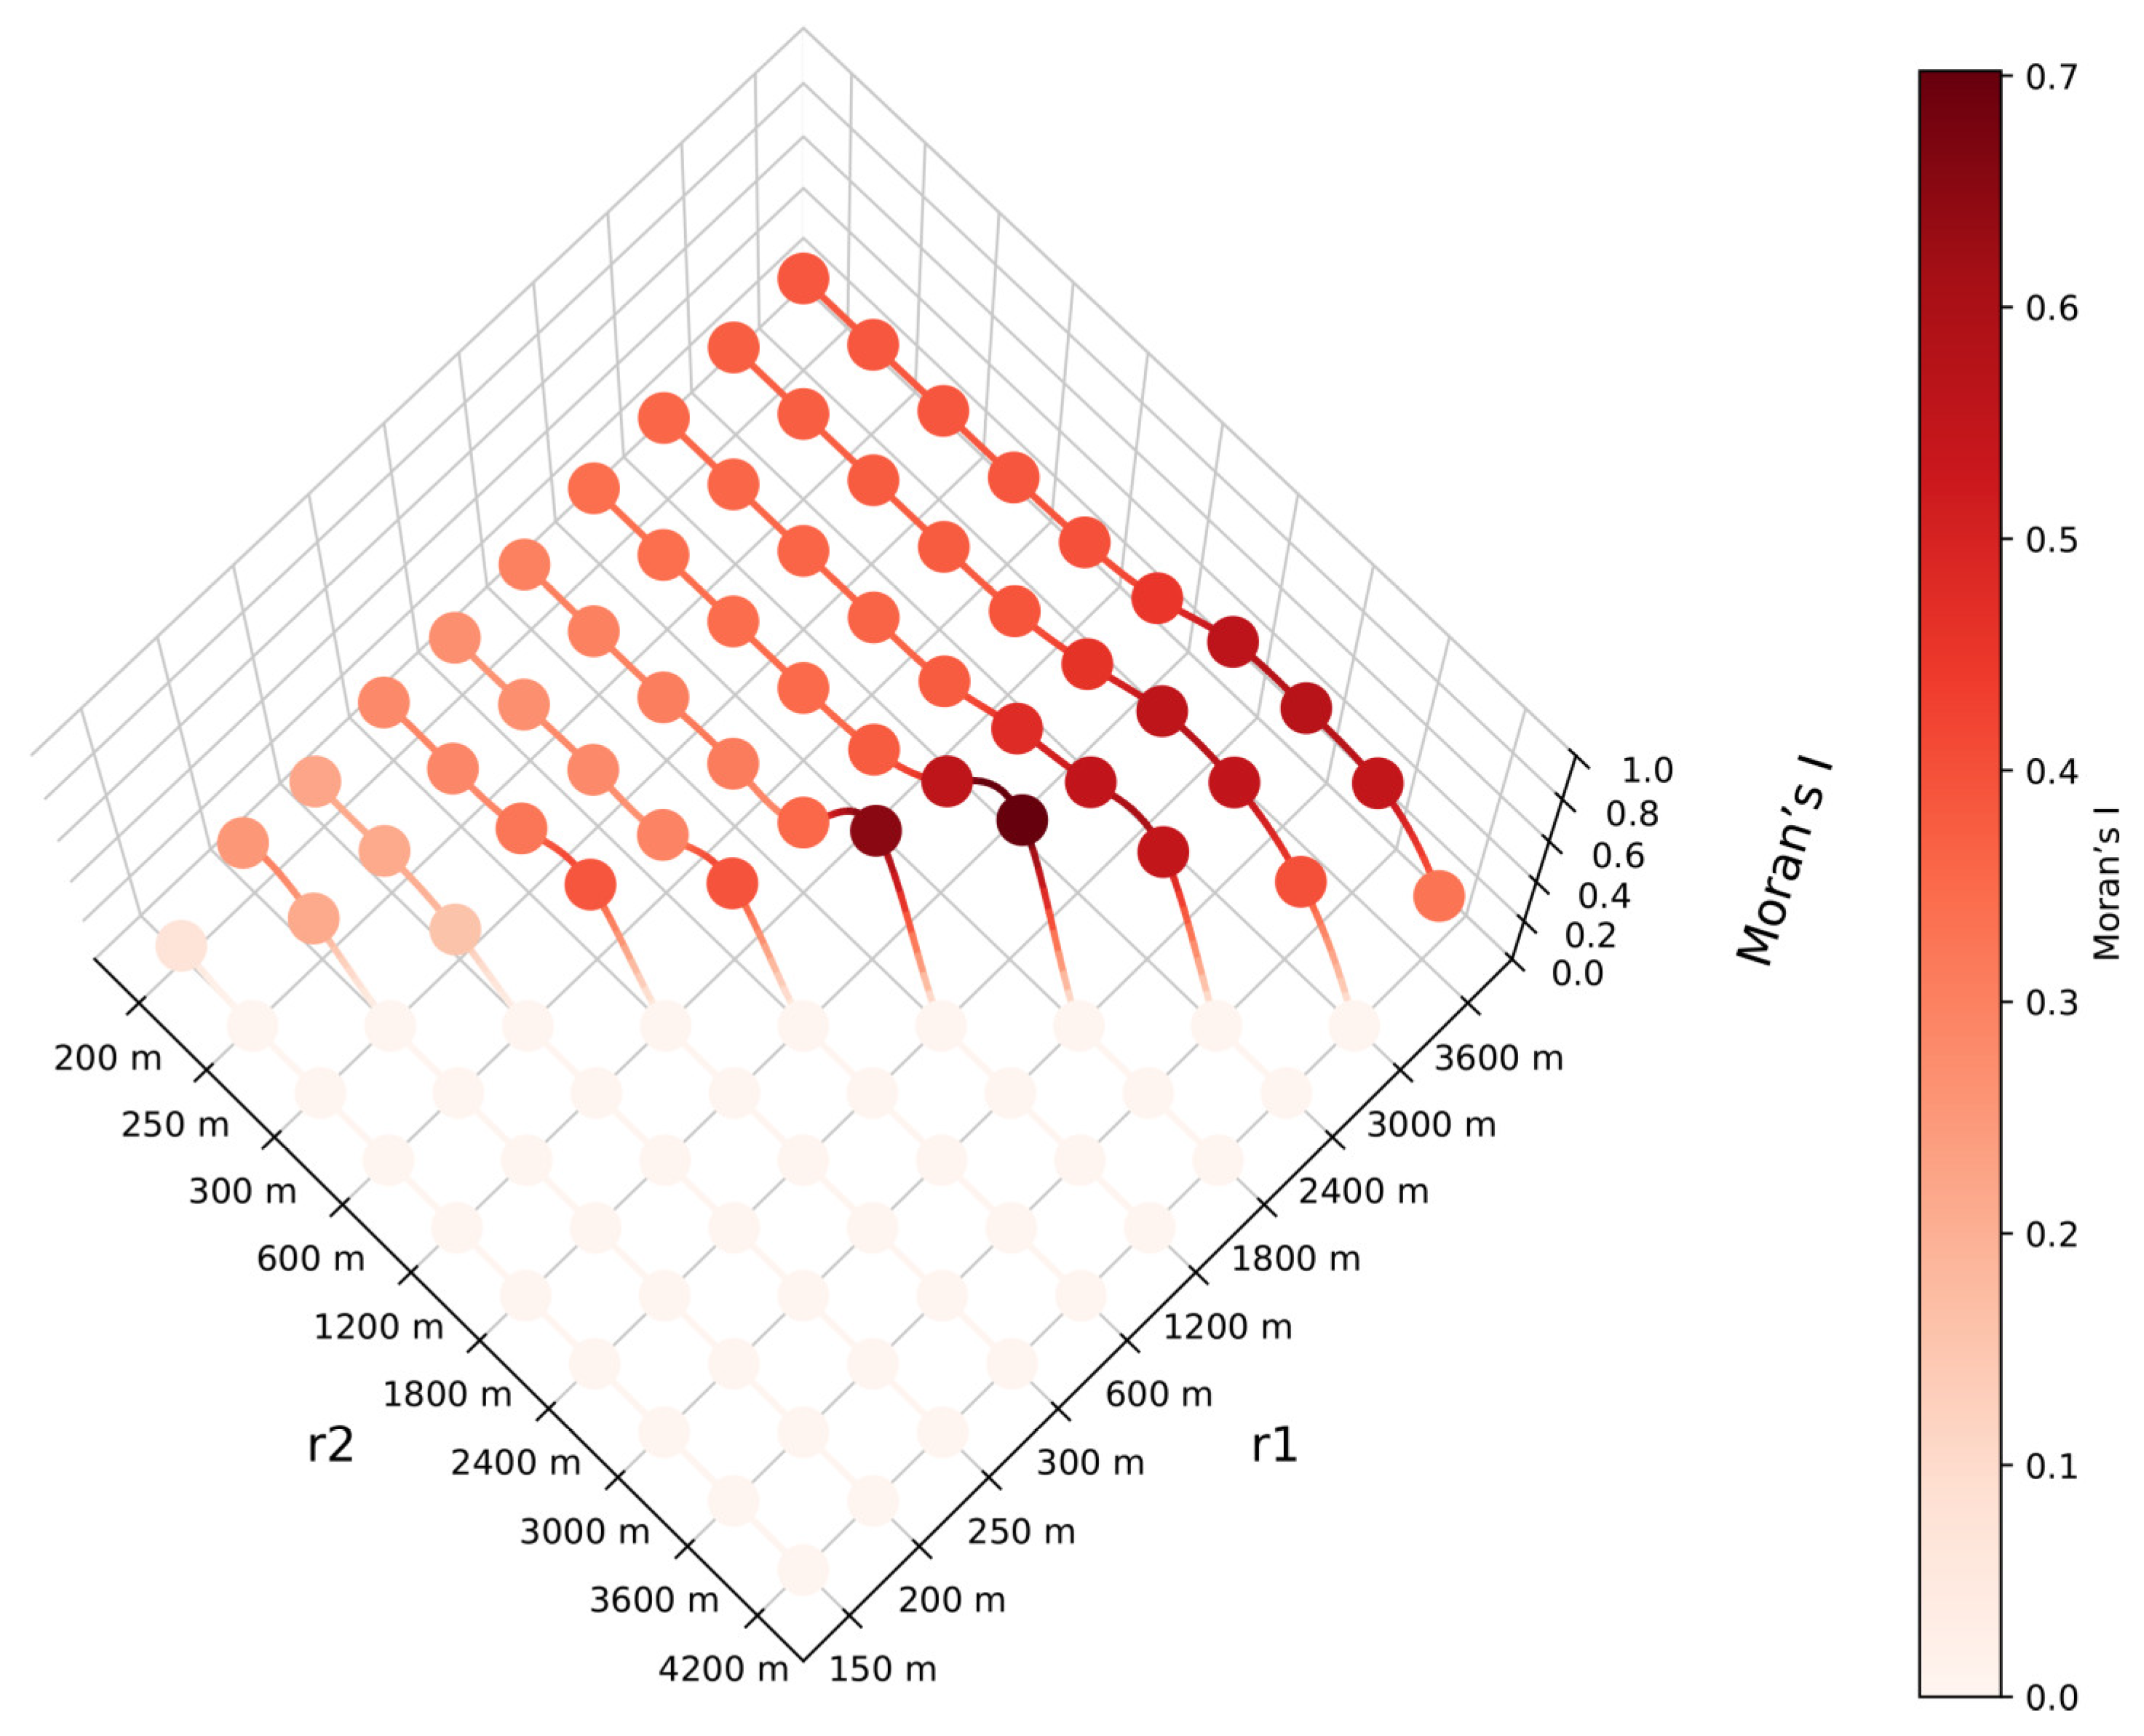
4.1. Global Moran’s I

The global Moran’s I and its significance tend to increase with increasing sampling radius. This is because the residential fire density is high in specific core areas of downtown Nanjing. With the increasing radius, the fire stations in these areas will catch residential fires, which will lead to an increase in Moran’s I. The result is shown in Figure 9.
With the increasing construction density, the cost of planning a fire station in a high-density area also increases. Therefore, some fire stations are on the periphery of the high-risk area. The limited number of fire stations in the high-risk area are not able to handle FPs on their own; thus, neighboring stations must deal with these FPs.

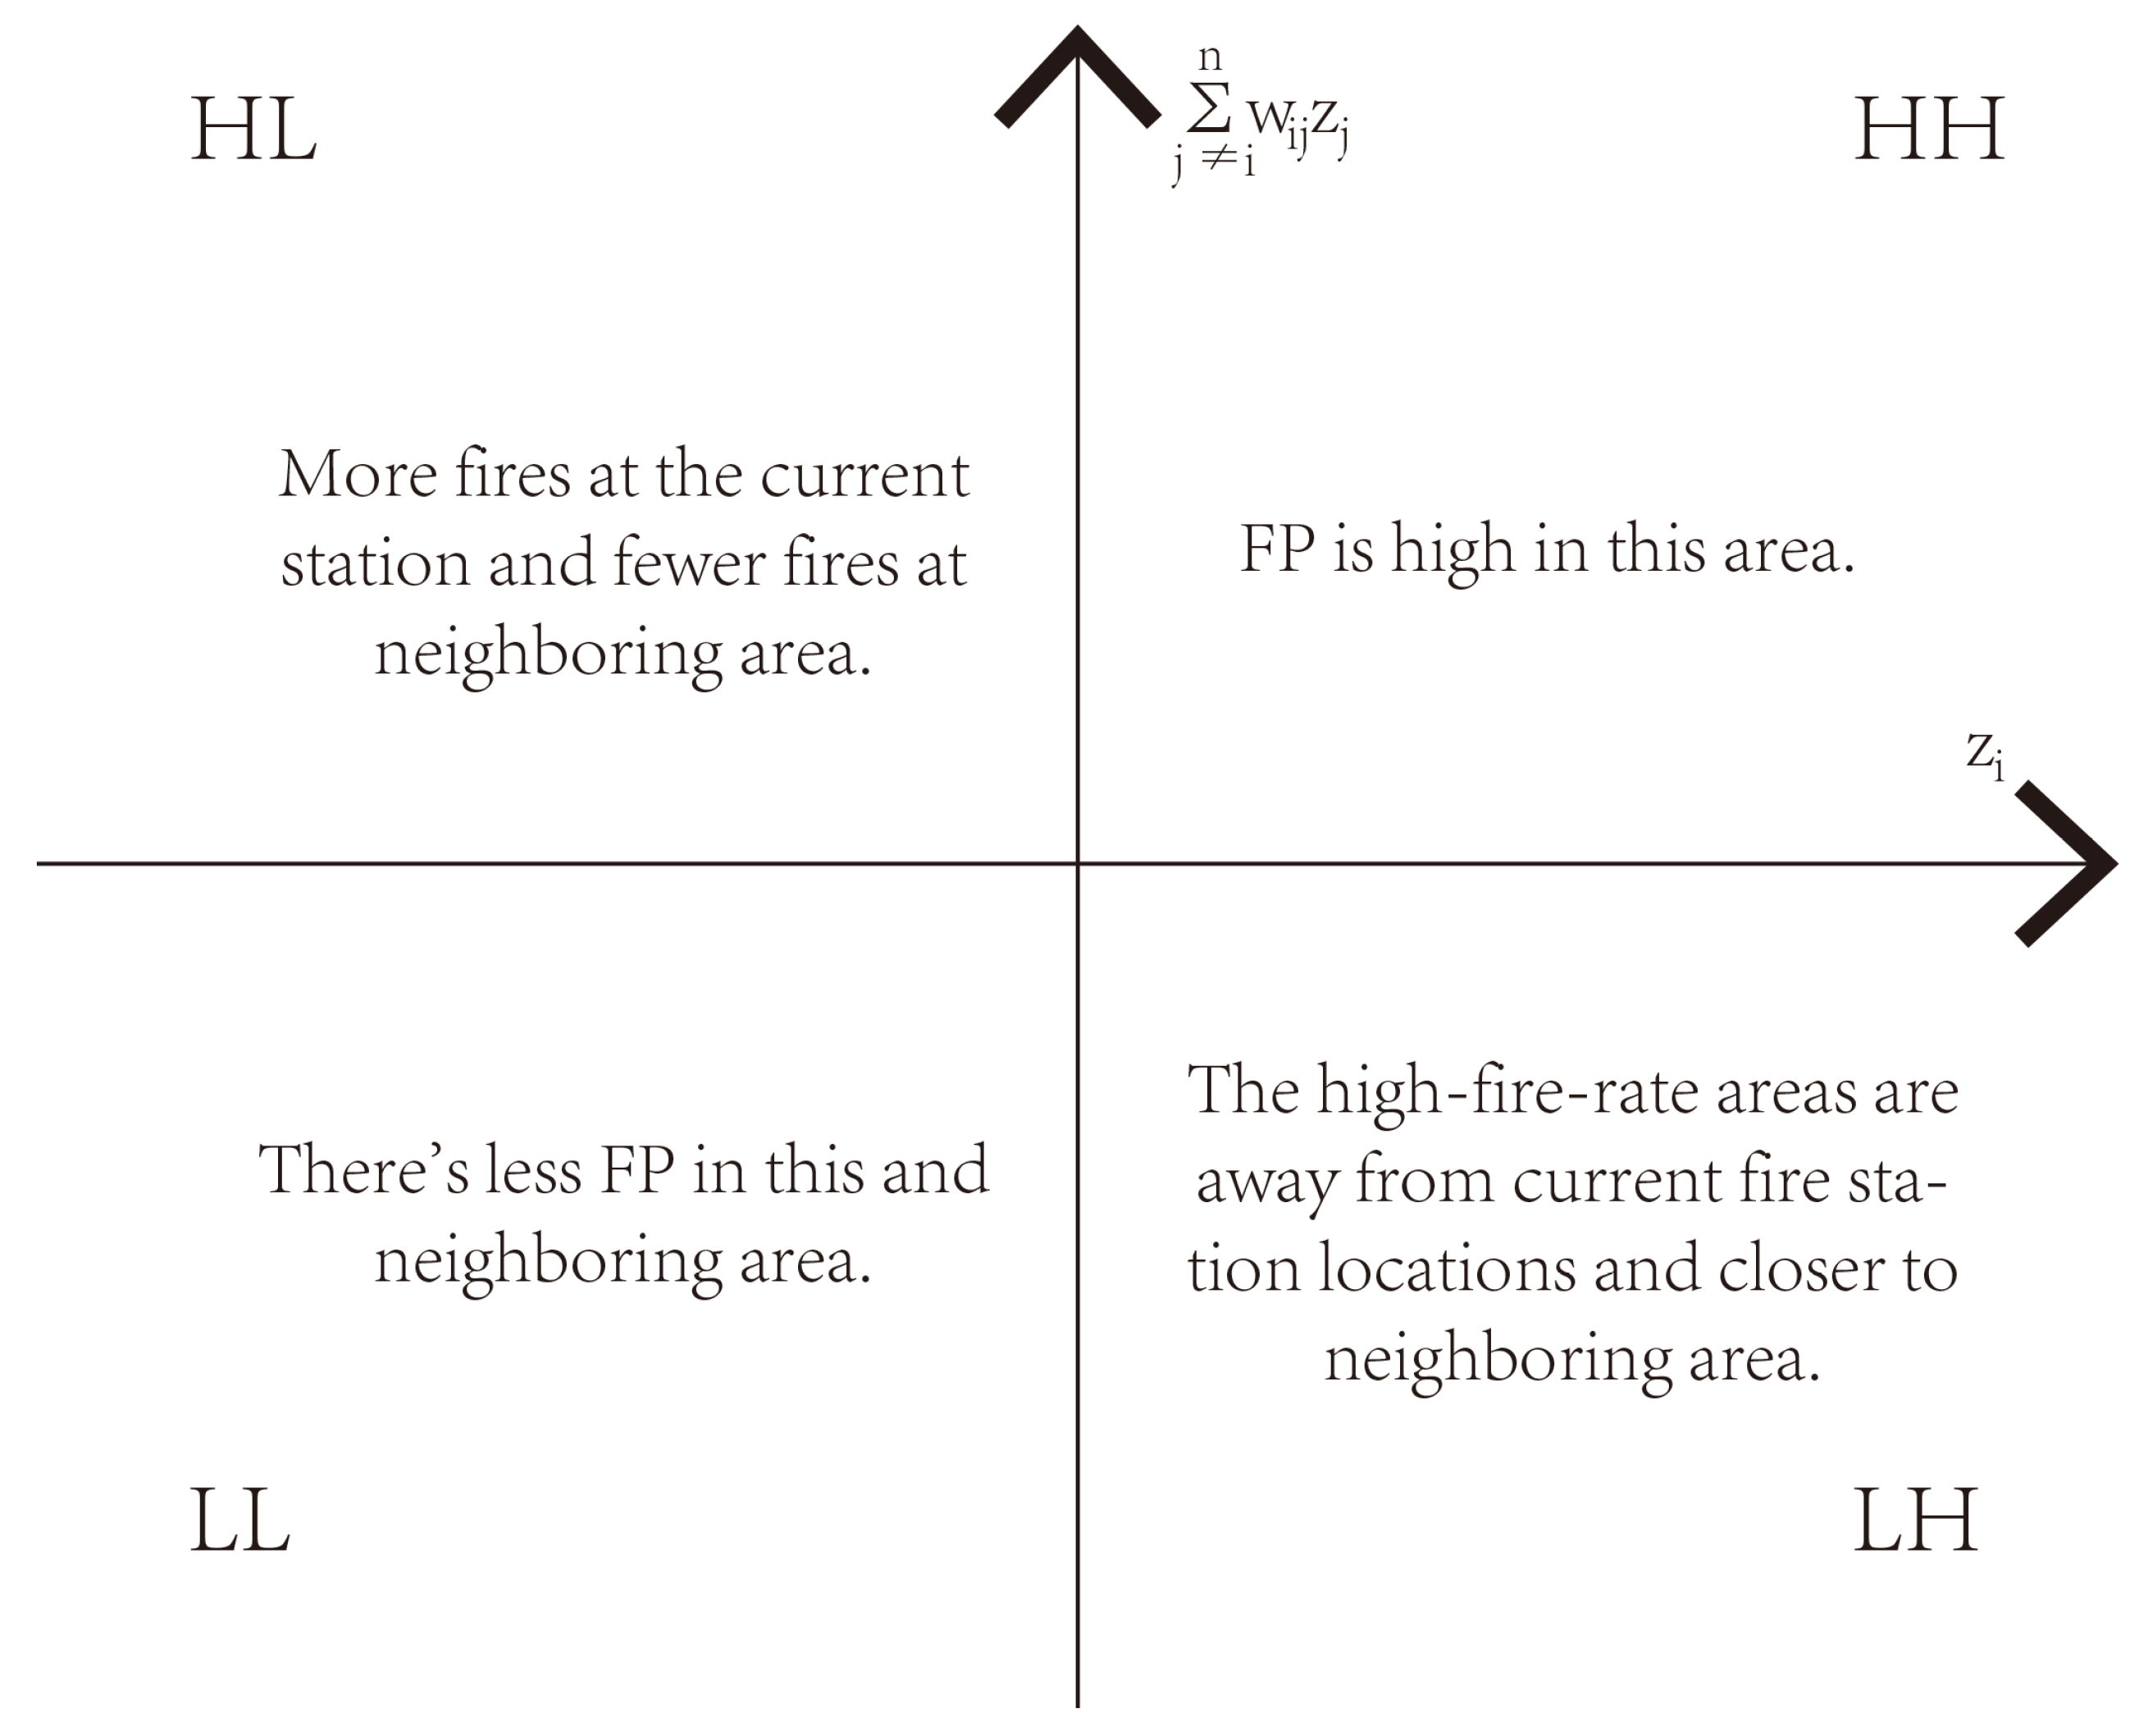
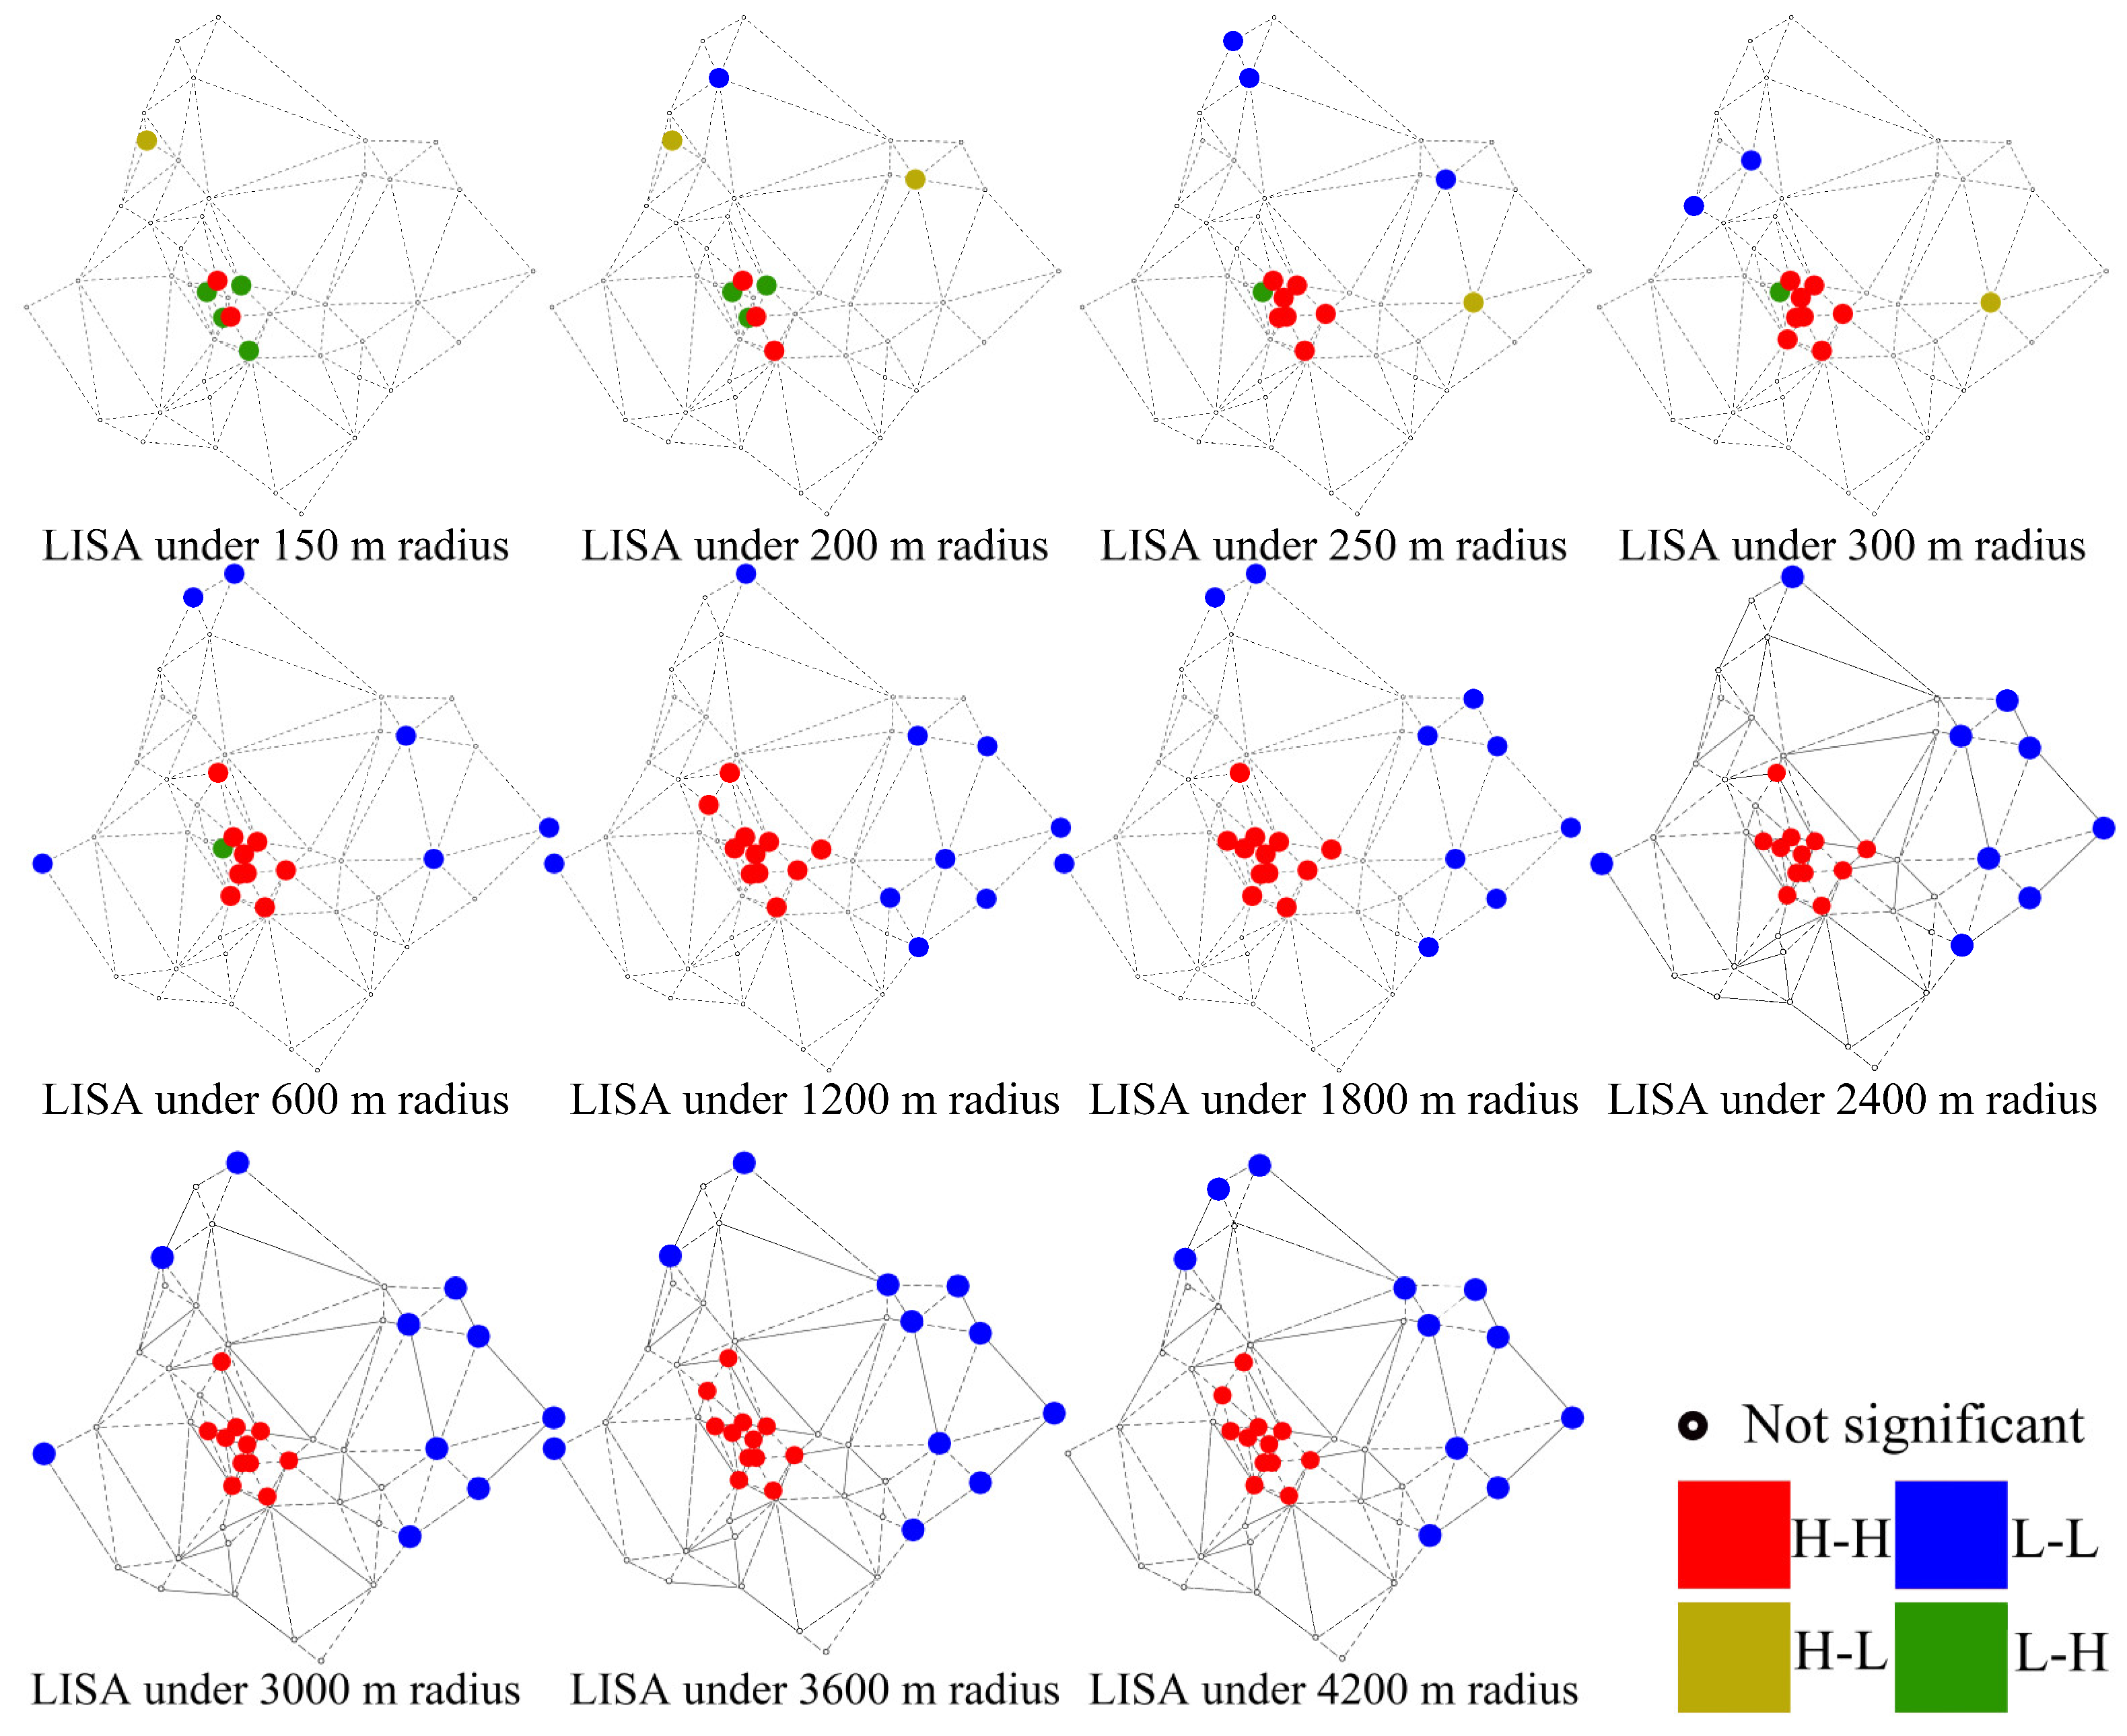
4.2. Localized Moran’s I

We adopted LISA to illustrate the spatial autocorrelation under different fire stations. Figure 10 and Figure 11 and Table 1 show the LISA results for the different sampling radii.
The increase in the number of L-L and H-H stations reflects the distribution difference between fire stations and fire records. The records are concentrated in the core area and dispersed in the periphery. As the radius increases, these H-H and L-L stations appear in the core area and edge area separately.
The L-H stations appear in the LISA at neighborhood-level collection areas and shift into H-H at larger radii. At the block scale, the L-H station does not have high FP, but at the edges of these station jurisdictions, FPs rise steeply when the radii increase. To ensure equal FP on all fire stations, the L-H stations need to develop specific firefighting behaviors to improve firefighting efficiency.
H-L denotes fire stations located in the sub-central areas, which appear at a shorter radius and become nonsignificant as the radius increases. The fire records in the sub-centers have an agglomeration effect, but globally, fires are mainly located in the city center. With the increase in the radius, the LISA gradually becomes less significant. In general, the H-L stations do not have a high level of FPs.
The FP does not change significantly as the radius increases for the H-H and L-L stations. The H-L stations lose significance as the radius increases. The L-H stations’ FP increases as the radius increases. As the collection range increases, an increasing number of fire records located at the edges of these stations are captured. In this case, these stations face a firefighting mission in a distant area. We refer to this category of fire stations as inter-regional fire stations. The relationship between the stations are shown in Figure 12.
Though these fire stations are converted from L-H to H-H at a larger radius, the significance of the strategy needs to be validated. Further empirical research is needed to determine the validity of this inter-regional firefighting behavior.

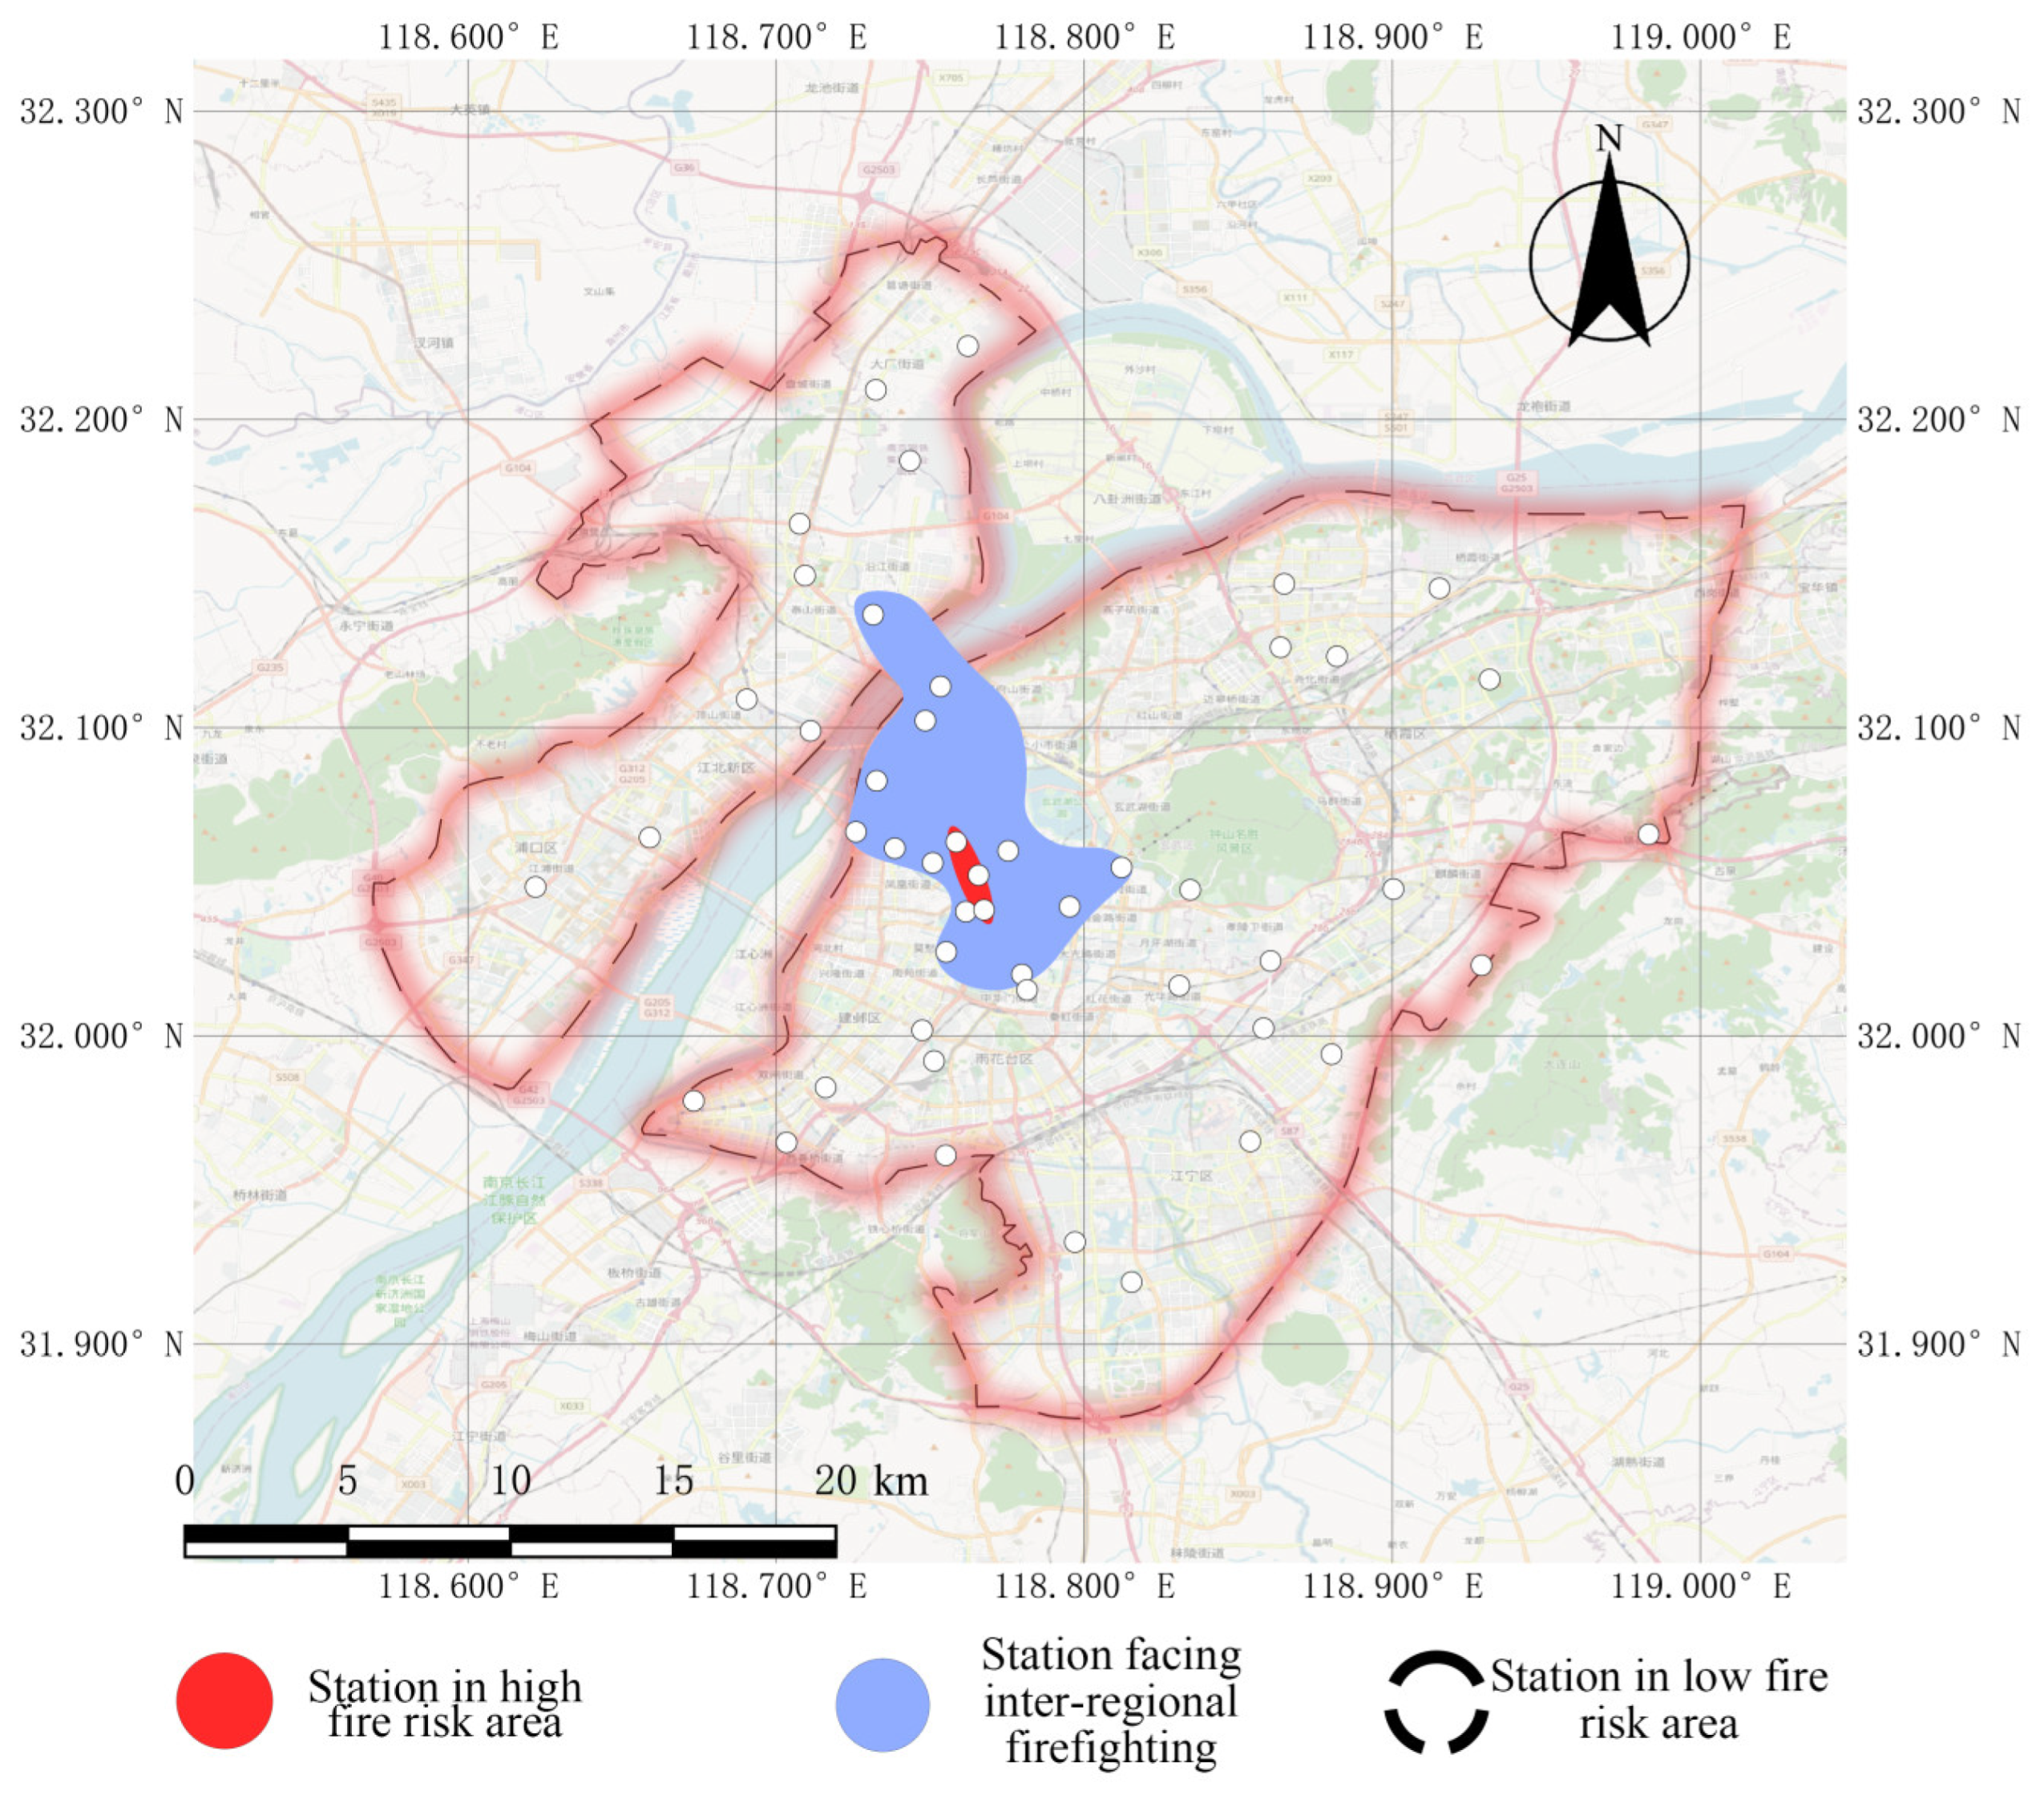
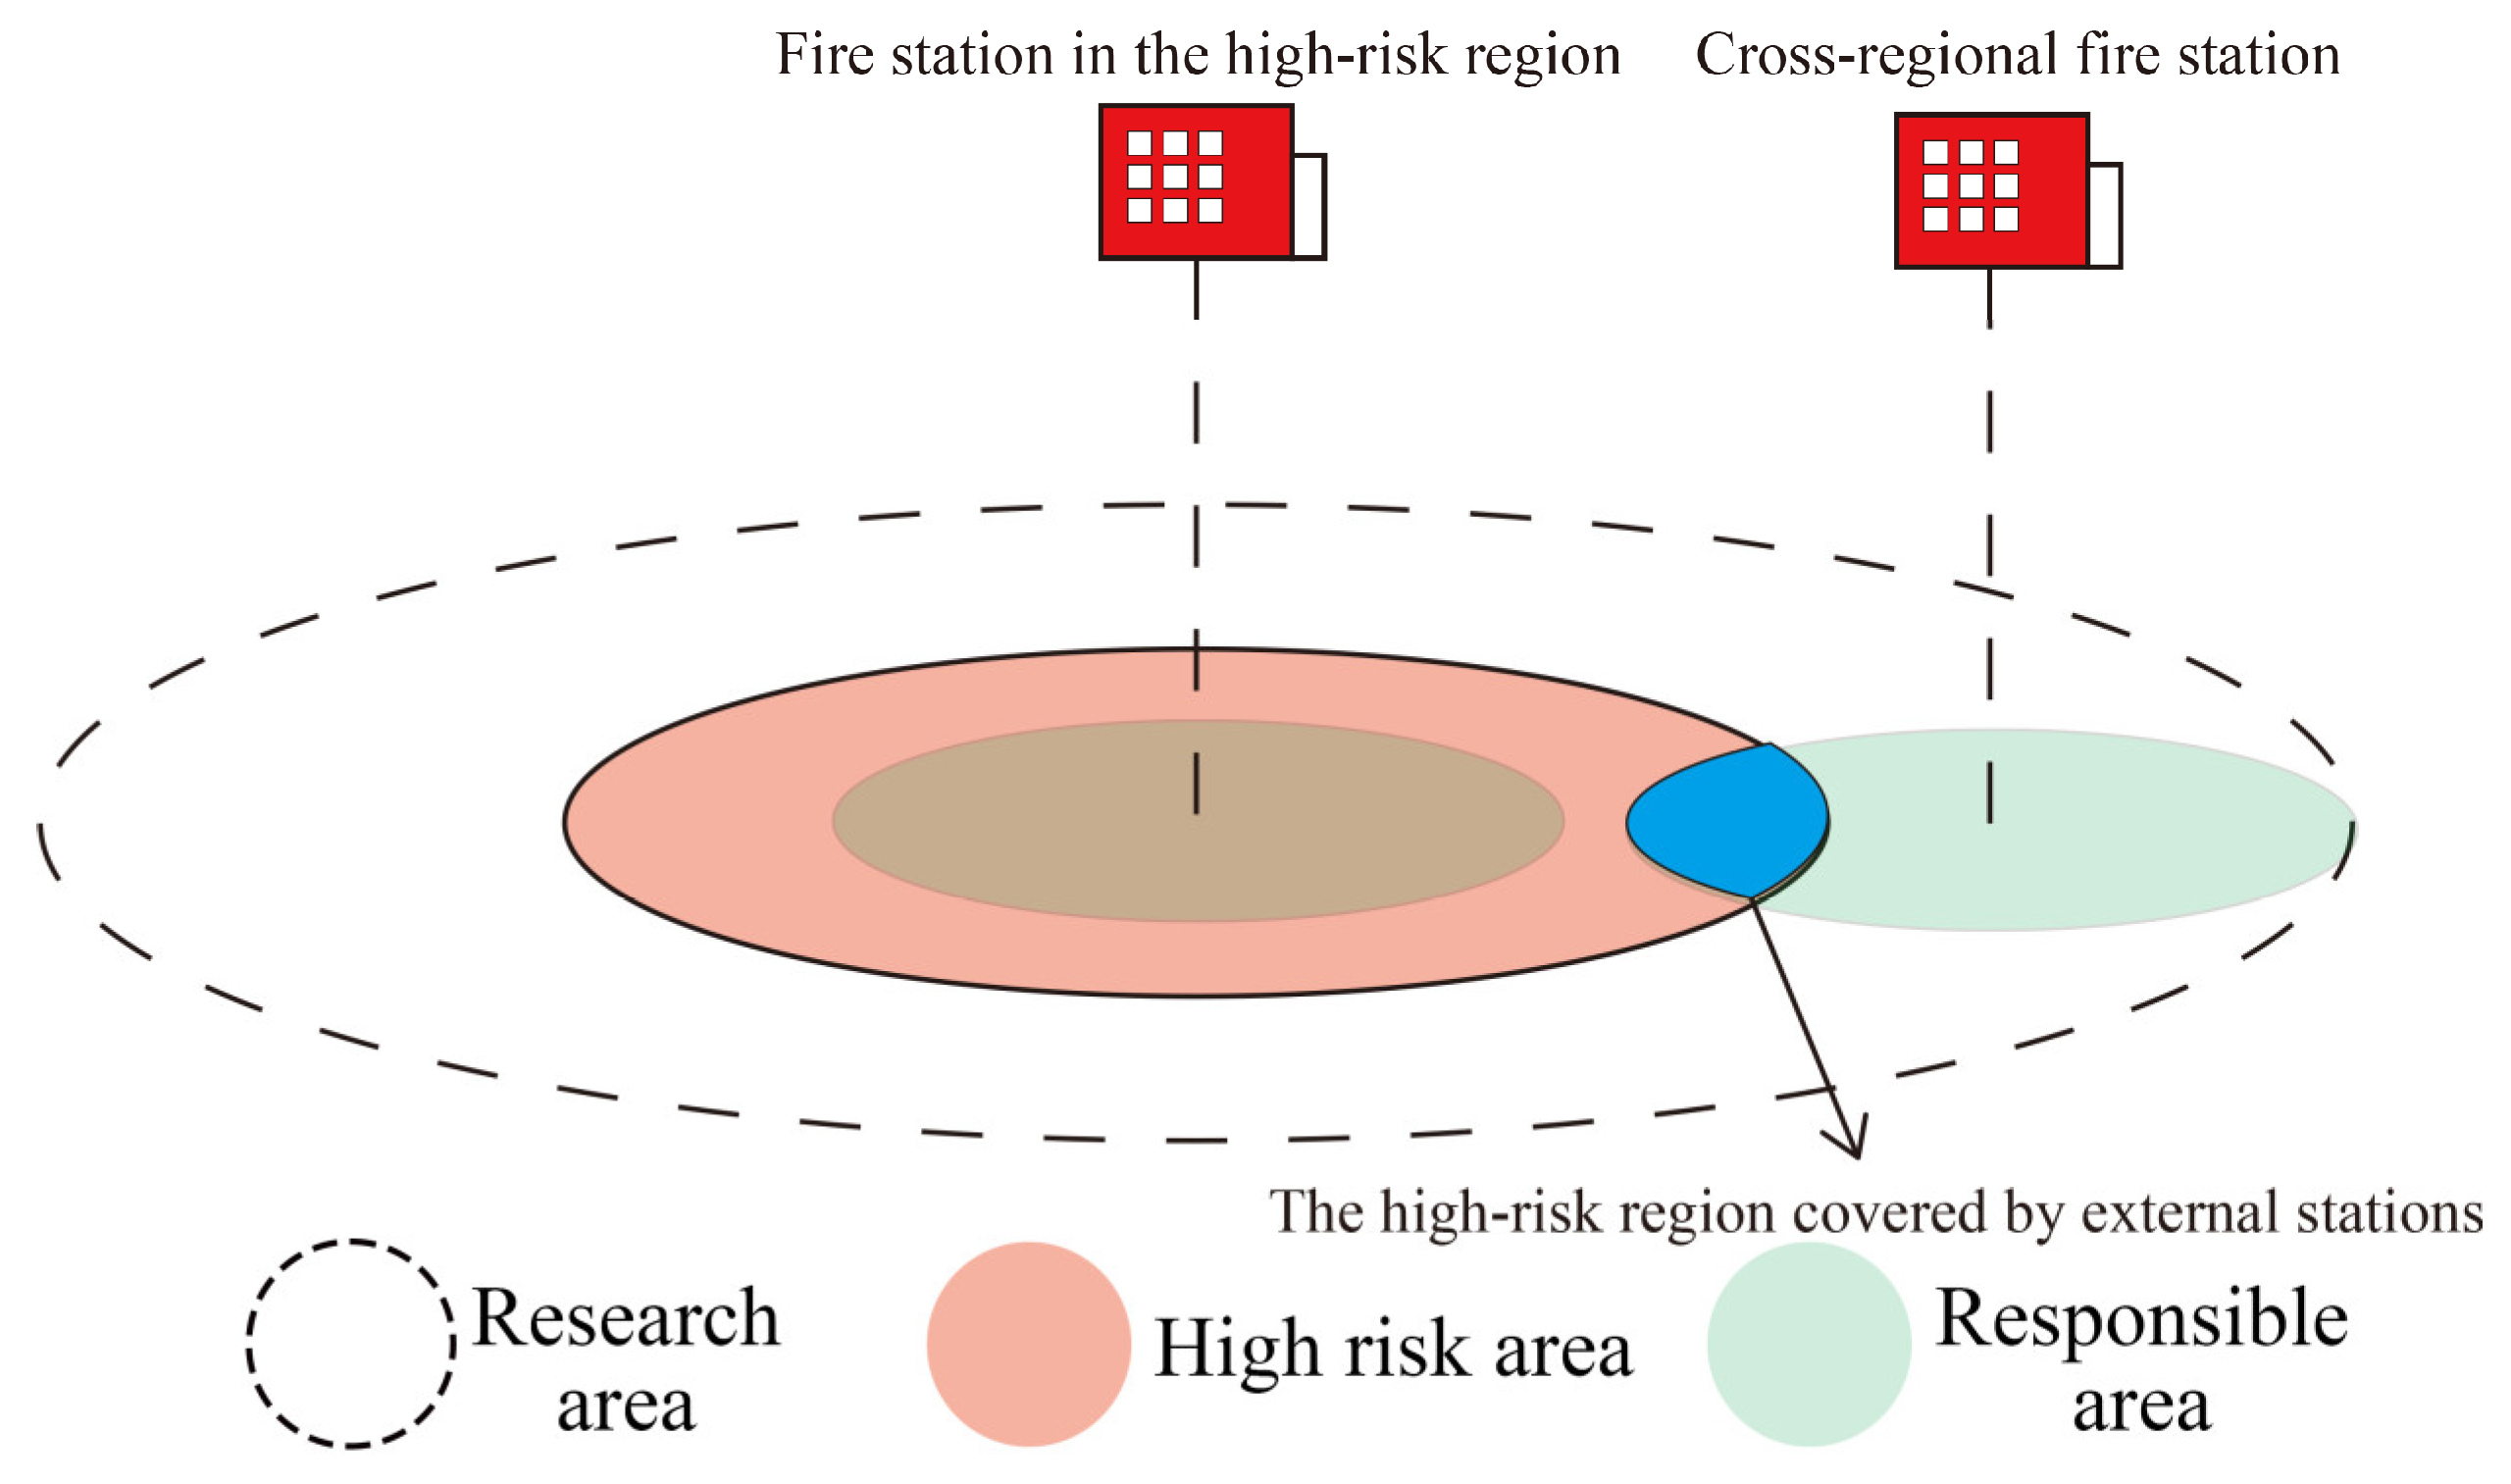
4.3. Validation of Inter-Regional Strategy Based on Moran’s I

Based on the three different buffers given in Figure 6 and Figure 11, in this section, a combined radius approach is used to present the different buffers, and Moran’s I is used to validate the inter-regional firefighting behavior. The results are shown in Table 2 and Figure 13.
The Moran’s I resulting from such a strategy is always significant. The three types of fire stations can form significant spatial autocorrelation through nearest-neighbor connections. However, with the selection of different r1 and r2 values, the strengths of spatial autocorrelation are different. For the radii selected in this paper, the spatial autocorrelation is strongest when r2 is 2400 m and r1 is 1800 m. This suggests a robust spatial autocorrelation of inter-regional fire-secure behavior.
The fire station that used a ring buffer captured fires in high-risk areas under this scale, which led to an increase in Moran’s I. The other lower values indicate that only the stations located in high-risk areas can generate spatial autocorrelation. With an appropriate selection of r1 and r2 values, the high-risk area can be finely captured in the buffer if the inter-regional stations are able to capture fire records in high-risk areas, a chain of fire stations that work together to co-protect against the high-risk areas. Thus, a very strong spatial autocorrelation effect is created between r1 and r2 over a radius of 1800–2400 m. In this case, inter-regional firefighting behavior is significant.
In the application of this strategy, buffers represent isochronous boundaries of fire stations in urban areas. The inter-regional strategy involves the different preferences of the stations in different isochronous boundaries. Table 2 shows that the inter-regional strategy is significant for any combination of r1 values of 1200 m, 1800 m, and 2400 m and r2 values of 1800 m, 2400 m, and 3000 m. This finding indicates that inter-regional stations need to focus on isochronous areas between 1 min 20 s and 2 min 40 s to better cooperate with other fire stations.
Hence, for resource allocation, these stations should focus on transport approaches that fit this time period. The high-risk stations could focus on a smaller area of the FP to improve the efficiency of fire rescue, which would provide a basis for interstation coordination.
In the promotion of the inter-regional strategy, the FPs in different cities have different spatial characteristics, which are strongly based on the socioeconomic features in urban areas. For Nanjing, we present a basic correlation check among FPs, average housing prices, and the number of sampled POI (the buffers are the same as those used for FP). The results are shown in Table 3.
With this close correlation, the adaptiveness of inter-regional strategies in different cities is clear. If these features are distributed in a very limited area (compact cities), the land in urban areas is scarce, and it is necessary to consider using this strategy. Conversely, if the city is sparsely distributed, the effect of the strategy would be lacking.

4.4. Comparison with Other Balancing Approaches

After validating the significance of inter-regional firefighting strategies, the characteristics of inter-regional firefighting strategies and micro-firefighting strategies were compared to determine the effects of the different strategies. The result is shown in Table 4.
Different firefighting strategies have increased the ability of fire stations to respond to fires. However, the performance enhancements of the strategies are different. The micro strategy has an enhancement in Moran’s I at the block level because, at a shorter radius, the boundaries that the professional station and the micro station are responsible for are similar. However, as the radius increases, the micro station’s capabilities decrease, and the professional fire station continues to provide quality firefighting services. Therefore, the enhancement is not significant in larger radii.
In contrast, the inter-regional strategy does not provide an enhancement at first. However, as the area of coverage increases, the strategy has a significant effect. Micro stations can provide fire services at the community level, but as the radius increases, these stations cannot respond to fires further away. However, while the inter-regional strategy is not significant at the community level, it becomes increasingly more effective as the radius increases. The two different strategies can be combined and used after considering their specific advantages.

5. Conclusions

This study revealed significant inter-regional fire rescue strategies at urban fire stations. The inequivalent FPs and the disadvantages in maximum coverage logic can be largely relieved under this strategy. When real planning is considered, especially when quantitative approaches are used, researchers should recognize that the likelihood of a fire occurring is not equal and develop a more detailed fire-security method for different fire stations. In Nanjing city, based on the results of Moran’s I and LISA, some stations will face more FPs, and some will be in a state with few rescue missions. Therefore, for Nanjing’s fire stations, adopting an inter-regional strategy is an ideal solution to imbalance the FP and help improve rescue efficiency.
To validate this strategy, we divided Nanjing’s fire stations into three different types and validated them via Moran’s I and LISA scale effects. Through the validation and the significant performance of these indicators, the planning logic and FPs of a fire station will be mismatched because of the potential limitations of the maximum coverage method. In the LISA results, some L-H stations appear in a block-level sampling method and disappear in a larger radius sampling area, which reveals this inequality. Moreover, the inter-regional strategy is more helpful in a larger responsible area than the micro fire station strategy. In future studies, researchers should not only consider optimizing current planning methods but also change the research perspective to find the lack of planning logic from the bottom.
Moreover, the fire records in our research included fires that significantly impact urban construction. Future researchers can use a different perspective in FP estimation (such as minor fires). Moreover, the urban climate and construction morphology will change across different development stages. Future studies can research urban fire strategies in extreme climates and morphology.
For future applications of the scale effect, researchers can focus on the interrelationships between Moran’s I and the actual space to represent spatial autocorrelation via real behaviors, which is the core of improving the scientific soundness in geographical research. Moreover, the scale effect can be widely applied in other urban research fields to identify uncovered spatial effects.

Author Contributions

Conceptualization, methodology, formal analysis, and writing—original draft preparation Jianyu Li; supervision, project administration Mingxing Hu. All authors have read and agreed to the published version of the manuscript.

Funding

This research received no external funding.

Data Availability Statement

Dataset available on request from the authors.

Conflicts of Interest

No conflicts of interest exist in the submission of this manuscript, and the manuscript has been approved by all authors for publication. I would like to declare on behalf of my co-author that the work described is original research that has not been published previously and is not under consideration for publication elsewhere, in whole or in part.

References

  1. Yao, J.; Zhang, X.; Murray, A.T. Location optimization of urban fire stations: Access and service coverage. Comput. Environ. Urban Syst. 2019, 73, 184–190. [Google Scholar] [CrossRef]
  2. Rie, D.; Ryu, J. Sustainable urban planning technique of fire disaster prevention for subway. Sustainability 2020, 12, 372. [Google Scholar] [CrossRef]
  3. Cui, S.; Wang, N.; Zhao, E.; Zhang, J.; Zhang, C. Assessing urban fire risk: An ensemble learning approach based on scenarios and cases. Int. J. Disaster Risk Reduct. 2024, 114, 104941. [Google Scholar] [CrossRef]
  4. Bai, M.; Liu, Q. Evaluating Urban fire risk based on entropy-cloud model method considering urban safety resilience. Fire 2023, 6, 62. [Google Scholar] [CrossRef]
  5. Xia, Z.; Li, H.; Chen, Y.; Yu, W. Detecting urban fire high-risk regions using colocation pattern measures. Sustain. Cities Soc. 2019, 49, 101607. [Google Scholar] [CrossRef]
  6. Murray, A.T. Optimising the spatial location of urban fire stations. Fire Saf. J. 2013, 62, 64–71. [Google Scholar] [CrossRef]
  7. Badri, M.A.; Mortagy, A.K.; Alsayed, C.A. A multi-objective model for locating fire stations. Eur. J. Oper. Res. 1998, 110, 243–260. [Google Scholar] [CrossRef]
  8. Ferreira, T.M.; Vicente, R.; da Silva, J.A.R.M.; Varum, H.; Costa, A.; Maio, R. Urban fire risk: Evaluation and emergency planning. J. Cult. Herit. 2016, 20, 739–745. [Google Scholar] [CrossRef]
  9. Svensson, S. A study of tactical patterns during fire fighting operations. Fire Saf. J. 2002, 37, 673–695. [Google Scholar] [CrossRef]
  10. Brasington, D.M.; Parent, O. Fire protection services and house prices: A regression discontinuity investigation. Reg. Sci. Urban Econ. 2024, 105, 103984. [Google Scholar] [CrossRef]
  11. Winter, G.; Fried, J.S. Homeowner perspectives on fire hazard, responsibility, and management strategies at the wildland-urban interface. Soc. Nat. Resour. 2000, 13, 33–49. [Google Scholar]
  12. Zhang, X.; Yao, J.; Sila-Nowicka, K.; Jin, Y. Urban fire dynamics and its association with urban growth: Evidence from Nanjing, China. ISPRS Int. J. Geo-Inf. 2020, 9, 218. [Google Scholar] [CrossRef]
  13. Yao, M.; Zhang, D.; Chen, Y.; Liu, Y.; Elsadek, M. Urban Fire Risk Dynamics and Mitigation Strategies in Shanghai: Integrating Spatial Analysis and Game Theory. Land 2024, 13, 1125. [Google Scholar] [CrossRef]
  14. Yu, W.; Chen, Y.; Guan, M. Hierarchical siting of macro fire station and micro fire station. Environ. Plan. B Urban Anal. City Sci. 2021, 48, 1972–1988. [Google Scholar] [CrossRef]
  15. Yu, Z.; Xu, L.; Chen, S.; Jin, C. Research on urban fire station layout planning based on a combined model method. ISPRS Int. J. Geo-Inf. 2023, 12, 135. [Google Scholar] [CrossRef]
  16. Lewis, R.H.; Jiao, J.; Seong, K.; Farahi, A.; Navrátil, P.; Casebeer, N.; Niyogi, D. Fire and smoke digital twin—A computational framework for modeling fire incident outcomes. Comput. Environ. Urban Syst. 2024, 110, 102093. [Google Scholar] [CrossRef]
  17. Corcoran, J.; Higgs, G.; Higginson, A. Fire incidence in metropolitan areas: A comparative study of Brisbane (Australia) and Cardiff (United Kingdom). Appl. Geogr. 2011, 31, 65–75. [Google Scholar] [CrossRef]
  18. Tian, F.; Lei, J.; Zheng, X.; Yin, Y. Integrating space syntax and location-allocation model for fire station location planning in a China mega city. Fire 2023, 6, 64. [Google Scholar] [CrossRef]
  19. Moran, P.A.P. Notes on continuous stochastic phenomena. Biometrika 1950, 37, 17–23. [Google Scholar] [CrossRef]
  20. Xingxing, H.E.; Junjie, R.; Caixing, B. Does Artificial Intelligence Application Promote Green Innovation in Three Major City Clusters of the Yangtze River Economic Belt? Based on the Perspectives of “Digital Dividend” and “Digital Divide”. Econ. Geogr. 2024, 44, 137–147. [Google Scholar]
  21. Fu, Q.; Zhou, M.; Li, Y.; Ye, X.; Yang, M.; Wang, Y. Flow Spatiotemporal Moran’s I: Measuring the Spatiotemporal Autocorrelation of Flow Data. Geogr. Anal. 2024, 56, 799–824. [Google Scholar] [CrossRef]
  22. Guliyev, H. Associations of (un) observed factors and gender inequality in European countries: Evidence from spatial panel data model. Appl. Geogr. 2023, 159, 103066. [Google Scholar] [CrossRef]
  23. Zhang, Y.; Zhao, J.; Mavoa, S.; Smith, M. Inequalities in urban green space distribution across priority population groups: Evidence from Tāmaki Makaurau Auckland, Aotearoa New Zealand. Cities 2024, 149, 104972. [Google Scholar] [CrossRef]
  24. Floderus, P.; Lingas, A.; Persson, M. Towards more efficient infection and fire fighting. Int. J. Found. Comput. Sci. 2013, 24, 3–14. [Google Scholar] [CrossRef]
  25. Shaikh, M.K. Application of Deep Learning: A Review for Firefighting. Int. J. Comput. Sci. Netw. Secur. 2022, 22, 73–78. [Google Scholar]
  26. Dong, X.M.; Li, Y.; Pan, Y.L.; Huang, Y.J.; Cheng, X.D. Study on urban fire station planning based on fire risk assessment and GIS technology. Procedia Eng. 2018, 211, 124–130. [Google Scholar] [CrossRef]
  27. Yoshida, H.; Omae, M. An approach for analysis of urban morphology: Methods to derive morphological properties of city blocks by using an urban landscape model and their interpretations. Comput. Environ. Urban Syst. 2005, 29, 223–247. [Google Scholar] [CrossRef]
  28. Xu, X.; Yin, C.; Wang, W.; Xv, N.; Hong, T.; Li, Q. Revealing urban morphology and outdoor comfort through genetic algorithm-driven urban block design in dry and hot regions of China. Sustainability 2019, 11, 3683. [Google Scholar] [CrossRef]
Figure 1. Fire stations and fire points in Nanjing.
Ijgi 14 00164 g001
Figure 2. Fire records in different periods.
Ijgi 14 00164 g002
Figure 3. The increment of Moran’s I. (a) Calculation process of Moran’s I in situation a. (bb) Calculation process of Moran’s I in situation b.
Ijgi 14 00164 g003
Figure 4. Meaning of LISA in different situations.
Ijgi 14 00164 g004
Figure 5. Rook neighbors of the fire station.
Ijgi 14 00164 g005
Figure 6. Buffering methods.
Ijgi 14 00164 g006
Figure 7. Different fire strategies.
Ijgi 14 00164 g007
Figure 8. Research structure.
Ijgi 14 00164 g008
Figure 9. Global Moran’s I.
Ijgi 14 00164 g009
Figure 10. LISA results.
Ijgi 14 00164 g010
Figure 11. Station strategies under LISA.
Ijgi 14 00164 g011
Figure 12. Inter-regional firefighting schematic.
Ijgi 14 00164 g012
Figure 13. Graph of validation result.
Ijgi 14 00164 g013
Table 1. Significant stations under LISA.
Significant Stations Under LISA CheckH-HH-LL-HL-L
150 m2140
200 m3231
250 m7113
300 m8112
600 m9017
1200 m11009
1800 m12009
2400 m12009
3000 m110011
3600 m120010
4200 m120011
Table 2. Results of the inter-regional strategy validation.
r2150 m200 m250 m300 m600 m1200 m1800 m2400 m3000 m3600 m4200 m
r1
150 m-----------
200 m0.071 *----------
250 m0.254 ***0.214 ***---------
300 m0.224 ***0.214 ***0.157 ***--------
600 m0.281 ***0.287 ***0.326 ***0.387 ***-------
1200 m0.270 ***0.271 ***0.281 ***0.294 ***0.393 ***------
1800 m0.299 ***0.300 ***0.305 ***0.311 ***0.355 ***0.651 ***-----
2400 m0.341 ***0.342 ***0.345 ***0.349 ***0.378 ***0.554 ***0.702 ***----
3000 m0.357 ***0.358 ***0.36 ***0.363 ***0.380 ***0.478 ***0.550 ***0.548 ***---
3600 m0.374 ***0.374 ***0.376 ***0.378 ***0.391 ***0.460 ***0.559 ***0.549 ***0.401 ***--
4200 m0.385 ***0.385 ***0.387 ***0.388 ***0.398 ***0.450 ***0.561 ***0.573 ***0.545 ***0.329 ***-
* p ≤ 0.05, *** p ≤ 0.001.
Table 3. Results of the correlation check.
RadiusAverage Housing PriceSampled POI Number
150 m0.407 ***0.549 ***
200 m0.485 ***0.590 ***
250 m0.598 ***0.746 ***
300 m0.613 ***0.747 ***
600 m0.681 ***0.819 ***
1200 m0.666 ***0.855 ***
1800 m0.715 ***0.907 ***
2400 m0.746 ***0.941 ***
3000 m0.769 ***0.961 ***
3600 m0.792 ***0.969 ***
4200 m0.814 ***0.973 ***
*** p ≤ 0.001.
Table 4. Results of the comparison between different strategy.
RadiusMoran’s IMoran’s I Under
Micro Fire Station Strategy
Moran’s I Under
Inter-Regional Firefighting
150 m0.068 *0.494 ***0.068 *
200 m0.124 **0.49 ***0.124 **
250 m0.363 ***0.518 ***0.474 ***
300 m0.425 ***0.522 ***0.64 ***
600 m0.589 ***0.602 ***0.684 ***
1200 m0.666 ***0.665 ***0.739 ***
1800 m0.739 ***0.735 ***0.785 ***
2400 m0.788 ***0.785 ***0.807 ***
3000 m0.802 ***0.801 ***0.817 ***
3600 m0.814 ***0.813 ***0.822 ***
4200 m0.826 ***0.825 ***0.833 ***
* p ≤ 0.05, ** p ≤ 0.01, *** p ≤ 0.001.
Disclaimer/Publisher’s Note: The statements, opinions and data contained in all publications are solely those of the individual author(s) and contributor(s) and not of MDPI and/or the editor(s). MDPI and/or the editor(s) disclaim responsibility for any injury to people or property resulting from any ideas, methods, instructions or products referred to in the content.

