
Integrating Machine Learning and Geospatial Data for Mapping Socioeconomic Vulnerability to Urban Natural Hazard
 , ,
, ,
Abstract
1. Introduction
2. Materials and Methods
2.1. Description of the Proposed Framework
2.2. Application of the Proposed Framework to Mapping Socio-Economic Vulnerability to Flooding in the City of Kigali
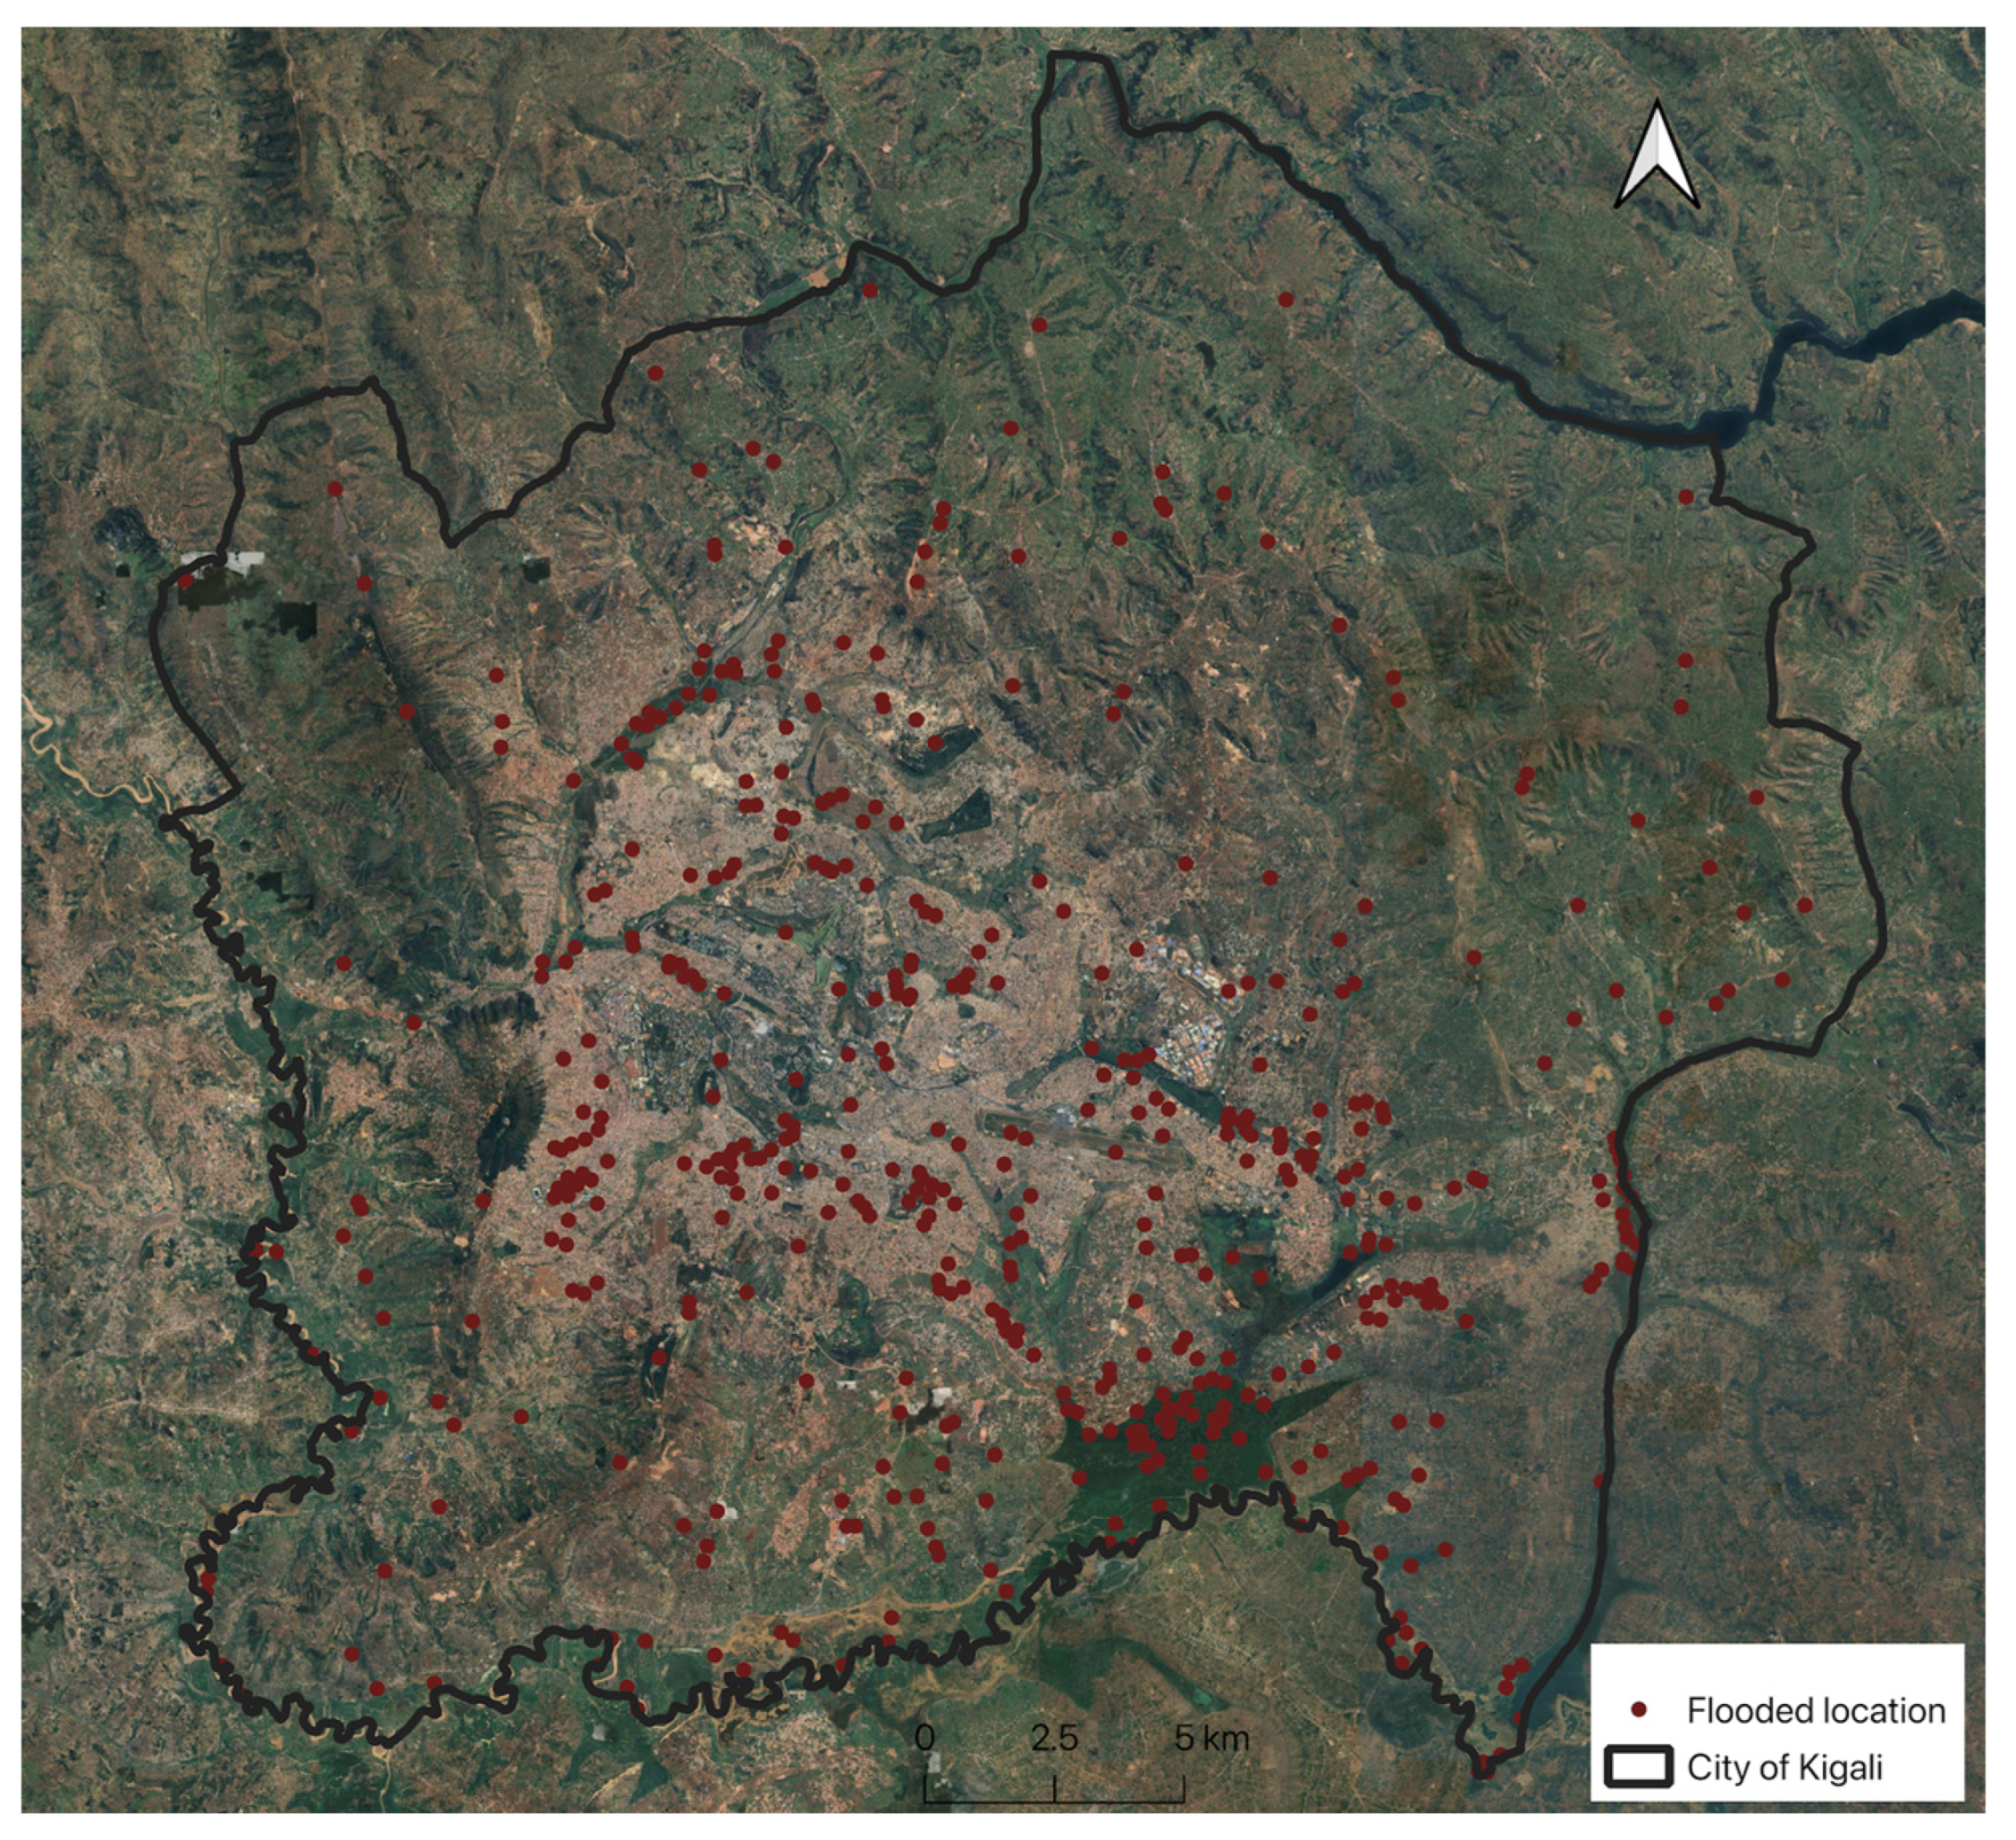
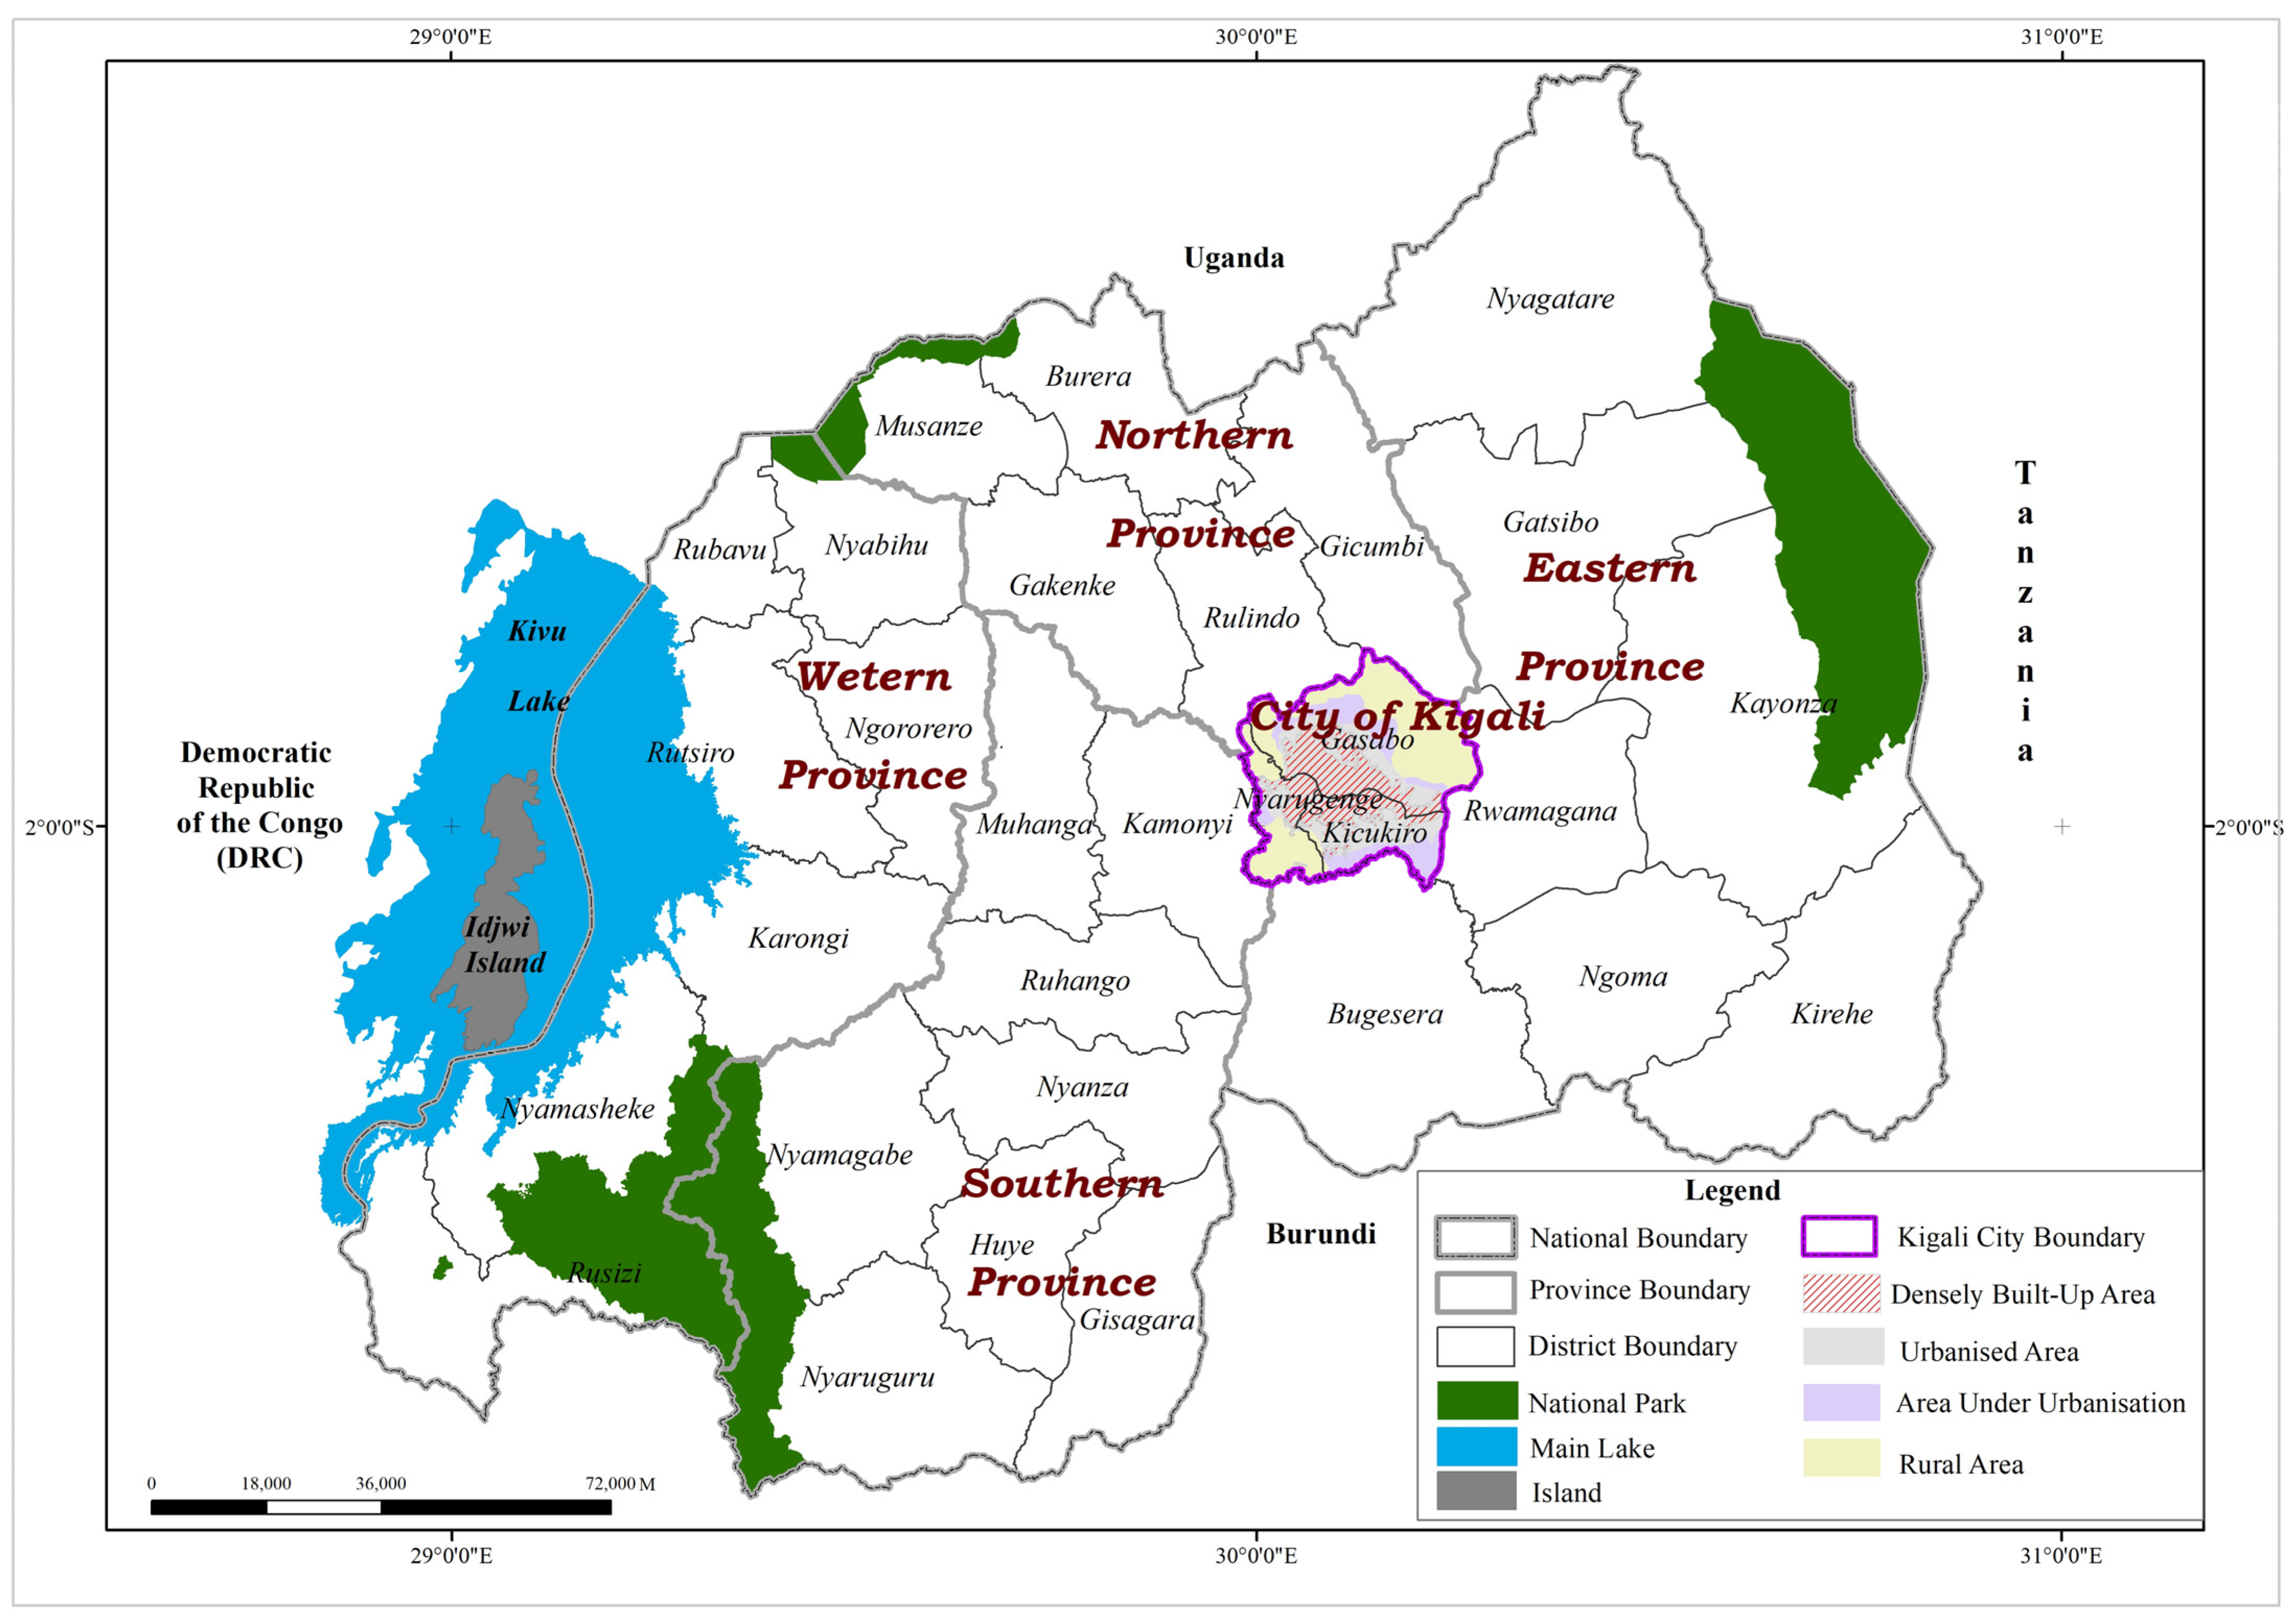
2.2.1. Description of City of Kigali
2.2.2. Overview of Data
2.2.3. Flood Susceptibility Estimation with Machine Learning Models
2.2.4. Mapping Socio-Economic Vulnerability to Flood
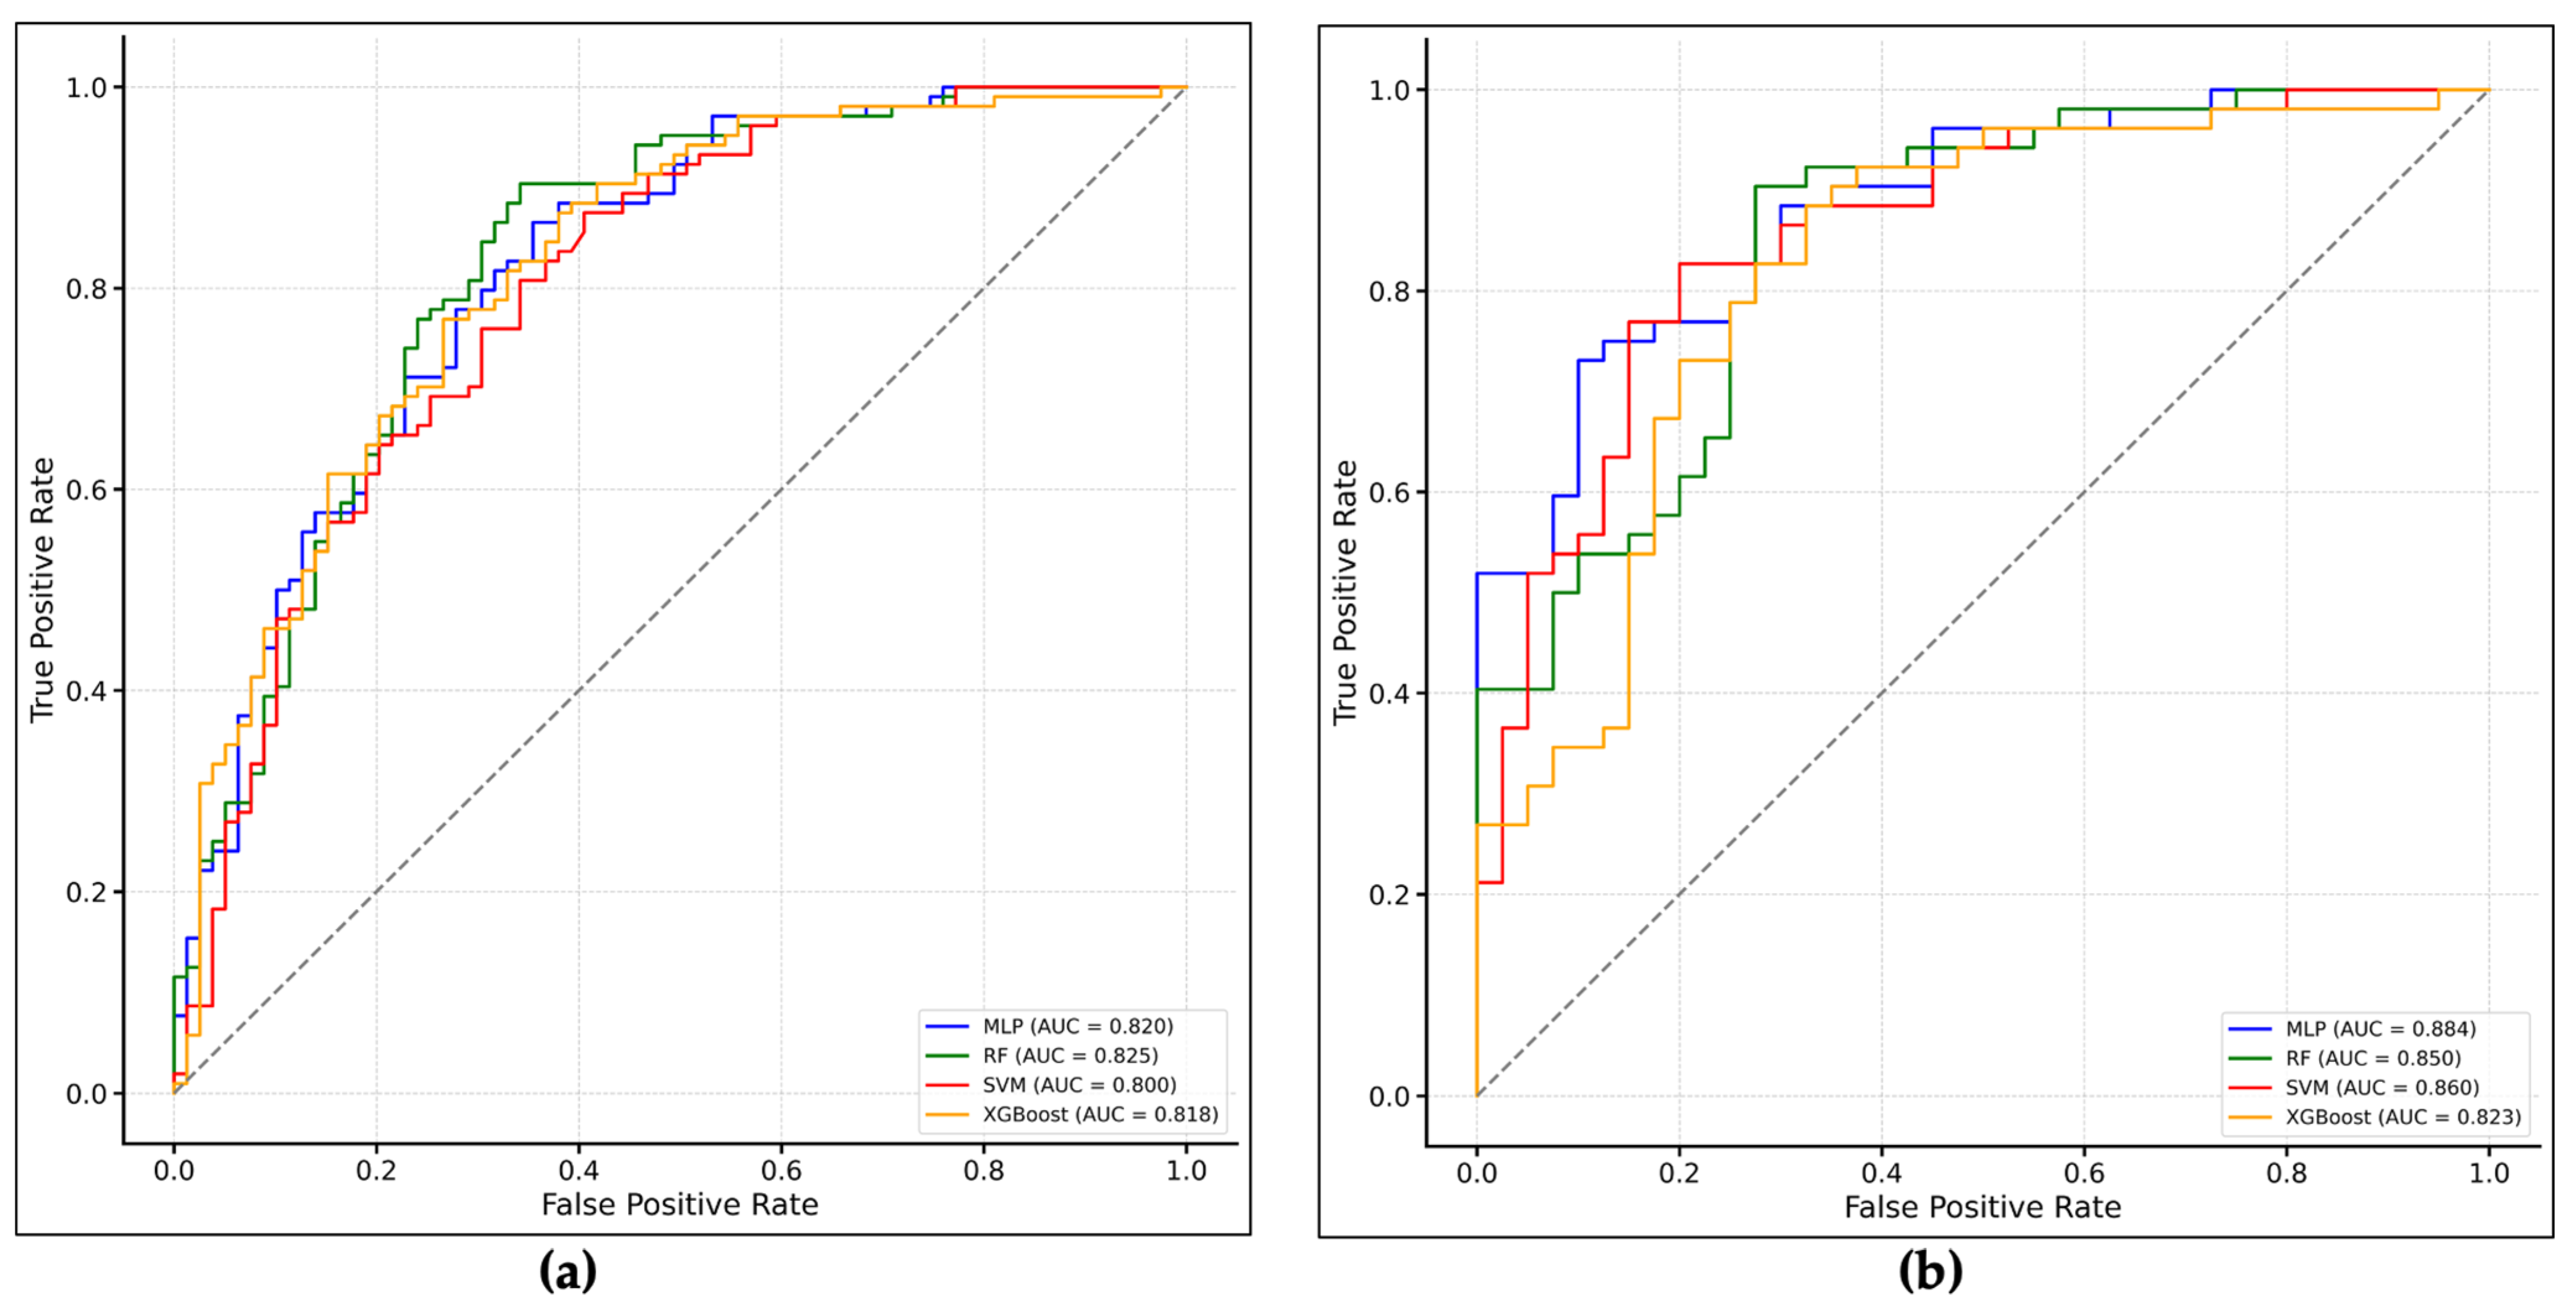
2.2.5. Validation of Flood Susceptibility and Socio-Economic Vulnerability Maps
2.3. Scalability and Transferability of the Framework
3. Results and Discussion
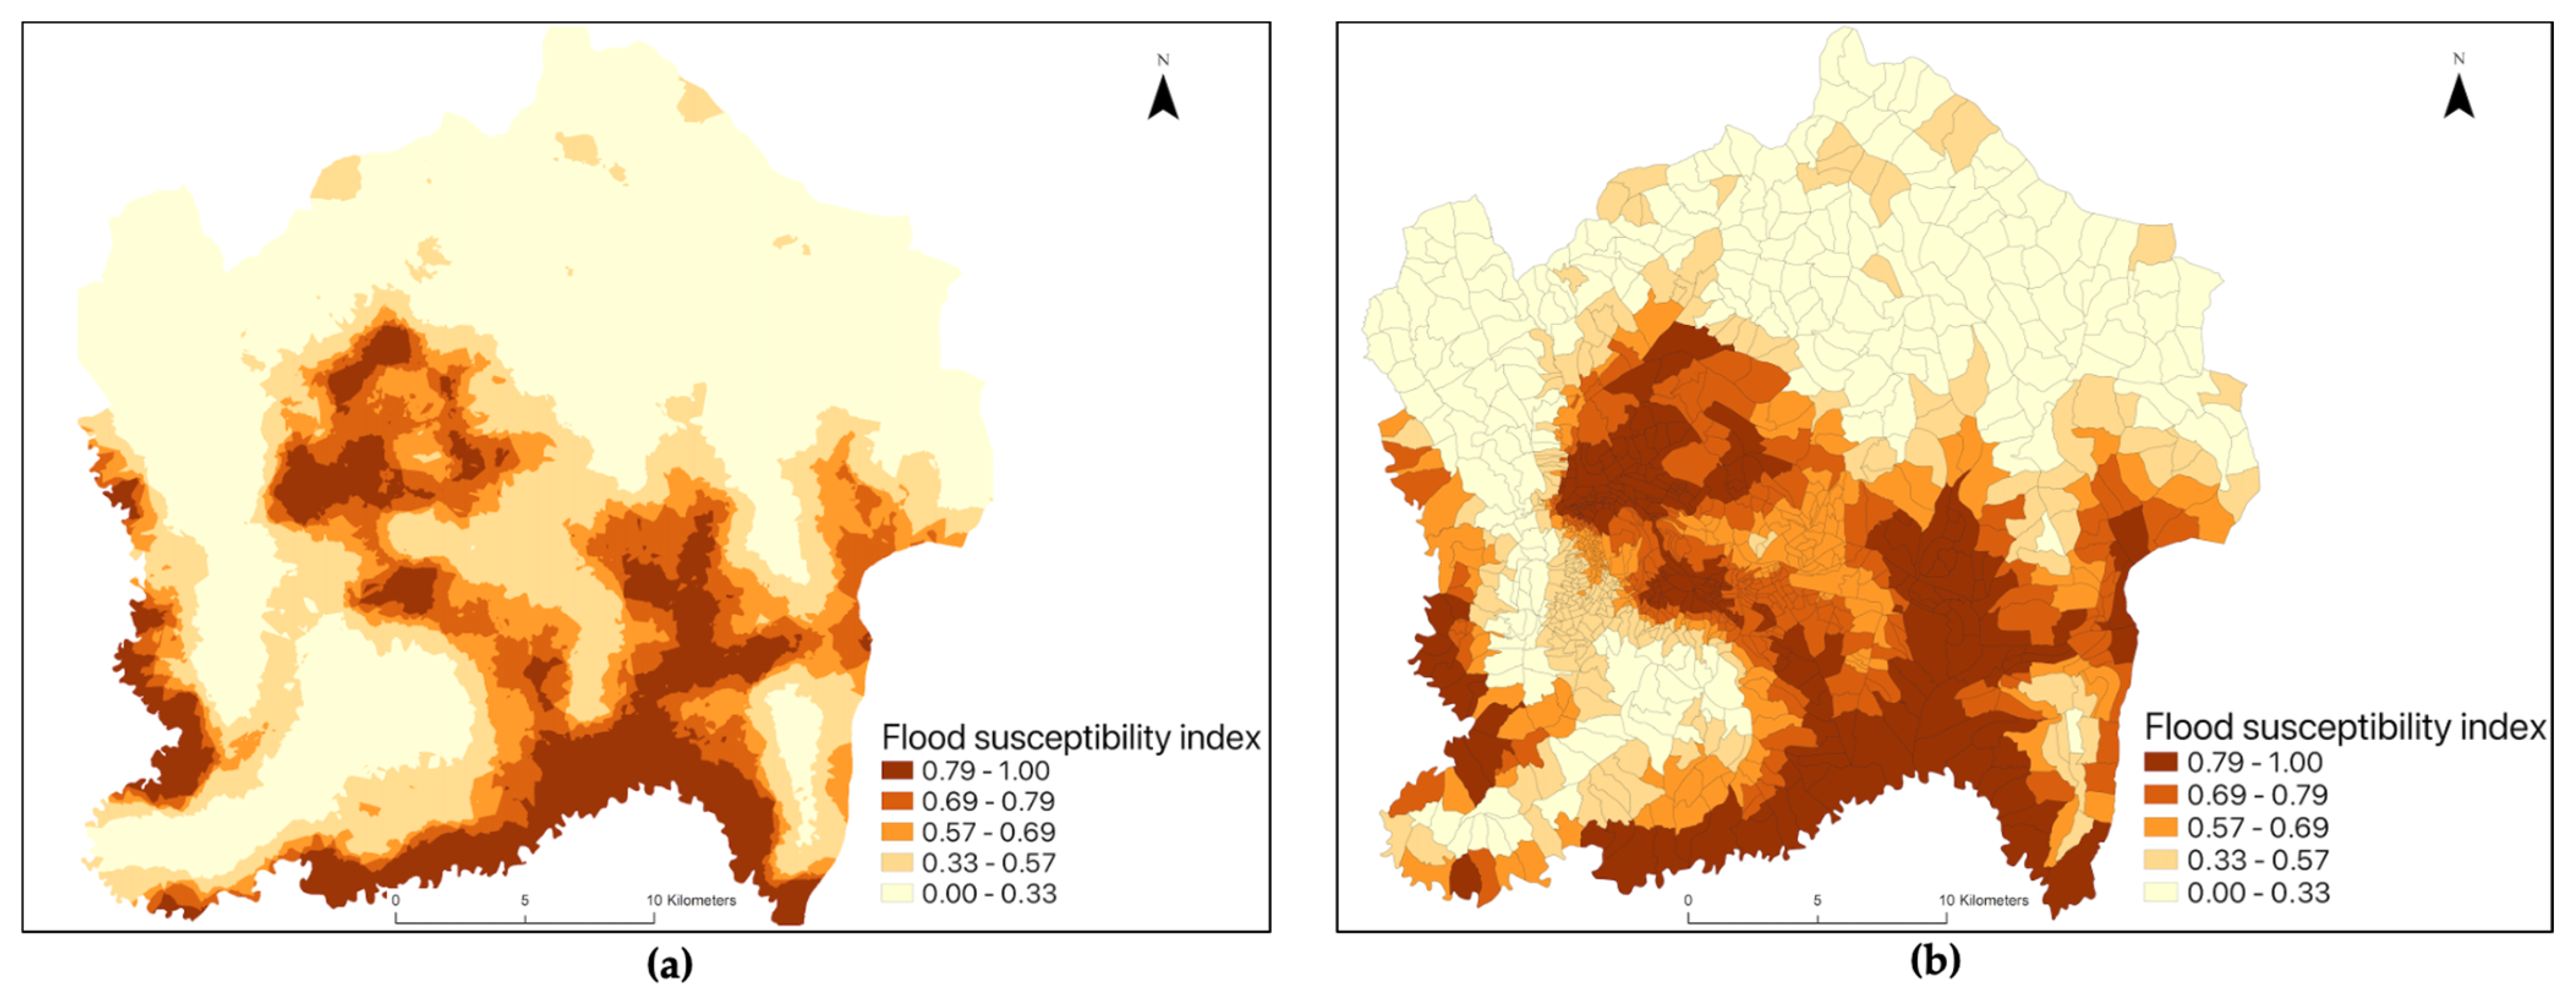
3.1. Flood Susceptibility Map
3.2. Socio-Economic Vulnerability Map
3.3. Scalability and Transferability
3.4. Limitations of the Study
4. Conclusions
Author Contributions
Funding
Data Availability Statement
Conflicts of Interest
Appendix A
Appendix B
Appendix C

References
- United Nations, World Social Report 2020: Inequality in a Rapidly Changing World. 2020. Available online: http://www.un.org/development/desa/dspd/wp-content/uploads/sites/22/2020/02/World-Social-Report2020-FullReport.pdf (accessed on 12 June 2023).
- UN-Habitat. Urbanization and Development: Emerging Futures. Nairobi. 2016. Available online: https://unhabitat.org/sites/default/files/download-manager-files/WCR-2016-WEB.pdf (accessed on 22 May 2020).
- Mahabir, R.; Crooks, A.; Croitoru, A.; Agouris, P. The study of slums as social and physical constructs: Challenges and emerging research opportunities. Reg. Stud. Reg. Sci. 2016, 3, 399–419. [Google Scholar] [CrossRef]
- Alves, B.; Angnuureng, D.B.; Morand, P.; Almar, R. A review on coastal erosion and flooding risks and best management practices in West Africa: What has been done and should be done. J. Coast. Conserv. 2020, 24, 1–22. [Google Scholar] [CrossRef]
- Wisner, B.; Blaikie, P.; Cannon, T.; Davis, I. At Risk; Routledge: London, UK, 2014. [Google Scholar] [CrossRef]
- Cutter, S.L. Vulnerability to environmental hazards. Prog. Hum. Geogr. 1996, 20, 529–539. [Google Scholar] [CrossRef]
- Prana, A.M.; Dionisio, R.; Curl, A.; Hart, D.; Gomez, C.; Apriyanto, H.; Prasetya, H. Informal adaptation to flooding in North Jakarta, Indonesia. Prog. Plann. 2024, 186, 100851. [Google Scholar] [CrossRef]
- Prana, A.M.; Curl, A.; Dionisio, M.R.; Gomez, C.; Hart, D.; Apriyanto, H.; Prasetya, H. Urban planning approaches to support community-based flood adaptation in North Jakarta Kampungs. Disaster Prev. Manag. Int. J. 2024, 33, 383–405. [Google Scholar] [CrossRef]
- Deroliya, P.; Ghosh, M.; Mohanty, M.P.; Ghosh, S.; Rao, K.H.V.D.; Karmakar, S. A novel flood risk mapping approach with machine learning considering geomorphic and socio-economic vulnerability dimensions. Sci. Total Environ. 2022, 851, 158002. [Google Scholar] [CrossRef]
- Adger, W.N. Vulnerability. Glob. Environ. Change 2006, 16, 268–281. [Google Scholar] [CrossRef]
- Berkes, F. Understanding uncertainty and reducing vulnerability: Lessons from resilience thinking. Nat. Hazards 2007, 41, 283–295. [Google Scholar] [CrossRef]
- Hagenlocher, M.; Schneiderbauer, S.; Sebesvari, Z.; Bertram, M.; Renner, K.; Renaud, F.; Wiley, H.; Zebisch, M. Climate Risk Assessment for Ecosystem-Based Adaptation A Guidebook for Planners and Practitioners. Bonn, 2018. Available online: www.giz.de (accessed on 16 February 2025).
- United Nations, Revision of World Urbanization Prospects. United Nations Department of Economic and Social Affairs. 2018. Available online: https://population.un.org/wup/assets/WUP2018-Report.pdf (accessed on 4 March 2023).
- Aroca-Jiménez, E.; Bodoque, J.M.; García, J.A. How to construct and validate an Integrated Socio-Economic Vulnerability Index: Implementation at regional scale in urban areas prone to flash flooding. Sci. Total Environ. 2020, 746, 140905. [Google Scholar] [CrossRef]
- Biswas, S.; Nautiyal, S. A review of socio-economic vulnerability: The emergence of its theoretical concepts, models and methodologies. Nat. Hazards Res. 2023, 3, 563–571. [Google Scholar] [CrossRef]
- McCallum, I.; Kyba, C.C.M.; Bayas, J.C.L.; Moltchanova, E.; Cooper, M.; Cuaresma, J.C.; Pachauri, S.; See, L.; Danylo, O.; Moorthy, I.; et al. Estimating global economic well-being with unlit settlements. Nat. Commun. 2022, 13, 2459. [Google Scholar] [CrossRef] [PubMed]
- Yeh, C.; Perez, A.; Driscoll, A.; Azzari, G.; Tang, Z.; Lobell, D.; Ermon, S.; Burke, M. Using publicly available satellite imagery and deep learning to understand economic well-being in Africa. Nat. Commun. 2020, 11, 2583. [Google Scholar] [CrossRef]
- Kuffer, M.; Thomson, D.R.; Boo, G.; Mahabir, R.; Grippa, T.; Vanhuysse, S.; Engstrom, R.; Ndugwa, R.; Makau, J.; Darin, E.; et al. The role of earth observation in an integrated deprived area mapping ‘system’ for low-to-middle income countries. Remote Sens. 2020, 12, 982. [Google Scholar] [CrossRef]
- Skinner, C. Issues and Challenges in Census Taking. Annu. Rev. Stat. Appl. 2018, 5, 49–63. [Google Scholar] [CrossRef]
- Kazemi, M.; Mohammadi, F.; Nafooti, M.H.; Behvar, K.; Kariminejad, N. Flood susceptibility mapping using machine learning and remote sensing data in the Southern Karun Basin, Iran. Appl. Geomat. 2024, 16, 731–750. [Google Scholar] [CrossRef]
- Seleem, O.; Ayzel, G.; de Souza, A.C.T.; Bronstert, A.; Heistermann, M. Towards urban flood susceptibility mapping using data-driven models in Berlin, Germany. Geomat. Nat. Hazards Risk 2022, 13, 1640–1662. [Google Scholar] [CrossRef]
- Javidan, N.; Kavian, A.; Pourghasemi, H.R.; Conoscenti, C.; Jafarian, Z.; Rodrigo-Comino, J. Evaluation of multi-hazard map produced using MaxEnt machine learning technique. Sci. Rep. 2021, 11, 6496. [Google Scholar] [CrossRef]
- Pourghasemi, H.R.; Kariminejad, N.; Amiri, M.; Edalat, M.; Zarafshar, M.; Blaschke, T.; Cerda, A. Assessing and mapping multi-hazard risk susceptibility using a machine learning technique. Sci. Rep. 2020, 10, 3203. [Google Scholar] [CrossRef]
- Sakti, A.D.; Deliar, A.; Hafidzah, D.R.; Chintia, A.V.; Anggraini, T.S.; Ihsan, K.T.N.; Virtriana, R.; Suwardhi, D.; Harto, A.B.; Nurmaulia, S.L.; et al. Machine learning based urban sprawl assessment using integrated multi-hazard and environmental-economic impact. Sci. Rep. 2024, 14, 13385. [Google Scholar] [CrossRef]
- Yousefi, S.; Pourghasemi, H.R.; Emami, S.N.; Pouyan, S.; Eskandari, S.; Tiefenbacher, J.P. A machine learning framework for multi-hazards modeling and mapping in a mountainous area. Sci. Rep. 2020, 10, 12144. [Google Scholar] [CrossRef]
- Ajtai, I.; Ștefănie, H.; Maloș, C.; Botezan, C.; Radovici, A.; Bizău-Cârstea, M.; Baciu, C. Mapping social vulnerability to floods. A comprehensive framework using a vulnerability index approach and PCA analysis. Ecol. Indic. 2023, 154, 110838. [Google Scholar] [CrossRef]
- Alabbad, Y.; Demir, I. Comprehensive flood vulnerability analysis in urban communities: Iowa case study. Int. J. Disaster Risk Reduct. 2022, 74, 102955. [Google Scholar] [CrossRef]
- Sun, Y.; Li, Y.; Ma, R.; Gao, C.; Wu, Y. Mapping urban socio-economic vulnerability related to heat risk: A grid-based assessment framework by combing the geospatial big data. Urban Clim. 2022, 43, 101169. [Google Scholar] [CrossRef]
- Zhang, T.; Wang, D.; Lu, Y. Machine learning-enabled regional multi-hazards risk assessment considering social vulnerability. Sci. Rep. 2023, 13, 13405. [Google Scholar] [CrossRef]
- Brower, A.E.; Ramesh, B.; Islam, K.A.; Mortveit, H.S.; Hoops, S.; Vullikanti, A.; Marathe, M.V.; Zaitchik, B.; Gohlke, J.M.; Swarup, S. Augmenting the Social Vulnerability Index using an agent-based simulation of Hurricane Harvey. Comput. Environ. Urban Syst. 2023, 105, 102020. [Google Scholar] [CrossRef]
- Davino, C.; Gherghi, M.; Sorana, S.; Vistocco, D. Measuring Social Vulnerability in an Urban Space Through Multivariate Methods and Models. Soc. Indic. Res. 2021, 157, 1179–1201. [Google Scholar] [CrossRef]
- Hadipour, V.; Vafaie, F.; Kerle, N. An indicator-based approach to assess social vulnerability of coastal areas to sea-level rise and flooding: A case study of Bandar Abbas city, Iran. Ocean Coast. Manag. 2020, 188, 105077. [Google Scholar] [CrossRef]
- Streifeneder, V.; Kienberger, S.; Reichel, S.; Hölbling, D. Socio-Economic Vulnerability Assessment for Supporting a Sustainable Pandemic Management in Austria. Sustainability 2023, 16, 78. [Google Scholar] [CrossRef]
- Zhu, K.; Wang, Z.; Lai, C.; Li, S.; Zeng, Z.; Chen, X. Evaluating Factors Affecting Flood Susceptibility in the Yangtze River Delta Using Machine Learning Methods. Int. J. Disaster Risk Sci. 2024, 15, 738–753. [Google Scholar] [CrossRef]
- Al-Kindi, K.M.; Alabri, Z. Investigating the Role of the Key Conditioning Factors in Flood Susceptibility Mapping Through Machine Learning Approaches. Earth Syst. Environ. 2024, 8, 63–81. [Google Scholar] [CrossRef]
- Khosravi, K.; Pham, B.T.; Chapi, K.; Shirzadi, A.; Shahabi, H.; Revhaug, I.; Prakash, I.; Bui, D.T. A comparative assessment of decision trees algorithms for flash flood susceptibility modeling at Haraz watershed, northern Iran. Sci. Total Environ. 2018, 627, 744–755. [Google Scholar] [CrossRef] [PubMed]
- Terna, I.P. Vulnerability: Types, Causes, and Coping Mechanisms. Int. J. Sci. Manag. Stud. (IJSMS) 2021, 4, 187–194. [Google Scholar] [CrossRef]
- Chakraborty, L.; Rus, H.; Henstra, D.; Thistlethwaite, J.; Scott, D. A place-based socioeconomic status index: Measuring social vulnerability to flood hazards in the context of environmental justice. Int. J. Disaster Risk Reduct. 2020, 43, 101394. [Google Scholar] [CrossRef]
- NISR. Fifth Rwanda Population and Housing Census, 2022; National Institute of Statistics of Rwanda, Ministry of Finance and Economic Planning: Ministry of Health; The DHS Program, ICF International: Kigali, Rwanda, 2022. Available online: https://www.statistics.gov.rw/publication/main_indicators_2022 (accessed on 2 December 2024).
- City of Kigali. Zoning Regulations: Kigali Master Plan 2050; City of Kigali: Kigali City, Rwanda, 2019.
- Baffoe, G.; Malonza, J.; Manirakiza, V.; Mugabe, L. Understanding the concept of neighbourhood in Kigali City, Rwanda. Sustainability 2020, 12, 1555. [Google Scholar] [CrossRef]
- Hafner, S.; Georganos, S.; Mugiraneza, T.; Ban, Y. Mapping Urban Population Growth from Sentinel-2 MSI and Census Data Using Deep Learning: A Case Study in Kigali, Rwanda. Available online: http://arxiv.org/abs/2303.08511 (accessed on 2 August 2023).
- Nikuze, A.; Sliuzas, R.; Flacke, J. Towards Equitable Urban Residential Resettlement in Kigali, Rwanda. In GIS in Sustainable Urban Planning and Management; CRC Press: Boca Raton, FL, USA, 2018; pp. 325–344. [Google Scholar] [CrossRef]
- Uwizeye, D.; Irambeshya, A.; Wiehler, S.; Niragire, F. Poverty profile and efforts to access basic household needs in an emerging city: A mixed-method study in Kigali’s informal urban settlements, Rwanda. Cities Health 2022, 6, 98–112. [Google Scholar] [CrossRef]
- Dufitimana, E.; Gahungu, P.; Uwayezu, E.; Mugisha, E.; Poorthuis, A.; Bizimana, J.P. Measuring urban socio-economic disparities in the global south from space using convolutional neural network: The case of the City of Kigali, Rwanda. GeoJournal 2024, 89, 107. [Google Scholar] [CrossRef]
- Nduwayezu, G.; Ingabire, E.; Bizimana, J.P. Measuring disparities in access to district and referral hospitals in the city of Kigali, Rwanda. Rwanda J. Eng. Sci. Technol. Environ. 2023, 5, 2617-2321. [Google Scholar] [CrossRef]
- Manirakiza, V.; Mugabe, L.; Nsabimana, A.; Nzayirambaho, M. City Profile: Kigali, Rwanda. Environ. Urban. ASIA 2019, 10, 290–307. [Google Scholar] [CrossRef]
- Naeem, A.; Zaheer, Z.; Tabassum, S.; Nazir, A.; Naeem, F. Diseases caused by floods with a spotlight on the present situation of unprecedented floods in Pakistan: A short communication. Ann. Med. Surg. 2023, 85, 3209–3212. [Google Scholar] [CrossRef]
- Haque, A.N. Climate risk responses and the urban poor in the global South: The case of Dhaka’s flood risk in the low-income settlements. Int. J. Disaster Risk Reduct. 2021, 64, 102534. [Google Scholar] [CrossRef]
- Liu, Q.; Yuan, J.; Yan, W.; Liang, W.; Liu, M.; Liu, J. Association of natural flood disasters with infectious diseases in 168 countries and territories from 1990 to 2019: A worldwide observational study. Glob. Transit. 2023, 5, 149–159. [Google Scholar] [CrossRef]
- Paterson, D.L.; Wright, H.; Harris, P.N.A. Health Risks of Flood Disasters. Clin. Infect. Dis. 2018, 67, 1450–1454. [Google Scholar] [CrossRef] [PubMed]
- Nagendra, H.; Bai, X.; Brondizio, E.S.; Lwasa, S. The urban south and the predicament of global sustainability. Nat. Sustain. 2018, 1, 341–349. [Google Scholar] [CrossRef]
- Singh, G.; Kishan; Rawat, S. Mapping flooded areas utilizing Google Earth Engine and open SAR data: A comprehensive approach for disaster response. Discov. Geosci. 2024, 2, 1–12. [Google Scholar] [CrossRef]
- Rahman, M.R.; Thakur, P.K. Detecting, mapping and analysing of flood water propagation using synthetic aperture radar (SAR) satellite data and GIS: A case study from the Kendrapara District of Orissa State of India. Egypt. J. Remote Sens. Space Sci. 2018, 21, S37–S41. [Google Scholar] [CrossRef]
- Dhanabalan, S.P.; Rahaman, S.A.; Jegankumar, R. Flood monitoring using Sentinel-1 SAR data: A case study based on an event of 2018 and 2019 Southern part of Kerala. In Proceedings of the International Archives of the Photogrammetry, Remote Sensing and Spatial Information Sciences, Volume XLIV-M-3-2021 ASPRS 2021 Annual Conference, Virtual, 29 March–2 April 2021. [Google Scholar] [CrossRef]
- Kalisch, H.; Lagona, F.; Roeber, V. Sudden wave flooding on steep rock shores: A clear but hidden danger. Nat. Hazards 2024, 120, 3105–3125. [Google Scholar] [CrossRef]
- Dodangeh, E.; Panahi, M.; Rezaie, F.; Lee, S.; Bui, D.T.; Lee, C.W.; Pradhan, B. Novel hybrid intelligence models for flood-susceptibility prediction: Meta optimization of the GMDH and SVR models with the genetic algorithm and harmony search. J. Hydrol. 2020, 590, 125423. [Google Scholar] [CrossRef]
- Liu, J.; Wang, J.; Xiong, J.; Cheng, W.; Sun, H.; Yong, Z.; Wang, N. Hybrid Models Incorporating Bivariate Statistics and Machine Learning Methods for Flash Flood Susceptibility Assessment Based on Remote Sensing Datasets. Remote Sens. 2021, 13, 4945. [Google Scholar] [CrossRef]
- Siahkamari, S.; Haghizadeh, A.; Zeinivand, H.; Tahmasebipour, N.; Rahmati, O. Spatial prediction of flood-susceptible areas using frequency ratio and maximum entropy models. Geocarto Int. 2018, 33, 927–941. [Google Scholar] [CrossRef]
- Lee, S.; Rezaie, F. Data used for GIS-based Flood Susceptibility Mapping. GEO Data 2022, 4, 1–15. [Google Scholar] [CrossRef]
- Darabi, H.; Choubin, B.; Rahmati, O.; Haghighi, A.T.; Pradhan, B.; Kløve, B. Urban flood risk mapping using the GARP and QUEST models: A comparative study of machine learning techniques. J. Hydrol. 2019, 569, 142–154. [Google Scholar] [CrossRef]
- Yariyan, P.; Avand, M.; Abbaspour, R.A.; Haghighi, A.T.; Costache, R.; Ghorbanzadeh, O.; Janizadeh, S.; Blaschke, T. Flood susceptibility mapping using an improved analytic network process with statistical models. Geomat. Nat. Hazards Risk 2020, 11, 2282–2314. [Google Scholar] [CrossRef]
- Li, Y.; Osei, F.B.; Hu, T.; Stein, A. Urban flood susceptibility mapping based on social media data in Chengdu city, China. Sustain. Cities Soc. 2023, 88, 104307. [Google Scholar] [CrossRef]
- Pham, Q.B.; Pal, S.C.; Saha, A.; Chowdhuri, I.; Albanai, J.A.; Janizadeh, S.; Ahmadi, K.; Khedher, K.M.; Anh, D.T.; Duan, W. Current and future projections of flood risk dynamics under seasonal precipitation regimes in the Hyrcanian Forest region. Geocarto Int. 2022, 37, 9047–9070. [Google Scholar] [CrossRef]
- Breinl, K.; Lun, D.; Müller-Thomy, H.; Blöschl, G. Understanding the relationship between rainfall and flood probabilities through combined intensity-duration-frequency analysis. J. Hydrol. 2021, 602, 126759. [Google Scholar] [CrossRef]
- Government of Rwanda. Law n°48/2018 of 13/08/2018 on Environment; Government of Rwanda. 2018. Available online: https://rema.gov.rw/fileadmin/templates/Documents/Law_on_environment.pdf (accessed on 2 December 2024).
- Izonin, I.; Tkachenko, R.; Shakhovska, N.; Ilchyshyn, B.; Singh, K.K. A Two-Step Data Normalization Approach for Improving Classification Accuracy in the Medical Diagnosis Domain. Mathematics 2022, 10, 1942. [Google Scholar] [CrossRef]
- Chen, Y.; Zhang, X.; Yang, K.; Zeng, S.; Hong, A. Modeling rules of regional flash flood susceptibility prediction using different machine learning models. Front. Earth Sci. 2023, 11, 1117004. [Google Scholar] [CrossRef]
- El-Magd, S.A.; Soliman, G.; Morsy, M.; Kharbish, S. Environmental hazard assessment and monitoring for air pollution using machine learning and remote sensing. Int. J. Environ. Sci. Technol. 2023, 20, 6103–6116. [Google Scholar] [CrossRef]
- Henry, D.; Gorman-Smith, D.; Schoeny, M.; Tolan, P. ‘Neighborhood Matters’: Assessment of Neighborhood Social Processes. Am. J. Community Psychol. 2014, 54, 187–204. [Google Scholar] [CrossRef]
- Warembourg, C.; Nieuwenhuijsen, M.; Ballester, F.; De Castro, M.; Chatzi, L.; Esplugues, A.; Heude, B.; Maitre, L.; McEachan, R.; Robinson, O.; et al. Urban environment during early-life and blood pressure in young children. Environ. Int. 2021, 146, 106174. [Google Scholar] [CrossRef]
- Jiang, T.-B.; Deng, Z.-W.; Zhi, Y.-P.; Cheng, H.; Gao, Q. The Effect of Urbanization on Population Health: Evidence From China. Front. Public Health 2021, 9, 706982. [Google Scholar] [CrossRef]
- Yap, W.; Biljecki, F. A Global Feature-Rich Network Dataset of Cities and Dashboard for Comprehensive Urban Analyses. Sci. Data 2023, 10, 667. [Google Scholar] [CrossRef] [PubMed]
- Ndayishimiye, P.; Uwase, R.; Kubwimana, I.; Niyonzima JD, L.C.; Dzekem Dine, R.; Nyandwi, J.B.; Ntokamunda Kadima, J. Availability, accessibility, and quality of adolescent Sexual and Reproductive Health (SRH) services in urban health facilities of Rwanda: A survey among social and healthcare providers. BMC Health Serv. Res. 2020, 20, 697. [Google Scholar] [CrossRef] [PubMed]
- Jimoh, M.; Bikam, P.; Chikoore, H. The Influence of Socioeconomic Factors on Households’ Vulnerability to Climate Change in Semiarid Towns of Mopani, South Africa. Climate 2021, 9, 13. [Google Scholar] [CrossRef]
- Galderisi, A.; Limongi, G. A Comprehensive Assessment of Exposure and Vulnerabilities in Multi-Hazard Urban Environments: A Key Tool for Risk-Informed Planning Strategies. Sustainability 2021, 13, 9055. [Google Scholar] [CrossRef]
- Ganter, M.; Toetzke, M.; Feuerriegel, S. Mining Points-of-Interest Data to Predict Urban Inequality: Evidence from Germany and France. 2022. Available online: www.pricehubble.com (accessed on 24 January 2024).
- Shrestha, N. Factor Analysis as a Tool for Survey Analysis. Am. J. Appl. Math. Stat. 2021, 9, 4–11. [Google Scholar] [CrossRef]
- Gulum, M.A.; Trombley, C.M.; Kantardzic, M. A Review of Explainable Deep Learning Cancer Detection Models in Medical Imaging. Appl. Sci. 2021, 11, 4573. [Google Scholar] [CrossRef]
- Hall, O.; Ohlsson, M.; Rögnvaldsson, T. A review of explainable AI in the satellite data, deep machine learning, and human poverty domain. Patterns 2022, 3, 100600. [Google Scholar] [CrossRef]
- Fazeli, D.; Zeynab, S.; Khatami, S.M.; Ranjbar, E. The Associations Between Urban Form and Major Non-communicable Diseases: A Systematic Review. J. Urban Health 2022, 99, 941–958. [Google Scholar] [CrossRef]
- Persello, C.; Kuffer, M. Towards Uncovering Socio-Economic Inequalities Using VHR Satellite Images and Deep Learning. In IGARSS 2020—2020 IEEE International Geoscience and Remote Sensing Symposium; IEEE: Piscataway Township, NJ, USA, 2020; pp. 3747–3750. [Google Scholar] [CrossRef]


| Flood-Influencing Factor | Description | Data Source |
|---|---|---|
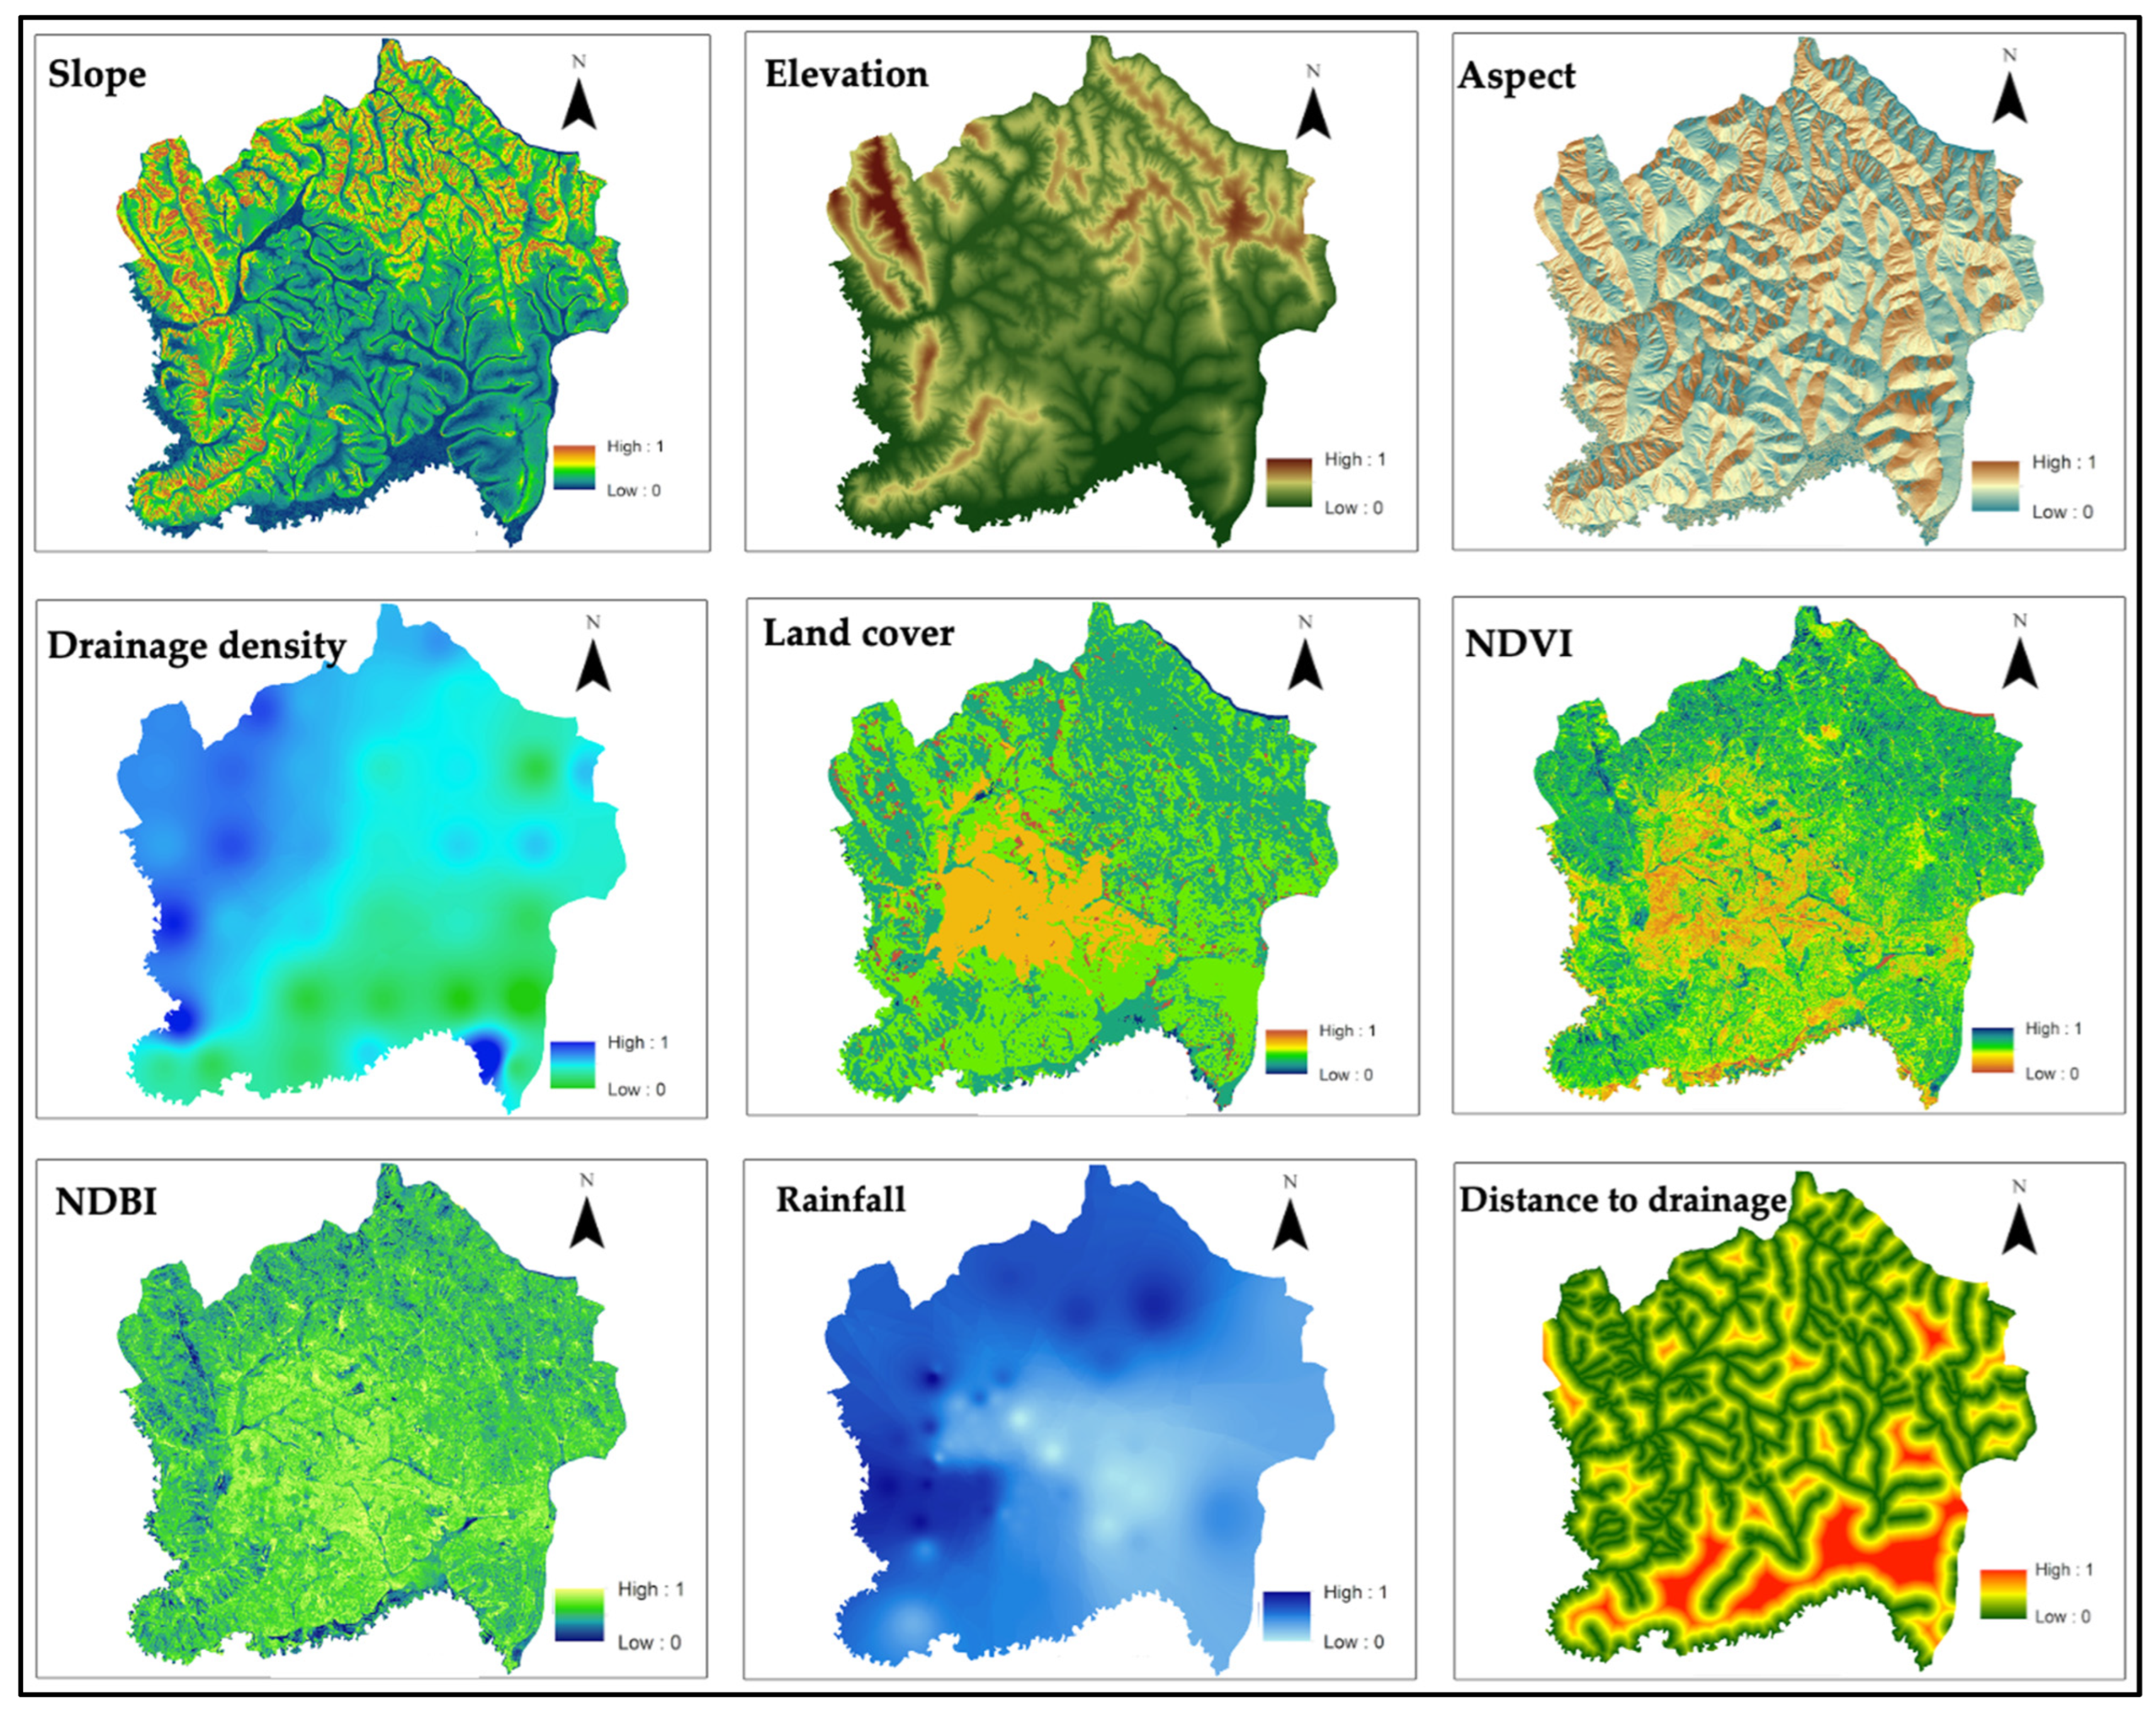
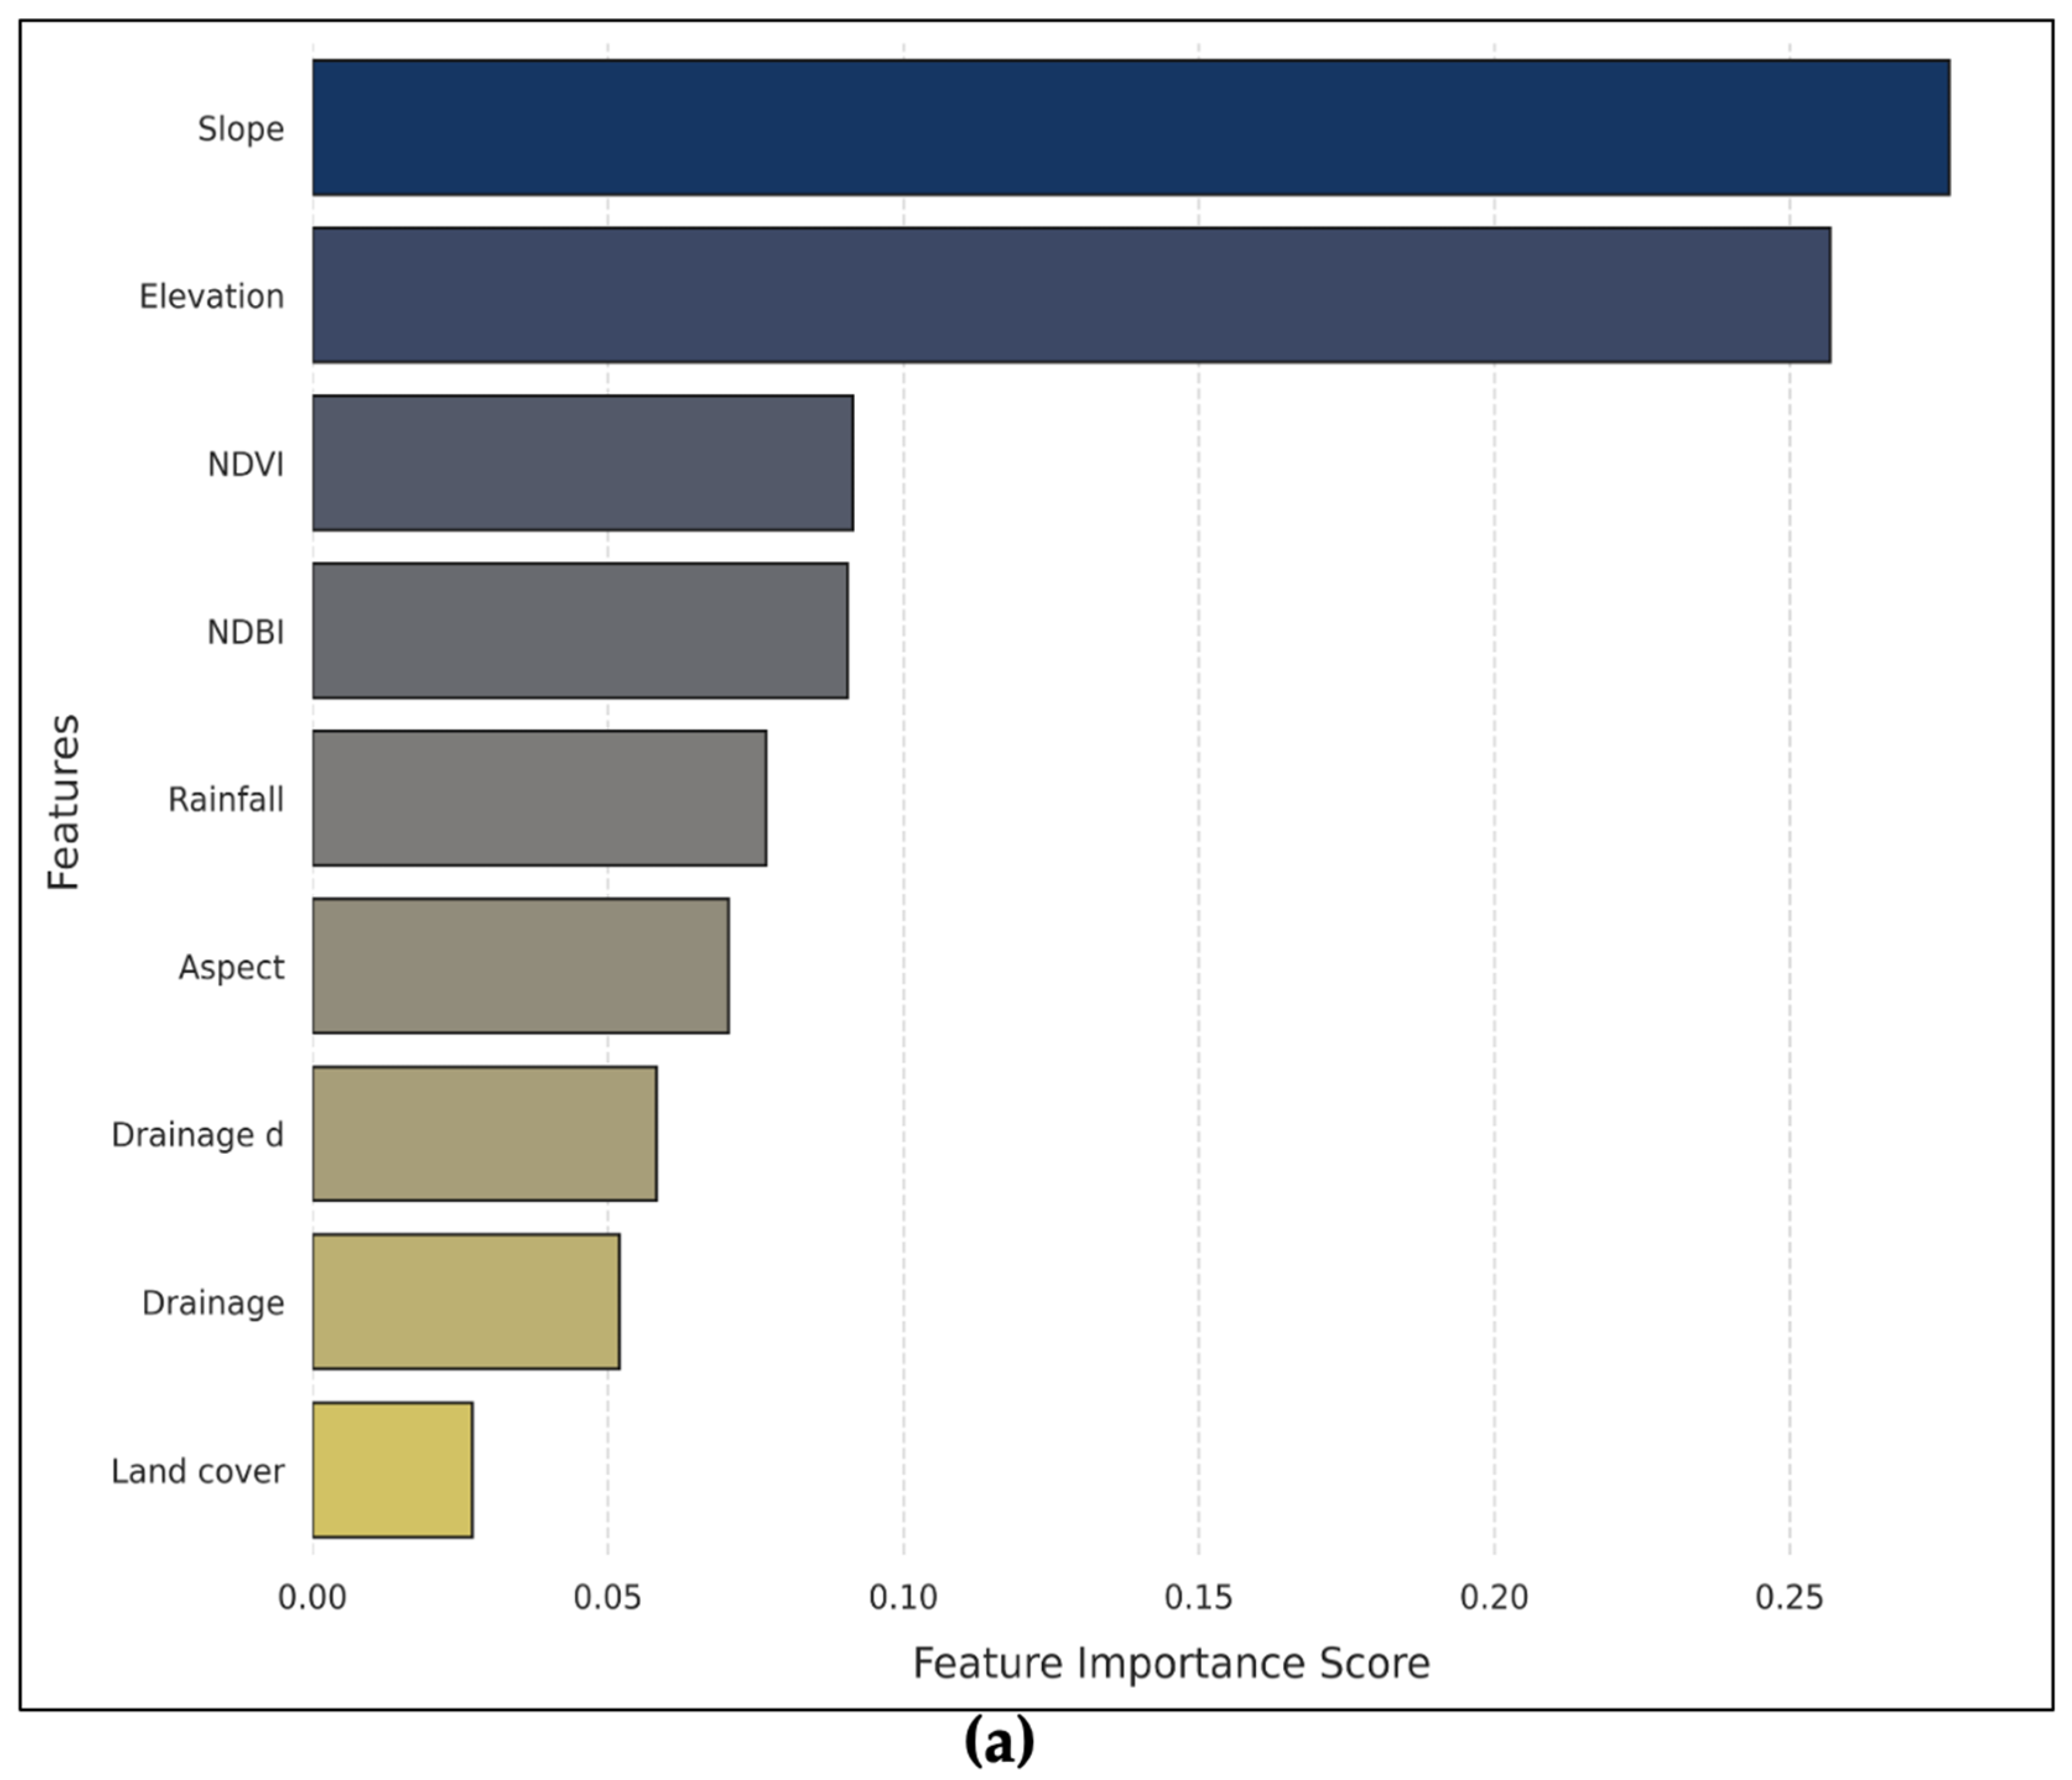
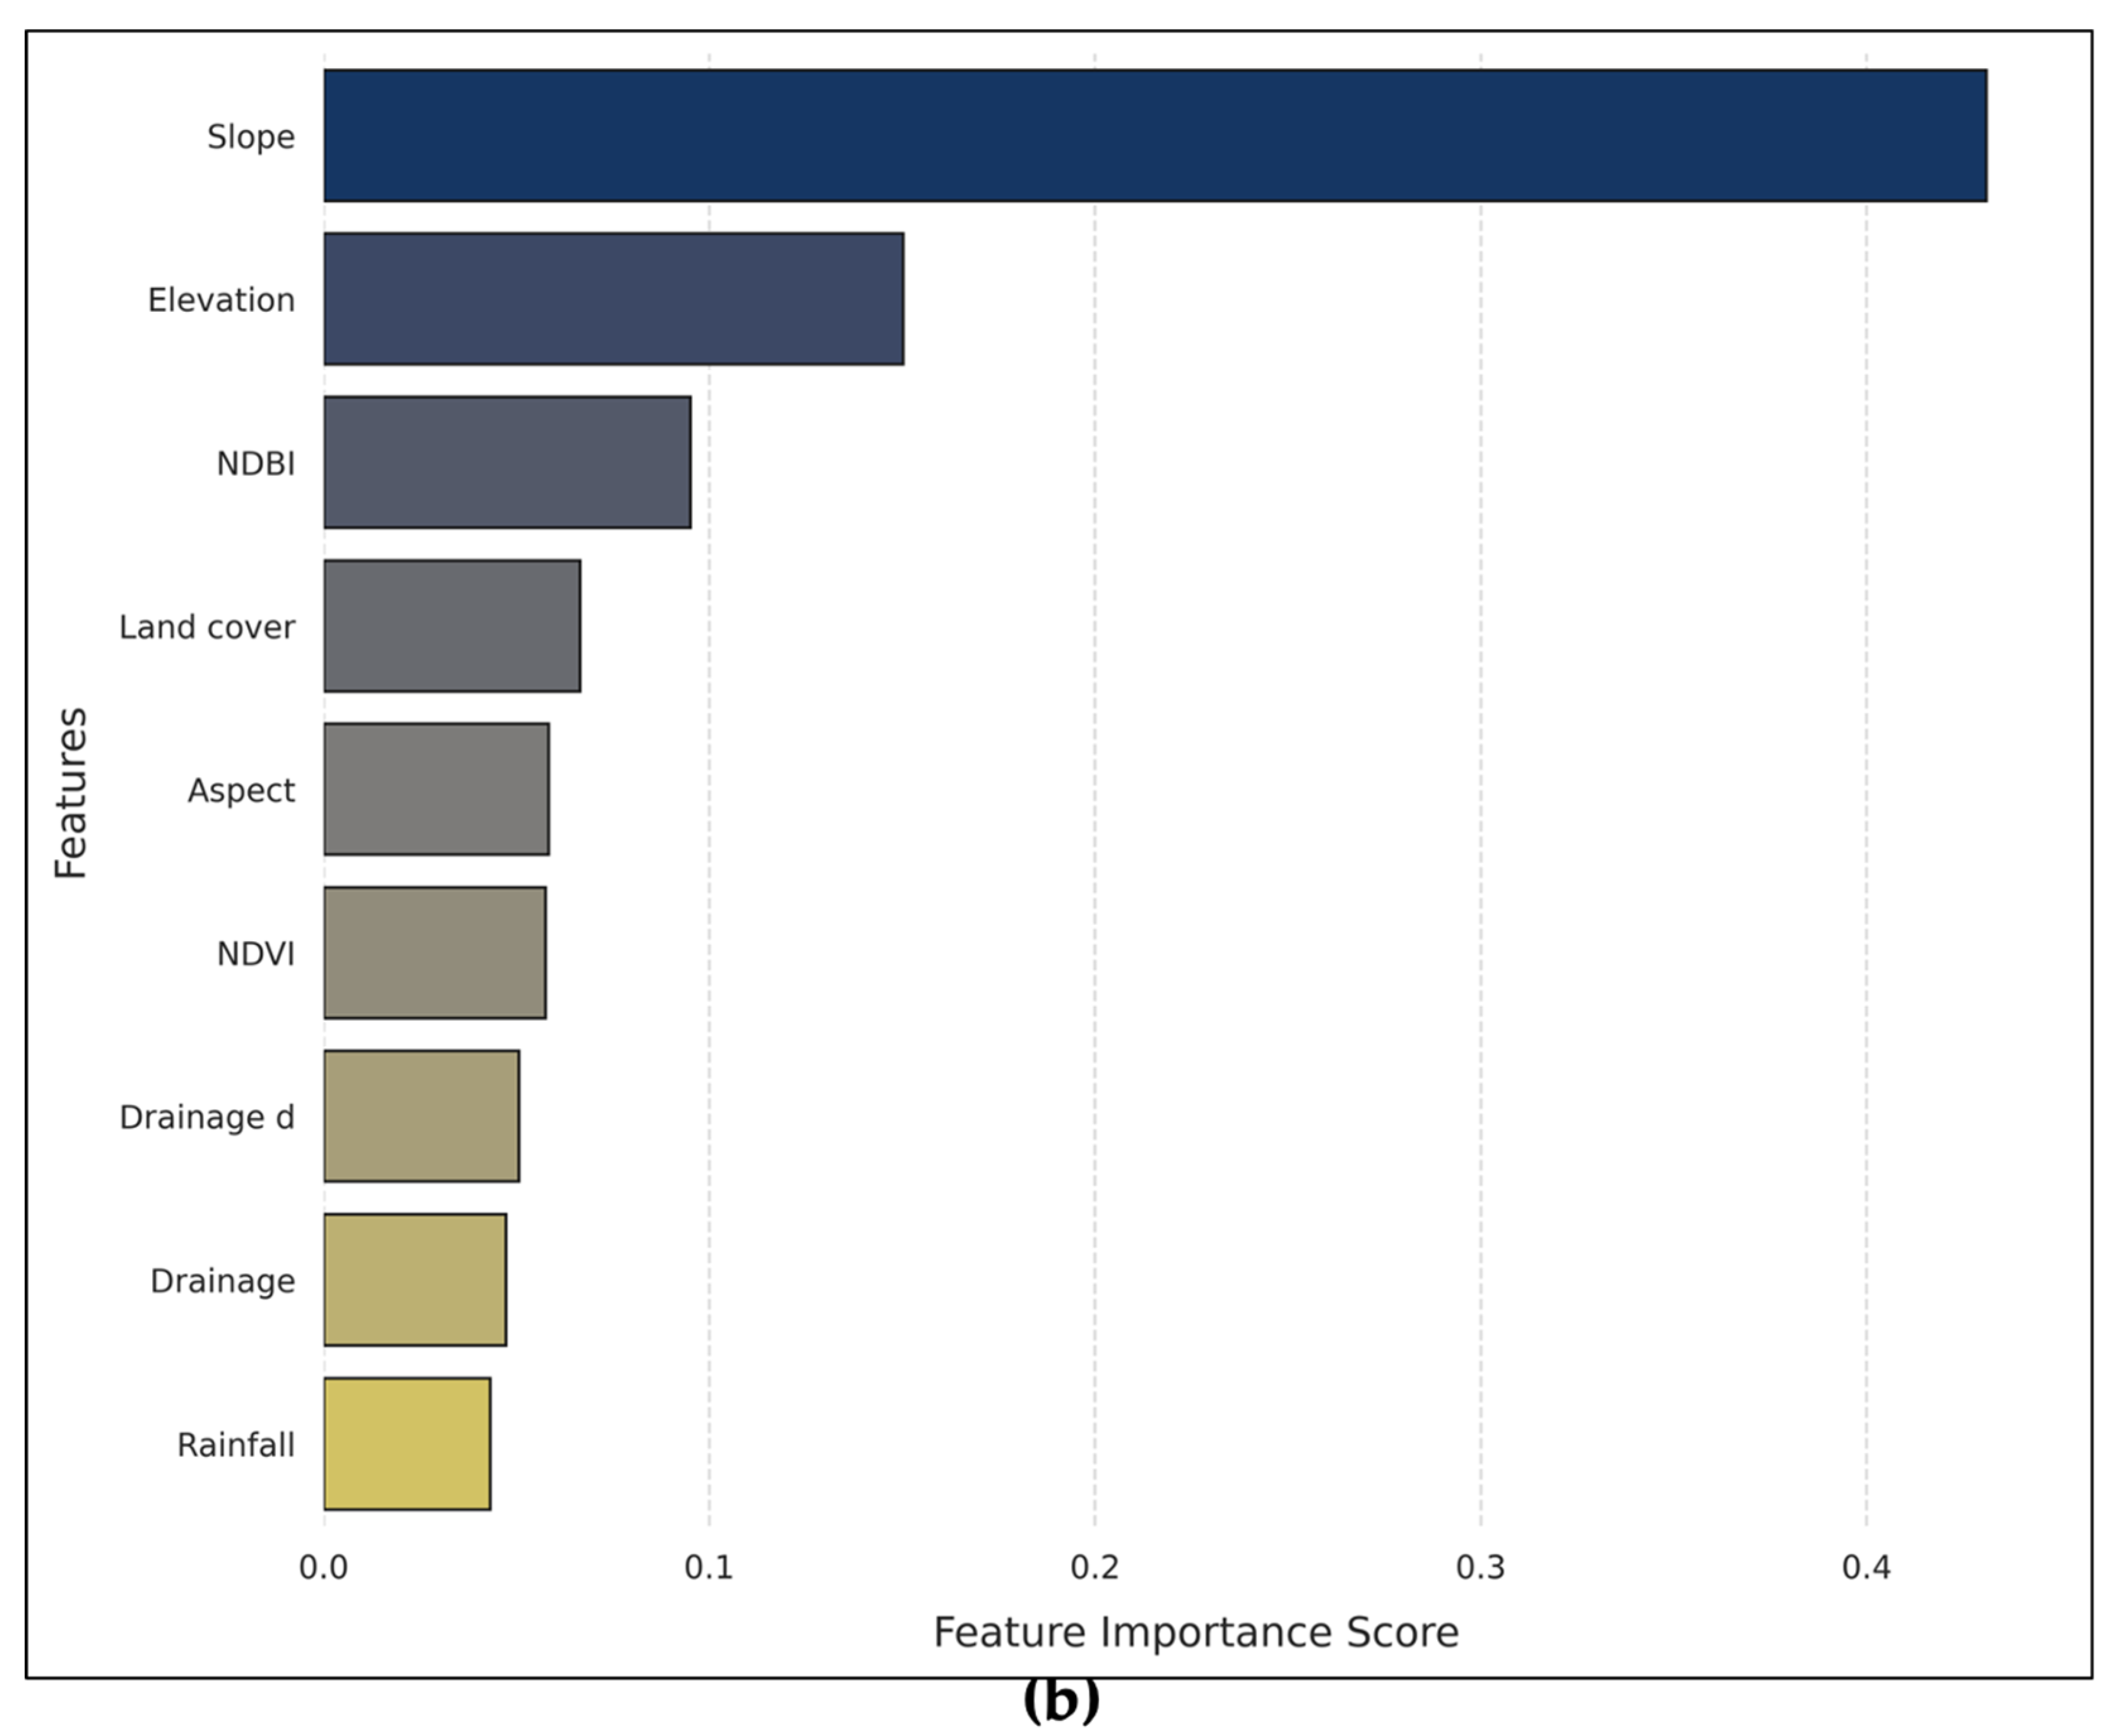
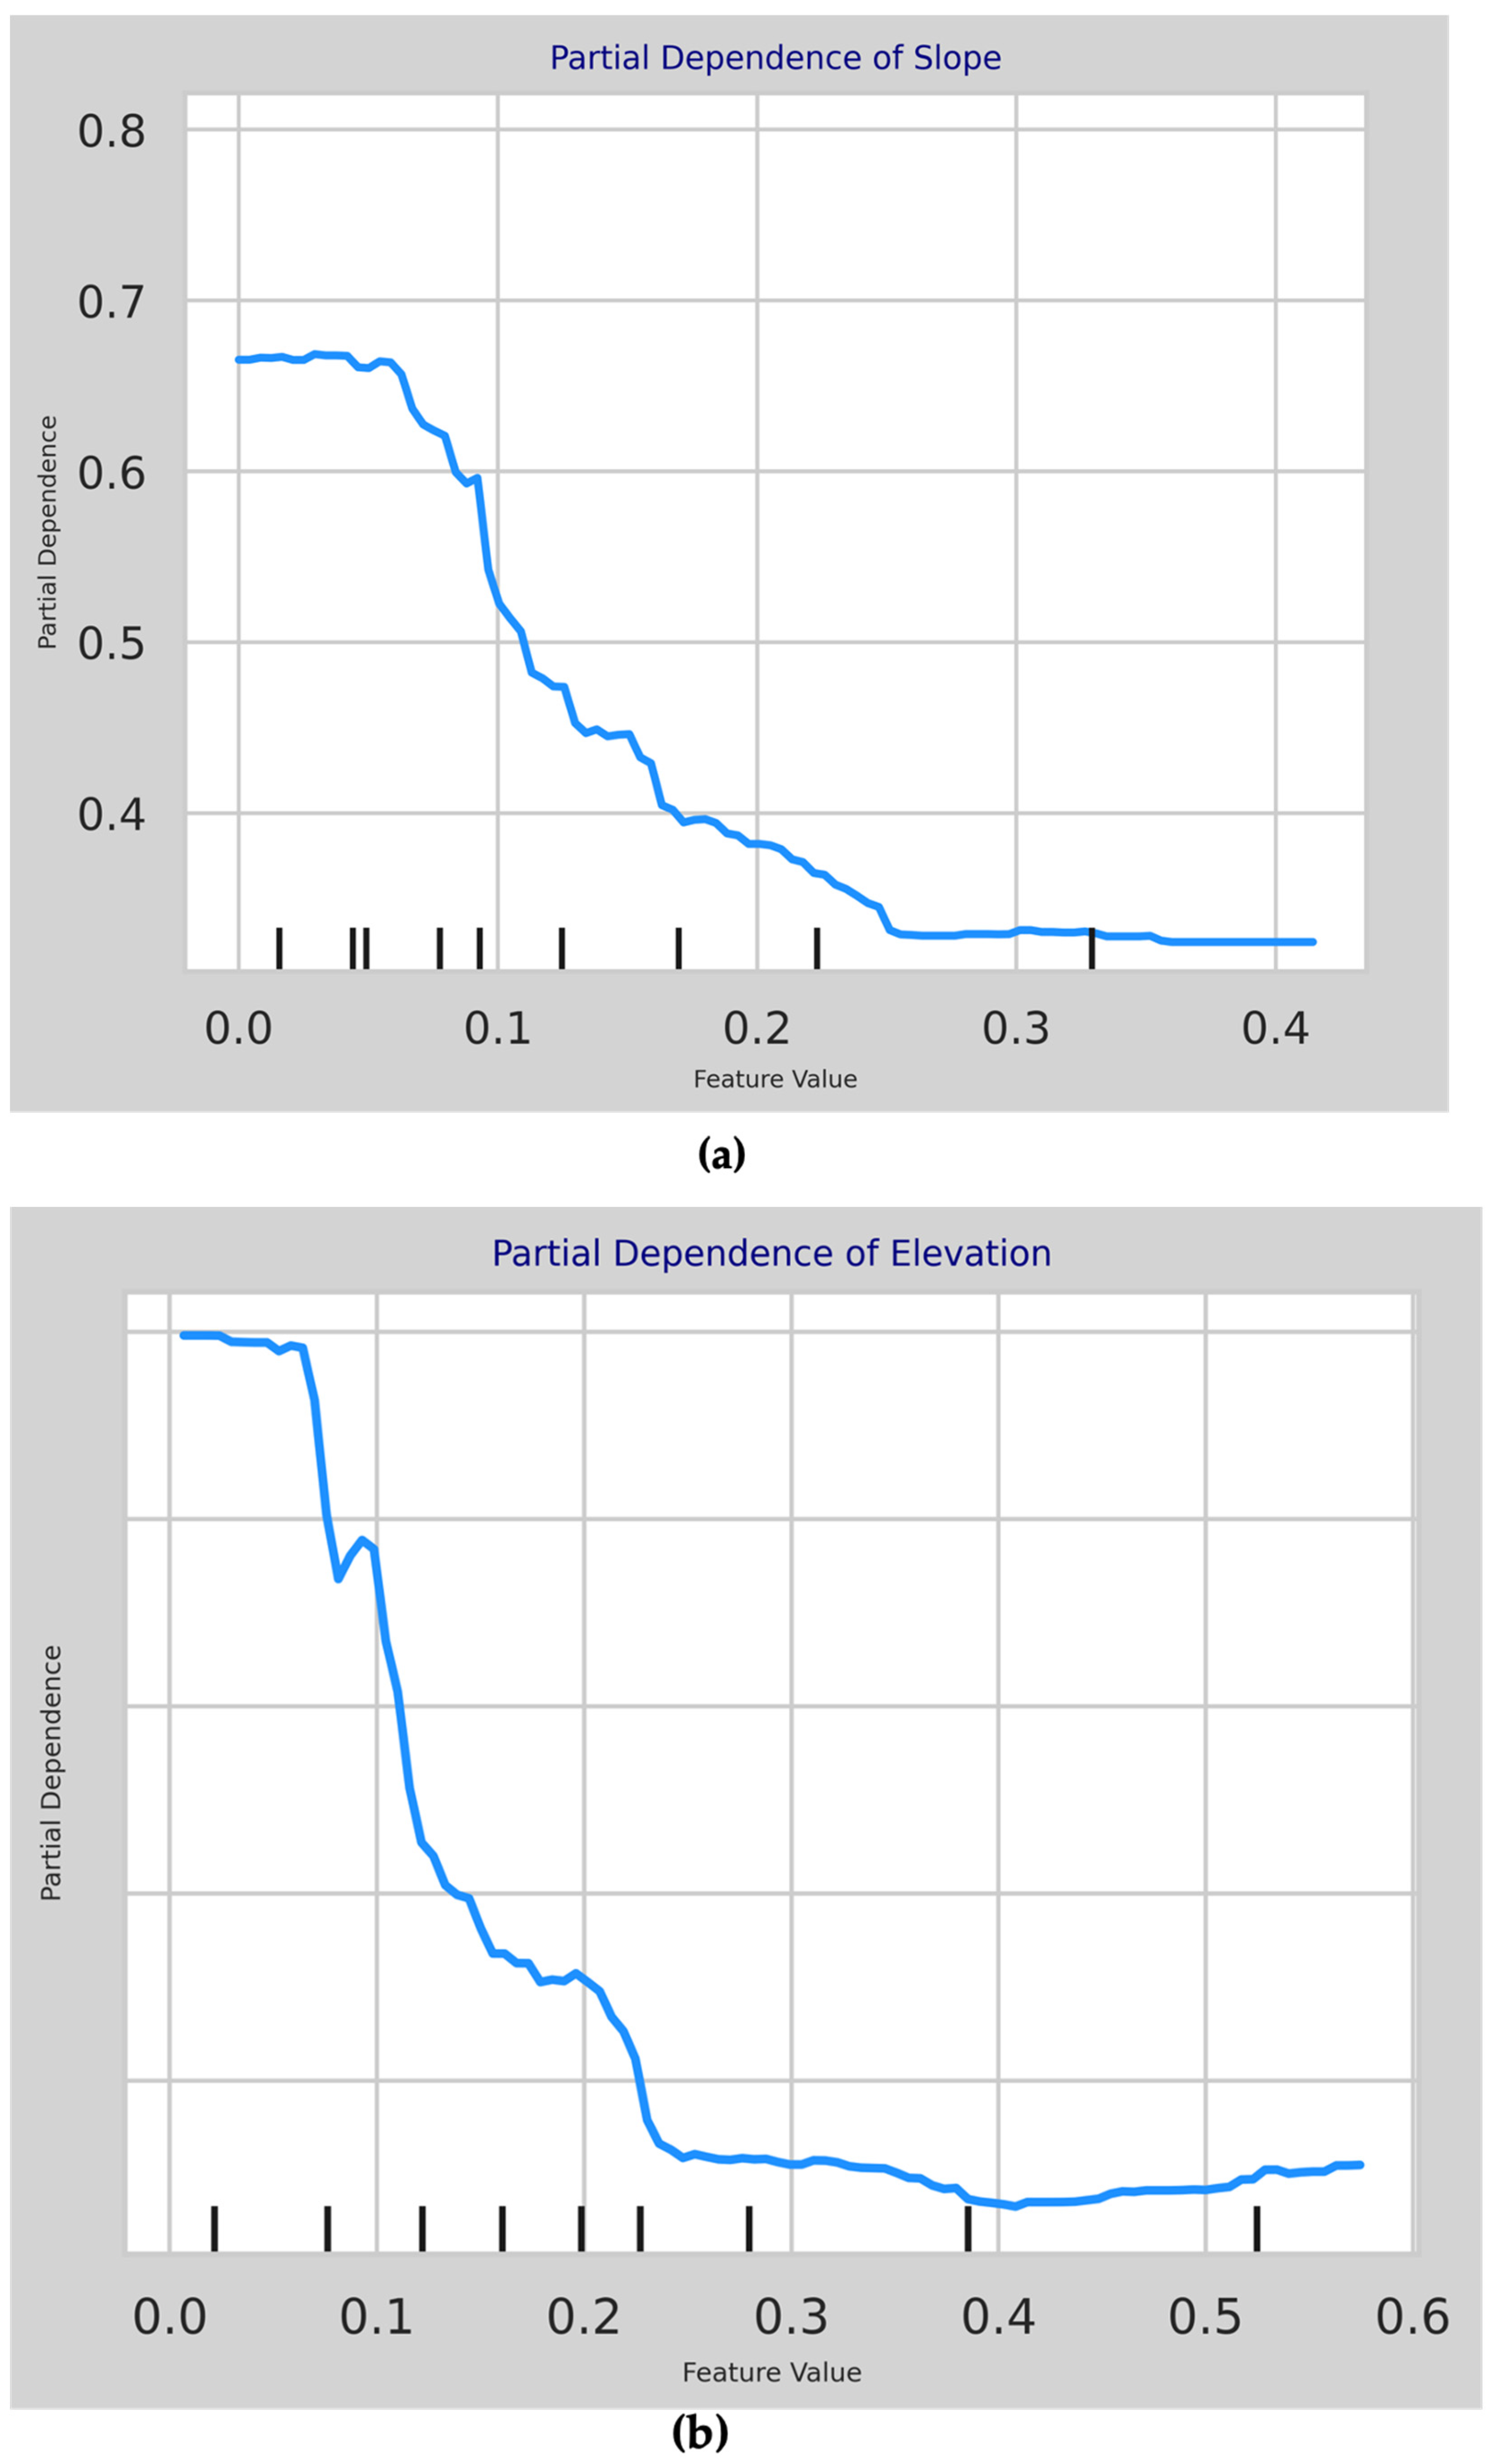
| Elevation | Lower elevation areas are more prone to water accumulation, which increases the likelihood of flooding, while higher elevations typically experience less flooding as water drains downhill [56]. | Extracted from DEM (10 m resolution) obtained from the National Land Authority (NLA) of Rwanda. |
| Slope | Moderate slopes may lead to water accumulation, increasing flood risk, while steep slopes promote rapid runoff, potentially resulting in flash floods [56]. | Extracted from DEM (10 m resolution) obtained from the National Land Authority (NLA) of Rwanda. |
| Aspect | Different aspects can influence vegetation growth and soil moisture levels, impacting flood dynamics; for example, south-facing slopes may dry out faster than north-facing ones [35,57,58,59]. | Extracted from DEM (10 m resolution) obtained from the National Land Authority (NLA) of Rwanda. |
| Land cover | Land cover influences the flow and accumulation of water. For instance, vegetation is important in reducing water runoff and enhancing soil infiltration, which helps mitigate flooding [60]. In contrast, impervious surfaces and barren or open land exacerbate flooding by accelerating water runoff and decreasing water infiltration [61]. | Data were obtained from land cover map of the City of Kigali |
| Normalized Difference Vegetation Index (NDVI) | High NDVI values indicate dense vegetation that can absorb and slow water movement and mitigate flooding effects; low NDVI values suggest sparse vegetation cover correlating with higher flood susceptibility [62]. | Extracted from Sentinel-2 satellite image. |
| Normalized Difference Built-up Index (NDBI) | High NDBI values indicate extensive urban development with impermeable surfaces that exacerbate flooding by increasing surface runoff during heavy rains [63]. | Extracted from Sentinel-2 satellite images. |
| Cumulative Rainfall | Excessive cumulative rainfall can overwhelm drainage systems, particularly in areas with low drainage density or poor soil permeability, leading to increased flooding risks [64]. | Computed from Climate Hazards Group Infrared Precipitation with Station (CHIRPS) data. |
| Drainage Density | Low drainage density can hinder effective water channeling during floods, increasing the likelihood of flooding in those areas [65]. | Computed from drainage networks data obtained from the City of Kigali. |
| Distance from drainage | Areas that are close to drainage systems, including rivers and streams, are more prone to experience flooding in the event that the drainage system is overloaded with water [62]. | Computed based on drainage network data obtained from the City of Kigali. We considered a distance of 10 m from each river and stream based on Law n°48/2018 of 13 August 2018 on the environment in Rwanda [66]. |
| Categories | Socio-Economic Factors/Indicators | Effect on Vulnerability | Data Source |
|---|---|---|---|
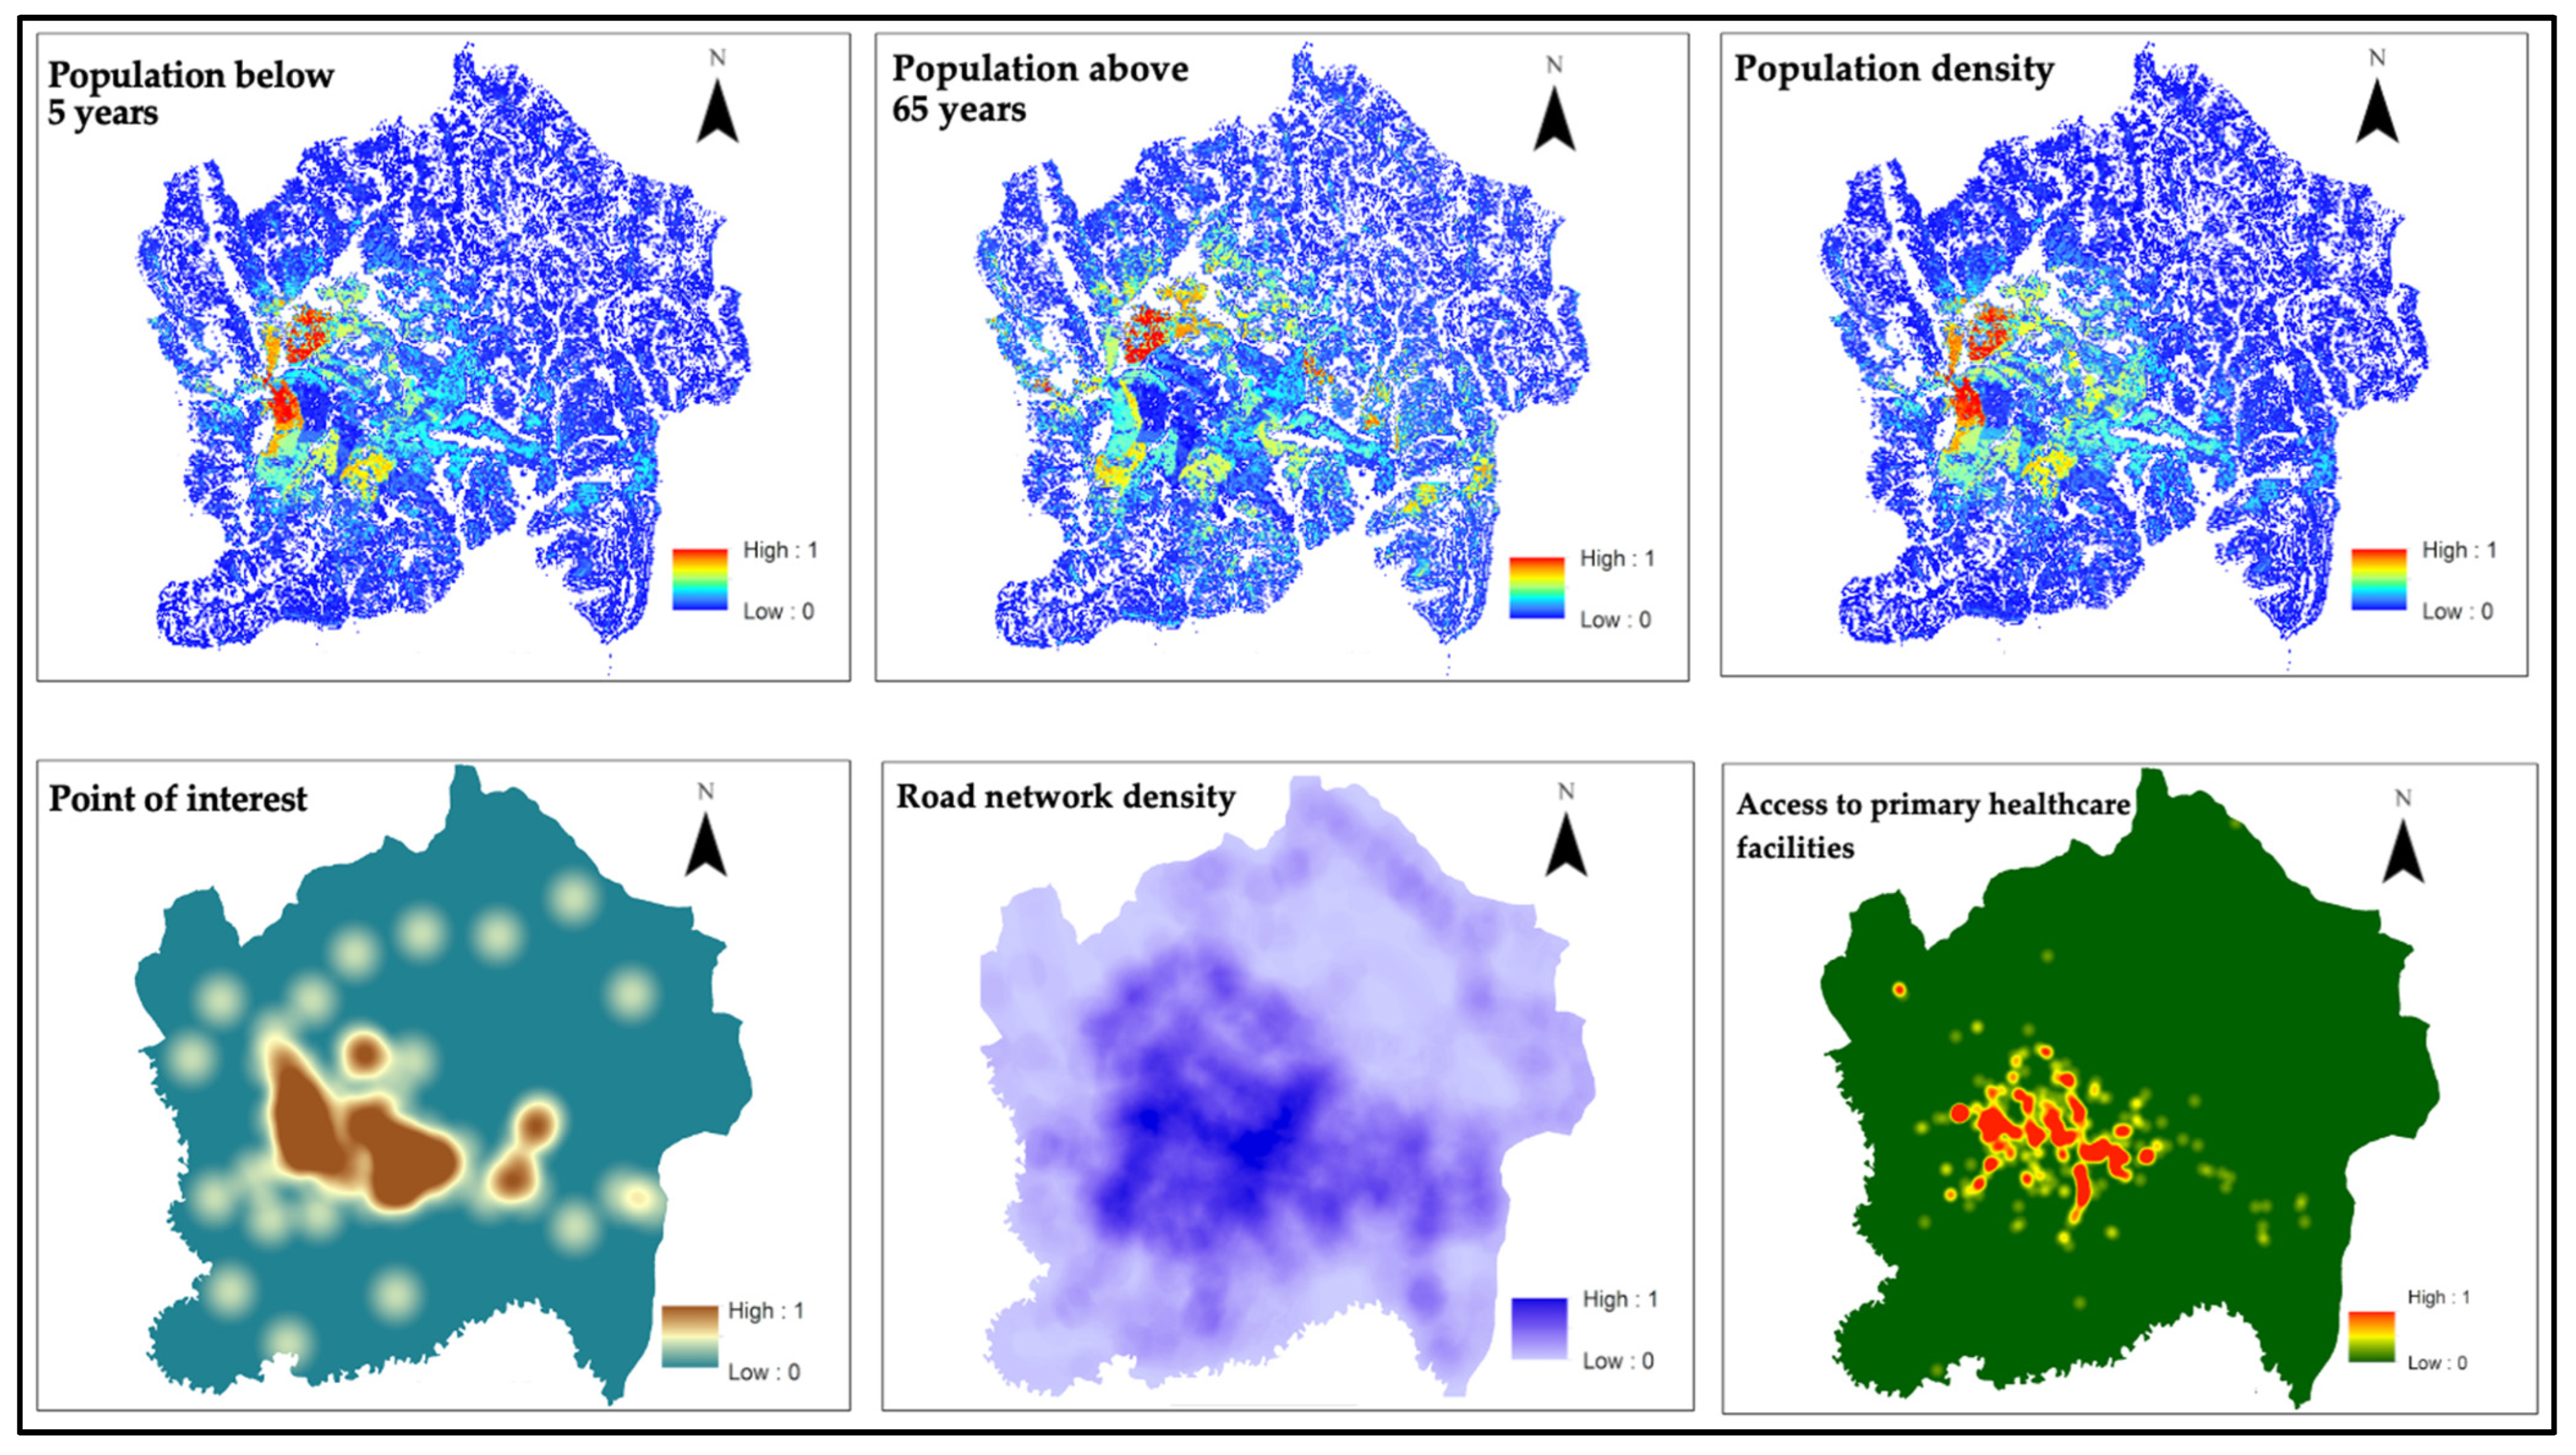
| Exposure sensitivity | Population density | Higher population density often leads to increased exposure to hazards such as flooding [6]. In densely populated regions, the concentration of individuals exacerbates the effects of these hazards, as more people are simultaneously affected by limited resources and emergency services during disasters [70]. | Obtained from Worldpop a database for global population and their characteristics at high resolution. |
| Population below 5 years | Young children are not physically able to resist during the flood event since their bodies adapt less efficiently than adults, increasing their risk during flood event [38,71]. | Obtained from Worldpop. | |
| Population above 65 years | Older people are particularly sensitive to natural hazards people are not physically able to resist during the flood event and are likely suffering from pre-existing health conditions that can be exacerbated by environmental factors, making them a high-risk group during disasters [71,72]. | Obtained from Worldpop. | |
| Adaptive capacity | Road network | The road network is crucial for understanding human and socio-economic interactions, particularly in accessing essential services [73]. Access to road networks facilitates quicker responses during emergencies and enhances the overall adaptive capacity of communities [26]. | Extracted from OpenStreetMap (OSM), a global open-source database where volunteers map geographic elements [73]. |
| Access to primary healthcare facilities, | Access to healthcare facilities enables quicker medical responses during disasters. When facilities are within reach, individuals can receive timely treatment for injuries or health issues that arise during emergencies [74,75,76]. Primary healthcare facilities serve as the initial point of entry for individuals seeking healthcare services. | Computed from the spatial distribution of primary healthcare facilities available from the Ministry of Health of Rwanda and downloaded from the national spatial data geoportal. | |
| Points of interest (POIs) | Socio-economic related POIs, including economic and social activities, were used to describe the availability of socio-economic activities across the city [77]. In total, 804 POIs were extracted and grouped into eight categories, namely hospitality services, education, amenities, shopping centers, financial services, culture and recreation, auto services, and health. | POIs were obtained from OSM. |
| Model | AUC | Accuracy | Precision | Recall | F1-Score |
|---|---|---|---|---|---|
| MLP | 0.902 | 0.85 | 0.83 | 0.90 | 0.86 |
| SVM | 0.885 | 0.82 | 0.79 | 0.90 | 0.84 |
| RF | 0.884 | 0.80 | 0.78 | 0.87 | 0.82 |
| XGBoost | 0.883 | 0.80 | 0.77 | 0.88 | 0.82 |
| City | Model | AUC | MAE |
|---|---|---|---|
| Kampala | MLP | 0.475 | 0.511 |
| RF | 0.473 | 0.530 | |
| SVM | 0.455 | 0.547 | |
| XGBoost | 0.519 | 0.484 | |
| Dar es Salaam | MLP | 0.402 | 0.523 |
| RF | 0.403 | 0.590 | |
| SVM | 0.447 | 0.535 | |
| XGBoost | 0.387 | 0.605 |
Disclaimer/Publisher’s Note: The statements, opinions and data contained in all publications are solely those of the individual author(s) and contributor(s) and not of MDPI and/or the editor(s). MDPI and/or the editor(s) disclaim responsibility for any injury to people or property resulting from any ideas, methods, instructions or products referred to in the content. |
© 2025 by the authors. Published by MDPI on behalf of the International Society for Photogrammetry and Remote Sensing. Licensee MDPI, Basel, Switzerland. This article is an open access article distributed under the terms and conditions of the Creative Commons Attribution (CC BY) license (https://creativecommons.org/licenses/by/4.0/).
Share and Cite
Dufitimana, E.; Gahungu, P.; Uwayezu, E.; Mugisha, E.; Bizimana, J.P. Integrating Machine Learning and Geospatial Data for Mapping Socioeconomic Vulnerability to Urban Natural Hazard. ISPRS Int. J. Geo-Inf. 2025, 14, 161. https://doi.org/10.3390/ijgi14040161
Dufitimana E, Gahungu P, Uwayezu E, Mugisha E, Bizimana JP. Integrating Machine Learning and Geospatial Data for Mapping Socioeconomic Vulnerability to Urban Natural Hazard. ISPRS International Journal of Geo-Information. 2025; 14(4):161. https://doi.org/10.3390/ijgi14040161
Chicago/Turabian StyleDufitimana, Esaie, Paterne Gahungu, Ernest Uwayezu, Emmy Mugisha, and Jean Pierre Bizimana. 2025. "Integrating Machine Learning and Geospatial Data for Mapping Socioeconomic Vulnerability to Urban Natural Hazard" ISPRS International Journal of Geo-Information 14, no. 4: 161. https://doi.org/10.3390/ijgi14040161
APA StyleDufitimana, E., Gahungu, P., Uwayezu, E., Mugisha, E., & Bizimana, J. P. (2025). Integrating Machine Learning and Geospatial Data for Mapping Socioeconomic Vulnerability to Urban Natural Hazard. ISPRS International Journal of Geo-Information, 14(4), 161. https://doi.org/10.3390/ijgi14040161