

Multi-Scenario Forecasting of Land Use and Ecosystem Service Values in Coastal Regions: A Case Study of the Chaoshan Area, China

Abstract
1. Introduction
2. Study Area and Datasets
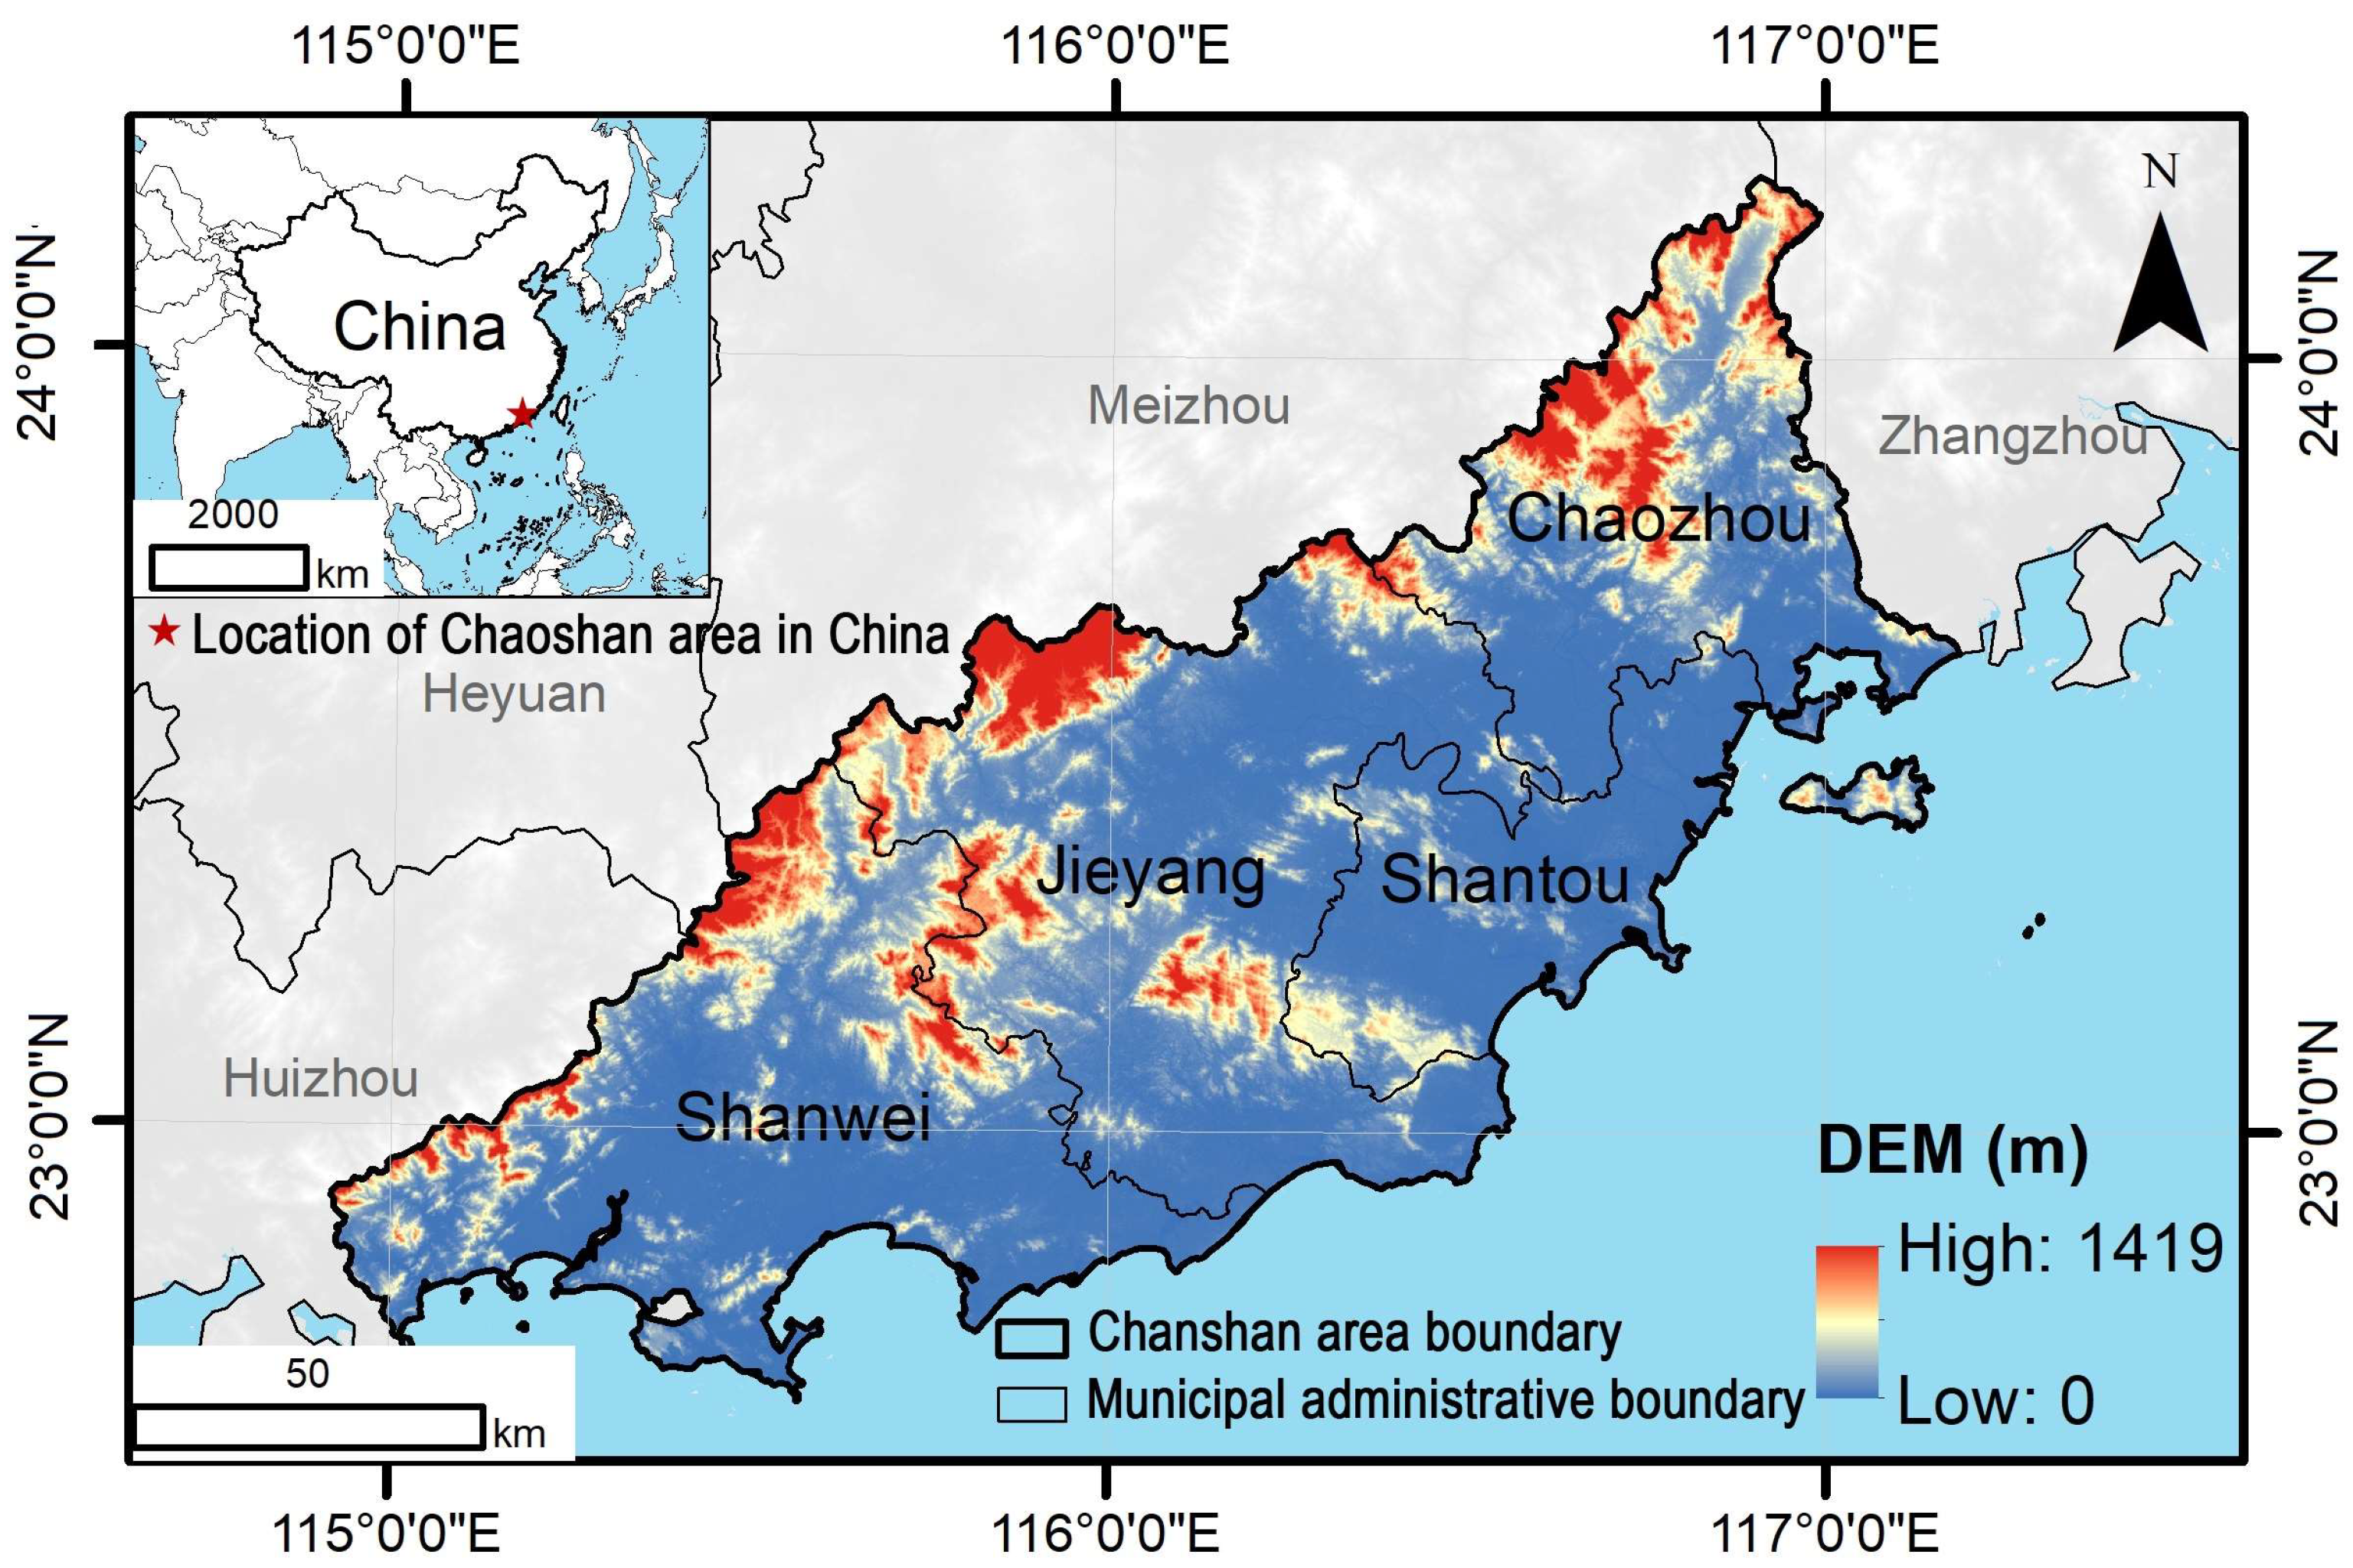
2.1. Study Area
2.2. Datasets
3. Methods
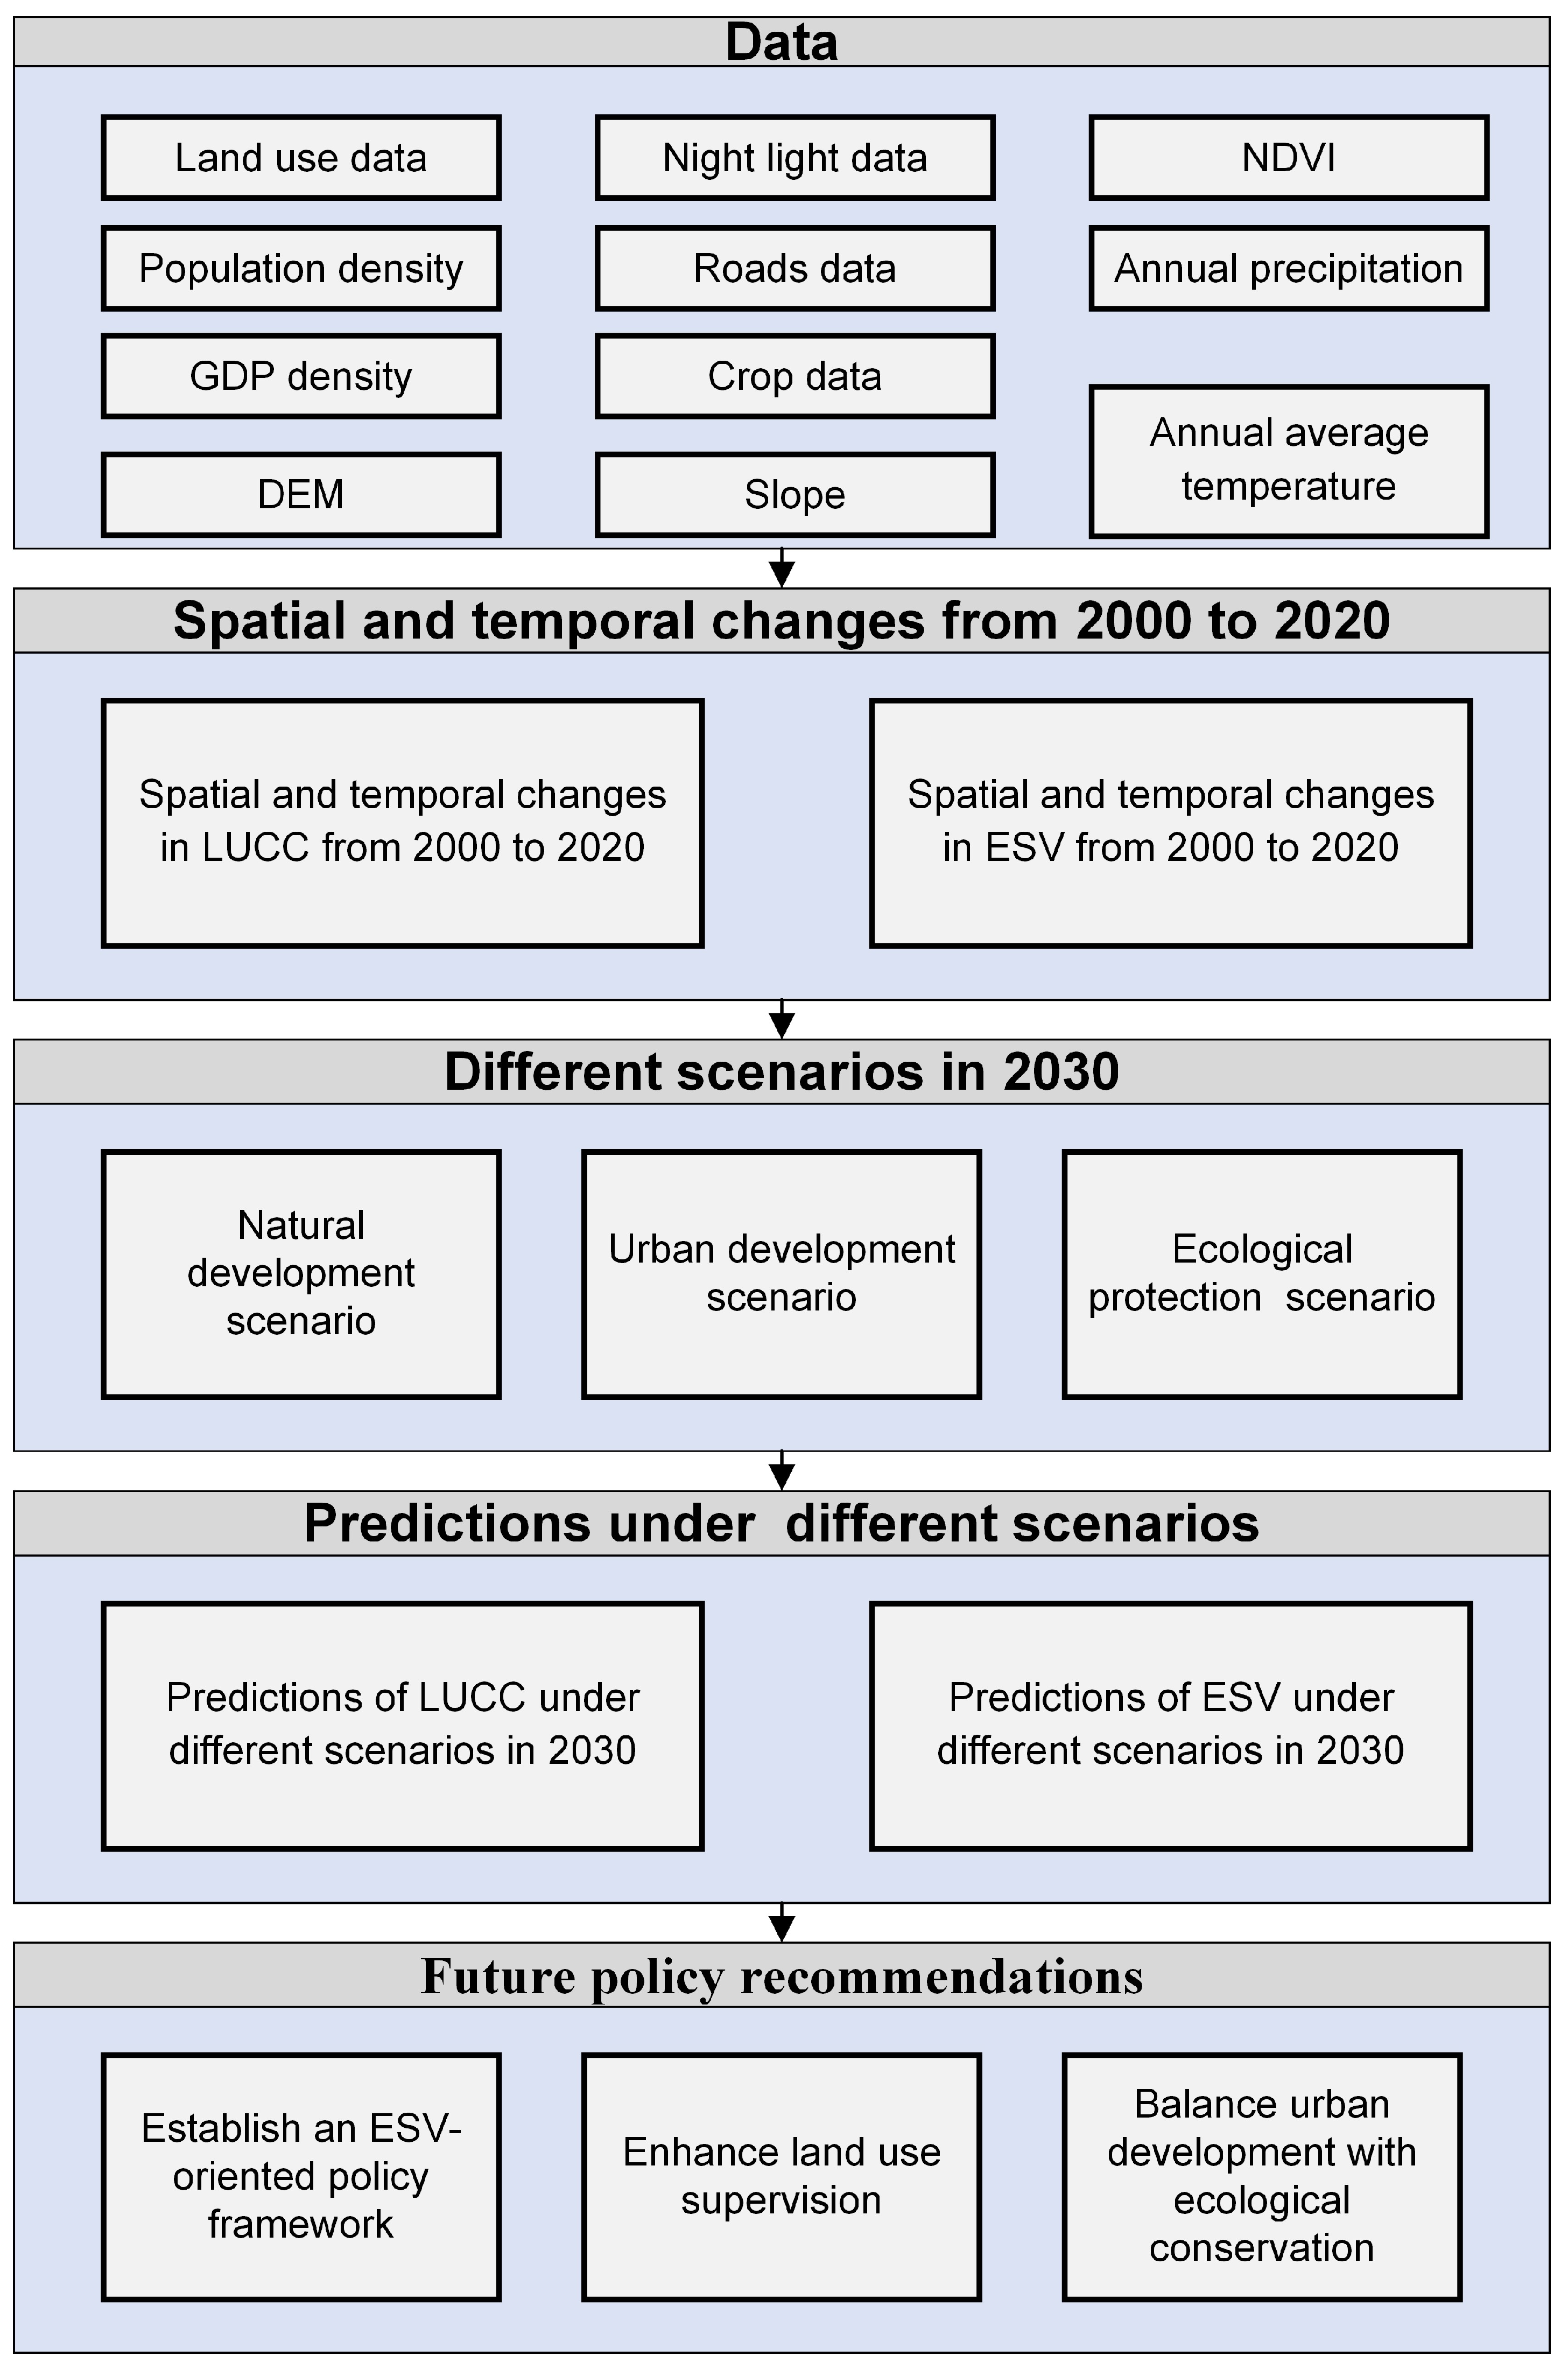
3.1. Research Framework
3.2. PLUS Model
3.3. Scenario Simulation Construction
3.4. ESV Assessment
3.5. Sensitivity Analysis
4. Results
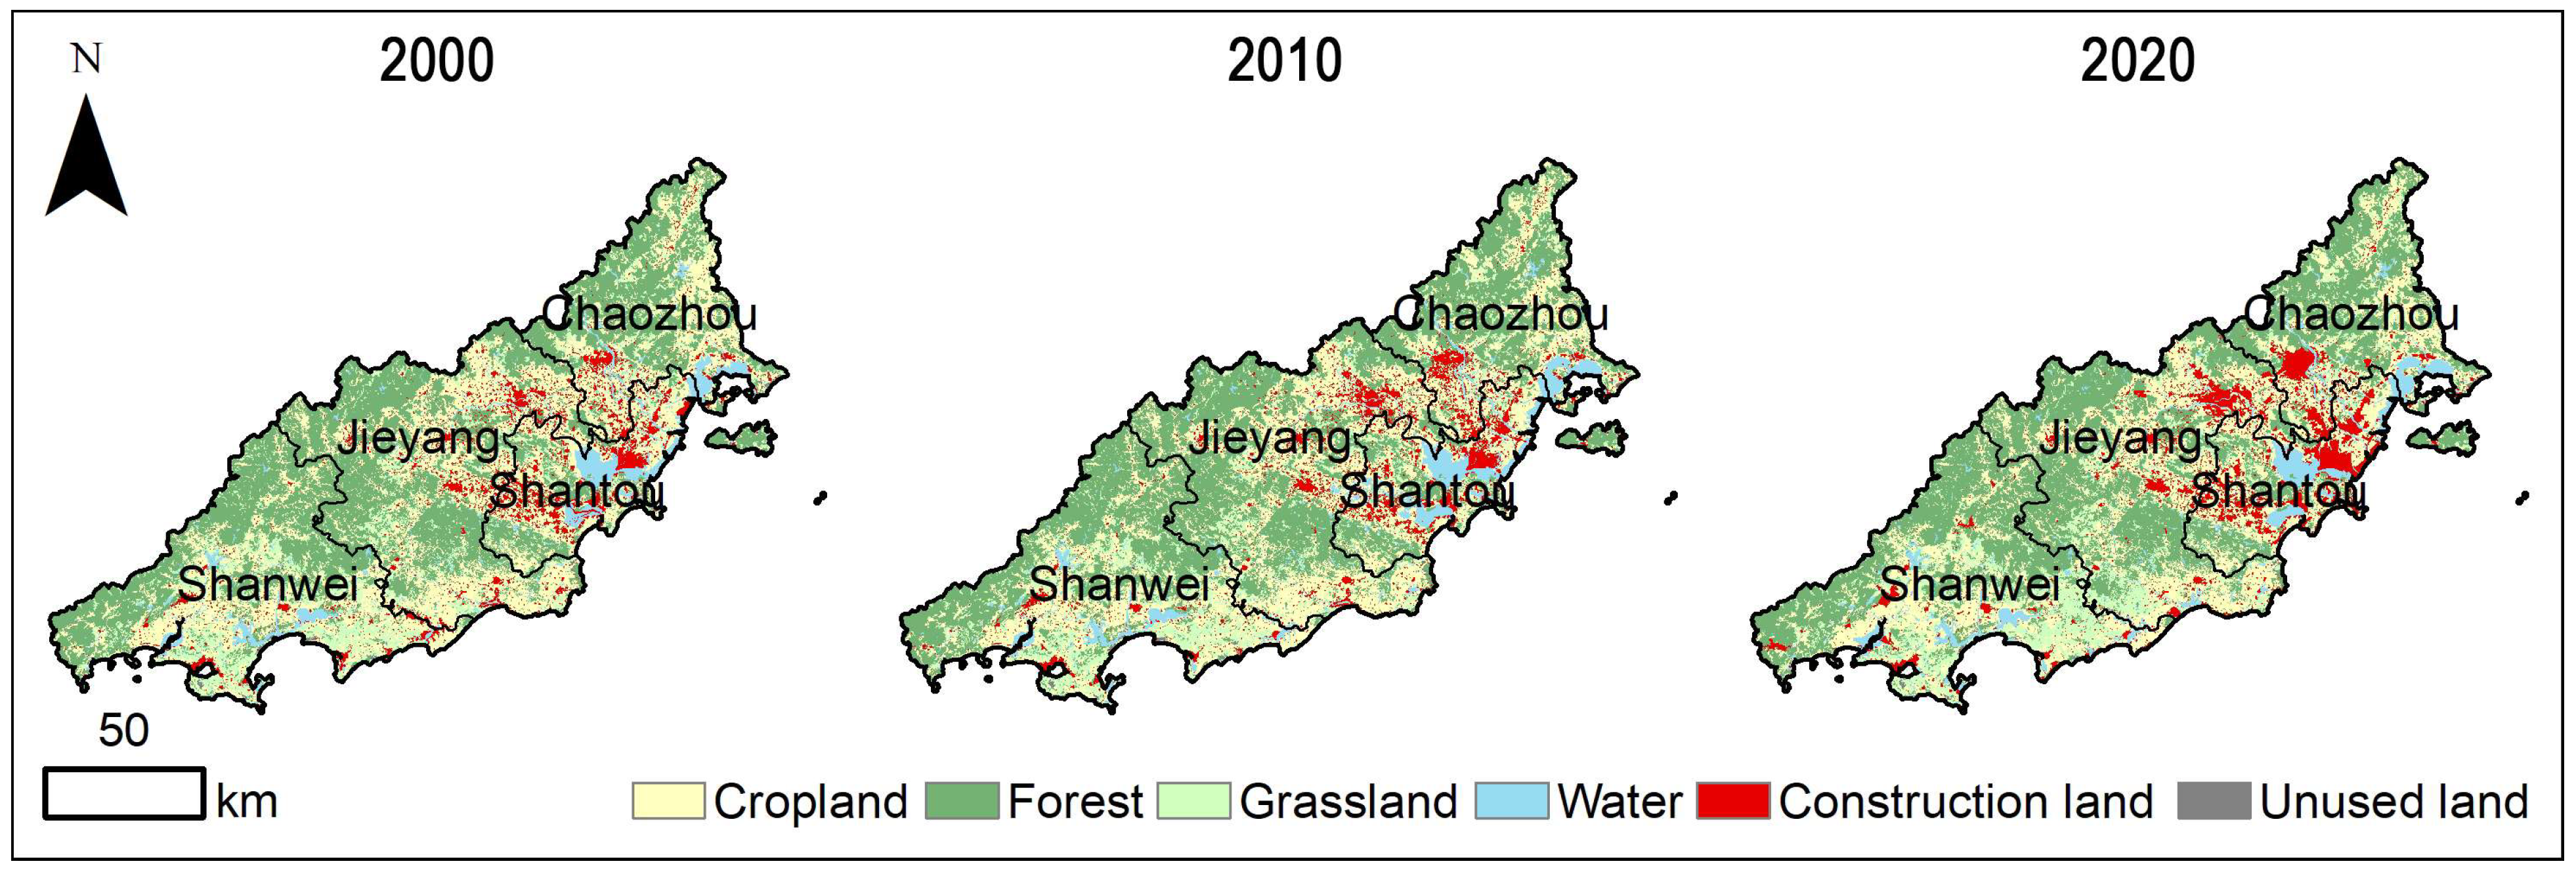
4.1. Spatial and Temporal Changes in LUCC
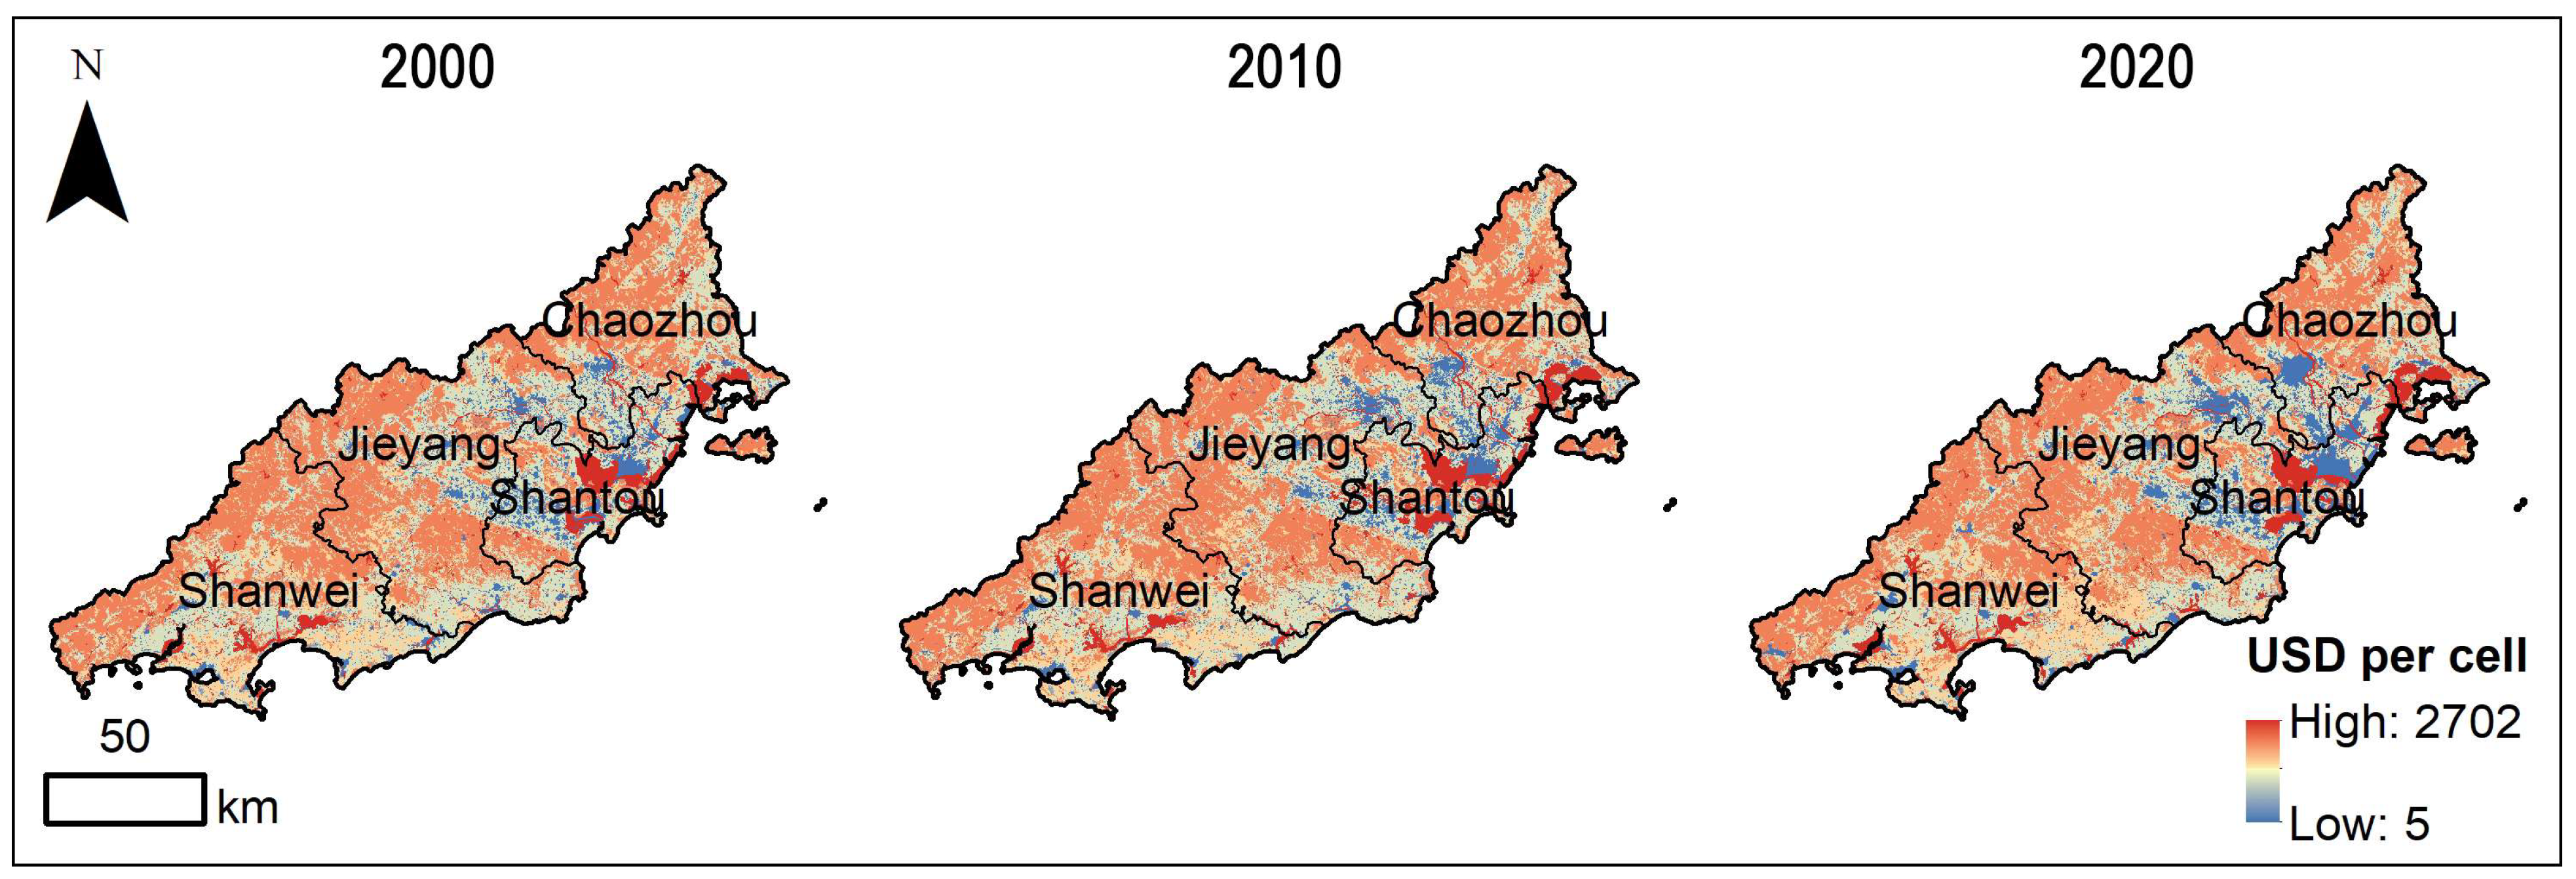
4.2. Spatial and Temporal Changes in ESV
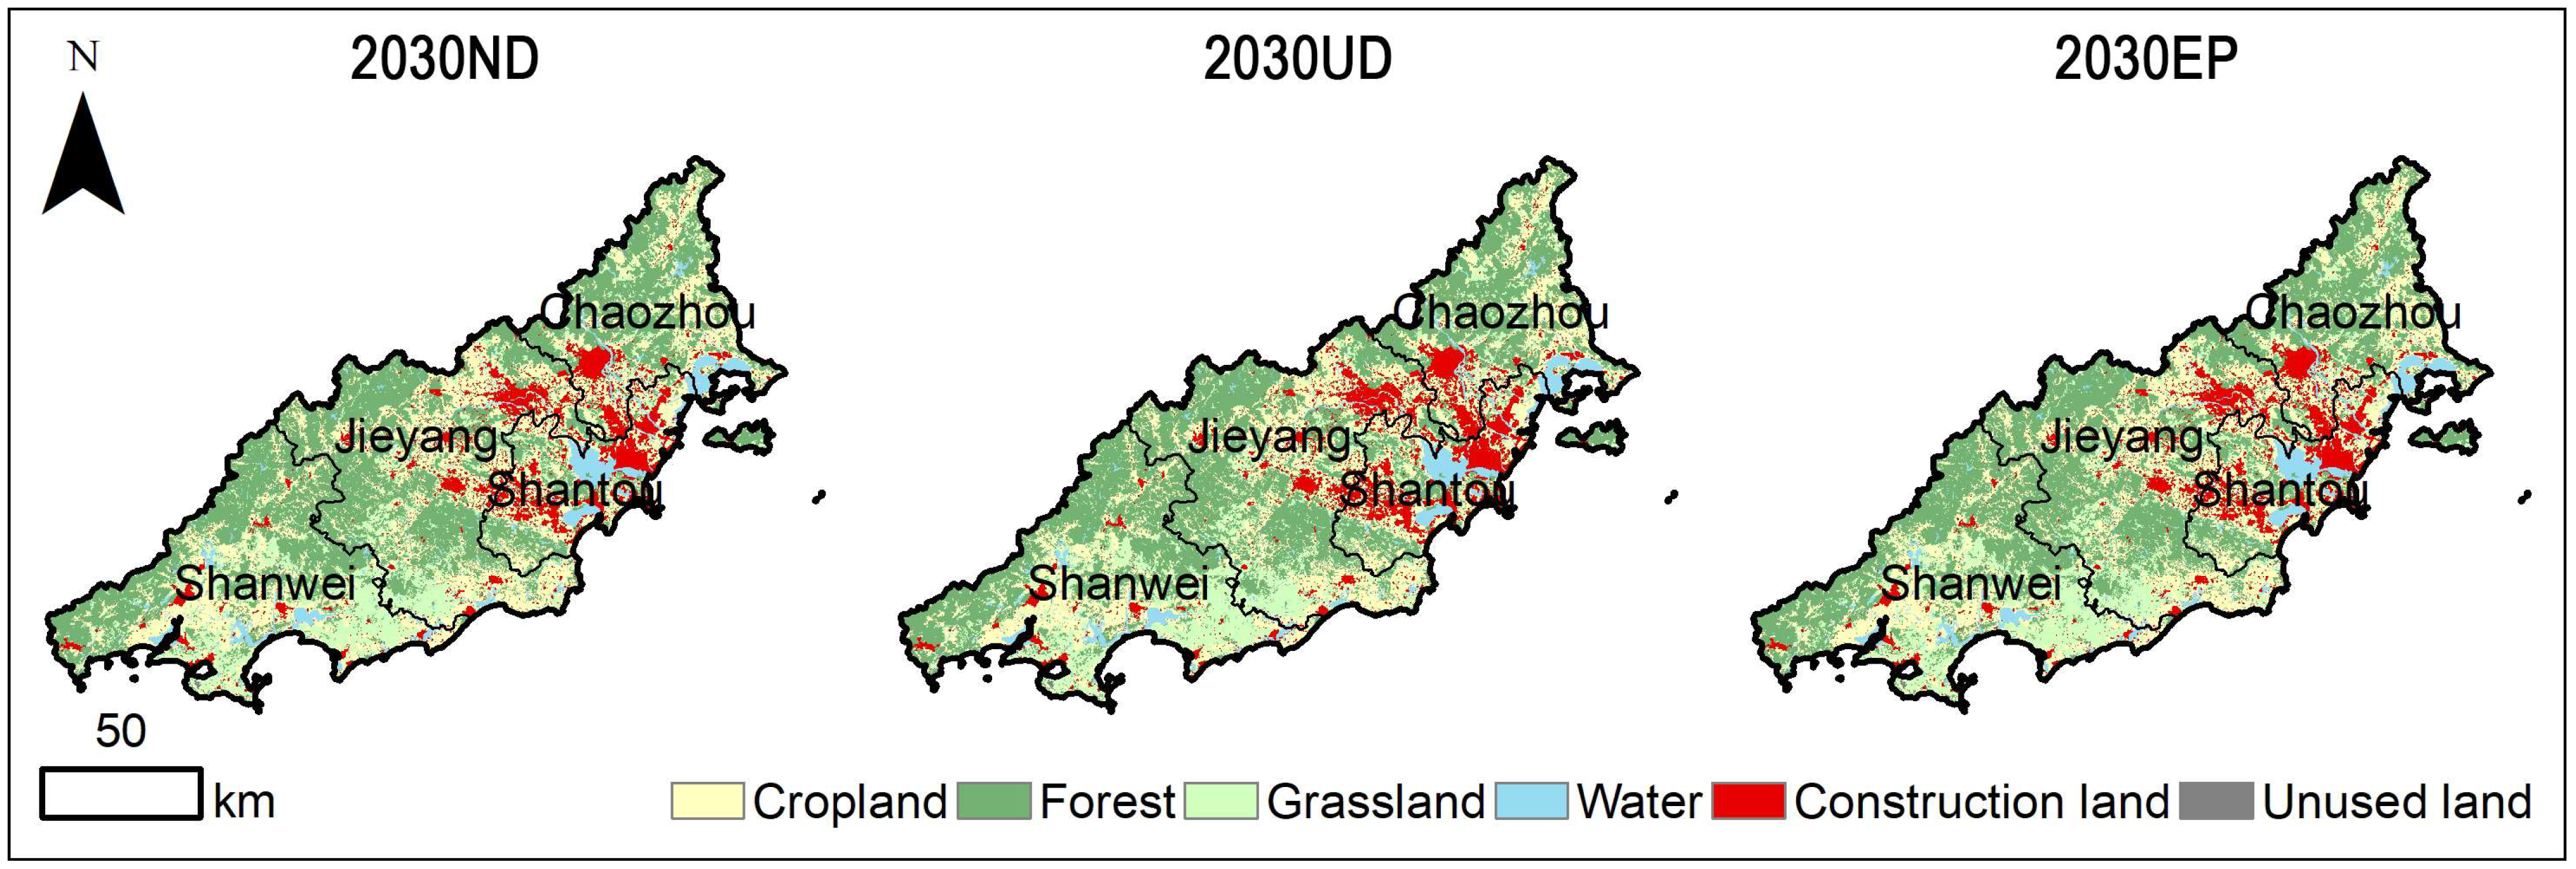
4.3. LUCC Predictions in Different Scenarios
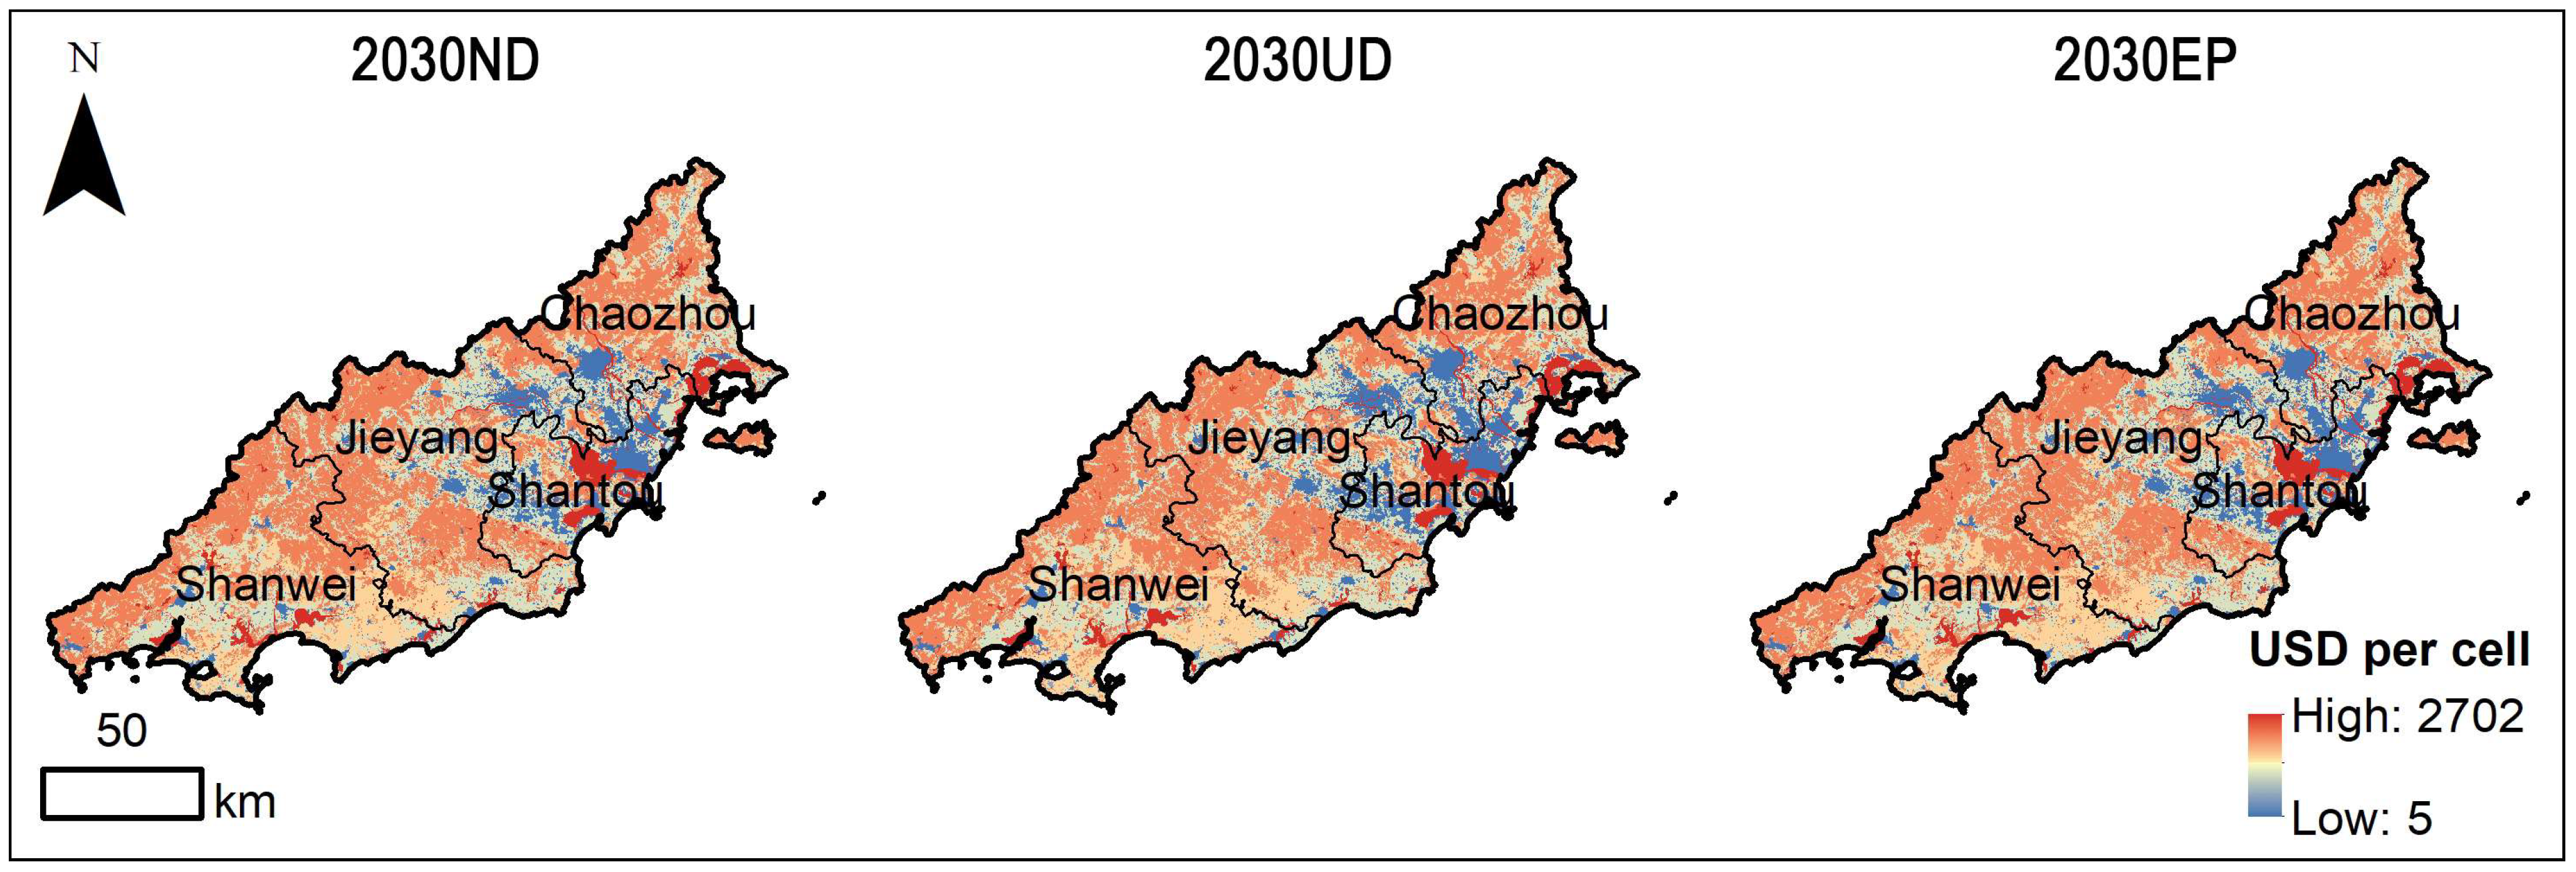
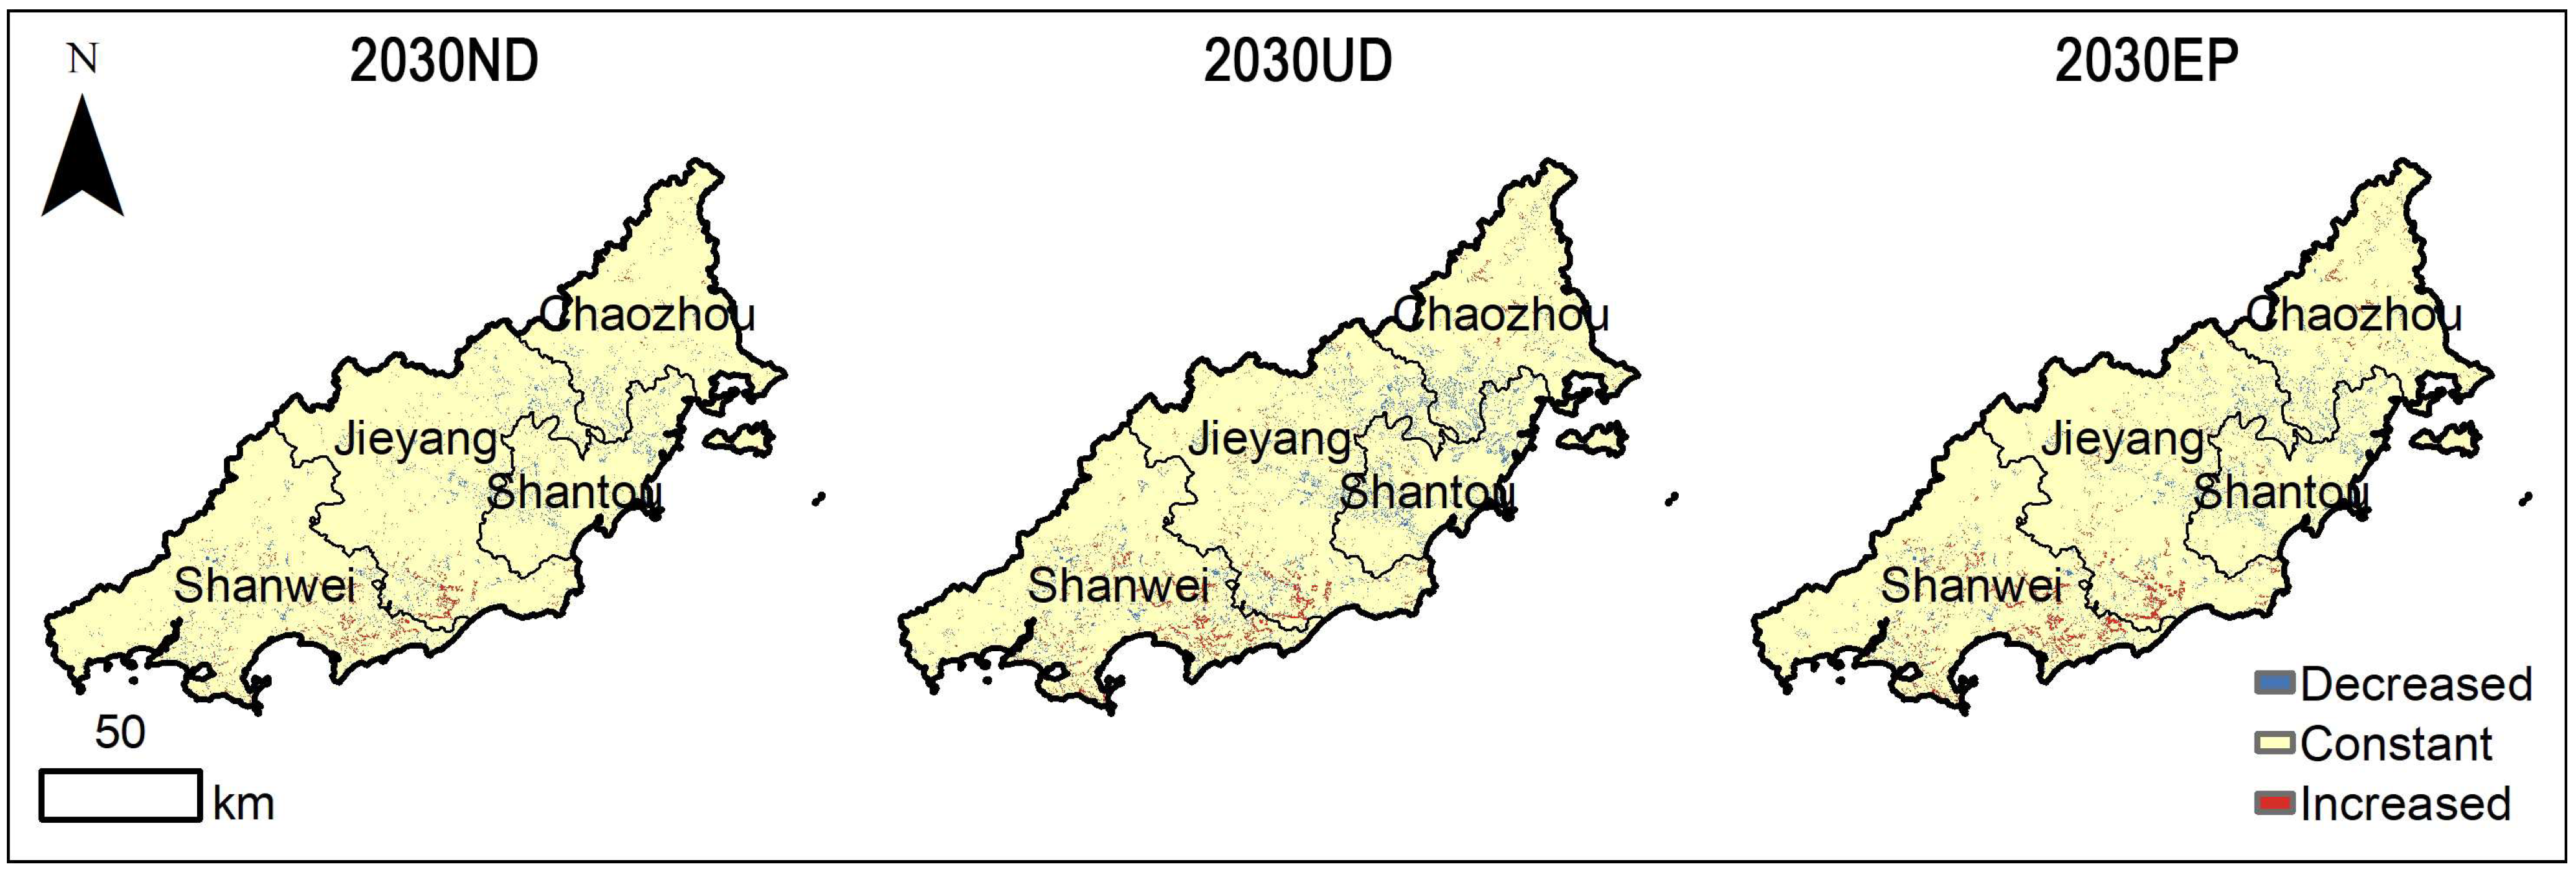
4.4. Predictions of ESV Under Different Scenarios
5. Discussion
5.1. Drivers of Land Use Change
5.2. Response of ESV to LUCC
5.3. Reflections on Future Planning Policies
5.4. Limitations of This Study
6. Conclusions
- (1)
- Between 2000 and 2020, the cropland area in the Chaoshan region decreased significantly by 52,147 hm2. By 2020, the per capita cultivated land area was approximately 113.34 m2 (0.028 acres). Over the past two decades, construction land has continuously expanded, increasing by 26,412 hm2, with the growth concentrated in Shantou, Jieyang, and Chaozhou, reflecting a clear trend of urban integration among these cities. The increase in construction land was mainly influenced by nighttime light and the distance to water areas, with contribution rates of 14.55% and 16.97%. This indicates that urban sprawl is extending from existing urban areas to surrounding regions and is influenced by the presence of water. By 2030, both grassland and construction land areas are projected to increase by more than 10%. However, under the EP scenario, the growth rate of construction land is expected to decline, suggesting a slowdown in urban expansion.
- (2)
- Between 2000 and 2020, the total ESV in the Chaoshan region exhibited a slow upward trend, with Shantou being the only city experiencing a decline. The areas with low ESV values were primarily located in the southeastern part of the Chaoshan region. By 2030, as urban integration among Shantou, Chaozhou, and Jieyang progresses, the ESV in this region is expected to continue declining.
- (3)
- The slight increase in grassland, forest, and water may partially offset the negative impact of the significant expansion of construction land. Therefore, focusing solely on changes in total ESV may overlook the severe consequences of cropland loss. The inevitable urban integration of Shantou, Chaozhou, and Jieyang will continue to drive the expansion of construction land at the expense of other land types, potentially turning the region into an ecologically vulnerable area. Close monitoring of the dynamic changes in land use patterns and the ecological risks associated with urban land expansion in this region is crucial.
Supplementary Materials
Author Contributions
Funding
Data Availability Statement
Acknowledgments
Conflicts of Interest
References
- Ren, Y.M.; Liu, X.P.; Xu, X.C.; Sun, S.S.; Zhao, L.F.; Liang, X.; Zeng, L. Multi-scenario simulation of land use change and its impact on ecosystem services in Beijing-Tianjin-Hebei region based on the FLUS-InVEST Model. Acta Ecol. Sin. 2023, 43, 4473–4487. [Google Scholar] [CrossRef]
- Li, R.Q.; Dong, M.; Cui, J.Y.; Zhang, L.L.; Cui, Q.G.; He, W.M. Quantification of the impact of land-use changes on ecosystem services: A case study in Pingbian County, China. Environ. Monit. Assess. 2007, 128, 503–510. [Google Scholar] [CrossRef] [PubMed]
- de Groot, R.S.; Alkemade, R.; Braat, L.; Hein, L.; Willemen, L. Challenges in integrating the concept of ecosystem services and values in landscape planning, management and decision making. Ecol. Complex. 2010, 7, 260–272. [Google Scholar] [CrossRef]
- Haines-Young, R.; Potschin, M.; Kienast, F. Indicators of ecosystem service potential at European scales: Mapping marginal changes and trade-offs. Ecol. Indic. 2012, 21, 39–53. [Google Scholar] [CrossRef]
- Lin, Z.; Peng, S. Comparison of multimodel simulations of land use and land cover change considering integrated constraints—A case study of the Fuxian Lake basin. Ecol. Indic. 2022, 142, 109254. [Google Scholar] [CrossRef]
- Xie, G.D.; Zhang, C.X.; Zhang, L.M.; Chen, W.H.; Li, S.M. Improvement of the evaluation method for ecosystem service value based on per unit area. J. Nat. Resour. 2015, 30, 1243–1254. [Google Scholar] [CrossRef]
- Fu, B.J.; Zhang, L.W. Land-use change and ecosystem services: Concepts, methods and progress. Prog. Geogr. Sci. 2014, 33, 441–446. [Google Scholar] [CrossRef]
- Li, W.H. Valuation of Ecosystem Services: Theories, Methods and Applications; China Renmin University Press: Beijing, China, 2008; ISBN 978-7-300-09783-1. [Google Scholar]
- Lamarque, P.; Quétier, F.; Lavorel, S. The diversity of the ecosystem services concept and its implications for their assessment and management. C. R. Biol. 2011, 334, 441–449. [Google Scholar] [CrossRef]
- Fu, B.J. Ecosystem Service and Ecological Security; Higher Education Press: Beijing, China, 2013. [Google Scholar]
- Zhang, Z.; Wu, C.F.; Tan, R. Application of ecosystem service value in land use change research: Bottlenecks and prospects. Chin. J. Appl. Ecol. 2013, 24, 556–562. [Google Scholar] [CrossRef]
- Liu, G.L.; Zhang, L.C.; Zhang, Q. Spatial and temporal dynamics of land use and its influence on ecosystem service value in Yangtze River Delta. Acta Ecol. Sin. 2014, 34, 3311–3319. [Google Scholar] [CrossRef]
- Liu, Y.B.; Hou, X.Y.; Li, X.W. Assessing and predicting changes in ecosystem service values based on landuse/cover change in the Bohai rim coastal zone. Ecol. Indic. 2020, 111, 106004. [Google Scholar] [CrossRef]
- Zhang, Y.S.; Wu, D.T.; Lyu, Y.X. A review on the impact of land use/land cover change on ecosystem services from a spatial scale perspective. J. Nat. Resour. 2020, 35, 1172–1189. [Google Scholar] [CrossRef]
- Clerici, N.; Cote-Navarro, F.; Escobedo, F.J.; Rubiano, K.; Villegas, J.C. Spatio-temporal and cumulative effects of land use-land cover and climate change on two ecosystem services in the colombian andes. Sci. Total Environ. 2019, 685, 1181–1192. [Google Scholar] [CrossRef] [PubMed]
- Gomes, E.; Inácio, M.; Bogdzevi, K.; Kalinauskas, M.; Karnauskait, D.; Pereira, P. Future land-use changes and its impacts on terrestrial ecosystem services: A review. Sci. Total Environ. 2021, 781, 146716. [Google Scholar] [CrossRef] [PubMed]
- Cao, Y.; Kong, L.; Zhang, L.; Ouyang, Z. The balance between economic development and ecosystem service value in the process of land urbanization: A case study of China’s land urbanization from 2000 to 2015. Land Use Policy 2021, 108, 105536. [Google Scholar] [CrossRef]
- Richards, D.R.; Belcher, R.N.; Carrasco, L.R.; Edwards, P.J.; Fatichi, S.; Hamel, P.; Masoudi, M.; McDonnell, M.J.; Peleg, N.; Stanley, M.C. Global variation in contributions to human well-being from urban vegetation ecosystem services. One Earth 2022, 5, 522–533. [Google Scholar] [CrossRef]
- Jokar Arsanjani, M.; Helbich, M.; Kainz, W. Integration of logistic regression, Markov chain and cellular automata models to simulate urban expansion. Int. J. Appl. Earth Obs. Geoinf. 2013, 21, 265–275. [Google Scholar] [CrossRef]
- Liao, G.; He, P.; Gao, X.; Lin, Z.; Huang, C.; Zhou, W.; Deng, O.; Xu, C.; Deng, L. Land use optimization of rural production–living–ecological space at different scales based on the BP-ANN and CLUE-S models. Ecol. Indic. 2022, 137, 6876. [Google Scholar] [CrossRef]
- Nasiakou, S.; Vrahnakis, M.; Chouvardas, D.; Mamanis, G.; Kleftoyanni, V. Land use changes for investments in silvoarable agriculture projected by the CLUE-S spatio-temporal model. Land 2022, 11, 598. [Google Scholar] [CrossRef]
- Liu, X.; Liang, X.; Li, X.; Xu, X.; Ou, J.; Chen, Y.; Li, S.; Wang, S.; Pei, F. A future land use simulation model (FLUS) for simulating multiple land use scenarios by coupling human and natural effects. Landsc. Urban Plan. 2017, 168, 94–116. [Google Scholar] [CrossRef]
- Wang, X.D.; Yao, Y.; Ren, S.L.; Shi, X. A coupled FLUS and markov approach to simulate the spatial pattern of land use in rapidly developing cities. J. Geo-Inf. Sci. 2022, 24, 100–113. [Google Scholar] [CrossRef]
- Liu, M.; Xiong, Y.; Zhang, A. Multi-scale telecoupling effects of land use change on ecosystem services in urban agglomerations—A case study in the middle reaches of Yangtze River urban agglomerations. J. Clean. Prod. 2023, 415, 137878. [Google Scholar] [CrossRef]
- Lin, Q.; Luo, G.P.; Chen, X. Review of land-use model. Prog. Geogr. 2005, 24, 79–87. [Google Scholar]
- Zhang, Y.M.; Zhao, S.D.; Verburg, P.H. CLUE-S CLUE-S and its application for simulating temporal and spatial change of land use in Naiman Banner. J. Nat. Resour. 2003, 18, 310–318. [Google Scholar]
- Ren, J. Scenario Simulation of Regional Land Use Change Based on CLUE-S Model—A Case Study of Jizhou District. Master’s Thesis, Tianjin University of Technology, Tianjin, China, 2021. [Google Scholar] [CrossRef]
- Xie, H.L.; Liu, L.M.; Li, B.; Zhang, X. Spatial auto-correlation analysis of multi-scale land- use changes: A case study in Ongniud Banner, Inner Mongolia. Acta Geogr. Sin. 2006, 61, 389–400. [Google Scholar]
- Zhang, J.D.; Mei, Z.X.; Lv, J.H.; Chen, J. Simulating multiple land use scenarios based on the FLUS model considering spatial auto-correlation. J. Geo-Inf. Sci. 2020, 22, 531–542. [Google Scholar] [CrossRef]
- Tan, X.H.; Feng, W.L.; Xu, W.X.; Li, L.; Niu, X. Application and comparison of FLUS and PLUS model on land use simulation in the Nianchu river basin. Plateau Sci. Res. 2024, 8, 34–45. [Google Scholar] [CrossRef]
- Liu, F.L.; Yang, R.Y. Evolution of land use patterns in national central cities and its impact on ecosystem service values: A case study of Wuhan city. Int. Soil Water Conserv. Res. 2021, 28, 177–183. [Google Scholar] [CrossRef]
- Yang, G.Z.; Lyu, K.; Li, F. Spatial and temporal correlation analysis of land use change and ecosystem service value in Nanchang City based on grid scale. China Land Sci. 2022, 36, 121–130. [Google Scholar]
- Costanza, R.; d’Arge, R.; De Groot, R.; Farber, S.; Grasso, M.; Hannon, B.; Limburg, K.; Naeem, S.; O’Neill, R.V.; Paruelo, J.; et al. The value of the world’s ecosystem services and natural capital. Nature 1997, 387, 253–260. [Google Scholar] [CrossRef]
- Kindu, M.; Schneider, T.; Teketay, D. Changes of ecosystem service values in response to land use/land cover dynamics in Munessa-Shashemene landscape of the Ethiopian highlands. Sci. Total Environ. 2016, 547, 137–147. [Google Scholar] [CrossRef]
- Liang, X.; Guan, Q.F.; Clarke, K.C.; Liu, S.; Wang, B.; Yao, Y. Understanding the drivers of sustainable land expansion using a patchgenerating land use simulation (PLUS) model: A case study in Wuhan, China. Comput. Environ. Urban Syst. 2021, 85, 101569. [Google Scholar] [CrossRef]
- Gao, L.N.; Tao, F.; Liu, R.R.; Wang, Z.; Leng, H.; Zhou, T. Multi-scenario simulation and ecological risk analysis of land use based on the PLUS model: A case study of Nanjing. Sustain. Cities Soc. 2022, 85, 104055. [Google Scholar] [CrossRef]
- Tan, Z.Z.; Chen, Y.Q.; Ding, J.F.; Liu, M.-D.; Wang, H.; Wang, J. Simulation of land use and assessment of ecosystem service value in the eastern coastal cities of Zhejiang Province, China. Chin. J. Appl. Ecol. 2023, 34, 2777–2787. [Google Scholar] [CrossRef]
- Guo, R.; Wu, T.; Wu, X.; Luigi, S.; Wang, Y. Simulation of urban land expansion under ecological constraints in Harbin-Changchun urban agglomeration China. Chin. Geogr. Sci. 2022, 32, 438–455. [Google Scholar] [CrossRef]
- Gao, X.; Yang, L.; Li, C.; Song, Z.; Wang, J. Land use change and ecosystem service value measurement in Baiyangdian Basin under the simulated multiple scenarios. Acta Ecol. Sin. 2021, 41, 7974–7988. [Google Scholar] [CrossRef]
- Cai, S.M.; Wen, Y.Y. Characteristics and driving factors of construction land expansion in Chaoshan Region from 1980 to 2013. Jiangxi Sci. 2022, 1, 40. [Google Scholar]
- Li, C.; Gao, B.B.; Wu, Y.M.; Zheng, K.J.; Wu, Y. Dynamic simulation of landscape ecological risk in mountain towns based on PLUS model. J. Zhejiang AF Univ. 2022, 39, 84–94. [Google Scholar] [CrossRef]
- Yang, S.; Su, H.; Zhao, G. Multi-scenario simulation of urban ecosystem service value based on PLUS model: A case study of Hanzhong city. J. Arid Land Resour. Environ. 2022, 36, 86–95. [Google Scholar] [CrossRef]
- Pu, J.H.; Chen, S.L.; Du, F.Y. Simulation of land use change and response of ecosystem service value of Fuzhou city based on PLUS model. J. Subtrop. Resour. Environ. 2024, 19, 137–146. [Google Scholar] [CrossRef]
- Lou, Y.; Yang, D.; Zhang, P.; Zhang, Y.; Song, M.; Huang, Y.; Jing, W. Multi-scenario simulation of land use changes with ecosystem service value in the Yellow river basin. Land 2022, 11, 992. [Google Scholar] [CrossRef]
- Yao, S.; Li, Y.; Quan, X.; Xu, J. Applying the driver-pressure-state-impact-response model to ecological restoration: A case study of comprehensive zoning and benefit assessment in Zhejiang Province, China. Glob. Ecol. Conserv. 2024, 55, e03222. [Google Scholar] [CrossRef]
- Xie, G.D.; Lu, C.X.; Leng, Y.F.; Zheng, D.U.; Li, S.C. Ecological assets valuation of the Tibetan Plateau. J. Nat. Resour. 2003, 18, 189–196. [Google Scholar] [CrossRef]
- Yao, S.; Li, Y.; Jiang, H.; Wang, X.; Ran, Q.; Ding, X.; Wang, H.; Ding, A. Predicting land use changes under shared socioeconomic pathway–representative concentration pathway scenarios to support sustainable planning in high-density urban areas: A case study of Hangzhou, southeastern China. Buildings 2024, 14, 2165. [Google Scholar] [CrossRef]
- Li, G.; Sun, S.; Fang, C. The varying driving forces of urban expansion in China: Insights from a spatial -temporal analysis. Landsc. Urban Plan. 2018, 174, 63–77. [Google Scholar] [CrossRef]
- Han, Y.H.; Ma, Z.G.; Li, M.X.; Chen, L. Simulation of the Impact of Land Use/Cover Change on Land Surface Process in China from 2001 to 2010. Clim. Environ. Res. 2021, 26, 75–90. [Google Scholar] [CrossRef]
- Zeng, J.; Cui, X.; Chen, W.; Yao, X. Impact of urban expansion on the supply-demand balance of ecosystem services: An analysis of prefecture-level cities in China. Environ. Impact Assess. Rev. 2023, 99, 107003. [Google Scholar] [CrossRef]
- Guo, J.K.; Zhou, H.; Xia, H.B.; Yuan, D.; Zhang, J.S.; He, Z.H. The process and results for water pollution control in Lianjiang river basin. Water Wastewater Eng. 2021, 47, 57–61. [Google Scholar] [CrossRef]
- Shi, X.Y.; Mao, D.H.; Song, K.S.; Xiang, H.; Li, S.; Wang, Z. Effects of landscape changes on water quality: A global meta-analysis. Water Res. 2024, 260, 121946. [Google Scholar] [CrossRef]
- Urban, M.C.; Alberti, M.; De Meester, L.; Zhou, Y.; Verrelli, B.C.; Szulkin, M.; Schmidt, C.; Savage, A.M.; Roberts, P.; Rivkin, L.R.; et al. Interactions between climate change and urbanization will shape the future of biodiversity. Nat. Clim. Change 2024, 14, 436–447. [Google Scholar] [CrossRef]
- Spotswood, E.N.; Beller, E.E.; Grossinger, R.; Grenier, J.L.; Heller, N.E.; Aronson, M.F.J. The biological deserts fallacy: Cities in their landscapes contribute more than we think to regional biodiversity. BioScience 2021, 71, 148–160. [Google Scholar] [CrossRef] [PubMed]
- Lei, J.C.; Wang, S.; Wang, J.M. Effects of land use change on ecosystem services value of Xunwu County. Acta Ecol. Sin. 2019, 39, 3089–3099. [Google Scholar] [CrossRef]
- Chen, J.; Guo, Z.; Xu, S.; Law, R.; Liao, C.; He, W.; Zhang, M. A Bibliometric Analysis of Research on Intangible Cultural Heritage Tourism Using CiteSpace: The Perspective of China. Land 2022, 11, 2298. [Google Scholar] [CrossRef]
- Veisi Nabikandi, B.; Rastkhadiv, A.; Feizizadeh, B.; Gharibi, S.; Gomes, E. A scenario-based framework for evaluating the effectiveness of nature-based solutions in enhancing habitat quality. Geo J. 2025, 90, 55. [Google Scholar] [CrossRef]
- Yao, S.; Huang, G.; Chen, Z. Evaluation of urban flood adaptability based on the InVEST model and GIS: A case study of New York City, USA. Nat. Hazards 2024, 120, 11063–11082. [Google Scholar] [CrossRef]
- Pal, S.; Bauch, C.T.; Anand, M. Coupled social and land use dynamics affect dietary choice and agricultural land use extent. Commun. Earth Environ. 2021, 2, 204. [Google Scholar] [CrossRef]
- Li, Z.; Jiang, W.; Peng, K.; Wang, X.; Deng, Y.; Yin, X.; Ling, Z. Comparative analysis of land use change prediction models for land and fine wetland types: Taking the wetland cities Changshu and Haikou as examples. Landsc. Urban Plan. 2024, 243, 104975. [Google Scholar] [CrossRef]


| Data | Year | Resolution | Source |
|---|---|---|---|
| Land use data | 2000–2020 | 30 m | http://www.resdc.cn/ accessed on 19 September 2024 |
| Population density | 2020 | 1 km | https://hub.worldpop.org/ accessed on 19 September 2024 |
| GDP density | 2020 | 1 km | http://www.resdc.cn/ accessed on 19 September 2024 |
| Night light | 2020 | 500 m | https://www.geodata.cn accessed on 19 September 2024 |
| Roads | 2020 | - | https://www.openstreetmap.org accessed on 19 September 2024 |
| Crops | 2020 | - | https://www.stats.gov.cn accessed on 19 September 2024 |
| Annual average temperature | 2020 | 1 km | http://www.resdc.cn/ accessed on 19 September 2024 |
| Annual precipitation | 2020 | 1 km | http://www.resdc.cn/ accessed on 19 September 2024 |
| NDVI | 2020 | 30 m | http://www.nesdc.org.cn/ accessed on 19 September 2024 |
| DEM | 2020 | 30 m | https://www.gscloud.cn/ accessed on 19 September 2024 |
| Slope | 2020 | 30 m | Retrieved from DEM |
| Cultivated Land | Forest | Grassland | Water | Construction Land | Unused Land | |
|---|---|---|---|---|---|---|
| Weight | 0.7 | 0.4 | 0.3 | 0.2 | 0.9 | 0.1 |
| First Class | Second Class | Farmland | Forest | Grassland | Water | Construction Land | Unused Land |
|---|---|---|---|---|---|---|---|
| Supply service | Food production | 373.50 | 85.35 | 78.87 | 221.40 | 0.00 | 3.38 |
| Raw material production | 82.81 | 196.05 | 116.05 | 123.37 | 0.00 | 10.14 | |
| water supply | −441.10 | 101.40 | 64.22 | 1838.77 | 0.00 | 6.76 | |
| Conditioning service | Gas regulation | 300.83 | 644.75 | 407.87 | 451.24 | 0.00 | 37.18 |
| Climate regulation | 157.17 | 1929.19 | 1078.25 | 995.44 | 0.00 | 33.80 | |
| Waste treatment | 45.63 | 565.32 | 356.04 | 1546.40 | 0.00 | 104.78 | |
| Hydrological regulation | 505.32 | 1262.47 | 789.82 | 21,374.06 | 0.00 | 70.98 | |
| Support Services | soil conservation | 175.77 | 785.03 | 496.87 | 547.58 | 0.00 | 43.94 |
| Maintaining nutrient cycling | 52.39 | 60.00 | 38.31 | 42.25 | 0.00 | 3.38 | |
| Maintain biodiversity | 57.46 | 714.89 | 451.81 | 1761.03 | 0.00 | 40.56 | |
| Cultural services | Provide landscape aesthetics | 25.35 | 313.50 | 199.43 | 1118.81 | 55.18 | 16.90 |
| Total | 9209.27 | 1335.14 | 6657.95 | 4077.53 | 30,020.36 | 55.18 | |
| Land Use Types | ESV (USD) | Coefficient of Sensitivity (CS) | ||||
|---|---|---|---|---|---|---|
| 2000 | 2010 | 2020 | 2000 | 2010 | 2020 | |
| Cultivated land VC + 50% | 8,831,935,855 | 9,244,640,456 | 9,049,879,458 | −0.0194 | −0.0179 | −0.0170 |
| Cultivated land VC − 50% | 8,147,883,233 | 8,584,050,775 | 8,435,450,823 | 0.0210 | 0.0192 | 0.0182 |
| Forestland VC + 50% | 10,643,033,788 | 11,096,687,616 | 10,915,558,708 | −0.1012 | −0.0983 | −0.0995 |
| Forestland VC − 50% | 6,336,785,300 | 6,732,003,615 | 6,569,771,573 | 0.1699 | 0.1621 | 0.1654 |
| Grassland VC + 50% | 8,846,282,820 | 9,251,009,634 | 9,125,196,203 | −0.0201 | −0.0182 | −0.0210 |
| Grassland VC − 50% | 8,133,536,268 | 8,577,681,597 | 8,360,134,078 | 0.0219 | 0.0196 | 0.0229 |
| Water VC + 50% | 9,879,717,185 | 10,518,492,309 | 10,247,131,787 | −0.0703 | −0.0763 | −0.0734 |
| Water VC − 50% | 7,100,101,903 | 7,310,198,922 | 7,238,198,494 | 0.0979 | 0.1097 | 0.1039 |
| Construction land VC + 50% | 8,492,812,453 | 8,917,366,308 | 8,746,296,694 | −0.0002 | −0.0002 | −0.0002 |
| Construction land VC − 50% | 8,486,277,991 | 8,911,324,924 | 8,739,033,588 | 0.0002 | 0.0002 | 0.0002 |
| Unused land VC + 50% | 8,490,629,935 | 8,915,050,179 | 8,746,296,694 | 0.0000 | 0.0000 | −0.0002 |
| Unused land VC − 50% | 8,489,189,153 | 8,913,641,052 | 8,742,069,717 | 0.0000 | 0.0000 | 0.0000 |
| Land Use Type | Area and Proportion | 2000 | 2010 | 2020 |
|---|---|---|---|---|
| Cultivated land | Area (hm2) | 512,345 | 494,772 | 460,198 |
| Proportion (%) | 33.37 | 32.22 | 29.97 | |
| Forest | Area (hm2) | 646,783 | 655,559 | 652,721 |
| Proportion (%) | 42.12 | 42.69 | 42.50 | |
| Grassland | Area (hm2) | 174,799 | 165,131 | 187,629 |
| Proportion (%) | 11.38 | 10.75 | 12.22 | |
| Water | Area (hm2) | 92,591 | 106,871 | 100,230 |
| Proportion (%) | 6.03 | 6.96 | 6.53 | |
| Construction land | Area (hm2) | 105,225 | 109,495 | 131,637 |
| Proportion | 6.85 | 7.13 | 8.57 | |
| Unused land | Area (hm2) | 3875 | 3790 | 3203 |
| Proportion (%) | 0.25 | 0.25 | 0.21 | |
| Total land | Area (hm2) | 1,535,618 | 1,535,618 | 1,535,618 |
| Proportion (%) | 100.00 | 100.00 | 100.00 |
| Area | 2000 | 2010 | 2020 |
|---|---|---|---|
| Shantou | 1,511,702,645 | 1,741,516,777 | 1,449,417,294 |
| Shanwei | 2,760,993,963 | 2,820,500,951 | 2,912,310,738 |
| Chaozhou | 1,748,368,876 | 1,805,847,549 | 1,813,347,851 |
| Jieyang | 2,466,605,188 | 2,544,278,433 | 2,565,461,299 |
| Chaoshan area | 8,487,670,672 | 8,912,143,710 | 8,740,537,182 |
| Land Use Type | Area and Proportion | 2030 Natural Development Scenario | 2030 Urban Development Scenario | 2030 Ecological Conservation Scenario |
|---|---|---|---|---|
| Cultivated land | Area (hm2) | 432,953 | 407,450 | 416,675 |
| Proportion (%) | 28.19 | 26.53 | 27.13 | |
| Forest | Area (hm2) | 650,536 | 648,969 | 651,427 |
| Proportion (%) | 42.36 | 42.26 | 42.42 | |
| Grassland | Area (hm2) | 206,501 | 221,895 | 224,448 |
| Proportion (%) | 13.45 | 14.45 | 14.62 | |
| Water | Area (hm2) | 95,171 | 91,185 | 91,354 |
| Proportion (%) | 6.20 | 5.94 | 5.95 | |
| Construction land | Area (hm2) | 147,695 | 163,682 | 149,275 |
| Proportion (%) | 9.62 | 10.66 | 9.72 | |
| Unused land | Area (hm2) | 2762 | 2437 | 2439 |
| Proportion (%) | 0.18 | 0.16 | 0.16 | |
| Total land | Area (hm2) | 1,535,618 | 1,535,618 | 1,535,618 |
| Proportion (%) | 100.00 | 100.00 | 100.00 |
| Area | 2030 Natural Development Scenario | 2030 Urban Development Scenario | 2030 Ecological Conservation Scenario |
|---|---|---|---|
| Shantou | 1,431,982,313 | 1,418,948,025 | 1,427,752,019 |
| Shanwei | 2,849,866,805 | 2,829,028,768 | 2,835,342,938 |
| Chaozhou | 1,802,715,172 | 1,795,285,209 | 1,801,226,039 |
| Jieyang | 2,530,902,918 | 2,509,176,882 | 2,520,264,965 |
| Chaoshan area | 8,615,467,208 | 8,552,438,884 | 8,584,585,961 |
| X1 | X2 | X3 | X4 | X5 | X6 | X7 | X8 | X9 | X10 | X11 | X12 | |
|---|---|---|---|---|---|---|---|---|---|---|---|---|
| Cultivated land | 6.54% | 11.55% | 7.52% | 7.04% | 7.39% | 6.12% | 9.58% | 9.67% | 8.35% | 4.75% | 9.00% | 12.49% |
| Forest | 15.59% | 5.69% | 6.78% | 7.27% | 9.04% | 6.25% | 5.59% | 10.67% | 7.82% | 5.23% | 10.25% | 9.82% |
| Grassland | 4.90% | 11.87% | 8.60% | 4.53% | 5.26% | 3.38% | 9.87% | 13.60% | 9.08% | 5.09% | 11.93% | 11.89% |
| Water | 0.42% | 3.93% | 1.38% | 3.16% | 1.02% | 0.21% | 8.90% | 0.69% | 1.87% | 0.57% | 0.61% | 77.24% |
| Construction land | 6.10% | 7.96% | 5.59% | 5.62% | 12.88% | 14.55% | 4.05% | 9.25% | 6.49% | 3.38% | 7.16% | 16.97% |
| Unused land | 16.88% | 10.13% | 16.40% | 5.54% | 1.48% | 3.80% | 2.18% | 21.20% | 5.97% | 1.22% | 13.69% | 1.51% |
Disclaimer/Publisher’s Note: The statements, opinions and data contained in all publications are solely those of the individual author(s) and contributor(s) and not of MDPI and/or the editor(s). MDPI and/or the editor(s) disclaim responsibility for any injury to people or property resulting from any ideas, methods, instructions or products referred to in the content. |
© 2025 by the authors. Published by MDPI on behalf of the International Society for Photogrammetry and Remote Sensing. Licensee MDPI, Basel, Switzerland. This article is an open access article distributed under the terms and conditions of the Creative Commons Attribution (CC BY) license (https://creativecommons.org/licenses/by/4.0/).
Share and Cite
Xiong, Z.; Yao, S.; Liu, H.; Yu, L. Multi-Scenario Forecasting of Land Use and Ecosystem Service Values in Coastal Regions: A Case Study of the Chaoshan Area, China. ISPRS Int. J. Geo-Inf. 2025, 14, 160. https://doi.org/10.3390/ijgi14040160
Xiong Z, Yao S, Liu H, Yu L. Multi-Scenario Forecasting of Land Use and Ecosystem Service Values in Coastal Regions: A Case Study of the Chaoshan Area, China. ISPRS International Journal of Geo-Information. 2025; 14(4):160. https://doi.org/10.3390/ijgi14040160
Chicago/Turabian StyleXiong, Zili, Song Yao, Hongmei Liu, and Liang Yu. 2025. "Multi-Scenario Forecasting of Land Use and Ecosystem Service Values in Coastal Regions: A Case Study of the Chaoshan Area, China" ISPRS International Journal of Geo-Information 14, no. 4: 160. https://doi.org/10.3390/ijgi14040160
APA StyleXiong, Z., Yao, S., Liu, H., & Yu, L. (2025). Multi-Scenario Forecasting of Land Use and Ecosystem Service Values in Coastal Regions: A Case Study of the Chaoshan Area, China. ISPRS International Journal of Geo-Information, 14(4), 160. https://doi.org/10.3390/ijgi14040160