Article

A Model of Building Changes to Support Comparative Studies and Open Discussions on Densification

by
Bénédicte Bucher
1,2,*,
Juste Raimbault
1,2,
Mouhamadou Ndim
1,2,
Ana-Maria Raimond
1,2,
Julien Perret
1,2,
Sebastian Dembski
3 and
Mathias Jehling
4
1
Ecole Nationale des Sciences Géographiques, University Gustave Eiffel, F-77420 Champs sur Marne, France
2
LASTIG, Institut National de l’Information Géographique et Forestière, F-94160 Saint-Mandé, France
3
Department of Geography and Planning, University of Liverpool, Liverpool L69 7ZT, UK
4
Research Group Urban Structure and Policy (USP), Leibniz-Institute of Ecological Urban and Regional Development (IOER), 01217 Dresden, Germany
*
Author to whom correspondence should be addressed.
ISPRS Int. J. Geo-Inf. 2025, 14(4), 155; https://doi.org/10.3390/ijgi14040155
Submission received: 6 January 2025 / Revised: 6 March 2025 / Accepted: 26 March 2025 / Published: 2 April 2025

Abstract

:
Densification is a widely used concept, but there is a lack of terminology and tools to facilitate discussions among data scientists, policy makers and citizens. This paper proposes a model of building changes based on building surveys undertaken in past decades to connect discussions about densification with shared evidence. A specific challenge is to process buildings in city regions and areas in a replicable way across different building data sources. Another challenge is to manage the quality of the representation, i.e., how well the maps represent changes to buildings and how well they can support discussions of densification. Building data and real buildings are different things that sometimes change in an independent way. Addressing these factors requires different forms of expertise, i.e., expertise about the realities depicted in the areas studied, about local data sources, and about advanced matching tools and state-of-the-art densification concepts. We present a collaborative dashboard through which to engage corresponding experts in the production of building change maps and the clarification of related concepts.

1. Introduction

As the demand for housing in European metropolitan areas continues to increase, densification, defined as a net increase in the dwellings within pre-existing built-up areas [1], is expected to mitigate urban sprawl and promote sustainable transport [2]. Empirical evidence on densification processes implies that there is immense densification potential in relatively low-density suburban areas across Europe. Examples from Germany show that densification happens to a high extent in core cities [3], while the potential in suburban areas remains unused, leading to concerns about the environmental implications in already dense urban contexts, as well as ongoing land take in the suburban realm. Research on the social effects of densification also reveals that it can provide housing for various socio-economic groups through more affordable housing and fostering socially mixed neighbourhoods [4,5]. However, land policies targeting urban densification can have undesirable side effects, such as insecure neighbourhoods and low social mixing [4] or a loss of urban green space [6], and there is potential resistance to such densification. Against this backdrop, a deeper understanding of densification is urgently required to deliver its value while avoiding its pitfalls. Unfortunately, there is a lack of specific shared vocabulary and tools with which to facilitate discussions between the different actors whose perspectives are fundamental in the process of densification: landowners, developers, planning authorities, policy makers, citizens, and scientists from different disciplines.
The motivation of the work presented in this paper is to make up for the shortfall mentioned hereinabove and to contribute to innovative tools to support comparative studies and open discussions related to densification. We take inspiration from the field of archaeology, where observations are scarce and where scientists design models as pieces of machinery to relate their theories to observations [7]. We argue that models are also needed to relate the many ideas about densification to observations. Buildings observed through the lens of building surveys performed on different dates, together with the changes detected between these dates (e.g., a building’s construction, demolition or elevation, which we will call building changes), associated with explicit conceptual discussions, can become shared models and form the backbone of a densification discussion tool.
Firstly, buildings and their changes relate to densification. Buildings are explicitly referred to in planning and in regulation. Different building changes—such as demolition, the development of vacant (for instance, “brownfield”) land, replacement development, raising the height of a building, infill development, and changes in the use of existing buildings through subdivisions and conversions—may impact housing stock [4,8]. They can provide a high level of spatial disaggregation of densification, which is needed to observe and study local variations in the contrasting benefits and disbenefits of denser urban environments [8].
Secondly, building data relate to observations, as they are produced during a systematic survey process which uses aerial photography or in situ surveys with topometric tools. Yet, the changes detected in building surveys on different dates are not direct observations of the changes that actually happen to real building entities. This relationship must be established and documented so that the changes in surveyed buildings can be used to observe, indirectly, the changes that happen to real building entities in a systematic way.
Lastly, while abstract concepts of suburbs, densification, and intensification are prone to ambiguities and may require expertise to be interpreted, topographic maps that include individual topographic features like buildings or land parcels are part of our common-sense experience [9] and can be shared between all of the actors needed in the densification debate, ranging from inhabitants to scientists, provided that they are used to explain the densification concepts used in these studies and discussions.
A core challenge in developing such a model of building changes is the production of comparable building change maps over past decades. On one hand, land cover data which are natively adapted to diachronic analyses do not distinguish between individual buildings. On the other hand, data that distinguish between individual buildings are not natively adapted to diachronic analyses. They do not include systematic stable items through time, such as, for example, the fixed grid cells in grid models or the fixed partitions of space in land cover models. Instead, they rely on abstract representations of buildings, which are called features [10] and are not necessarily stable over time. Throughout the rest of this paper, the term feature is used to refer to a building data object, while the term entity is used to refer to a building in the real world. One reason for the lack of stability of building features is obviously that the reality depicted can change, e.g., a new building can be constructed. Other reasons may be technological or organisational evolutions that impact the way that buildings are represented; for example, a coarse geometry may be replaced with a more detailed shape. The introduction of stable identifiers eases the detection of changes in features, but they were not yet systematically available at the beginning of our observation period. In addition, some building changes like extension or regeneration, as illustrated in Figure 1, cannot be detected through basic operations applied to features and their attributes.
Several research gaps are addressed in this paper. The first concerns the lack of tools with which we can facilitate discussions about densification. Our approach is to propose a model of building changes for city regions based on building surveys performed on different dates, which act as a backbone for such tools. The main related research gap is the lack of a suitable method of detecting changes in building data in areas where a large number of features require automation and where data are not natively adapted to automated diachronic analysis. Another gap is the evaluation of biases induced by the usage of different sources based on scattered documentation of these sources. The final gap is the lack of an ontology with which to describe the different dimensions of densification and relate them to changes in building entities.
This paper presents our theoretical framework through which to achieve such a model of building changes and to evaluate its potential to support densification studies. It is a collaborative and open platform that engages different experts to identify which building data sources can be accessed in relation to the past decade in a specific city of interest; process the data with change detection methods adapted to building specificities; validate and interpret derived building change maps; identify which specific densification questions relate to changes in buildings; and clarify associated concepts. We call it a collaborative building changes dashboard. It is composed of three different elements: (1) a building change conceptual model to articulate collaborations between different experts, (2) a replicable procedure for producing building change maps with a feature-matching algorithm adapted to the specificities of building data, and (3) an open metadata fragments model to manage the quality of the produced maps. This approach was applied to city regions in Germany, France, and the UK over the period 2011–2021, and tested in three specific cities, allowing us to reflect on its suitability.
The remainder of this paper is organised as follows. Section 2 presents a literature and data review. Section 3 develops our proposal, i.e., our materials and methods. Section 4 presents our implementation and first results.

2. Literature Review

Our work takes place in the field of information infrastructures. A theoretical perspective on information infrastructures highlights that these cannot be studied as classical information systems because they are too interconnected; every actor can only shape a part of its infrastructure while others are shaping other parts of the same information infrastructure [11]. The design of a contribution cannot be addressed solely by identifying use cases, standards, and components but must also recognise communities who are shaping these usages and standards. With that in mind, our review covers three areas: building changes in densification studies (Section 2.1), building data fitness for detecting building changes (Section 2.2), and integration approaches to design a building change detection process (Section 2.3).

2.1. Relevance of Building Changes to Densification Studies and Discussions

In this section, building change refers to any physical modification of a building, including its construction and demolition, that can be observed on the ground. Why are building changes relevant to densification studies? Densification refers to two different realities: the spatial process of an increase in density in already dense areas, and public goals and activities to increase the density of the built environment. Population density is the number of individuals, or sometimes more specifically the number of inhabitants, on a given surface; it is often approached through the number of dwellings on a given surface. The planning system regulates density through a wide range of instruments, including land use plans, and planning policy more broadly [12,13]. However, the demographic change in an area can be influenced by a number of factors that are not necessarily the result of policy. Planning policy in particular has very little influence on the occupation of dwellings, although it may assist by creating social infrastructure or certain environments influencing demographic change. Therefore, the more logical choice for measuring densification is evaluating the increase in dwellings per urban area unit, which is directly impacted by changes in the building stock, as explained in the introduction.
The characteristics of areas where building changes occur are important. An increase in dwellings and buildings can constitute both densification and urban expansion [1]. However, densification generally refers to an increase in densities within the existing built-up area as opposed to other territorial units, which would also include expansion, i.e., urban development on previously undeveloped land. While the benefits of densification can clearly be seen in ecological terms with reduced land uptake and more sustainable transport [3], potential conflicts emerge in terms of social sustainability. Densification projects have an impact on housing quality and affordability. As densification projects bring more living space or dwellings into existing urban structures, they come with costs. Remaining urban green with important climatic or recreational value is built upon. Also, densification projects follow different market logics and can change the social composition of neighbourhoods as living space for different socio-economic groups is developed, with implications for the affordability of housing [14]. Hence, urban densification requires a critical debate on its effects on the urban context and on the more specific areas in which it takes place, as stated by [15], which uses the example of “20 min neighbourhoods”.
To study changes in density at the urban level, building-centric approaches are interesting. These also allow us to circumvent non-accessible data on small-scale population changes in many countries, e.g., Germany [3]. Building-based approaches are also considered to enable comparative approaches to analysis across countries with different strategies on urban development [16]. The capacity to compare past situations of buildings with current situations is crucial in studying densification [ibid]. By definition, densification only takes place within existing urban structures. Hence, a boundary must be defined that discriminates between urban development through densification and urban expansion. To do so, existing urban land use needs to be defined and operationalised geospatially [6]. For better comparability, it is furthermore necessary to study these densification dynamics within comparable urban areas; the concept of functional urban areas (“urban regions”) provides a relevant scale for such comparability across countries [17].
To summarise, different kinds of change attached to buildings are of potential interest within the study of densification, ranging from large-scale urban redevelopment projects to changes in individual buildings. Among these changes, elevation of existing buildings is considered of great interest as it increases the number of housing units without sealing more soil in dense areas. The absence of building construction can thus be meaningful, as plots that remain vacant within existing urban areas could reveal obstacles to densification or explicit strategies through which to protect urban green areas. The characteristics of the plots and blocks where these changes happen are important in assessing their ecological impact. Mapping such changes could benefit from the systematic mapping of changes in buildings within functional urban areas, with the possibility of zooming in to the granular level of the building and the dwelling units within the building.

2.2. Available Building Data Sources in the Three Countries and Recent Decades

In this section, unless specified otherwise, the expression building change refers to modification of building features that can be detected in building data. Different building data are available for city regions in Germany, France, and the UK. We briefly analyse their availability over the past decade, their fitness for detecting changes in building features, and access to documentation through which to interpret these changes as changes in surveyed building entities or changes in surveying procedure.
While public and scientific data products dedicated to monitoring land change exist across Europe, e.g., Corine Land Cover, Global Human Settlement Layer, or Urban Atlas [18], they consider urban land use or land cover at resolutions ranging from 1 × 1 km size cells to 250 × 250 m. The data are aggregated into either a grid or vector format and vary in temporal resolutions. On a building level, the EUBUCCO project targets the provision of a pan-European database of all buildings with properties relevant to high-resolution urban sustainability studies through integration of available (governmental) sources by scientists as well as quality documentation [19]. However, the data so far only consider the initial year of construction of a current building and no historic information.
OpenStreetMap (OSM) [20] covers, in theory, the required spatial and temporal scopes. It is a collaborative project aiming to produce a global-scale open database of topographic objects, including building features, which is available in the three countries of interest. Past versions can be queried through the OSM API. However, OSM lacks completeness [21]. For example, OSM building data in Bristol in 2011 present many blank areas as compared to official OS MasterMap® building data for the same area and same year. Moreover, the detection of building change based on OSM building data can be hampered by massive bulk imports coming from open data, as documented by [22] for France. These bulk imports generate changes in building data that do not reflect actual changes in buildings. Diachronic analysis using OSM road network snapshots [23] has been proven instead to measure changes in OSM data than changes in the real-world entities. The OSM model introduces the ‘changeset’ concept, which aggregates all the modifications made by a contributor during a session and can be associated with documentation to describe the reasons behind new edits or to describe the source of externally used data. This information is too rarely filled in by OSM contributors. Therefore, additional sources of information or local knowledge are necessary to differentiate between updates (i.e., edits representing real-world changes) and upgrades (i.e., changes representing error corrections or improvements made to completeness).
To conclude the brief analysis above, there is not a single building product covering all city regions with the required guarantee of completeness for the past decades that is needed to detect building changes. We need to investigate the availability of building data fitted for change detection even if they come from different sources for the different city regions. Since the early 2000s, many countries in Europe have provided national datasets on building stock. There exist official topographic building products issued by the Legally Mandated Authority (LMA) for each of the three countries with a guarantee of completeness over the past decades: ATKIS® “Amtliche Hausumringe” in Germany [24], BDTopo® in France [25], and OS MasterMap® for England, Scotland, and Wales [26]. ATKIS® and OS MasterMap® are freely available for research provided an agreement is signed. BDTopo® is available under an open licence.
As mentioned in the introduction, changes in building surveys of a given city region between two dates can be challenging to detect as building data are not natively adapted to diachronic analysis. Stable identifiers can be used to identify homologous features between two dates and facilitate change detection. They are available in OS MasterMap® data and have been introduced progressively in France and Germany but were lacking in 2011. In France, specific identifier management policies exist for production purposes but are not publicly available and require expertise to use. For example, in some cases, changes in a building like splitting can lead to new identifiers, which are not always connected to the former identifier of the building. Attributes have been introduced to record changes, either at the level of published data or in internal production databases, but their value still is complex to interpret. OS MasterMap® has a native log of building changes with two specific attributes to document changes: “changedate” and “reasonforchange”. Yet, the value of the attribute “reasonforchange” is text and does not differentiate between feature corrections or entity change.
Interpreting detected changes in building features as changes of the surveyed reality necessitates information about possible changes in the survey procedure. In France, the decision to merge cadastral data with topographic data led to a change of the selection threshold and to a change in the modelling of buildings; adjacent building entities that were formerly represented by one single building feature in BDTopo® are currently represented by separate features (see Figure 2 on the left). This led to many individual changes in building data that should not be interpreted as real building changes. In the UK, there was a change related to annexes, which were displayed in more detail and often identified as new entities in 2021 (see Figure 2, on the right). Furthermore, variations in survey procedures across countries can bias the comparison, as shown in [16]. In France, the minimum surface for a building to be selected and modelled into BDTopo® was, until 2015, 50 m2 in urban areas and 25 m2 in rural areas. In the UK, buildings that exceed 8 m2 (12 m2 in private gardens), irrespective of their use, are represented. To compare maps that have been produced with these different products, the reader must be aware of these differences, which cannot be identified in the data. Documentation of topographic products is useful for identifying these differences. This documentation consists of different documents and metadata published on the mapping agency’s portal, sometimes in the local language only.
To summarise this brief analysis of building data sources that can feed a building change model, the necessity of data completeness for the past decades in cities and regions of interest as well as the necessity of accessing documentation of survey procedures led us to select the three national building data sources. Detected building change data will need to be enriched with additional data to model changes that are not visible on topographic surveys.

2.3. Methods and Tools for Producing Comparable Building Change Data and Maps

The production of comparable building change maps based on different topographic building data is hindered by the fact that building data refer to data products, in our case BDTopo®, OS MasterMap® and ATKIS®, that vary across time and across countries. Relevant methods and tools from the literature are analysed by considering three more specific sub-tasks for this production.

2.3.1. Discovering Relevant Building Data Sources

In this paper, we aim to identify data sources and assess their fitness for a specific application. The detection of building changes in city regions has been addressed in the literature through the definition of specific information infrastructures for data sharing and reuse.
Geographical metadata standards, adapted to the specificities of geographical data, have been designed to develop Spatial Data Infrastructures (SDIs), where users can discover, compare, and select geographical datasets from different providers [27,28]. The European Union has developed an SDI called INSPIRE to share and reuse datasets provided by legally mandated authorities in member states that are relevant to environmental policies [29], including buildings. A user can search the INSPIRE geoportal to discover which authoritative source provides building data in each member state and to access standard metadata for these products. A limitation of these approaches is that some information necessary to analyse the relevance of a discovered dataset is either not provided or provided in a too heterogeneous form to be used by catalogues [30]. Analysing the fitness of a dataset for an advanced usage like deriving changes necessitates different metadata, standard or not, structured or not (e.g., a textual description of the data product) that are broadly referred to as quality metadata. Geographic quality metadata are provider-oriented [31] and not easy to access. These data are organised in two dimensions [32]; their internal quality is how well the data represent reality, while external quality is the fitness for use of the data, assuming their internal quality is perfect. The internal quality of topographic building data is documented through three categories of information. The first category is the scope of the product, i.e., what categories of building entities will be represented, which individuals from these categories will be selected, and how they will be represented. These factors are detailed in a textual document and in product metadata like the spatial coverage, the feature catalogue and the data schema. The second category is a set of criteria measuring the gap between the produced data and the scope, like completeness, accuracy, and consistency. This gap is difficult to measure for the “data patchwork”, where the data are not produced through a homogeneous procedure but rather as an aggregation of sources that have different levels of completeness [33]. The third category is data provenance, which is usually depicted in different files like the product lineage metadata and ad hoc production logs. External quality is described as a set of known usages. The Geospatial User Feedback (GUF) standard aims to extend the current metadata standard to integrate user feedback in quality management frameworks [34]. The authors argue that data users can contribute to the documentation of these data, provided a solution exists to aggregate and organise their feedback statements and attach them to the correct resources.
The Semantic Web community also addresses the challenge of reusing open data on the Web [35]. The core of the Semantic Web is to make the meaning of content explicit using metadata or annotations that are human- and machine-readable; for example, it may annotate a paragraph in a text which refers to the city of Liverpool with a semantic annotation identifying that city. The Resource Description Framework is a core model used to express unambiguous and shareable statements about reality and about conceptual models of reality. The authors of [36] have identified 540 semantic web models used in environmental science to structure or annotate research data to improve their findability, interoperability, and reusability. Knowledge graphs have emerged as a key asset with which to interconnect through semantic statement assets from different providers, for example, based on location [37]. Since the late 2010s, there has been a general trend towards integrating SDI classical technologies with the Semantic Web [38,39]. This integration is useful for publishing the conceptual model that underpins topographic data [40] and for integrating geographic knowledge into Artificial Intelligence approaches [41]. Knowledge graphs can also be used to connect users’ concepts, expressed through common-sense ontologies, with records describing datasets, i.e., metadata standards which are not user-oriented [42]. Ref [30] prototyped such a knowledge graph by connecting Wikidata and records from three French catalogues and defined a semantic similarity measure to match a user query with the closest records and to cluster these records [30].

2.3.2. Detecting Changes in Building Data

The second task is the detection of changes in building features by comparing building data from different dates, even though these data are not natively adapted to diachronic analysis. Vector data-matching methods have been developed to connect features that represent the same real-world entities in datasets for the same area but with different temporal extents, for example street networks in [43], or urban features in [44]. The results of the data-matching algorithm are represented as matching links; one link relies on homologous features from different datasets and has different cardinalities such as 0-1, 1-0, and 1:1 (n:m, where n is the number of features from a dataset matched with m feature from the other dataset). Dissimilarities between data at different temporal dates, revealed by the matching process, are modelled as changes in the global representation, which are useful for studying changes in reality. For example, a 0-1 link indicates that a feature in the latest representation has no homologous feature in the oldest representation, which can indicate that the represented entity has been created in between. A 1-0 link cardinality can be interpreted as showing that an entity no longer exists. A dedicated workflow with which to create a spatio-temporal database from interconnected features representing roads, railways, buildings, and administrative limits across five temporal periods—1957, 1978, 1989, 1999, and 2007—was proposed by [45]. Their study leveraged a classification of changes in the representation into stability, destruction, modification, and two types of restructuring (splitting and fusion). Features’ interconnection relies on stable keys or identifiers when they exist and on data-matching algorithms otherwise. Advanced data-matching algorithms compare geometries as well as other attributes [44,46]. The comparison of geometries may consider locations, shapes and also orientations and topological relationships. Specific geocomputation algorithms are developed to tackle polygons like the Geometric Matching of Areas algorithm (GMoA) [47] or multi-criteria algorithms based on knowledge fusion [46]. Such algorithms have many parameters, and it is important to identify their sensitivity to both these parameters and the data in order to optimise data-matching results [48]. In the domain of times-series satellite data, the development of integration models to detect changes in specific cells and, for example, a change in building density, is also a dynamic domain of research [49].

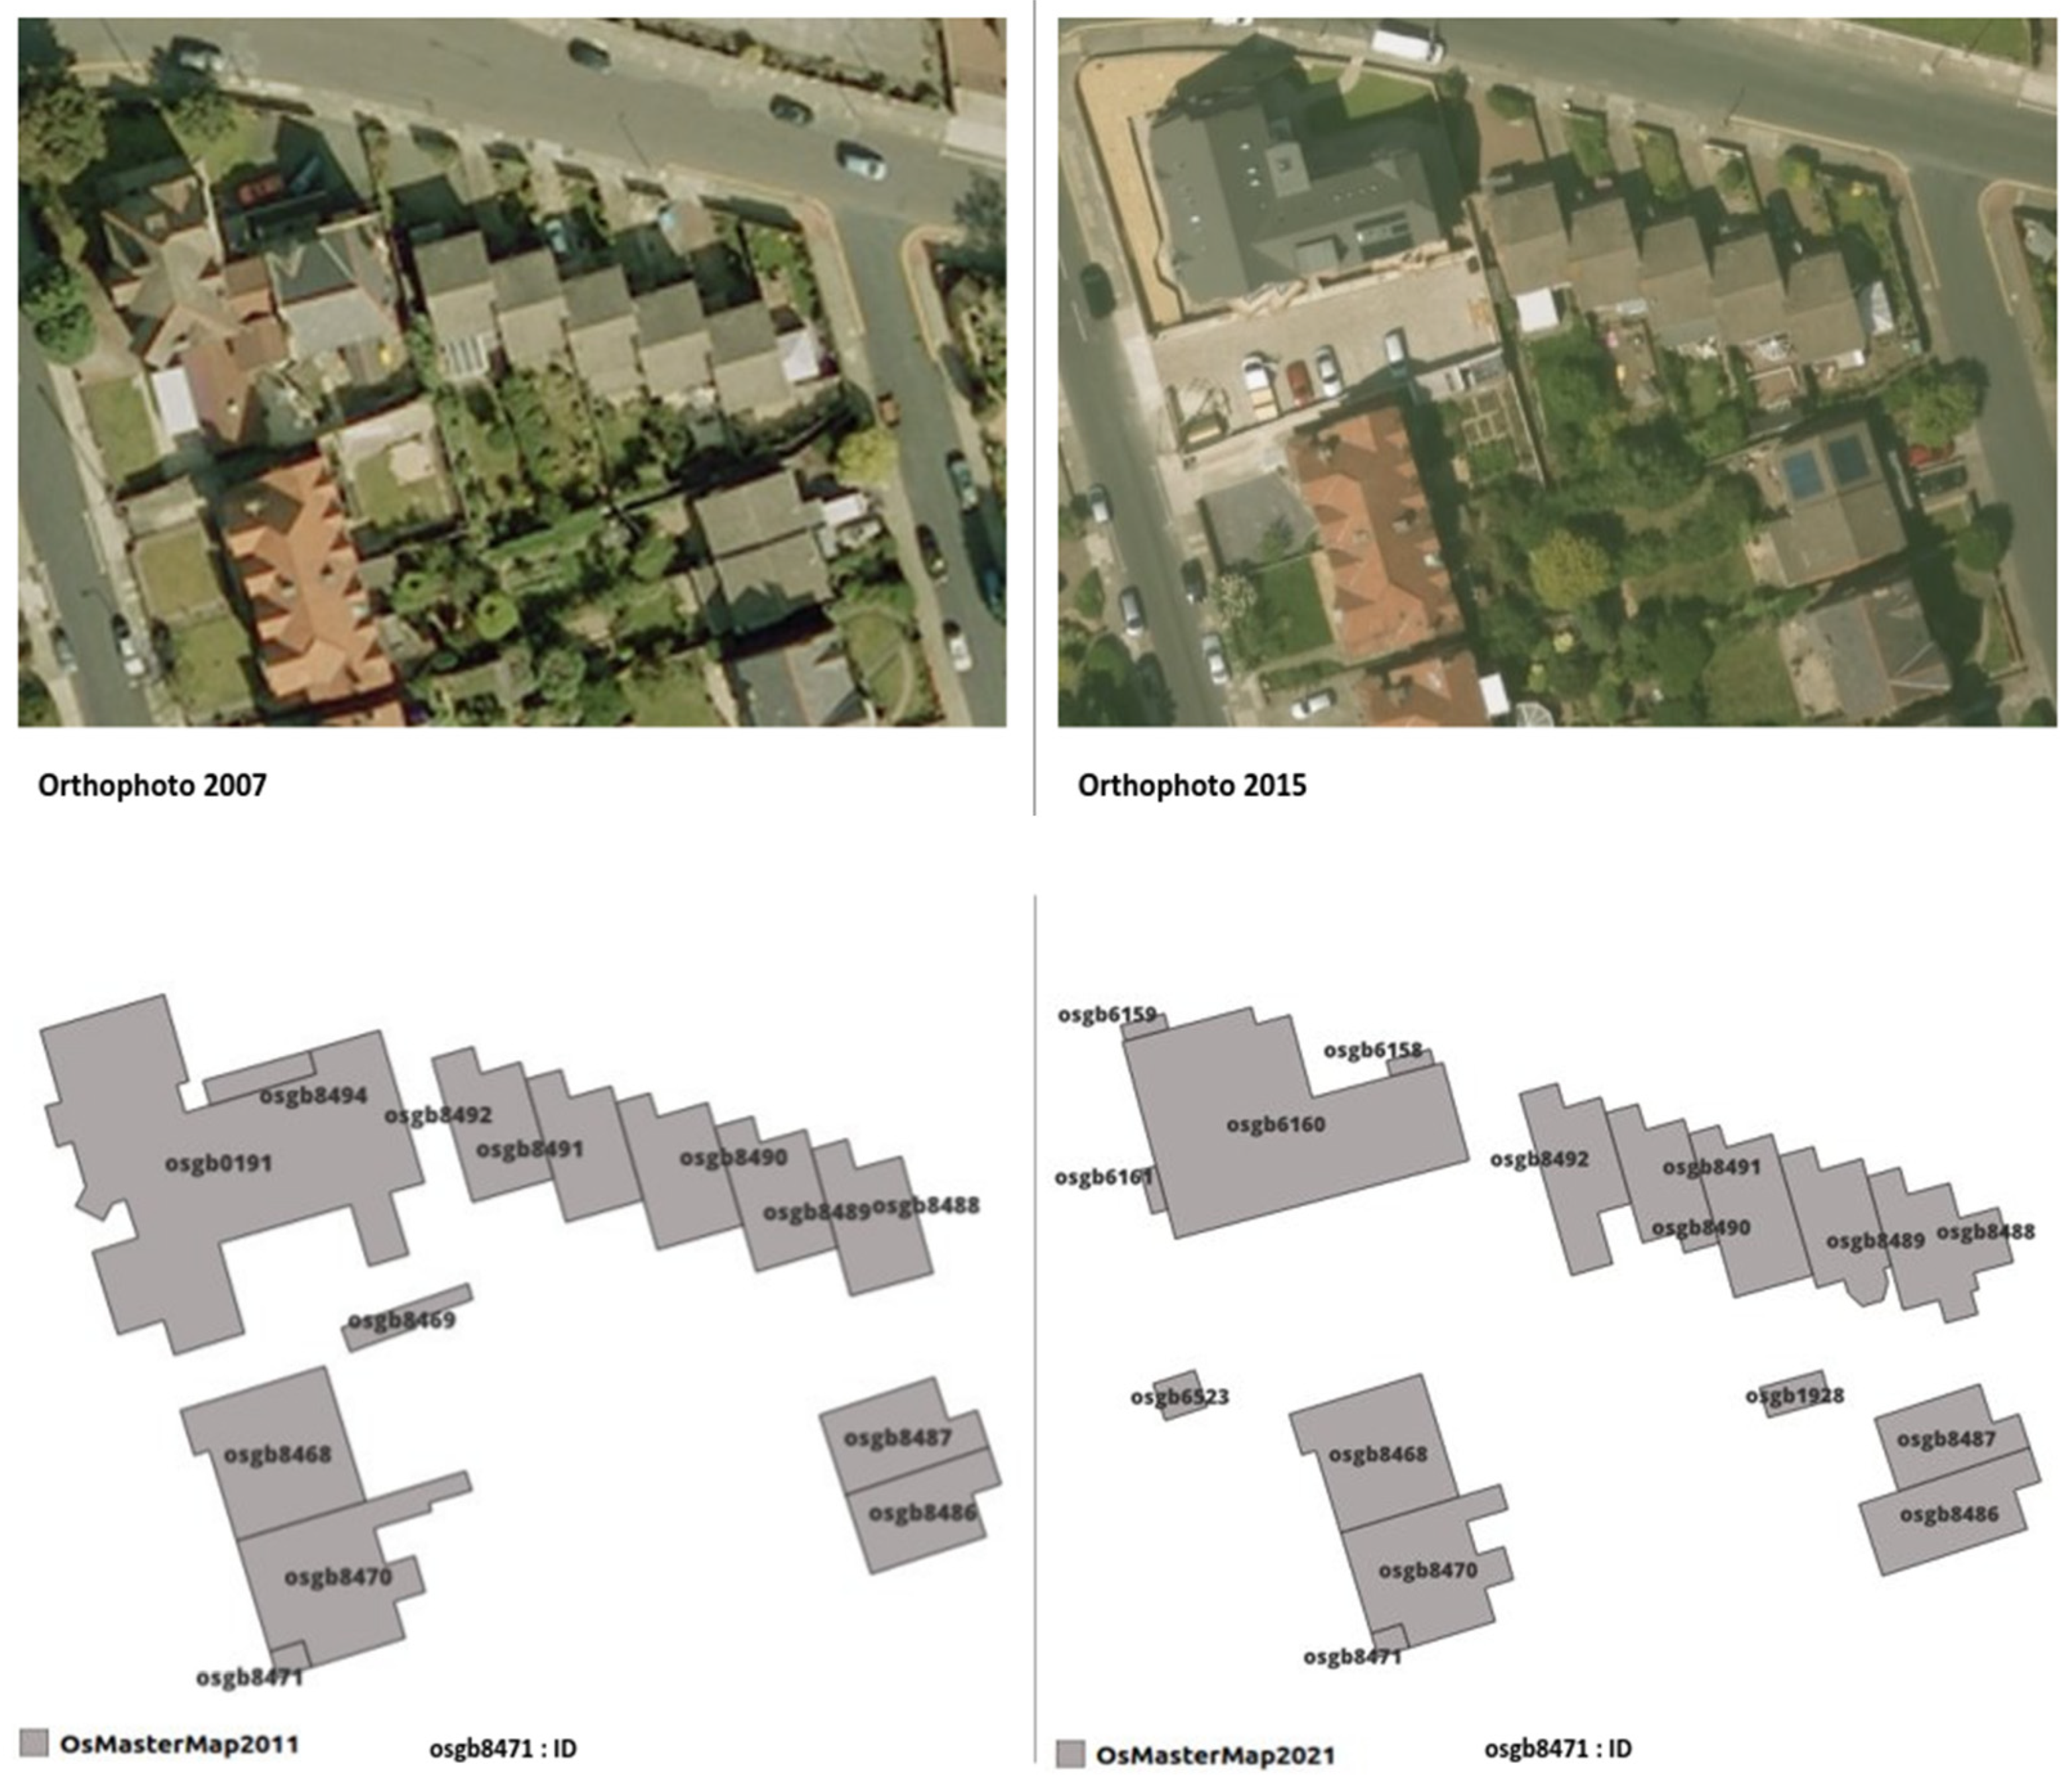
2.3.3. Deriving Comparable Maps About Changes in Real Building Entities

The third task is to interpret the detected changes in building features as changes in building entities, i.e., to identify the semantics of the derived data and what reality they represent. This task should be performed in such a way that these change data are adapted for comparative studies between different countries as well as for open discussion between different actors. This task can benefit from harmonised conceptual models of building changes to avoid ambiguities, as well as harmonised data models of building changes to facilitate the production of maps with the same styles. To our knowledge, there is no conceptual model that represents changes in real-world building entities. The upper ontology called DOLCE aims to clarify categories that underlie natural language and human common sense [50]. This ontology is illustrated in Figure 3 and is relevant in grasping the complexity of densification. DOLCE adopts the key distinction introduced by philosophers between what they call “endurants”, which are wholly present at any time, and “perdurants”, which are composed of parts that take place at different times. Endurants can be physical objects, e.g., buildings, or social objects, e.g., a regulation. Perdurants can be the different states of a physical or social object, like the state “planned” for a building. They can also be events. Events can relate to an achievement, like the demolition of a building, or to a dynamic, like the transport of rubble or an increase in land prices.
Descriptions of states can be found in building data models where attributes’ values correspond to specific states of the properties during the survey, i.e., their geometry, height, and usage. Building data models integrate a specific “state” attribute: the building is either in project or in operation. Ruins usually belong to a different category of features than buildings. A harmonised building data model has been established in Europe to inform European policies, and it was lately revised with attributes relevant to description of changes like dateOfConstruction, dateOfDemolition, and dateOfRenovation [51]. It also includes an elevation attribute to describe the height of the building. The description of states is also tackled in land use and land cover models where some attributes have a parametric value of time to account for seasonal changes [52]. The authors of [53] proposed a taxonomy of changes undergone by spatial features, i.e., objects in geographical databases that correspond to changes in reality.
Explicit models of events have been developed in information and communication communities to better manage messages, social media, and news archives since 1950 [54]. They led to the production of event-centric knowledge graphs by Google in 2012 and further development to representing logical connections between events (ibid). The spatial and temporal characteristics of events are particularly studied, as they can be described in common frameworks like gazetteers and calendars, and they can be used to relate events to one another. The modelling of how things happen in time is particularly studied in the digital humanities, where standard data schemas are adopted to make sources used by historians more interoperable. For example, the Getty thesaurus for names includes a start date and an end date as well as a relationship “parent” between places. The Simple Event Model Ontology also introduces Views and Authorities to encode in the description of an event specific properties that only hold according to a certain authority [55].
To summarise this section, our research assumption is that the production of comparable building change maps as well as the production of shared concepts for discussing building changes and densification can benefit from different methods, which range from data-matching tools to quality metadata and ontologies. Table 1 summarises these tools and methods structured by the identified tasks.

3. Proposal

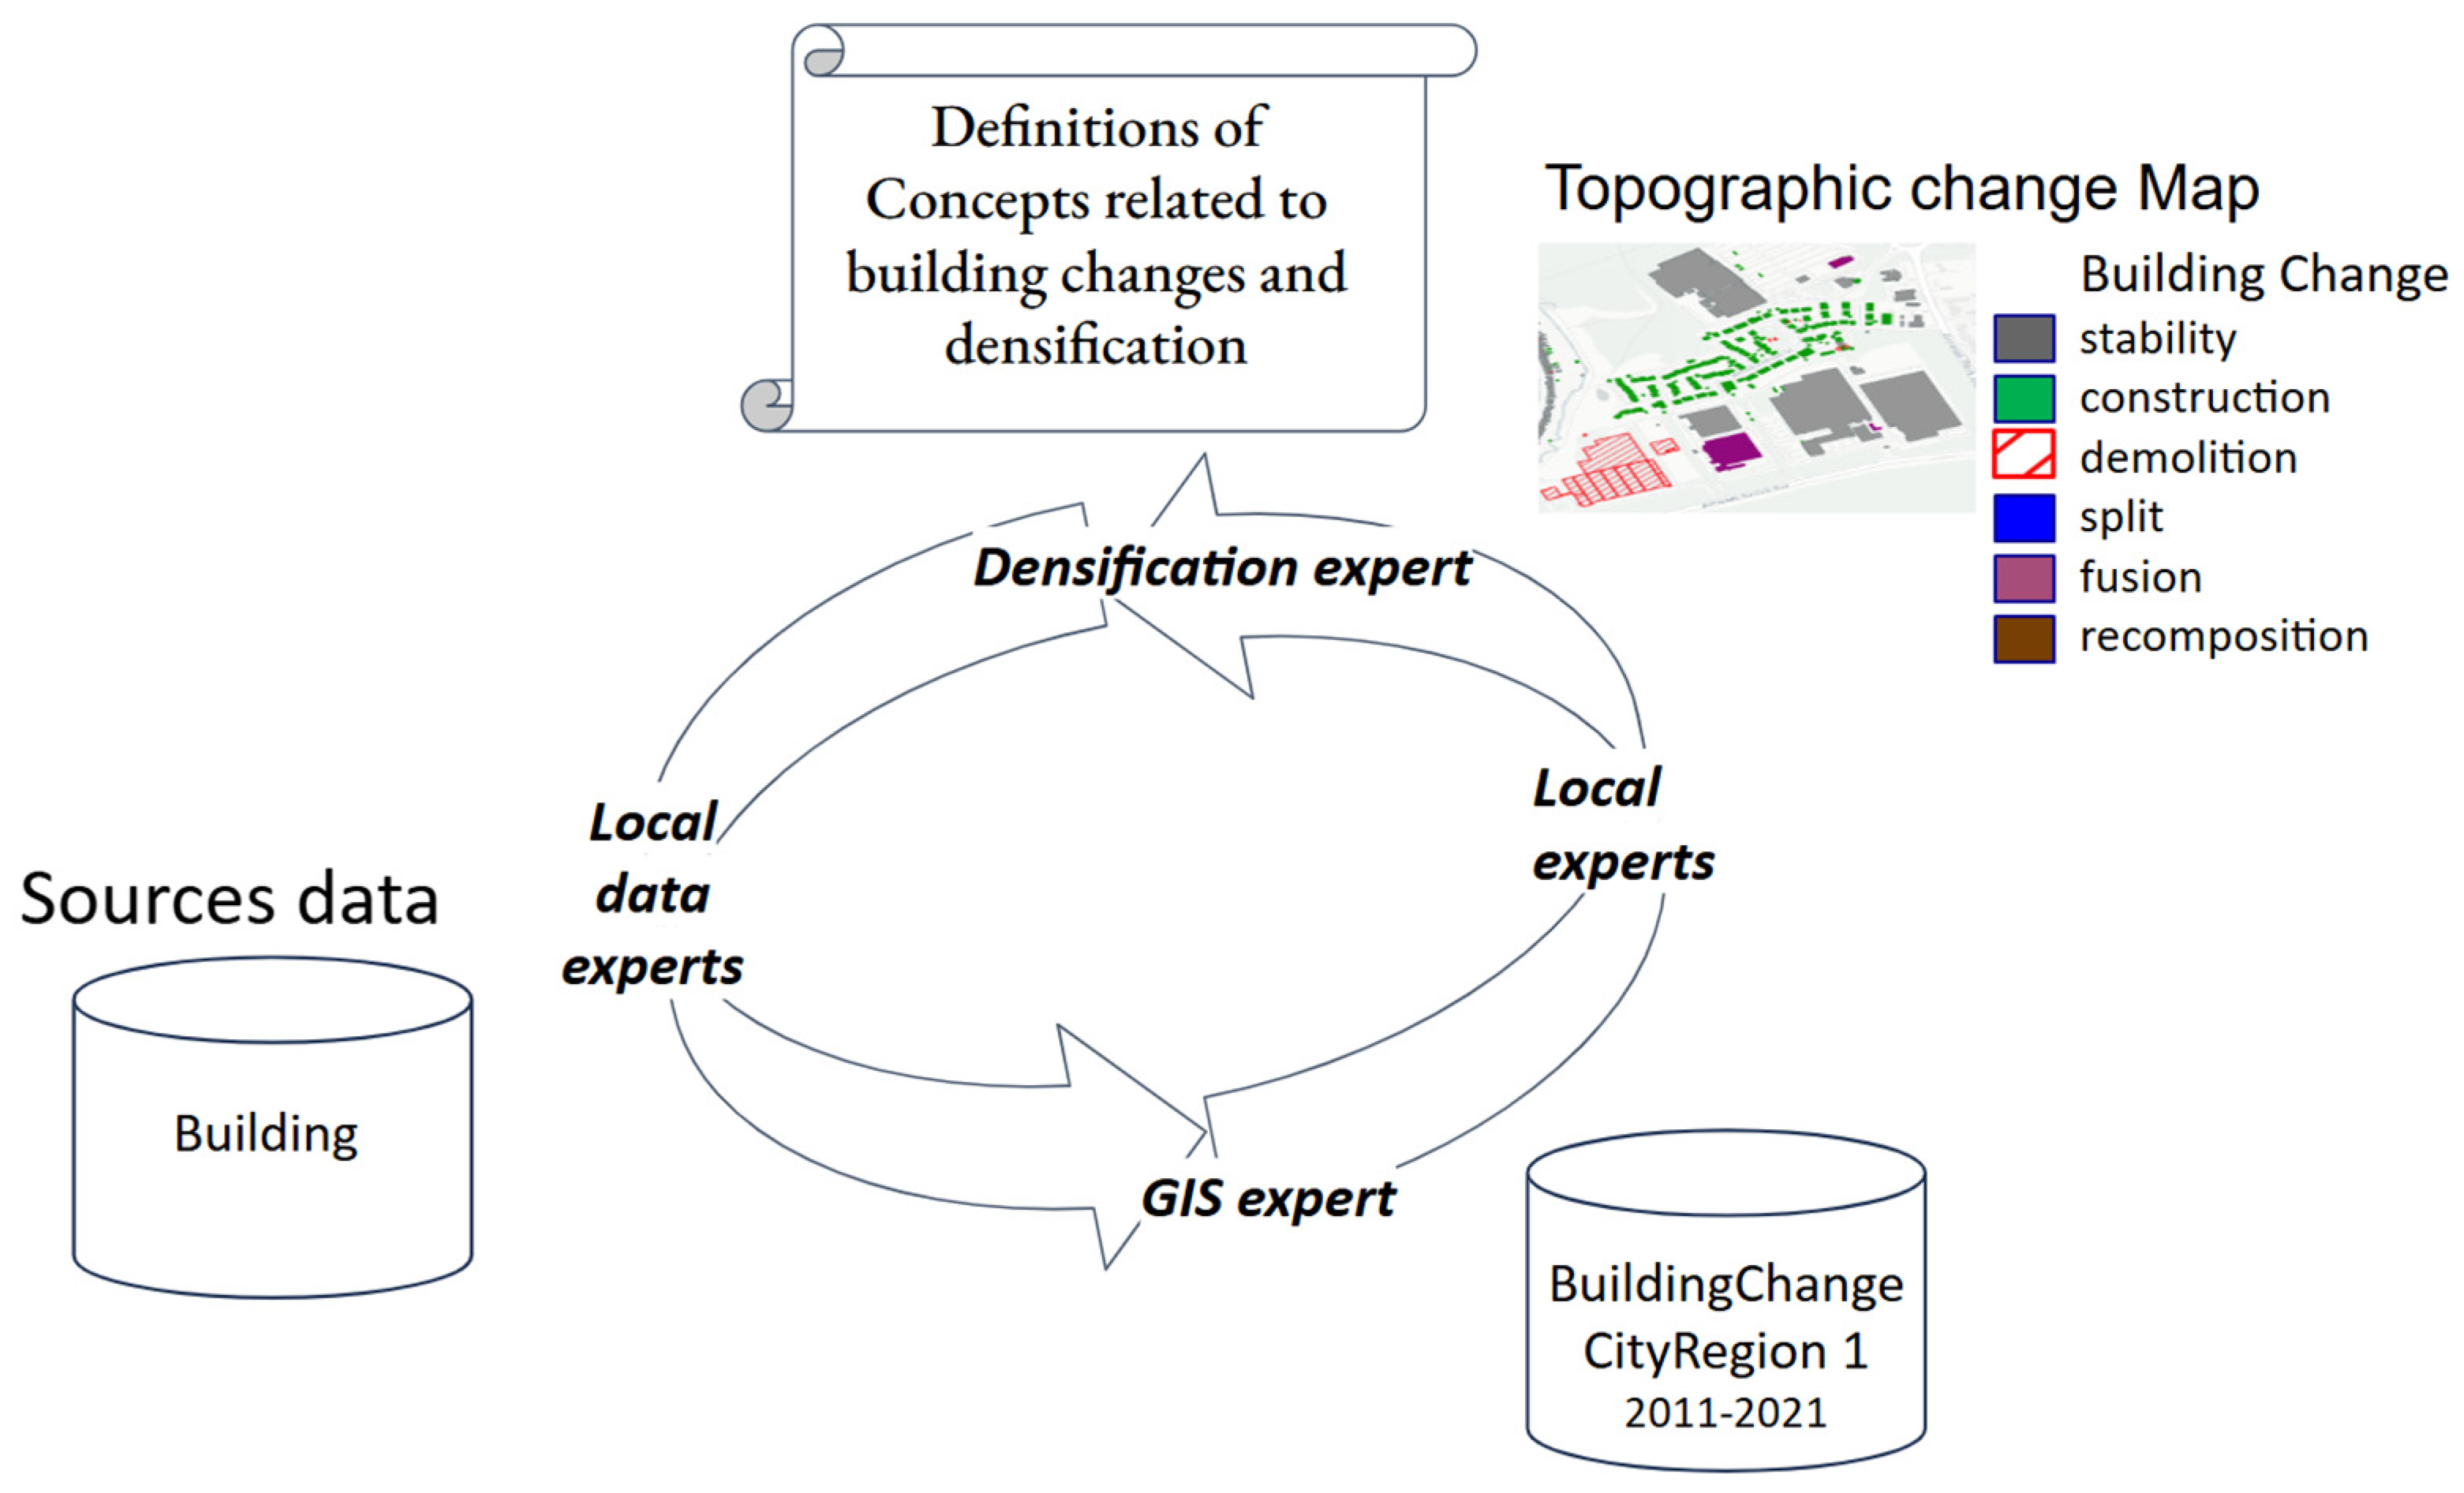
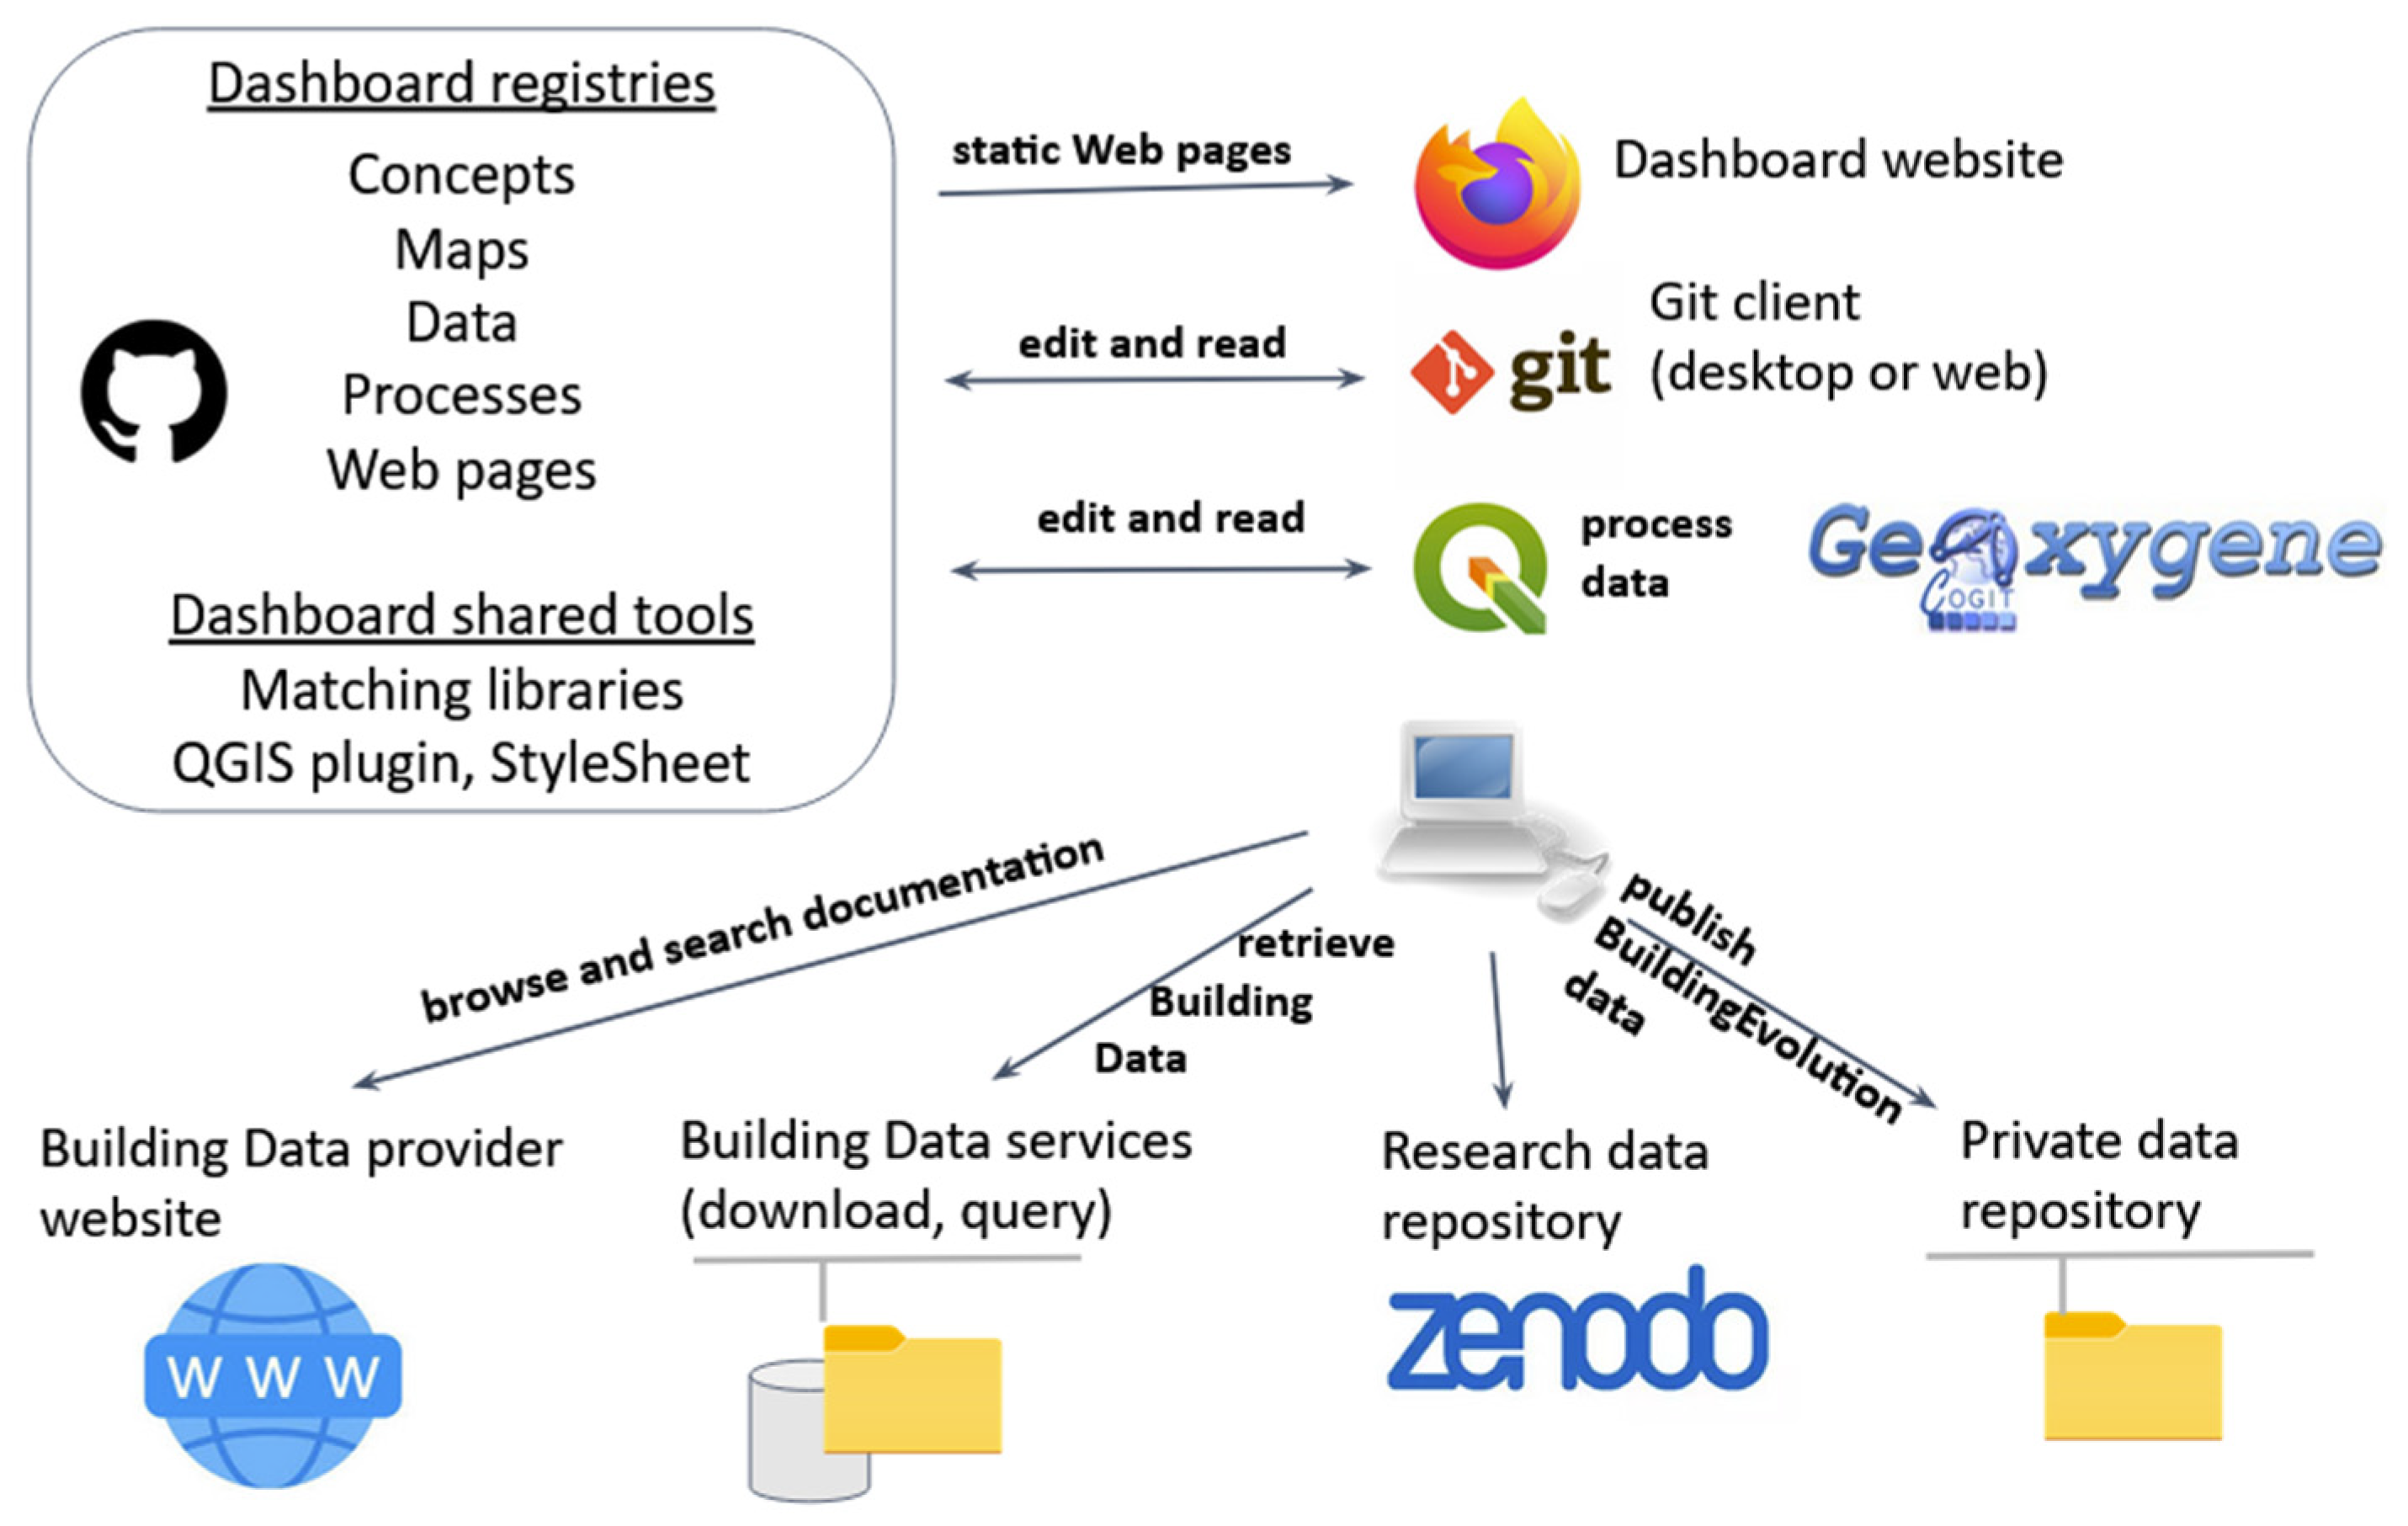
3.1. A Collaborative Dashboard for Producing Building Change Maps and Concepts

Our methodology involves designing a building change model with available national topographic building data from different dates, which we call building data sources. A replicable procedure will derive building change data for city regions, based on the local building data source, by means of an automated matching algorithm and by reading the documentation of the sources to define post-processing rules and remove false positives, i.e., building change data that do not correspond to changes made in reality. Building change maps are used to identify more specific densification questions and concepts that need clarification. This leads to the identification of additional local data to integrate with building change data in order to refine them. This iterative process relies on a proposed collaborative platform, called a building change dashboard. We designed that platform and used it ourselves to produce initial building change maps for three city-based regions of interest. The potential of these initial building change maps to support densification discussions is evaluated empirically.
This section presents the design of the dashboard, its first usage to derive initial building change data and maps, and the empirical assessment of their potential to connect densification discussions with shared observations.
As illustrated in Figure 4, different expertise was needed to design our building change model. Expertise about local data was required to identify building data sources, retrieve their documentation, and analyse this documentation. GIS expertise was necessary to retrieve building data, launch a data-matching algorithm to compare building data for different dates, generate basic building change data, launch post-processing rules, and generate the map. Expertise about local reality was needed to evaluate building change maps, and expertise from the local administration was needed to connect building changes with specific densification decisions at stake. Lastly, general expertise about densification was useful in connecting our discussions with state-of-the-art knowledge, and expertise about quantitative geography and local data was needed to identify new data to integrate with the building change data.
Unlike conventional dashboards, our platform neither hosts data nor delivers on-demand visualisation. It rather serves as a repository for shared tools, procedures, and engineering tips, e.g., how we might recreate the building dataset for a specific area based on the provider’s data services. It also logs design decisions, like abandoning the initial idea to use the suburb as a spatial extent of interest and instead focusing on functional urban areas. These design decisions are expressed through explicit statements written in specific files. This information is often exchanged through mail or oral discussions (or possibly meeting notes) during a research project and are unavailable to newcomers. The dashboard more generally stores important statements about concepts, data, and the process, expressed by contributors, which need to be easily found during other steps or by further users, as illustrated in Figure 5. The data themselves are exchanged on existing infrastructures and are manipulated locally by contributors who can use a GIS.

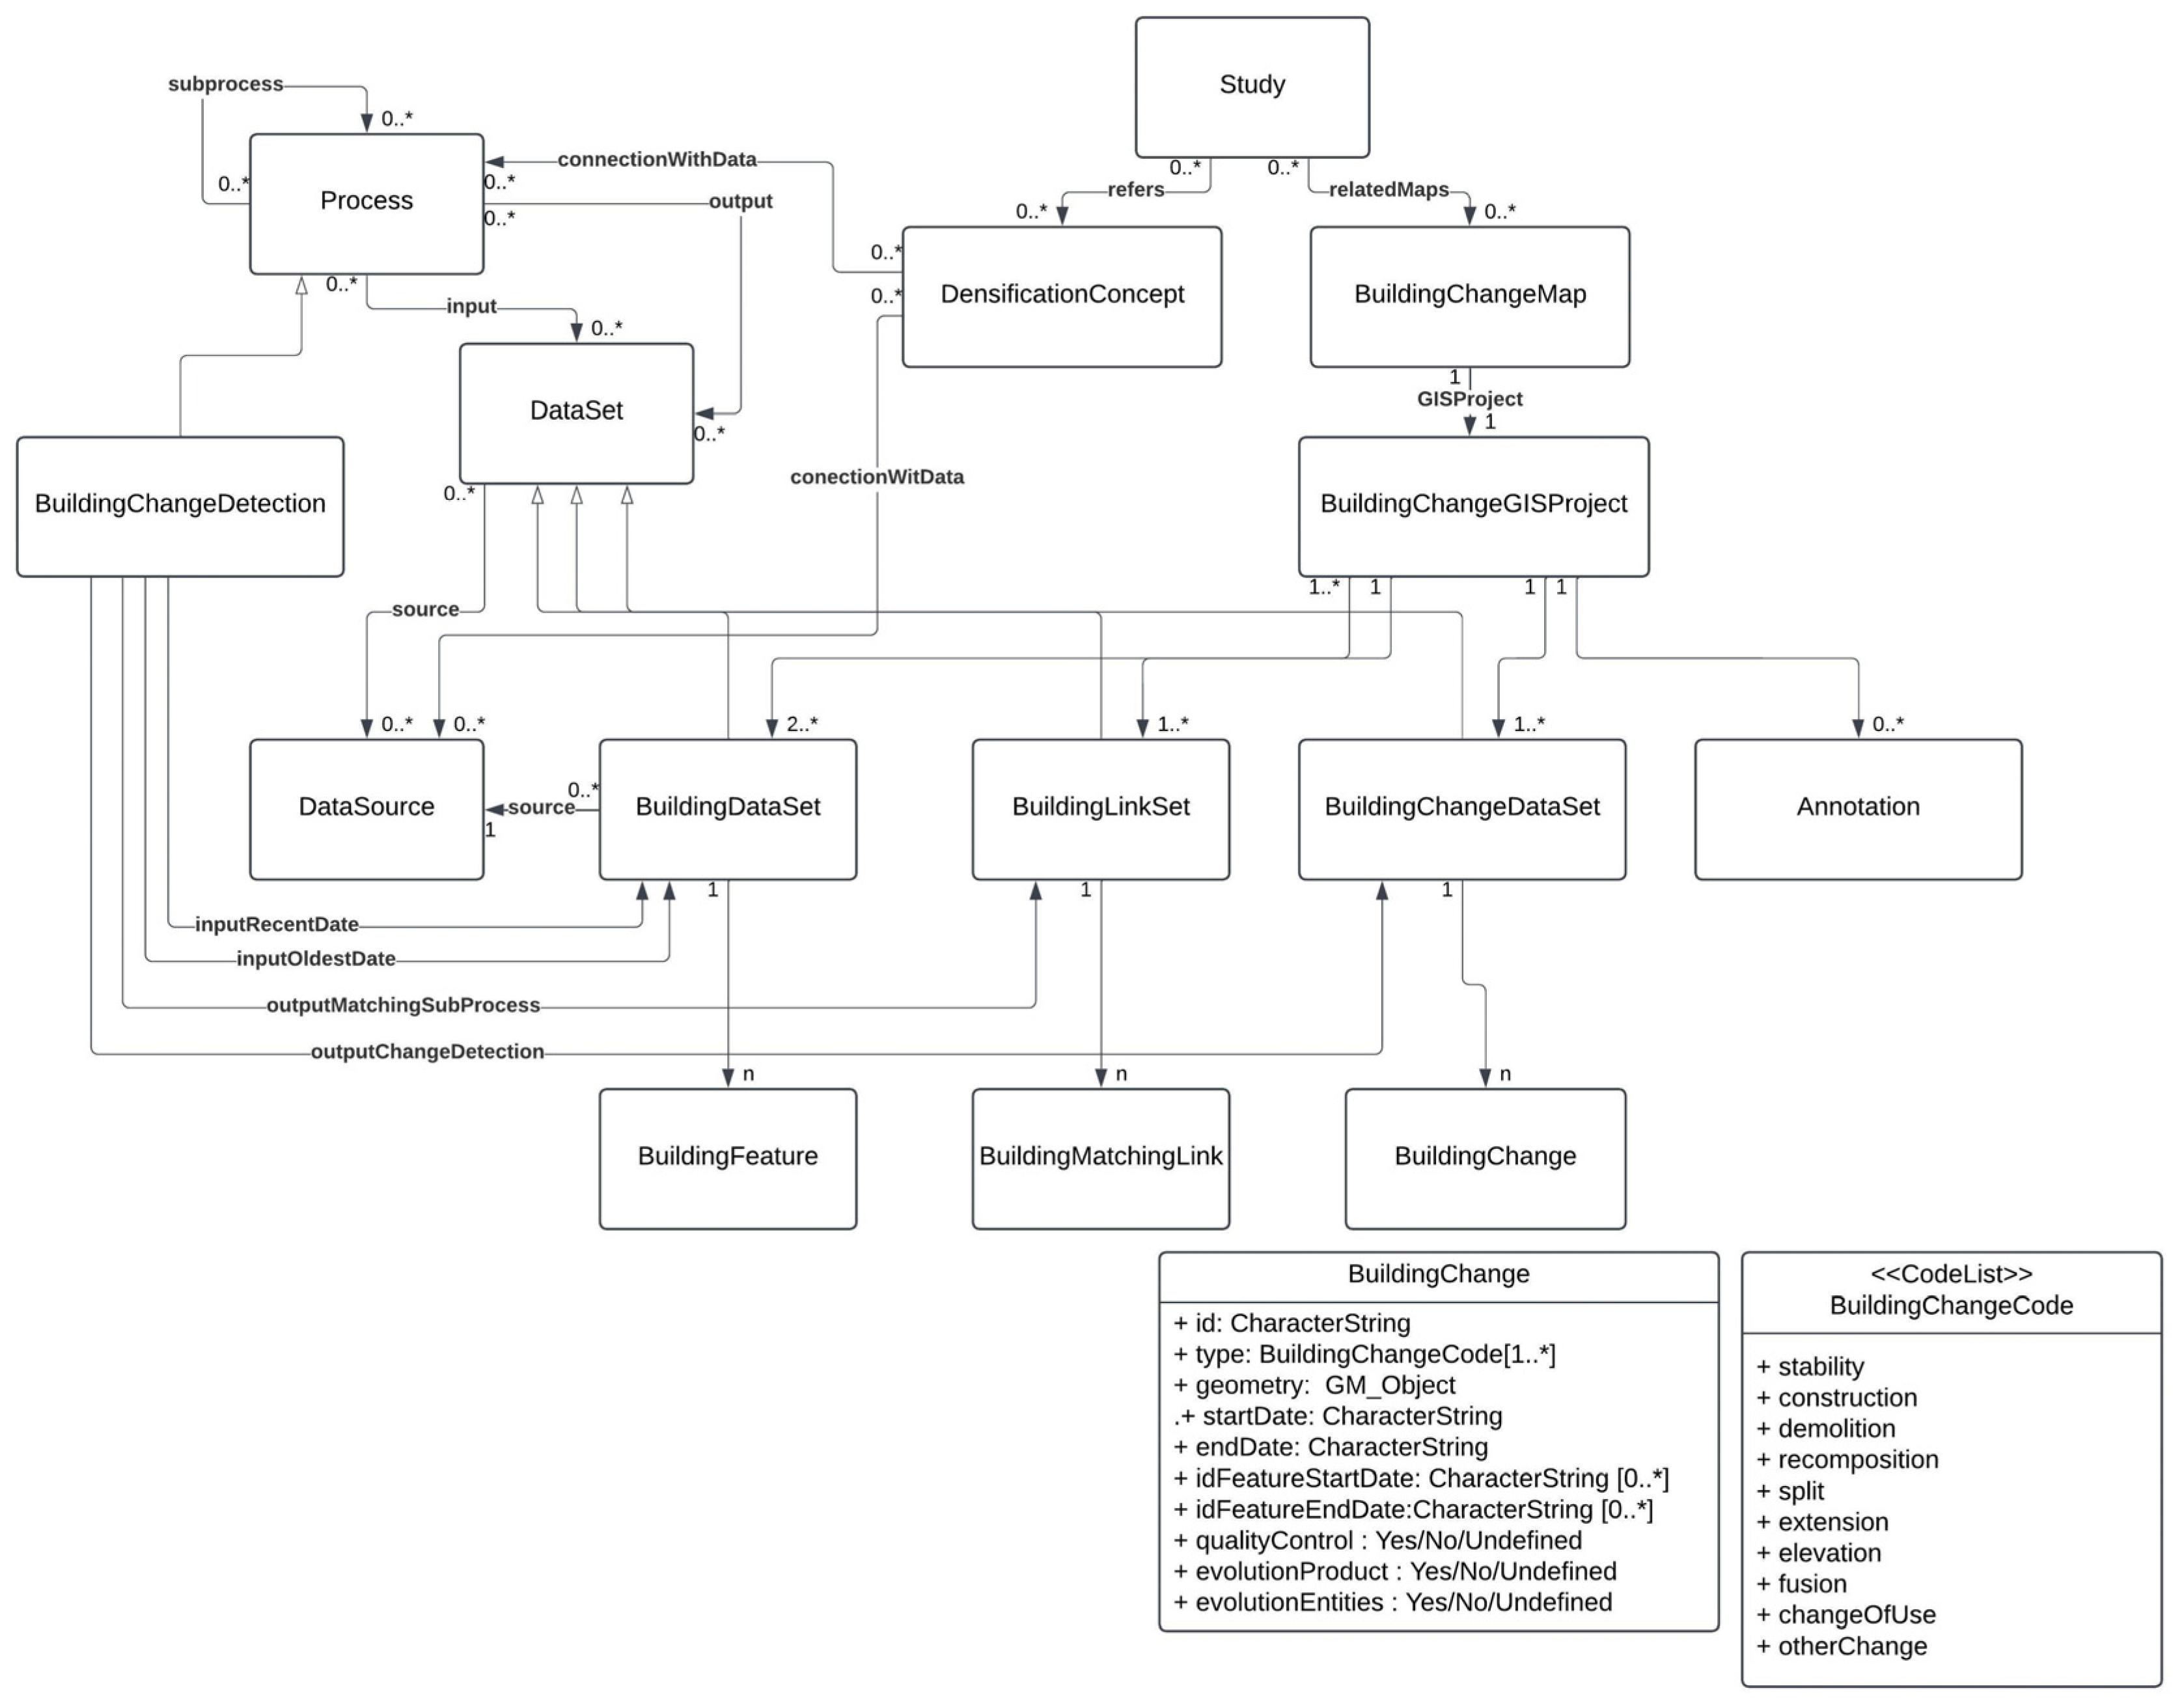
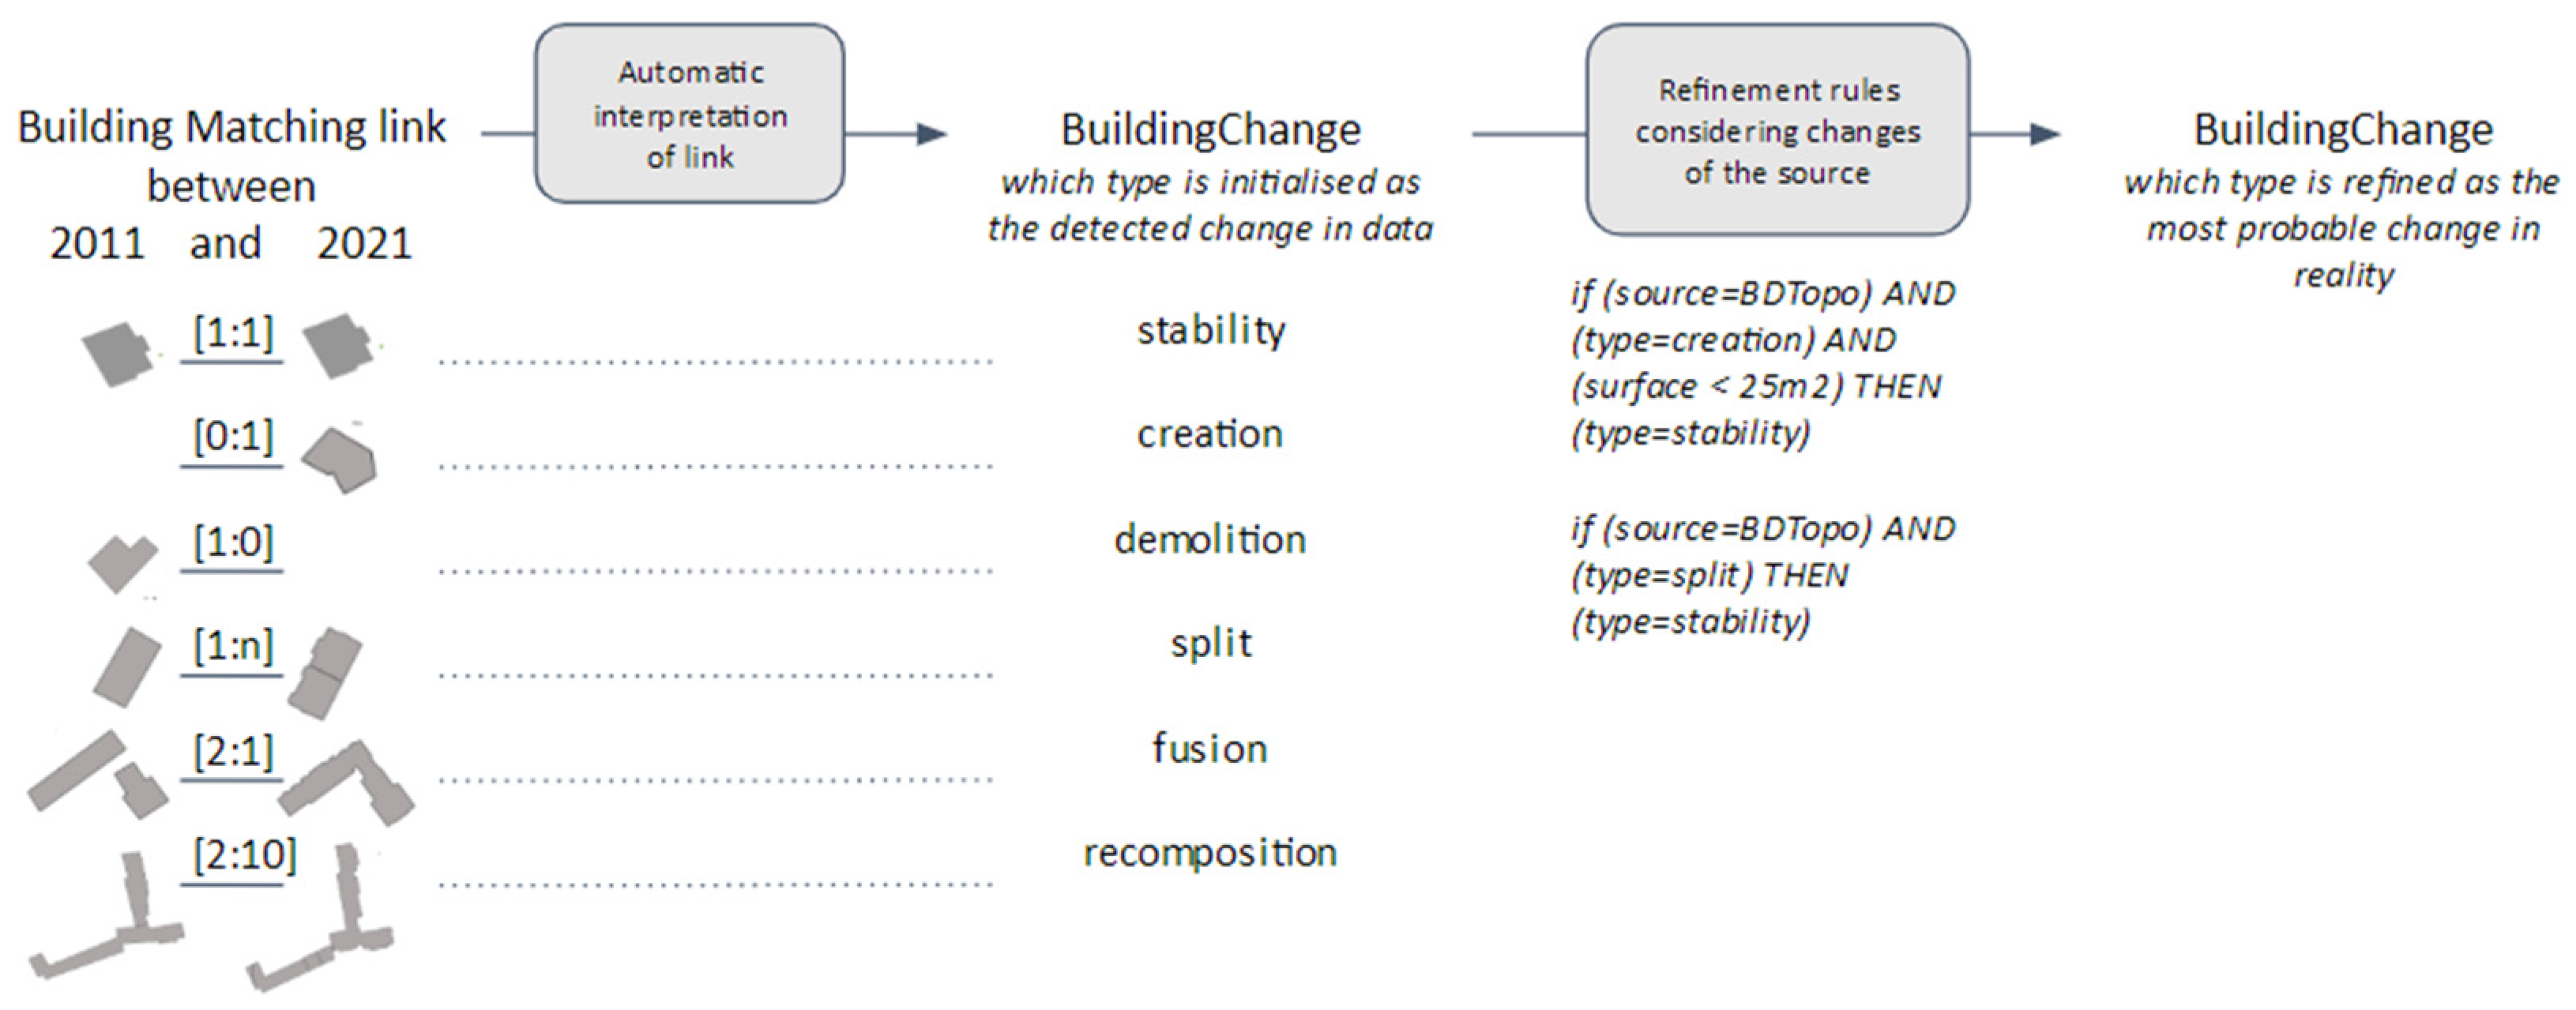
3.2. Core Building Change Conceptual Model

The integration of different contributions into the building change model is based on a common model that articulates the respective perspectives of the experts. This building change conceptual model is illustrated in Figure 6.
Some classes are dedicated to sharing information about building data sources and their documentation and logging the preparation of building datasets. DataSource represents a data product, like BDTopo®, OS MasterMap®, and ATKIS®. BuildingDataSet is a dataset containing building data for a study area and a given date. The class BuildingFeature represents a building object in a dataset.
Other classes concern the computation of change detection. BuildingChange represents both changes in data and in reality. This is a simplification. Building entities, i.e., a real buildings and building features, i.e., building data, are different things, and their changes also are. A BuildingChange instance can represent the demolition of a building entity, or the deletion of a building feature from the database. This simplification has been adopted after some internal tests, for the sake of designing a simple and self-learnable data model. Introducing two different classes for entity changes and feature changes was verbose and not intuitive for local experts who have no specific skills in data product changes. Instead, the class BuildingChange has three attributes used to specify if a change is probably explained by a change in reality (changeEntities), if it is probably linked to a change of the source product (changeProduct), and if it is caused by a quality control factor (qualityControl). The codeList BuildingChangeCode has been defined with terms describing changes in building entities, firstly considering changes that could be detected in topographic data, like recomposition, extension, elevation, and change of use.
A BuildingChangeDataSet is defined on an area and a timespan. It is initialised by matching the BuildingDataSets that correspond to this area of interest and to the initial and final dates of the timespan. The result of the matching process is a LinkSet composed of MatchingLinks which connect BuildingFeatures in the oldest dataset with homologous BuildingFeatures in the latest. For each MatchingLink, a BuildingChange is automatically created in the BuildingChangeDataSet. The values of the different attributes of the BuildingChange are refined through post-processing rules and quality checks. A BuildingChange is associated with a geometry so that it can be displayed in a map. This geometry is defined as follows. If the type of change is ‘disappeared’ then its geometry is the geometry of the BuildingFeature in the oldest dataset; otherwise, its geometry is the geometry of the buildings in the latest dataset.
The next four classes correspond to different tools that can support densification studies and discussions with evidence and disambiguation. The production of these tools is the motivation for our work. The key element is the Concept, which represents important words for the densification discussion, like, for example, the concepts of densification, suburbs, and buildings. The purpose is not to list all concepts but only those that need clarification within the platform and within densification discussions. A Concept can be associated with different more specific meanings in the different countries. It has a property that can express how a concept is connected with data to draw it on a map. The Study class was introduced after a first experimentation to explicitly express the different questions and interests of contributors and researchers and planning practices in a specific city region through a Study object. In the same Study object, other contributors can express suggestions to produce a new BuildingChangeMap or to enrich an existing one to bring evidences to the expressed questions. A BuildingChangeMap is associated with a BuildingChangeGISProject and stores information to generate a layout, like a title, and possibly focuses views on the display as well as the provenance of the data and the related study. A BuildingChangeGISProject contains the set of BuildingChange and Building data with a dedicated StyleSheet and possible additional annotations from expert readers. This addresses the diversity of profiles of densification experts and local experts. Some wish to visualise maps through a GIS software environment to benefit from the serendipitous interactions of a GIS. They can retrieve the BuildingChangeGISProject from an ftp site and display the BuildingChangeMap description from the dashboard, which contains metadata describing the map in the GIS project. Others do not use GIS and prefer to read and edit studies (Study) and maps (Map) prepared with GIS experts.
Finally, the Process class is used to share engineering expertise within the teams. It can describe high-level processes like producing a BuildingChange map for a given area and time period or sub-processes like preparing a BuildingDataSet for a given area and date.

3.3. A Replicable Process for Producing Building Change Data and Maps Based on a Data-Matching Algorithm

The production of the first version of BuildingChange maps relies on a replicable process supported by the dashboard. We apply this process to our three city regions, Liverpool, Strasbourg, and Dortmund.
Local data experts describe on the Datasource register the relevant building data source for a given city region and timespan. They also analyse its documentation and quote specific parts which are relevant to change detection, for example, rules for building selection and modelling, identification policy, and changes in these rules that may have occurred during the timespan and in the city region.
A GIS engineer prepares the building datasets. They retrieve building data from the appropriate sources on the appropriate dates and crop these to the functional urban area. The building data are kept in the format of the original source to avoid any loss of information. In the case of the functional urban area of Strasbourg, which involves France and Germany, four building datasets were prepared: BDTopo® buildings for the French part in 2011 and in 2021, and ATKIS® buildings for the German part in 2011 and in 2021. They created an identifier for the datasets on the registry of datasets with a detailed description of their provenance. They downloaded the building-matching libraries and ran the change detection procedure on the building data.
Data-matching libraries connect building features between both datasets, either using stable identifiers or matching the buildings’ polygonal shapes, implementing the GMoA algorithm [48]. As mentioned in Section 2.3.2, the output of a matching process is a set of matching links. Each link connects a building or a set of buildings with the homologous buildings or a set of buildings in the other dataset, if it exists. A link is represented by the class MatchingLink. The interpretation of its cardinality is modelled through the class BuildingChange, adapted from [45]. Post-processing rules are applied to refine these BuildingChanges as illustrated in Figure 7.
The procedure relies on an implementation of the GMoA matching algorithm that can be downloaded from the dashboard and launched locally from most environments. Each derived BuildingChangeDataSet is registered manually by the GIS engineer on the datasets register with a short description of its provenance and the parameters used by the algorithm. They launch refines rules specific to the source data product in order to identify changes that could be caused by changes in the corresponding source product, i.e., false positives. They download the BuildingChange stylesheet from the dashboard and apply it to display the BuildingChange in a map. They may perform visual controls with the orthoimages to check on the detected false positives. They log all these additional steps on the description of the provenance of the dataset on the register. They can also create an annotation layer in a GIS environment to delineate a smaller area wherein a systematic visual checking of the detected changes has been performed or to add some comments specific to the features. They export the layers in a BuildingchangeGISProject and update the map description to mention it.
A map publisher completes the map by preparing the title and the copyright mentions and adding specific warnings for the reader based on the quality metadata framework depicted in the next section.
Local densification experts visualise the map through the full-resolution BuildingChangeGISProject in order to detect possible bugs or to propose refinements or explanations for the changes. They share their findings either by annotating objects or areas within the BuildingchangeGISProject or by expressing statements that are stored in the map metadata.
This process is designed to be replicable for every city in the UK, France, and Germany and in different teams. The definition of post-processing rules is specific to the data product and necessitates access to the full documentation, possibly with the capacity to contact the production team within the data provider.

3.4. Collaborative Documentation of Quality Metadata

The last component of our approach is a quality management framework through which to evaluate how well the produced maps describe the reality at stake, i.e., changes in real buildings, and how well they support comparative studies. This framework is organised around four traditional categories of quality metadata: the scope of these maps, quality criteria measuring the gaps between maps and the scope, the provenance of these maps, and their usage.
The production of these metadata is not achieved by directly filling in metadata attached to the maps. Every expert engaged in the dashboard process is invited to express pieces of information about the resource they are using or producing; this may include, for example, filling in a data source description or describing the provenance of a dataset. These fragments are later reorganised by the map publisher to be attached to the maps as quality metadata, as detailed below.
The scope of a map is mainly described through the studied concepts and the keys of the map, i.e., mainly the code list of BuildingChange types and the explanation of how these changes are observed and represented using the attributes evolutionProduct and evolutionReality.
The production of quality criteria, like accuracy and completeness, will be addressed only when basic concepts for building changes are clarified.
The provenance of building maps is documented through the description of the building data sources, the building change production process, and the log of the production. The description of the building data sources and their relevance to the dashboard form the first provenance metadata. The description of derived datasets and maps comprises a field where the provider and contributor can write down the steps undertaken to achieve the dataset or the map. For example, they might record the intersection surface threshold adopted by the data-matching algorithm in the provenance of the LinkSet. Provenance can also be attached to the data, like attributes generated by the matching algorithm for each MatchingLink, in order to store values of measures used by the algorithm.

4. Experimentation and First Results

The motivation of this paper was to show the value of a model of BuildingChange as a tool to support densification studies and discussions. A first experimentation was conducted to evaluate our theoretical framework presented in Section 3. It focuses on the following aspects:
-
the production of BuildingChange data and maps;
-
the documentation of quality metadata fragments;
-
the usage of the platform to exchange information relevant for that process between different participants, i.e., the procedure, the source analysis, and the metadata fragments;
-
the potential of these maps to clarify densification concepts and support debates on densification.

4.1. Implementation

The dashboard was implemented as an additional component on top of existing and widely used platforms with which to share research and process data, as illustrated in Figure 8 and detailed below. The core functionality for registries and resource sharing is based on the Git software (https://git-scm.com/) with a Git repository hosted on the GitHub platform, version “Free, Pro, & Team”. The dashboard repository is accessible on https://github.com/subdense/dashboard (accessed on 25 March 2025), where the different registries are stored as md files. Some contributors prefer to share the information with a moderator who, in turn, places them in the Git repository.
The implementation of the BuildingChange detection algorithm was achieved using the Geometric Matching of Areas algorithm implemented on the Java open-source platform, GEOXYGENE [56], coupled with Python script (https://www.python.org/) to interpret the matching links. This change detection script is available at https://github.com/subdense/matching (accessed on 25 March 2025).

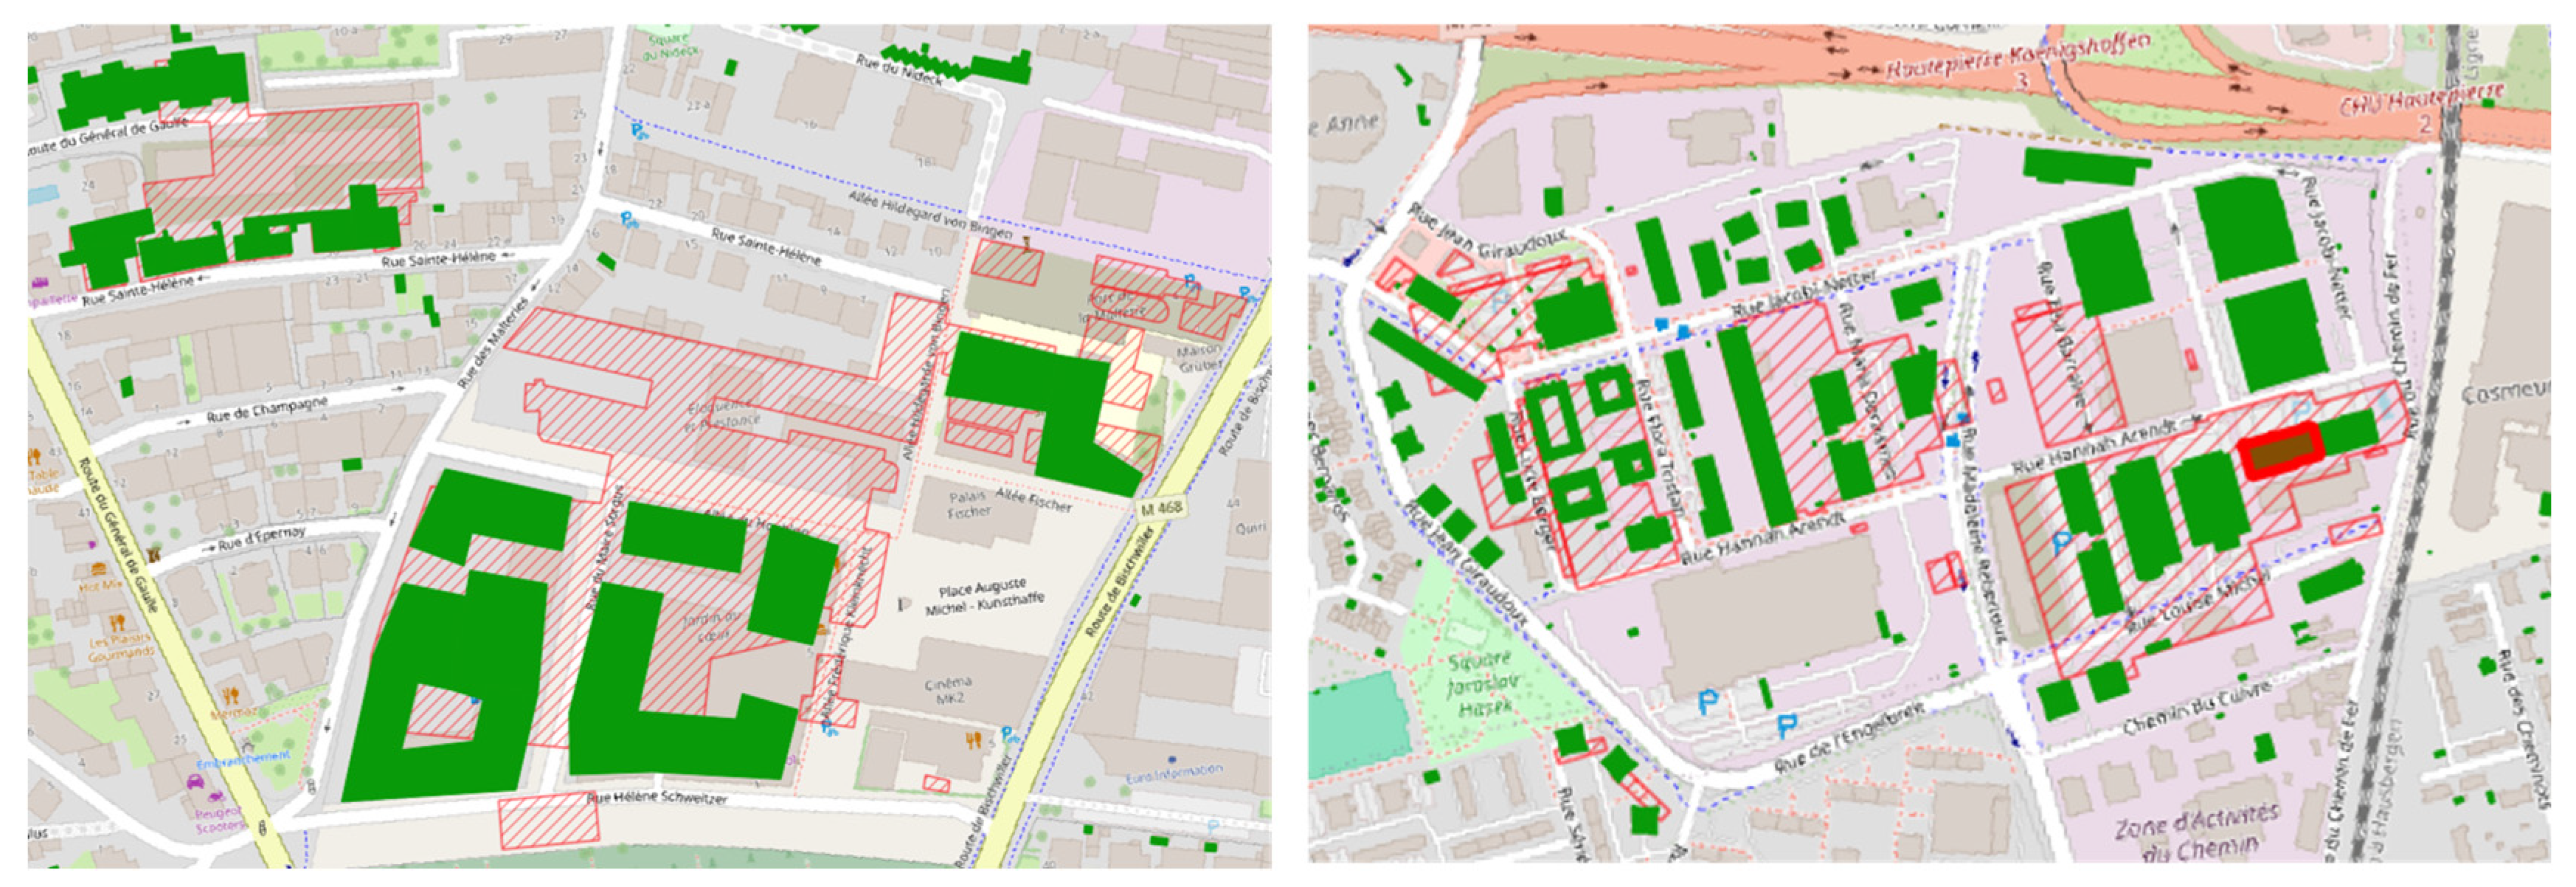
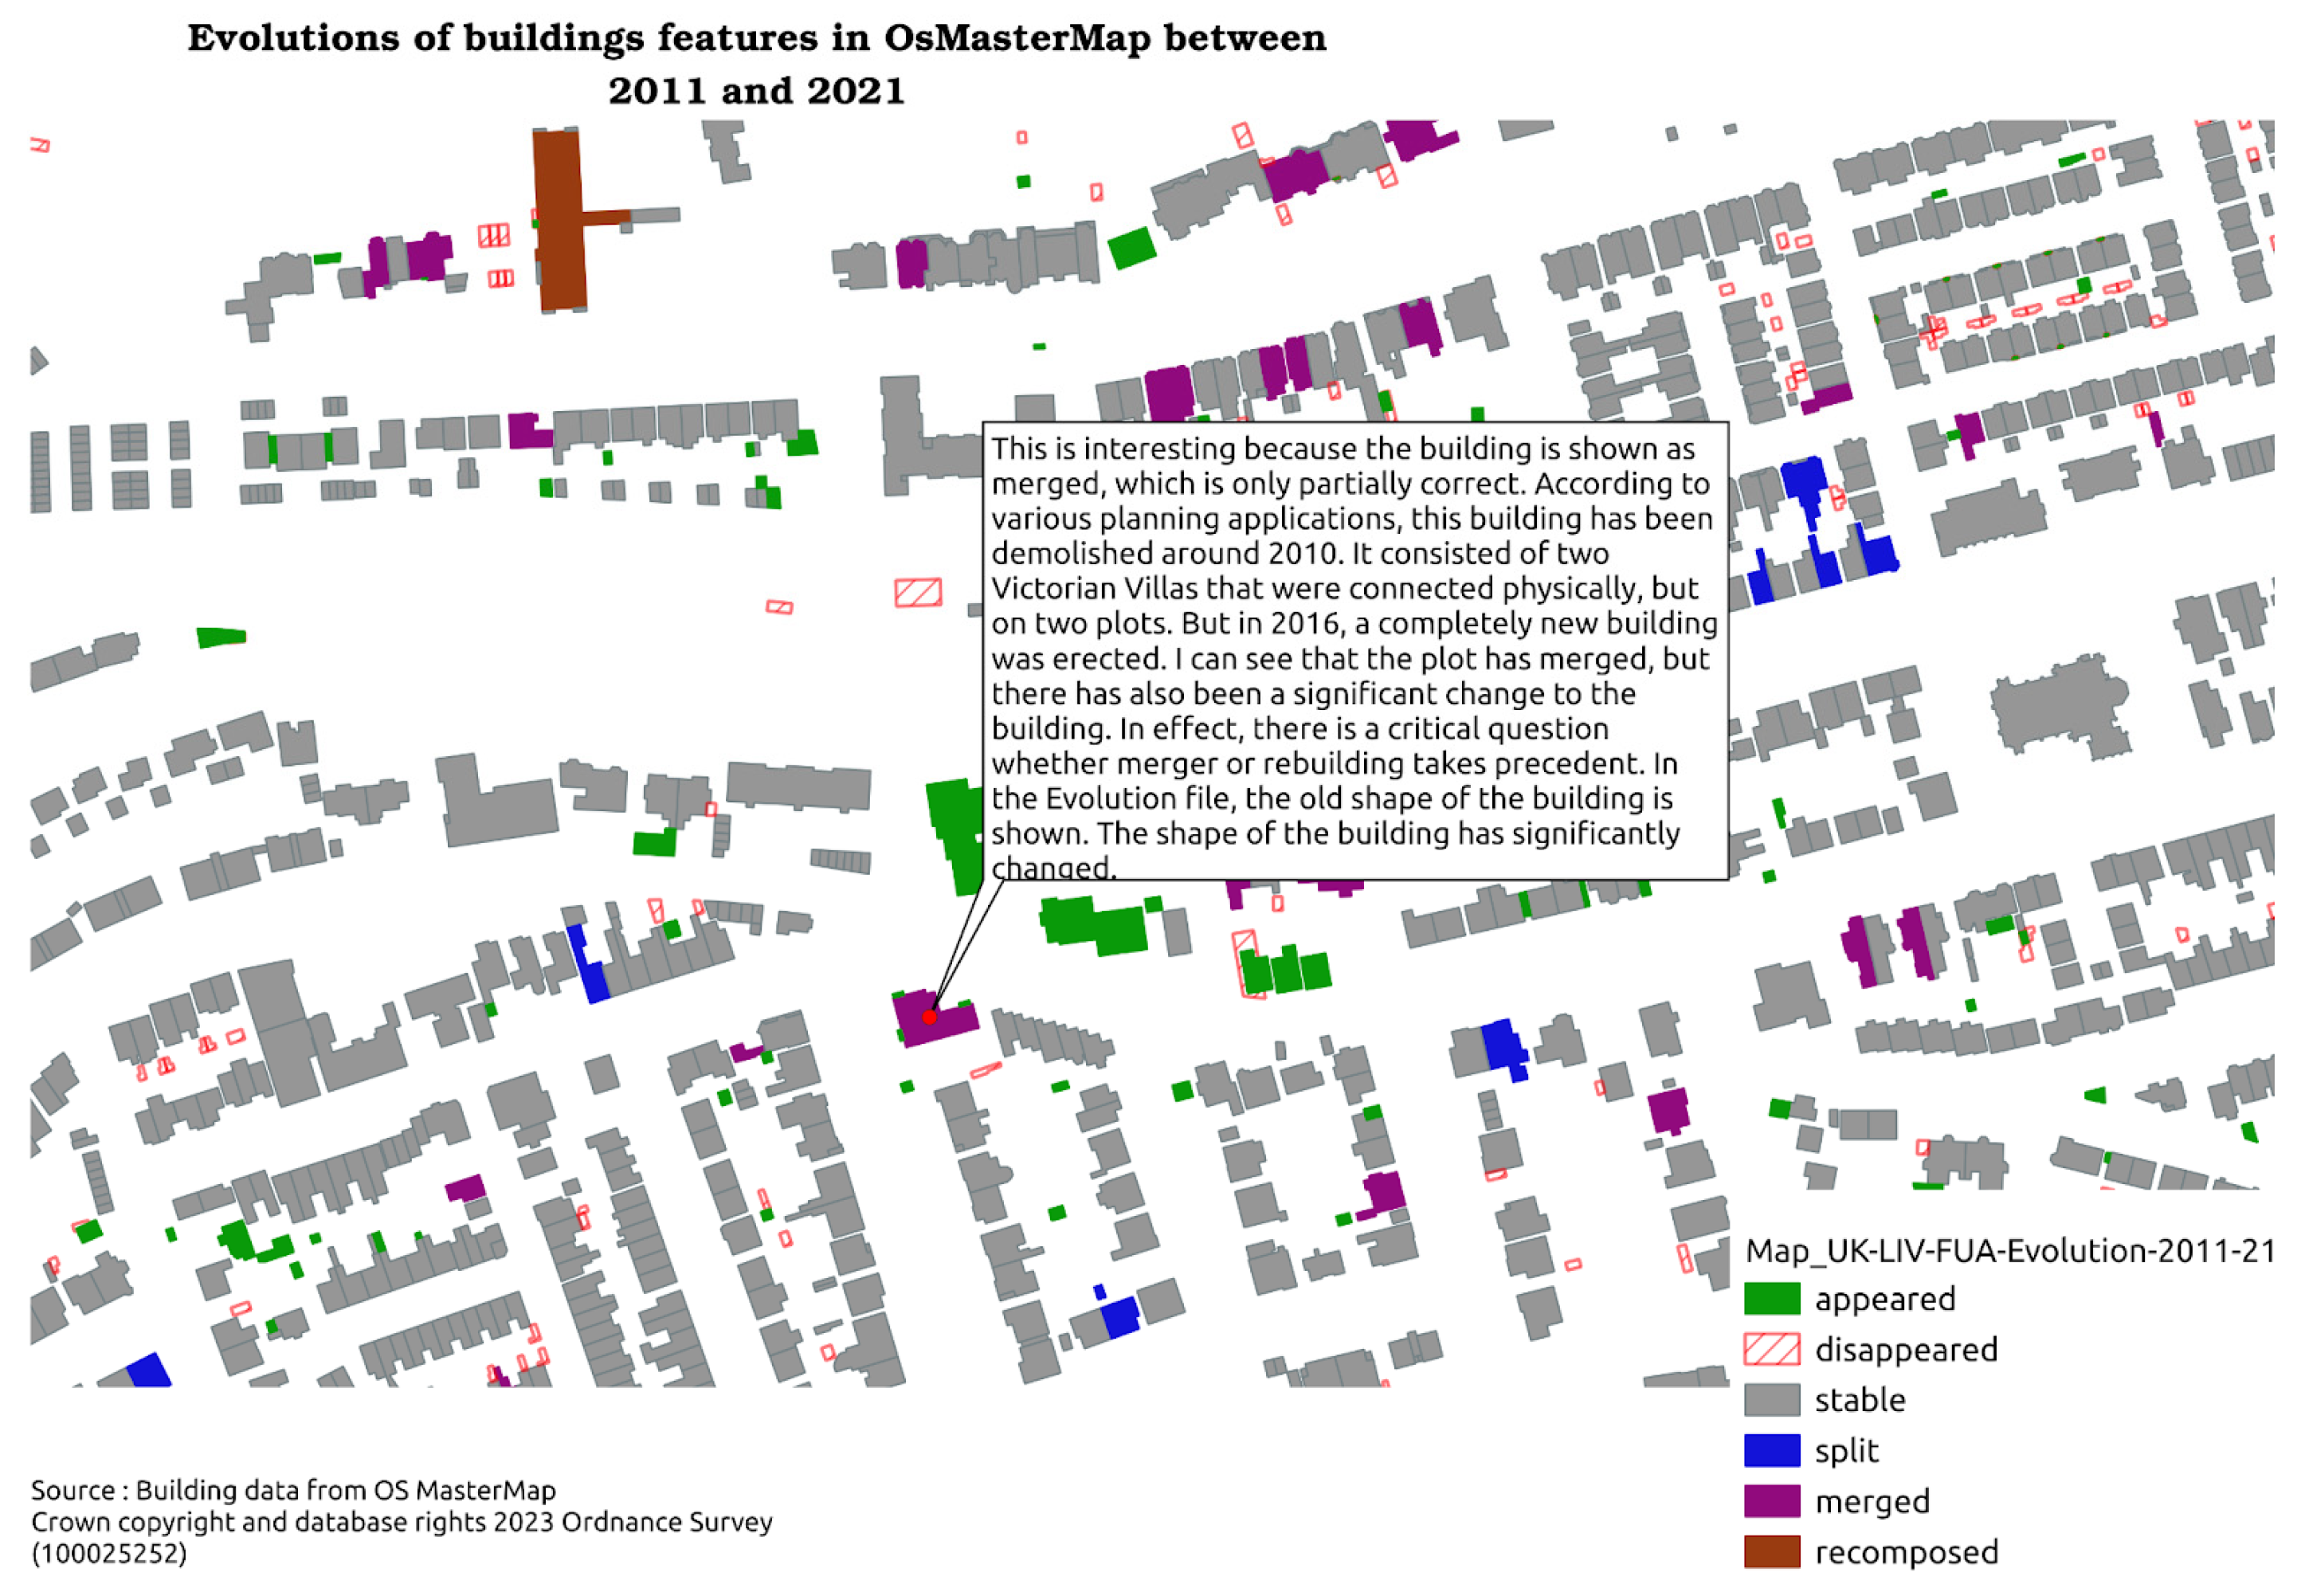
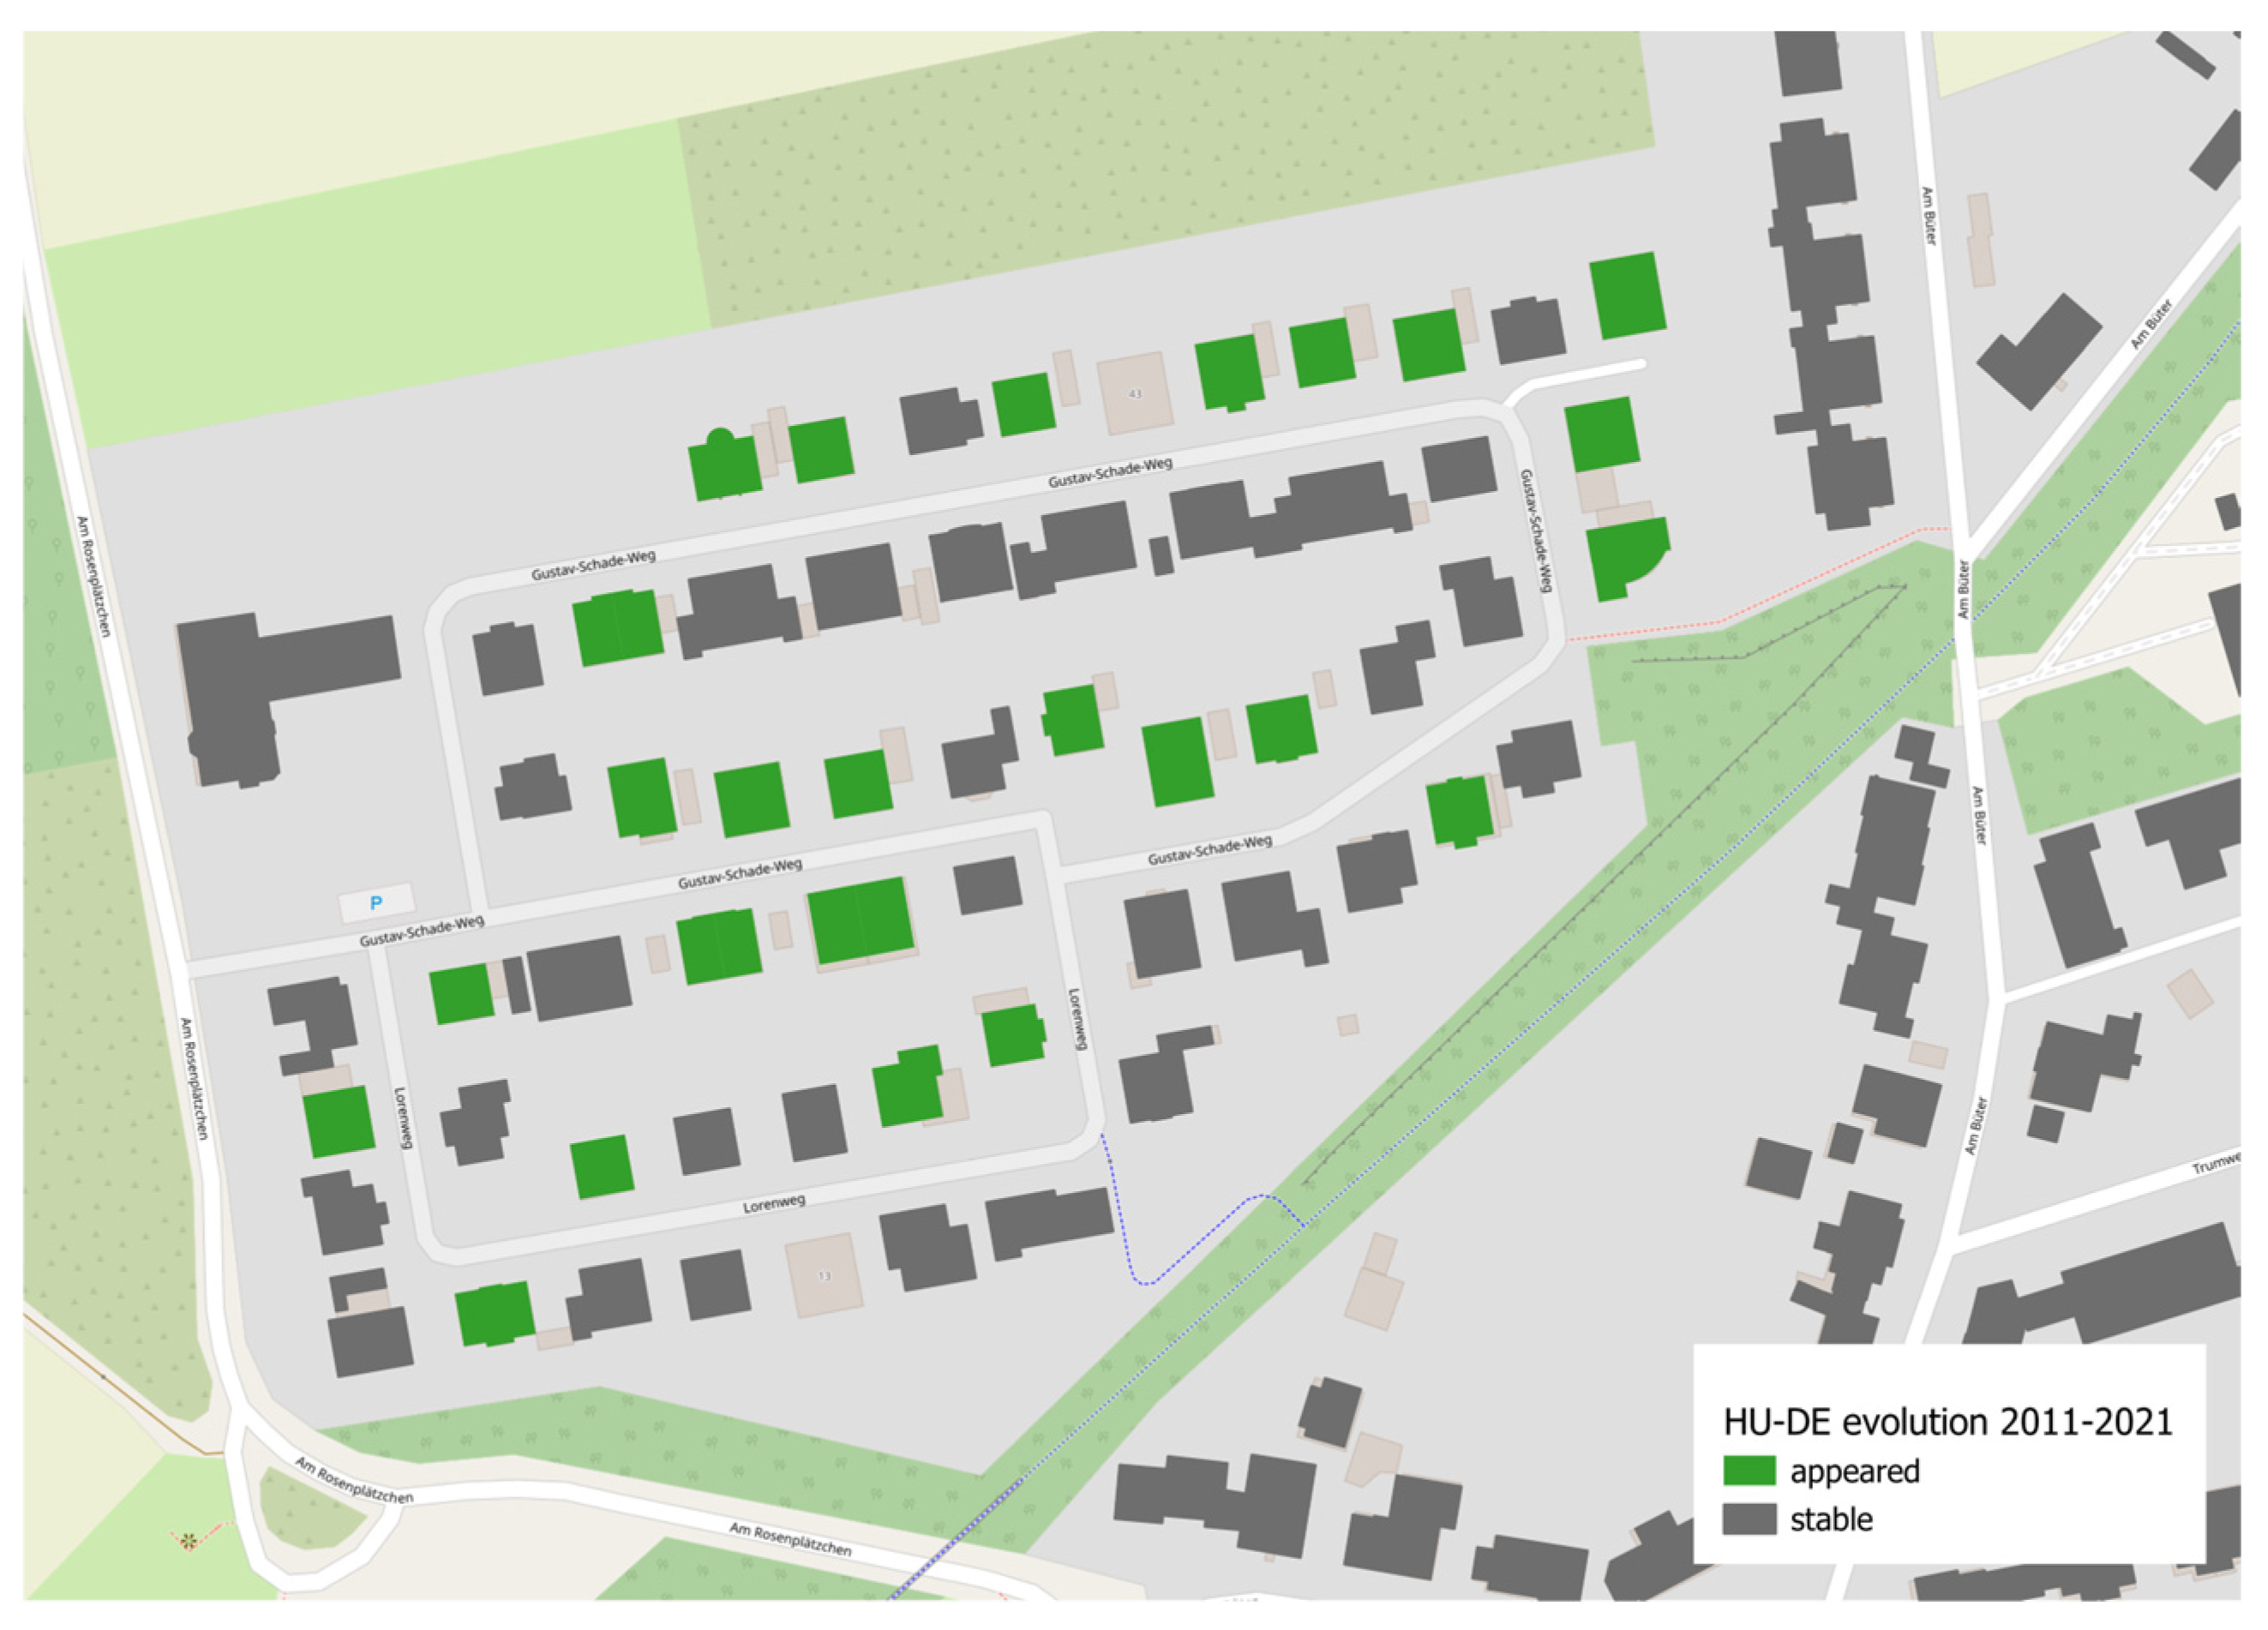
4.2. Producing Building Change Maps

The experimentation focused on the city regions of Strasbourg, Dortmund, and Liverpool from 2011 to 2021. The specification of concepts of interest was initiated by quoting papers on densification and suburbs on the Git Concept.md file. The first concepts were densification and the suburb. The concept of the suburb eventually was not used to scope maps because of the lack of comparable suburb definitions and map objects. The concept of the functional urban area was introduced instead, and an implementation of that concept to delineate map study areas was agreed on by geographers within the consortium; a specific procedure to compute these areas based on road networks was then proposed by one GIS expert and shared through the Git platform. The result is illustrated in Figure 9.
The concept discussions took place during consortium meetings, and one dashboard contributor edited a “Concepts.md” file to reflect these discussions. A web page was automatically generated so that web users could browse the discussions. Moreover, the study register was introduced to log discussions and progress specific to a given city region and experiment for Strasbourg.
The second step was the analysis of building data sources by local data experts. Identification of data sources was often achieved through mail and discussions logged on the Datasource registry afterward. The original national building data sources showed a high degree of diversity. The documentation, standard metadata, ad hoc files, and detailed textual documentation were not easy to retrieve and were often in the local language only. The most detailed analysis of building data sources was performed on French BDTopo® only. The experimentation supported parts of quotes of this documentation, which are relevant for the empirical analysis of building changes within and between city regions. A procedure for preparing a BuildingDataSet, detailing where to retrieve data corresponding to a specific year and specific area of interest and how to crop the functional area of a given city, was also produced.
The third step is the production of matching links and building changes. The matching tool was tested on Strasbourg. Then, it was replicated by different GIS engineers in Liverpool and Dortmund. When the building data source was BDTopo®, additional post-processing rules were applied based on the quotes of the product documentation in the Datasource registry. These are as follows: for every change of type “Split”, the “changeProduct” is set to “Yes”, and for every change of type “Appeared” where the building surface is less than 50 m2, the “changeProduct” is set to “Yes”. After these post-processing steps, a sample of these false positives was checked manually using aerial orthoimages. When it was identified that the building was already present or that there was no visible split between both years, the “changeEntities” attribute was set to “No” in these product change cases, based on the assumption that the sample was representative enough. The post-processing step was added to the description of the dataset’s provenance.
Table 2 shows building changes detected in the Strasbourg, Liverpool, and Dortmund functional urban areas. In all three study areas, stability is the dominant type of change, with 80%, 78%, and 82%, respectively, of the total area for the three study areas (Dortmund, Liverpool, and Strasbourg); this is expected, given that these are already established urban areas. This large majority of stability is consistent with low rates of urban land expansion observed for mature urban systems (e.g., around 2% for Europe between 1970 and 2000 according to [57]). Construction is the second type for all three areas, covering 4059 ha (11%), 2313 ha (9%), and 1453 ha (11%), respectively, suggesting fewer new constructions in Liverpool compared to the two others. Demolition reflects the renewal process of building construction, with Strasbourg being the smallest among the three study areas of Dortmund (3%), Liverpool (5%), and Strasbourg (2%). The split, fusion and recomposition categories are generally balanced and low (between 1% and 2%) between the three study areas, suggesting fewer building rearrangements. The particularity of French data with specification changes inducing splits therefore has a low quantitative impact overall; furthermore, it is not distinguishable from other countries in the summary statistics.
These building change data are a basis for (i) a consolidated statistical analysis of densification dynamics, implying validation by experts and integration with additional data (e.g., land plots, landowners, regulations, etc.) to identify evolutions corresponding effectively to different definitions or types of densification (shared in the Concepts part of the dashboard), and (ii) visual examination and exploration by various experts or stakeholders with a knowledge of data products and of the studied areas, initiating a refinement of the change modelling process as in Figure 4. We provide examples of the latest in the remaining part of this section, with one example for each country.
The harmonised Stylesheet is applied to the BuildingChangeDataSet to visualise changes in a map. A GIS project in a standard format has been prepared for densification experts to load the full map on their computer and examine the generated data with the full functionalities of a GIS. In Strasbourg, change in product specification generates the more pronounced appearance of small buildings, which the process can tag correctly using the attributes changeProduct and changeEntity. A composed pattern of change can be visually detected in different areas where deletion of buildings is followed by the appearance of new buildings, as illustrated in Figure 10. A closer look at the attributes of the corresponding buildings shows that industrial buildings are demolished to construct new residential buildings.
As illustrated in Figure 11, displaying building changes on a topographical background is useful when visually detecting patterns like the development of a campsite with a series of identical bungalows on the shore of a river. This pattern highlights localised strategies for development and their implications for urban planning.
In Liverpool, the local expert detected a specific case where the type of change was classified as “merged” by the algorithm, but the reality (verified with fieldwork and planning documents) corresponded to a reconstruction. This implies that the typology or the classification process needs more refinements in a later iteration (see Figure 12).
For Dortmund, the building change analysis revealed a process of individual single-family housing developments in a residential area. The identified change reveals a typical pattern for German land use planning and subsequent land readjustment that leaves the construction to the ultimate owner of the land. A local expert can assume that while the areas had been planned and infrastructure provision had been finished before 2011, the landowners individually built houses in the following years until 2021 (Figure 13).
These initial results indicate that building change maps can serve as a trigger for driving attention to specific areas where change is occurring, as evidenced by different densification patterns, which are illustrated in a way that can be shared by actors with basic skills in topographic map reading. They can also be used to detect new patterns and refine the types of changes. Critical reading of the output maps and discussions allowed us to express the focuses of current debates and identify possible refinements of these initial building change data and maps. Whereas the debate in Germany is mainly about infill development, far fewer of these sites exist in urban areas in England. The focus in France is instead on regeneration of commercial areas and on limiting soil sealing while achieving desirable densification. Differences were also identified in terms of understanding of buildings and dwellings, which are regulated differently in French, German, and British contexts.
However, additional information is necessary to distinguish false positives as well as false negatives, to detail the detected changes, and to embrace more changes needed for densification (such as change of use, change of height, and change in number of dwellings). A big limitation on current maps is that they lack the capacity to show changes in housing units within a given building.

5. Discussion and Perspectives

The motivation of this paper was to support studies and open discussions on dynamics that change a shared living environment through new tools that can be adopted by a wide range of users. We approached the complex reality of urban densification through building change data. Describing densification through building changes allows for sharing observations across various fields of expertise, from local planning to inhabitant-used buildings as common real-world objects. We have presented a collaborative dashboard through which to support the production of maps of building change for city regions based on topographic surveys performed at different points in time as well as definitions of shared concepts that relate densification to building changes. Not all changes can be detected through topographic building data, but these data are used to generate a core resource with which to engage relevant map readers in the refinement and enrichment of change maps. Four key contributions emerge from our experimentation:
  • A conceptual BuildingChange model embraces changes in building data and changes in real buildings as well as connections with densification concepts;
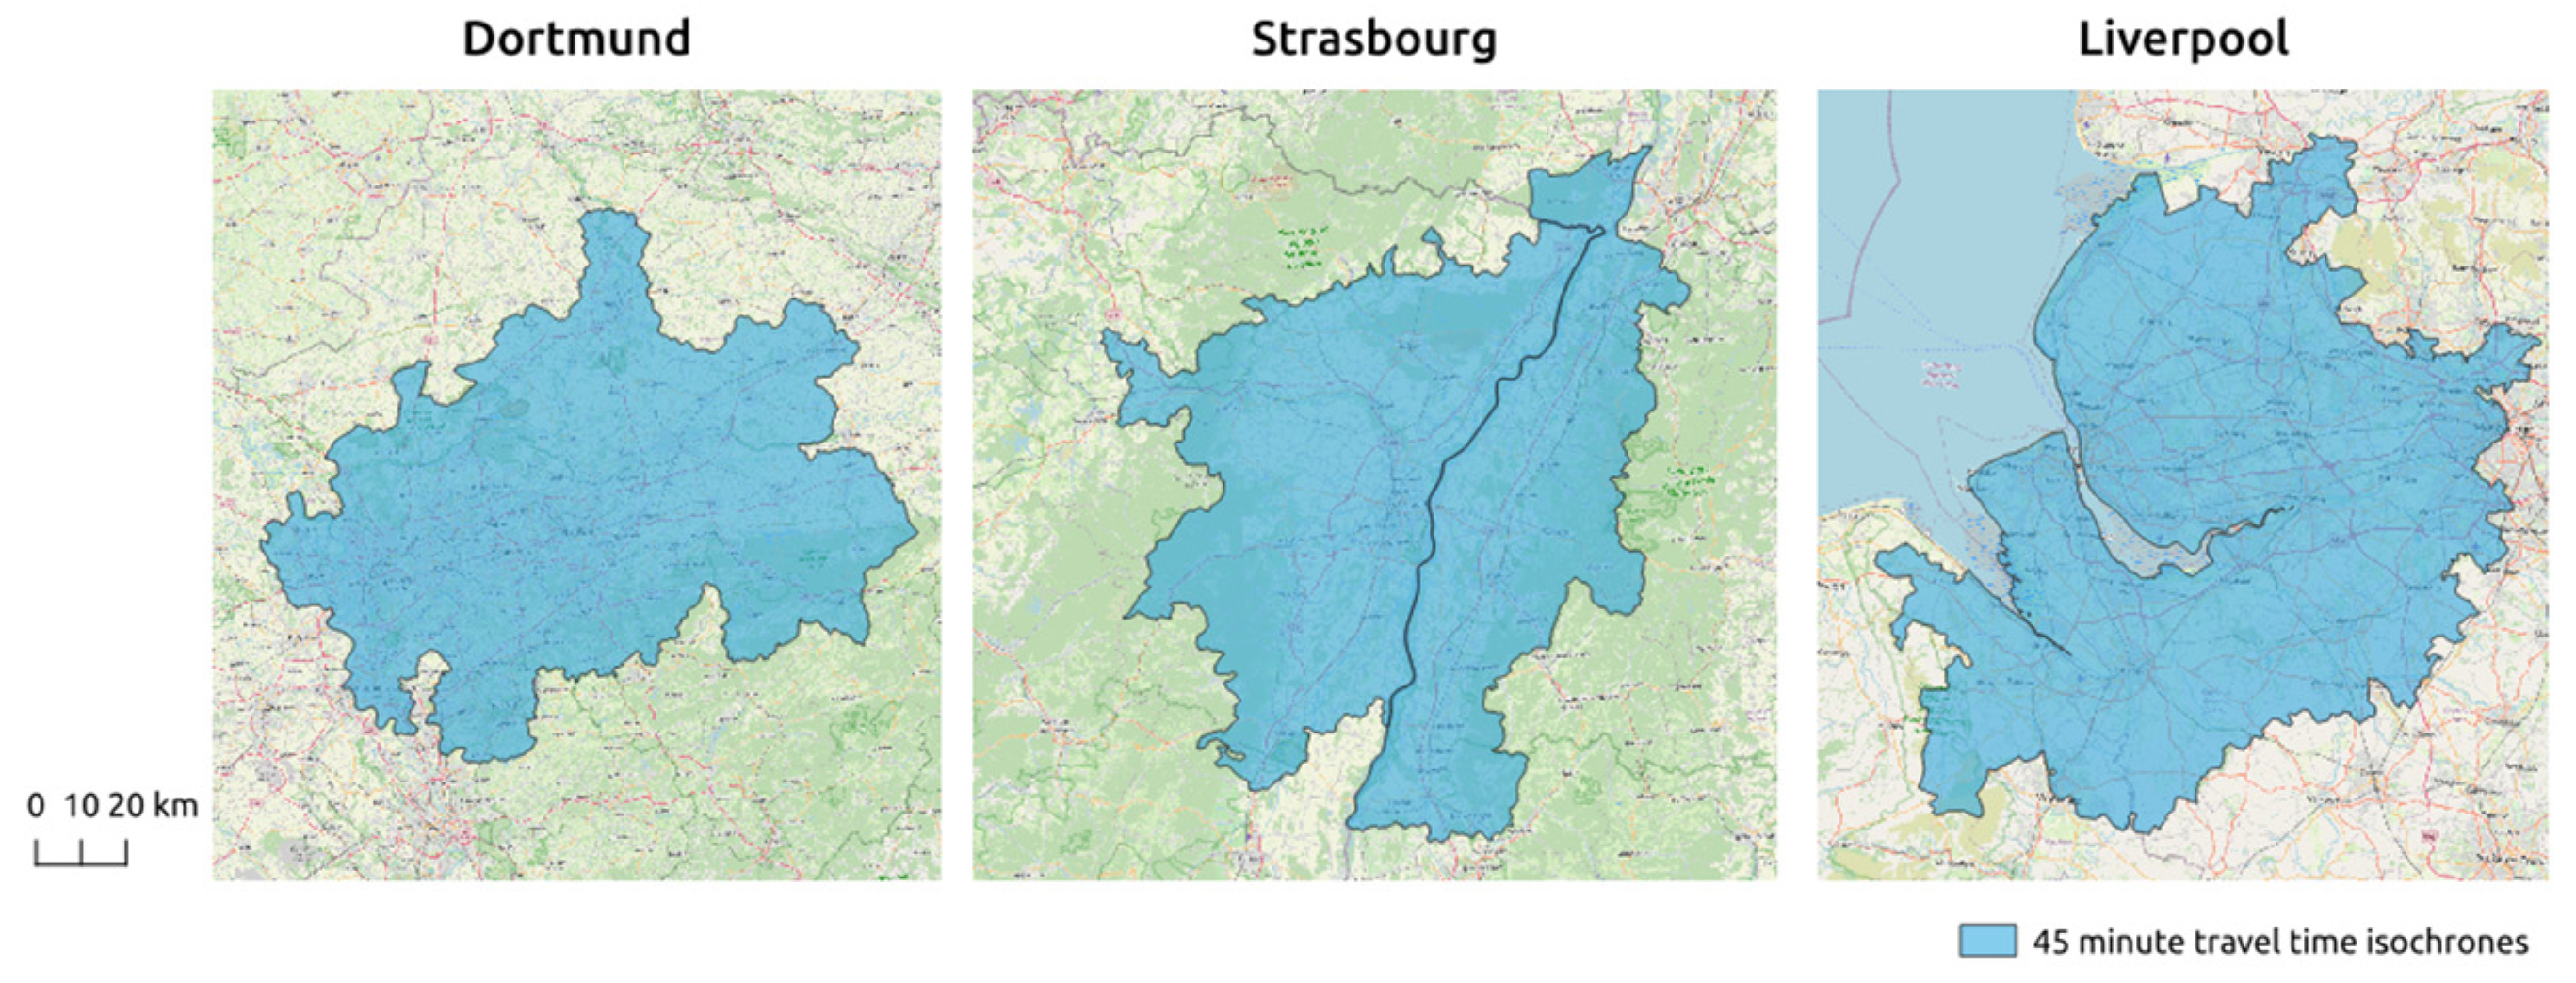
  • A replicable process is proposed to generate building change data and maps based on topographic data sources and a data-matching tool for city regions in France, Germany and the UK;
  • The documentation of quality metadata for the produced maps is based on distributed metadata fragments consolidated on a collaborative platform;
  • Three BuildingChange datasets and maps have been produced with this framework for the city regions of Strasbourg, Liverpool, and Dortmund.
A key finding is that even though building features in data and buildings as real-world entities are distinct things that can change independently, changes in building features can be detected automatically and ground indirect observation of changes in the real world. We used a dedicated feature-matching algorithm and interpreted these changes as those in building entities, provided the input building data had a guarantee of completeness and followed a documented survey procedure.
The second key finding is that mapping these changes with an adapted style over a topographic background produces a relevant material with which to illustrate densification and visually detect densification patterns. The expression of national concepts revealed that in Germany, vacant plots were perceived as areas with key potential for urban densification through infill development, whereas in England, a significant share of urban densification is seen as an increase in dwelling units through redevelopment.
The third key finding is that the lack of clear meta-information is hindering data engineering and comparability. A collaborative metadata fragment documentation platform can make this more explicit and accessible for everyone.
Future research needs to consider two main aspects. There is a need to reduce false positives and improve quality management. The capacity of Artificial Intelligence—through Knowledge Graphs and Large Language Models—to process unstructured text is a promising approach to handle the different documentations of building data sources. Also in this regard, a method is needed to generate a ground truth and to evaluate the completeness of the BuildingChangeDataset for basic categories of changes. Furthermore, the BuildingChange data could be improved by integrating additional data to detect changes in housing units’ and buildings’ elevation, using address point data, building permits, or digital elevation models. This necessitates the definition of integrative approaches for geospatial data and thematic information, the mixing of data matching, attribute transfer and downscaling, and the consideration of replicability for these aspects.
The capacity of our BuildingChange model to connect densification theories to shared observations must be evaluated with stakeholders with different rationales and opinions of densification, i.e., urban scientists, urban planners, citizens, developers, and policy makers. Cultural theory [58] could be a viable approach to describing these differences in observations, as shown by its application to planning processes [59]. The BuildingChange data need to be associated with rendering adapted to different scales. Additional social and spatial indicators are necessary to understand the drivers of densification and to compare them across countries by using, for example, logistic regression [60].
Concerning the Git platform, future work should target higher usability for contributors, ranging from scientists to municipalities’ data offices. Here, didactic user stories that can explain how to use it and possibly to extend it to more city regions and more countries are important. More automation in resource registration, exploitation of quality fragments, execution of data analysis processes, and generation of web pages can be achieved with Git technologies, like the isomorphic–Git JavaScript library. Finally, a future technical challenge lies in how we might ensure the private sharing of elements within an open Git environment. Presentations and training sessions for users on how to effectively use the platform are currently in progress. This will leverage the platform’s capabilities to address specific needs.

Author Contributions

Conceptualization, Bénédicte Bucher, Ana-Maria Raimond, Julien Perret, Juste Raimbault and Mathias Jehling; software, Julien Perret, Juste Raimbault, Mouhamadou Ndim and Bénédicte Bucher; investigation, Bénédicte Bucher, Juste Raimbault, Mouhamadou Ndim, Ana-Maria Raimond, Julien Perret, Mathias Jehling and Sebastian Dembski; data curation, Mouhamadou Ndim, Juste Raimbault and Bénédicte Bucher; writing—original draft preparation, Bénédicte Bucher, Ana-Maria Raimond, Mathias Jehling, Sebastian Dembski, Julien Perret and Juste Raimbault; writing—review and editing, Bénédicte Bucher, Ana-Maria Raimond, Mathias Jehling, Sebastian Dembski, Julien Perret and Juste Raimbault; funding acquisition, Mathias Jehling, Sebastian Dembski and Bénédicte Bucher. All authors have read and agreed to the published version of the manuscript.

Funding

This work was funded under the Open Research Area 7 framework by the Deutsche Forschungsgemeinschaft [grant number 502663987], the Economic and Social Research Council [grant number ES/X008290/1], and the French National Research Agency (ANR) [grant number 22-ORAR-0004].

Data Availability Statement

Access to BuildingChanges data and maps can be subject to restriction due to the licence of the source building data. The French part of Strasbourg Building Changes dataset is available under the French Open Licence compatible with CC-BY, on the platform recherche.data.gouv.fr with the DOI: https://doi.org/10.57745/RFKKYX (accessed on 25 March 2025). A first version has been published, and a new version has been submitted, which is more consistent with the version of the BuildingChanges schema presented in this paper. For the BuildingChanges datasets derived for the UK and Germany (Strasbourg and Dortmund for the German part, and Liverpool for the UK), specific agreements have to be signed with the source building data providers to access data freely for scientific purposes.

Conflicts of Interest

The authors declare no conflicts of interest. The funders had no role in the design of the study; in the collection, analyses, or interpretation of data; in the writing of the manuscript; or in the decision to publish the results.

References

  1. Broitman, D.; Koomen, E. Regional diversity in residential development: A decade of urban and peri-urban housing dynamics in the Netherlands. Lett. Spat. Resour. Sci. 2015, 8, 201–217. [Google Scholar] [CrossRef]
  2. Evers, D.; Katuric, I.; van der Wouden, R. Urbanization in Europe, Past Developments and Pathways to a Sustainable Future; Palgrave Macmillan: Cham, Switzerland, 2024. [Google Scholar] [CrossRef]
  3. Ehrhardt, D.; Behnisch, M.; Jehling, M.; Michali, M. Mapping soft densification—A geospatial approach to identify residential infill processes and potentials on vacant lots. Build. Cities 2023, 4, 193–211. [Google Scholar] [CrossRef]
  4. Bibby, P.; Henneberry, J.; Halleux, J.-M. Incremental residential densification and urban spatial justice: The case of England between 2001 and 2011. Urban Stud. 2021, 58, 2117–2138. [Google Scholar] [CrossRef]
  5. Cavicchia, R. Are Green, dense cities more inclusive? Densification and housing accessibility in Oslo. Local Environ. 2021, 26, 1250–1266. [Google Scholar] [CrossRef]
  6. Schorcht, M.; Jehling, M.; Krüger, T. Where are cities under pressure?—An indicator for measuring the impact of building changes on urban density. Ecol. Indic. 2023, 149, 110142. [Google Scholar] [CrossRef]
  7. Clarke, D.L. (Ed.) Models and paradigms in contemporary Archaeology: Chapter 1. In Models in Archaeology; Methuen: London, UK, 1972; pp. 1–60. [Google Scholar]
  8. Touati-Morel, A. Hard and soft densification policies in the Paris City-Region. Int. J. Urban Reg. Res. 2015, 39, 603–612. [Google Scholar] [CrossRef]
  9. Fleischmann, M.; Arribas-Bel, D. Geographical characterisation of British urban form and function using the spatial signatures framework. Sci. Data 2022, 9, 546. [Google Scholar] [CrossRef]
  10. ISO 19101–1:2014; Geographic Information—Reference Model—Part 1: Fundamentals. International Organization for Standardization: Geneva, Switzerland, 2014.
  11. Hanseth, O. From Systems and Tools to Networks and Infrastructures—From Design to Cultivation: Towards a design Theory of Information Infrastructures. In Industrial Informatics Design, Use and Innovation; Jonny, H., Ed.; IGI Global: Hershey, PA, USA, 2010; pp. 122–156. ISBN 978-1-61520-692-6.11A. [Google Scholar]
  12. Bibby, P.; Henneberry, J.; Halleux, J.-M. Under the radar? ‘Soft’ residential densification in England, 2001–2011. Environ. Plan. B Urban Anal. City Sci. 2020, 47, 102–118. [Google Scholar] [CrossRef]
  13. Dembski, S.; Hartmann, T.; Hengstermann, A.; Dunning, R. Enhancing understanding of strategies of land policy for urban densification. Town Plan. Rev. 2020, 91, 209–216. [Google Scholar] [CrossRef]
  14. Debrunner, G.; Hengstermann, A.; Gerber, J.-D. The business of densification: Distribution of power, wealth and inequality in Swiss policy making. Town Plan. Rev. 2020, 91, 259–281. [Google Scholar] [CrossRef]
  15. Morley, M.; Pafka, E. “Density Done Well” in the Pursuit of 20-Minute Neighbourhoods: Navigating Fluid Discourses in Melbourne. Urban Policy Res. 2023, 41, 148–163. [Google Scholar] [CrossRef]
  16. Jehling, M.; Hecht, R. Do land policies make a difference? A data-driven approach to trace effects on urban form in France and Germany. Environ. Plan. B Urban Anal. City Sci. 2022, 49, 114–130. [Google Scholar] [CrossRef]
  17. Rozenblat, C. Extending the concept of city for delineating large urban regions (LUR) for the cities of the world. Cybergeo Eur. J. Geogr. 2020, 954. [Google Scholar] [CrossRef]
  18. EEA: Mapping Guide for a European Urban Atlas. 2011. Available online: http://www.eea.europa.eu/data-and-maps/data/urban-atlas (accessed on 25 March 2025).
  19. Milojevic-Dupont, N.; Wagner, F.; Nachtigall, F.; Hu, J.; Brüser, G.B.; Zumwald, M.; Biljecki, F.; Heeren, N.; Kaack, L.H.; Pichler, P.-P.; et al. EUBUCCO v0.1: European building stock characteristics in a common and open database for 200+ million individual buildings. Sci. Data 2023, 10, 147. [Google Scholar] [CrossRef]
  20. OpenStreetMap contributors. OpenStreetMap [Data Set]. OpenStreetMap Foundation. Available as Open Data Under the Open Data Commons Open Database License (ODbL). Consulted 2024. Available online: https://openstreetmap.org (accessed on 25 March 2025).
  21. Hecht, R.; Kunze, C.; Hahmann, S. Measuring Completeness of Building Footprints in OpenStreetMap over Space and Time. ISPRS Int. J. Geo-Inf. 2013, 2, 1066–1091. [Google Scholar] [CrossRef]
  22. Witt, R.; Loos, L.; Zipf, A. Analysing the Impact of Large Data Imports in OpenStreetMap. ISPRS Int. J. Geo-Inf. 2021, 10, 528. [Google Scholar] [CrossRef]
  23. Zhao, P.; Jia, T.; Qin, K.; Shan, J.; Jiao, C. Statistical analysis on the change of OpenStreetMap road networks in Beijing. Phys. A Stat. Mech. Its Appl. 2015, 420, 59–72. [Google Scholar] [CrossRef]
  24. ADV. Data format description of Official Building Polygons of Germany (HU-DE), v2.7. 2023. Available online: https://www.adv-online.de/AdV-Produkte/Standards-und-Produktblaetter/ZSHH/ (accessed on 25 March 2025).
  25. IGN. BD TOPO® Version 3.3—Descriptif de Contenu. 2023. Available online: https://geoservices.ign.fr/sites/default/files/2023-10/DC_BDTOPO_3-3.pdf (accessed on 25 March 2025).
  26. Ordnance Survey. OS MasterMap Topography Layer™—Technical Specification, v3.0; Ordnance Survey: Southampton, UK, 2023. [Google Scholar]
  27. Rajabifard, A.; Feeney, M.E.F.; Williamson, I.P. Future directions for SDI development. Int. J. Appl. Earth Obs. Geoinf. 2002, 4, 11–22. [Google Scholar] [CrossRef]
  28. Masser, I.; Crompvoets, J. Building European Spatial Data Infrastructures; Esri Press: Redlands, CA, USA, 2015. [Google Scholar]
  29. European Parliament. Directive 2007/2/EC an Infrastructure for Spatial Information in the European Community (INSPIRE); European Parliament: Luxembourg, 2007. [Google Scholar]
  30. Zrhal, M.; Bucher, B.; Hamdi, F.; Van Damme, M.-D. Identifying the key resources and missing elements to build a knowledge graph dedicated to spatial dataset search. Procedia Comput. Sci. 2022, 207, 2911–2920. [Google Scholar] [CrossRef]
  31. Brodeur, J.; Coetzee, S.; Danko, D.; Garcia, S.; Hjelmager, J. Geographic Information Metadata—An Outlook from the International Standardization Perspective. ISPRS Int. J. Geo-Inf. 2019, 8, 280. [Google Scholar] [CrossRef]
  32. Devillers, R.; Jeansoulin, R. Fundamentals of Spatial Data Quality; ISTE: London, UK, 2006. [Google Scholar]
  33. Maué, P.; Schade, S. Quality of Geographic Information Patchwork. In Proceedings of the AGILE, Washington, DC, USA, 4–8 August 2008. [Google Scholar]
  34. Masó, J.; Bastin, L.; Thum, S.; Nüst, D. OGC Geospatial User Feedback Standard: Conceptual Model, Ver. 1.0, 15-097r1; Open Geospatial Consortium: Wayland, MA, USA, 2016. [Google Scholar]
  35. Janowicz, K.; van Harmelen, F.; Hendler, J.A.; Hitzler, P. Why the Data Train Needs Semantic Rails. AI Mag. 2015, 36, 5–14. [Google Scholar] [CrossRef]
  36. Di Muri, C.; Pulieri, M.; Raho, D.; Muresan, A.N.; Tarallo, A.; Titocci, J.; Netola, E.; Basset, A.; Mazzoni, S.; Rosati, I. Assessing semantic interoperability in environmental sciences: Variety of approaches and semantic artefacts. Sci. Data 2024, 11, 1055. [Google Scholar] [CrossRef] [PubMed]
  37. Cheatham, M.; Krisnadhi, A.; Amini, R.; Hitzler, P.; Janowicz, K.; Shepherd, A.; Narock, T.; Jones, M.; Peng, J. The GeoLink knowledge graph. Big Earth Data 2018, 2, 131–143. [Google Scholar] [CrossRef]
  38. Yue, P.; Guo, X.; Zhang, M.; Jiang, L.; Zhai, X. Linked Data and SDI: The case on Web geoprocessing workflows. ISPRS J. Photogramm. Remote Sens. 2016, 114, 245–257. [Google Scholar] [CrossRef]
  39. Wiemann, S.; Bernard, L. Spatial data fusion in Spatial Data Infrastructures using Linked Data. Int. J. Geogr. Inf. Sci. 2015, 30, 613–636. [Google Scholar] [CrossRef]
  40. Abadie, N.; Mcgibbney, L.J.; Atemezing, G.A. Ontologie des éléments du territoire et de ses infrastructures de l’IGN. 2014. Available online: https://data.ign.fr/def/topo# (accessed on 25 March 2025).
  41. Janowicz, K.; Gao, S.; McKenzie, G.; Hu, Y.; Bhaduri, B. GeoAI: Spatially explicit artificial intelligence techniques for geographic knowledge discovery and beyond. Int. J. Geogr. Inf. Sci. 2019, 34, 625–636. [Google Scholar] [CrossRef]
  42. Scheider, S.; Nyamsuren, E.; Kruiger, H.; Xu, H. Geo-analytical question-answering with GIS. Int. J. Digit. Earth 2020, 14, 1–14. [Google Scholar] [CrossRef]
  43. Costes, B.; Perret, J. A hidden Markov model for matching spatial networks. J. Spat. Inf. Sci. 2019, 18, 57–89. [Google Scholar] [CrossRef]
  44. Gregory, I.N.; Healey, R.G. Historical GIS: Structuring, mapping and analysing geographies of the past. Prog. Hum. Geogr. 2007, 31, 638–653. [Google Scholar] [CrossRef]
  45. Perret, J.; Ruas, A.; Boffet-Mas, A. Understanding urban dynamics: The use of vector topographic database and the creation of spatiotemporal databases. In Proceedings of the International Cartographic Conference—ICC 2009, Santiago, Chile, 15–21 November 2009. [Google Scholar]
  46. Olteanu-Raimond, A.-M.; Mustière, S.; Ruas, A. Knowledge formalization for vector data matching using belief theory. J. Spat. Inf. Sci. 2015, 10, 21–46. [Google Scholar] [CrossRef]
  47. Harvey, F.; Vauglin, F.; Bel Hadj Ali, A. Geometric matching of areas, comparison measures and association links. In Proceedings of the 8th International Symposium on Spatial Data Handling, Vancouver, Canada, 11–15 July 1998; pp. 557–568. [Google Scholar]
  48. Guardiola, P.; Raimbault, J.; Olteanu-Raimond, A.-M.; Perret, J. Benchmarking algorithms for matching geospatial vector data. In Proceedings of the French Regional Conference on Complex Systems, Montpellier, France, 29–31 May 2024. [Google Scholar]
  49. Eftekhari, A.; Samadzadegan, F.; Javan, F. Building change detection using the parallel spatial-channel attention block and edge-guided deep network. Int. J. Appl. Earth Obs. Geoinf. 2023, 117, 103180. [Google Scholar] [CrossRef]
  50. Gangemi, A.; Guarino, N.; Masolo, C.; Oltramari, A.; Schneider, L. Sweetening ontologies with DOLCE. In Knowledge Engineering and Knowledge Management: Ontologies and the Semantic Web; Springer: Berlin/Heidelberg, Germany, 2002; pp. 166–181. [Google Scholar] [CrossRef]
  51. MIWP. INSPIRE Data Specification on Buildings—Technical Guidelines, D2.8.III.2_v3.1.0. 2024. Available online: https://knowledge-base.inspire.ec.europa.eu/publications/inspire-data-specification-buildings-technical-guidelines_en (accessed on 25 March 2025).
  52. Banko, G.; Mansberger, R.; Gallaun, H.; Grillmayer, R.; Prüller, R.; Riedl, M.; Stemberger, W.; Steinnocher, K.; Walli, A. Land Information System Austria (LISA). In Land Use and Land Cover Mapping in Europe: Remote Sensing and Digital Image Processing; Manakos, I., Braun, M., Eds.; Springer: Dordrecht, The Netherlands, 2014; Volume 18, pp. 237–254. [Google Scholar] [CrossRef]
  53. Claramunt, C.; Thériault, M.; Parent, C. A qualitative representation of evolving spatial entities in two-dimensional topological spaces. In Innovations in GIS 5; Carver, S., Ed.; CRC Press: London, UK, 1997; pp. 119–129. [Google Scholar]
  54. Guan, S.; Cheng, X.; Bai, L.; Zhang, F.; Li, Z.; Zeng, Y.; Jin, X.; Guo, J. What is Event Knowledge Graph: A Survey. IEEE Trans. Knowl. Data Eng. 2023, 35, 7569–7589. [Google Scholar] [CrossRef]
  55. Van Hage, W.; Malaisé, V.; Segers, R.; Hollink, L.; Schreiber, G. Design and use of the Simple Event Model (SEM). J. Web Semant. 2011, 9, 128–136. [Google Scholar] [CrossRef]
  56. Badard, T.; Braun, A. OXYGENE: An open framework for the deployment of geographic web services. In Proceedings of the 21st International Cartographic Conference, Durban, South Africa, 10–16 August 2003; pp. 994–1004. [Google Scholar]
  57. Seto, K.C.; Fragkias, M.; Güneralp, B.; Reilly, M.K. A meta-analysis of global urban land expansion. PLoS ONE 2011, 6, e23777. [Google Scholar] [CrossRef] [PubMed]
  58. Douglas, M. Four cultures: The evolution of a parsimonious model. GeoJournal 1999, 47, 411–415. [Google Scholar] [CrossRef]
  59. Hartmann, T. Wicked problems and clumsy solutions. Plan. Theory 2012, 11, 242–256. [Google Scholar] [CrossRef]
  60. Mustafa, A.; Heppenstall, A.; Omrani, H.; Saadi, I.; Cools, M.; Teller, J. Modelling built-up expansion and densification with multinomial logistic regression, cellular automata and genetic algorithm. Comput. Environ. Urban Syst. 2018, 67, 147–156. [Google Scholar] [CrossRef]
Figure 1. Examples of building changes observed in data and that can correspond or not to changes in reality. Source: © Crown copyright and database rights 2023 Ordnance Survey (100025252); © Getmapping Ltd.
Ijgi 14 00155 g001
Figure 2. Examples of changes in building data that correspond to changes in specifications of BDTopo® (left) and OS MasterMap® (right). Source: © copyright IGN-2011, IGN-2021; © Crown copyright and database rights 2023 Ordnance Survey (100025252); © Getmapping Ltd.
Ijgi 14 00155 g002
Figure 3. Simplified view of the different categories of knowledge relevant to densification discussions, using the DOLCE meta-ontology.
Ijgi 14 00155 g003
Figure 4. Proposed collaborative process through which to engage different experts in the iterative production of buildings change maps and concepts.
Ijgi 14 00155 g004
Figure 5. The collaborative dashboard supports contributions through collaborative metadata organised in registries, as well as shared tools and procedures.
Ijgi 14 00155 g005
Figure 6. Our building change conceptual model relates different fields of expertise: building data sources, change detection using GIS, densification concepts and changes in real buildings.
Ijgi 14 00155 g006
Figure 7. A MatchingLink is interpreted into a BuildingChange of different types depending on its cardinality and on refinement rules specific to the initial building data source.
Ijgi 14 00155 g007
Figure 8. The dashboard is implemented as a complementary component to existing solutions already adopted by scientists to retrieve, process, and publish data.
Ijgi 14 00155 g008
Figure 9. Maps produced for the functional urban areas or city regions, defined as 45 min travel time isochrones, for Dortmund, Strasbourg and Liverpool. For Strasbourg, the map involves France and Germany.
Ijgi 14 00155 g009
Figure 10. Detection of change patterns in Strasbourg where the demolished buildings, indicated through red hatching, are industrial buildings and the newly built buildings, in green, are residential buildings. © BDTopo®, Source: © copyright IGN-2011, IGN-2021.
Ijgi 14 00155 g010
Figure 11. Visual detection of a specific creation pattern: a development project was decided for the whole area to replace former buildings (red hashes), and a series of identical bungalows were created (green shapes) along the shore of the river (Strasbourg area). (© BDTopo®, Source: © copyright IGN-2011, IGN-2021, topographic map © OpenStreetMap contributors).
Ijgi 14 00155 g011
Figure 12. User feedback on the building change model based on features in OS MasterMap® of 2011 and 2021.
Ijgi 14 00155 g012
Figure 13. Building change model based on features in HU-DE® of 2011 and 2021 revealing individual single-family housing development in Dortmund, in green (topographic map © OpenStreetMap contributors).
Ijgi 14 00155 g013
Table 1. Tools and methods from the literature used to produce comparable maps of building changes.
TaskTools and Methods
Identify potentially relevant data sources and evaluate their fitness for the detection of building changes in the past decade
  • Catalogues and standard metadata
  • Geo-Question answering models
  • Quality “metadata” including detailed textual documentation
  • Geospatial User Feedback
Detect changes in building features (i.e., data) in the past decade
  • Data-matching algorithm
  • Harmonised data model
Detect changes in building entities (i.e., real world) based on the changes in building features and represent them in a comparable way across cities
  • Shared ontologies
  • Harmonised data model
  • Harmonised styles
  • Quality management and metadata
Table 2. Building change in the Strasbourg, Liverpool, and Dortmund city regions in 2011–2021.
DortmundLiverpoolStrasbourg
NumberArea (ha)NumberArea (ha)NumberArea (ha)
Construction 684,5234059 (11%)524,3812313 (9%)75,25681.453 (11%)
Demolition 89,036935 (3%)232,5871160 (5%)13,976313 (2%)
Stability 2,384,28428,362 (80%)2,569,08819,550 (78%)987,49910,452 (82%)
Split 47,162759 (2%)15,702257 (1%)127020 (<1%)
Fusion 33,0131070 (>1%)60,0751491 (6%)2310157 (1%)
Recomposition40,322477 (1%)7831291 (1%)12,369335 (3%)
Total area (ha) 35,662 25,062 12,730
Disclaimer/Publisher’s Note: The statements, opinions and data contained in all publications are solely those of the individual author(s) and contributor(s) and not of MDPI and/or the editor(s). MDPI and/or the editor(s) disclaim responsibility for any injury to people or property resulting from any ideas, methods, instructions or products referred to in the content.

