


Multi-Scenario Simulation of Urban Land Expansion Modes Considering Differences in Spatial Functional Zoning
Abstract
1. Introduction
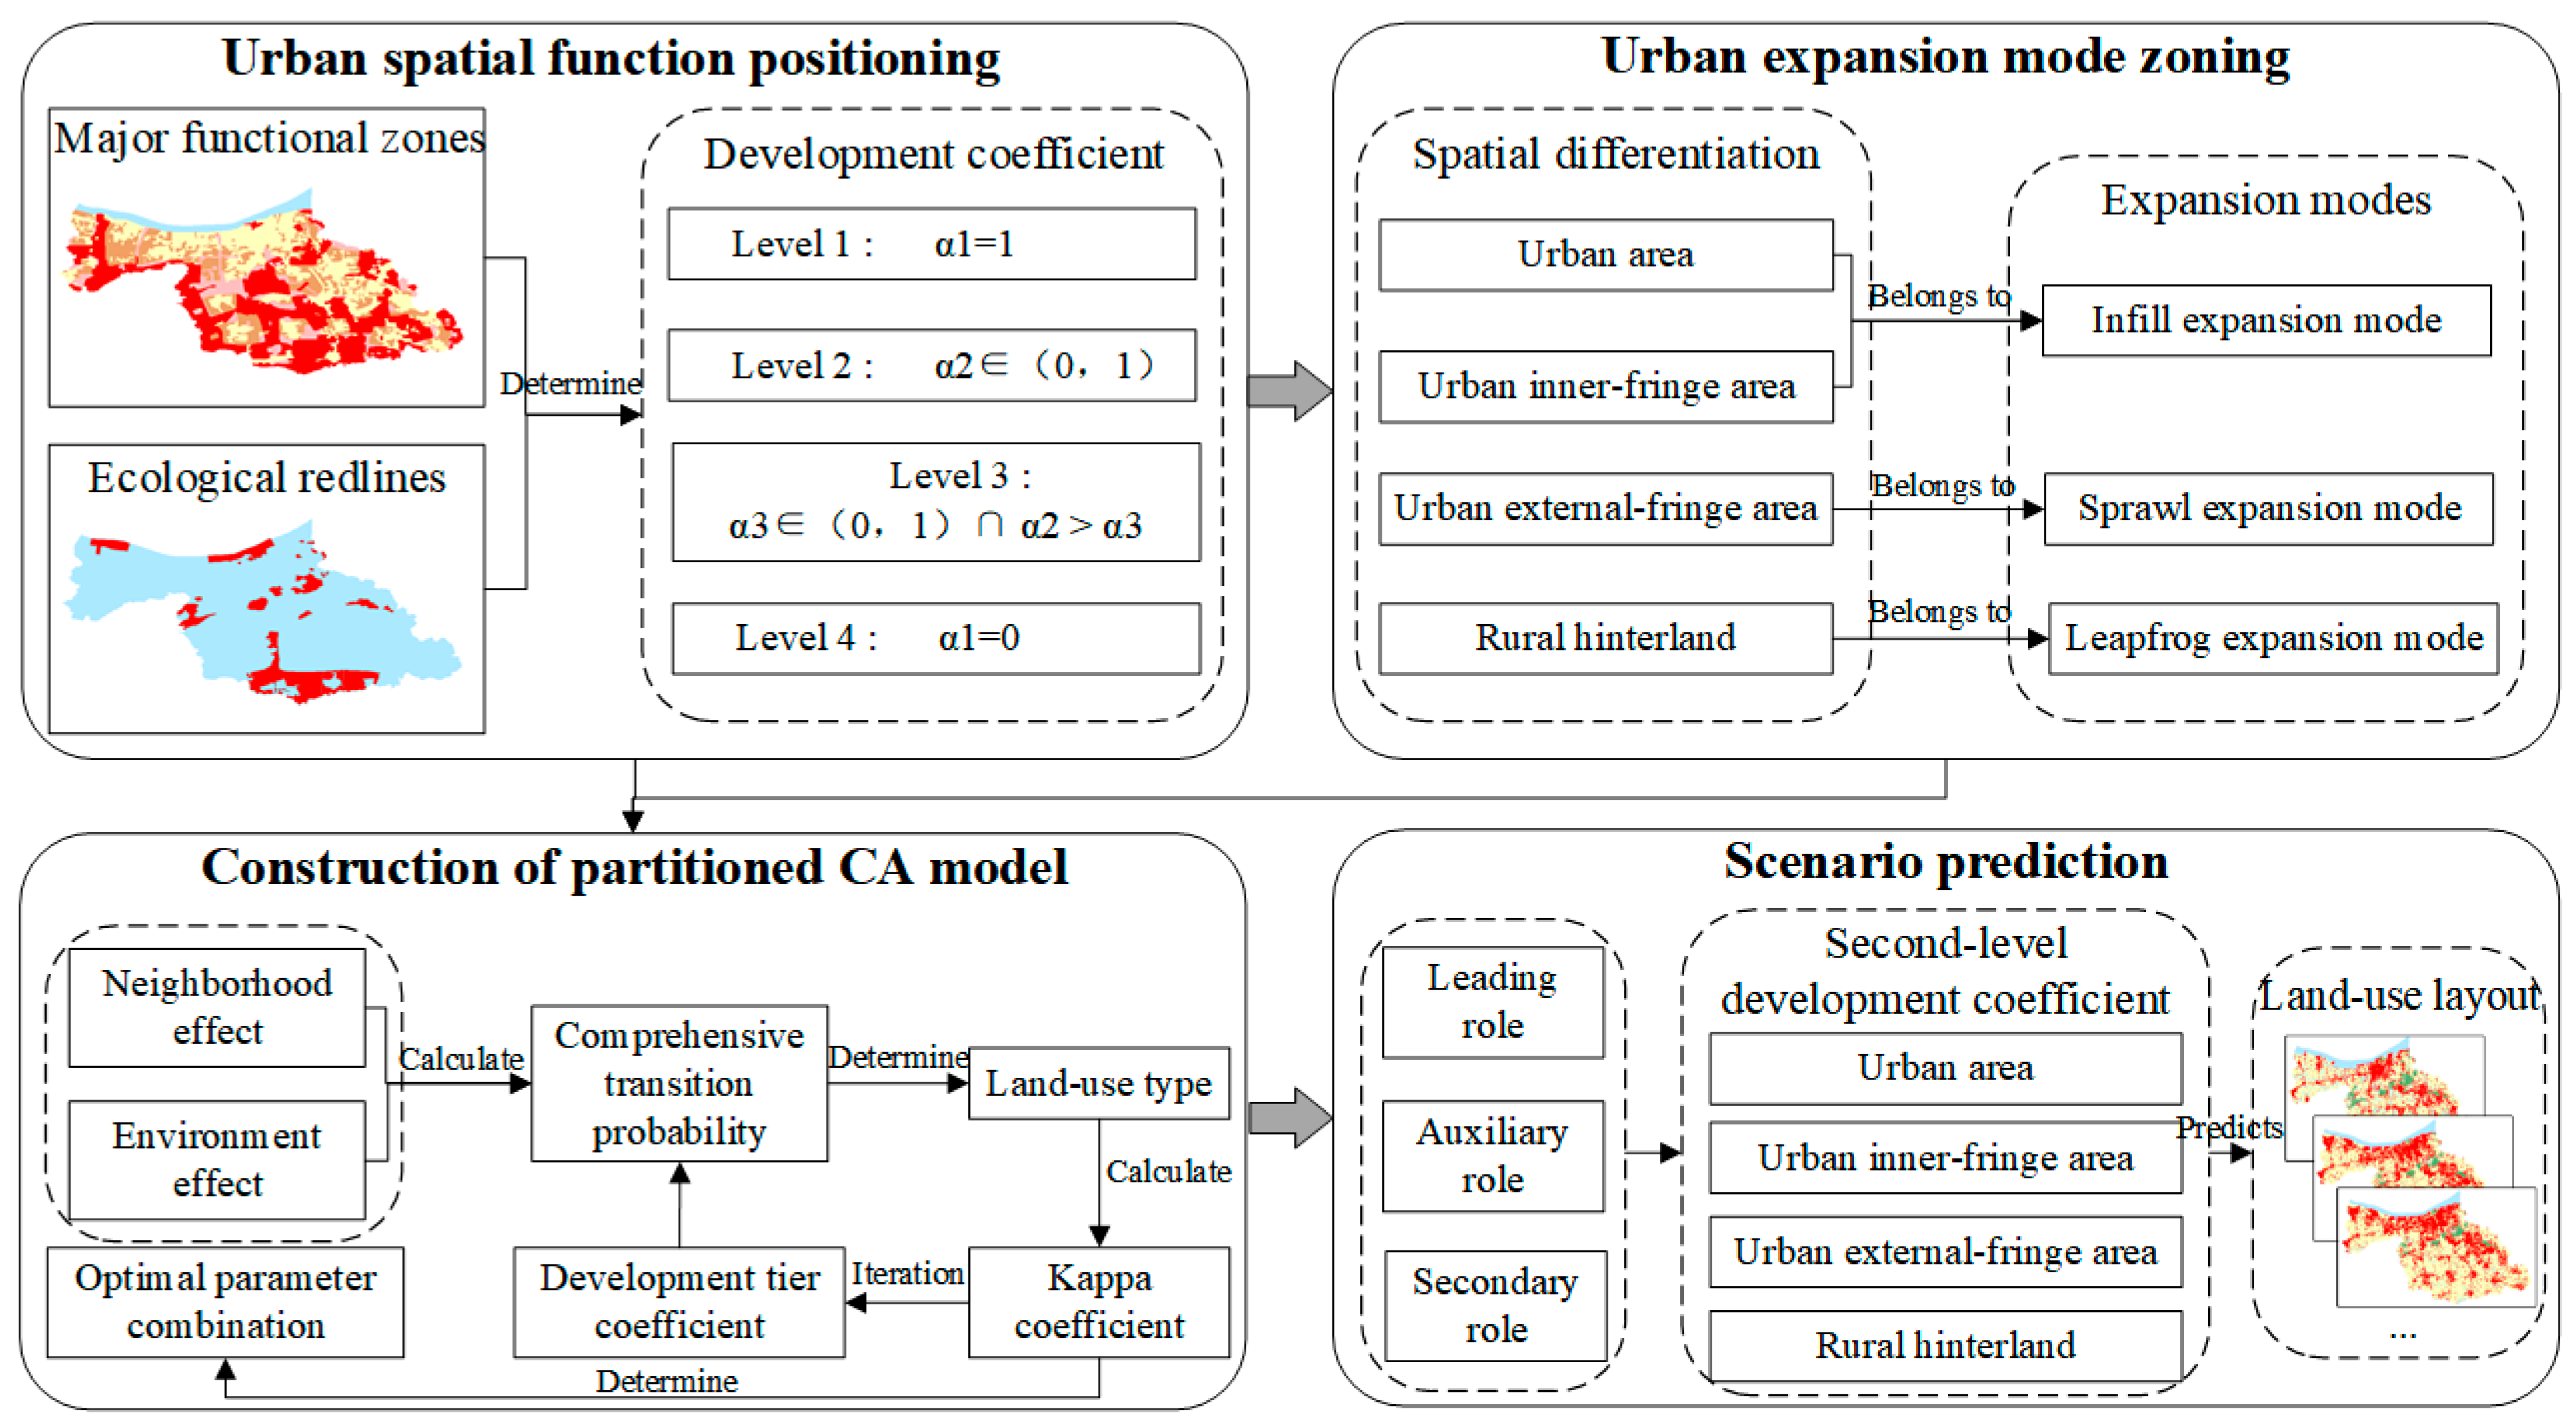
2. Methodology
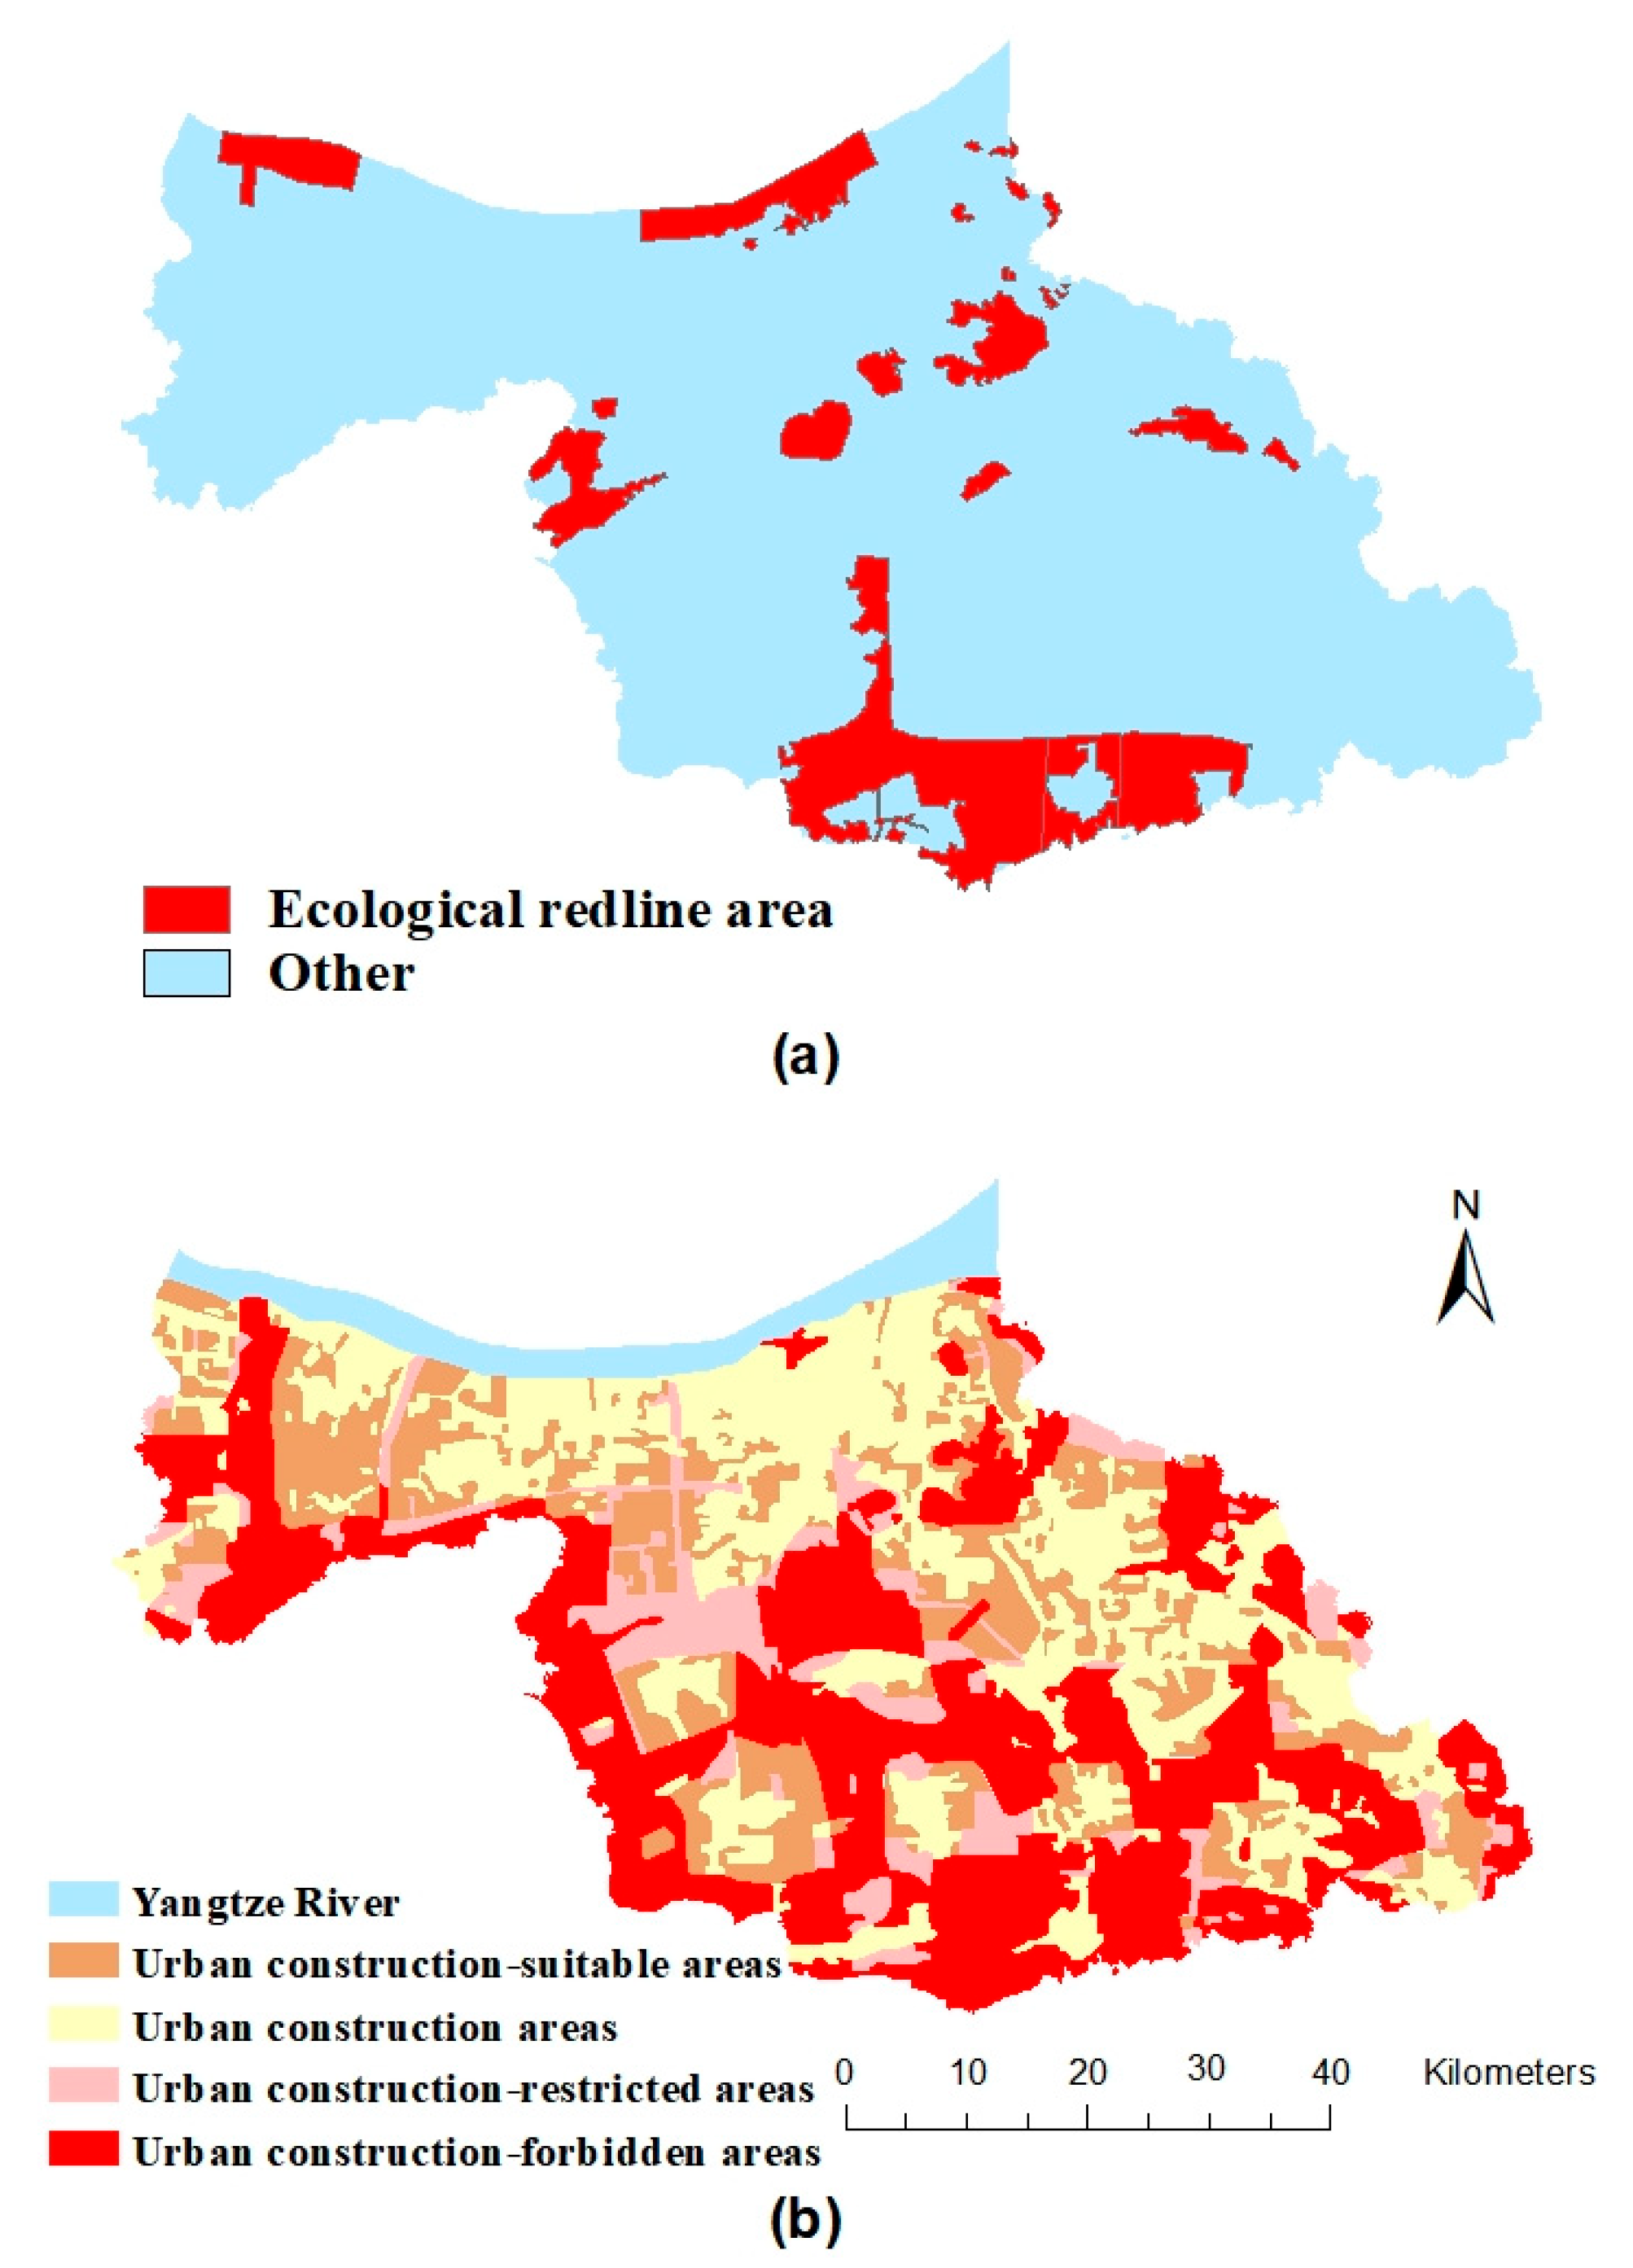
2.1. Study Area and Data
2.2. Urban Spatial Functional Zoning
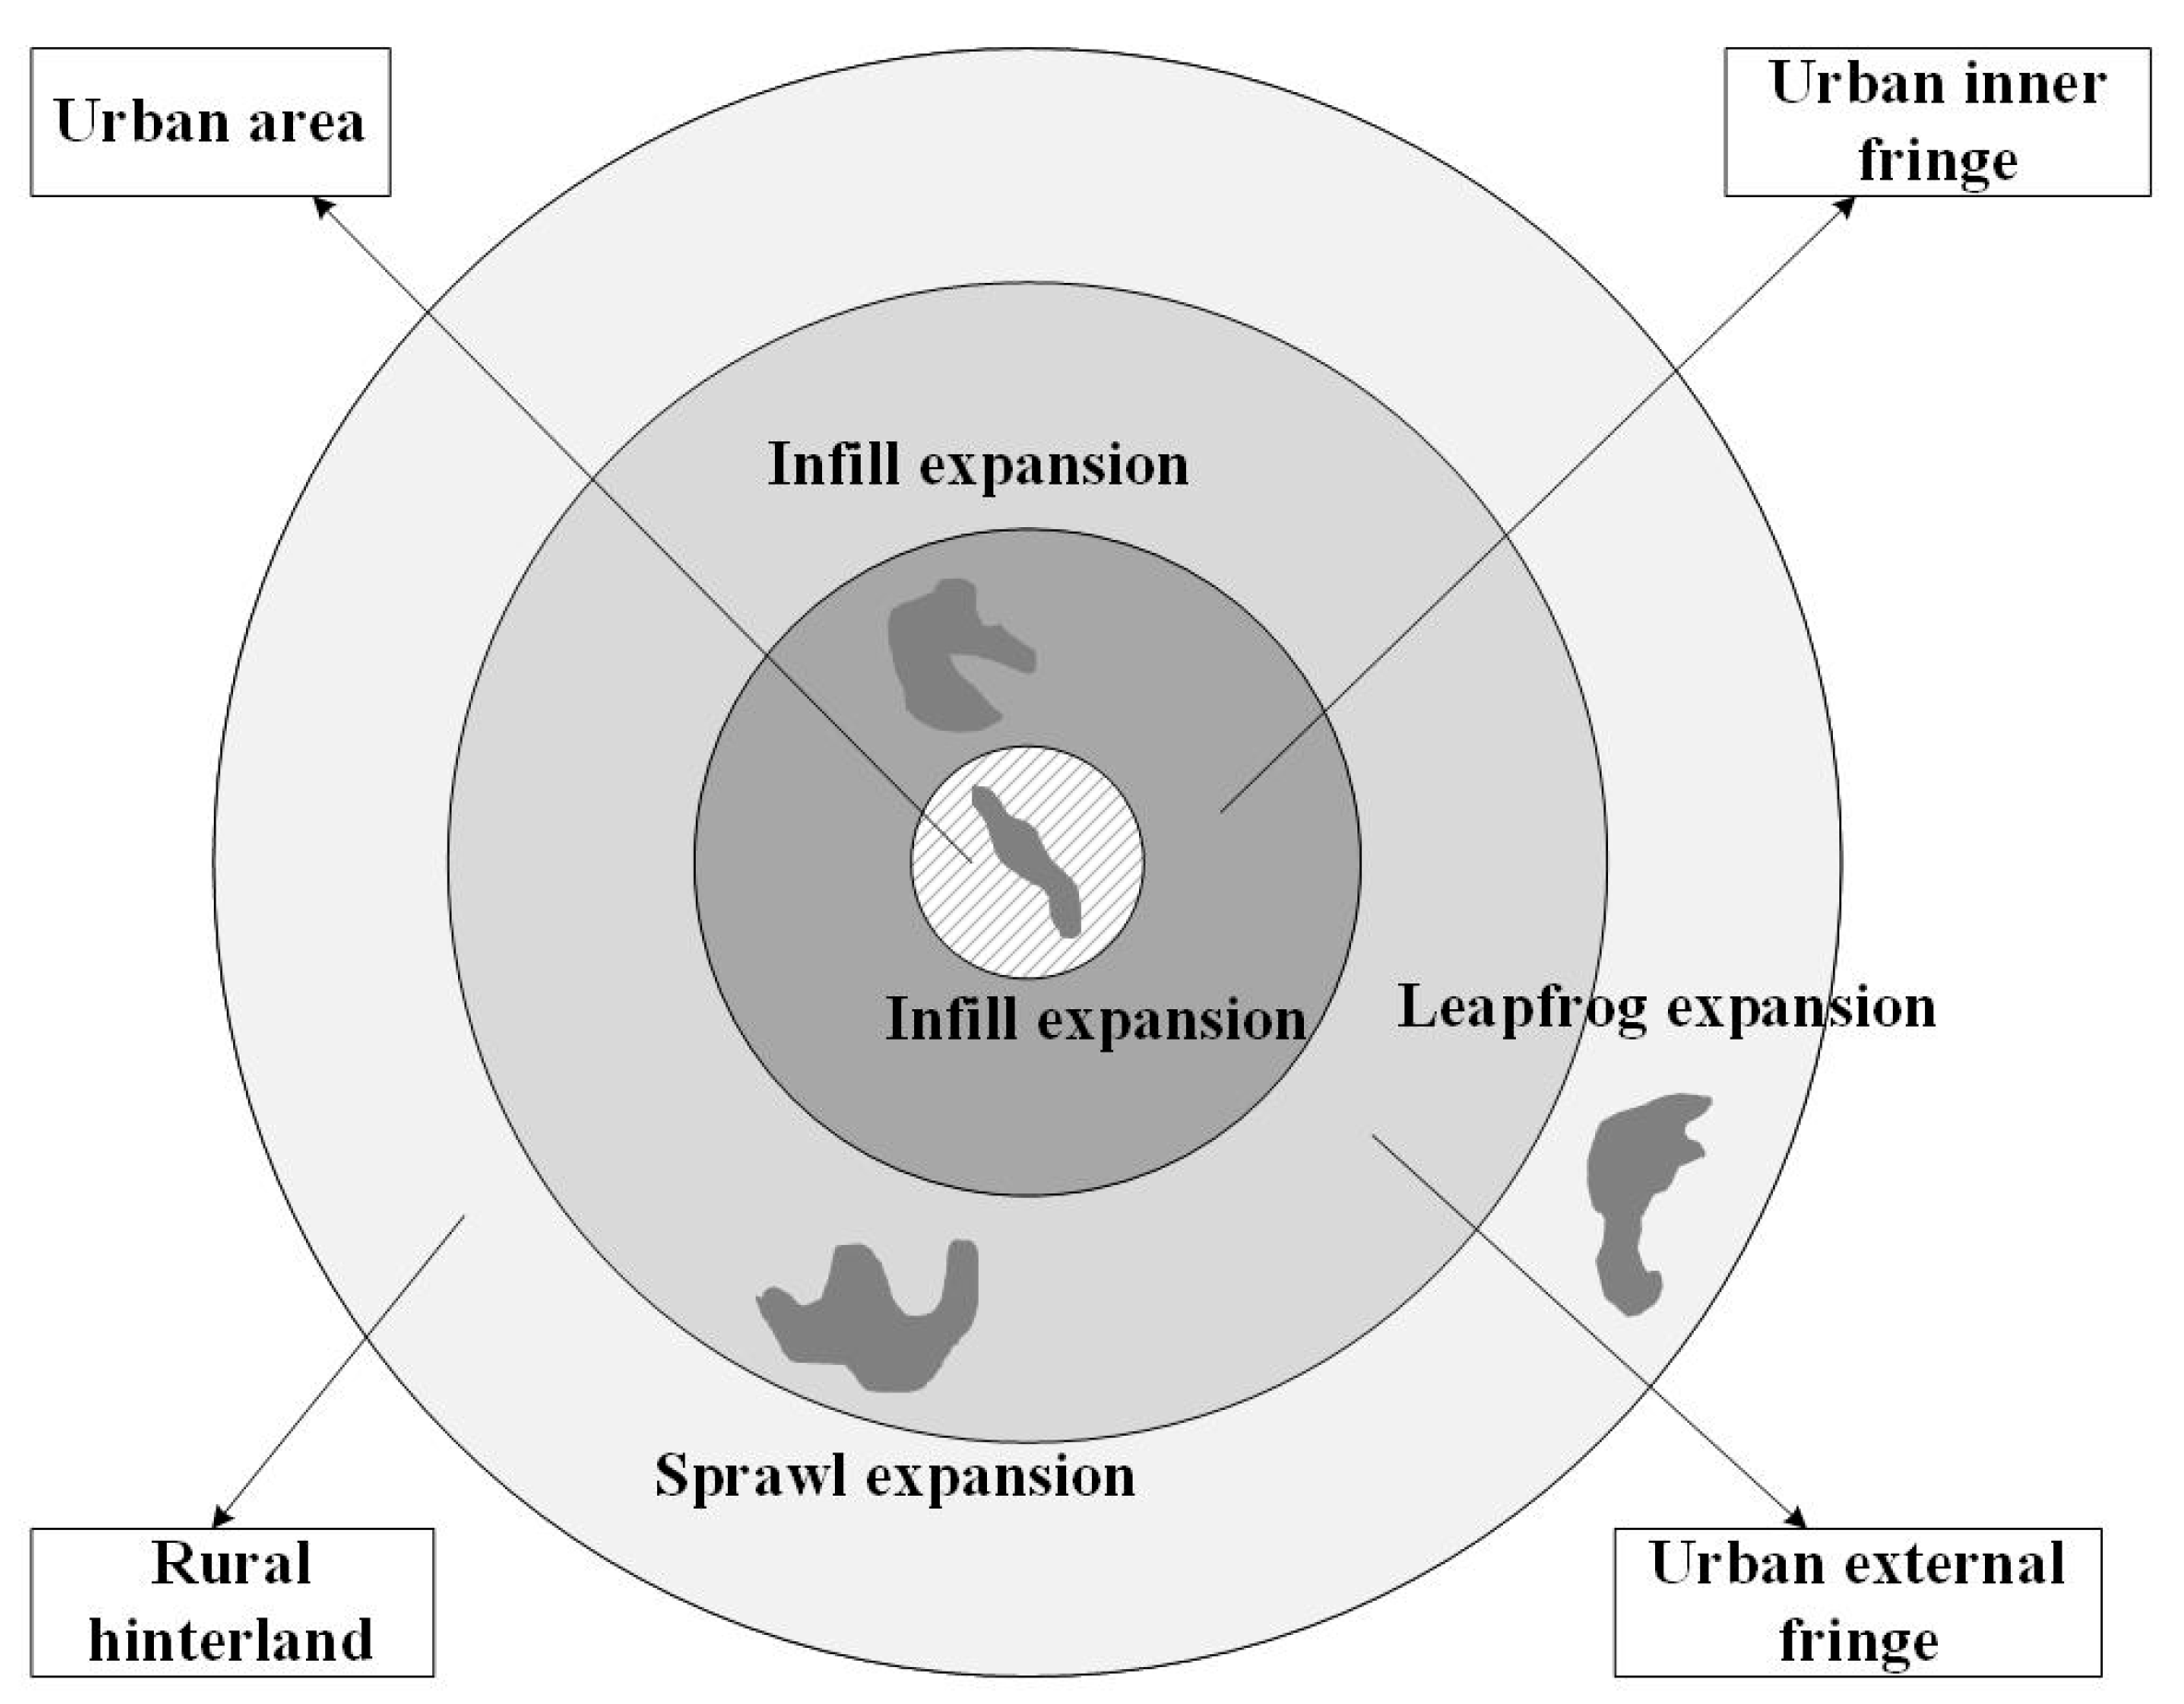
2.3. Urban Land Expansion Mode Zoning
2.4. Urban Land Expansion Simulation
2.4.1. Neighborhood Effect
2.4.2. Environment Effect
2.4.3. Comprehensive Transition Probability
2.4.4. Parameter Determination
2.5. Multi-Scenario Design for Urban Land Expansion
3. Results
3.1. Spatial Pattern of Urban Functional Zoning
3.2. Analysis of Urban Land Expansion Simulation
3.2.1. Analysis of Model Parameters
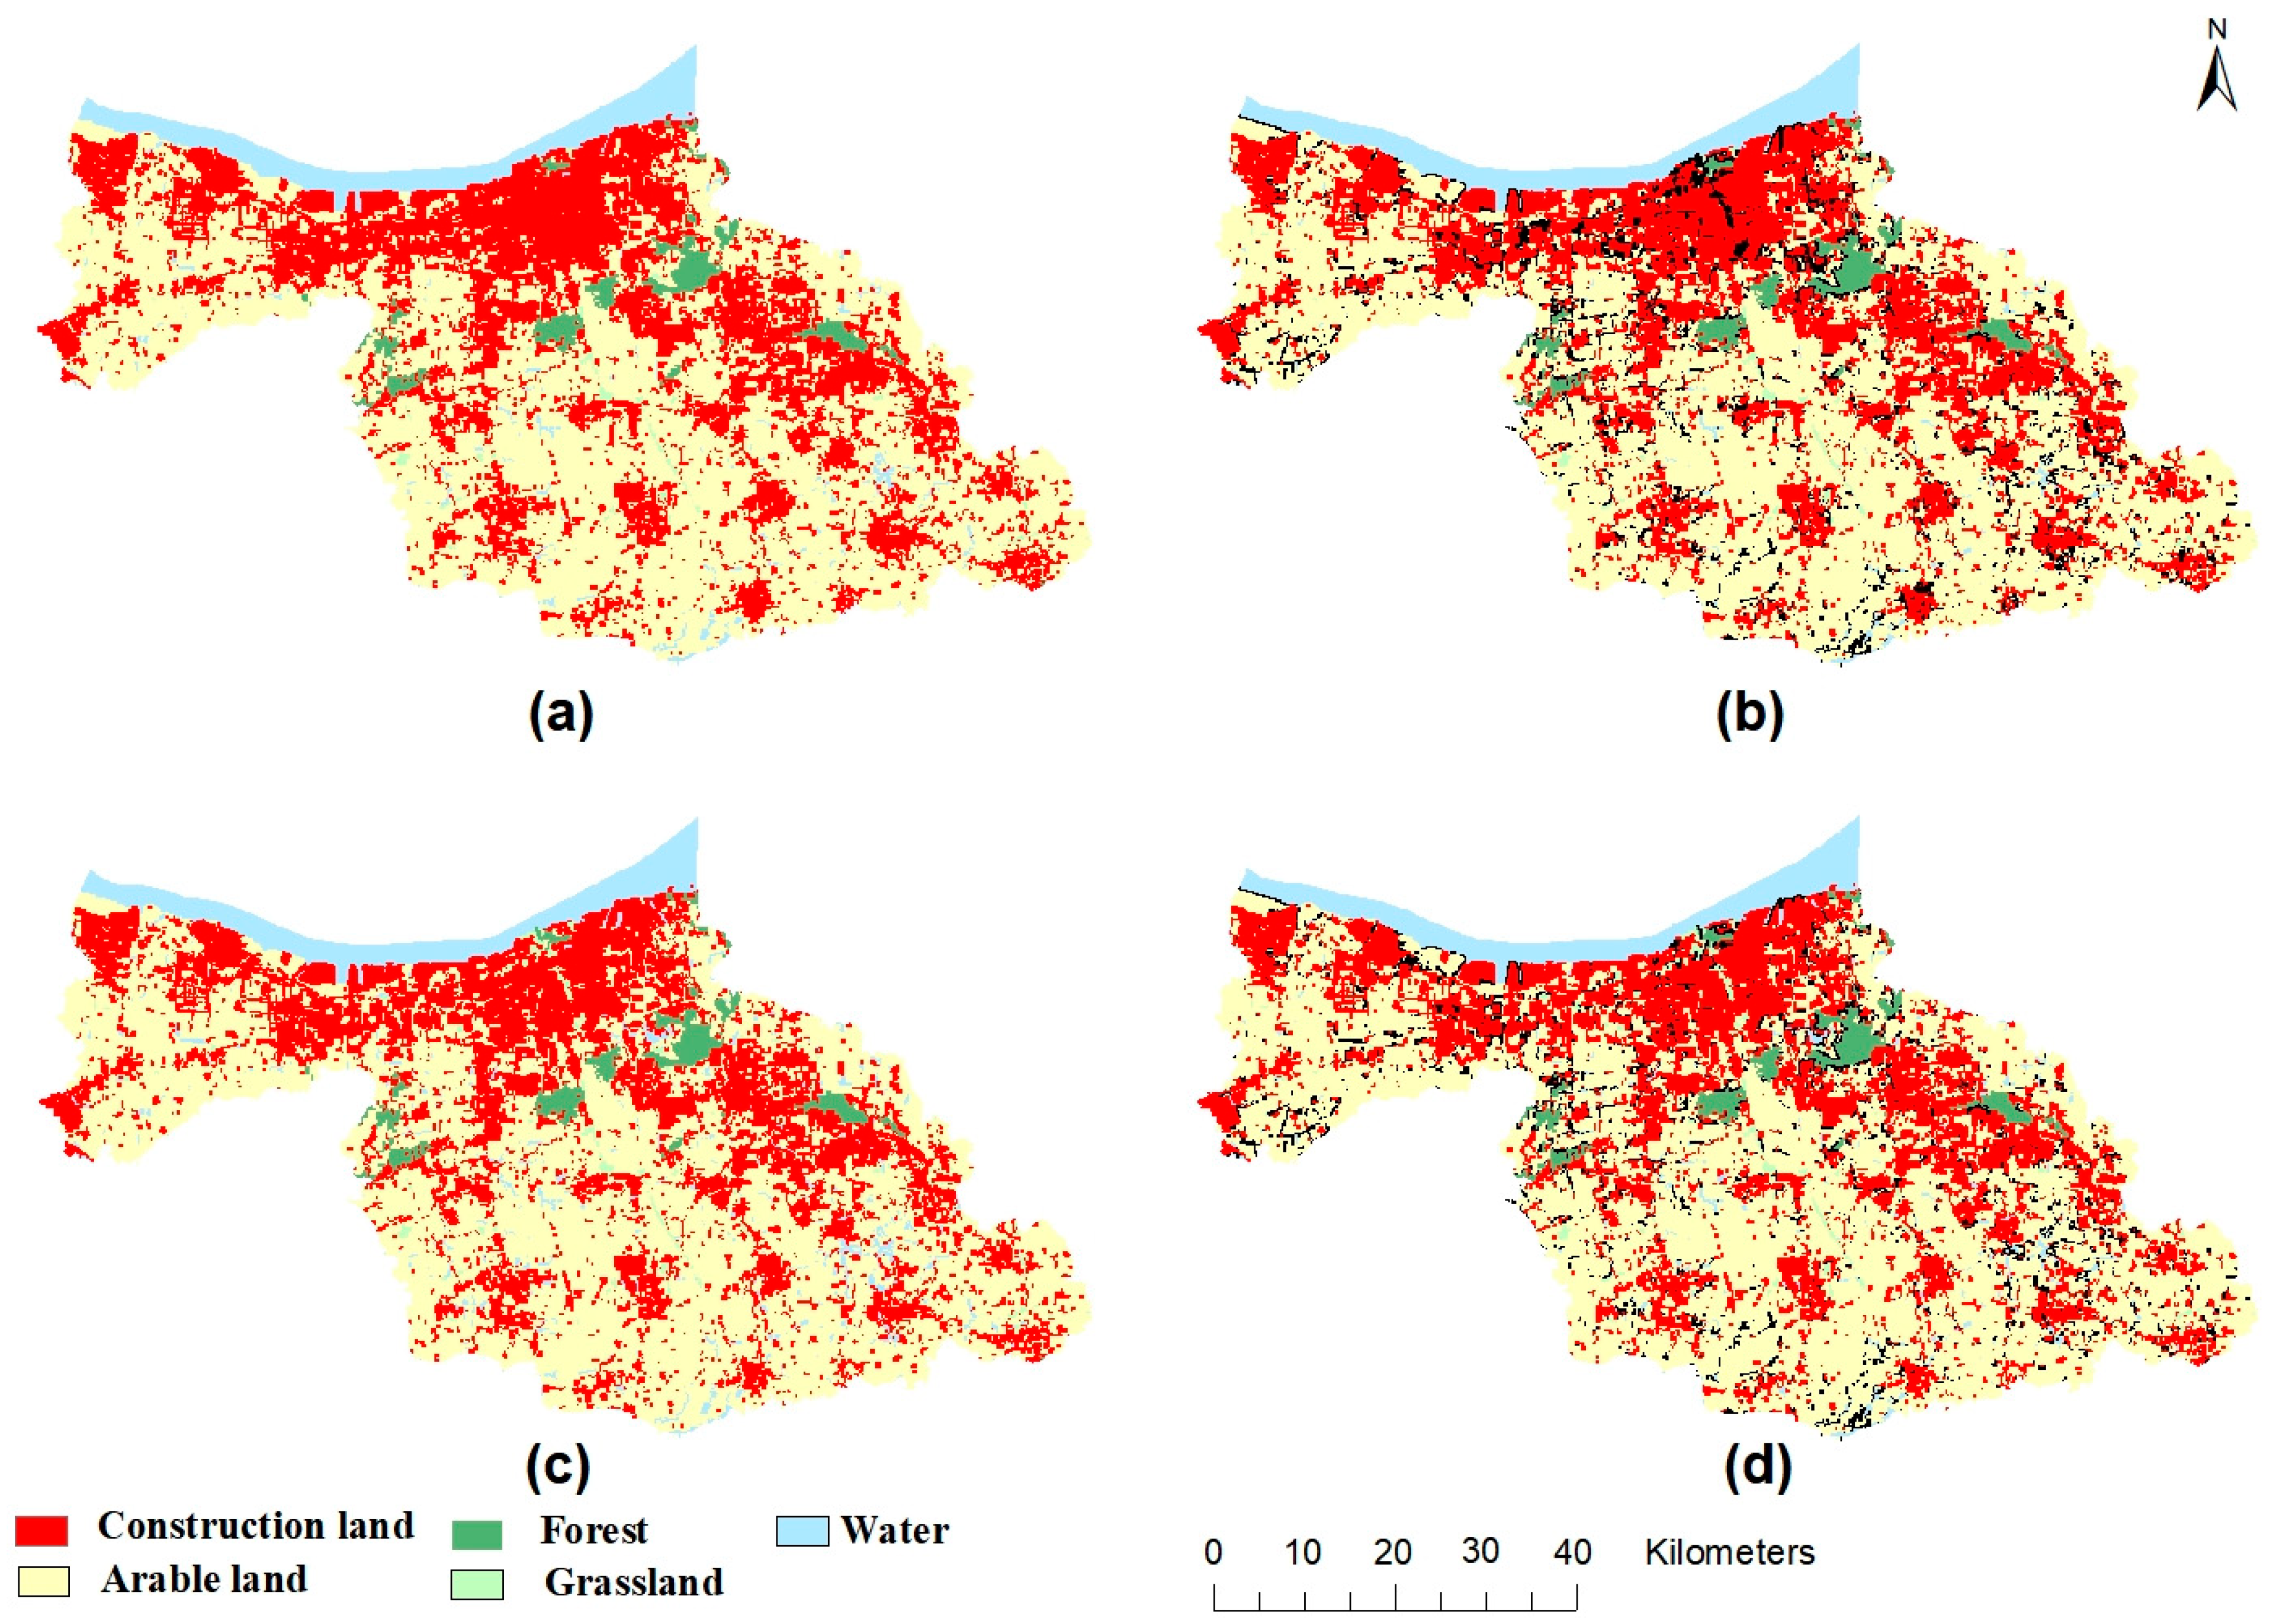
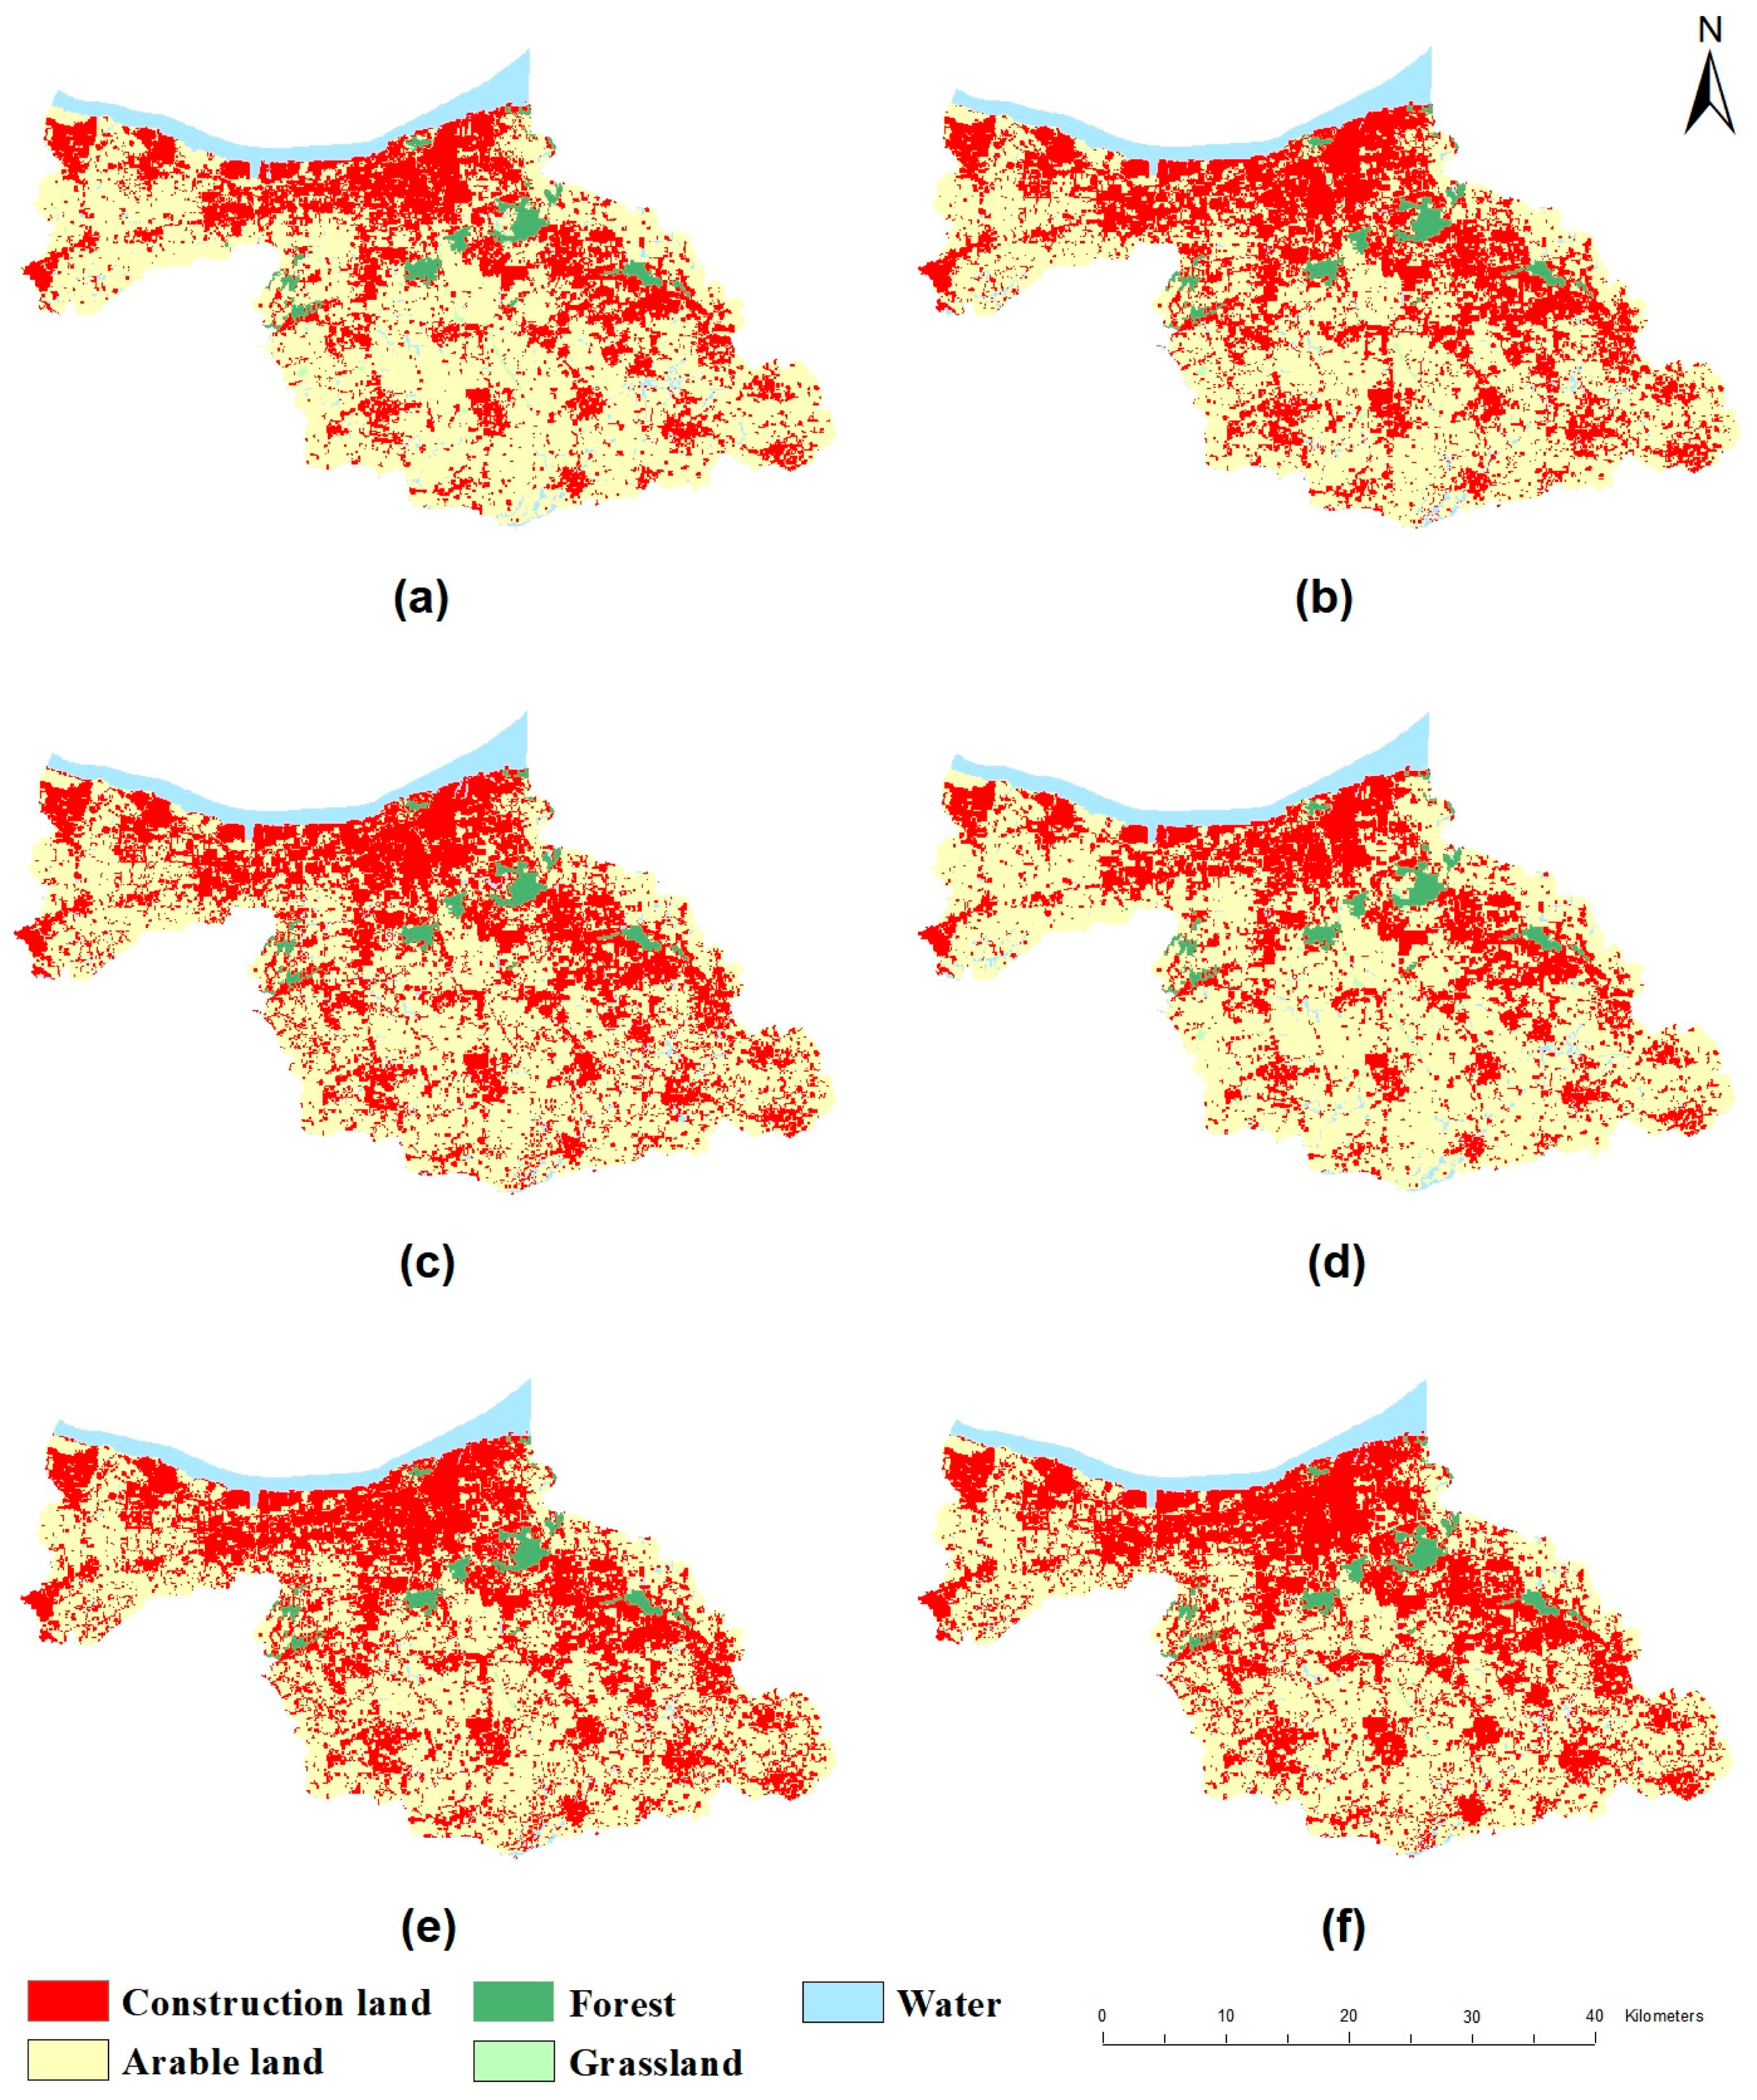
3.2.2. Analysis of Simulated Results
3.3. Prediction of Multi-Scenario Urban Land Expansion
4. Discussion
5. Conclusions
Author Contributions
Funding
Data Availability Statement
Conflicts of Interest
References
- Gu, C. Urbanization: Processes and driving forces. Sci. China Earth Sci. 2019, 62, 1351–1360. [Google Scholar]
- Yang, R.; Xu, Q.; Long, H. Spatial distribution characteristics and optimized reconstruction analysis of China’s rural settlements during the process of rapid urbanization. J. Rural. Stud. 2016, 47, 413–424. [Google Scholar]
- He, C.; Chen, T.; Mao, X.; Zhou, Y. Economic transition, urbanization and population redistribution in China. Habitat Int. 2016, 51, 39–47. [Google Scholar]
- Zhang, X.; Song, W.; Wang, J.; Wen, B.; Yang, D.; Jiang, S.; Wu, Y. Analysis on decoupling between urbanization level and urbanization quality in China. Sustainability 2020, 12, 6835. [Google Scholar] [CrossRef]
- Li, S.; Shao, Y.; Hong, M.; Zhu, C.; Dong, B.; Li, Y.; Zhang, J. Impact mechanisms of urbanization processes on supply-demand matches of cultivated land multifunction in rapid urbanization areas. Habitat Int. 2012, 131, 102726. [Google Scholar]
- De Roo, G.; Miller, D. (Eds.) . Compact Cities and Sustainable Urban Development: A Critical Assessment of Policies and Plans from an International Perspective; Routledge: Oxfordshire, UK, 2019. [Google Scholar]
- Ralha, C.G.; Abreu, C.G.; Coelho, C.G.; Zaghetto, A.; Macchiavello, B.; Machado, R.B. A multi-agent model system for land-use change simulation. Environ. Model. Softw. 2013, 42, 30–46. [Google Scholar]
- Chang, X.; Zhang, F.; Cong, K.; Liu, X. Scenario simulation of land use and land cover change in mining area. Sci. Rep. 2021, 11, 12910. [Google Scholar]
- Wang, J.; Bretz, M.; Dewan, M.A.A.; Delavar, M.A. Machine learning in modelling land-use and land cover-change (LULCC): Current status, challenges and prospects. Sci. Total Environ. 2022, 822, 153559. [Google Scholar]
- Qu, Y.; Jiang, G.; Zhao, Q.; Ma, W.; Zhang, R.; Yang, Y. Geographic identification, spatial differentiation, and formation mechanism of multifunction of rural settlements: A case study of 804 typical villages in Shandong Province, China. J. Clean. Prod. 2017, 166, 1202–1215. [Google Scholar] [CrossRef]
- Kim, S. Spatial inequality and economic development: Theories, facts, and policies. In Urbanization and Growth; World Bank Publications: Washington, DC, USA, 2008; pp. 133–166. [Google Scholar]
- Parr, J.B. The regional economy, spatial structure and regional urban systems. Reg. Stud. 2014, 48, 1926–1938. [Google Scholar]
- Chen, Y.; Liu, X.; Li, X.; Liu, X.; Yao, Y.; Hu, G.; Pei, F. Delineating urban functional areas with building-level social media data: A dynamic time warping (DTW) distance based k-medoids method. Landsc. Urban Plan. 2017, 160, 48–60. [Google Scholar] [CrossRef]
- Ma, Y.; Zhang, P.; Zhao, K.; Zhou, Y.; Zhao, S. A dynamic performance and differentiation management policy for urban construction land use change in Gansu, China. Land 2022, 11, 942. [Google Scholar] [CrossRef]
- Lambin, E.F.; Meyfroidt, P.; Rueda, X.; Blackman, A.; Börner, J.; Cerutti, P.O.; Wunder, S. Effectiveness and synergies of policy instruments for land use governance in tropical regions. Glob. Environ. Change 2014, 28, 129–140. [Google Scholar] [CrossRef]
- Wang, Z. Land spatial development based on carrying capacity, land development potential, and efficiency of urban agglomerations in China. Sustainability 2018, 10, 4701. [Google Scholar] [CrossRef]
- Tian, Y.; Sun, C. Comprehensive carrying capacity, economic growth and the sustainable development of urban areas: A case study of the Yangtze River Economic Belt. J. Clean. Prod. 2018, 195, 486–496. [Google Scholar] [CrossRef]
- Zhao, Y.; Leng, H.; Sun, P.; Yuan, Q. A spatial zoning model of municipal administrative areas based on major function-oriented zones. Sustainability 2018, 10, 2976. [Google Scholar] [CrossRef]
- McGarigal, K.; Plunkett, E.B.; Willey, L.L.; Compton, B.W.; DeLuca, W.V.; Grand, J. Modeling non-stationary urban growth: The SPRAWL model and the ecological impacts of development. Landsc. Urban Plan. 2018, 177, 178–190. [Google Scholar] [CrossRef]
- Liu, D.; Clarke, K.C.; Chen, N. Integrating spatial nonstationarity into SLEUTH for urban growth modeling: A case study in the Wuhan metropolitan area. Comput. Environ. Urban Syst. 2020, 84, 101545. [Google Scholar] [CrossRef]
- Geng, L.; Zhang, Y.; Hui, H.; Wang, Y.; Xue, Y. Response of urban ecosystem carbon storage to land use/cover change and its vulnerability based on major function-oriented zone planning. Land 2023, 12, 1563. [Google Scholar] [CrossRef]
- Liu, W.; Liu, J.; Kuang, W.; Ning, J. Examining the influence of the implementation of Major Function-oriented Zones on built-up area expansion in China. J. Geogr. Sci. 2017, 27, 643–660. [Google Scholar] [CrossRef]
- Wang, J.; Li, Y.; Wang, Q.; Cheong, K.C. Urban–rural construction land replacement for more sustainable land use and regional development in China: Policies and practices. Land 2019, 8, 171. [Google Scholar] [CrossRef]
- Güneralp, B.; Reba, M.; Hales, B.U.; Wentz, E.A.; Seto, K.C. Trends in urban land expansion, density, and land transitions from 1970 to 2010: A global synthesis. Environ. Res. Lett. 2020, 15, 44015. [Google Scholar]
- Long, H.; Li, Y.; Liu, Y.; Woods, M.; Zou, J. Accelerated restructuring in rural China fueled by ‘increasing vs. decreasing balance’land-use policy for dealing with hollowed villages. Land Use Policy 2012, 29, 11–22. [Google Scholar]
- Mahtta, R.; Fragkias, M.; Güneralp, B.; Mahendra, A.; Reba, M.; Wentz, E.A.; Seto, K.C. Urban land expansion: The role of population and economic growth for 300 + cities. Npj Urban Sustain. 2022, 2, 5. [Google Scholar]
- Fei, W.; Zhao, S. Urban land expansion in China’s six megacities from 1978 to 2015. Sci. Total Environ. 2019, 664, 60–71. [Google Scholar]
- Bidandi, F.; Williams, J.J. Understanding urban land, politics, and planning: A critical appraisal of Kampala’s urban sprawl. Cities 2020, 106, 102858. [Google Scholar]
- Glockmann, M.; Li, Y.; Lakes, T.; Kropp, J.P.; Rybski, D. Quantitative evidence for leapfrogging in urban growth. Environ. Plan. B Urban Anal. City Sci. 2022, 49, 352–367. [Google Scholar] [CrossRef]
- Meng, L.; Sun, Y.; Zhao, S. Comparing the spatial and temporal dynamics of urban expansion in Guangzhou and Shenzhen from 1975 to 2015: A case study of pioneer cities in China’s rapid urbanization. Land Use Policy 2020, 97, 104753. [Google Scholar]
- Li, G.; Sun, S.; Fang, C. The varying driving forces of urban expansion in China: Insights from a spatial-temporal analysis. Landsc. Urban Plan. 2018, 174, 63–77. [Google Scholar]
- Akhter, S.T.; Noon, M.H. Modeling spillover effects of leapfrog development and urban sprawl upon institutional delinquencies: A case for Pakistan. Procedia Soc. Behav. Sci. 2016, 216, 279–294. [Google Scholar]
- Cheng, C.; Yang, X.; Cai, H. Analysis of spatial and temporal changes and expansion patterns in mainland Chinese urban land between 1995 and 2015. Remote Sens. 2021, 13, 2090. [Google Scholar] [CrossRef]
- Wei, Y.D.; Ewing, R. Urban expansion, sprawl and inequality. Landsc. Urban Plan. 2018, 177, 259–265. [Google Scholar]
- Verburg, P.H.; Soepboer, W.; Veldkamp, A.; Limpiada, R.; Espaldon, V.; Mastura, S.S. Modeling the spatial dynamics of regional land use: The CLUE-S model. Environ. Manag. 2002, 30, 391–405. [Google Scholar]
- Liu, X.; Liang, X.; Li, X. A future land use simulation model (FLUS) for simulating multiple land use scenarios by coupling human and natural effects. Landsc. Urban Plan. 2017, 168, 94–116. [Google Scholar]
- Zhai, Y.; Yao, Y.; Guan, Q.; Liang, X.; Li, X.; Pan, Y.; Zhou, J. Simulating urban land use change by integrating a convolutional neural network with vector-based cellular automata. Int. J. Geogr. Inf. Sci. 2020, 34, 1475–1499. [Google Scholar]
- Liu, J.; Xiao, B.; Li, Y.; Wang, X.; Bie, Q.; Jiao, J. Simulation of dynamic urban expansion under ecological constraints using a long short term memory network model and Cellular Automata. Remote Sens. 2021, 13, 1499. [Google Scholar] [CrossRef]
- Zhang, W.; Ma, Y.; Zhu, D.; Dong, L.; Liu, Y. Metrogan: Simulating urban morphology with generative adversarial network. In Proceedings of the 28th ACM SIGKDD Conference on Knowledge Discovery and Data Mining, Washington, DC, USA, 14–18 August 2022; pp. 2482–2492. [Google Scholar]
- Xu, T.; Gao, J.; Coco, G. Simulation of urban expansion via integrating artificial neural network with Markov chain–cellular automata. Int. J. Geogr. Inf. Sci. 2019, 33, 1960–1983. [Google Scholar]
- Zhang, Z.; Wang, X.; Zhang, Y.; Gao, Y.; Liu, Y.; Sun, X.; Yin, S. Simulating land use change for sustainable land management in rapid urbanization regions: A case study of the Yangtze River Delta region. Landsc. Ecol. 2023, 38, 1807–1830. [Google Scholar]
- Jiang, X.; Wang, M.; Xu, G. Urban development boundary simulation based on “Double Evaluation” and FLUS Model. J. Geod. Geoinf. Sci. 2022, 5, 7–18. [Google Scholar]
- Yao, Y.; Ma, L.; Che, X.; Dou, H. Simulation study of urban expansion under ecological constraint—Taking Yuzhong Country, China as an example. Urban For. Urban Green. 2021, 57, 126933. [Google Scholar]
- Liu, Z.; Yang, Y.; He, C.; Tu, M. Climate change will constrain the rapid urban expansion in drylands: A scenario analysis with the zoned Land Use Scenario Dynamics-urban model. Sci. Total Environ. 2019, 651, 2772–2786. [Google Scholar] [CrossRef] [PubMed]
- Shu, H.; Xiong, P. Reallocation planning of urban industrial land for structure optimization and emission reduction: A practical analysis of urban agglomeration in China’s Yangtze River Delta. Land Use Policy 2019, 81, 604–623. [Google Scholar] [CrossRef]
- Huang, Y.; Qiu, Q.; Sheng, Y.; Min, X.; Cao, Y. Exploring the relationship between urbanization and the eco-environment: A case study of Beijing. Sustainability 2019, 11, 6298. [Google Scholar] [CrossRef]
- Yu, J.; Liu, J. Policies in the development of offshore cage aquaculture in China: Evolution, performance, and prospects. Rev. Fish. Sci. Aquac. 2023, 31, 216–232. [Google Scholar] [CrossRef]
- Xu, X.; Tan, Y.; Yang, G.; Barnett, J. China’s ambitious ecological red lines. Land Use Policy 2018, 79, 447–451. [Google Scholar]
- Liu, Y.; Wang, L.; Lu, Y.; Zou, Q.; Yang, L.; He, Y.; Li, Q. Identification and optimization methods for delineating ecological red lines in Sichuan Province of southwest China. Ecol. Indic. 2023, 146, 109786. [Google Scholar] [CrossRef]
- Liang, C.; Zeng, J.; Zhang, R.C.; Wang, Q.W. Connecting urban area with rural hinterland: A stepwise ecological security network construction approach in the urban–rural fringe. Ecol. Indic. 2022, 138, 108794. [Google Scholar] [CrossRef]
- Dadashpoor, H.; Ahani, S. A conceptual typology of the spatial territories of the peripheral areas of metropolises. Habitat Int. 2019, 90, 102015. [Google Scholar] [CrossRef]
- Yang, J.; Zhu, X.; Chen, W.; Sun, Y.; Zhu, J. Modeling land-use change using partitioned vector cellular automata while considering urban spatial structure. Environ. Plan. B Urban Anal. City Sci. 2023, 50, 2273–2293. [Google Scholar] [CrossRef]
- Zhang, Y.; Chang, X.; Liu, Y.; Lu, Y.; Wang, Y.; Liu, Y. Urban expansion simulation under constraint of multiple ecosystem services (MESs) based on cellular automata (CA)-Markov model: Scenario analysis and policy implications. Land Use Policy 2021, 108, 105667. [Google Scholar] [CrossRef]
- Liu, D.; Zheng, X.; Wang, H. Land-use Simulation and Decision-Support system (LandSDS): Seamlessly integrating system dynamics, agent-based model, and cellular automata. Ecol. Model. 2020, 417, 108924. [Google Scholar]
- Tian, G.; Ma, B.; Xu, X.; Liu, X.; Xu, L.; Liu, X.; Kong, L. Simulation of urban expansion and encroachment using cellular automata and multi-agent system model—A case study of Tianjin metropolitan region, China. Ecol. Indic. 2016, 70, 439–450. [Google Scholar]
- Arsanjani, J.J.; Helbich, M.; Kainz, W.; Boloorani, A.D. Integration of logistic regression, Markov chain and cellular automata models to simulate urban expansion. Int. J. Appl. Earth Obs. Geoinf. 2013, 21, 265–275. [Google Scholar]
- van Vliet, J.; Hagen-Zanker, A.; Hurkens, J.; van Delden, H. A fuzzy set approach to assess the predictive accuracy of land use simulations. Ecol. Model. 2013, 261, 32–42. [Google Scholar]
- Huang, D.; Zhu, S.; Liu, T. Are there differences in the forces driving the conversion of different non-urban lands into urban use? A case study of Beijing. Environ. Sci. Pollut. Res. 2022, 29, 6414–6432. [Google Scholar]
- He, S.; Yu, S.; Li, G.; Zhang, J. Exploring the influence of urban form on land-use efficiency from a spatiotemporal heterogeneity perspective: Evidence from 336 Chinese cities. Land Use Policy 2020, 95, 104576. [Google Scholar]
- Aly, S.S.; Attwa, Y.A. Infill development as an approach for promoting compactness of urban form. Sustain. Dev. Plan. VI 2013, 173, 455. [Google Scholar]
- Surya, B.; Salim, A.; Hernita, H.; Suriani, S.; Menne, F.; Rasyidi, E.S. Land use change, urban agglomeration, and urban sprawl: A sustainable development perspective of Makassar City, Indonesia. Land 2021, 10, 556. [Google Scholar] [CrossRef]
- Tombolini, I.; Zambon, I.; Ippolito, A.; Grigoriadis, S.; Serra, P.; Salvati, L. Revisiting “Southern” sprawl: Urban growth, socio-spatial structure and the influence of local economic contexts. Economies 2015, 3, 237–259. [Google Scholar] [CrossRef]
- Polidoro, M.; de Lollo, J.A.; Barros, M.V.F. Urban sprawl and the challenges for urban planning. J. Environ. Prot. 2012, 3, 1010–1019. [Google Scholar]
- Tian, L.; Ge, B.; Li, Y. Impacts of state-led and bottom-up urbanization on land use change in the peri-urban areas of Shanghai: Planned growth or uncontrolled sprawl? Cities 2017, 60, 476–486. [Google Scholar]
- Buller, H.; Furuseth, O.; Gilg, A.W. The City’s Hinterland: Dynamism and Divergence in Europe’s Peri-Urban Territories; Ashgate Publishing Ltd.: Farnham, UK, 2012. [Google Scholar]
- Chao, W.; Yu, Y.; Fanzong, G. Using street view images to examine the association between human perceptions of locale and urban vitality in Shenzhen, China. Sustain. Cities Soc. 2023, 88, 104291. [Google Scholar]
- Torrens, P.M.; Alberti, M. Measuring Sprawl; CASA Working Papers; University College London: London, UK, 2000. [Google Scholar]
- Frenkel, A.; Ashkenazi, M. Measuring Urban Sprawl: How Can We Deal with It? Environ. Plan. B 2008, 35, 56–79. [Google Scholar]
- Hamidi, S.; Ewing, R. A longitudinal study of changes in urban sprawl between 2000 and 2010 in the United States. Landsc. Urban Plan. 2014, 128, 72–82. [Google Scholar]
- Batty, M.; Axhausen, K.W.; Giannotti, F. Smart cities of the future. Eur. Phys. J. Spec. Top. 2012, 214, 481–518. [Google Scholar]
- Koomen, E.; Dekkers, J.; Van Dijk, T. Open-space preservation in the Netherlands: Planning, practice and prospects. Land Use Policy 2008, 25, 361–377. [Google Scholar]
- Nelson, A.C.; Moore, T. Assessing urban growth management: The case of Portland, Oregon, the USA’s largest urban growth boundary. Land Use Policy 1993, 10, 293–302. [Google Scholar]
- Hebbert, M. Urban sprawl and urban planning in Japan. Town Plan. Rev. 1986, 57, 141. [Google Scholar]
- Walker, R.A. Nature’s Popular Metropolis: The Greening of the San Francisco Bay Area. In Grounding Urban Natures: Histories and Futures of Urban Ecologies, 1st ed.; Ernstson, H., Sörlin, S., Eds.; MIT Press: Cambridge, MA, USA, 2019; p. 169. [Google Scholar]
- Kenley, R.; Seppänen, O. Location-Based Management for Construction: Planning, Scheduling and Control; Routledge: Oxfordshire, UK, 2006. [Google Scholar]
- Naghavi, M.; Alesheikh, A.A.; Hakimpour, F.; Vahidnia, M.H.; Vafaeinejad, A. VGI-based spatial data infrastructure for land administration. Land Use Policy 2022, 114, 105969. [Google Scholar]
- Bao, S.; Lu, L.; Zhi, J.; Li, J. An Optimization Strategy for Provincial “Production–Living–Ecological” Spaces under the Guidance of Major Function-Oriented Zoning in China. Sustainability 2024, 16, 2248. [Google Scholar] [CrossRef]
- Wang, W.; Zhang, X.; Wu, Y.; Zhou, L.; Skitmore, M. Development priority zoning in China and its impact on urban growth management strategy. Cities 2017, 62, 1–9. [Google Scholar]
- Zhang, X.; Wang, X.; Du, S. A systematic review of urban form generation and optimization for performance-driven urban design. Build. Environ. 2024, 253, 111269. [Google Scholar]
- Haaland, C.; van Den Bosch, C.K. Challenges and strategies for urban green-space planning in cities undergoing densification: A review. Urban For. Urban Green. 2015, 14, 760–771. [Google Scholar]
- Woldesemayat, E.M.; Genovese, P.V. Urban green space composition and configuration in functional land use areas in Addis Ababa, Ethiopia, and their relationship with urban form. Land 2021, 10, 85. [Google Scholar] [CrossRef]
- Su, Y.; Chen, X.; Liao, J.; Zhang, H.; Wang, C.; Ye, Y.; Wang, Y. Modeling the optimal ecological security pattern for guiding the urban constructed land expansions. Urban For. Urban Green. 2016, 19, 35–46. [Google Scholar]
- Qi, T.; Li, Y.; Huang, M.; Luo, B.; Peng, Z.; Wang, W.; Shang, Z. Land intensification use scenarios based on urban land suitability assessment of the national park. Sustain. Cities Soc. 2024, 102, 105229. [Google Scholar]


| Development Tier | Area | Development Coefficient |
|---|---|---|
| Level 1 | Urban construction area | = 1 |
| Level 2 | Urban construction-suitable area | ∈ (0, 1) |
| Level 3 | Urban construction-restricted area | |
| Level 4 | Combination of construction- forbidden and ecological redline areas | = 0 |
| Expansion Mode (Leading–Auxiliary–Secondary) | Development Coefficient | |||
|---|---|---|---|---|
| Urban Area | Inner-Fringe Area | External-Fringe Area | Rural Hinterland | |
| Infill–Sprawl–Leapfrog | 0.8 | 0.6 | 0.4 | 0.2 |
| Sprawl–Infill–Leapfrog | 0.6 | 0.4 | 0.8 | 0.2 |
| Leapfrog–Infill–Sprawl | 0.6 | 0.4 | 0.2 | 0.8 |
| Infill–Leapfrog–Sprawl | 0.8 | 0.6 | 0.2 | 0.4 |
| Sprawl–Leapfrog–Infill | 0.4 | 0.2 | 0.8 | 0.6 |
| Leapfrog–Sprawl–Infill | 0.4 | 0.2 | 0.6 | 0.8 |
| Area | Development Coefficient of Construction Land | |
|---|---|---|
| Second Level | Third Level | |
| Urban area | 0.84 | - |
| Inner-fringe area | 0.79 | 0.08 |
| External-fringe area | 0.89 | 0.32 |
| Rural hinterland | 0.23 | 0.19 |
| Area | Methods | ||
|---|---|---|---|
| Model 1 | Model 2 | Comparison Model | |
| Urban area | 0.921 | 0.921 | 0.825 |
| Inner-fringe area | 0.897 | 0.965 | 0.701 |
| External-fringe area | 0.725 | 0.906 | 0.846 |
| Rural hinterland | 0.960 | 0.960 | 0.852 |
| Global area | 0.883 | 0.959 | 0.806 |
Disclaimer/Publisher’s Note: The statements, opinions and data contained in all publications are solely those of the individual author(s) and contributor(s) and not of MDPI and/or the editor(s). MDPI and/or the editor(s) disclaim responsibility for any injury to people or property resulting from any ideas, methods, instructions or products referred to in the content. |
© 2025 by the authors. Published by MDPI on behalf of the International Society for Photogrammetry and Remote Sensing. Licensee MDPI, Basel, Switzerland. This article is an open access article distributed under the terms and conditions of the Creative Commons Attribution (CC BY) license (https://creativecommons.org/licenses/by/4.0/).
Share and Cite
Yang, J.; Wang, Z.; Sun, Y. Multi-Scenario Simulation of Urban Land Expansion Modes Considering Differences in Spatial Functional Zoning. ISPRS Int. J. Geo-Inf. 2025, 14, 138. https://doi.org/10.3390/ijgi14040138
Yang J, Wang Z, Sun Y. Multi-Scenario Simulation of Urban Land Expansion Modes Considering Differences in Spatial Functional Zoning. ISPRS International Journal of Geo-Information. 2025; 14(4):138. https://doi.org/10.3390/ijgi14040138
Chicago/Turabian StyleYang, Jing, Zheng Wang, and Yizhong Sun. 2025. "Multi-Scenario Simulation of Urban Land Expansion Modes Considering Differences in Spatial Functional Zoning" ISPRS International Journal of Geo-Information 14, no. 4: 138. https://doi.org/10.3390/ijgi14040138
APA StyleYang, J., Wang, Z., & Sun, Y. (2025). Multi-Scenario Simulation of Urban Land Expansion Modes Considering Differences in Spatial Functional Zoning. ISPRS International Journal of Geo-Information, 14(4), 138. https://doi.org/10.3390/ijgi14040138