Article

A Multidimensional Study of the 2023 Beijing Extreme Rainfall: Theme, Location, and Sentiment Based on Social Media Data

1
Beijing Key Laboratory of Big Data Technology for Food Safety, School of Computer and Artificial Intelligence, Beijing Technology and Business University, Beijing 100048, China
2
Institute of Earthquake Forecasting, China Earthquake Administration, Beijing 100036, China
3
Key Laboratory of Earthquake Forecasting and Risk Assessment, Ministry of Emergency Management, Beijing 100036, China
4
School of Computer Science and Artificial Intelligence, Xinjiang HeTian College, Hotan 848000, China
*
Author to whom correspondence should be addressed.
ISPRS Int. J. Geo-Inf. 2025, 14(4), 136; https://doi.org/10.3390/ijgi14040136
Submission received: 18 January 2025 / Revised: 14 March 2025 / Accepted: 20 March 2025 / Published: 24 March 2025

Abstract

:
Extreme rainfall events are significant manifestations of climate change, causing substantial impacts on urban infrastructure and public life. This study takes the extreme rainfall event in Beijing in 2023 as the background and utilizes data from Sina Weibo. Based on large language models and prompt engineering, disaster information is extracted, and a multi-factor coupled disaster multi-sentiment classification model, Bert-BiLSTM, is designed. A disaster analysis framework focusing on three dimensions of theme, location and sentiment is constructed. The results indicate that during the pre-disaster stage, themes are concentrated on warnings and prevention, shifting to specific events and rescue actions during the disaster, and post-disaster, they express gratitude to rescue personnel and highlight social cohesion. In terms of spatial location, the disaster shows significant clustering, predominantly occurring in Mentougou and Fangshan. There is a clear difference in emotional expression between official media and the public; official media primarily focuses on neutral reporting and fact dissemination, while public sentiment is even richer. At the same time, there are also variations in sentiment expressions across different affected regions. This study provides new perspectives and methods for analyzing extreme rainfall events on social media by revealing the evolution of disaster themes, the spatial distribution of disasters, and the temporal and spatial changes in sentiment. These insights can support risk assessment, resource allocation, and public opinion guidance in disaster emergency management, thereby enhancing the precision and effectiveness of disaster response strategies.

1. Introduction

In recent years, the world has suffered from natural disasters such as floods and landslides triggered by extreme rainfall, resulting in heavy property losses and numerous casualties. China is one of the countries deeply affected by these casualties [1]. During extreme rainfall events in areas with a relatively high degree of urbanization, heavy rainfall often leads to waterlogging due to the overburdened drainage systems, further exacerbating casualties and property losses. As the political center and a megacity of China, Beijing has a dense population, complex functions, and a large number of infrastructure facilities. At the end of July 2023, affected by comprehensive factors such as typhoon Doksuri, Beijing and its surrounding areas encountered extremely heavy rainstorms. The sudden influx of rainwater put the drainage system in a critical situation, causing partial traffic paralysis in the city and flooding in low-lying areas, and lead to considerable losses in terms of human life and property damage [2]. Therefore, the research on this event can accurately analyze the impact of extreme rainfall on megacities and provide crucial basis for formulating strategies to deal with extreme disasters in megacities, which is of great research and practical significance.
Social media platforms are effective means of communication for disaster management, and social media data are valuable for studying and understanding human responses and disaster resilience [3]. Meanwhile, timely and efficient extraction of disaster information based on social media data can further supplement the information needs for rapid emergency response. Cantini et al. [4] proposed a methodology using prompt-based LLMs to analyze social media content for disaster monitoring and automated reporting. The LLMs classify posts, extract geographic information, and generate informative reports, enabling efficient disaster response and management. Santos et al. [5] proposed a novel approach using large language models (LLMs) for data augmentation and multi-class classification to extract domain-specific data from tweets and identify issues raised by citizens, thus providing policymakers and social science researchers with valuable data to formulate effective plans and policies for improving services. Li et al. [6] uses feature extraction and Transformer technology to perceive the sentiment in public opinion samples. Mu et al. [7] proposes an IDBO-CNN-BiLSTM model combining the swarm intelligence optimization algorithm and deep learning methods to classify the emotional tendencies of tweets associated with the Hurricane Harvey event. Saddam et al. [8] focuses on the sentiment analysis of Jakarta flood management on Twitter. It employs SVM for classification after preprocessing and applies k-fold cross validation for testing, achieving a relatively high accuracy rate. Yuan et al. [9] analyzed tweets during Hurricane Florence. Employing demographic inference and LDA, they detected sentiment and concern variations among demographic cohorts, providing valuable insights for managers to optimize strategies. Extreme rainfall and flood disasters have a significant impact on China. Many researchers utilize social media data in China, such as Sina Weibo, to conduct their studies. Guo et al. [10] proposed a multi-temporal scale analysis framework that integrates social media text and image data. They solved the problems of insufficient real-time performance and limited coverage in traditional flood monitoring. Li et al. [11] proposed a multimodal analysis framework that combines the biterm topic model, SVM and GPT-3.5. This framework solves the problem of extracting the spatiotemporal distribution of public sentiment and discussion topics regarding flood events on social media. Hou et al. [12] proposed a framework for the extraction and analysis of flood disaster information that combines deep learning and regular expression techniques, which solves the problems of low accuracy in extracting disaster information from social media texts and the lack of meticulous analysis. Peng et al. [13] proposed a framework combining the NER with a flood hazard level lexicon, solving the problems of missing geolocation information and the difficulty in quantifying qualitative descriptions in social media data. Wang et al. [14] proposed a quantitative period division index based on the relationship between rainfall amount and Weibo activities and combined the analysis of the LDA topic model and sentiment lexicon to solve the problems of traditional subjective division of disaster stages and independent analysis of time and space. Zhang et al. [15] studied the online public opinion in the investigation of the “7·20” extraordinary rainstorm and flooding disaster in Zhengzhou by using the sentiment analysis method based on the BERT fine-tuning model and the keyword co-occurrence semantic network theme analysis technology. Wang et al. [16] proposed a multi-technology framework that integrates the BERTopic topic model, the BERT pre-trained model, NER, sentiment analysis, and the construction of disaster damage lexicons, solving the problem of insufficient depth in the mining of social perception data in traditional disaster assessments. Yan et al. [17] constructed a fine-grained flood location corpus and combined it with the BERT-BiLSTM-CRF model to solve the problem of insufficient accuracy in extracting location information from social media. They also integrated text and image information to extract water depth, addressing the issue of incomplete unimodal data. Qian et al. [18] proposed a novel algorithm to solve the problem of insufficient coverage in the traditional manual methods of extracting disaster-related keywords from social media. He et al. [19] proposed the ETEN_BERT_QA model framework that combines an Event Text Enhancement Network (ETEN) with the BERT question-answering mechanism, solving the problems of inaccurate extraction of rainstorm disaster event parameters and insufficient data in social media texts.
In terms of research content, most existing studies merely conduct overall statistics on disaster topics or simply divide them into different stages and lack a detailed depiction of the refined temporal evolution of the thematic content. However, we mined the thematic information from social media data through large language models and prompt engineering. By combining this with the k-means clustering method, we clearly distinguished the different topics before, during, and after the disaster, revealing a more detailed evolution law of disaster topics in the temporal dimension. Meanwhile, existing research mainly focuses on the impacts of primary disasters and ignores the chain effects of secondary disasters. We, on the other hand, systematically classified nine types of secondary disasters triggered by extreme rainfall through a brand-new disaster chain analysis method and studied their spatial clustering patterns and the interrelationships among them, which greatly expands our understanding of the overall picture of disasters. In the aspect of sentiment analysis, most studies adopt a simple classification of positive, neutral, and negative, ignoring the specific subtle emotional expressions in disaster situations and the emotional differences among different groups and regions. Our improved Bert-BiLSTM model, which incorporates the semantics of emojis and the contextual information of posts, achieves fine-grained classification of eight specific disaster-related sentiment categories. Moreover, we conduct an in-depth analysis of disaster sentiment from multiple dimensions such as time, space, the public, and official media, which represents an important breakthrough in the research of disaster sentiment.
In terms of research methods, existing studies mainly focus on the use of natural language processing methods. For example, the Bert model [20,21,22,23,24] is used for sentiment analysis, the LSTM model [25,26,27] is adopted to handle temporal information, the CNN model [28,29,30,31,32,33,34] which is used for processing images. Some researchers have combined the BERT model with the BiLSTM model [35,36,37,38,39], effectively utilizing the powerful language representation provided by BERT and the sequential modeling capabilities of BiLSTM, achieving outstanding results in tasks such as named entity recognition. Building upon the excellent ideas proposed in prior research, we innovatively integrate multi-element information by combining the Bert model with BiLSTM. This integration enables a more meticulous and in-depth analysis of disaster-related sentiments. In terms of topic extraction, most studies utilize the LDA method [40,41,42,43,44]. There are also the applications of biterm topic model [11], BERTopic [16,45]. In addition to these basic models, many variant models [7,46,47] have also been developed to improve the technological level of disaster research. In interdisciplinary studies that link disasters with geography, GIS analysis methods [48,49] are widely used. With the rise of large models and by virtue of their excellent performance in numerous tasks, introducing large models into disaster research is gradually becoming a new research trend [50,51]. We have also made some attempts and efforts in this regard. We innovatively applied advanced large language models and prompt engineering techniques to achieve efficient information extraction. This has further promoted the application of large language models in disaster informatics research and provided a new technical pathway for the development of disaster informatics.

2. Study Case and Data

2.1. Study Case

Since 29 July 2023, affected by the combined effects of the residual circulation of Typhoon Doksuri, the subtropical high, the water vapor transport of Typhoon Khanun, and the terrain, disastrous heavy rainstorms occurred in Beijing and its surrounding areas in China. This rainstorm event was extremely severe with a large accumulated rainfall, triggering a huge flood, which caused heavy casualties and property losses, and severely damaged urban infrastructure such as bridges, roads, electricity, and communications. Taking this extreme rainfall event as an example, this study explores methods of using social media data to provide accurate and comprehensive information support for extreme disaster research from multiple dimensions.
The study selected the period from 28 July 2023 to 10 August 2023 as the research time period and divided the entire disaster cycle into three stages: pre-disaster, during-disaster, and post-disaster. On 29 July 2023, Beijing issued a red rainstorm warning signal, and the city’s flood control headquarters launched a red flood control warning response across the city. In order to deeply explore the public’s initial perception state on the eve of the disaster, the pre-disaster stage was set as from 28 to 29 July. The disaster stage spanned from 30 July to 4 August. Until 4 August, the Beijing Meteorological Observatory lifted the yellow rainstorm warning signal, marking a turning point in the disaster intensity and the level of emergency response in this stage. On 9 August, a press conference was held in Beijing to update the public on the flood control and disaster relief efforts. Considering that under normal circumstances, the popularity of disaster events will gradually decline over time, but the news conference, as a key channel for disclosing information, can once again arouse public attention and lead to a rebound in popularity. Therefore, the post-disaster stage was set as 5 to 10 August. In this way, it focuses on the core popularity interval of social media induced by the disaster. The subsequent systematic research work will be steadily promoted based on the above carefully divided three disaster stages to ensure the scientific, targeted, and effective nature of the research.

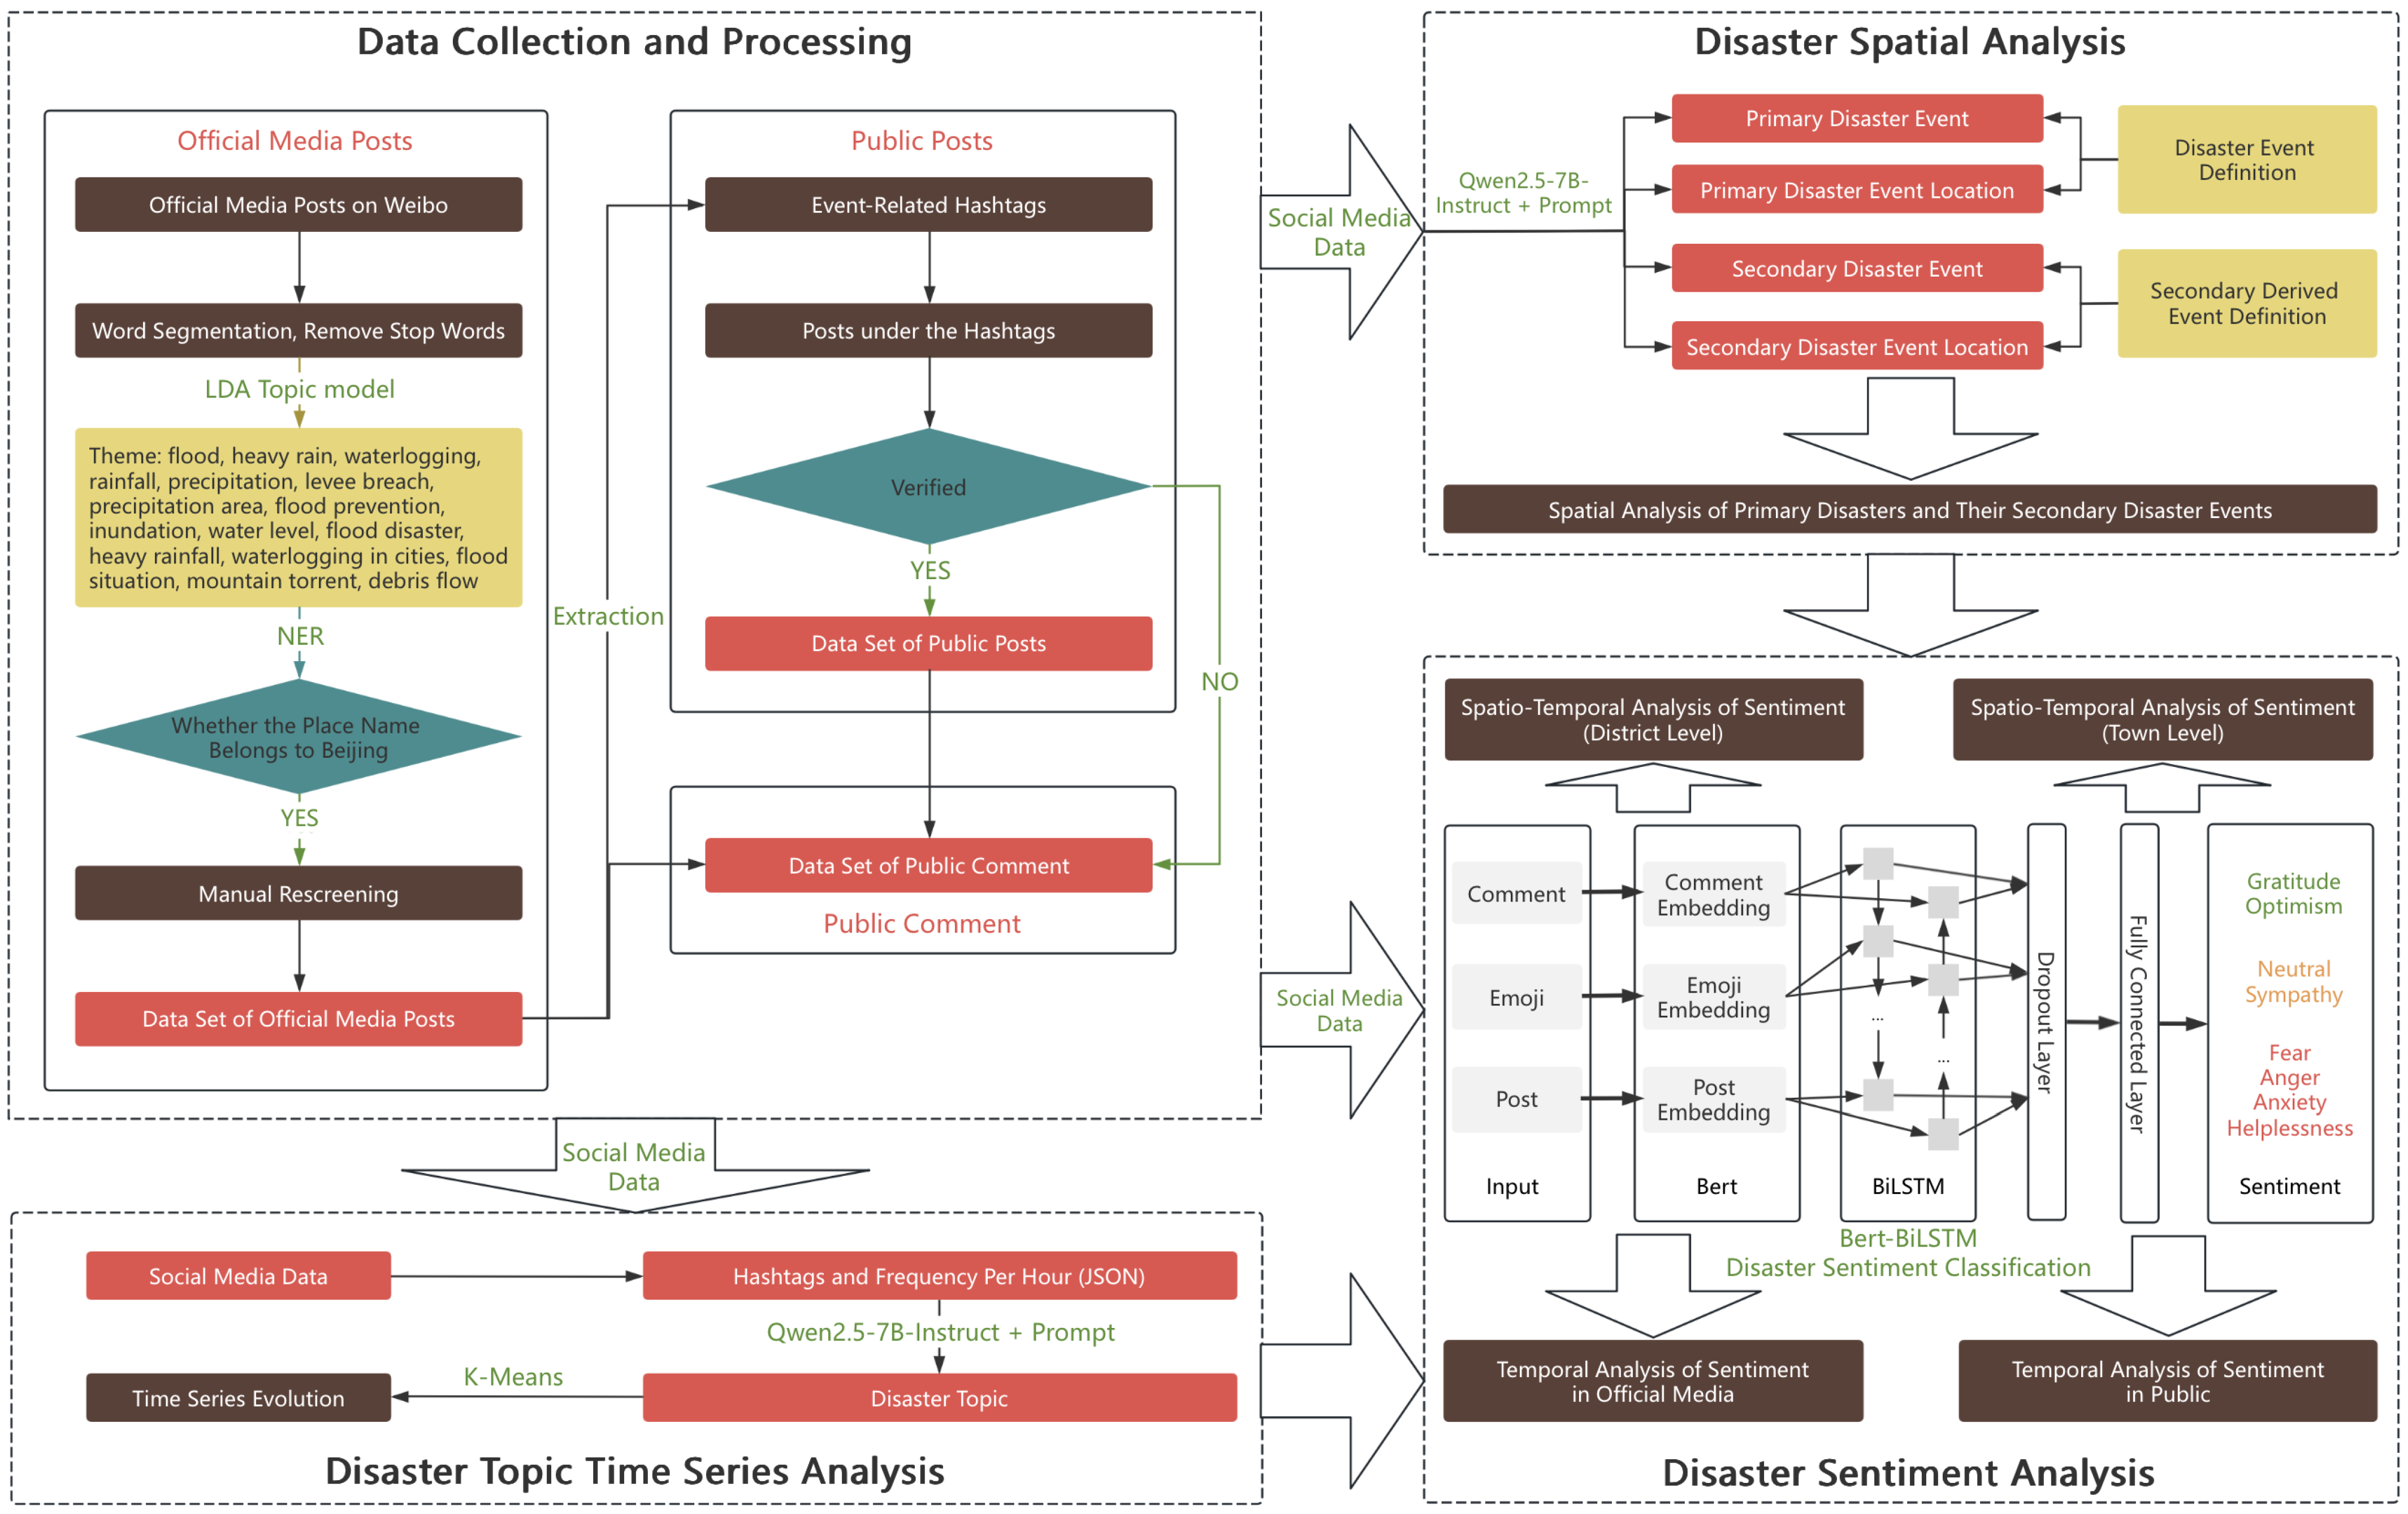
2.2. Data Collection and Processing

Sina Weibo (https://www.weibo.com accessed on 5 September 2023) is one of the largest social media platforms in China. Social media data provides real-time, extensive, and diverse information for disaster research, quickly reflecting the temporal and spatial dynamics of disasters, especially changes in public sentiment. Central news units (hereinafter referred to as official media) have a significant influence on social media. The information they publish is often regarded by the public as an authoritative source, especially in emergencies, social hotspots, and other sensitive topics. By influencing public opinion, they help alleviate social and public sentiment pressure. In 2021, the Central Cyberspace Administration and Informatization Committee Office (https://www.cac.gov.cn accessed on 5 September 2023) released a list of central news units, including 38 units such as the People’s Daily, Xinhua News Agency, and China Central Television. We used a Python crawler program to collect posts published by official media on the Weibo platform during the research period. Based on “Flood (洪水)”, “Heavy Rain (暴雨)”, “Flooding (洪涝)”, “Rainfall (降雨)”, “Precipitation (降水)”, “Dam Breach (决堤)”, “Affected Area (落区)”, “Flood Prevention (防汛)”, “Submersion (淹水)”, “Water Level (水位)”, “Flood Disaster ( 洪灾)”, “Intense Rainfall (强降雨)”, “Waterlogging (内涝)”, “Flood Situation (汛情)”, “Mountain Flood (山洪)”, “Debris Flows (泥石流)”, we constructed a thematic vocabulary library for extreme rainfall events. Using the LDA topic model, we filtered posts belonging to the extreme rainfall event topic vocabulary library. Since the information released by official media, especially place names, is complete and easier to identify, we used the spaCy library for place name recognition and further filtered out posts containing Beijing geographical location information. Ultimately, we obtained 497 posts published by official media and 13,018 public comment data. In Weibo data, topic tags [52,53] can help identify discussions related to specific events or topics, providing clues for extracting public focus. Topic tags can also gather a large number of users, significantly improving the representativeness of the analysis and the diversity of the data and making the research results more universal. We extracted topic tag information from the posts, manually filtered out topic tags unrelated to the research event and further crawled other post content during the research period based on the topic tags. Under the topics, there will be posts published by other local media, organizations, journalists, bloggers, etc., which cannot well represent the intentions of ordinary people. Therefore, we filtered by crawling the verified field, retaining only posts published by non-certified users. At the same time, we also retained the comment information under the certified user posts, which contains a large number of public comments. Ultimately, we obtained 5791 posts published by ordinary people and 60,546 public comment data, which includes both public comments under official media posts and comments under public posts. No fake news was found in our data. This is attributed to the fact that our data have undergone strict screening to remove irrelevant content. Moreover, during the subsequent experiments, we manually corrected the annotation results of the training data to ensure the accuracy of the data used for model training. Through this processing method, the possibility of the existence of fake news has been greatly reduced.

3. Methods

A different prompt engineering strategy was constructed through large language models to achieve the extraction of disaster theme information and the spatial location information of disasters and their secondary disasters. A Bert-BiLSTM multi-sentiment classification model for disasters was constructed, which comprehensively took into account three factors including comment content, emoticons, and post content, realizing a more precise and detailed classification of disaster sentiment. The research framework is shown in Figure 1.

3.1. Disaster Topic Information Extraction

Weibo hashtags enable users to rapidly find and follow discussions on specific events by aggregating related content. In disaster analysis, hashtags are conducive to quickly identifying the focus of public concern, tracking disaster progress in real time, and providing strong support for timely response and information dissemination. By extracting topic tags from microblog posts and analyzing the temporal change characteristics of the topics, we can uncover the temporal evolution of extreme rainstorm events. We compiled different topics and their frequency information hourly and constructed the frequency data of hashtags in JSON format. Conduct the prompt engineering based on the Qwen2.5-7B-Instruct model [54] to extract disaster topics from microblog hashtags. The prompt construction idea is as follows:
  • Determine the input content: Provide the topic content and frequency information of microblog posts during the disaster as the context.
  • Clear task instructions: Instruct the model to generate 1 to 5 disaster-related topic keywords and specify the output format. Specify the number of topic keywords to be generated in order to avoid generating too many unnecessary topic words.
  • Step-guided generation: Identify high-frequency topics; select keywords according to frequency; generate summative subject words.
Based on the above-mentioned ideas, we constructed the following prompt to extract disaster topics from microblog hashtags. “Hashtag content and frequency information (in JSON format, sorted in descending order of frequency) of Weibo posts for each hour during the disaster. The above topic information is the extraction result of microblog posts that I crawled during the disaster, which includes the topic tag of each post and its frequency of occurrence. The more frequently a topic appears, the more heated the discussion. The specific requirements are as follows: Firstly, based on the above topic information, generate 1 to 5 disaster-related core keywords during this period. The subject words should have clear logic and accurately reflect the main idea of the content. Secondly, compare the generated topic words with the original hashtags to ensure that it is logical and accurate. Avoid redundant and inconsistent subject headings. Finally, please return the output in the following format: [Keyword 1, keyword 2, keyword 3,…]”.
We categorized disaster-related keywords into three time periods: pre-disaster, during-disaster, and post-disaster. Since the model extracts disaster-related keywords from hourly Weibo topic tags, the same keywords may be extracted at different times. Even within the same disaster phase, keywords extracted at different time points may carry the same meaning. For example, “rescue operation” and “rescue”, extracted at different time points during the post-disaster phase, convey the same meaning and should belong to the same theme within that phase. Therefore, we applied k-means clustering to group the disaster-related keywords and their frequency information for each disaster phase. Ultimately, 10 distinct disaster themes were identified for each phase; we selected the most representative keyword under each category as the theme keyword of that category and obtained the theme information of different disaster stages according to the order of category frequencies from high to low.

3.2. Disaster Spatial Information Extraction

In the aftermath of many high-intensity natural disasters, a series of subsequent disasters are often triggered, a phenomenon referred to as the disaster chain. The disaster that occurs first and initiates the chain reaction is termed the primary disaster. In this study, we identify extreme rainfall as the primary disaster. Disasters induced by the primary disaster are classified as secondary disasters, which typically manifest within a short period and exhibit clear causal relationships. Based on official post-disaster reports, we categorize secondary disasters triggered by extreme rainfall into nine types, as shown in Table 1. Our classification focuses on the different impacts caused by the disaster, providing a more detailed categorization. Extreme rainfall initially leads to two primary secondary disasters: debris flows and waterlogging. These, in conjunction with extreme rainfall, further induce additional secondary disasters, including missing personnel, casualties, trapped personnel, building damage, traffic damage, power outages, communication interruptions, and damage to water conservancy infrastructure. This classification provides a clearer understanding of the causal relationships and hierarchical structure within the disaster chain, offering a scientific foundation for disaster risk assessment and emergency response.
We adopted a similar approach to thematic information extraction to construct prompts for extracting various disaster event information from Weibo texts. These prompts include descriptions of disaster event types to enable more precise information extraction. Additionally, we applied further post-processing to the model’s output using regular expressions. This primarily addressed inconsistencies in the way that geographic location information is described across different posts or comments. For instance, the location “Mentougou District, Beijing” might be referred to in various ways, such as 北京市门头沟区, 北京市门头沟, 北京门头沟区, 北京门头沟, 门头沟区, 门头沟. Although these descriptions differ, they all refer to the same geographic location: Mentougou District, Beijing. Since the model extracts location information strictly based on the text provided, this issue arises when different descriptions are used. By applying regularization processing, we obtained more consistent and standardized location information, facilitating further analysis and research.

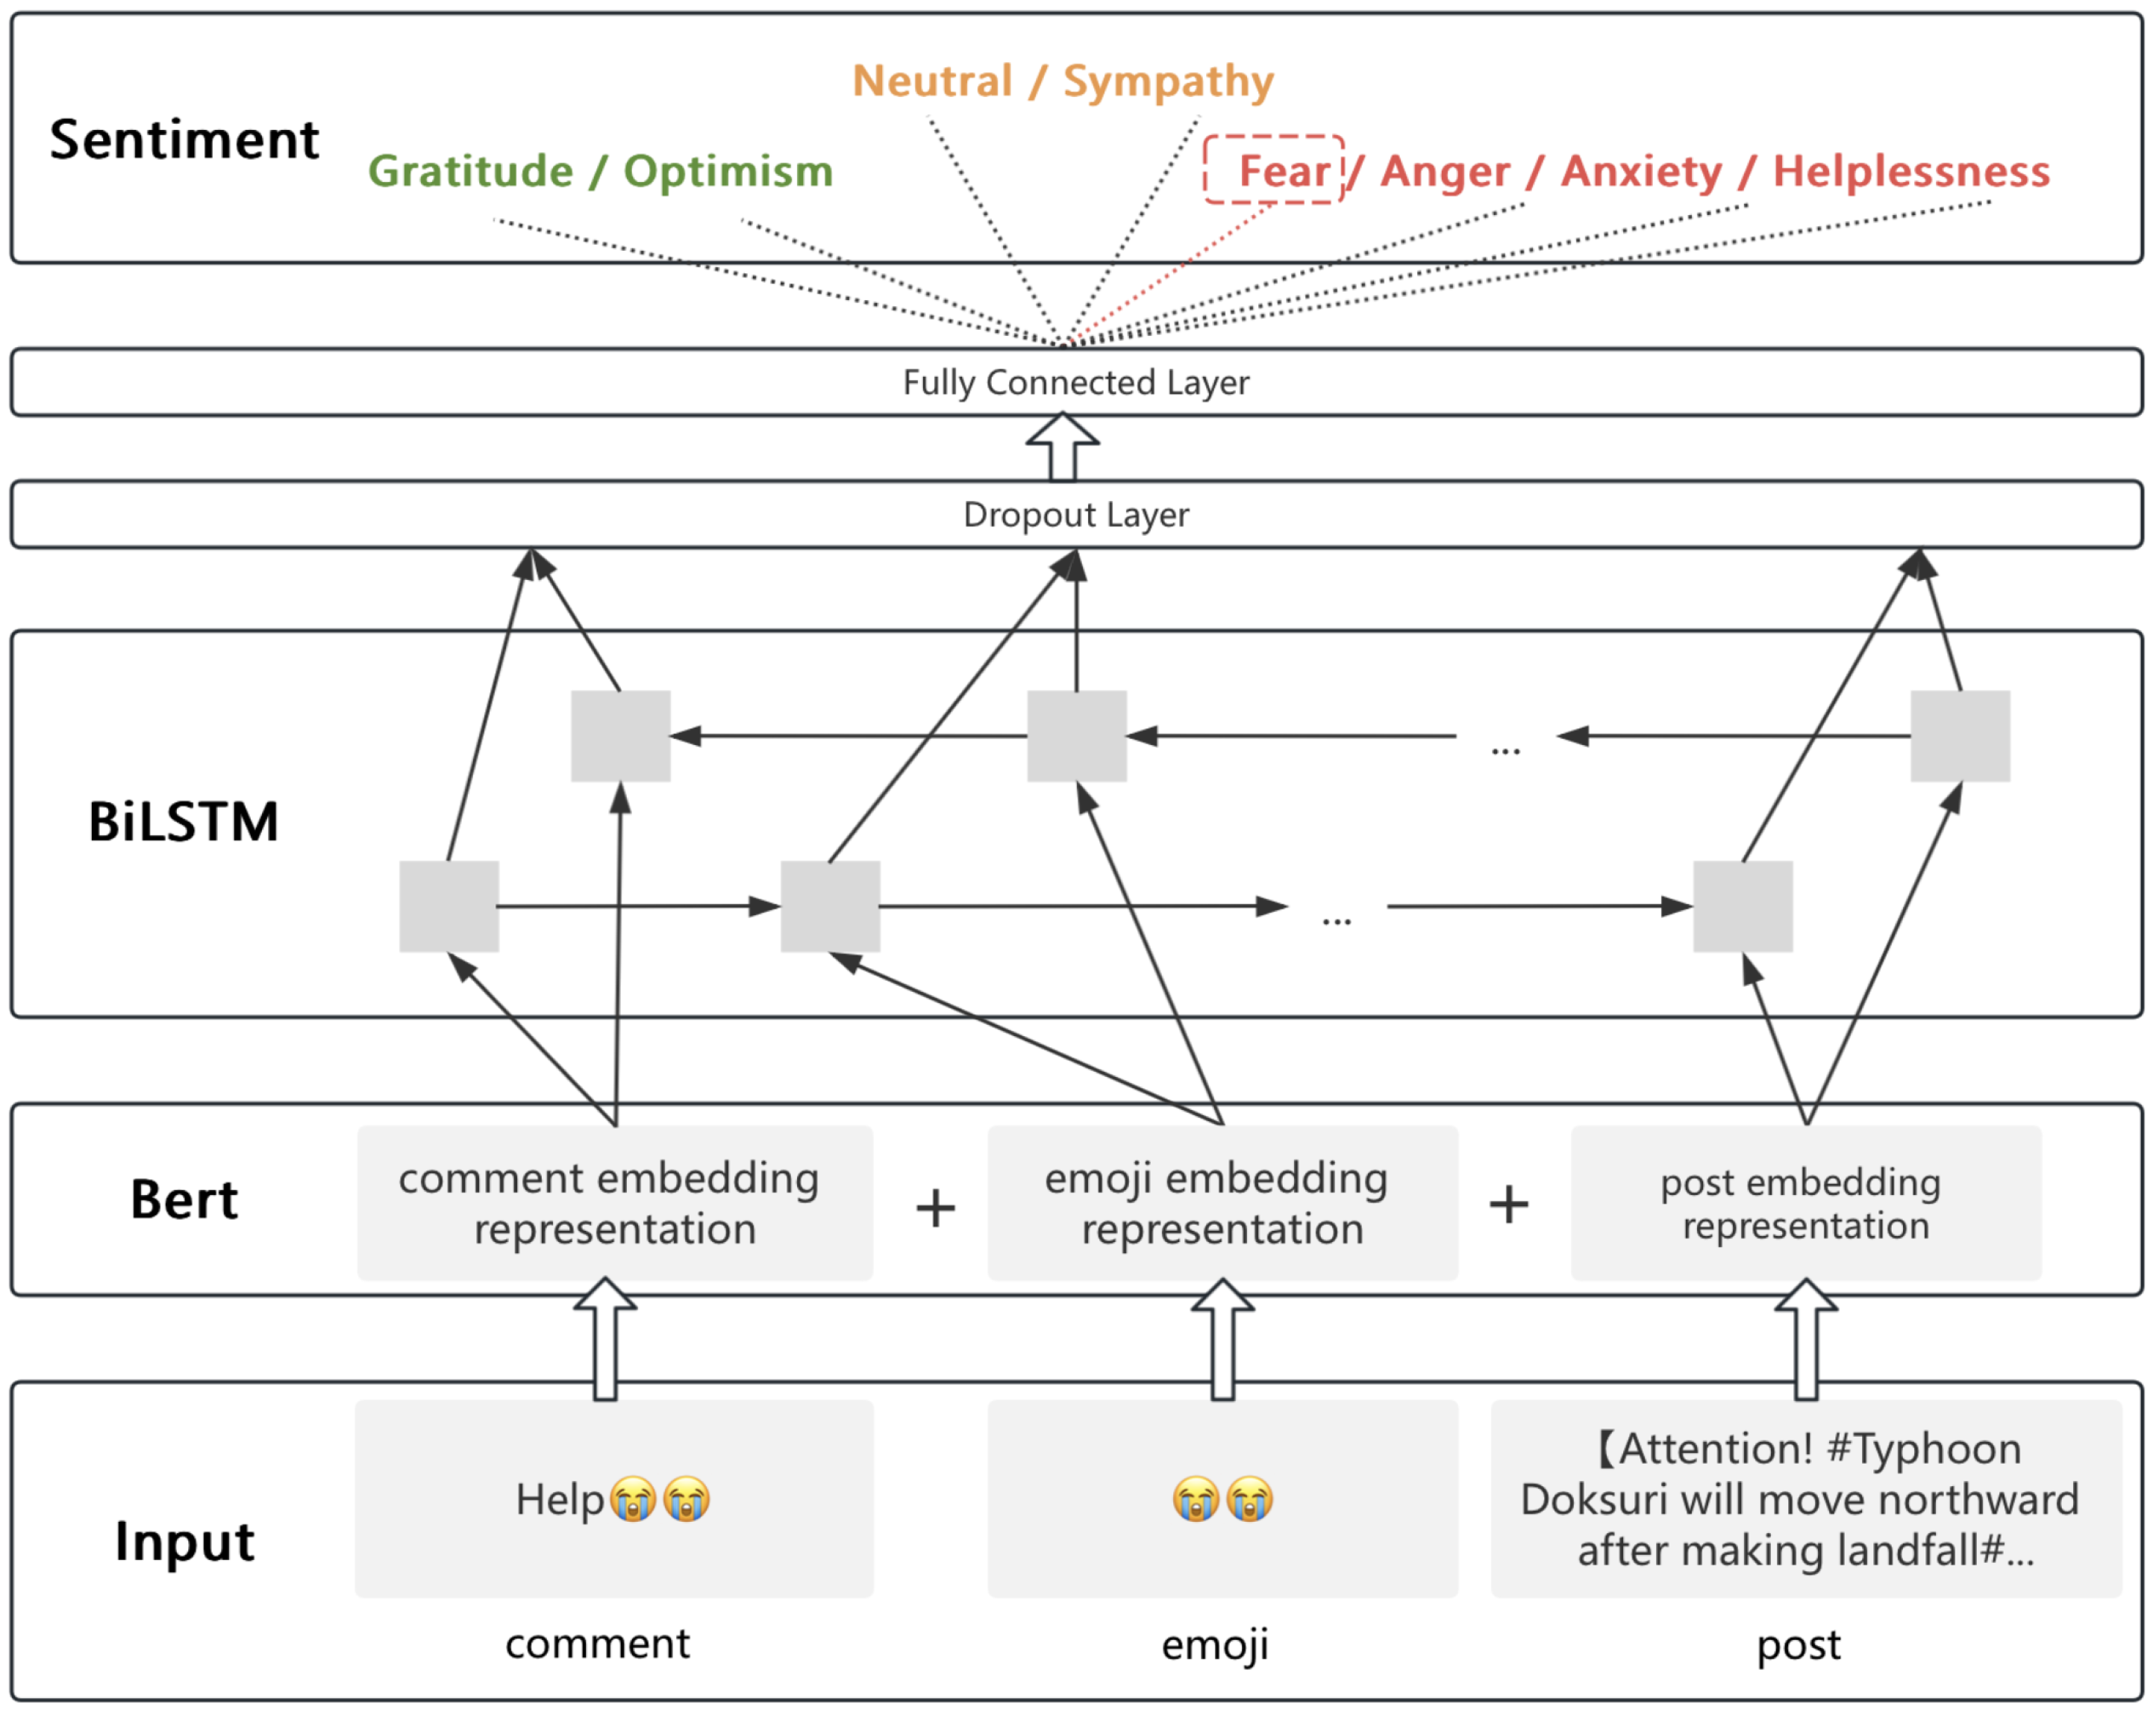
3.3. Disaster Sentiment Classification

We constructed the Bert-BiLSTM sentiment classification model, and its structure is presented in Figure 2. We mainly tackled three existing issues in disaster sentiment classification. Firstly, we refined the sentiment classification categories. Most sentiment classifications are trichotomous, namely positive, neutral, and negative, lacking detailed sentiment classifications related to disasters. Based on existing research and by simultaneously observing real data on social media, we designed eight types of disaster sentiment categories, namely Gratitude, Optimism, Neutral, Sympathy, Fear, Anger, Anxiety, and Helplessness. We divided positive, neutral, and negative sentiments in a more detailed way, thus gaining a deeper understanding of the emotions expressed by different groups during disaster events. Secondly, we emphasized the crucial role of emoticons in the expression of text sentiment. Emoticons [55] have unique expressions of feelings on social media, and the sentiments they convey are not entirely consistent with those of the text. For example, in a comment text, it is stated that “Thank you to all the rescue workers. [Love] [Love] [Love] ”(谢谢所有的救援工作者[爱心] [爱心] [爱心]). Here, emoticon intensifies the sentiment expressed by the preceding text content, expressing a deeper sense of gratitude towards the rescue workers. In another text, it is mentioned that “Wow, I really admire your all-powerful appearance. [Puke] [Puke] [Puke]” (所以我们应该崇拜你对吧[吐] [吐] [吐]). Here, the emoticon represents a reversal of the sentiment expressed by the preceding text content. The intuitive meaning expressed by the text is positive and affirmative, but the emoticon has an ironic meaning, so the actual sentiment expressed by the text should be negative. Therefore, in our method, we considered emoticons as an independent feature for model training and inputted them into the model to be combined with other features for model training. Finally, the sentiment expressed by a text may be influenced by its context, and perceiving the context is conducive to more accurate sentiment classification. Most analyses of social media comments only focus on the specific comment content and lack the perception of the context, such as the content of the post to which the comment belongs. In different posts, the same comment content may express slightly different sentiments. We obtained a more accurate judgment of the sentiment by conducting a deeper contextual analysis of the comment content to be analyzed.
In our proposed model, the Bert encoder is used to generate embedded representations of three different kinds of content and BiLSTM processes feature representations, splicing together comments, posts, and emojis to capture timing and context information of emotion while reducing overfitting risk through dropout, regularization, and dynamic learning rate adjustment. This ensures the robustness and generalization ability of the model in the training process. Our training process was carried out on the Ubuntu operating system, utilizing an NVIDIA 3090 GPU with 24 GB of memory. The development of the model was based on the Python language version 3.11 and the PyTorch framework version 2.2.1. The data required for model training were sourced from the comment content under the posts of official media. We obtained the sentiment of the user comment content through the Qwen2.5-7B-Instruct model, and then carried out manual review and modification. A total of 8000 pieces of comment data were annotated, with the ratio of the training set to the test set at 4:1. The data were all saved in an xlsx file, which included the comment content and the corresponding post content. In terms of model parameter settings, the number of neurons in the hidden layer of the LSTM was 128, and the dropout ratio was 0.6. The L2 regularization method of weight decay was selected, and the adjustment of the dynamic learning rate was achieved based on ReduceLROnPlateau. We used AdamW as the optimizer for model training and achieved excellent results by combining it with a weight decay of 1 × 10 3 . Taking into account the model training effect and the hardware configuration, we set the batch size to 18. The entire training process went through 15 iterations and achieved the best results.

4. Results

4.1. The Temporal Evolution of Disaster Themes

Table 2 shows the content and frequency information regarding the hashtag of Weibo posts at 6 o’clock on 30 July 2023. The hashtag “Ji Fa” (“姬发”) was generated by the one-step movie, which actually has nothing to do with the disaster event we studied and belongs to junk information. We used the prompt constructed for topic extraction, and the output result of the model was “Beijing rainstorm, Central Meteorological Observatory issued red warning for rainstorm, Beijing flood control, Tianjin rainstorm, disaster warning”. It can be seen from the example that the prompt project constructed by us has good performance of disaster topic extraction, which can summarize and generate summary disaster theme words for similar microblog hashtags, and filter well for non-disaster related hashtags.
Table 3 presents the disaster-related keywords on social media during different disaster phases ranked by frequency of occurrence. The disaster keywords exhibit a clear temporal evolution, reflecting the dynamic shift in disaster narratives from early warnings and prevention to specific events and rescue operations and finally to emotional expressions and social cohesion. This progression not only indicates the change in public attention but also reveals the deeper mechanisms of information dissemination and social psychology during disaster response.
In the pre-disaster phase, keywords such as Doksuri, extreme heavy rainfall, rainstorm warning, and Level I response to major meteorological disasters suggest that disaster narratives at this stage primarily focus on risk perception. During this phase, the public relies heavily on the information released by the government and authoritative institutions to assess the imminent threat. Notably, the keyword rainstorm weather preparedness guide stands out as it not only disseminates disaster knowledge but also establishes a public behavior guideline, emphasizing the importance of education and self-rescue in disaster management. In the mid-disaster phase, the keywords demonstrate two distinct characteristics: first, a high degree of spatial focus is evident in keywords such as Beijing Mentougou and Beijing Fangshan, which highlight the specific regions affected by the disaster. This indicates a shift in information dissemination from macro-level warnings to micro-level scene-based narratives as the disaster’s impact becomes clearer. Second, there is an emphasis on actions and participation, as seen in keywords like rescue operation and flood prevention warning, reflecting public concern over the efficiency of emergency response and the coordination of rescue efforts. Additionally, the keyword train K396 emerges as a symbolic event associated with the disaster’s impact, becoming a focal point for public attention. This suggests that specific events with strong emotional resonance and symbolic significance are more likely to spark widespread discussion, thereby serving as central nodes in disaster-related information dissemination. In the post-disaster phase, the narrative themes undergo a significant transformation. Keywords such as salute to everyone who lent a helping hand in the flood, love in Luopoling (“爱在落坡岭”), martyr Feng Zhen (“冯振烈士”), and the army fought against the flood (“子弟兵抗洪”) indicate a shift in public focus from the disaster’s immediate impact to the recognition of rescue personnel and the reaffirmation of social values. This transition from factual to emotional narratives reflects the psychological recovery mechanisms following a disaster. Notably, the presence of keywords like martyr Feng Zhen and salute represents the public’s reverence for individual heroes and the consolidation of collective social identity. This emotionalized narrative serves a distinct cultural function: on one hand, it provides psychological solace to affected communities; on the other, it injects moral support and social mobilization into the post-disaster recovery process. Moreover, keywords like love in Luopoling transcend traditional disaster narratives by focusing on interpersonal relationships and emotional bonds, further highlighting the role of social media in facilitating personalized expressions during disaster recovery.
The evolution of disaster-related keywords reveals a multilayered logic in society’s response to disasters. The pre-disaster phase reflects a rational narrative of knowledge and prevention, the mid-disaster phase transitions to a dynamic narrative of scenes and actions, and the post-disaster phase showcases a cultural narrative of emotions and values. This gradual shift from rationality to emotion signifies not only a deepened understanding of the disaster’s nature but also the public’s search for meaning and collective identity during and after the disaster. These findings underscore that disaster governance should not only focus on prevention and recovery at the material level but also strengthen public engagement and collective identity through information dissemination and social psychology, ultimately contributing to the construction of a more resilient societal ecosystem.

4.2. Spatial Distribution of Disaster

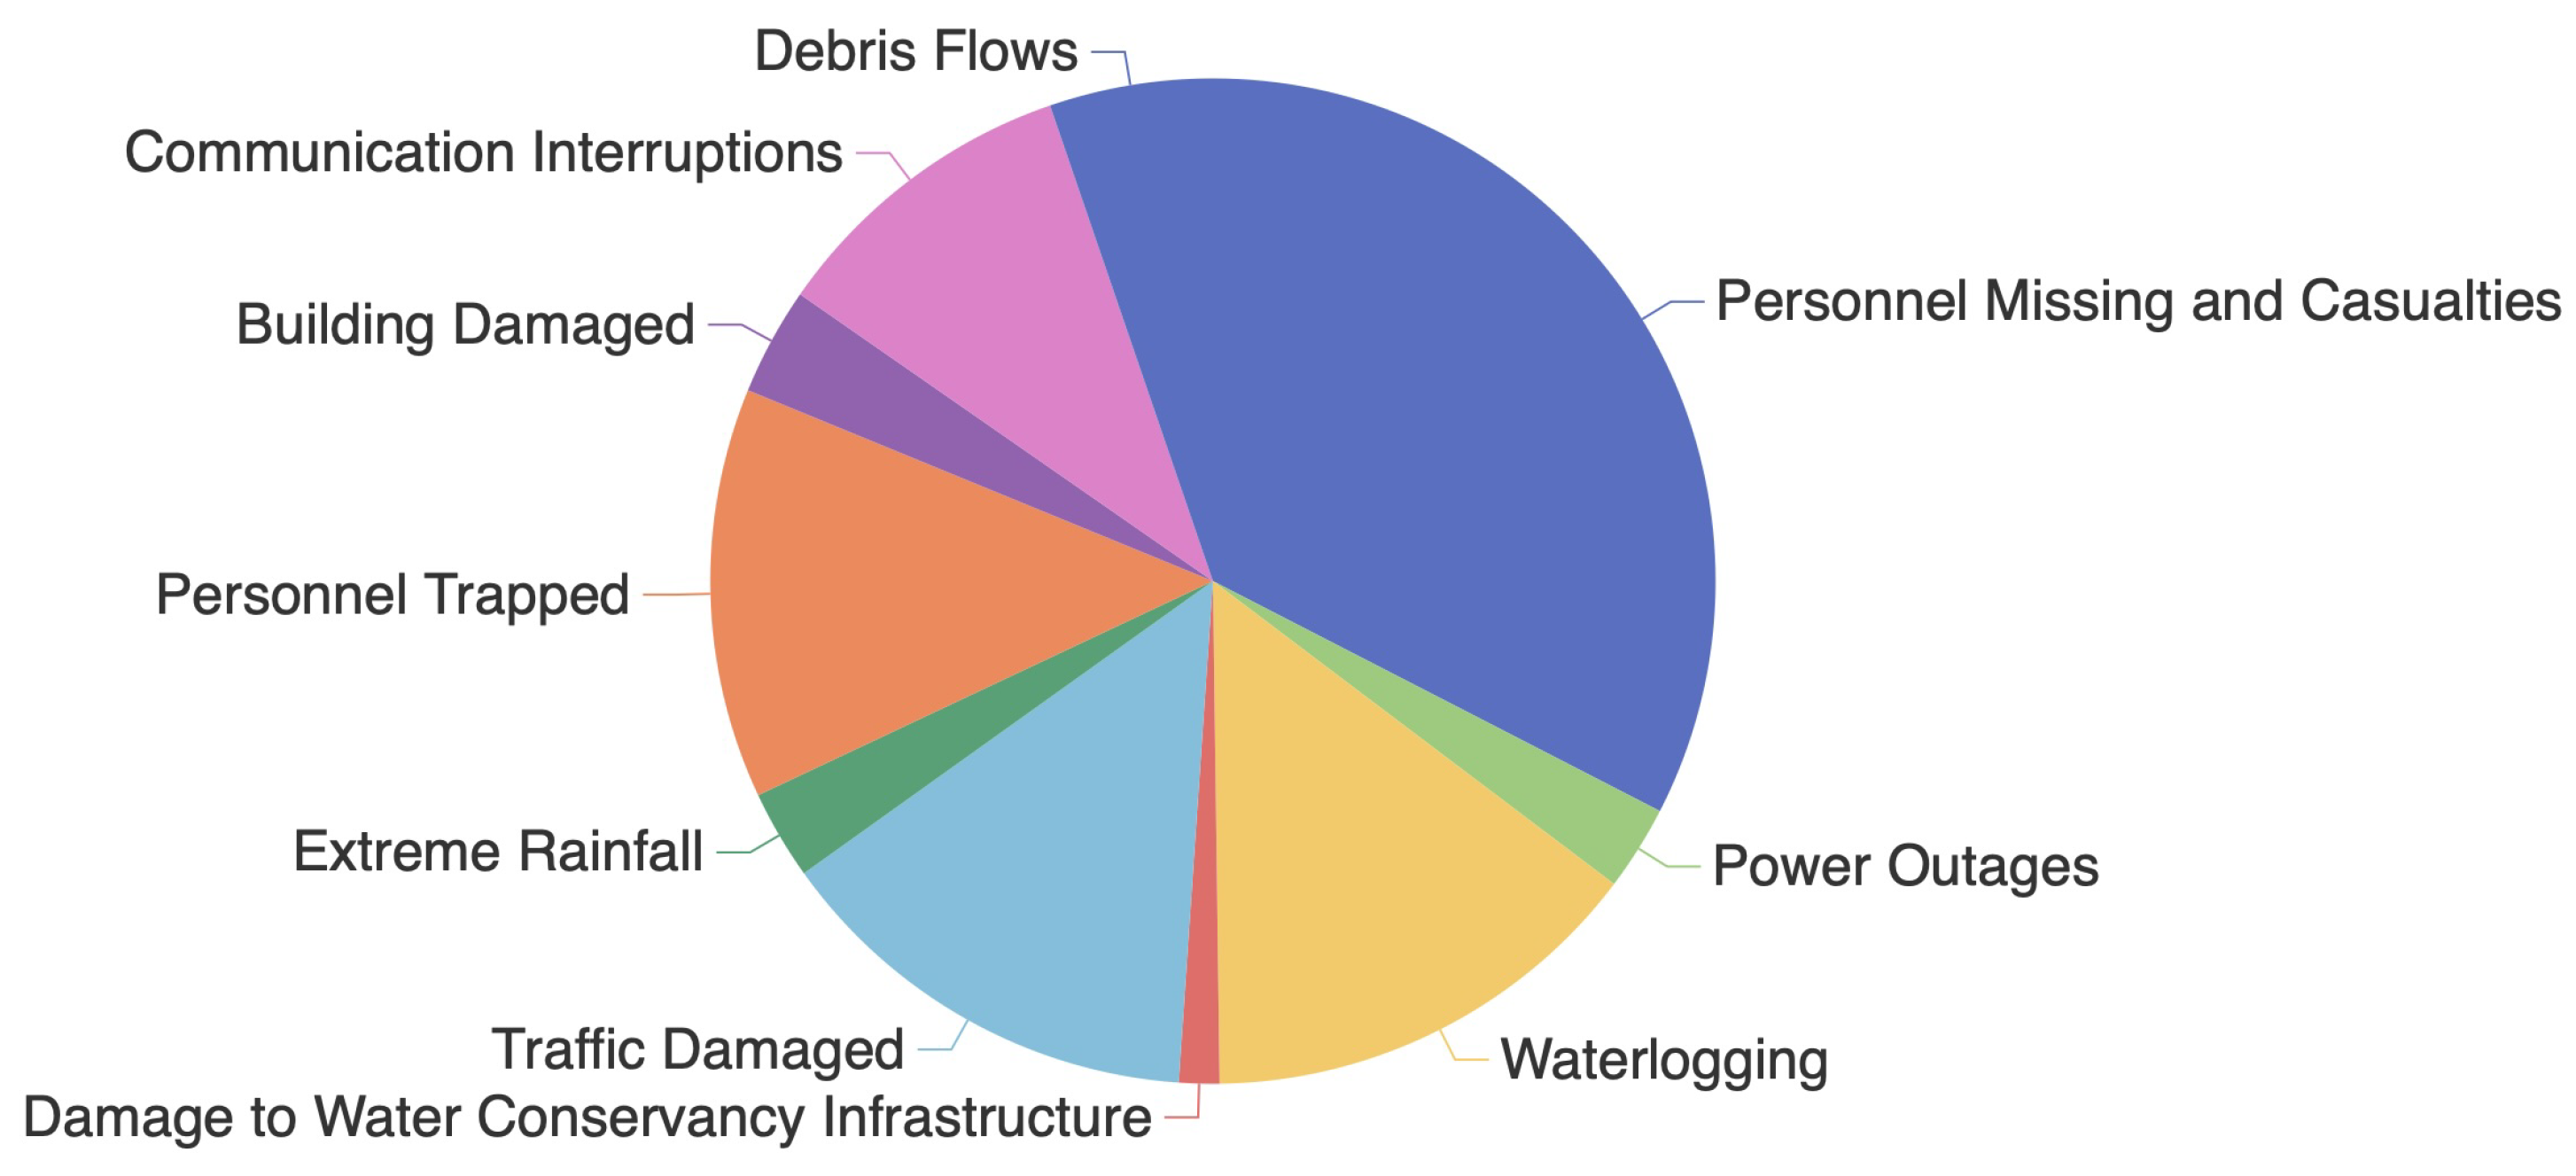
4.2.1. Frequency Distribution of Disasters and Secondary Events

We recorded the frequency of occurrences of primary and secondary disasters in the Weibo data, using this as a measure of public attention to different disaster events on social media. The distribution of attention levels is shown in Figure 3. The results indicate that both extreme rainfall events and the nine types of secondary disasters we defined received varying degrees of attention, reflecting the multifaceted impact of extreme rainfall and its secondary disasters on society, infrastructure, and the natural environment. Human-related disasters, such as missing personnel, casualties, and trapped people, garnered the highest public attention. This phenomenon suggests that the threat to life and safety is the primary dimension of public perception and response during disaster events. Whether directly experiencing the disaster or observing from afar, the sense of crisis regarding human life often generates strong social resonance and widespread media coverage. Secondary disasters that directly disrupt daily life, such as waterlogging, damage to traffic, and communication interruptions, also attracted significant attention. The breakdown of basic urban functions leads to noticeable disruptions in people’s daily routines, which is reflected in discussions about public services and infrastructure on social media. Although power outages and damage to water conservancy infrastructure are critical for emergency management, their lower levels of public attention may be attributed to their technical nature and higher thresholds for public perception. These issues are often viewed as responsibilities of governmental or technical organizations rather than personal concerns directly affecting individuals’ lives. In contrast, communication interruptions received relatively higher attention due to their direct impact on the public—people in affected areas may be unable to contact the outside world, or external individuals may find it challenging to reach those in disaster-stricken zones. This indirect but significant effect heightened public awareness of communication issues compared to power outages and water conservancy damage. Building damage, often caused by debris flows, primarily occurs in mountainous areas. In Beijing, extreme rainfall is less likely to damage urban buildings, with such disasters being more prevalent in suburban regions. As a result, attention to these events is relatively lower compared to other disaster types. As a primary disaster, extreme rainfall initially received high levels of attention. However, subsequent discussions on social media shifted toward secondary disaster events, leading to its relatively lower overall attention compared to other disaster types.

4.2.2. Spatial Distribution of Disasters and Secondary Events

We performed a word cloud visualization of the geographical locations of extracted and processed disaster events, as shown in Figure 4. Additionally, we listed the selected location information of disasters and secondary events as shown in Table 4. From the charts, it can be observed that there is a noticeable spatial agglomeration effect in the locations where different disasters and secondary disasters occur, particularly in areas such as Mentougou and Fangshan. The frequent occurrence of disasters in these areas is closely related to their geographical conditions and infrastructure characteristics, for example, mountainous terrain leading to higher risks of debris flow, and low-lying areas being prone to waterlogging. Events of people being trapped or missing and casualties are mainly concentrated in numerous townships within Mentougou and Fangshan. These areas are mostly mountainous or located in remote regions, with complex terrain and inconvenient transportation. Moreover, when disasters occur in these areas, they are often accompanied by other disasters such as building damage, communication interruptions, and power outages, which further increase the difficulty of rescue operations. In light of this, for regions with weaker infrastructure disaster resistance, priority should be given to strengthening their infrastructure construction and progressively enhancing the disaster resistance and post-disaster recovery capabilities of these areas. By analyzing the spatial distribution of disasters and their secondary events, it is not difficult to see that there is a certain chain reaction among different disasters. Areas such as Mentougou and Fangshan are mostly mountainous areas. Continuous extreme rainfall makes the soil water content reach a saturated state, the soil infiltration capacity decreases, and surface runoff increases. The saturated soil mass slides down the slope under the action of gravity, forming debris flows. Debris flows may destroy the road network and buildings in mountainous areas, not only causing traffic interruptions and preventing people from being transferred in a timely manner but also making it difficult for rescue forces to reach the affected villages, thus resulting in people being trapped. In low-lying areas, due to the insufficient carrying capacity of the drainage system, rainwater converges in a short period of time to form waterlogging. The accumulated water from waterlogging will also have a certain impact on transportation and the people living in low-lying areas. For example, Shuiyuzui Village in Miaofengshan Town, Mentougou District, is a typical case. From July 30th to 31st, 2023, Shuiyuzui Village was hit by heavy rainfall, triggering geological disasters such as debris flows, resulting in the collapse and flooding of houses, the interruption of roads due to accumulated water, silt deposition, and obstruction by debris. The Shuiyuzui Bridge, the only rescue passage, was congested, some infrastructure was washed away, and communication was also interrupted, leading to people being trapped. In Table 4, we can also see that the events of trapped personnel and building damage occurred in Shuiyuzui Village, which is consistent with the actual situation. Such chain reactions further reinforce the agglomeration effect of multiple disasters in the same spatial area; therefore, when allocating emergency management resources, priority should be given to considering these high-risk areas to ensure rapid response and resource allocation.

4.3. Model Analysis

4.3.1. Ablation Experiment

Aiming to verify the effects of emoticons and contextual information (comments corresponding to post content) on text emotion classification results, we designed an ablation experiment for the proposed emotion classification model. The experimental results are shown in Table 5. When only the review content was used as input, the accuracy of the model was 90.44%, which is the base performance of the model. After the inclusion of emoticons, the accuracy rate increased to 91.87%, an increase of 1.43%, indicating that emoticons, as supplementary information for non-text emotion expression, have a positive effect on emotion classification. After adding post content as context information, the accuracy rate is improved to 94.29%, which is 3.85% higher than only using comment content, indicating that the combination of comment and post content can provide richer context information, thus improving the effect of emotion classification. When our model combined comment content, emoji and post content at the same time, the accuracy rate reached 96.09%, which was an overall increase of 5.65% compared with the use of comment content alone, showing the significant advantage of multi-source information fusion. The results show that emoji and post content enhance the model’s ability to recognize emotion from non-text and context dimensions, respectively, and also verify the effectiveness of coupling multiple factors in enhancing the performance of sentiment classification models.

4.3.2. Comparative Experiment

We designed a comparative experiment to compare with the Qwen2.5-7B-Instruct model and the Bert model, and the experimental results are shown in Table 6. The experimental results show that different model structures had significant differences in the performance of emotion classification tasks, among which our Bert-BilSTM model had the best performance with a 96.09% accuracy, better than the Bert model (95.34%) and the Qwen2.5-7B-Instruct model (93.11%). This result shows that Bert’s context modeling capability combined with BiLSTM’s sequence feature capture capability can identify emotion features more accurately and improve classification performance. In contrast, although the large language model has strong generalization ability, the performance of the general model without special tuning is slightly insufficient in the task of multi-emotion disaster classification.
Through the ablation experiment, we found that the increase in data volume resulting from the coupling of multiple factors contributes to some extent to the improvement in the model’s classification accuracy. However, the enhancement in our model’s performance is not solely determined by the increase in data volume. In the comparative experiment, both the BERT model and the BERT-BiLSTM model were trained using the same data, yet our model’s classification accuracy remained higher than that of the BERT model. This indicates that the design of the model architecture has led to superior performance. On the other hand, although the addition of emoticons and contextual information increases the training time required, the 5.65% improvement in accuracy is considered acceptable. This significant enhancement in the disaster sentiment classification model provides reliable data support for our subsequent analysis work.

4.4. Spatial and Temporal Distribution of Disaster Sentiment

We conducted an emotional analysis of disasters from both temporal and spatial dimensions. In addition, we examine differences in emotional expressions between two distinct entities: the official media and the public, thereby enriching our understanding of disaster-related emotions.

4.4.1. Time Series Analysis of Disaster Sentiment

We have drawn the daily change trend of the number of different types of emotion in official media, as shown in Figure 5a [56]. It can be seen from the figure that in the pre-disaster stage, the number of posts published by official media is small, the emotion is mainly neutral, and the content is focused on the publicity of disaster warning and prevention measures, which reflects the rationality and guidance of official information. During the disaster phase, the number of posts increased significantly and reached a peak between 31 July and 1 August, with neutral emotions still dominating, indicating that the official media paid attention to disseminating facts and disaster information. At the same time, there is a clear upward trend in sympathy, reflecting an attitude of concern for the affected people. In the post-disaster phase, the number of posts gradually decreased, and the focus of official media shifted to rescue progress and disaster recovery; the proportion of sympathy has increased, and the concern for the affected people has continued to be expressed. Figure 5b shows the daily change trend of the number of different types of emotions of the public. It can be seen from the figure that in the pre-disaster stage, the public pays less attention, the expression of emotion is mainly neutral, and a few posts show the emotion of expectation and vigilance, which reflects the initial cognition and preparation for the disaster. In the middle of a disaster, emotional responses increase dramatically, especially reaching a peak between 31 July and 1 August. Neutral emotions dominate, showing the public’s attention to facts and information; at the same time, there is an outpouring of sympathy, which reflects the concern for the victims. Anxiety and fear increased significantly, reflecting anxiety about the severity of the disaster; anger also increased, possibly related to disaster relief issues. A small amount of positive emotion, such as joy, comes from successful rescues and social support actions. In the post-disaster stage, public sentiment generally fell back, and neutral and sympathetic feelings still accounted for the main part, reflecting the continuous attention and humanistic care for post-disaster recovery.

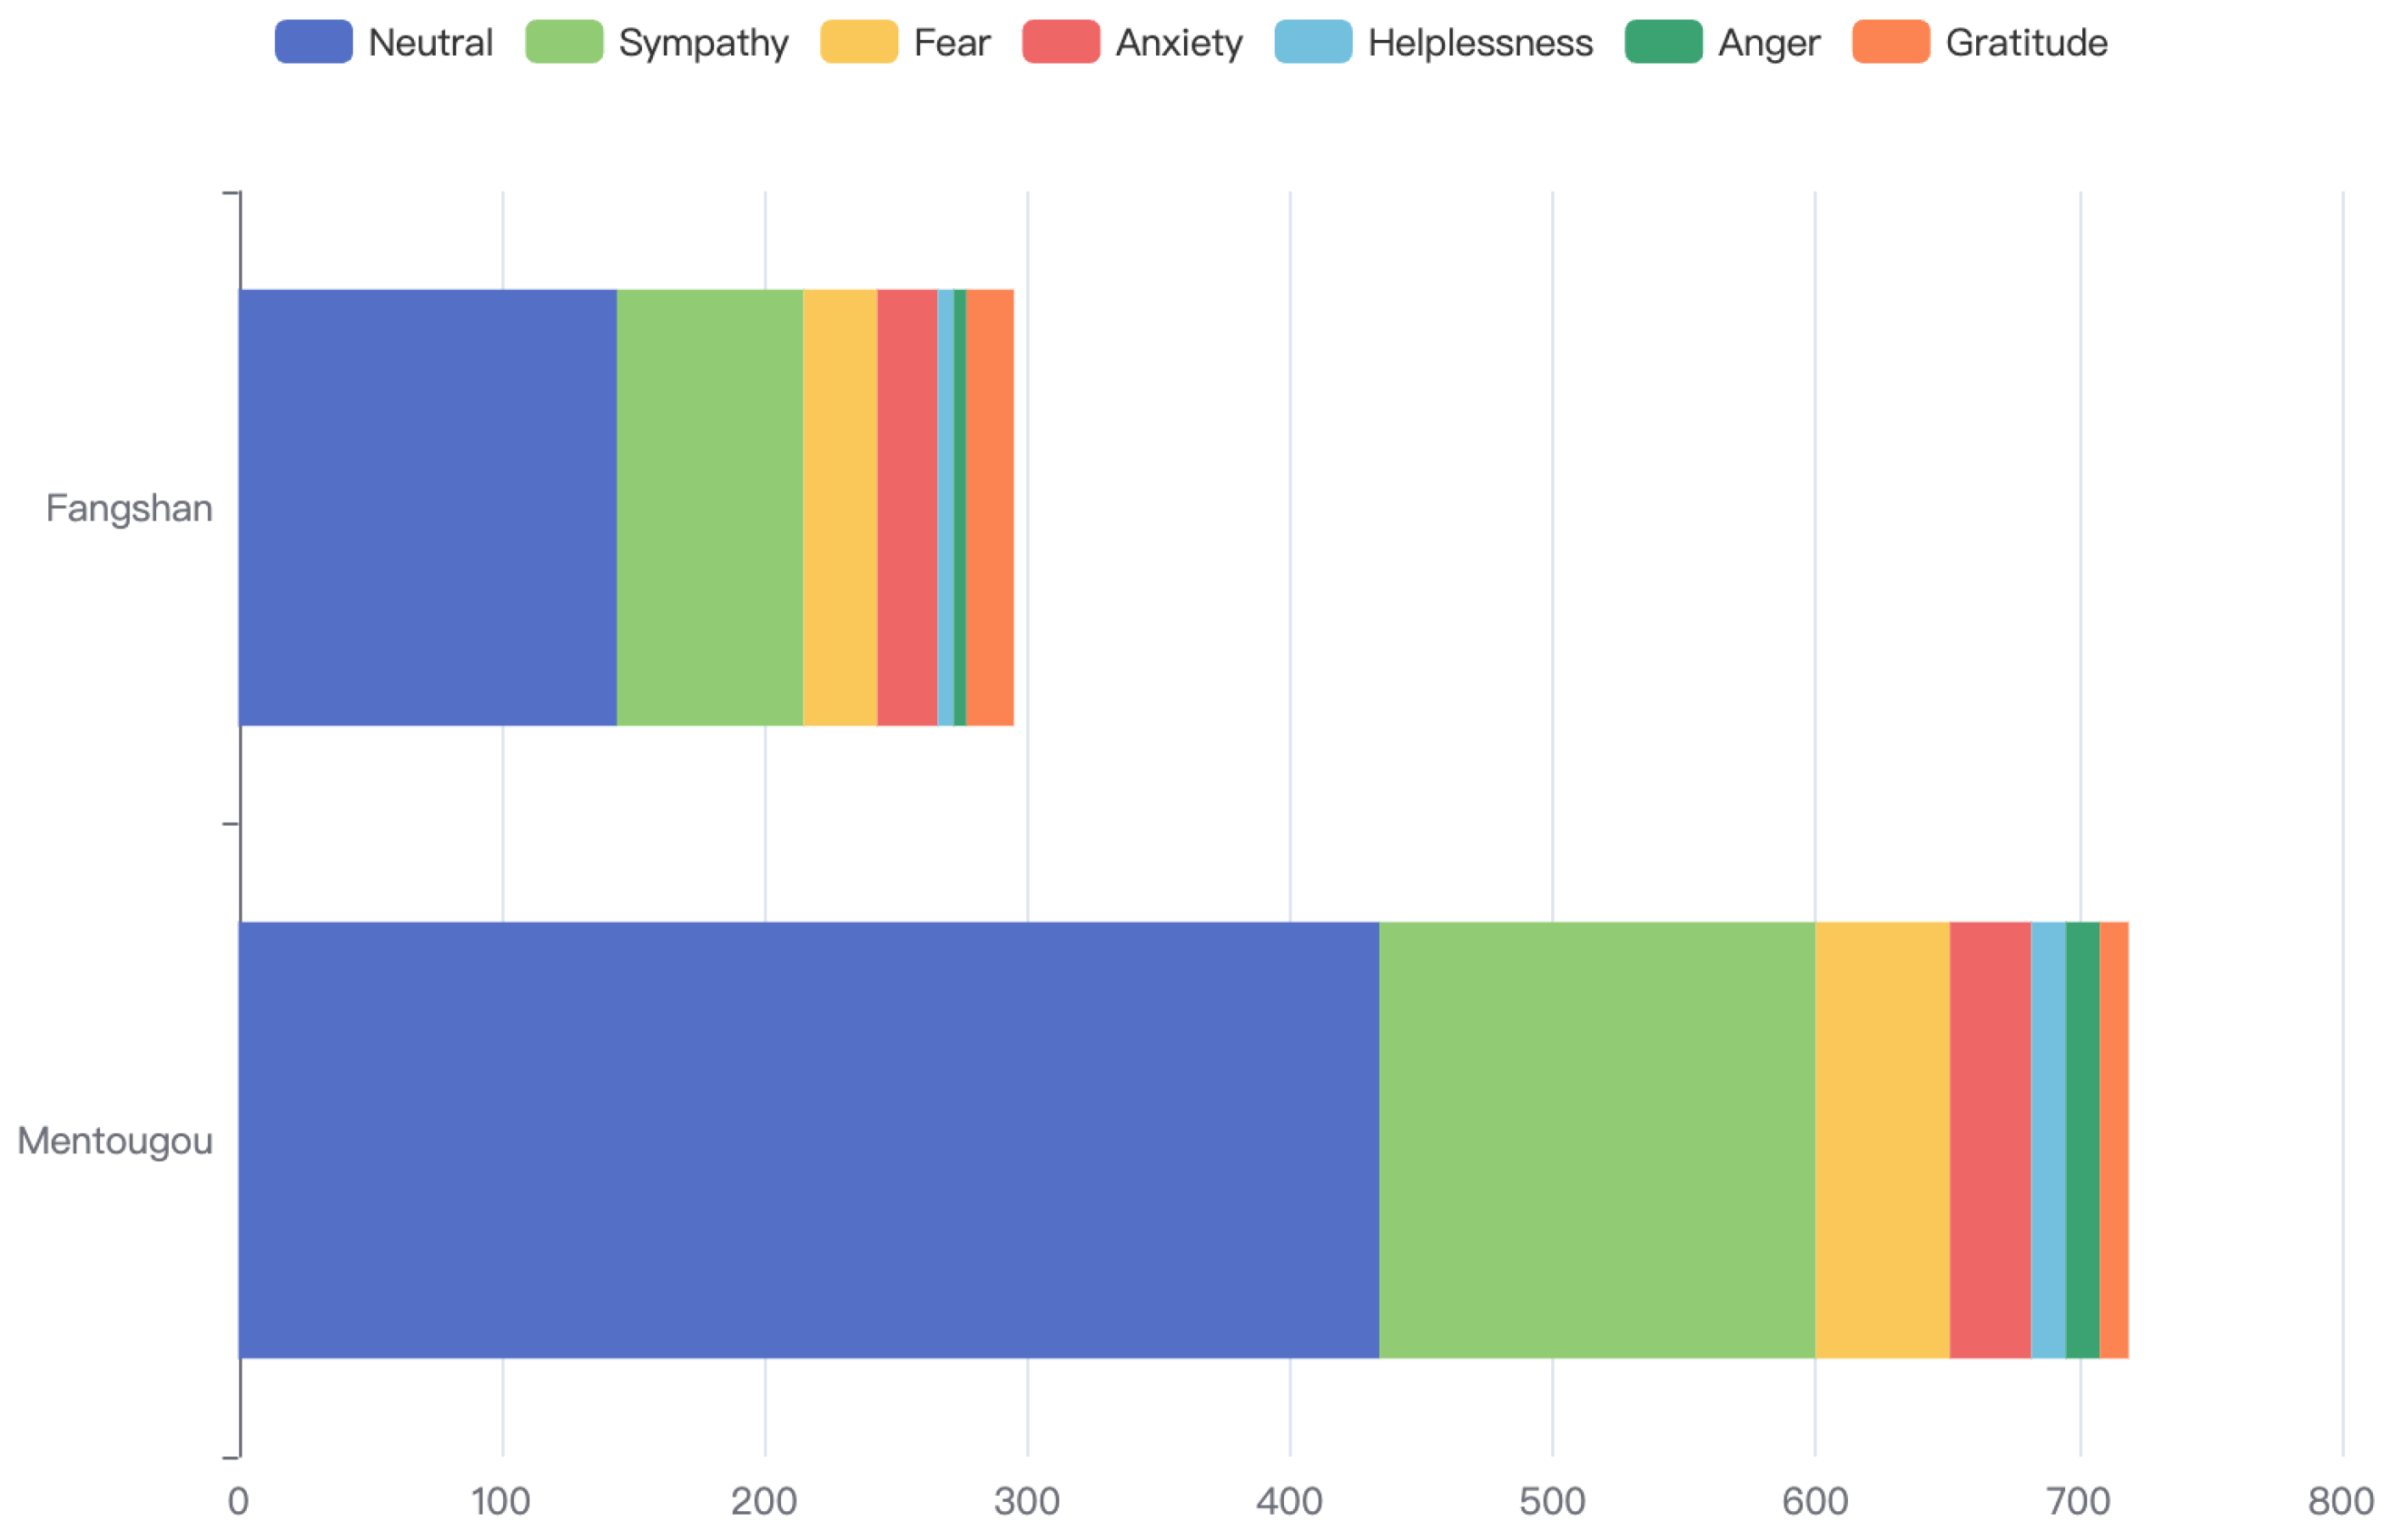
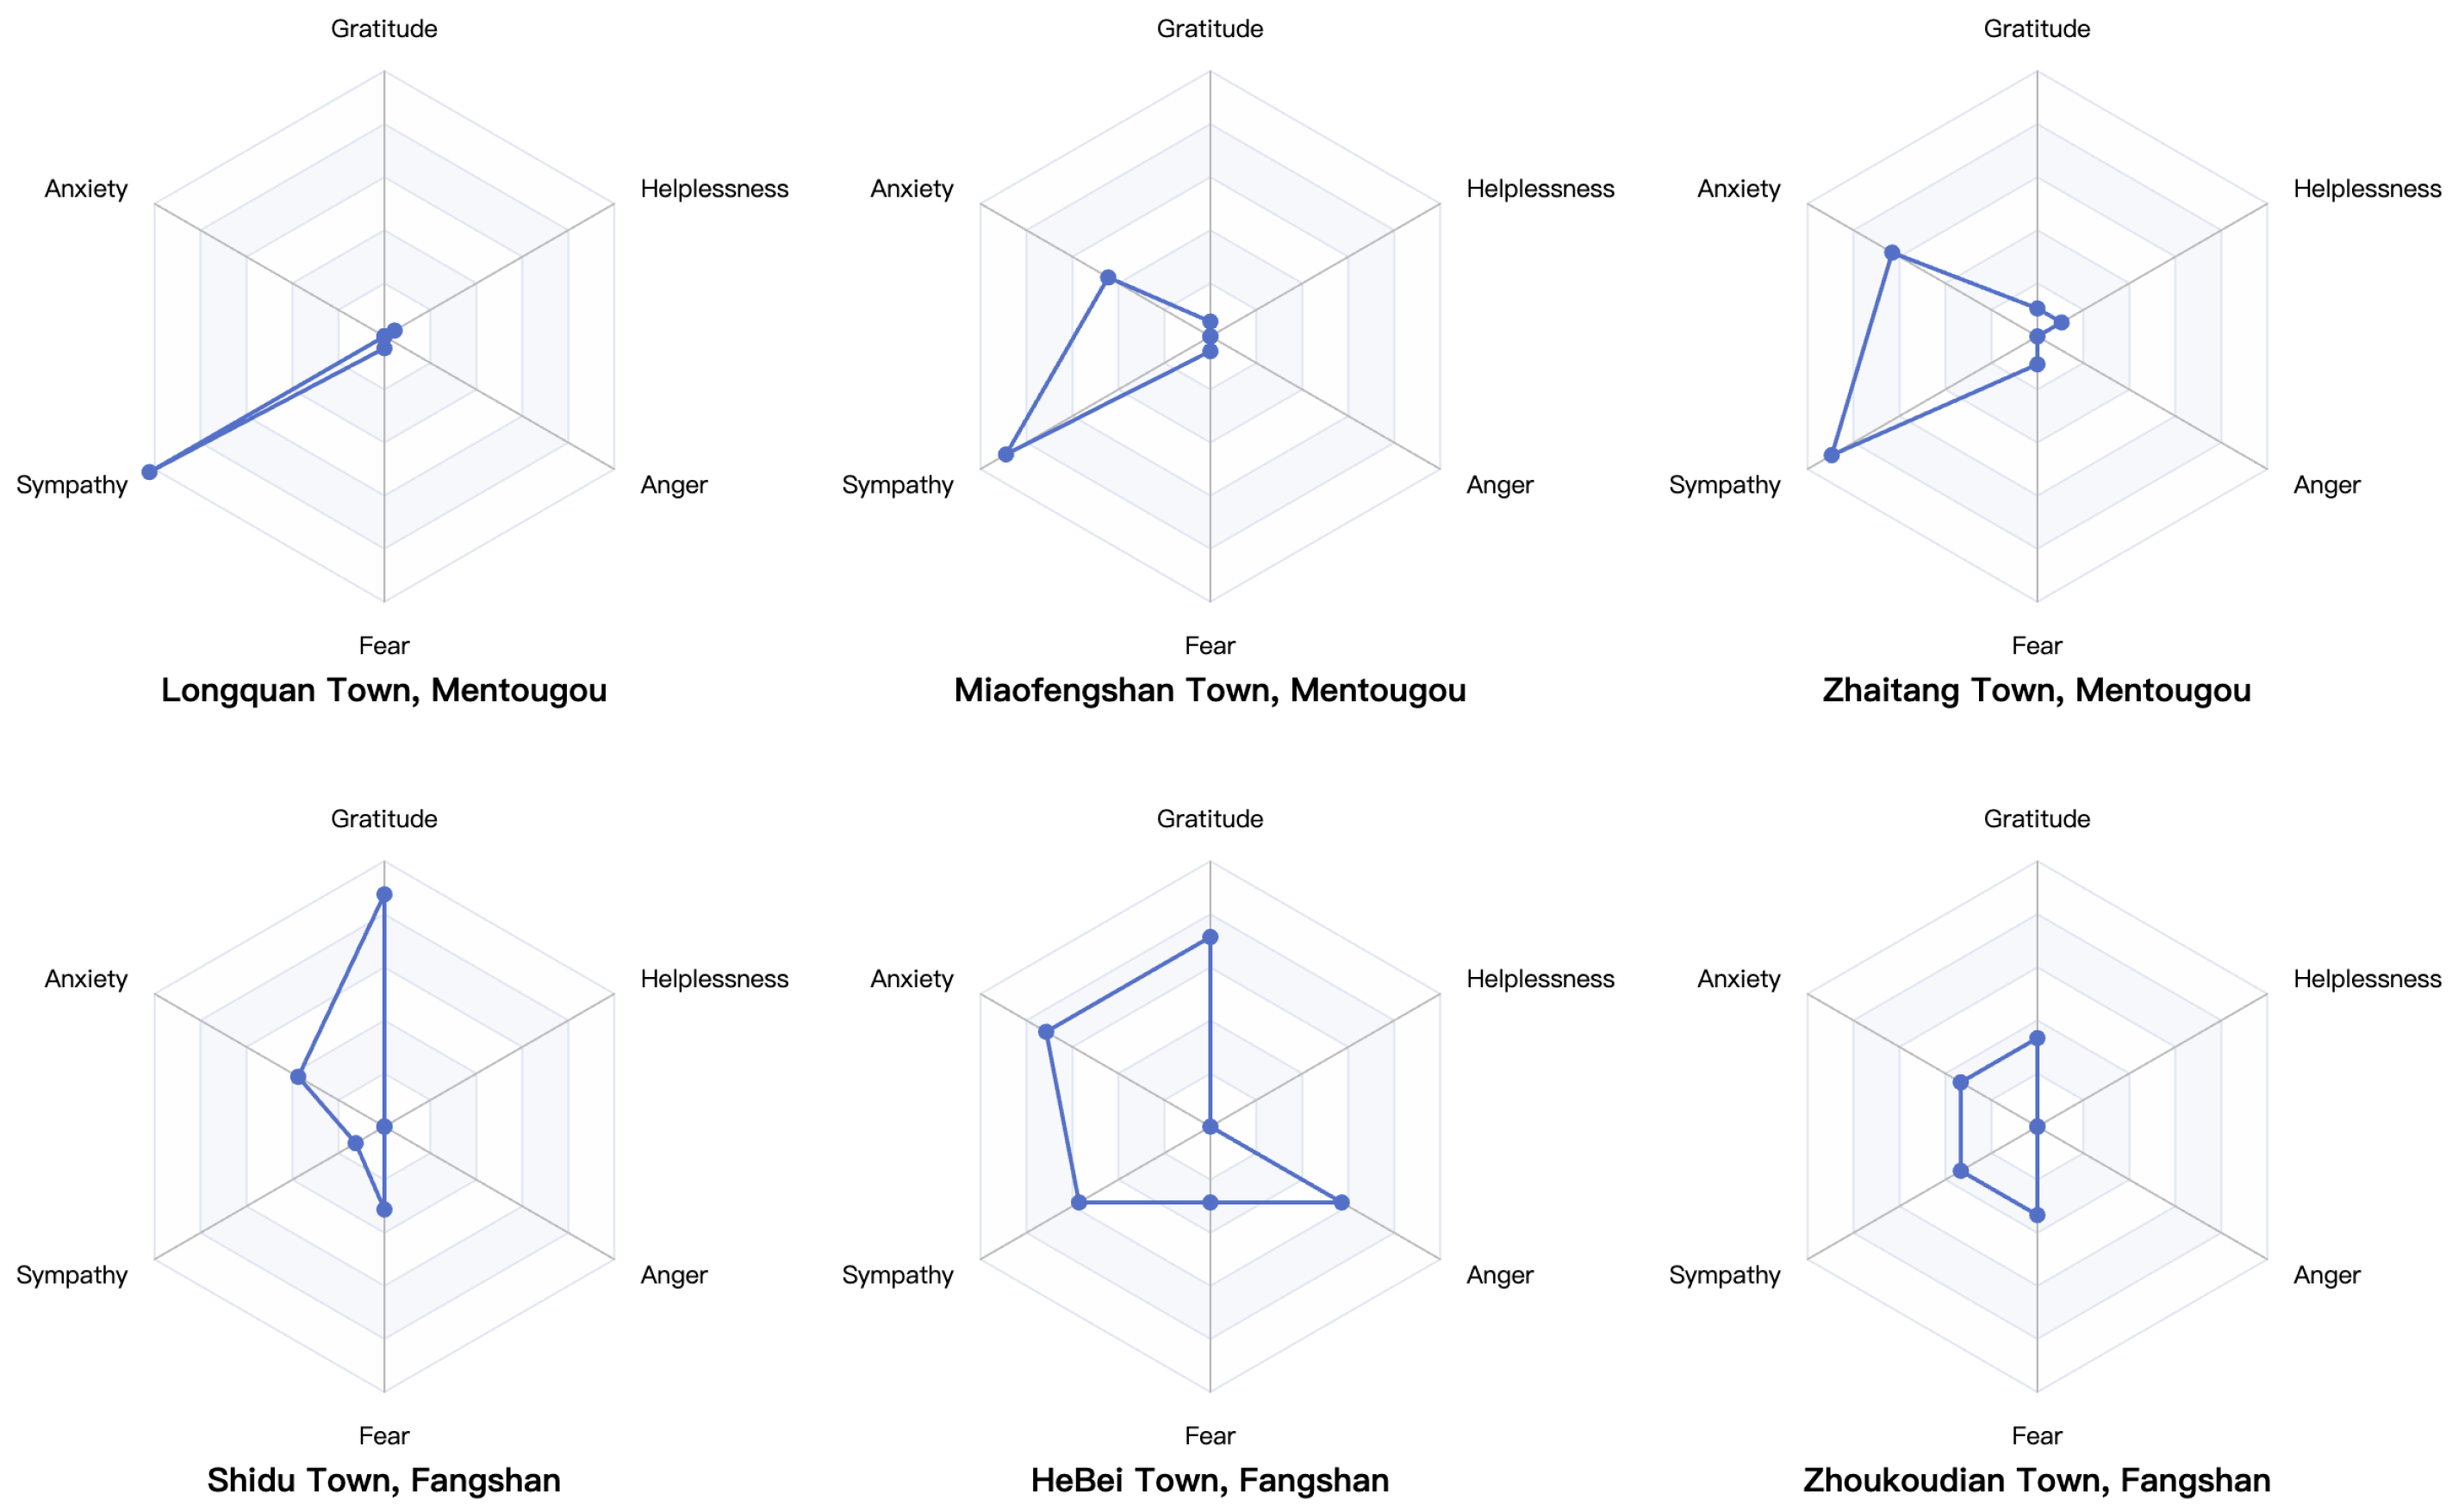
4.4.2. Spatial Analysis of Disaster Sentiment

We analyzed the spatial distribution of disaster sentiments at two different spatial scales: district and township. As shown in Figure 6, we used two severely affected districts, Fangshan and Mentougou, as examples to illustrate the distribution of disaster sentiments at the district scale. At this scale, Mentougou experienced severe disasters and attracted significant public attention, resulting in a higher volume of sentiments extracted from social media. Neutral and sympathy were the most prevalent types, while other sentiments accounted for a smaller proportion. This distribution indicates that public sentiments mainly focus on the objective description of the disaster and sympathy for the affected individuals, while other sentiments are triggered by specific events, such as successful rescues or the emergence of negative issues. In the two districts most severely affected, no optimistic sentiments were extracted from social media, which is understandable. People rarely express positive sentiments when facing danger, and individuals in unaffected areas are also less likely to express optimism.
To gain a deeper understanding of the sentiment distribution in severely affected areas, we selected three heavily impacted townships from both Mentougou and Fangshan to illustrate the distribution of disaster sentiments at the township scale, as shown in Figure 7. Neutral and optimistic sentiments were excluded to focus on changes in other sentiments, allowing for a more targeted analysis of sentiments in specific areas. We observed that expressions of sympathy were significantly more common than other sentiments. Residents in affected areas faced numerous challenges such as being stranded and water and power outages, leading the public to express as much sympathy and concern as possible for the affected individuals on social media. In Longquan Township, Mentougou, sympathy sentiments were particularly high. This was attributed to the deputy mayor of Longquan Township, Liu Jie, who tragically lost his life after being swept away in a torrent while evacuating residents during flood rescue operations. The sacrifice of government officials during disaster relief efforts drew widespread attention, causing an emotional surge in public sympathy. Anxiety and fear were also prominent in all affected areas, reflecting people’s concerns about the disaster’s impact and their fears of potential future developments. Expressions of gratitude frequently appeared, indicating residents’ appreciation for assistance and support, which is a result of effective rescue efforts and social aid. Anger and helplessness accounted for a smaller proportion, suggesting that as rescue operations progressed, the public developed a certain level of confidence in disaster relief efforts. However, the proportion of anger sentiments was relatively higher in HeBei Town, Fangshan, likely due to a perceived mismatch between the allocation of rescue resources and the severity of the disaster. The differences in sentiment distribution among affected townships may be related to the severity of the disaster’s impact, community vulnerability, and response capacity. Therefore, we recommend utilizing these sentiment distributions to guide subsequent psychological support services in disaster-affected areas and considering public sentiment expressions when formulating policies. This can help improve disaster management strategies for future incidents.

5. Discussion

The study found that disaster-related topics exhibited significant temporal evolution characteristics across different phases. In the pre-disaster phase, public awareness of disasters primarily relied on official information, with a focus on disaster warnings and preventive measures. As the disaster unfolded, the topics during the mid-disaster phase shifted to specific events and rescue operations, reflecting the public’s keen attention to the progress of the disaster and their expectations for rescue efforts. In the post-disaster phase, keywords increasingly expressed gratitude toward rescue personnel and social reflection, indicating that the public’s focus in the later stages of the disaster leaned more toward sentiment and value-oriented content. This finding aligns with existing research, which highlights significant differences in public attention across various disaster phases. However, this study further revealed the temporal evolution of disaster-related topics, offering a more detailed analysis of disaster keywords and providing a new perspective for understanding public cognition across different disaster stages.
Secondary disasters displayed significant spatial clustering, particularly in areas like the Mentougou District and the Fangshan District. This clustering is closely associated with factors such as the terrain, infrastructure conditions, and population distribution in these areas. For example, mountainous terrain is prone to triggering geological disasters like mudslides, while low-lying areas are more susceptible to urban flooding. Additionally, the relatively weak infrastructure in these areas further exacerbated the impact of the disasters. This result underscores the critical role of geographical factors in the occurrence and spread of disasters. Future studies should further explore the relationship between geographical factors and secondary disasters to provide scientific support for developing more targeted disaster prevention and emergency management strategies.
There were significant differences in sentiment expression between official media and the public during the disaster. Official media primarily adopted a neutral sentiment, emphasizing factual dissemination and updates on rescue progress. In contrast, public sentiment was more diverse, including expressions of sympathy, concern, and anger. This divergence reflects the different roles and positions of official media and the public in information dissemination and sentiment expression. As an authoritative channel of information, official media prioritizes accuracy and objectivity, while the public tends to express personal sentiment and subjective opinions. This finding highlights the need to consider the asymmetry in information and the sentiment differences between official media and the public when developing communication strategies for disaster emergency management.
We believe that it is highly necessary and meaningful to conduct disaster analysis from different perspectives. Previous studies have made a great deal of efforts in this regard and achieved many remarkable advancements. For example, apart from the research on the time sequence of disaster themes, some studies also analyze disaster themes from a spatial perspective [11], thereby reflecting the disaster-affected situations in different regions. This is a very good approach, which shares similarities with the disaster spatial analysis in our study. In subsequent research, effectively combining the spatiotemporal evolution characteristics of the themes can enable a more comprehensive analysis. However, when it comes to analyzing the disaster chain using social media data, we think there are relatively few existing studies in this area, which is exactly what we hope to explore. Based on previous research [13] on single disasters, we utilize social media data and start from the perspective of primary disasters to analyze the secondary disasters they trigger. Then, through social media data, we delve deeper into exploring the causes of the disaster chain and the causal relationships between different disasters. Compared with the research on a single disaster, we can uncover more of the logic behind the disaster chain.
This study still has some limitations. Although areas such as Mentougou and Fangshan show high popularity in the data, this only reflects the focal points of public attention or the concentrated areas of information dissemination, rather than the absolute scope of the disaster’s impact. We emphasize that areas not mentioned in social media may not have been included in the analysis due to data shortages or insufficient public participation. Therefore, it cannot be directly inferred that these areas were not affected by the disaster. In follow-up work, the coverage blind spots of a single data source can be filled by integrating data from satellite remote sensing and more social media platforms so as to depict the spatio-temporal distribution of disasters more comprehensively. Furthermore, future studies could also explore the broader impacts of disasters on areas such as socioeconomics and ecological environments, achieving a more comprehensive understanding of disaster effects.

6. Conclusions

This study examines the 2023 extreme rainfall event in Beijing, utilizing Sina Weibo data to analyze disaster theme evolution, spatial distribution of secondary disasters, and disaster emotions. The key findings are as follows:
  • Significant Temporal Evolution of Disaster Themes: During the pre-disaster phase, social media themes focused on disaster warnings and prevention measures. In the disaster phase, themes shifted to specific disaster events and rescue actions. Post-disaster, themes expressed gratitude to rescuers and reflected on the societal impact of the disaster. This temporal evolution reflects the public’s cognitive and emotional changes regarding the disaster.
  • Aggregation of Secondary Disasters in Specific Areas: Secondary disasters, such as trapped personnel, missing personnel, casualties, waterlogging, and damage to traffic infrastructure, were concentrated in areas like Mentougou and Fangshan, attributed to the local terrain and infrastructure conditions. These regions exhibit higher disaster risks, necessitating enhanced disaster prevention and emergency management.
  • Distinct Disaster Emotions Expressed by Official Media and the Public: Official media exhibited neutral emotions, focusing on fact dissemination and rescue progress, while the public expressed more sympathy, concern, and anger, reflecting their emotional perception of the disaster.
  • The distribution of sentiment in different impacted areas is related to both the severity of the event in the region and the incidents that occurred during the disaster. Overall, sympathy is the most strongly expressed sentiment across various regions.
  • Outstanding Performance of Bert-BiLSTM Model in Multi-Emotion Classification: By incorporating emojis and contextual information, the Bert-BiLSTM model outperformed Bert and large language models in sentiment classification tasks, highlighting the significance of coupling multiple factors for disaster sentiment classification.
This study has promoted the further development of disaster research by proposing a multidimensional framework. Theoretically, we bridge social media analytics and disaster management through LLM and an enhanced Bert-BiLSTM model, offering methodological innovation for fine-grained sentiment classification and disaster chain analysis. Practically, our findings highlight the need for geographically prioritized resource allocation in high-risk areas (e.g., Mentougou and Fangshan) and tailored communication strategies that balance official media’s factual reporting with public emotional support. Despite these contributions, limitations include data confinement to Sina Weibo, model generalizability across languages or disaster types. Future work should expand to multilingual platforms, integrate multimodal data (e.g., images, videos), and develop dynamic models for long-term sentiment tracking and real-time disaster response.

Author Contributions

Data curation, Yingchun Zhang; Funding acquisition, Xun Zhang; Methodology, Xun Zhang and Xin Zhang; Resources, Xun Zhang; Visualization, Ying Liu and Min Li; Writing—original draft, Xin Zhang; Writing—review and editing, Rui Zhou and Abdureyim Raxidin. All authors have read and agreed to the published version of the manuscript.

Funding

This research was supported by the National Natural Science Foundation of China, grant number 72242106. Project of Social Science Foundation of Xinjiang Uygur Autonomous Region, grant number 2023BTY128, Beijing Social Science Foundation, grant number 24YTC038.

Data Availability Statement

The raw data supporting the conclusions of this article will be made available by the authors on request.

Conflicts of Interest

The authors declare no conflicts of interest.

References

  1. Gu, X.; Ye, L.; Xin, Q.; Zhang, C.; Zeng, F.; Nerantzaki, S.D.; Papalexiou, S.M. Extreme precipitation in China: A review on statistical methods and applications. Adv. Water Resour. 2022, 163, 104144. [Google Scholar]
  2. Zhao, D.; Xu, H.; Li, Y.; Yu, Y.; Duan, Y.; Xu, X.; Chen, L. Locally opposite responses of the 2023 Beijing–Tianjin–Hebei extreme rainfall event to global anthropogenic warming. NPJ Clim. Atmos. Sci. 2024, 7, 38. [Google Scholar]
  3. Lam, N.S.N.; Meyer, M.; Reams, M.; Yang, S.; Lee, K.; Zou, L.; Mihunov, V.; Wang, K.; Kirby, R.; Cai, H. Improving social media use for disaster resilience: Challenges and strategies. Int. J. Digit. Earth 2023, 16, 3023–3044. [Google Scholar]
  4. Cantini, R.; Cosentino, C.; Marozzo, F.; Talia, D.; Trunfio, P. Harnessing prompt-based large language models for disaster monitoring and automated reporting from social media feedback. Online Soc. Netw. Media 2025, 45, 100295. [Google Scholar]
  5. dos Santos, V.G.; Santos, G.L.; Lynn, T.; Benatallah, B. Identifying Citizen-Related Issues from Social Media Using LLM-Based Data Augmentation. In Proceedings of the International Conference on Advanced Information Systems Engineering, Limassol, Cyprus, 3–7 June 2024; pp. 531–546. [Google Scholar]
  6. Li, S.; Sun, X. Application of public emotion feature extraction algorithm based on social media communication in public opinion analysis of natural disasters. PeerJ Comput. Sci. 2023, 9, e1417. [Google Scholar]
  7. Mu, G.; Li, J.; Li, X.; Chen, C.; Ju, X.; Dai, J. An Enhanced IDBO-CNN-BiLSTM Model for Sentiment Analysis of Natural Disaster Tweets. Biomimetics 2024, 9, 533. [Google Scholar] [CrossRef]
  8. Saddam, M.A.; Dewantara, E.K.; Solichin, A. Sentiment analysis of flood disaster management in Jakarta on Twitter using support vector machines. Sink. J. Dan Penelit. Tek. Inform. 2023, 7, 470–479. [Google Scholar]
  9. Yuan, F.; Li, M.; Liu, R.; Zhai, W.; Qi, B. Social media for enhanced understanding of disaster resilience during Hurricane Florence. Int. J. Inf. Manag. 2021, 57, 102289. [Google Scholar]
  10. Guo, Q.; Jiao, S.; Yang, Y.; Yu, Y.; Pan, Y. Assessment of urban flood disaster responses and causal analysis at different temporal scales based on social media data and machine learning algorithms. Int. J. Disaster Risk Reduct. 2025, 117, 105170. [Google Scholar]
  11. Li, R.; Zhao, L.; Xie, Z.; Ji, C.; Mo, J.; Yang, Z.; Feng, Y. Mining and analyzing the evolution of public opinion in extreme disaster events from social media: A case study of the 2022 yingde flood in china. Nat. Hazards Rev. 2025, 26, 05024015. [Google Scholar]
  12. Hou, H.; Shen, L.; Jia, J.; Xu, Z. An integrated framework for flood disaster information extraction and analysis leveraging social media data: A case study of the Shouguang flood in China. Sci. Total Environ. 2024, 949, 174948. [Google Scholar]
  13. Peng, J.; Zhang, J. Spatiotemporal assessment of urban flooding hazard using social media: A case study of Zhengzhou ‘7·20’. Environ. Model. Softw. 2024, 176, 106021. [Google Scholar]
  14. Wang, W.; Zhu, X.; Lu, P.; Zhao, Y.; Chen, Y.; Zhang, S. Spatio-temporal evolution of public opinion on urban flooding: Case study of the 7.20 Henan extreme flood event. Int. J. Disaster Risk Reduct. 2024, 100, 104175. [Google Scholar]
  15. Zhang, P.; Zhang, H.; Kong, F. Research on online public opinion in the investigation of the “7–20” extraordinary rainstorm and flooding disaster in Zhengzhou, China. Int. J. Disaster Risk Reduct. 2024, 105, 104422. [Google Scholar]
  16. Wang, C.; Zhang, X.; Wu, J. Disaster information mining from a social perception perspective: A case study of the “23· 7” extreme rainfall event in the Beijing–Tianjin–Hebei region. Int. J. Disaster Risk Reduct. 2024, 115, 105056. [Google Scholar]
  17. Yan, Z.; Guo, X.; Zhao, Z.; Tang, L. Achieving fine-grained urban flood perception and spatio-temporal evolution analysis based on social media. Sustain. Cities Soc. 2024, 101, 105077. [Google Scholar]
  18. Qian, J.; Du, Y.; Liang, F.; Yi, J.; Wang, N.; Tu, W.; Huang, S.; Pei, T.; Ma, T. Quantifying urban linguistic diversity related to rainfall and flood across China with social media data. ISPRS Int. J. Geo-Inf. 2024, 13, 92. [Google Scholar] [CrossRef]
  19. He, Y.; Yang, B.; He, H.; Fei, X.; Fan, X.; Liu, J. Event Argument Extraction for Rainstorm Disasters Based on Social Media: A Case Study of the 2021 Heavy Rains in Henan. Water 2024, 16, 3535. [Google Scholar] [CrossRef]
  20. Wang, J.; Wang, K. Bert-based semi-supervised domain adaptation for disastrous classification. Multimed. Syst. 2022, 28, 2237–2246. [Google Scholar]
  21. Zou, L.; He, Z.; Zhou, C.; Zhu, W. Multi-class multi-label classification of social media texts for typhoon damage assessment: A two-stage model fully integrating the outputs of the hidden layers of BERT. Int. J. Digit. Earth 2024, 17, 2348668. [Google Scholar]
  22. Jain, P.K.; Quamer, W.; Saravanan, V.; Pamula, R. Employing BERT-DCNN with sentic knowledge base for social media sentiment analysis. J. Ambient. Intell. Humaniz. Comput. 2023, 14, 10417–10429. [Google Scholar] [CrossRef]
  23. Chen, Y.; Hu, M.; Chen, X.; Wang, F.; Liu, B.; Huo, Z. An approach of using social media data to detect the real time spatio-temporal variations of urban waterlogging. J. Hydrol. 2023, 625, 130128. [Google Scholar] [CrossRef]
  24. Wan, B.; Wu, P.; Yeo, C.K.; Li, G. Emotion-cognitive reasoning integrated BERT for sentiment analysis of online public opinions on emergencies. Inf. Process. Manag. 2024, 61, 103609. [Google Scholar] [CrossRef]
  25. Ullah, I.; Jamil, A.; Hassan, I.U.; Kim, B.S. Unveiling the Power of Deep Learning: A Comparative Study of LSTM, BERT, and GRU for Disaster Tweet Classification. IEIE Trans. Smart Process. Comput. 2023, 12, 526–534. [Google Scholar] [CrossRef]
  26. Luo, J.; Wang, L.; Tu, S.; Song, G.; Han, Y. Analysis of public sentiment tendency in sudden meteorological disasters based on LSTM-BLS. Nanjing Xinxi Gongcheng Daxue Xuebao 2021, 13, 477–483. [Google Scholar]
  27. Parimala, M.; Swarna Priya, R.M.; Praveen Kumar Reddy, M.; Lal Chowdhary, C.; Kumar Poluru, R.; Khan, S. Spatiotemporal-based sentiment analysis on tweets for risk assessment of event using deep learning approach. Softw. Pract. Exp. 2021, 51, 550–570. [Google Scholar] [CrossRef]
  28. Hossain, E.; Hoque, M.M.; Hoque, E.; Islam, M.S. A deep attentive multimodal learning approach for disaster identification from social media posts. IEEE Access 2022, 10, 46538–46551. [Google Scholar] [CrossRef]
  29. Faisal, M.R.; Budiman, I.; Abadi, F.; Haekal, M.; Delimayanti, M.K.; Nugrahadi, D.T. Using social media data to monitor natural disaster: A multi dimension convolutional neural network approach with word embedding. J. RESTI (Rekayasa Sist. Dan Teknol. Inf.) 2022, 6, 1037–1046. [Google Scholar] [CrossRef]
  30. Chen, Z.; Lim, S. Social media data-based typhoon disaster assessment. Int. J. Disaster Risk Reduct. 2021, 64, 102482. [Google Scholar] [CrossRef]
  31. Li, S.; Wang, Y.; Huang, H.; Huang, L.; Chen, Y. Study on typhoon disaster assessment by mining data from social media based on artificial neural network. Nat. Hazards 2023, 116, 2069–2089. [Google Scholar] [CrossRef]
  32. Hassan, S.Z.; Ahmad, K.; Hicks, S.; Halvorsen, P.; Al-Fuqaha, A.; Conci, N.; Riegler, M. Visual sentiment analysis from disaster images in social media. Sensors 2022, 22, 3628. [Google Scholar] [CrossRef]
  33. Dwarakanath, L.; Kamsin, A.; Rasheed, R.A.; Anandhan, A.; Shuib, L. Automated machine learning approaches for emergency response and coordination via social media in the aftermath of a disaster: A review. IEEE Access 2021, 9, 68917–68931. [Google Scholar] [CrossRef]
  34. Kumar, A.; Singh, J.P.; Rana, N.P.; Dwivedi, Y.K. Multi-Channel Convolutional Neural Network for the Identification of Eyewitness Tweets of Disaster. Inf. Syst. Front. 2023, 25, 1589–1604. [Google Scholar] [CrossRef]
  35. Koshy, R.; Elango, S. Utilizing social media for emergency response: A tweet classification system using attention-based BiLSTM and CNN for resource management. Multimed. Tools Appl. 2024, 83, 41405–41439. [Google Scholar] [CrossRef]
  36. Yunida, R.; Faisal, M.R.; Indriani, F.; Abadi, F.; Budiman, I.; Prastya, S.E. LSTM and Bi-LSTM models for identifying natural disasters reports from social media. J. Electron. Electromed. Eng. Med. Inform. 2023, 5, 241–249. [Google Scholar] [CrossRef]
  37. Koshy, R.; Elango, S. Applying social media in emergency response: An attention-based bidirectional deep learning system for location reference recognition in disaster tweets. Appl. Intell. 2024, 54, 5768–5793. [Google Scholar] [CrossRef]
  38. Huang, L.; Shi, P.; Zhu, H.; Chen, T. Early detection of emergency events from social media: A new text clustering approach. Nat. Hazards 2022, 111, 851–875. [Google Scholar] [CrossRef]
  39. Pimpalkar, A. MBiLSTMGloVe: Embedding GloVe knowledge into the corpus using multi-layer BiLSTM deep learning model for social media sentiment analysis. Expert Syst. Appl. 2022, 203, 117581. [Google Scholar] [CrossRef]
  40. Li, W.; Haunert, J.H.; Knechtel, J.; Zhu, J.; Zhu, Q.; Dehbi, Y. Social media insights on public perception and sentiment during and after disasters: The European floods in 2021 as a case study. Trans. GIS 2023, 27, 1766–1793. [Google Scholar] [CrossRef]
  41. Mihunov, V.V.; Jafari, N.H.; Wang, K.; Lam, N.S.; Govender, D. Disaster impacts surveillance from social media with topic modeling and feature extraction: Case of Hurricane Harvey. Int. J. Disaster Risk Sci. 2022, 13, 729–742. [Google Scholar] [CrossRef]
  42. Zhou, Z.; Zhou, X.; Chen, Y.; Qi, H. Evolution of online public opinions on major accidents: Implications for post-accident response based on social media network. Expert Syst. Appl. 2024, 235, 121307. [Google Scholar]
  43. Li, L.; Du, Y.; Ma, S.; Ma, X.; Zheng, Y.; Han, X. Environmental disaster and public rescue: A social media perspective. Environ. Impact Assess. Rev. 2023, 100, 107093. [Google Scholar]
  44. Dou, M.; Wang, Y.; Gu, Y.; Dong, S.; Qiao, M.; Deng, Y. Disaster damage assessment based on fine-grained topics in social media. Comput. Geosci. 2021, 156, 104893. [Google Scholar]
  45. Zhang, T.; Shen, S.; Cheng, C.; Su, K.; Zhang, X. A topic model based framework for identifying the distribution of demand for relief supplies using social media data. Int. J. Geogr. Inf. Sci. 2021, 35, 2216–2237. [Google Scholar]
  46. Upadhyay, A.; Meena, Y.K.; Chauhan, G.S. SatCoBiLSTM: Self-attention based hybrid deep learning framework for crisis event detection in social media. Expert Syst. Appl. 2024, 249, 123604. [Google Scholar]
  47. Song, G.; Huang, D. A sentiment-aware contextual model for real-time disaster prediction using twitter data. Future Internet 2021, 13, 163. [Google Scholar] [CrossRef]
  48. Forati, A.M.; Ghose, R. Examining Community Vulnerabilities through multi-scale geospatial analysis of social media activity during Hurricane Irma. Int. J. Disaster Risk Reduct. 2022, 68, 102701. [Google Scholar]
  49. Zeng, Z.; Li, Y.; Lan, J.; Hamidi, A.R. Utilizing user-generated content and gis for flood susceptibility modeling in mountainous areas: A case study of Jian City in China. Sustainability 2021, 13, 6929. [Google Scholar] [CrossRef]
  50. Han, J.; Zheng, Z.; Lu, X.Z.; Chen, K.Y.; Lin, J.R. Enhanced Earthquake Impact Analysis based on Social Media Texts via Large Language Model. Int. J. Disaster Risk Reduct. 2024, 109, 104574. [Google Scholar]
  51. Otal, H.T.; Stern, E.; Canbaz, M.A. Llm-assisted crisis management: Building advanced llm platforms for effective emergency response and public collaboration. In Proceedings of the 2024 IEEE Conference on Artificial Intelligence, Singapore, 25–27 June 2024; pp. 851–859. [Google Scholar]
  52. Murzintcev, N.; Cheng, C. Disaster hashtags in social media. ISPRS Int. J. Geo-Inf. 2017, 6, 204. [Google Scholar] [CrossRef]
  53. Cheng, C.; Zhang, T.; Su, K.; Gao, P.; Shen, S. Assessing the intensity of the population affected by a complex natural disaster using social media data. ISPRS Int. J. Geo-Inf. 2019, 8, 358. [Google Scholar] [CrossRef]
  54. Yang, A.; Yang, B.; Hui, B.; Zheng, B.; Yu, B.; Zhou, C.; Li, C.; Li, C.; Liu, D.; Huang, F.; et al. Qwen2 technical report. arXiv 2024, arXiv:2407.10671. [Google Scholar]
  55. Liu, C.; Fang, F.; Lin, X.; Cai, T.; Tan, X.; Liu, J.; Lu, X. Improving sentiment analysis accuracy with emoji embedding. J. Saf. Sci. Resil. 2021, 2, 246–252. [Google Scholar]
  56. Han, Z.; Shen, M.; Liu, H.; Peng, Y. Topical and emotional expressions regarding extreme weather disasters on social media: A comparison of posts from official media and the public. Humanit. Soc. Sci. 2022, 9, 421. [Google Scholar]
Figure 1. General framework of the study.
Ijgi 14 00136 g001
Figure 2. Multi-sentiment disaster classification model structure.
Ijgi 14 00136 g002
Figure 3. Frequency proportion of different secondary derived event types.
Ijgi 14 00136 g003
Figure 4. Disaster geographic locations.
Ijgi 14 00136 g004
Figure 5. Variation trends of emotional quantity for different disaster types, shown daily in official media (a) and public posts (b).
Ijgi 14 00136 g005
Figure 6. Spatial distribution of sentiment at district level.
Ijgi 14 00136 g006
Figure 7. Spatial distribution of sentiment at town level.
Ijgi 14 00136 g007
Table 1. Types and definitions of disasters and their secondary and derivative events.
Disaster TypeDisaster EventDisaster Event Definition
primary disasterExtreme RainfallExtreme rainfall
secondary disastersDebris FlowsDebris flows caused by extreme rainfall usually damage roads, houses, and so on.
WaterloggingLarge areas of waterlogging due to rainfall, which affect the lives of residents or traffic.
Missing Personnel and CasualtiesPeople being out of contact, injured, or killed due to rainstorms or secondary disasters.
Trapped PersonnelSituations where people were trapped and unable to escape danger due to heavy rain or secondary disasters.
Building DamagedHouses, bridges, or other buildings were damaged or collapsed due to rainstorms or secondary disasters.
Traffic DamageDamage to roads, waterways, or rail transit caused by extreme rainfall or secondary disasters, including collapses, vehicles in distress, and so on.
Power OutagesHeavy rain or secondary disasters cause damage to power facilities, resulting in power outages or power interruptions.
Communication InterruptionsDamage to communication facilities results in signal interruption or communication failure.
Damage to Water Conservancy InfrastructureWater conservancy infrastructure such as reservoirs and dams are damaged or become ineffective due to rainstorms or secondary disasters.
Table 2. The content and frequency information regarding the hashtag of Weibo posts at 6 o’clock on 30 July 2023.
TimeContent and Frequency Information of The Hashtag of Weibo Posts
30 July 2023 06“中央气象台发暴雨红色预警”: 4,
(“Central Meteorological Observatory issued red alert for rainstorm”: 4,)
“北京暴雨”: 3,
(“Beijing Rainstorm”: 3,)
“北京河北局地有特大暴雨”: 2,
(“Beijing Hebei Bureau had extremely heavy rainstorm”: 2,)
“北京企事业单位员工非必要不到岗上班”: 2,
(“Employees of Beijing enterprises and public institutions did not go to work unnecessarily”: 2,)
“北京大雨”: 2,
(“Beijing Heavy rain”: 2,)
“上次发暴雨红色预警还是2011年”: 1,
(“The last red alert for rainstorm was issued in 2011”: 1,)
“中央气象台发布史上第二个暴雨红色预警”: 1,
(“Central Meteorological Observatory issued the second red alert for rainstorm in history”: 1,)
“北京防汛红色预警响应启动”: 1,
(“Beijing flood control red alert response launched”: 1,)
“天津暴雨”: 1,
(“Tianjin Rainstorm”: 1,)
“姬发”: 1,
(“Ji Fa”: 1),
Table 3. Top 10 disaster theme words in different disaster periods.
SeqPre-Disaster PhaseMid-Disaster PhasePost-Disaster Phase
1杜苏芮
(Doksuri)
北京暴雨
(Beijing rainstorm)
北京暴雨
(Beijing rainstorm)
2极端强降雨
(extreme heavy rainfall)
京津冀强降雨
(heavy rainfall in
Beijing–Tianjin–Hebei)
致敬洪水中每位伸出援手的人
(salute to everyone who lent a
helping hand in the flood)
3京津冀
(Beijing–Tianjin–Hebei)
K396次列车
(train K396)
爱在落坡岭
(love in Luopoling)
4北京暴雨
(beijing rainstorm)
北京门头沟
(Beijing Mentougou)
防汛救灾
(flood prevention and disaster relief)
5暴雨天气防范指南
(rainstorm weather preparedness guide)
北京房山
(Beijing Fangshan)
子弟兵抗洪
(the army fought against the flood)
6暴雨预警
(rainstorm warning)
救援行动
(rescue operation)
K396乘客
(passengers on the K396 train)
7重大气象灾害Ⅰ级响应
(level I response to
major meteorological disasters)
防汛预警
(flood prevention warning)
冯振烈士
(martyr Feng Zhen)
8灾害
(disaster)
台风
(typhoon)
武警
(armed police)
9防汛预警
(flood prevention warning)
团结
(solidarity)
洪涝灾害
(flood disaster)
10故宫临时闭馆
(the Forbidden City is temporarily closed)
地质灾害
(geological disasters)
消防员
(firefighter)
Table 4. Partial locations of primary and secondary disasters.
Disaster EventDisaster Event Location
Extreme Rainfall门头沟高山玫瑰园/十三陵镇果庄村……
(Gaoshanmeiguiyuan, Mentougou/
Guozhuang Village, Shisanling Town…)
Debris Flows房山区周口店镇/丁家滩/门头沟区沿河口村……
(Zhoukoudian Town, Fangshan/Ding Jiatan/
Yanhekou Village, Mentougou…)
Waterlogging房山区青龙湖镇北车营村/门头沟龙泉西公交场……
(Beicheying Village, Qinglonghu Town, Fangshan/
Longquan West Bus Yard, Mentougou…)
Personnel Missing and Casualties门头沟区龙泉镇三家店村/房山区十渡镇西石门村……
(Sanjiadian Village, Longquan Town, Mentougou/
West Shimen Village, Shidu Town, Fangshan…)
Trapped Personnel房山周口店镇顺心捷达集配站/门头沟区妙峰山镇水峪嘴村……
(satisfactory Jetta collection station, Zhoukoudian town, Fangshan
Shuiyuzui Village, Miaofengshan Town, Mentougou…)
Building Damage悉昙酒店/水峪嘴村/卢沟桥西侧的小清河桥……
(Xitan Hotel/Shuiyuzui Village/
Xiaoqing River Bridge on the West Side of Lugou Bridge…)
Traffic Damage109国道北京门头沟段/丰台至沙城铁路……
(National Road 109 Beijing Mentougou Section/
Fengtai to Shacheng Railway…)
Power Outages北潞冠家园/房山河北镇……
(Beiluguanjiayuan/HeBei Town, Fangshan…)
Communication Interruptions门头沟雁翅镇/怀柔汤河口镇……
(Yanwing town, Mentougou/Tanghekou Town, Huairou…)
Damage to Water Conservancy Infrastructure大宁水库/门头沟斋堂水库……
(Daning Reservoir/Zhaitangshui Reservoir, Mentougou…)
Table 5. Disaster sentiment classification ablation experiment.
Model ComponentAccuracy Rate (%)
Review Content90.44
Review Content + Emotion91.87
Review Content + Post Content94.29
Review Content + Emotion + Post Content96.09
Table 6. Disaster sentiment classification comparison experiment.
ModelAccuracy Rate (%)
Qwen2.5-7B-Instruct93.11
Bert95.34
Bert-BiLSTM96.09
Disclaimer/Publisher’s Note: The statements, opinions and data contained in all publications are solely those of the individual author(s) and contributor(s) and not of MDPI and/or the editor(s). MDPI and/or the editor(s) disclaim responsibility for any injury to people or property resulting from any ideas, methods, instructions or products referred to in the content.

