Article

Evaluation of Spatial Variability of Soil Nutrients in Saline–Alkali Farmland Using Automatic Machine Learning Model and Hyperspectral Data

1
School of Civil Engineering and Geomatics, Shandong University of Technology, Zibo 255000, China
2
State Key Laboratory of Efficient Utilization of Arid and Semi-Arid Arable Land in Northern China/Key Laboratory of Agricultural Remote Sensing, Ministry of Agriculture and Rural Affairs, Institute of Agricultural Resources and Regional Planning, Chinese Academy of Agricultural Sciences, Beijing 100081, China
3
National Center of Technology Innovationfor Comprehensive Utilization of Saline-Alkali Land, Dongying 257300, China
*
Author to whom correspondence should be addressed.
ISPRS Int. J. Geo-Inf. 2025, 14(10), 403; https://doi.org/10.3390/ijgi14100403
Submission received: 27 July 2025 / Revised: 30 September 2025 / Accepted: 9 October 2025 / Published: 15 October 2025

Abstract

Saline–alkali soils represent a significant reserve of arable land, playing a vital role in ensuring national food security. Given that saline–alkali soil has low soil organic matter (SOM) and soil nutrient contents, and that soil quality degradation poses a threat to regional high-quality agricultural development and ecological balance, this study took coastal saline–alkali land as a case study. It adopted the extreme gradient boosting (XGB) model optimized by the tree-structured Parzen estimator (TPE) algorithm, combined with in situ hyperspectral (ISH) and spaceborne hyperspectral (SBH) data, to predict and map soil organic matter and four soil nutrients: alkali nitrogen (AN), available phosphorus (AP), and available potassium (AK). From the research outputs, one can deduce that superior predictive efficacy is exhibited by the TPE-XGB construct, employing in situ hyperspectral datasets. Among these, available phosphorus (R2 = 0.67) exhibits the highest prediction accuracy, followed by organic matter (R2 = 0.65), alkali-hydrolyzable nitrogen (R2 = 0.56), and available potassium (R2 = 0.51). In addition, the spatial continuity mapping results based on spaceborne hyperspectral data show that SOM, AN, AP, and AK in soil nutrients in the study area are concentrated in the northern, eastern, southern, and riverbank and estuarine delta areas, respectively. The variability of soil nutrients from large to small is phosphorus, potassium, nitrogen, and organic matter. The SHAP (SHapley Additive exPlanations) analysis results reveal that the bands with the greatest contribution to the fitting of SOM, AN, AP, and AK are 612 nm, 571 nm, 1493 nm, and 1308 nm, respectively. Extending into realms of hierarchical partitioning (HP) and variation partitioning (VP), it is discerned that climatic factors (CLI) alongside vegetative aspects (VEG) wield dominant influence upon the spatial differentiation manifest in nutrients. Meanwhile, comparatively diminished are the contributions possessed by terrain (TER) and soil property (SOIL). In summary, this study effectively assessed the significant variation patterns of soil nutrient distribution in coastal saline–alkali soils using the TPE-XGB model, providing scientific basis for the sustainable advancement of agricultural development in saline–alkali coastal regions.

1. Introduction

The importance of soil nutrients in food production, agriculture, and industrial development has become increasingly prominent [1]. This is primarily attributed to declining soil fertility caused by insufficient or unbalanced fertilization, as well as the reduction in arable land resulting from urbanization and industrialization [2,3]. Saline–alkali soils represent an important reserve of arable land for addressing global climate change and ensuring food security [4], and recent research has further confirmed their critical ecological and agricultural value. For instance, long-term saline and water irrigation in the Taklamakan Desert enhanced soil exchangeable calcium, which promoted organic carbon accumulation and stability in arid regions [5]. In the semi-arid regions of Inner Mongolia, the combined application of humic acid and manure reduced electrical conductivity, alleviated microbial nitrogen and phosphorus limitation, and simultaneously increased both organic and inorganic carbon stocks [6]. In the Songnen Plain, long-term rice cultivation lowered soil pH and salinity, enhanced carbon inputs, and improved the stability of organic carbon [7]. In the Yellow River Delta, the effects of dibutyl phthalate (DBP) on microbial communities underscored the ecological sensitivity of this region and the urgent need for restoration [8]. In coastal saline–alkali cotton fields, incorporating cotton residues with deep tillage optimized microbial community structure and improved soil fertility [9]. At the global scale, the adverse impact of salinity upon stocks of soil organic carbon, amelioration measures specific to each region can alleviate [10], and the synergistic effects of organic amendments have been confirmed by global meta-analyses [11]. That saline–alkali soils stand as indispensable in the realm of ecological rehabilitation and agriculturally sustainable advancement, it can be discerned from the collective evidence. Nevertheless, soil salinization reduces fertility by decreasing soil water-holding capacity and organic matter content while hindering plant nutrient uptake, thereby limiting the productivity of most non-halophytic crops in saline–alkali soils [12,13].
Traditional soil nutrient determination methods depend on laboratory analysis [14]. Although widely used, these methods are limited by high costs and low efficiency [15], and the chemical reagents involved may cause environmental risks [16]. Previous studies have demonstrated that spatial prediction of soil nutrients, when combined with auxiliary variables, provides a rapid, economical, non-destructive, and cost-effective approach to soil nutrient assessment [15,17]. Investigating the content and spatial distribution of soil nutrients through such approaches can provide valuable data and theoretical support for agricultural practices in saline–alkali regions [17]. Therefore, studying the spatial variability and driving mechanisms of soil nutrients in coastal saline–alkali soils is of significant strategic importance for their comprehensive development and utilization, as well as for ensuring national food security [18].
Environmental variables used for nutrient prediction can generally be divided into non-spectral and spectral categories. Non-spectral variables include topography, soil type, vegetation, and climate, which directly or indirectly influence soil nutrient content. For example, Tomislav et al. applied gradient boosting tree and random forest, combined with remote sensing covariates and features such as landforms, lithology, and land cover, to model soil properties at different depths, including organic carbon, total nitrogen, total phosphorus, and potassium [19]. Similarly, Li Wenqing, Liu Kai, and colleagues showed that ecosystem factors such as vegetation patterns, restoration time, and soil pH influence the stoichiometric relationships of AN (available nitrogen), C (carbon), and AP (available phosphorus) through intrinsic soil properties such as soil texture and aggregate stability, as well as extrinsic variables such as soil pH and precipitation [20,21]. However, non-spectral approaches often require extensive ground sampling and manual observation, while routine laboratory analyses are both costly and time-consuming [22], potentially reducing prediction accuracy. Moreover, at small regional scales, minimal variation in topographic and climatic factors, combined with limitations in spatiotemporal resolution, means that non-spectral variables often lack the accuracy and sensitivity of spectral variables in capturing subtle variations in soil nutrient content [23].
In precision agriculture and soil management, more responsive environmental variables are needed to improve prediction accuracy and efficiency. In recent years, spectral techniques have been used to estimate the spatial variability of soil properties [24,25]. Multispectral sensors can capture a broader range of the electromagnetic spectrum than monochromatic sensors, thereby improving target recognition and classification [26]. For example, Li Yinshuai et al. employed MODIS time-series images combined with random forest algorithms to identify cultivated land quality grades [27], while near-infrared (NIR) and mid-infrared (MIR) spectroscopy with MIR often showing superior predictive performance [28,29]. However, multispectral techniques have limitations. Their relatively low spectral resolution weakens predictive capability [19], making them more suitable for large-scale applications. Furthermore, multispectral sensors cannot provide continuous spectral data and are constrained by broad spectral bands, limiting their ability to capture the fine spectral information required for accurate soil property estimation [30].
To overcome these limitations, hyperspectral technology has emerged, offering high spectral resolution and continuous spectral characteristics that provide significant advantages in detailed analysis and identification of soil nutrient spatial variability [31,32]. This capability has been successfully applied in ecological vulnerability assessments [33] and mineral exploration [34], demonstrating its broad utility in environmental and geoscientific research. Unlike multispectral technology, which has broader bands and fewer channels [32], hyperspectral imaging provides ultra-fine spectral information to characterize material properties [35]. Previous studies have used hyperspectral VNIR data to obtain soil spectral information and, through regression algorithms and feature band selection, modeled and predicted soil nitrogen, phosphorus, and potassium content [15,24]. UAV-based hyperspectral remote sensing combined with machine learning has also been employed to extract spectral features and establish quantitative inversion models for soil nutrients [36]. However, existing studies often overlook hyperparameter optimization, a key process in machine learning that significantly affects model fitting accuracy [37]. Traditional hyperparameter tuning methods, such as manual trial-and-error or GridSearch, are often inefficient and may fail to guarantee optimal solutions [38]. Furthermore, while hyperspectral variables provide predictive advantages, they do not directly explain the driving mechanisms of soil nutrient variability. The potential of hyperspectral variable-based spatial mapping for analyzing soil nutrient variability remains underexplored. To date, no studies have integrated hyperparameter-optimized machine learning models with hyperspectral data to perform spatial prediction of soil nutrients followed by driving mechanism analysis.
Therefore, this study aims to achieve the following objectives: (1) integrate the SHAP (shapley additive explanations) method with the XGBoost model to identify nonlinear spectral features with significant contributions from massive airborne and in situ hyperspectral datasets; (2) develop a TPE-optimized XGBoost model for predicting nutrient distributions and compare the performance of in situ and spaceborne hyperspectral data; and (3) use spatial maps derived from spaceborne hyperspectral data, combined with hierarchical partitioning and variance partitioning, to analyze the synergistic driving effects of soil, vegetation, and climate factors on the spatial variability of soil nutrients. This study is expected to provide scientific evidence for the high-quality agricultural development in coastal saline–alkali land.

2. Materials and Methods

2.1. Study Area

The study area is located in the coastal saline–alkali zone of Dongying City, Shandong Province, China (118°10′–119°05′ E, 36°40′–38°10′ N). It lies within a temperate continental monsoon climate, with mean annual temperature around 14.4 °C and average precipitation of 902.8 mm. Agriculture is the dominant land use, where major crops such as wheat, corn, and rice are widely cultivated, making the region an important grain production base. The soils have developed mainly from alluvial loess and are classified primarily as Fluvo-aquic and paddy soils under the Chinese Soil Taxonomy (CST). Soil salinization is widespread and represents a key limitation to agricultural productivity. Saline–alkali soil is a degraded soil type with unfavorable properties and low fertility. Its characteristics, including high salt content, low permeability, and low organic matter content, restrict the land’s productive capacity. The study area is a key region in China for research focused on the amelioration and utilization of saline–alkali soil. To this end, we uniformly collected 144 topsoil samples (0–20 cm) from farmland in coastal saline–alkali areas at the end of September 2022. The study area and specific sampling locations are shown in Figure 1.

2.2. Data Sources and Preprocessing

2.2.1. Spectral Data

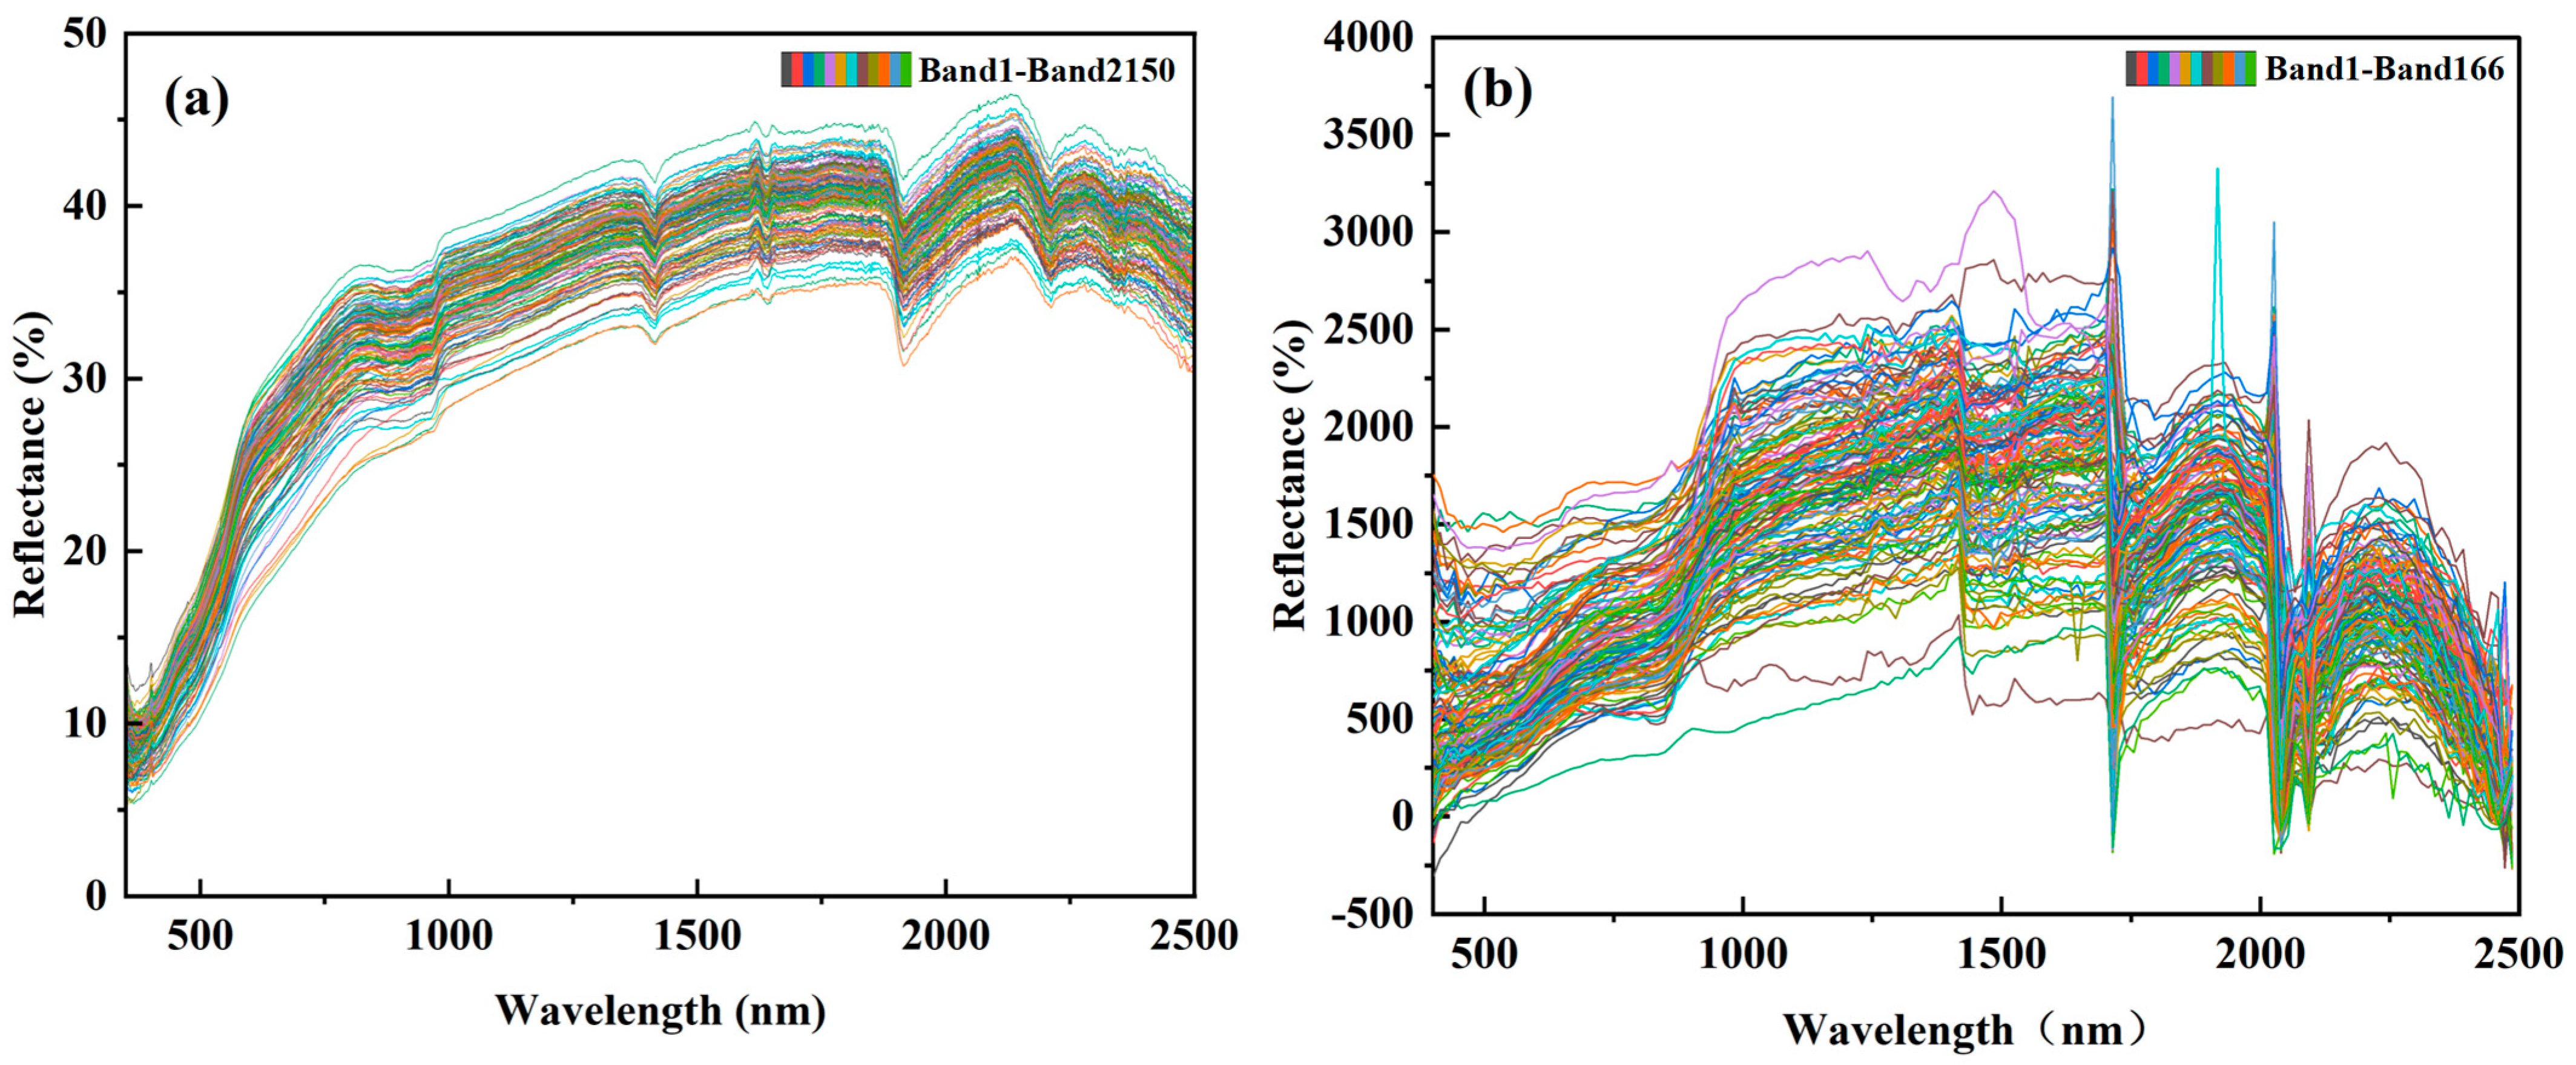
Obtained were in situ hyperspectral data through the process of measuring 144 soil samples, these collected from the study area, employing an in situ hyperspectral spectrometer. The spectrometer mainly collected information between 350 nm and 2500 nm (band resolution: 1 nm), resulting in a total of 2150 × 144 in situ hyperspectral data points. Figure 2a shows the in situ hyperspectral curve. In the visible light band (400–780 nm), the reflectance band increases significantly; in the near-infrared band (780–1100 nm), the band continues to rise but tends to slow down overall; in the short-wave infrared (mid-infrared) band (1100–2500 nm), the band tends to be stable, maintaining a reflectance of around 30%~40%. However, there are several obvious absorption valleys in this interval (such as around 1400 nm, 1600 nm, 1800 nm, and 2200 nm). The 2300 nm-2500 nm band shows a slow downward trend, and the highest reflectance value of about 35–45% is obtained near the 2100 nm band.
The remote sensing images of spaceborne hyperspectral data come from the Ziyuan-1 satellite and are obtained after preprocessing such as atmospheric correction, radiometric calibration, and image cropping in ENVI software. After multi-value extraction to points in the ArcGIS software, 144 × 166 spaceborne data are obtained. Figure 2b shows the spaceborne hyperspectral curve of 144 soil samples. The analysis of the figure shows that the spaceborne hyperspectral curve has an overall upward trend in the visible light band (400–780 nm), but it is not obvious; in the near-infrared band (780–1100 nm), the spectral curve has a significant upward trend and remains stable; in the short-wave infrared (mid-infrared) band (1100–2500 nm), the spectral curve fluctuates greatly. Around 1700 nm and 2000 nm, some samples exhibit significant fluctuations in reflectance, while after the 2200 nm band, a slow decreasing trend is observed. Compared to in situ hyperspectral data (Figure 2a), the fluctuations in spaceborne hyperspectral data are more pronounced, especially in the 1000–1500 nm and 1700~2200 nm ranges. In contrast, the in situ hyperspectral data is generally more stable. Despite the large number of samples, the spectral curve of each sample is basically consistent with the overall trend. Some samples in the spaceborne hyperspectral data show large oscillations, exhibiting a trend inconsistent with the overall pattern. This may be due to the influence of atmospheric scattering and absorption, resulting in more noise in the spaceborne hyperspectral data.

2.2.2. Soil Nutrient Data

In October 2022, 144 soil samples were collected in the superficial layer (0–20 cm), four soil nutrient parameters were measured and calculated: AP, AN, AK, and SOM. Soil alkali-hydrolyzable nitrogen was determined using the alkali-hydrolyzable diffusion method. This method hydrolyzes and reduces the soil under alkaline conditions in the presence of ferrous sulfate, converting easily hydrolyzable nitrogen and nitrate nitrogen into ammonia, which is then absorbed by a boric acid solution via diffusion. The ammonia absorbed in the boric acid solution is then titrated with a standard acid to calculate the alkali-hydrolyzable nitrogen content. The procedure involves weighing an air-dried soil sample, adding ferrous sulfate powder, sealing the diffusion dish with alkaline glue, adding sodium hydroxide solution, performing constant-temperature diffusion, and finally titrating the NH3 in the absorbent with a standard sulfuric acid solution. The calculation formula is
ω ( N ) = ( V V 0 ) × c × M m × 1000
where ω ( N ) is the mass fraction of soil alkali-hydrolyzable nitrogen (mg kg−1), c is the concentration of the sulfuric acid (1/2 H2SO4) standard solution (mol L−1); V is the volume of sulfuric acid standard solution employed within the act of sample determination (mL); V0 is the volume of sulfuric acid standard solution engaged during the blank test (mL); M is the molar mass of N, M(N) = 14 g·mol−1; m is the soil sample mass (g).
The determination of soil-available potassium typically employs the ammonium acetate extraction method. This method relies on the exchange of potassium ions on the surface of soil colloids with a neutral 1 mol L−1 ammonium acetate solution, which allows water-soluble potassium ions to enter the solution as well. Subsequently, the potassium concentration in the extract is determined using a flame photometer. The specific calculation formula is
W k = c × V m 1 × K 2 × 1 0 3 × 1000
where W K is the content of available potassium (K) (mg kg−1); c is the potassium concentration in the reading solution obtained from the standard curve (μg mL−1); V is the volume of the extractant (mL); K2 is the moisture conversion factor from air-dried to oven-dried soil samples; m1 represents the mass of the air-dried soil sample (g).
Employed in the assessment of soil AP, was the method utilizing sodium bicarbonate. This method extracts available phosphorus from the soil with NaHCO3 solution at pH 8.5, reducing Ca2+ activity by forming CaCO3 precipitates, which promotes the leaching of Ca-P. It also increases the pH in acidic soils to hydrolyze Fe-P and Al-P. The calculation formula for available phosphorus content is
ω ( P ) = P × V × t s m
where ω ( P ) represents the mass fraction of soil AP (mg kg−1); ρ is the phosphorus concentration obtained from the standard curve (mg L−1); V is the volume of the colorimetric solution (mL); ts is the aliquot factor (total volume of extract/volume of extract taken); m denotes the mass (g) from the dried soil.
Determination of soil organic matter content involves oxidizing soil organic carbon with potassium dichromate-sulfuric acid solution under heating, followed by titrating the remaining potassium dichromate with a standard ferrous sulfate solution. The amount of organic carbon is calculated from the amount of ferrous sulfate consumed and then calculated by a coefficient of 1.724 to obtain the soil organic matter content. The specific calculation formula is
ω o m = ( A A 0 α ) × 100 b × m 1 × 1000 × 1.724
where m 1 indicates the mass (g) of dry matter; ω o m corresponds to the soil organic matter content (%); A and A 0 refer to the absorbance of the sample digestion solution and the blank test, respectively; a is the intercept of the calibration curve.

2.2.3. Driving Factor Data

Factors pivotal to the study encompass topography, climatic variables, indices of vegetation, along with soil attributes (as articulated in Table 1). Soil factors were determined based on 144 soil samples, with soil moisture content (SoilMOI), soil pH (SoilpH), and soil salinity (SoilSAL) measured using the drying method, electrode method, and mass method, respectively. The spatial distribution pertinent to these soil elements was yielded through Kriging interpolation, executed within ArcGIS 10.8. Access to topographical data emerged from the Geospatial Data Cloud platform situated within the Computer Network Information Center of the Chinese Academy of Sciences (http://www.gscloud.cn, accessed on 10 January 2020). Three topographic factors—elevation (ELE), slope (SLO), and aspect (ASP)—were derived using the surface analysis tools in ArcGIS 10.8. Climate factors, including monthly average temperature (TMP), monthly average precipitation (PRE), and potential evapotranspiration (PET), were obtained from the Climatic Research Unit (CRU) at the National Center for Atmospheric Research (NCAS) (http://www.cru.uea.ac.uk/data, accessed on 10 May 2023). Ordinary Kriging was used to interpolate the three climate factors, and spatial grid maps were generated using ArcGIS 10.8 software.
In addition, vegetation indices were derived from Sentinel-2 L2A remote sensing images acquired in September 2022 from the European Space Agency (https://www.copernicus.eu/en/access-data/conventional-data-access-hubs, accessed on 12 November 2022). Using the band math tool in ENVI 5.3 software, three vegetation indices were calculated according to the given formulas: the final red-edge soil adjusted vegetation index (SAVIred), the plant senescence reflectance index (PSRI), and the normalized difference vegetation index (NDVI). The spatial resolution of the driving factors above was unified to 10 m × 10 m. This provides data support for subsequent analysis of variability mechanisms when combined with spatial maps of soil nutrients.

2.3. Band Selection

Traditional column sampling methods struggle to efficiently identify features crucial for model performance within vast feature spaces. This research involves a large amount of data, especially in situ hyperspectral data, and the complex data characteristics increase the time cost of model training. Therefore, before formal modeling, the SHAP method is introduced in conjunction with machine learning models to filter the band of satellite data and the band of in situ hyperspectral data from the huge amount of data. SHAP is a unified interpretation framework proposed by Lundberg and Lee in 2016 [39]. It calculates the SHAP value for each variable involved in the modeling process to measure its importance to the target, and outputs images based on the Python 3.9 package matplotlib so that the model can be explained more intuitively.
After screening and removing bands with smaller contributions, the SHAP contribution values of the finally selected bands account for more than 70% of the total band contribution values. The screened bands are then put into the model for training. The feature bands are shown in Figure 3.

2.4. TPE Optimization Algorithm

Bayesian hyperparameter optimization was initially proposed by Snoek et al. [40]. As a variant of Bayesian algorithms with excellent performance, the TPE is an efficient hyperparameter optimization technique. It has achieved good results in many fields [41]. Kim et al. employd a TPE-based Bayesian optimization machine learning model to predict land subsidence and achieved the optimal performance of the optimized model [42]. TPE intelligently samples and iterates the hyperparameters of the model by constructing a Gaussian Mixture Model (GMM). Unlike traditional Bayesian optimization, it can optimize categorical and conditional hyperparameters, providing a wider range of hyperparameter options [43]. In addition, the algorithm has excellent global exploration capabilities and can be observed where it deftly avoids entrapment in local optima [44]. The principle of TPE algorithm is shown in Figure 4. Serving predominantly as a foundation for algorithm selection, Expected Improvement (EI) underlies it, with its computational formula presented thusly:
First, two probabilisty density functions, defined by the algorithm, present themselves., namely g ( x ) and l ( x ) , which are the functions corresponding to y values greater than and less than a certain critical value, respectively.
p ( x y ) = l ( x ) i f ,   y < z g ( x ) i f ,   y z
where z is the value at the r-quantile of the prediction target of the dataset. In the original TPE study, the value of r was 0.15 [43].
r = P ( y < z )
The TPE algorithm utilizes the Expected Improvement (EI) as its acquisition function, defined as the expectation that the objective function f(x) falls below a threshold z. Its formulation is given by:
E I y * x = r y * l x l ( x ) y * p ( y ) d y r l x 1 r g ( x ) r + g x l x 1 r 1
The calculation formula shows that EI is inversely proportional to g x and directly proportional to l x . To maximize EI during the iteration process, g x l x is used to select the most suitable x value. The returned y* participates in the next iteration. This iteration process is repeated until the optimal value of the algorithm stagnates for a long time or reaches the specified iterations. And returns the optimal parameter combination [36].

2.5. XGB Model

The XGB model was recognized as one of the best-performing gradient boosting machine algorithms in supervised learning [45]. As an optimized Gradient Boosting Decision Tree (GBDT) variant, XGB integrates a regularization term into its objective function for enhanced overfitting resistance [46], and adopts a second-order Taylor expansion for loss function approximation—outperforming GBDT’s first-order expansion in capturing actual loss characteristics. XGB also adopts column sampling from the Random Forest model, where only a subset of features is selected during each iteration for training, thereby controlling overfitting by reducing the amount of data used. Moreover, XGB is an algorithm with sparsity-aware capabilities, which is particularly important when certain parts of the data are missing [47]. The prediction result of a sample is given by the following formula:
y ^ = t = 1 H f t ( x )
In this formula, y ^ represents the prediction target of the algorithm; H is the number of decision tree algorithms; x denotes the data sample; f t ( x ) is the prediction value of the t-th decision tree algorithm for sample x.
Previous studies have shown that the XGB model performs excellently in regression or prediction tasks across various scenarios and has been widely applied in multiple fields. In this experiment, the model was built using the native XGB interface of the xgboost package (version 1.42) in the PyCharm 2021 environment. The detailed hyperparameter configuration of the model is shown in Table 2.

2.6. Principles of SHAP and Model Interpretation

SHapley Additive exPlanations (SHAP) is a general model interpretation method that decomposes the prediction results of complex models into the contributions of individual features. By satisfying axioms such as local accuracy, consistency, and missingness, SHAP provides a rational attribution of model outputs. Compared with traditional feature importance evaluation methods, SHAP not only maintains global consistency but also offers fine-grained explanations for individual predictions. As a result, it is widely regarded as an essential tool for uncovering the internal mechanisms of “black-box” models.
In tree-based models, the commonly used TreeSHAP algorithm enables efficient and accurate computation of each feature’s contribution. It can quantify both the positive and negative impacts of features on predictions, as well as reveal interaction effects among features. This feature attribution approach supports both local-level interpretation (analyzing the driving factors behind a single sample’s prediction) and global-level interpretation (assessing the overall importance and directional influence of features). Numerous studies have demonstrated that SHAP exhibits strong explanatory power in complex environmental modeling and process simulations. In particular, when applied to nonlinear models such as ensemble learning and boosting trees, SHAP effectively bridges model behavior with physically meaningful driving factors, thereby offering new analytical perspectives for geographic information and environmental sciences.
In the XGB model of this study, the specific application procedure includes the following steps: first, training the optimized XGB model; second, selecting a representative subset of the training data as the background distribution; third, computing SHAP values for the test samples; fourth, evaluating feature importance through global mean contributions and identifying key driving factors using dependence and interaction plots; and finally, integrating SHAP results with spatial data for mapping analysis so as to reveal spatial differences in prediction values across regions and their underlying causes.

2.7. Performance Evaluation of TPE-XGB Model

In this study, the dataset was randomly partitioned into a 75% training set for model development and a 25% testing set for validation. After model training was completed, the testing set was used for accuracy validation, and the model’s performance on the testing set was used as the evaluation metric for overall model accuracy. In this study, after band selection, the final input features for the in situ hyperspectral and organic matter prediction model consisted of 11 in situ hyperspectral bands. The input features for the spaceborne hyperspectral and organic matter model consisted of 12 bands, and the selected characteristic bands for soil nitrogen, phosphorus, and potassium ranged between 10 and 14. To comprehensively and accurately evaluate model performance, model performance was evaluated using the coefficient of determination (R2) and root mean square error (RMSE), defined as follows:
R 2 = [ i = 1 m ( y i y i ¯ ) ( y ^ i y i ¯ ) ] 2 ( y i y i ¯ ) 2 i = 1 m ( y ^ i y i ¯ )
R M S E = 1 m i = 1 m ( y ^ i y i ) 2
In the formulas, y ^ i represents the predicted value; y i and y ^ i represent the mean values of the true values and predicted values, respectively; i is the sample index, and m refers to the total count of samples. In addition, SHAP is equipped with various explainers to interpret different types of models. In this study, TreeExplainer is used to interpret the XGB model.
To better evaluate the accuracy of the two hyperspectral modeling approaches, we define the accuracy degradation ratio of R2 between in situ hyperspectral and spaceborne hyperspectral data as I(R2), and the accuracy degradation ratio of RMSE as I(RMSE). The formulas are as follows:
I ( R 2 ) = R I S H 2 R S B H 2 R S B H 2 × 100
I ( R M S E ) = R M S E I S H R M S E S B H R M S E S B H × 100
where R I S H 2 represents the R2 value of the in situ hyperspectral data, R I S H 2 represents the R2 value of the spaceborne hyperspectral data; R I S H 2 represents the RMSE value of the in situ hyperspectral data, and R M S E S B H represents the RMSE value of the spaceborne hyperspectral data.

2.8. Hierarchical Partitioning and Variance Decomposition

Hierarchical Partitioning (HP) describes the relative importance of each predictor variable (or group of predictor variables) across the full model [48]. However, HP does not assume a causal hierarchy but instead uses all relationships among variables to identify the most likely causal variables. HP is a commonly used statistical method that can be considered an extension of commonality analysis (CA). Variation partitioning (VP), the predecessor of hierarchical partitioning (HP), emphasizes the unique and shared variation among predictor variables [48]. It is used to decompose the total variation into the contributions of different components (or component groups). We used the “rdacca.hp” package [48] to perform hierarchical partitioning analysis to determine the synergistic driving effects of 12 factors (ASP, SLO, ELE, TM, PRE, PET, SoilMOI, SoilpH, SoilSAL, SAVI, NDVI, PSRI) on the spatial variability of four soil nutrients (AN, AK, AP, SOM).

3. Results and Analysis

3.1. Distribution Characteristics and Variability of Soil Nutrients

The sample distributions of soil organic matter, AN, AP, and AK contents in farmland in the study area were relatively concentrated, conforming to a skewed distribution, with some outliers (Figure 5a). The numerical variability of soil nutrients was assessed using the Coefficient of Variation (CV), categorized as low differences accuracy (CV < 15%), moderate differences accuracy (15% < CV < 35%), and high differences accuracy (CV > 35%) [39]. Analysis of Figure 5b shows that the CV values for all four soil nutrients were greater than 40%, indicating high differences in accuracy and exhibiting significant spatial differences. Furthermore, the high number of outliers for phosphorus likely contributed to its particularly high CV (132.9%). Furthermore, the soil nutrients in the study area exhibited significant correlations (Figure 5b). All four soil nutrients were positively correlated with each other, with soil organic matter and nitrogen showing the strongest correlation (r = 0.65).

3.2. Accuracy Assessment of Soil Nutrient Prediction Models

Following hyperparameter optimization, the TPE-XGB model was applied to estimate four soil nutrients utilizing both in situ and spaceborne hyperspectral data. As summarized in Table 3, the model performed best for phosphorus and organic matter when using in situ hyperspectral data, yielding R2 values of 0.70 and 0.65, and RMSE values of 9.84 mg kg−1 and 0.21 mg kg−1, respectively. The TPE-XGB model demonstrated an explanatory power (R2) greater than 0.5 for the spatial differences of all four soil properties based on in situ hyperspectral data, indicating that the XGB model possesses strong fitting capability when applied to high-quality datasets.
However, the model shows relatively low accuracy when fitting spaceborne hyperspectral data to soil properties, with most R2 values ranging between 0.4 and 0.6. The accuracy degradation ratios of R2 and RMSE between in situ hyperspectral and spaceborne hyperspectral data, denoted as I(R2) and I(RMSE), respectively, were calculated. As shown in Table 2, organic matter exhibits the highest accuracy degradation at 44%, indicating a significant difference between satellite-based and in situ prediction results for this soil nutrient. Phosphorus shows the smallest accuracy degradation at 15%, suggesting a smaller gap in accuracy between satellite-based and in situ measurements and higher reliability. Most of the RMSE degradation ratios are negative, indicating that the RMSE of spaceborne hyperspectral data is higher and the model’s prediction error is greater. Overall, the XGB model provides better prediction accuracy for soil organic matter compared to AN, AK, and AP. Due to low pixel purity and mixed pixel interference, spaceborne hyperspectral data yield lower fitting accuracy for soil nutrient spatial differences than in situ hyperspectral data.

3.3. Evaluation of TPE-XGB Model Fitting Performance Via Scatter Plot Analysis

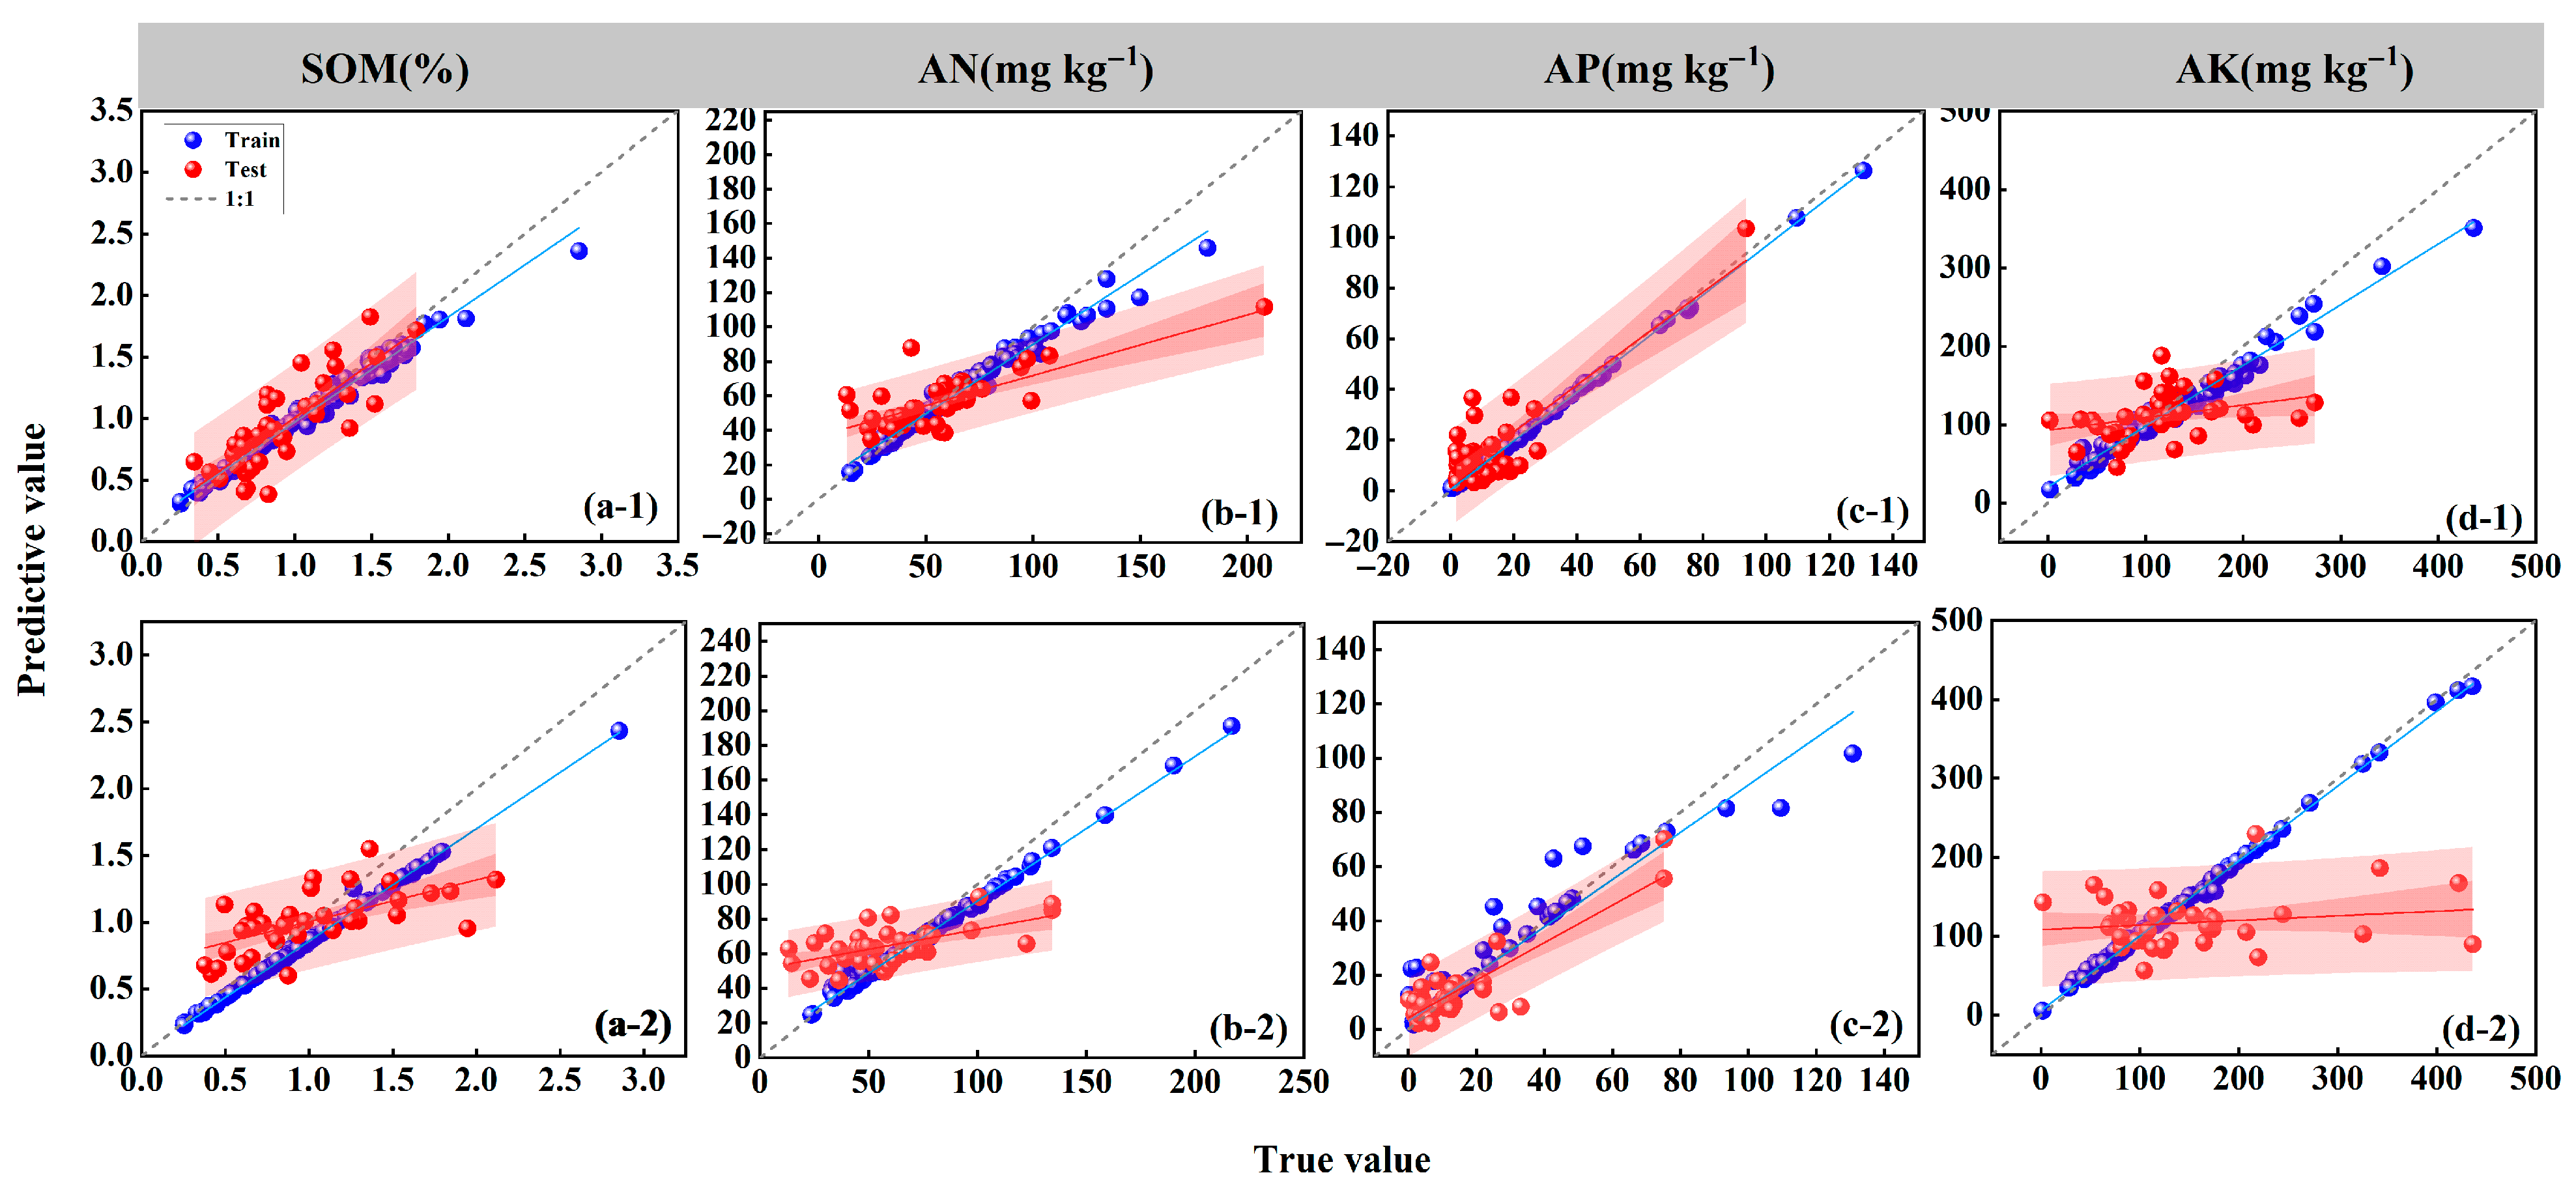
Figure 6 shows the scatter plots for four types of soil nutrients based on in situ and spaceborne hyperspectral data by the TPE-XGB model. In the models constructed with in situ hyperspectral data (Figure 6(a-1)–(d-1)), the scatter distributions of both the training and testing sets for SOM and AP are relatively concentrated, with the scatter points and fitted curves distributed near the 1:1 diagonal line, indicating that the TPE-XGB model performs well in fitting these two soil nutrients. In contrast, the scatter plots of the testing sets for AN and AK are more dispersed, with a noticeable overestimation of low values, particularly in AK. In the TPE-XGB models constructed with spaceborne hyperspectral data (Figure 6(a-2)–(d-2)), the testing set distributions for AN, AK, and SOM are more scattered and deviate further from the diagonal line. Both in situ and spaceborne hyperspectral data show better performance in the training sets, while the TPE-XGB model based on spaceborne hyperspectral data exhibits greater dispersion in extreme values. This suggests that noise pixels affected by climatic conditions and mixed pixel interference result in lower fitting performance for soil nutrients with high spatial differences.

3.4. Spatial Distribution Mapping of Soil Nutrients Using TPE-XGB Model

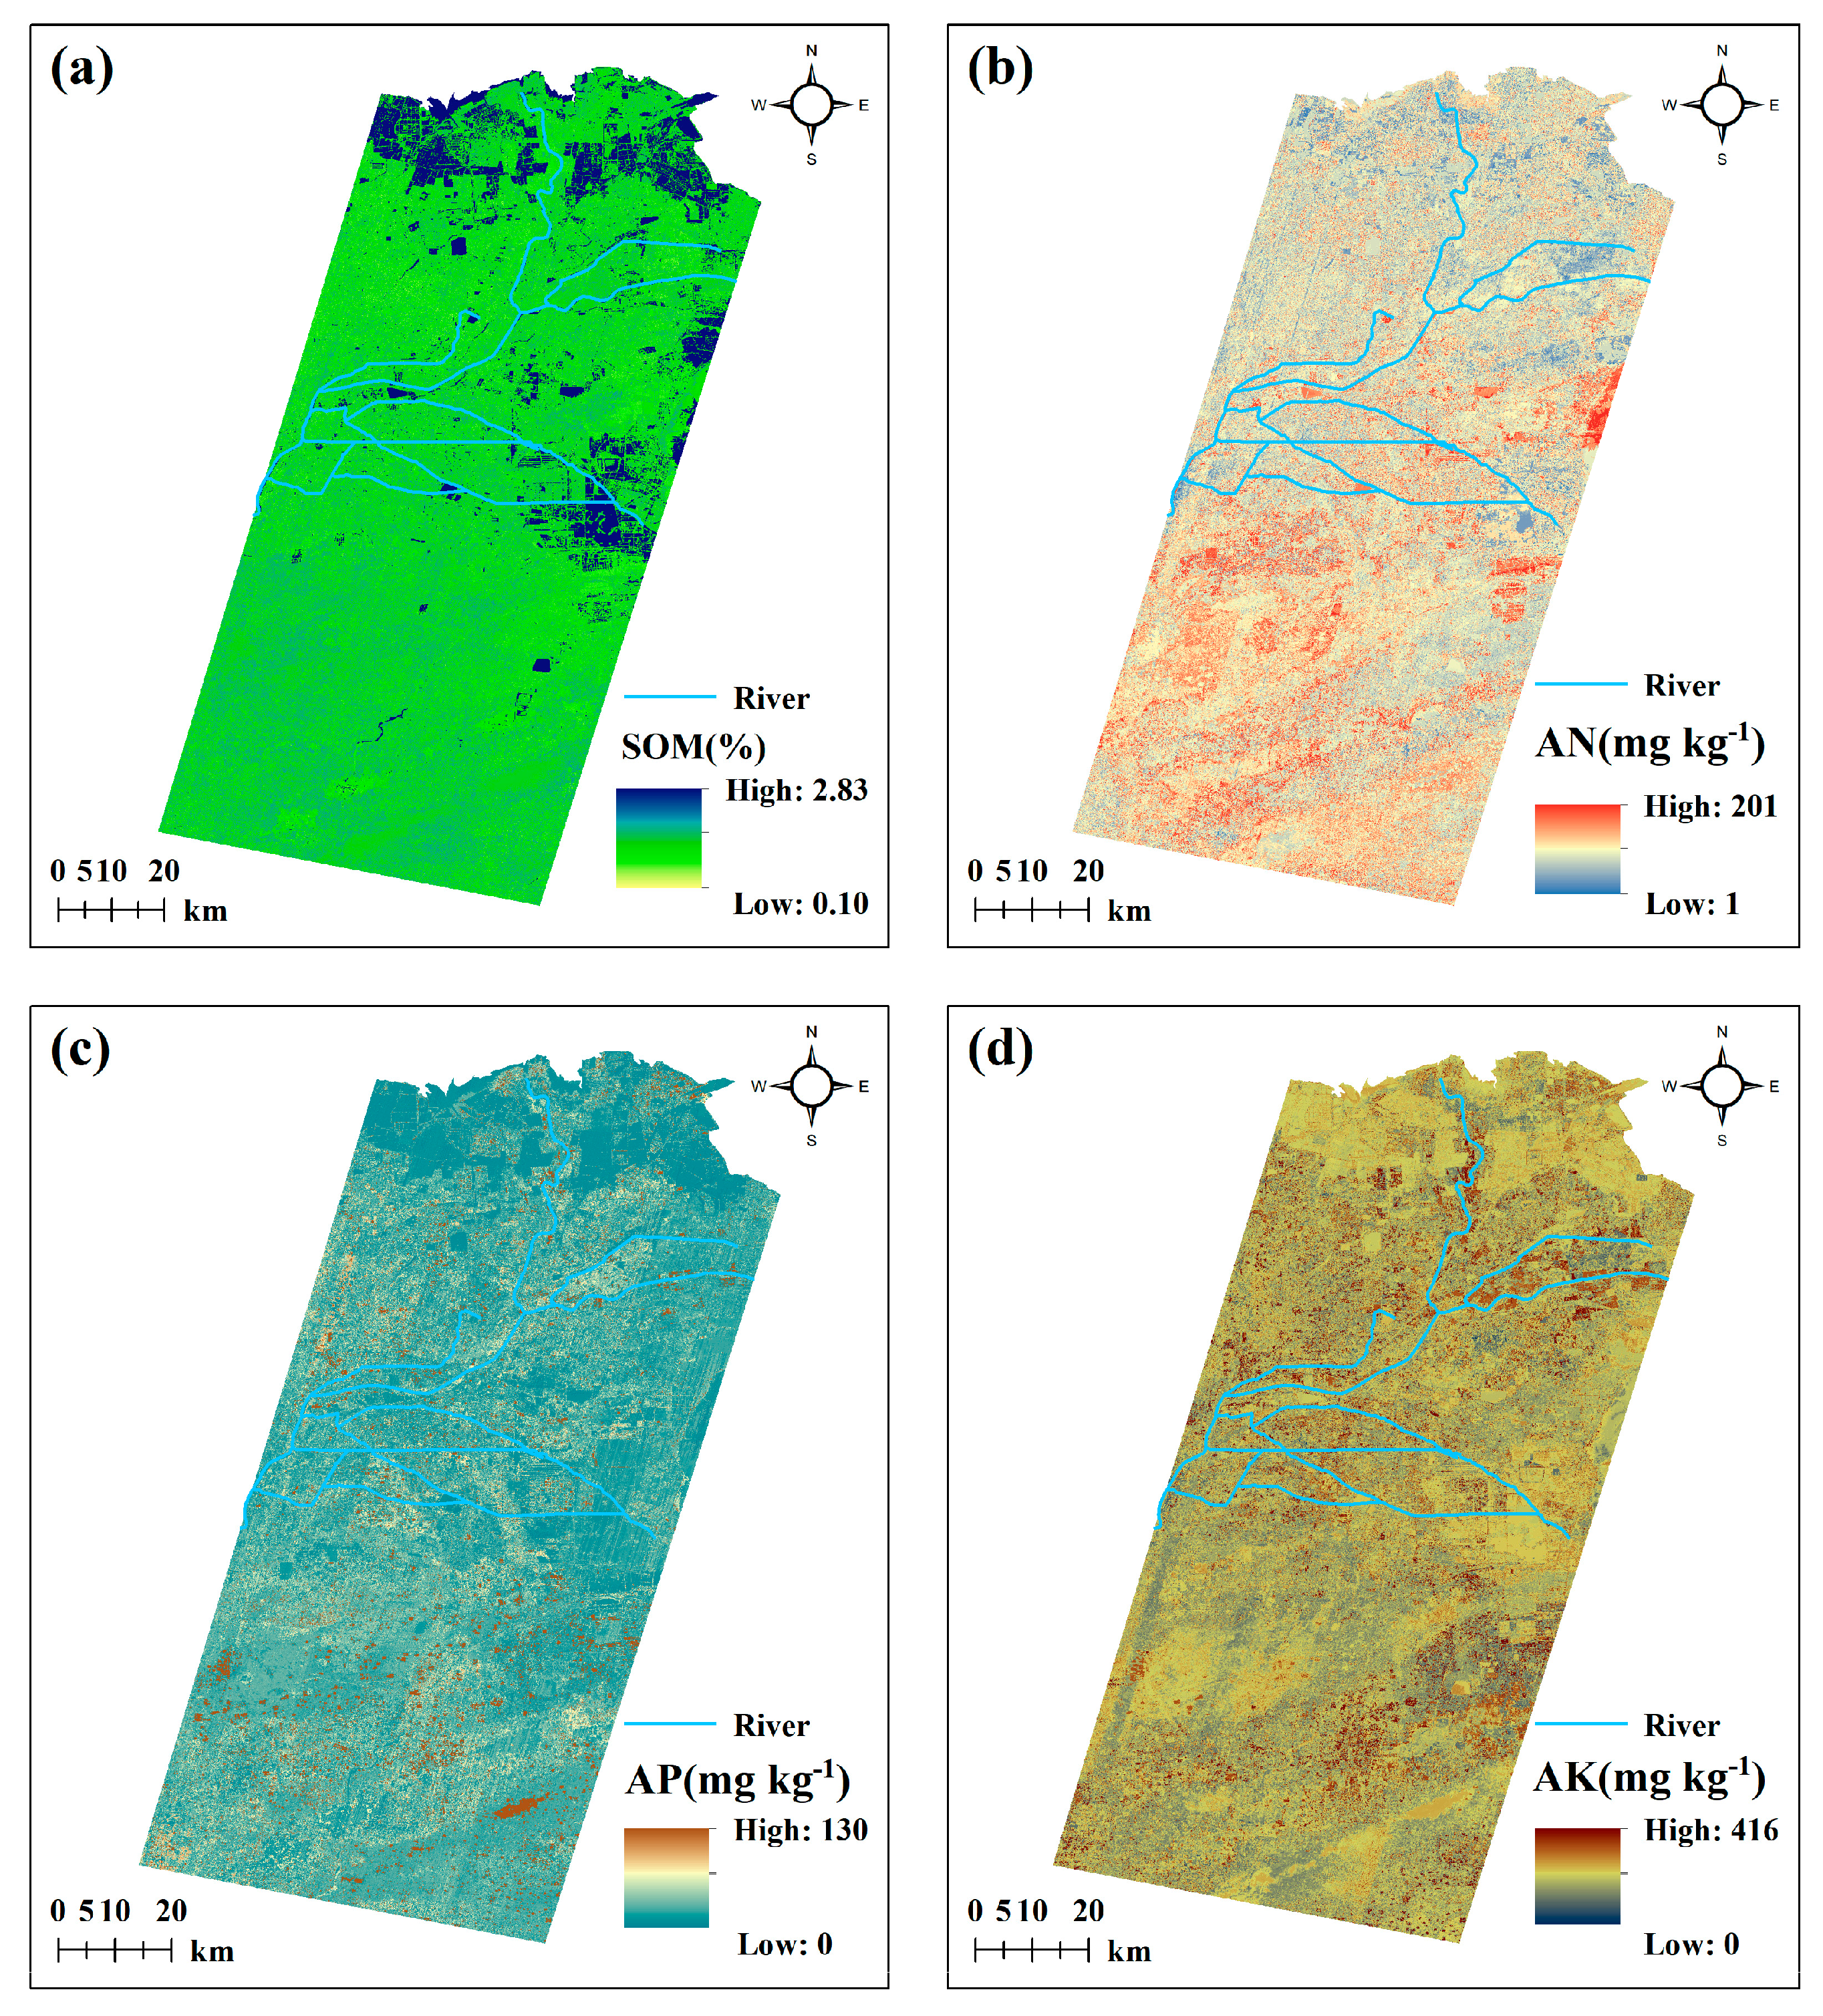
Figure 7 illustrates the spatial patterns of soil nitrogen, phosphorus, potassium, and organic matter in coastal saline–alkali soils predicted by the TPE-XGB model using spaceborne hyperspectral data. Overall, the predicted value ranges of the four soil nutrients are close to the actual value ranges, all exhibiting a reasonable trend of transition from high to low values, without abnormal phenomena such as abrupt data drops. Organic matter (Figure 7a) and potassium (Figure 7d) are notably concentrated along the Yellow River and its estuary, likely due to river transport or soil moisture effects, while other nutrients show little river-related pattern. The spatial distribution of nitrogen (Figure 7b) and organic matter in the eastern region is similar, both showing a general decreasing from east to west, which is consistent with the strong correlation between the two. In the southern part of the study area, nitrogen, phosphorus, and potassium are all distributed in a patchy pattern across the southern region.

3.5. Interpretation of Spectral Contributions Using SHAP Values

Figure 8 presents the spectral feature analysis of in situ hyperspectral data and spaceborne hyperspectral data for four types of soil nutrients. For all four soil nutrients, whether using satellite-based data (Figure 8(a-1)–(d-1)) or in situ data (Figure 8(a-2)–(d-2)), the main characteristic bands are concentrated in the visible and near-infrared regions. However, the most representative bands vary for each soil nutrient. For example, for AP, the bands are mainly concentrated in the near-infrared region of the spaceborne hyperspectral data (90.9%) and the visible region of the in situ hyperspectral data (83.33%). The characteristic bands 1493 nm (MSV = 4.3) and 398 nm (MSV = 1.8) contribute the most to the prediction accuracy of AN. In contrast, only a few elements are dominated by the shortwave infrared region, such as AN (58.33%) and SOM (50%) based on in situ hyperspectral data, with characteristic bands at 571 nm (MSV = 7.2) and 622 nm (MSV = 0.08), respectively, both contributing the most.
In the SHAP interpretation and band-wise positive/negative statistical analysis of the model (Figure 8(e-1)–(h-2)), whether using satellite data (Figure 8(e-1)–(h-1)) or in situ data (Figure 8(i-2)–(h-2)), most characteristic bands exhibited a negative driving effect on soil nutrients. The bands associated with AP, AK, and SOM were predominantly negatively correlated. In contrast, the element that showed a primarily positive correlation with characteristic bands was AN, with proportions of 72.73% and 63.6%, respectively. Specifically, AN demonstrated a notably strong positive correlation with the 413 nm band.

3.6. Analysis of Environmental Drivers of Soil Nutrient Spatial Differences

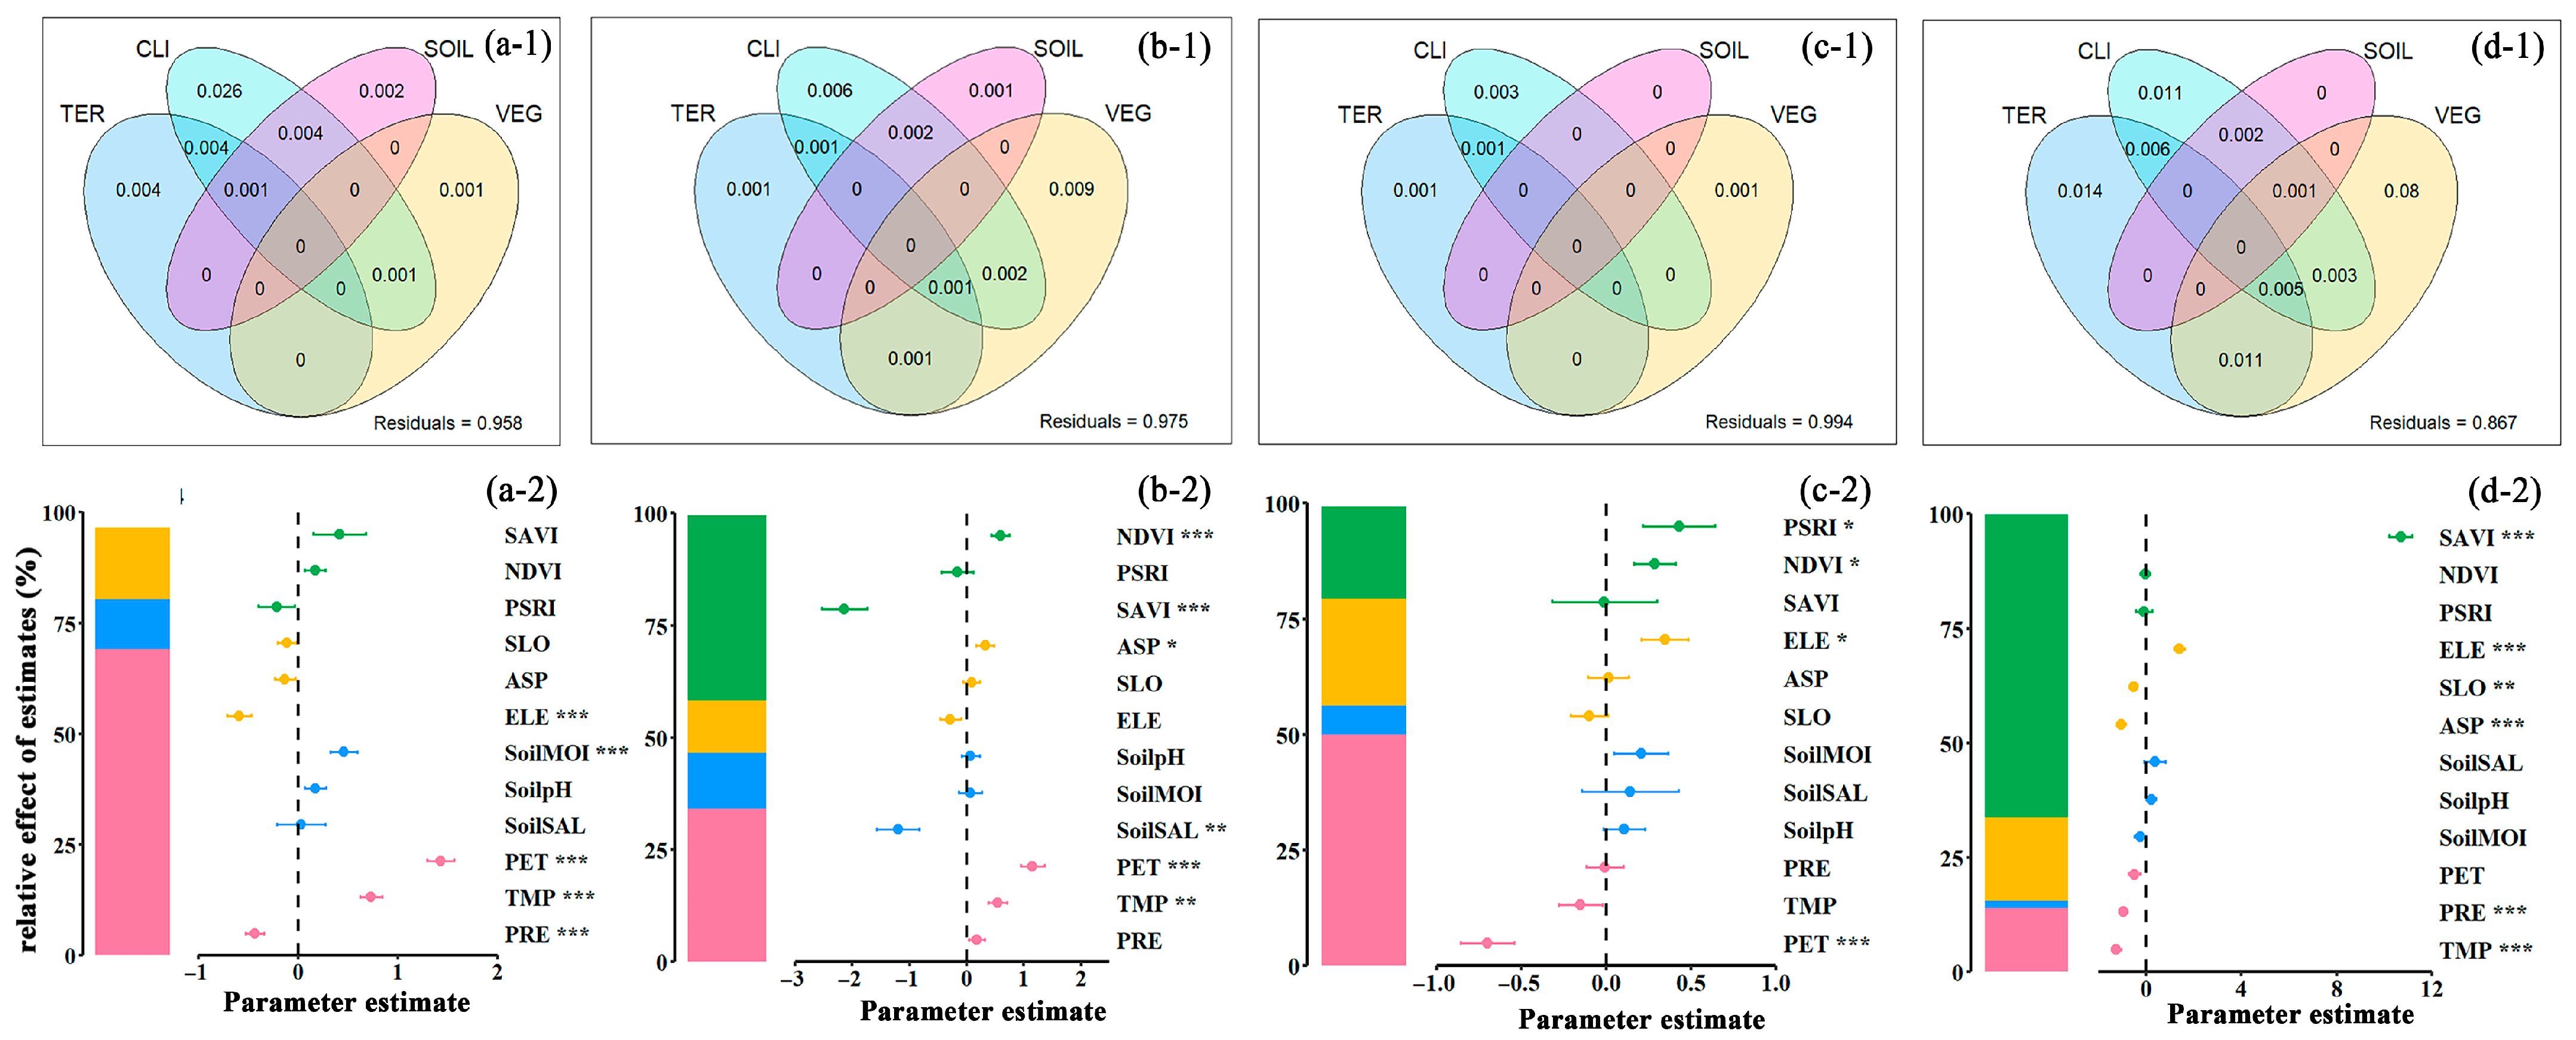
As shown in Figure 9((a-1)–(d-1)), the most significant independent explanatory factors for AN, AP, AK, and SOM are CLI, VEG, CLI, and VEG, respectively. In terms of joint explanatory contributions, AK and SOM show stronger interaction effects from CLI and TER, with values of 0.004 and 0.006, respectively. For AN and AP, the more significant contributing factor combinations are TER and CLI, CLI and SOIL, and SOIL and VEG, respectively. When the proportion of an individual environmental factor’s explanatory power is significantly greater than that of its joint explanatory power with other environmental factors, the contribution of individual factors can be considered higher. For instance, CLI alone accounts for an explanatory proportion of 0.026 for AN (Figure 9(a-1)), markedly surpassing its shared explanatory contributions with other environmental factor groups.
Thus, CLI should not be regarded as the primary contributor in this case. Conversely, when the variance explained individually by a factor is less than half of that achieved jointly with others—often due to collinearity—the independent contribution should not be overinterpreted. In the case of AP, SOIL independently explains only 0.001 of the variance, while its joint effect with CLI reaches 0.002 (Figure 9(b-1)), with minimal difference between the two. It can thus be inferred that CLI does not constitute the major contributing factor.
The strength of the influence of individual factors on soil nutrients was evaluated using the hierarchical partitioning method (Figure 9(a-2)–(d-2)). The proportions of variance explained by different environmental factors vary across the elements. Overall, CLI and VEG factors show the highest explanatory proportions for AN, AP, AK, and SOM, indicating that both play important roles in determining the spatial distribution of farmland soil nutrients. However, in the case of AN, the influence of VEG is negligible. In contrast, the TER and SOIL factors contribute less and are of minimal importance. Analyzing the correlations between the factors and soil nutrients, CLI shows a significant positive correlation with AN and AP, while it is correlated with AK and SOM. Additionally, the VEG and SOIL factors generally exhibit positive effects on all four nutrients. In contrast, the TER factor shows a negative correlation with AN, which differs from its positive effects on the other elements (AP, AK, SOM).

4. Discussion

4.1. The Driving Mechanism of Factor Synergy on Soil Nutrients

This study demonstrates that climate (CLI) and vegetation (VEG) jointly regulate the spatial variability of soil nutrients through microbial activity and crop root processes. Rising temperatures enhance microbial and enzymatic activity, altering stoichiometry and accelerating litter decomposition and nutrient release [49,50], consistent with higher AN and AP observed in favorable climates (Figure 7). The positive correlations of CLI with AN and AP and its negative correlations with AK and SOM further validate this mechanism [51], as also reflected in the higher independent explanatory power of CLI in Figure 9a–d.
Vegetation influences nutrient cycling by providing litter inputs that alter microbial abundance and soil properties such as pH [52,53]. This explains the significant correlations of SOM and AN with higher vegetation coverage in Figure 7. Litter decomposition and microbial turnover enhance soil organic matter and phosphorus mineralization [54,55], while root exudates promote microbial activity and soil aggregation, further improving fertility [52,56]. Vegetation also enhances AN through nitrogen-fixing litter inputs [52] and increases multiple nutrient concentrations via root activity and organic matter inputs [55,57]. Precipitation interacts with roots by inducing leaching and redistribution of nutrients [51,58]. In favorable climates, developed root systems reduce nutrient losses, improve soil structure, and promote nutrient accumulation, consistent with the patchy AP and AK distributions in southern areas (Figure 7) and the independent role of VEG for AP (Figure 9) [20].
The synergy between climate and topography also shapes nutrient redistribution. Precipitation and slope affect runoff and deposition [59], explaining SOM and AK enrichment along rivers (Figure 7). High altitudes accumulate nutrients due to lower temperatures and slower decomposition [60], while erosion and runoff redistribute soil and nutrients across slopes [61,62,63]. Nutrients concentrate in deltas due to sediment transport from the Loess Plateau [64,65], with flat terrain and reduced erosion promoting further deposition [66]. Microtopography also regulates runoff–soil contact, influencing nutrient dissolution [67]. Overall, vegetation and soil factors positively influence nutrient retention and transformation, while terrain negatively correlates with AN but supports accumulation of AP, AK, and SOM. These synergistic effects highlight the complex drivers of nutrient spatial heterogeneity and their implications for sustainable soil fertility management.

4.2. Limitations

Due to constraints such as time and cost, this study still has certain limitations and implications. Firstly, only topsoil (0–10 cm) nutrient data and organic matter data were collected, so this research is limited to the spatial prediction of topsoil. However, many soil properties, including soil nutrients, exhibit different variation patterns with increasing soil depth. Therefore, Future research should address the vertical dimension by predicting soil nutrients across multiple layers. For example, by collecting samples from surface to subsoil layers, measuring the ground in situ hyperspectral data of different layers, and establishing the response relationship between soil layers and soil properties content, the correlation between spaceborne hyperspectral data and surface in situ hyperspectral data can be explored to assess the applicability of spaceborne hyperspectral imagery in analyzing mid- to deep-layer soil P, N, SOM, and K.
Secondly, the study needs to increase the data volume and develop more accurate soil nutrient prediction methods. Although the current study demonstrates good performance with the XGB model, its effectiveness varies across different soil nutrient predictions. For example, the prediction accuracy for organic matter and phosphorus is high (coefficient of determination > 0.7), whereas the accuracy for nitrogen and potassium is relatively low (coefficient of determination: 0.4–0.5). This discrepancy may be due to limitations in data quantity and quality, which makes the prediction maps useful at a macro level but less applicable in micro-level studies that require high precision. Therefore, future research should aim to develop deep learning models optimized through hyperparameter optimization, as these models offer more complex network architectures and stronger learning capabilities compared to XGB and Gradient Boosting Decision Tree. However, deep learning requires large amounts of data for training, and insufficient data may lead to overfitting. Traditional soil sampling is limited in scale, which affects the prediction accuracy of deep learning models. Nevertheless, it is feasible to construct large-scale soil sample datasets through meta-analysis. Therefore, future research could therefore integrate such expansive datasets with advanced frameworks (i.e., deep learning) to evaluate the spatial prediction of soil nutrients and other properties.
Moreover, this study did not fully account for the noise interference in spaceborne hyperspectral data—its relatively low accuracy is often directly related to excessive noise. Noise can distort the true spectral characteristics of soil and background, reduce the precision of endmember extraction and abundance estimation, and ultimately constrain the accuracy of spectral inversion for soil nutrients such as nitrogen and potassium. This may lead to relatively lower prediction accuracy for certain soil properties. Existing studies have proposed various noise mitigation strategies, including separating signal and noise subspaces using Minimum Noise Fraction (MNF), reducing the weight of noisy pixels through Weighted Nonnegative Matrix Factorization (WNMF) or oblique projection, selecting low-noise and high-information samples Via active learning, and correcting noise-induced prediction errors using methods such as Adaptive Dilation Morphological Profiles (ADMP/ADSOMP), Mixed Similarity Graph Convolution Networks (MSGCN), or Self-Organizing Maps (SOM) combined with fuzzy membership. However, the present study did not integrate these approaches to optimize the utilization of spatial data. Future studies should embed such denoising approaches into modeling pipelines and correlate spaceborne data with in situ spectra across soil depths to improve noise robustness and support more accurate mid- and deep-layer nutrient predictions.

5. Conclusions

This study constructed an XGB model optimized by the tree-structured parzen estimator based on high-resolution in situ hyperspectral and spaceborne hyperspectral data to investigate the spatial variation characteristics and driving mechanism of typical soil nutrients in coastal saline–alkali areas. The results show that the influence of different spectral sources on model performance is reflected not only in prediction accuracy but also in the degree of information coupling between data quality and soil properties. Thanks to its spectral continuity and consistency with the environmental background, in situ hyperspectral enhances the model’s ability to capture nonlinear relationships, leading to significantly better fitting performance for micro-environment-sensitive indicators such as soil organic matter and available phosphorus compared to spaceborne data. Further analysis of spatial distribution patterns revealed that soil nutrients exhibit marked geographical heterogeneity, and Certain indicators, including soil organic matter and available potassium, tend to concentrate along rivers, suggesting that hydrological processes strongly influence localized nutrient accumulation. The spectral-sensitive bands identified by SHAP analysis indicate that different nutrient components exhibit heterogeneous spectral response characteristics. In particular, the positive response of available nitrogen contrasts with the generally negative correlation observed for other nutrients, suggesting that it may be primarily influenced by rhizosphere processes or microbial activity. The HP and VP results further validate the synergistic effects of climate (CLI) and vegetation (VEG) in regulating the spatial variation of soil nutrients: Climate (CLI) influences nutrient supply by modulating litter decomposition rate and water flux, while vegetation (VEG) governs the absorption and transformation of nutrients in the soil through root system secretions and aboveground biomass. These findings advance understanding of nonlinear hyperspectral feature responses and provide spatial information support for coastal saline–alkali land’s agricultural management and ecological restoration; future applications could expand to multi-source data integration, deep soil prediction, and dynamic monitoring for precise sustainable agricultural decisions.
Beyond these technical findings, this study also highlights the broader social relevance and practical advantages of focusing on coastal saline–alkali land as a key reserve of arable land. By leveraging hyperspectral data and the TPE-XGB model to precisely predict soil nutrient spatial variability and identify driving mechanisms, this work directly responds to the global demand for sustainable saline–alkali land development under the context of food security. It provides scientific support for addressing pressing challenges such as farmland reduction and soil degradation. Furthermore, it overcomes the time- and labor-intensive limitations of traditional soil nutrient determination methods and identifies key drivers like climate and vegetation, thereby offering spatial information and technical guidance for precision irrigation, fertilization, and ecological restoration. These contributions have direct value for advancing sustainable agricultural practices in coastal saline–alkali regions.

Author Contributions

Methodology, visualization, writing—original draft, validation, and writing—review and editing, M.X. and Q.R.; Software, investigation, resources, and writing—review and editing, X.Y., X.W., J.Z. and D.Z.; Conceptualization, data curation, formal analysis, project administration, and supervision, Y.S.; Funding acquisition, M.L. and Y.S. All authors have read and agreed to the published version of the manuscript.

Funding

This research was funded by the Shandong Provincial Natural Science Foundation (ZR2024MD056), the National Key Research and Development Program of China (2023YFD200140101), and the Scientific Innovation Project for Young Scientists in Shandong Provincial Universities (grant no.2022KJ224).

Data Availability Statement

Topographical data comes from the Geospatial Data Cloud platform situated within the Computer Network Information Center of the Chinese Academy of Sciences (http://www.gscloud.cn, accessed on 10 January 2020). Climate factors were obtained from the Climatic Research Unit (CRU) at the National Center for Atmospheric Research (NCAS) (http://www.cru.uea.ac.uk/data, accessed on 10 May 2023). Vegetation indices were derived from Sentinel-2 L2A remote sensing images acquired in September 2022 from the European Space Agency (https://www.copernicus.eu/en/access-data/conventional-data-access-hubs, accessed on 12 November 2022).

Conflicts of Interest

The authors declare no conflicts of interest.

References

  1. Ahmed, U.; Lin, J.C.; Srivastava, G.; Djenouri, Y. A nutrient recommendation system for soil fertilization based on evolutionary computation. Comput. Electron. Agric. 2021, 189, 106407. [Google Scholar] [CrossRef]
  2. Kim, M.; Gilley, J.E. Artificial neural network estimation of soil erosion and nutrient concentrations in runoff from land application areas. Comput. Electron. Agric. 2008, 64, 268–275. [Google Scholar] [CrossRef]
  3. Sirsat, M.S.; Cernadas, E.; Fernández-Delgado, M.; Barro, S. Automatic prediction of village-wise soil fertility for several nutrients in india using a wide range of regression methods. Comput. Electron. Agric. 2018, 154, 120–133. [Google Scholar] [CrossRef]
  4. Chen, L.; Zhou, G.X.; Feng, B.; Wang, C.; Luo, Y.; Li, F.; Shen, C.C.; Ma, D.H.; Zhang, C.Z.; Zhang, J.B. Saline-alkali land reclamation boosts topsoil carbon storage by preferentially accumulating plant-derived carbon. Sci. Bull. 2024, 69, 2948–2958. [Google Scholar] [CrossRef]
  5. Feng, W.T.; Jiang, J.; Lin, L.T.; Wang, Y.G. Soil calcium prompts organic carbon accumulation after decadal saline-water irrigation in the Taklamakan desert. J. Environ. Manag. 2023, 344, 118421. [Google Scholar] [CrossRef]
  6. Song, J.S.; Zhang, H.Y.; Chang, F.D.; Yu, R.; Zhang, X.Q.; Wang, X.Q.; Wang, W.N.; Liu, J.M.; Zhou, J.; Li, Y.Y. Humic acid plus manure increases the soil carbon pool by inhibiting salinity and alleviating the microbial resource limitation in saline soils. Catena 2023, 233, 107527. [Google Scholar] [CrossRef]
  7. Du, X.J.; Hu, H.; Wang, T.H.; Zou, L.; Zhou, W.F.; Gao, H.X.; Ren, X.Q.; Wang, J.; Hu, S.W. Long-term rice cultivation increases contributions of plant and microbial-derived carbon to soil organic carbon in saline-sodic soils. Sci. Total Environ. 2023, 904, 166713. [Google Scholar] [CrossRef] [PubMed]
  8. Wang, C.; Yao, X.F.; Li, X.X.; Wang, Q.; Wang, J.H.; Zhu, L.S.; Wang, J. Effects of dibutyl phthalate on microbial community and the carbon cycle in salinized soil. J. Clean. Prod. 2023, 404, 136928. [Google Scholar] [CrossRef]
  9. Zhang, L.; Su, X.Y.; Meng, H.; Men, Y.Q.; Liu, C.M.; Yan, X.Y.; Song, X.L.; Sun, X.Z.; Mao, L.L. Cotton stubble return and subsoiling alter soil microbial community, carbon and nitrogen in coastal saline cotton fields. Soil Till. Res. 2023, 226, 105585. [Google Scholar] [CrossRef]
  10. Setia, R.; Gottschalk, P.; Smith, P.; Marschner, P.; Baldock, J.; Setia, D.; Smith, J. Soil salinity decreases global soil organic carbon stocks. Sci. Total Environ. 2012, 465, 267–272. [Google Scholar] [CrossRef] [PubMed]
  11. Li, S.P.; Zhao, L.; Wang, C.; Huang, H.Y.; Zhuang, M.H. Synergistic improvement of carbon sequestration and crop yield by organic material addition in saline soil: A global meta-analysis. Sci. Total Environ. 2023, 891, 164530. [Google Scholar] [CrossRef] [PubMed]
  12. Sun, J.X.; Fan, Q.Y.; Ma, J.W.; Cui, L.Q.; Quan, G.X.; Yan, J.L.; Wu, L.M.; Hina, K.; Abdul, B.; Wang, H. Effects of biochar on cadmium (Cd) uptake in vegetables and its natural downward movement in saline-alkali soil. Environ. Pollut. Bioavail. 2020, 32, 36–46. [Google Scholar] [CrossRef]
  13. Duan, M.L.; Liu, G.H.; Zhou, B.B.; Chen, X.P.; Wang, Q.J.; Zhu, H.Y.; Li, Z.J. Effects of modified biochar on water and salt distribution and water-stable macro-aggregates in saline-alkaline soil. J. Soils Sediments 2021, 21, 2192–2202. [Google Scholar] [CrossRef]
  14. Liu, K.; Wang, Y.F.; Wang, X.D.; Sun, Z.P.; Song, Y.H.; Di, H.G.; Yan, Q.; Hua, D.X. Characteristic bands extraction method and prediction of soil nutrient contents based on an analytic hierarchy process. Measurement 2023, 220, 111695. [Google Scholar] [CrossRef]
  15. Qi, H.J.; Paz-Kagan, T.; Karnieli, A.; Jin, X.; Li, S.W. Evaluating calibration methods for predicting soil available nutrients using hyperspectral VNIR data. Soil Tillage Res. 2018, 175, 267–275. [Google Scholar] [CrossRef]
  16. Lelago, A.; Bibiso, M. Performance of mid infrared spectroscopy to predict nutrients for agricultural soils in selected areas of ethiopia. Heliyon 2022, 8, e11564. [Google Scholar] [CrossRef]
  17. Shao, W.Y.; Wang, Q.Z.; Guan, Q.Y.; Luo, H.P.; Ma, Y.R.; Zhang, J. Distribution of soil available nutrients and their response to environmental factors based on path analysis model in arid and semi-arid area of northwest china. Sci. Total Environ. 2022, 827, 154346. [Google Scholar] [CrossRef]
  18. Zuo, W.A.; Xu, L.; Qiu, M.H.; Yi, S.Q.; Wang, Y.M.; Shen, C.; Zhao, Y.L.; Li, Y.L.; Gu, C.H.; Shan, Y.H.; et al. Effects of different exogenous organic materials on improving soil fertility in coastal saline-alkali soil. Agriculture 2023, 13, 61. [Google Scholar] [CrossRef]
  19. žížala, D.; Minařík, R.; Zádorová, T. Soil organic carbon mapping using multispectral remote sensing data: Prediction ability of data with different spatial and spectral resolutions. Remote Sens. 2019, 11, 2947. [Google Scholar] [CrossRef]
  20. Li, W.; Liu, Y.; Zheng, H.; Wu, J.; Yuan, H.; Wang, X.; Xie, W.; Qin, Y.; Zhu, H.; Nie, X.; et al. Complex vegetation patterns improve soil nutrients and maintain stoichiometric balance of terrace wall aggregates over long periods of vegetation recovery. Catena 2023, 227, 107141. [Google Scholar] [CrossRef]
  21. Liu, K.; Liu, Z.C.; Zhou, N.; Shi, X.R.; Lock, T.R.; Kallenbach, R.L.; Yuan, Z.Y. Predicted increased p relative to n growth limitation of dry grasslands under soil acidification and alkalinization is ameliorated by increased precipitation. Soil Biol. Biochem. 2022, 173, 108793. [Google Scholar] [CrossRef]
  22. Oberholzer, S.; Summerauer, L.; Steffens, M.; Speranza, C.I. Best performances of visible-near-infrared models in soils with little carbonate—A field study in switzerland. Soil 2024, 10, 231–249. [Google Scholar] [CrossRef]
  23. Pelegrino, M.H.P.; Silva, S.H.G.; de Faria, Á.J.G.; Mancini, M.; Teixeira, A.F.D.S.; Chakraborty, S.; Weindorf, D.C.; Guilherme, L.R.G.; Curi, N. Prediction of soil nutrient content via pxrf spectrometry and its spatial variation in a highly variable tropical area. Precis. Agric. 2022, 23, 18–34. [Google Scholar] [CrossRef]
  24. Jiao, X.C.; Liu, H.; Wang, W.M.; Zhu, J.J.; Wang, H. Estimation of surface soil nutrient content in mountainous citrus orchards based on hyperspectral data. Agriculture 2024, 14, 873. [Google Scholar] [CrossRef]
  25. Liu, K.; Wang, Y.F.; Peng, Z.Q.; Xu, X.X.; Liu, J.J.; Song, Y.H.; Di, H.G.; Hua, D.X. Monitoring soil nutrients using machine learning based on uav hyperspectral remote sensing. Int. J. Remote Sens. 2024, 45, 4897–4921. [Google Scholar]
  26. Ratke, R.F.; Viana, P.R.N.; Teodoro, L.P.R.; Baio, F.H.R.; Teodoro, P.E.; Santana, D.C.; Santos, C.E.D.S.; Zuffo, A.M.; Aguilera, J.G. Multispectral sensors and machine learning as modern tools for nutrient content prediction in soil. AgriEngineering 2024, 6, 4384–4394. [Google Scholar] [CrossRef]
  27. Li, Y.S.; Chang, C.Y.; Wang, Z.R.; Li, T.; Li, J.W.; Zhao, G.X. Identification of cultivated land quality grade using fused multi-source data and multi-temporal crop remote sensing information. Remote Sens. 2022, 14, 5647. [Google Scholar]
  28. Vašát, R.; Kodešová, R.; Borůvka, L.; Klement, A.; Jakšík, O.; Gholizadeh, A. Consideration of peak parameters derived from continuum-removed spectra to predict extractable nutrients in soils with visible and near-infrared diffuse reflectance spectroscopy (VNIR-DRS). Geoderma 2014, 232–234, 208–218. [Google Scholar] [CrossRef]
  29. Ramírez, P.B.; Calderón, F.J.; Jastrow, J.D.; Ping, C.; Matamala, R. Applying nir and mir spectroscopy for c and soil property prediction in northern cold-region ecosystems. Which approach works better? Geoderma Reg. 2023, 32, e00617. [Google Scholar] [CrossRef]
  30. Yang, J.X.; Yuan, X.Z.; Han, B.; Zhao, L.B.; Sun, J.L.; Shang, M.Y.; Wang, X.C.; Ding, C.B. Phase imbalance analysis of gf-3 along-track insar data and ocean current measurements. Remote Sens. 2021, 13, 269. [Google Scholar] [CrossRef]
  31. Hu, J.; Peng, J.; Zhou, Y.; Xu, D.; Zhao, R.; Jiang, Q.; Fu, T.; Wang, F.; Shi, Z. Quantitative estimation of soil salinity using UAV-borne hyperspectral and satellite multispectral images. Remote Sens. 2019, 11, 736. [Google Scholar] [CrossRef]
  32. Metternicht, G.I.; Zinck, J.A. Remote sensing of soil salinity: Potentials and constraints. Remote Sens. Environ. 2003, 85, 1–20. [Google Scholar] [CrossRef]
  33. Dai, X.; Feng, H.; Xiao, L.; Zhou, J.; Wang, Z.; Zhang, J.; Yao, Y. Ecological vulnerability assessment of a China’s representative mining city based on hyperspectral remote sensing. Ecol. Indic. 2022, 145, 109663. [Google Scholar] [CrossRef]
  34. Feng, L.; Zhao, Z.; Yang, H.; Chen, Q.; Yang, C.; Zhao, X.; Zhang, G.; Zhang, X.; Dong, X. Clay-Hosted Lithium Exploration in the Wenshan Region of Southeastern Yunnan Province, China, Using Multi-Source Remote Sensing and Structural Interpretation. Minerals 2025, 15, 826. [Google Scholar] [CrossRef]
  35. Ge, X.Y.; Ding, J.L.; Teng, D.X.; Xie, B.Q.; Zhang, X.L.; Wang, J.J.; Han, L.J.; Bao, Q.L.; Wang, J.Z. Exploring the capability of gaofen-5 hyperspectral data for assessing soil salinity risks. Int. J. Appl. Earth Obs. Geoinf. 2022, 112, 102928. [Google Scholar] [CrossRef]
  36. Goetz, A.F.; Vane, G.; Solomon, J.E.; Rock, B.N. Imaging spectrometry for earth remote sensing. Science 1985, 228, 1147–1153. [Google Scholar] [CrossRef] [PubMed]
  37. Stuke, A.; Rinke, P.; Todorovic, M. Efficient hyperparameter tuning for kernel ridge regression with bayesian optimization. Mach. Learn. Sci. Technol. 2021, 2, 045024. [Google Scholar] [CrossRef]
  38. Ghawi, R.; Pfeffer, J. Efficient hyperparameter tuning with grid search for text categorization using kNN approach with BM25 similarity. Int. J. Inf. Retr. Res. 2019, 9, 160–180. [Google Scholar] [CrossRef]
  39. Scott, M.; Lee, S. A unified approach to interpreting model predictions. Adv. Neural Inf. Process. Syst. 2017, 30, 4765–4774. [Google Scholar]
  40. Snoek, J.; Larochelle, H.; Adams, R.P. Practical bayesian optimization of machine learning algorithms. Adv. Neural Inf. Process. Syst. 2012, 25, 2951–2959. [Google Scholar]
  41. Chen, B.L.; Zheng, H.W.; Luo, G.P.; Chen, C.B.; Bao, A.M.; Liu, T.; Chen, X. Adaptive estimation of multi-regional soil salinization using extreme gradient boosting with bayesian tpe optimization. Int. J. Remote Sens. 2022, 43, 778–811. [Google Scholar] [CrossRef]
  42. Kim, D.; Kwon, K.; Pham, K.; Oh, J.; Choi, H. Surface settlement prediction for urban tunneling using machine learning algorithms with bayesian optimization. Autom. Constr. 2022, 140, 104331. [Google Scholar] [CrossRef]
  43. Salamai, A.A. Deep learning framework for predictive modeling of crude oil price for sustainable management in oil markets. Expert Syst. Appl. 2023, 211, 118687. [Google Scholar] [CrossRef]
  44. Yu, J.; Zheng, W.; Xu, L.; Meng, F.; Li, J.; Zhangzhong, L. Tpe-catboost: An adaptive model for soil moisture spatial estimation in the main maize-producing areas of china with multiple environment covariates. J. Hydrol. 2022, 613, 128465. [Google Scholar] [CrossRef]
  45. Ozaki, Y.; Tanigaki, Y.; Watanabe, S.; Onishi, M. Multiobjective tree-structured parzen estimator for computationally expensive optimization problems. IEEE Trans. Evol. Comput. 2020, 25, 522–535. [Google Scholar]
  46. Ha, N.T.; Manley-Harris, M.; Pham, T.D.; Hawes, I. The use of radar and optical satellite imagery combined with advanced machine learning and metaheuristic optimization techniques to detect and quantify above ground biomass of intertidal seagrass in a new zealand estuary. Int. J. Remote Sens. 2021, 42, 4712–4738. [Google Scholar] [CrossRef]
  47. Liu, X.; Liu, T.; Feng, P. Long-term performance prediction framework based on xgboost decision tree for pultruded frp composites exposed to water, humidity and alkaline solution. Compos. Struct. 2022, 284, 115184. [Google Scholar] [CrossRef]
  48. Lai, J.; Zou, Y.; Zhang, J.; Peres Neto, P.R. Generalizing hierarchical and variation partitioning in multiple regression and canonical analyses using the rdacca. Hp R package. Methods Ecol. Evol. 2022, 13, 782–788. [Google Scholar] [CrossRef]
  49. Li, H.; Tian, H.; Wang, Z.; Liu, C.; Nurzhan, A.; Megharaj, M.; He, W. Potential effect of warming on soil microbial nutrient limitations as determined by enzymatic stoichiometry in the farmland from different climate zones. Sci. Total Environ. 2022, 802, 149657. [Google Scholar] [CrossRef]
  50. Lu, Z.; Wang, P.; Ou, H.; Wei, S.; Wu, L.; Jiang, Y.; Wang, R.; Liu, X.; Wang, Z.; Chen, L. Effects of different vegetation restoration on soil nutrients, enzyme activities, and microbial communities in degraded karst landscapes in southwest china. For. Ecol. Manag. 2022, 508, 120002. [Google Scholar] [CrossRef]
  51. Yang, X.; Shao, M.; Li, T.; Zhang, Q.; Gan, M.; Chen, M.; Bai, X. Distribution of soil nutrients under typical artificial vegetation in the desert–loess transition zone. Catena 2021, 200, 105165. [Google Scholar] [CrossRef]
  52. Cui, Y.; Fang, L.; Guo, X.; Han, F.; Ju, W.; Ye, L.; Wang, X.; Tan, W.; Zhang, X. Natural grassland as the optimal pattern of vegetation restoration in arid and semi-arid regions: Evidence from nutrient limitation of soil microbes. Sci. Total Environ. 2019, 648, 388–397. [Google Scholar] [CrossRef]
  53. Zhang, M.; O’Connor, P.J.; Zhang, J.; Ye, X. Linking soil nutrient cycling and microbial community with vegetation cover in riparian zone. Geoderma 2021, 384, 114801. [Google Scholar] [CrossRef]
  54. Yuan, C.; Wu, F.; Wu, Q.; Fornara, D.A.; Heděnec, P.; Peng, Y.; Zhu, G.; Zhao, Z.; Yue, K. Vegetation restoration effects on soil carbon and nutrient concentrations and enzymatic activities in post-mining lands are mediated by mine type, climate, and former soil properties. Sci. Total Environ. 2023, 879, 163059. [Google Scholar] [CrossRef]
  55. Lin, Y.; Deng, H.; Du, K.; Rafay, L.; Zhang, G.; Li, J.; Chen, C.; Wu, C.; Lin, H.; Yu, W. Combined effects of climate, restoration measures and slope position in change in soil chemical properties and nutrient loss across lands affected by the wenchuan earthquake in china. Sci. Total Environ. 2017, 596, 274–283. [Google Scholar] [CrossRef] [PubMed]
  56. Zhao, W.; Jing, C. Response of the natural grassland vegetation change to meteorological drought in xinjiang from 1982 to 2015. Front. Environ. Sci. 2022, 10, 1047818. [Google Scholar] [CrossRef]
  57. Qinfei, B.; Yuhai, B.; Yantong, Y.; Jie, Y.; Yanqi, W.; Jie, W. Effects of different vegetation restoration models on soil nutrients in the water level fluctuation zone of a large reservoir. Ecol. Indic. 2024, 169, 112955. [Google Scholar] [CrossRef]
  58. Ni, Y.; Jian, Z.; Zeng, L.; Liu, J.; Lei, L.; Zhu, J.; Xu, J.; Xiao, W. Climate, soil nutrients, and stand characteristics jointly determine large-scale patterns of biomass growth rates and allocation in pinus massoniana plantations. For. Ecol. Manage. 2022, 504, 119839. [Google Scholar] [CrossRef]
  59. Dai, L.; Ge, J.; Wang, L.; Zhang, Q.; Liang, T.; Bolan, N.; Lischeid, G.; Rinklebe, J. Influence of soil properties, topography, and land cover on soil organic carbon and total nitrogen concentration: A case study in qinghai-tibet plateau based on random forest regression and structural equation modeling. Sci. Total Environ. 2022, 821, 153440. [Google Scholar] [CrossRef]
  60. Bi, M.; Zhang, S.; Xu, Q.; Hou, S.; Han, M.; Yu, X. Coupling and synergistic relationships between soil aggregate stability and nutrient stoichiometric characteristics under different microtopographies on karst rocky desertification slopes. Catena 2024, 243, 108142. [Google Scholar] [CrossRef]
  61. Balasundram, S.K.; Robert, P.C.; Mulla, D.J.; Allan, D.L. Relationship between oil palm yield and soil fertility as affected by topography in an indonesian plantation. Commun. Soil Sci. Plant Anal. 2006, 37, 1321–1337. [Google Scholar] [CrossRef]
  62. Noorbakhsh, S.; Schoenau, J.; Si, B.; Zeleke, T.; Qian, P. Soil properties, yield, and landscape relationships in south-central saskatchewan canada. J. Plant Nutr. 2008, 31, 539–556. [Google Scholar] [CrossRef]
  63. Zhang, X.; Liu, M.; Zhao, X.; Li, Y.; Zhao, W.; Li, A.; Chen, S.; Chen, S.; Han, X.; Huang, J. Topography and grazing effects on storage of soil organic carbon and nitrogen in the northern china grasslands. Ecol. Indic. 2018, 93, 45–53. [Google Scholar] [CrossRef]
  64. Huang, M.; Zhang, L. Hydrological responses to conservation practices in a catchment of the loess plateau, china. Hydrol. Process. 2004, 18, 1885–1898. [Google Scholar] [CrossRef]
  65. Li, Z.; Liu, C.; Dong, Y.; Chang, X.; Nie, X.; Liu, L.; Xiao, H.; Lu, Y.; Zeng, G. Response of soil organic carbon and nitrogen stocks to soil erosion and land use types in the loess hilly–gully region of china. Soil Till. Res. 2017, 166, 1–9. [Google Scholar] [CrossRef]
  66. Chen, G.; Zhang, Q.; Wang, H.; Geng, R.; Wang, J.; Yi, Y.; Li, M.; He, D. Optical and molecular techniques are complementary to understand the characteristics of dissolved organic matter in the runoff from sloping croplands with various micro-topographies during rainfall. J. Hydrol. 2025, 648, 132403. [Google Scholar] [CrossRef]
  67. Fu, B.J.; Meng, Q.H.; Qiu, Y.; Zhao, W.W.; Zhang, Q.J.; Davidson, D.A. Effects of land use on soil erosion and nitrogen loss in the hilly area of the loess plateau, china. Land Degrad. Dev. 2004, 15, 87–96. [Google Scholar] [CrossRef]
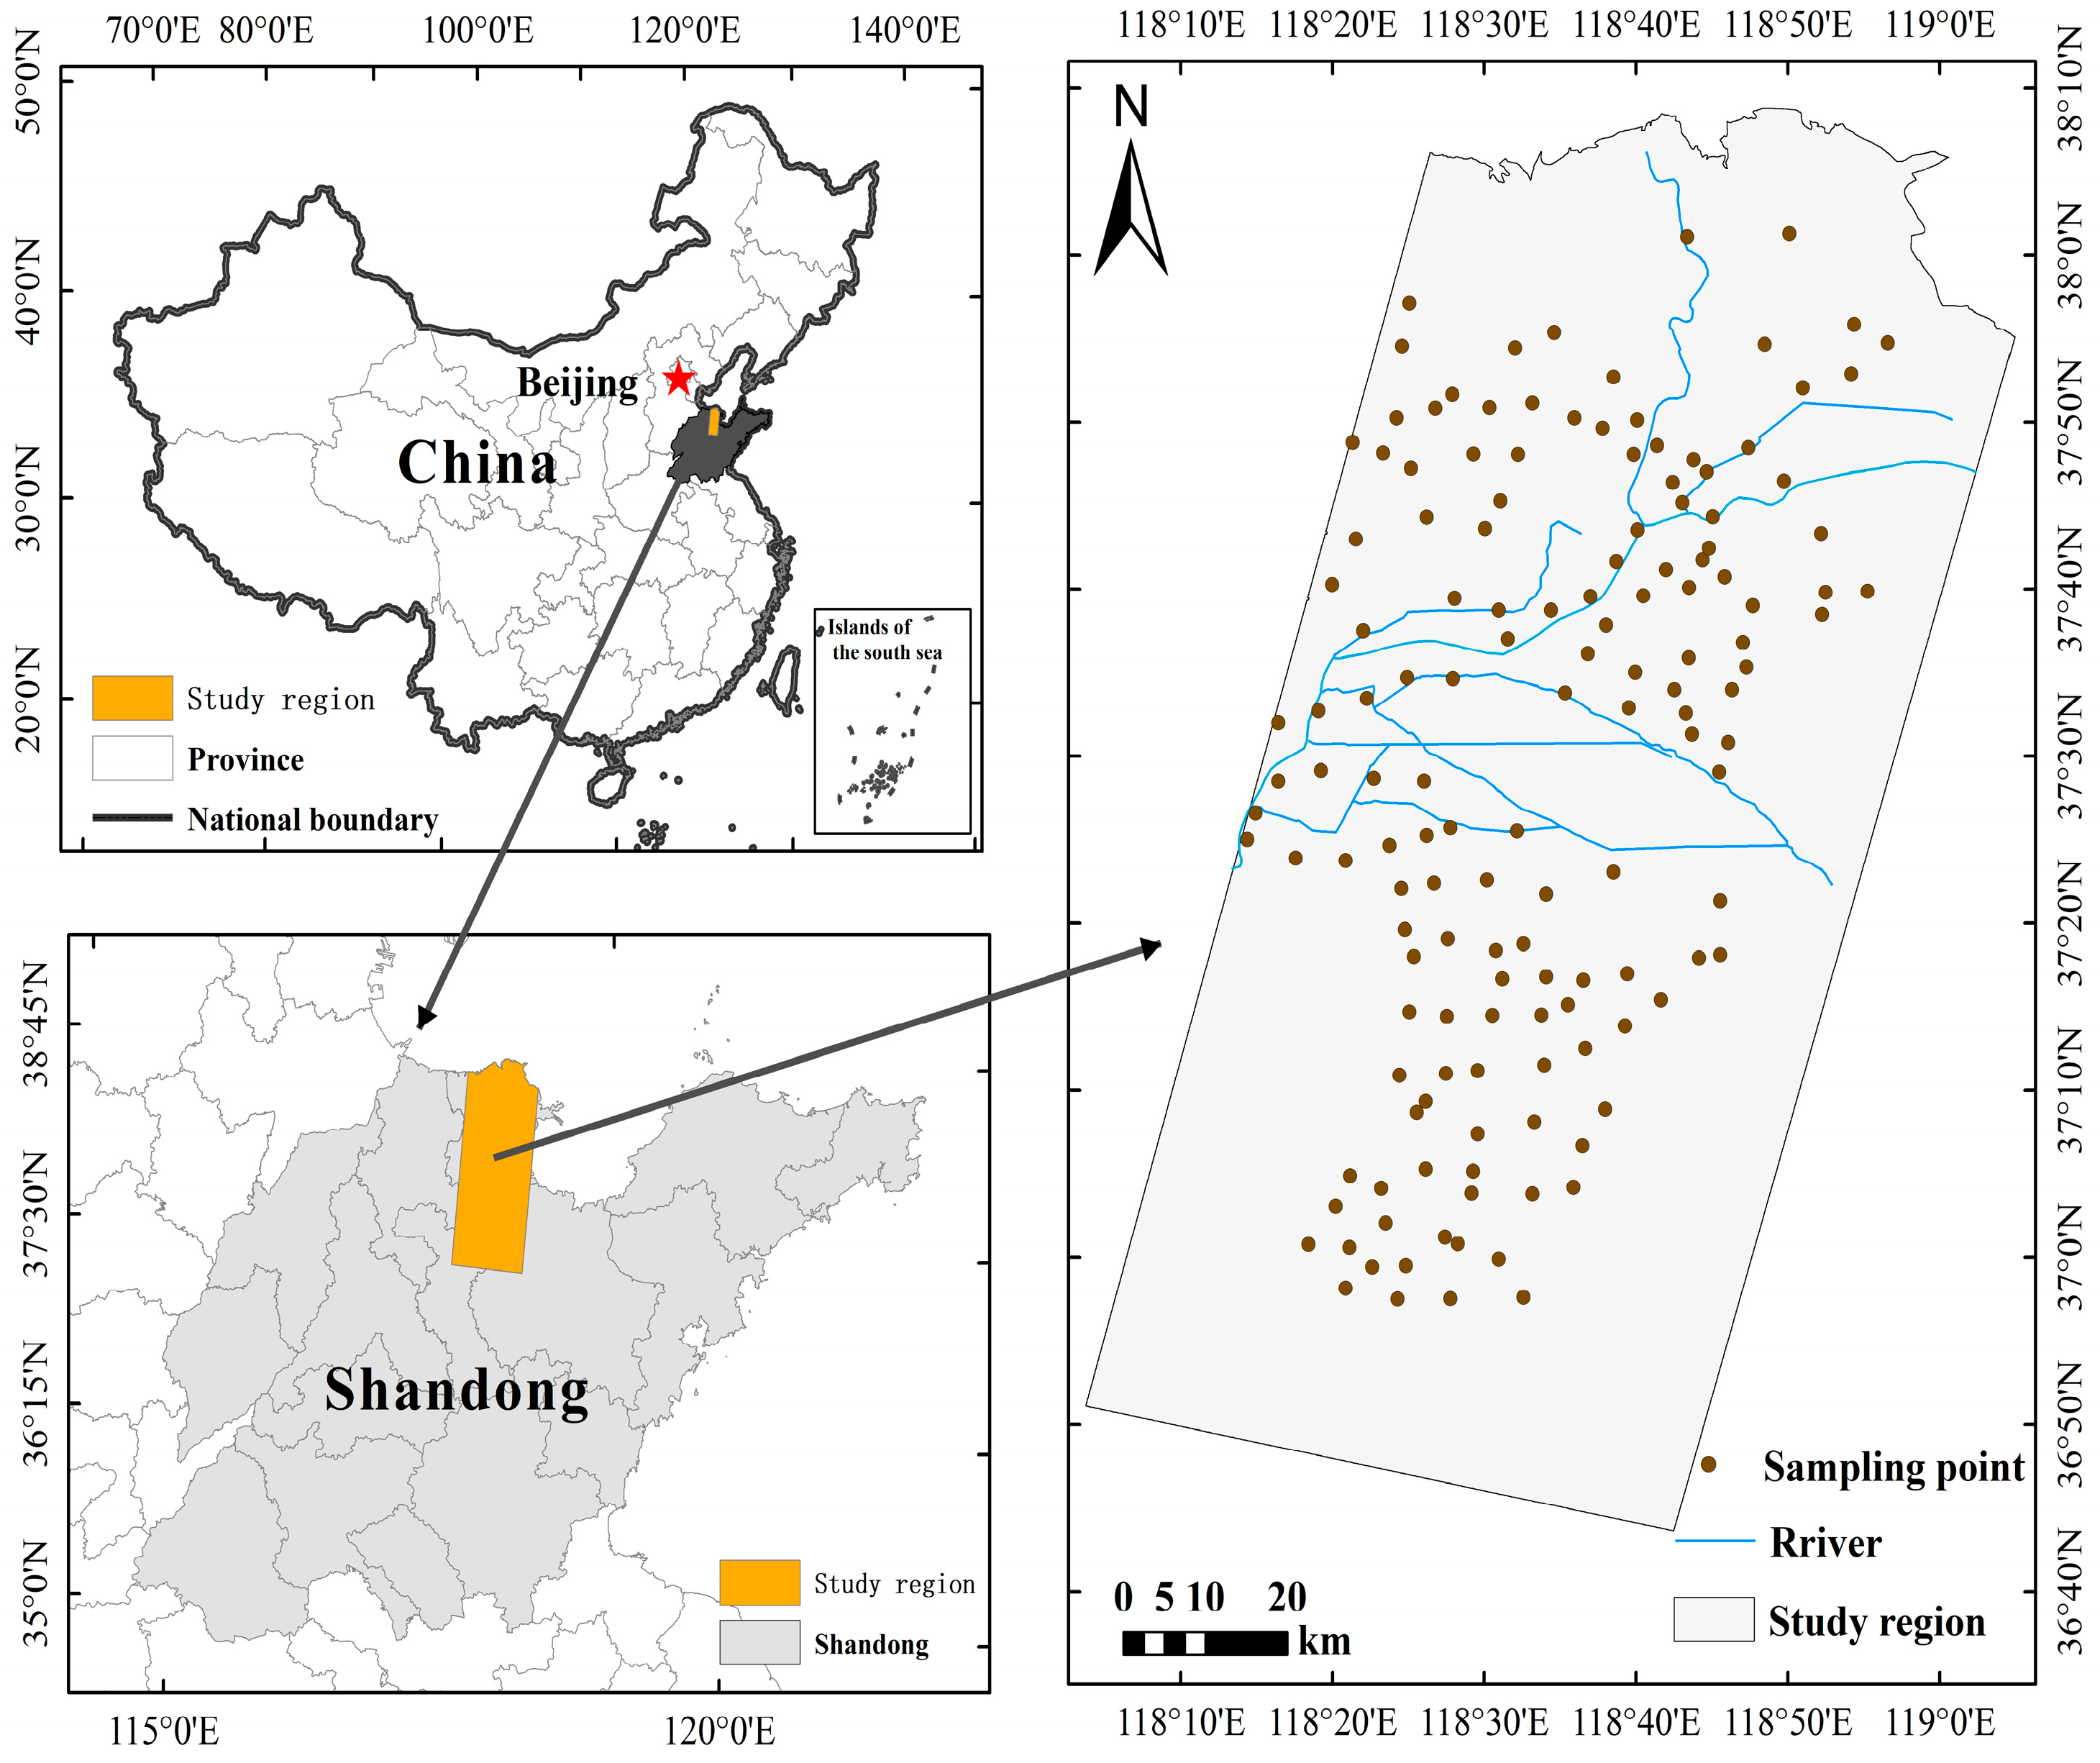
Figure 1. Overview of the study area and sampling sites in the Yellow River Delta.
Ijgi 14 00403 g001
Figure 2. In situ and satellite-borne hyperspectral reflectance curves: (a) Reflectance curve of in situ hyperspectral (ISH) data; (b) Reflectance curve of satellite-borne hyperspectral (SBH) data.
Ijgi 14 00403 g002
Figure 3. Key bands for soil nutrients derived from different hyperspectral data.
Ijgi 14 00403 g003
Figure 4. Workflow of the TPE optimization algorithm.
Ijgi 14 00403 g004
Figure 5. Statistical analysis of (a) the numerical distribution and (b) the coefficient of variation and correlation matrix for SOM, AN, AP, and AK.
Ijgi 14 00403 g005
Figure 6. Scatter plots of predicted versus observed values for soil nutrients using the TPE-XGB model for (a-1,a-2) SOM, (b-1,b-2) AN, (c-1,c-2) AP, and (d-1,d-2) AK, where the dark pink shaded area represents the 95% confidence band, and the light pink shaded area represents the 95% prediction band. 1 and 2 represent in situ hyperspectral data and spaceborne hyperspectral data, respectively.
Ijgi 14 00403 g006
Figure 7. Spatial distribution of (a) SOM, (b) AN, (c) AP, and (d) AK in the study area.
Ijgi 14 00403 g007
Figure 8. SHAP-based interpretation of spectral contributions for (a-1,a-2,e-1,e-2) AN, (b-1,b-2,f-1,f-2) AP, (c-1,c-2,g-1,g-2) AK, and (d-1,d-2,h-1,h-2) SOM using the TPE-XGB model. 1 and 2 represent spaceborne hyperspectral data and in situ hyperspectral data, respectively.
Ijgi 14 00403 g008
Figure 9. Results of variance decomposition and hierarchical partitioning for (a-1,a-2) AN, (b-1,b-2) AP, (c-1,c-2) AK, and (d-1,d-2) SOM. 1 and 2 represent multi-factor synergy and single-factor driving effect, respectively. *, ** and *** represent the significant level from low to high, respectively.
Ijgi 14 00403 g009
Table 1. Environmental driving factors and data acquisition methods.
CategoryDriving FactorAcquisition Method
SoilSoilMOI, SoilpH, SoilSALDrying method, electrode method, mass method
TopographyELE, SLO, ASPArcGIS—Surface Analysis
ClimateTMP, PRE, PETArcGIS—Kriging Interpolation
VegetationSAVIred, PSRI, NDVIENVI—Band Math
Table 2. Hyperparameter settings for the XGB model.
HyperparameterTypeOptimization Range
min_child_weightfloat[0.1, 5]
lambdafloat[1, 100]
num_boost_roundint[10, 200]
etafloat[0.1, 5]
subsamplefloat[0.1, 5]
max_depthint[1, 15]
colsample_bytreefloat[0.6, 1]
colsample_bynodefloat[0.6, 1]
Table 3. Performance evaluation of the TPE-XGB model for soil nutrient prediction.
Soil NutrientsFeatureR2I(R2)RMSEI(RMSE)
SOMISH0.6544%0.21%−40%
SBH0.450.35%
ANISH0.5637%23.42 (mg kg−1)−40%
SBH0.4139.23 (mg kg−1)
APISH0.7015%9.84 (mg kg−1)−23%
SBH0.6112.73 (mg kg−1)
AKISH0.5121%59.82 (mg kg−1)17%
SBH0.4250.94 (mg kg−1)
Disclaimer/Publisher’s Note: The statements, opinions and data contained in all publications are solely those of the individual author(s) and contributor(s) and not of MDPI and/or the editor(s). MDPI and/or the editor(s) disclaim responsibility for any injury to people or property resulting from any ideas, methods, instructions or products referred to in the content.