Article

Enhancing Land Use Efficiency Assessment Through Built-Up Area–Built-Up Volume Trajectories: Integrating Vertical Urban Growth into SDG 11.3.1 Monitoring

by
Jojene Santillan
1,2,*,
Mareike Dorozynski
1 and
Christian Heipke
1
1
Institute of Photogrammetry and GeoInformation, Leibniz University Hannover, Nienburger Str. 1, 30167 Hannover, Germany
2
Caraga Center for Geo-Informatics, Department of Geodetic Engineering, College of Engineering and Geosciences, Caraga State University, Butuan City 8600, Philippines
*
Author to whom correspondence should be addressed.
ISPRS Int. J. Geo-Inf. 2025, 14(10), 404; https://doi.org/10.3390/ijgi14100404
Submission received: 16 July 2025 / Revised: 19 September 2025 / Accepted: 26 September 2025 / Published: 15 October 2025

Abstract

SDG Indicator 11.3.1 assesses urban land use efficiency (LUE) through the ratio of the land consumption rate (LCR) to the population growth rate (PGR), or LCRPGR. However, its methodology is restricted to two-dimensional built-up area expansion, excluding vertical development and limiting insight into the structural mechanisms underlying efficiency outcomes. This study aims to integrate vertical urban growth into SDG 11.3.1 monitoring to improve the interpretation of efficiency outcomes. We introduce the Built-up Area–Built-up Volume (BUA–BUV) trajectory framework, which embeds vertical growth into LUE monitoring. The framework represents urban growth as trajectories in normalized BUA–BUV space and classifies them by prevailing built form (horizontal, balanced, vertical) and growth modality (expansion or intensification). This classification is then coupled with LCRPGR to link efficiency outcomes with spatial structure. We apply the framework to 10,856 urban centres worldwide using Global Human Settlement Urban Centre Database (GHS-UCDB 2025) data from 1980 to 2020. Results show that inefficient growth (LCRPGR > 1) dominated, affecting 69% of centres during 1980–2000 and 52% during 2000–2020, while inefficiency linked to demographic decline (LCRPGR ≤ 0) rose from 9% to 20%. Efficient centres (0 < LCRPGR ≤ 1) increased from 22% to 29%. Across all efficiency classes, BUA–BUV trajectories revealed a prevailing pattern of horizontal expansion, with similar LCRPGR values associated with structurally divergent growth paths. Vertically intensifying development was rare, even among efficient centres. The BUA–BUV framework embeds structural context into efficiency assessments, thereby strengthening SDG 11.3.1 monitoring and informing policies for compact and sustainable urbanization.

1. Introduction

Urbanization has become a defining transformation of the twenty-first century, driving profound shifts in land use patterns, resource demand, and human well-being [1]. Today, more than half of the world’s population lives in cities, and this share is projected to rise steadily in the coming decades [2]. The spatial form of urban growth, whether expressed through outward expansion, vertical densification, or a combination of both, directly impacts sustainability, influencing infrastructure provision, energy consumption, and ecological footprints [3]. Recognizing these challenges, the United Nations adopted Sustainable Development Goal (SDG) 11 to “make cities and human settlements inclusive, safe, resilient, and sustainable.” Within this framework, Target 11.3 calls for enhancing inclusive and sustainable urbanization by 2030, with Indicator 11.3.1 included among the official metrics for monitoring progress [4].
Indicator 11.3.1 measures land use efficiency (LUE) as the ratio between the land consumption rate (LCR) and the population growth rate (PGR), commonly referred to as LCRPGR [5]. In principle, efficiency is achieved when population growth is accommodated without disproportionate increases in land consumption [6]. A ratio close to or below one is interpreted as compact or efficient growth. At the same time, values larger than one suggest that land is being consumed more rapidly than the population increases, which is often associated with urban sprawl [5,7].
The methodological simplicity and global comparability of LCRPGR have enabled its application across diverse local, national, and global contexts, e.g., [8,9,10,11,12,13,14,15]. However, its formulation is fundamentally limited by the exclusion of the vertical dimension of urban growth [6]. This omission is critical because many cities, particularly those with high population density or limited land availability, accommodate growth primarily through vertical construction [16,17]. Since land consumption is measured only in two dimensions, LCRPGR reduces diverse urban processes to a single value, concealing vertical dynamics and limiting the capacity of SDG 11.3.1 monitoring to explain how cities actually accommodate population change. Consequently, LCRPGR alone cannot distinguish whether compactness arises from horizontal containment, vertical intensification, or both, nor whether inefficiency reflects sprawl, demographic decline, or insufficient densification. The indicator thus offers limited insight into the mechanisms through which efficiency is achieved or whether outcomes correspond to structurally sustainable forms of urban development [18].
Recent advances in Earth observation (EO) provide an opportunity to address these shortcomings. Globally available datasets provide multitemporal estimates of building height and volume, enabling systematic three-dimensional characterization of urban form, e.g., [19,20,21,22,23,24]. These datasets reveal clear evidence of vertical urbanization, with Liu et al. [16] documenting widespread increases in building volume between 1985 and 2015, and Frolking et al. [25] showing a global transition from predominantly lateral expansion to upward growth, particularly in Asian cities. Despite these advances, vertical metrics and trajectory-based or 3D typological approaches remain largely absent from SDG 11.3.1 monitoring. Where such methods have been employed, e.g., [16,25,26,27,28,29], they often rely on proxy indicators of verticality, involve heavy data and processing requirements, or lack alignment with the operational logic and comparability standards of SDG 11.3.1 monitoring procedures. This gap leads to the central scientific question guiding this paper: how can vertical urban growth be systematically integrated into SDG 11.3.1 monitoring to improve the interpretation of land use efficiency outcomes?
In response to this need, this paper introduces the Built-up Area–Built-up Volume (BUA–BUV) trajectory framework as a complementary approach to enhance SDG 11.3.1 monitoring. The framework represents urban growth as trajectories in normalized BUA–BUV space, enabling classification of urban centres by built form (horizontal, balanced, vertical) and growth modality (expansion or intensification). Coupled with LCRPGR, the framework embeds spatial structure into efficiency assessment, distinguishing whether compactness or inefficiency is linked to horizontal or vertical dynamics. In doing so, it clarifies the conditions under which efficiency is achieved and whether the underlying structure supports long-term sustainability, thereby strengthening the interpretability and policy relevance of SDG 11.3.1.
This study applies the BUA–BUV trajectory framework to 10,856 urban centres worldwide for the period 1980–2020, using the Global Human Settlement Urban Centre Database (GHS-UCDB) 2025 [30], which provides harmonized estimates of built-up area, built-up volume, and population. Four research questions guide the analysis:
  • Does integrating built-up volume with built-up area improve the interpretation of efficiency outcomes under SDG 11.3.1, and if so, how?
  • Which global patterns of built form and growth modality emerge when urban centres are analyzed in BUA–BUV trajectory space?
  • How do these structural dynamics intersect with efficiency classifications based on LCRPGR?
  • To what extent do these dynamics indicate whether observed efficiency outcomes are structurally sustainable in the long term?
The remainder of the paper proceeds as follows. Section 2 situates the study within existing work on SDG 11.3.1 monitoring, outlining the limitations of LCRPGR, the emergence of vertical urban metrics and typologies, and the rationale for adopting the BUA–BUV trajectory framework. Section 3 introduces the conceptual foundations of the framework and its integration with SDG Indicator 11.3.1, while Section 4 presents its global application. Section 5 reports the empirical findings, and Section 6 interprets these results with respect to efficiency outcomes, structural dynamics of urban growth, policy implications, and associated caveats and limitations. Finally, Section 7 concludes the work by summarizing the main contributions of the study.

2. SDG 11.3.1 Fundamentals and Related Work

2.1. SDG 11.3.1 Formulations

The fundamental formulations for calculating SDG Indicator 11.3.1 (LCRPGR) and its components, based on the latest metadata definitions [5] with minor adjustments in notation, are
L C R = B U A t 2 B U A t 1 B U A t 1 · 1 t
P G R = l n P o p t 2 P o p t 1 t
L C R P G R = L C R P G R
Here, BUA denotes the total built-up area and Pop the total population at two epochs ( t 1 and t 2 ), with Δ t as the time interval. In the context of SDG 11.3.1, built-up areas are defined as all areas occupied by buildings [5]. Interpreting an LCRPGR value requires understanding the sign and relative magnitude of LCR and PGR (Table 1).

2.2. Applications and Limitations of LCRPGR

Since the adoption of the UN SDGs in 2015, an expanding body of research has employed LCRPGR to assess urban LUE across global, national, and local scales, e.g., [8,9,10,13,14,15,31,32,33,34,35,36,37,38,39,40,41,42]. These studies illustrate how factors such as urban population size, expansion rate, compactness, and border complexity influence LCRPGR while revealing the spatially varied dynamics of LUE across regions, countries, and local urban centres. Consistent with the methodological prescriptions of the indicator’s metadata [5,7], much of this work has emphasized the simplicity of LCRPGR, which requires only the delineation of the spatial unit of analysis (e.g., city, country) and corresponding built-up area and population data for the period of analysis. However, the same studies also underscore the indicator’s limitations. Its strict reliance on two-dimensional representations of land consumption, as represented by Equation (1), reduces urban growth to horizontal expansion alone, leaving vertical development entirely unaccounted for [6]. Moreover, LCRPGR omits economic [35], governance [12], and environmental dimensions [6], while paying insufficient attention to the spatial and statistical complexities inherent in urbanization processes [6,34,43,44]. The indicator’s dimensionless form and lack of spatial explicitness further constrain interpretation, particularly in diverse urban contexts. As several studies note, e.g., [6,9,33,38,45], identical LCRPGR values can result from very different processes, such as rapid land expansion exceeding population growth or population decline alongside reduced land consumption. Such cases result in ambiguous and sometimes misleading conclusions about efficiency. Importantly, these interpretability issues are also acknowledged in the most recent revision of the indicator’s metadata [5], which recognizes the need for caution in comparing LCRPGR values across different urban contexts. In addition, the reliability and comparability of SDG 11.3.1 assessments are further affected by variability in EO data products, particularly differences in built-up area definitions, spatial resolution, and classification errors [46,47].
To mitigate such limitations, supplementary indicators such as Built-up Area per Capita (BUpC), Total Change in Built-up Area, Abstract Achieved Population Density in Expansion Areas (AAPDEA), and Marginal Land Consumption per New Inhabitant (MLCNI), have been introduced to capture the form and intensity of urban expansion, thereby addressing the metric’s lack of spatial explicitness [5,15,33]. Parallel efforts have extended the framework to economic and governance dimensions by relating LCRPGR to the ratio of economic growth to land consumption (EGRLCR) [35] or to World Governance Indicators (WGI) [12]. Interpretation tables (such as Table 1) and LCRPGR classification have further improved clarity by distinguishing efficiency drivers, i.e., between built-up land consumption and population growth [6,15,33,35]. Advances in built-up and population data generation, together with the adoption of automated geospatial approaches, e.g., [41,47,48,49], and the integration of uncertainty quantification techniques [46], have further strengthened the reliability and comparability of LCRPGR estimates across different spatial and temporal contexts.
However, these extensions remain partial. While they address some weaknesses, they do not resolve the core limitation: the confinement of LCRPGR to a two-dimensional view of urbanization. Because land consumption is not solely a 2D process, land use efficiency cannot be fully captured within a 2D framework. A more complete understanding of urban growth requires explicit consideration of vertical intensification, where volumetric information becomes indispensable [50]. The need for such consideration is evident in the global analysis of Estoque et al. [6], which found that correlations between land consumption and population growth were weak or absent in several high-income and very high human development countries. The authors attributed this finding to the predominance of vertical construction, as indicated by the widespread presence of high-rise buildings, a dynamic entirely invisible to LCRPGR. In its current form, LCRPGR cannot distinguish whether efficiency outcomes result from horizontal sprawl, vertical intensification, or mixed trajectories, highlighting the need for approaches that integrate the vertical dimension of urban growth.

2.3. Volumetric Approaches to Measure Urbanization

Beyond the SDG 11.3.1 framework, volumetric indicators have been proposed to more fully characterize urbanization processes by incorporating the vertical dimension of growth. For instance, Zięba-Kulawik et al. [29] introduced the Building 3D Density Index (B3DI) to quantify changes in the volume of buildings and urban expansion; Zambon et al. [27] proposed the Vertical-to-Horizontal Growth (VHG) ratio to discriminate vertical from horizontal urban expansion; Ruan et al. [51] calculated a Coupling Index to examine mismatches between built-up land intensity and efficiency; and Kim & Kim [52] developed a 3D Land Use Index (3D LUI) to quantify vertical land use. Collectively, these studies show that excluding volumetric information risks obscuring key structural and functional dimensions of growth, while their inclusion offers a richer basis for interpreting efficiency outcomes.
Among these measures, B3DI and VHG stand out because they capture complementary aspects of volumetric form that may be useful to enhance LCRPGR interpretation. B3DI directly relates total building volume to total surface area [29], offering a density-based measure conceptually closer to the land consumption logic of SDG 11.3.1. However, because it collapses vertical and horizontal contributions into a single aggregate ratio, B3DI cannot reliably distinguish whether increases in volumetric density arise from vertical intensification of existing built-up land or from outward expansion into new areas. VHG, by contrast, explicitly encodes the relative contribution of vertical versus horizontal growth, embedding structural information that is highly relevant for interpreting efficiency [27]. Yet VHG’s application faces notable challenges. Its original formulation requires detailed building-level data such as floor counts, which are rarely available at consistent spatial or temporal scales. When only aggregated datasets such as the GHS-UCDB 2025 are accessible, height can only be approximated indirectly as the ratio of built-up volume to built-up area, yielding averages that mask intra-urban variation. Moreover, because VHG is expressed in terms of building counts rather than land consumption, its alignment with the efficiency logic of SDG 11.3.1 remains only partial. The B3DI and VHG can be adapted for aggregated datasets using the ratio of built-up volume to area (resulting in average height), but this blurs structural differences. Cities with very different forms—such as mixed high-rises and suburbs versus uniform mid-rise blocks—may yield the same value, limiting the metrics’ reliability when applied across many cities. These limitations underscore the need for approaches that integrate volumetric information to clarify efficiency outcomes while remaining scalable, comparable, and consistent with the operational logic of SDG 11.3.1.

2.4. Trajectory-Based and 3D Typological Approaches

Beyond individual volumetric indicators, a parallel body of research has used trajectories and typologies to classify the dynamics of urban growth. Classical 2D approaches track outward edge expansion, radial growth from city centres, and pattern classes such as infill, leapfrog, and edge expansion [53,54,55,56,57]. Related work has examined the co-evolution of built-up area and population over time [58], with some studies linking these trajectories to LUE assessments within the framework of SDG 11.3.1, e.g., [6,13,33,59]. While helpful in clarifying horizontal growth patterns, these frameworks remain confined to planimetric change and fail to capture vertical development’s contribution to efficiency outcomes.
More recent typologies attempt to integrate vertical dimensions in urban growth analysis. Mahtta et al. [26] combined GHSL-derived built-up extent with microwave backscatter (as a proxy for height) and population data to classify global urban expansion into five types, ranging from stabilized to upward-and-outward growth. Frolking et al. [25] applied a similar approach, identifying growth modes such as slow growth, outward growth, rapid 3D growth, and height-dominant growth. Although these studies highlight vertical processes, their use of microwave backscatter as a proxy restricts temporal coverage, spatial consistency, and sensitivity to urban morphology. Moreover, their cluster-based approaches for typology classifications introduce methodological subjectivity, reducing reproducibility across contexts and weakening alignment with SDG 11.3.1 monitoring requirements.
Other studies rely on direct 3D data. Liu et al. [16] applied a global morphology typology based on built-up horizontal coverage ratio (planar density) and average height (vertical intensity), classifying cities into forms such as sparse-low rise, compact-low rise, sparse-high rise, and compact-high rise. Zhao et al. [28] proposed a LiDAR-based typology that uses building height and land cover to identify processes such as intensification, efficient expansion, and sprawl. While these approaches demonstrate the value of explicit 3D data for characterizing built forms, they also illustrate important limitations. Liu et al.’s framework focuses on describing urban form at a single point in time, offering little insight into temporal trajectories of co-evolution, while Zhao et al.’s method is constrained by heavy data requirements and complex preprocessing, limiting its transferability beyond data-rich local contexts. Importantly, neither framework was designed to align with SDG 11.3.1, which reduces their applicability for standardized LUE monitoring.
In summary, trajectory-based and typological studies show the value of embedding vertical form into efficiency assessments. However, they remain unsuitable for standardized monitoring: proxy-based methods lack consistency, LiDAR-based approaches are data-intensive and locally constrained, and existing typologies are not interoperable with SDG 11.3.1. This limitation underscores the need for reproducible techniques that can trace urban trajectories, embed both horizontal and vertical dimensions, and align directly with the operational requirements of SDG 11.3.1.

2.5. Synthesis and Rationale for the BUA–BUV Framework

Across the reviewed literature, three broad gaps emerge. First, studies applying LCRPGR demonstrate its global uptake and methodological simplicity but also reveal its inherent limitations: it is dimensionless, spatially non-explicit, and confined to horizontal measures of land consumption. These constraints lead to ambiguous interpretations, particularly where vertical growth absorbs population change, as noted in high-income contexts [6]. Second, advances in EO and the development of volumetric approaches have created powerful tools for analyzing vertical urbanization, yet these remain absent from SDG 11.3.1 monitoring. Third, vertical metrics and trajectory-based and 3D typological approaches demonstrate the conceptual value of embedding vertical form. However, they face methodological subjectivity, heavy data requirements, and poor alignment with SDG 11.3.1 monitoring procedures, limiting their scalability and policy relevance.
This study responds to these gaps by introducing the BUA–BUV trajectory framework to explicitly integrate horizontal and vertical dimensions of urban growth into LUE assessment. The framework produces a trajectory-based typology of urban growth, enabling systematic classification of centres according to their prevailing built form and growth direction. Unlike previous approaches that relied on proxy measures of verticality, involved heavy data and processing requirements, or remained conceptually disconnected from SDG 11.3.1 monitoring, the proposed framework leverages harmonized global datasets on built-up area and volume. This framework enables analysis of the co-evolution of extent and form, distinction between horizontal expansion and vertical intensification, and integration of these trajectories with LCRPGR to improve interpretability. Crucially, the framework was chosen because it combines three essential properties absent in earlier methods: (i) it captures both horizontal and vertical processes without collapsing them into aggregate density ratios, (ii) it provides a transparent and reproducible trajectory-based classification that avoids the subjectivity of clustering or typology schemes, and (iii) it aligns with the scalability and comparability requirements of SDG 11.3.1 monitoring. These properties make the BUA–BUV framework a suitable and globally transferable basis for embedding vertical growth into LUE assessments.

3. The BUA-BUV Trajectory Framework

3.1. Conceptual Basis

The framework conceptualizes urban growth as a trajectory in a two-dimensional space, with the x-axis representing BUA and the y-axis representing BUV. For each urban centre u , a trajectory is constructed as an ordered sequence of observations across n temporal snapshots t 1 , t 2 ,…, t n , where each t k ( k = 1 , 2 , , n ) denotes a specific year or epoch. The raw trajectory is defined as
T u = B U A t 1 ,   B U V t 1 ,   B U A t 2 ,   B U V t 2 ,   , B U A t n ,   B U V t n  
As illustrated in Figure 1a, this trajectory represents the temporal co-evolution of urban spatial extent and built volume as a sequence of connected line segments in BUA–BUV space. Each segment, constructed by linearly linking consecutive observations, conveys the direction and magnitude of growth between time steps. While this captures the scale and cumulative magnitude of change, raw trajectories are insufficient for systematic comparison across urban centres. They do not allow the analytical determination of prevailing built form or growth modality, which are essential for linking structural characteristics of urban development with LCRPGR outcomes.
Two issues explain this limitation. First, BUA and BUV are incommensurable, since they represent different physical dimensions and operate on different numerical ranges, making direct interpretation of trajectory slopes ambiguous. Second, interpretation requires a reference trajectory against which relative growth modes can be assessed. Without such a benchmark, raw plots provide only visual impressions, which are subjective and unsuitable for consistent typological classification. As a result, reliance on visual inspection prevents reproducible identification of growth modalities, whether predominantly horizontal, vertical, or balanced, across urban centres and temporal intervals.
To overcome these limitations, the framework applies normalization to place BUA and BUV on a common, dimensionless scale. Specifically, a min–max transformation is performed across all urban centres and time steps, rescaling values to the [0, 1] range. This normalization ensures that each trajectory is evaluated relative to the global distribution of observed BUA and BUV values. A normalized value of 0 corresponds to the lowest observed expansion or volume, while a value of 1 corresponds to the highest, with intermediate values reflecting relative positions within the global range. This transformation creates a standardized basis for comparison, enabling consistent classification of growth modes independent of absolute size.
In this normalized trajectory T u * 0,1 2 (Figure 1b), the values for each time step t k are computed as
B U A t k * = B U A t k m i n B U A m a x B U A m i n B U A
B U V t k * = B U V t k m i n B U V m a x B U V m i n B U V
where m i n ( B U A ) , m a x ( B U A ) , m i n ( B U V ) , and m a x ( B U V ) are computed from the full spatiotemporal dataset of all urban centres and all time points.
The central premise of the BUA–BUV framework is the 1:1 line, which represents a state of proportional equilibrium between horizontal expansion and vertical intensification. This benchmark is meaningful only when both axes are normalized to the same [0, 1] range. Under this condition, the line y = x indicates that an urban centre’s relative position in BUA growth is identical to its relative position in BUV growth.
In the normalized BUA–BUV space, the position of trajectory points relative to the 1:1 line reflects their prevailing built form compared to the global sample. Because the 1:1 line captures equal relative change concerning each variable’s observed range, it functions as a comparative reference. Trajectory points above it reflect proportionally larger upward expansion, those below it indicate dominant horizontal expansion, and those on or near it represent balanced growth, where horizontal expansion and vertical development proceed in comparable proportions (Figure 1c). Because normalization is performed across the whole dataset, these positions highlight relative morphological tendencies rather than absolute magnitudes.
Trajectory direction between two epochs indicates the prevailing growth modality. It is quantified as the slope of the trajectory in normalized space, calculated from the counterclockwise angle between the x-axis and the line segment connecting the earliest and latest time points. Shallow slopes indicate predominantly area-driven expansion, steeper slopes reflect volume-led intensification, and intermediate slopes suggest more balanced growth. Combined with a trajectory’s starting position relative to the 1:1 line, these directional measures enable consistent identification of urban growth typologies (Figure 1d). For example, an urban centre whose initial trajectory point lies above the 1:1 line and follows a steep upward slope indicates pronounced vertical intensification, whereas one starting below the line with a shallow slope signifies sustained horizontal growth. Transitional cases, such as centres on or near the 1:1 line, signal balanced growth trajectories that can shift toward vertical or horizontal dominance over time.

3.2. Operationalizing the BUA–BUV Framework for Typology Classification

To operationalize the classification, a “zone of effective balance” is first defined to capture trajectory points that fall sufficiently close to proportional equilibrium between horizontal expansion and vertical intensification. Because perfect balance is only a theoretical ideal, this zone is set as the 5th percentile of absolute orthogonal distances to the 1:1 line, calculated from the pooled global sample of all centres and years. Year-specific percentiles would introduce a moving decision boundary and confound temporal comparisons; the pooled threshold yields a fixed, globally defined tolerance consistent with the global normalization and the trajectory interpretation. The prevailing built form of an urban centre at each time step is then determined by the position of its normalized trajectory vertices (or the trajectory’s end points in the case of only two time steps) relative to this band. Centres within this band are classified as balanced, while those outside are assigned to vertical or horizontal dominance depending on the sign of deviation.
Second, growth modality is determined by slope categories. Slopes between 0° and 30° represent horizontal expansion, 30° to 60° correspond to balanced growth, and 60° to 90° indicate vertical intensification. While trajectory directions can, in principle, extend from −180° to 180° if either BUA or BUV decreases over time, such contractions are rare in practice, given the cumulative nature of EO-derived built-up area and volume, e.g., [16,60]. For interpretive clarity, the present study restricts classification to the 0–90° domain under the assumption of monotonic increases in BUA and BUV. This assumption can be relaxed in future applications of the framework to explicitly accommodate contraction scenarios such as those resulting from natural disasters, armed conflict, or deliberate downsizing. By combining positional classification relative to the 1:1 line with slope-based growth modality, the framework establishes a systematic and reproducible scheme for deriving urban growth typologies that explicitly incorporate the vertical dimension (Figure 1d, Table 2).
Both conceptual and geometric considerations guide the choice of the 5th percentile for defining the balance band, and the selection of the slope thresholds. The 5th percentile was chosen as a conservative and data-driven threshold. Stricter values, such as the 1st percentile, risk excluding genuinely balanced centres due to data uncertainty. Broader values like the 10th percentile risk misclassifying skewed forms as balanced. The 5th percentile ensures that only centres with the smallest deviations (i.e., those that clearly exhibit proportional equilibrium) are classified as balanced.
For the slope thresholds, dividing the 0–90° continuum evenly into three 30° intervals provides a neutral and symmetric partition that avoids privileging one growth mode over another. This scheme also aligns with the established triad of urban growth processes: horizontal expansion, vertical densification, and mixed forms [16,17,25]. Moreover, slope angles are mathematically equivalent to the BUV* to BUA* ratio, making this approach comparable to ratio-based indices such as the B3DI [29] and VHG [27]. However, unlike B3DI, which conflates vertical and horizontal contributions into a single density measure, and unlike VHG, which requires detailed building-level data or loses precision when applied in aggregated form, the slope-based classification embeds both dimensions within a normalized framework and applies evenly defined regimes. In doing so, it overcomes the limited precision of aggregated ratio measures. Finally, the use of equal angular partitions ensures transparency and reproducibility. The classification is straightforward, interpretable across contexts, and independent of dataset-specific distributions. Unlike empirically derived thresholds (e.g., quartiles of observed slopes), which vary by dataset and reduce comparability, evenly spaced angular partitions provide a consistent and generalizable basis for classification.

3.3. Comparison with Other Trajectory Typology Classifications

Unlike clustering methods used in earlier studies for urban growth trajectory classification, e.g., [25,26], which are exploratory and often sensitive to algorithmic choices, our urban growth typology classification approach is explicitly theory-driven. It begins with a predefined conceptual benchmark—the 1:1 line of proportional equilibrium—and classifies urban centres according to their prevailing built form (vertically dominant, balanced, or horizontally dominant) and their growth mode (horizontal expansion, balanced growth, or vertical intensification). This two-dimensional scheme yields interpretable categories (Table 2) such as “Vertical Intensification,” “Sustained Balanced Growth,” or “Sustained Horizontal Growth,” each directly linked to structural processes of urban change. The resulting typologies are transparent, reproducible, and aligned with the central research objective of assessing how urban centres deviate from or approach structural balance. Thus, this trajectory classification scheme provides a more robust basis for interpreting LUE outcomes than unsupervised clustering approaches.
It is also possible to condense trajectories into a single scalar, such as the angle between the overall trajectory vector and the 1:1 line, but doing so removes critical contextual information. For instance, an urban centre that begins in a vertically dominant position and subsequently undergoes moderate horizontal expansion may yield an overall trajectory angle that suggests horizontal growth, even though its built form remains predominantly vertical. This loss of temporal and structural information limits the interpretability of scalar metrics. By retaining the full trajectory while classifying it into interpretable categories, the BUA-BUV framework balances methodological rigor with explanatory clarity, providing a stronger basis for assessing structural drivers of LUE outcomes.

3.4. Interpretation in the Context of SDG Indicator 11.3.1

The BUA-BUV trajectory-based typologies, when used in conjunction with LCRPGR, provide a more comprehensive basis for evaluating LUE and its alignment with sustainable urban development within the context of SDG 11.3.1.
Urban centres with similar LCRPGR values may belong to different trajectory typologies, and vice versa. Referring to our hypothetical example (Figure 1d), City A and City I might both fall within the “efficient” range (0 < LCRPGR ≤ 1), yet their growth typologies diverge significantly. City A’s steep trajectory above the 1:1 line indicates vertical intensification and compact urban form. At the same time, City I follows a shallow path below the line, suggesting continued horizontal expansion with minimal vertical development. Although both may appear equally efficient numerically according to the SDG 11.3.1 standard, their long-term sustainability implications differ: City A’s compact form supports resource efficiency and reduced land consumption, whereas City I may incur higher infrastructure costs and contribute to urban sprawl [18].
Conversely, cities with similar spatial trajectories may exhibit varying LCRPGR values depending on their population growth dynamics. For instance, City G shows a steep upward trajectory from a low-rise base—suggesting a vertical correction or densification strategy—yet may still have an LCRPGR larger than one if its population growth remains stagnant. In such a case, the indicator might not yet reflect this progress despite the improving spatial form.
These distinctions underscore the value of interpreting LCRPGR together with BUA–BUV typologies. While LCRPGR provides a numerical measure of efficiency, the trajectories act as a spatial diagnostic tool that clarifies the structural pathways through which efficiency or inefficiency arises and whether these pathways are likely to be sustainable in the long term. Importantly, the BUA–BUV framework is diagnostic rather than causal: it identifies whether growth is realized through horizontal expansion, vertical intensification, or balanced forms, but it does not explain the socioeconomic, institutional, or cultural drivers behind these patterns. As such, the framework complements rather than replaces causal analyses of urbanization, providing a reproducible and scalable means to embed structural context into SDG 11.3.1 monitoring.
The framework’s application relies on BUA and BUV data that are already harmonized across time, with consistent boundaries and definitions to ensure that observed changes reflect real urban dynamics. It further assumes that the inputs are free of major errors or extreme outliers. The procedures for detecting and removing such anomalies are described in the following section, where the framework is applied to assess LUE and global urban growth trajectories.

4. Application of the BUA-BUV Trajectory Framework for Enhanced LUE Assessment of Global Urban Centres

4.1. Data Description and Temporal Scope of Analysis

We applied the BUA–BUV trajectory framework to the GHS-UCDB 2025, a database of harmonized and spatially explicit information on 11,422 urban centres worldwide [30]. According to the GHS-UCDB 2025 documentation [30], boundaries are delineated using the Degree of Urbanisation (DEGURBA) (Stage 1) methodology [61], which the United Nations Statistical Commission has endorsed as the global standard for classifying settlements. DEGURBA is implemented through the GHS Settlement Model (GHS-SMOD R2023A), which classifies settlement typologies on a 1 km × 1 km grid [62]. An urban centre consists of contiguous cells with a population density of at least 1500 inhabitants per km2 of permanent land and a minimum total population of 50,000, with smoothed boundaries created by 3 × 3 conditional majority filtering and <15 km2 holes filled [30].
Each record is annotated with its country, UN SDG region, and World Bank (WB) income group. It also contains aggregated attributes for built-up area and population from 1975 to 2020 at 5-year intervals, with projections for 2025 and 2030. Built-up height (2020) and volume (historical and projected) are also included. These variables are derived from four 100-m resolution layers of the GHSL Data Package 2023 [60]: GHS-BUILT-S for built-up area [63], GHS-POP for population [64], GHS-BUILT-H for building height [22], and GHS-BUILT-V for built-up volume [21]. GHSL estimates are among the most accurate among publicly available datasets, with built-up area errors averaging 6% per 100-m pixel, a mean absolute error of 2.27 m for building height, and over 80% accuracy for population estimates [65].
For this study, we restricted the temporal scope to 1980–2020. We analyzed two 20-year intervals (1980–2000 and 2000–2020) and the cumulative period (1980–2020). These intervals capture major phases of global urban development before and after 2000. Shorter steps, such as the native 5-year resolution, may be less reliable due to precision limits and often do not reflect substantial structural change. The 20-year framing balances robustness with interpretability, providing a consistent basis for global-scale trajectory analysis.

4.2. Data Preparation

This study used two files from the GHS-UCDB 2025: a spreadsheet (GHS_UCDB_THEME_GHSL_GLOBE_R2024A.xlsx) and a GeoPackage (GHS_UCDB_THEME_GHSL_GLOBE_R2024A.gpkg). The spreadsheet served as the primary input for analysis. The GeoPackage, containing centroids and boundaries of urban centres, was used for mapping and geovisualization. LCR, PGR, and LCRPGR were calculated for each urban centre over two 20-year intervals (1980–2000, 2000–2020) and cumulatively across 1980–2020, following Equations (1)–(3).
A preliminary statistical check examined the distribution of LCR and PGR values. Descriptive statistics (minimum, maximum, mean, median, standard deviation) and frequency plots were generated for each period. The distributions were highly skewed and deviated from normality. LCR values exceeded 4000, and PGR reached 54%, which are implausible given their interpretation as annual rates. These anomalies likely stem from uncertainties in built-up area and population estimates. To address this issue, extreme values were removed using the modified Interquartile Range (IQR) method [66]. A value was classified as an outlier if it fell outside the acceptance range defined as
Q 1 3 · I Q R 1 + 0.1 l o g n 10   to   Q 3 + 3 · I Q R 1 + 0.1 l o g n 10 ,
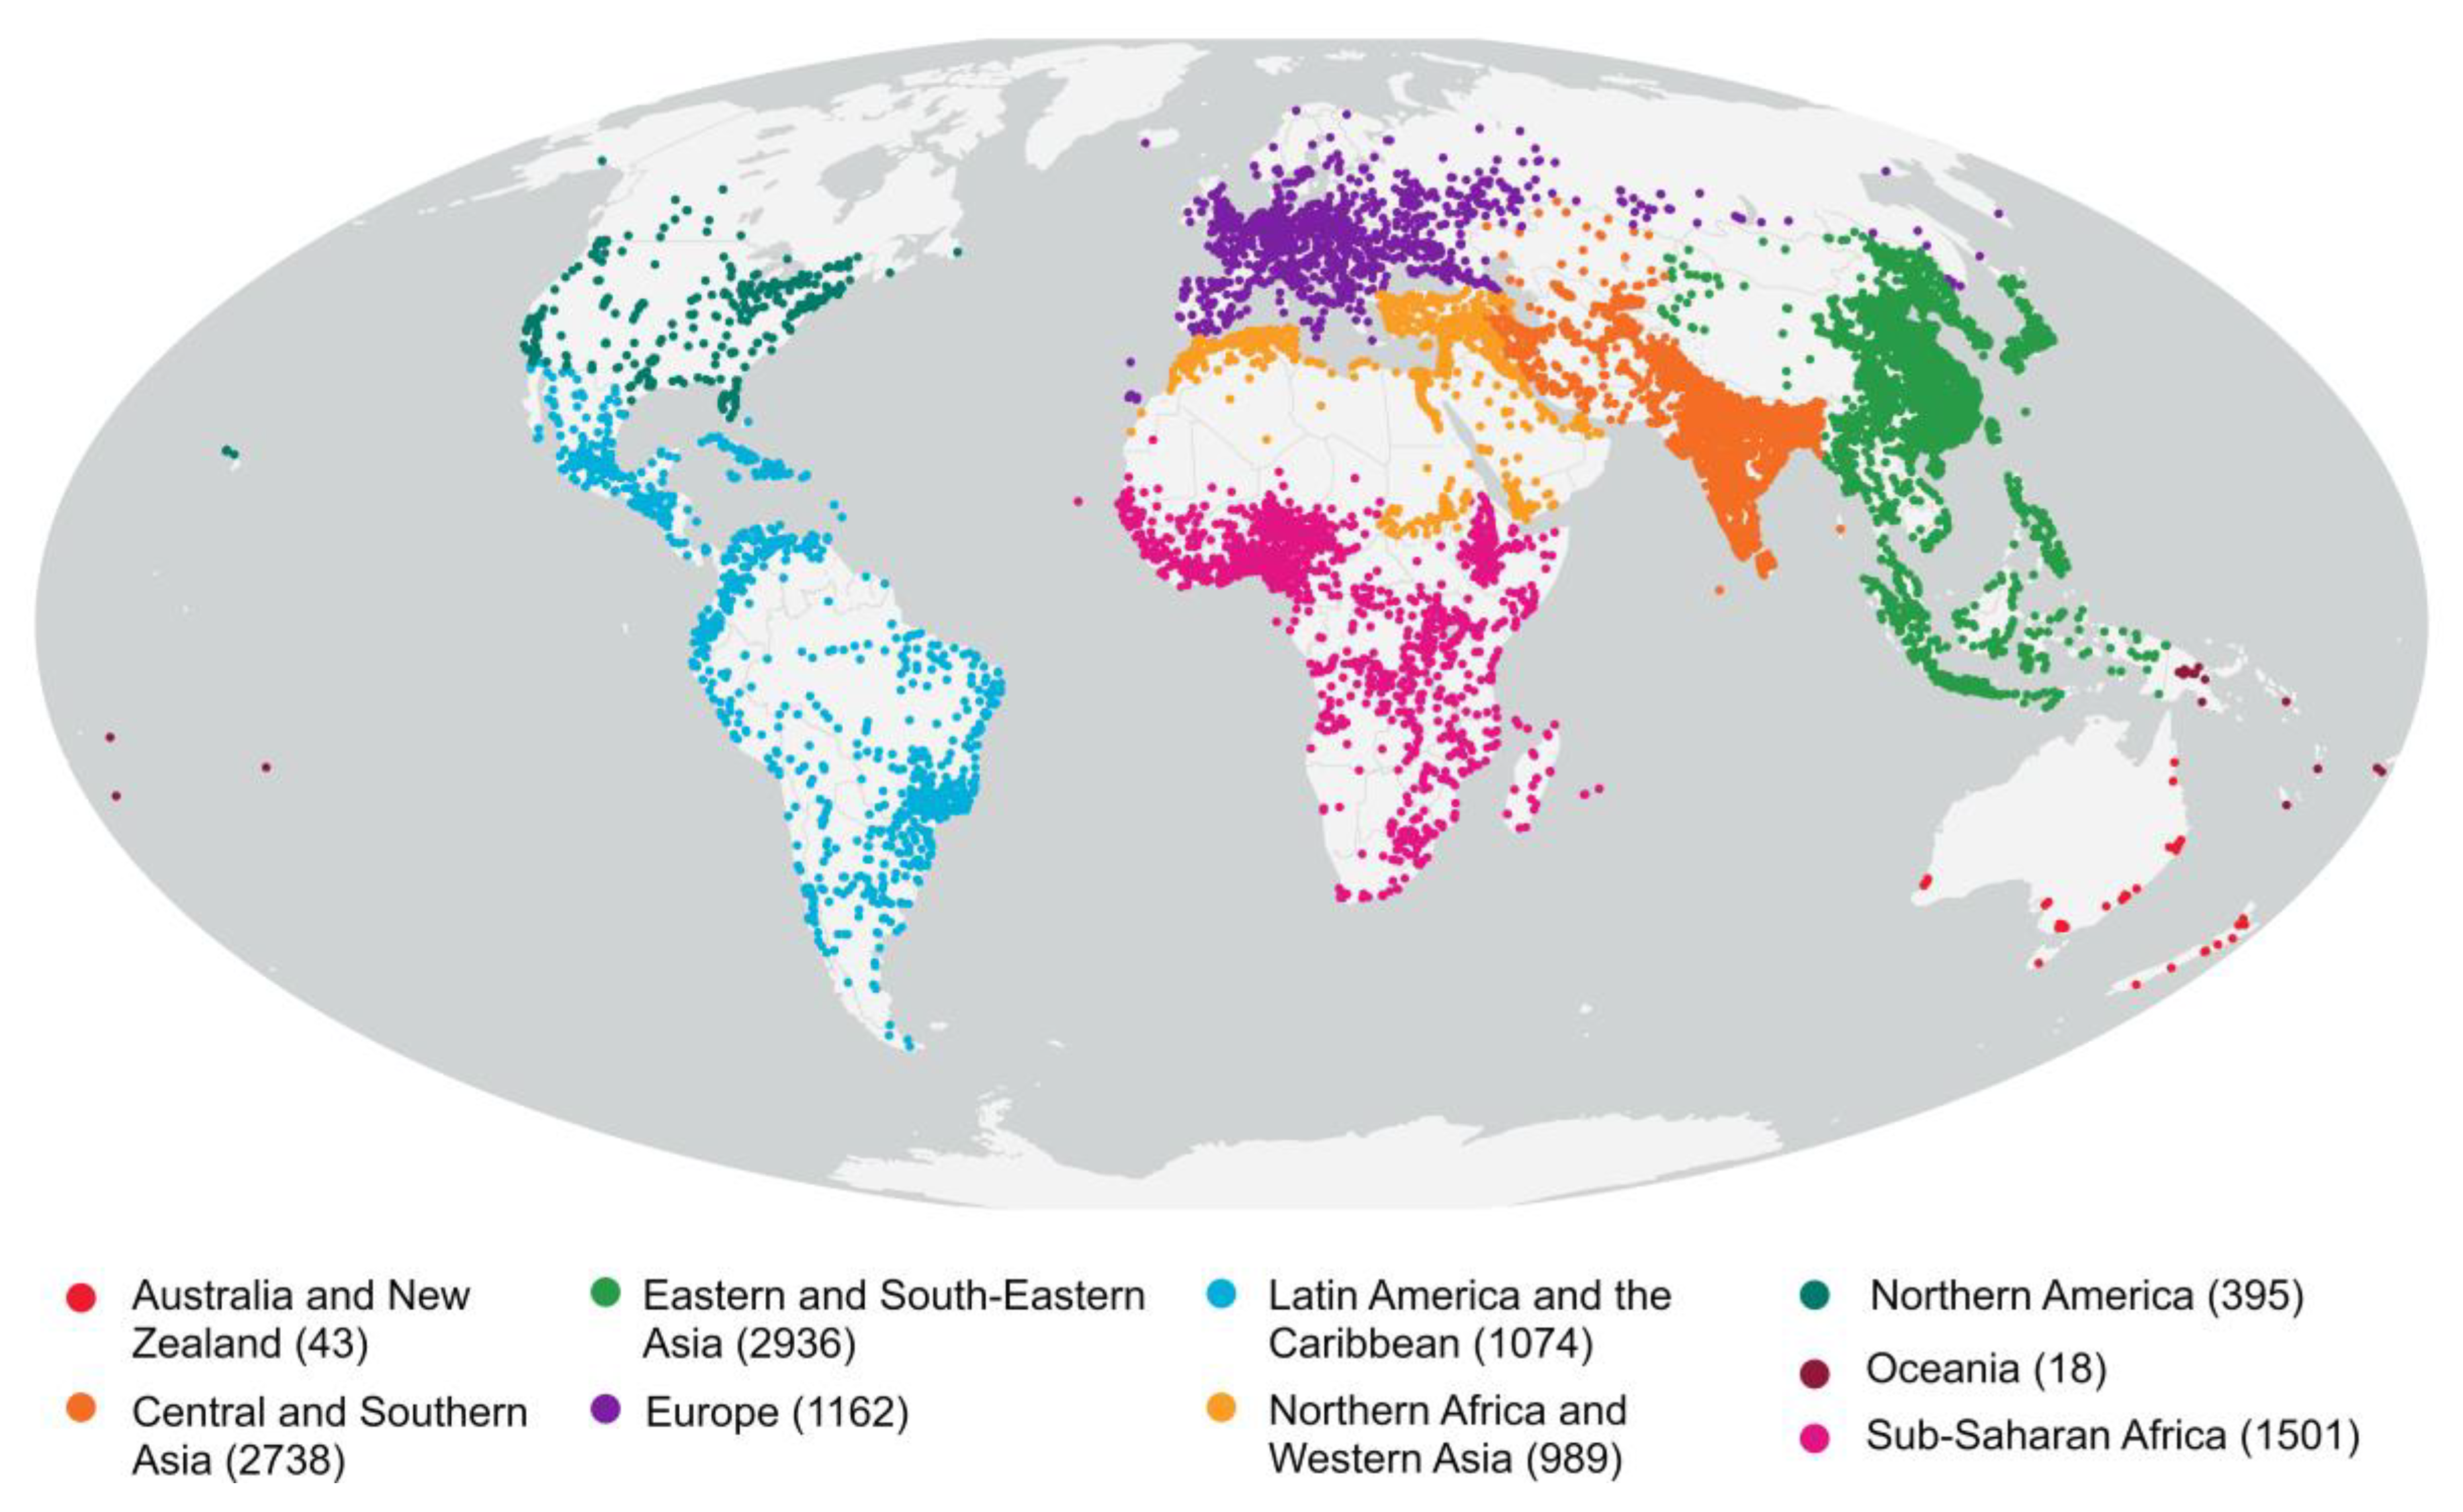
where Q 1 and Q 3 represent the first (25th percentile) and third (75th percentile) quartiles, respectively; I Q R = Q 3 Q 1 ; and n is the total number of observations. This procedure was applied separately to the LCR and PGR distributions across the three analysis periods: 1980–2000, 2000–2020, and 1980–2020. For each metric, the acceptance range was computed based on all available observations ( n = 11,422). An urban centre was flagged as an outlier and excluded from further analysis if it exhibited at least one LCR or PGR value across any of the three periods that fell outside the corresponding acceptance range. Following this quality control procedure, a sample of 10,856 urban centres was retained for subsequent analysis (Figure 2).

4.3. LUE Assessment

LUE was assessed across the full set of urban centres retained after quality control. For each analysis period, frequency distributions of LCR, PGR, and LCRPGR were generated to describe the overall efficiency of global urban centres. Despite removing outliers (Section 4.2), the distributions remained skewed, which likely reflects the inherent heterogeneity of global urbanization. To provide a robust representation of central tendencies without being influenced by distributional asymmetry, medians were used as the primary measure. To examine variation beyond the global aggregate, the medians of these indicators were also calculated by UN SDG Regions and WB Income Groups. This stratification enables assessment of how geographic context and economic level influence patterns of land consumption, population growth, and LUE.
LCRPGR was further classified into three categories: ≤0 (inefficient, reflecting land expansion with stagnant or declining population), 0–1 (efficient), and >1 (inefficient, where land consumption outpaces population growth). Based on this classification, the number of urban centres falling into each category was tabulated for the three analysis periods (1980–2000, 2000–2020, and 1980–2020). Categorical distributions by UN SDG Region and World Bank Income Group were also derived. These distributions were then compared across periods to assess how the prevalence and regional patterns of efficiency classes evolved, thereby providing insights into the shifting characteristics of LUE at both global and disaggregated levels.

4.4. Trajectory Typology Assignment and Efficiency Evaluation

BUA and BUV values for 1980, 2000, and 2020 were normalized using global minimum and maximum values (Equations (5) and (6)). Each urban centre was then classified by prevailing built form (horizontal, balanced, vertical) and growth direction (horizontal expansion, balanced growth, vertical intensification) using the scheme outlined in Section 3.2. The combination of these two dimensions yields nine possible trajectory typologies, as summarized in Table 2. Each urban centre was assigned to one of these typologies for the three analysis periods: 1980–2000, 2000–2020, and 1980–2020.
LCRPGR classes (Section 4.3) were cross-tabulated with the trajectory typologies to evaluate how growth form and efficiency are interlinked. For each analysis period, the number and proportion of urban centres in each efficiency class were tabulated within every trajectory category. This tabulation enabled identification of which trajectory pathways were most frequently associated with efficient or inefficient outcomes, thereby providing an integrated perspective on how horizontal and vertical growth modalities shape LUE across time.

4.5. Statistical Assessment of Distributional Differences

To assess whether categorical distributions differed significantly, we applied the Chi-square (χ2) test of independence, complemented by Cramer’s V to indicate the strength of association between the variables [67]. First, we tested whether the distribution of LCRPGR classes differed significantly across the two multi-decadal periods. Second, we evaluated whether the prevalence of horizontally, balanced, and vertically dominant urban centres differed significantly across years. Third, we examined whether the distribution of growth typologies showed statistically significant shifts between the two multi-decadal periods, irrespective of efficiency outcomes. Fourth, we assessed whether these typology distributions changed significantly across periods when efficiency classes were considered separately. Finally, we tested whether efficiency classes were disproportionately associated with particular growth typologies in each period. For each analysis, we report the Chi-square statistic, degrees of freedom (df), p-value, and the strength of association (Cramer’s V), and we further inspected standardized residuals to identify the specific categories contributing most to the significant departures from independence.

4.6. Sensitivity Analysis

The sensitivity of the BUA–BUV trajectory framework was examined by varying the parameters used to classify prevailing built form and growth modality. First, for built form, we altered the zone of effective balance (see Section 3.2). The baseline for this zone was established using the 5th percentile of absolute orthogonal distances from the 1:1 line, calculated across all urban centers and years. We tested this against stricter (1st percentile) and looser (10th percentile) thresholds. For growth modality, slope partitions were adjusted from the baseline 0–30°/30–60°/60–90° scheme to alternative ranges of 0–25°/25–55°/55–90° and 0–20°/20–50°/50–90°. Built-form and typology assignments were recomputed for the three analysis periods (1980–2000, 2000–2020, and 1980–2020) and compared with the baseline using percentage agreement and Cohen’s kappa index [68,69].
Percentage agreement was evaluated using two complementary measures analogous to the well-established Producer’s and User’s accuracies in remote sensing accuracy assessment [68]. Class retention rate (analogous to Producer’s accuracy) quantified the share of urban centres assigned to a given class in the baseline and remained in that class under an alternative specification. At the same time, assignment purity (analogous to User’s accuracy) measured the share of urban centres assigned to a class in the alternative specification that also belonged to the same class in the baseline. Cohen’s kappa index was additionally reported to adjust for agreement expected by chance, thereby providing a more robust indicator of classification stability. Kappa (κ) values were interpreted following Landis and Koch’s [70] scale: <0.00 (poor), 0.00–0.20 (slight), 0.21–0.40 (fair), 0.41–0.60 (moderate), 0.61–0.80 (substantial), and 0.81–1.00 (almost perfect). These tests were exploratory rather than exhaustive, intended to illustrate the framework’s sensitivity to reasonable variations in classification parameters.

5. Results

5.1. Temporal Trends in LCR, PGR, and LCRPGR

The temporal dynamics of the SDG 11.3.1 metrics are summarized in Table 3, which presents values for all urban centres and further disaggregates the results by UN SDG Regions and WB Income Groups for additional context.
Between 1980–2000 and 2000–2020, the global median LCR decreased from 3.47% to 1.72%, indicating a notable deceleration in horizontal land expansion. The median PGR also declined, from 1.97% to 0.95%, though at a slower rate. Consequently, the median LCRPGR dropped from 1.67 to 1.05, suggesting improved alignment between land consumption and population growth. When evaluated over the 1980–2020 period, the global median LCR remained high at 3.44%, while the median LCRPGR reached 1.94.
At the regional level, most SDG regions exhibited decreasing LCR and PGR values from 1980–2000 to 2000–2020. For instance, “Europe” showed persistently low PGR values and relatively high LCRPGR, especially in the earlier period. “Eastern and South-Eastern Asia” and “Central and Southern Asia” exhibited high LCRs in 1980–2000, followed by substantial reductions in 2000–2020. In contrast, “Sub-Saharan Africa” and “Northern Africa and Western Asia” sustained high LCRs and PGRs in both periods, resulting in LCRPGR values near or slightly above 1. Meanwhile, “Oceania”, “Northern America”, and “Australia and New Zealand” showed declining median LCR and PGR values, with median LCRPGR ratios consistently below 1 in the later period.
Across income groups, the global trend of declining LCR and PGR was again evident. High-income urban centres showed the lowest median values in both indicators, with a median LCRPGR of 0.60 in 2000–2020, indicative of compact growth under demographic stability for this period. Lower-middle-income urban centres exhibited the highest LCRPGR values in all periods, including a 1980–2020 median value of 2.48, denoting continued inefficiency. Despite demonstrating high LCR and PGR, low-income urban centres improved their efficiency over time, with median LCRPGR decreasing from 1.43 to 0.82. Upper-middle-income urban centres showed a more balanced trajectory, with LCRPGR nearing 1.00 in the later period. Over the 1980–2020 period, the median LCRPGR values suggest that LUE does not increase monotonically with income level.

5.2. Spatiotemporal Patterns of Land Use Efficiency (LUE)

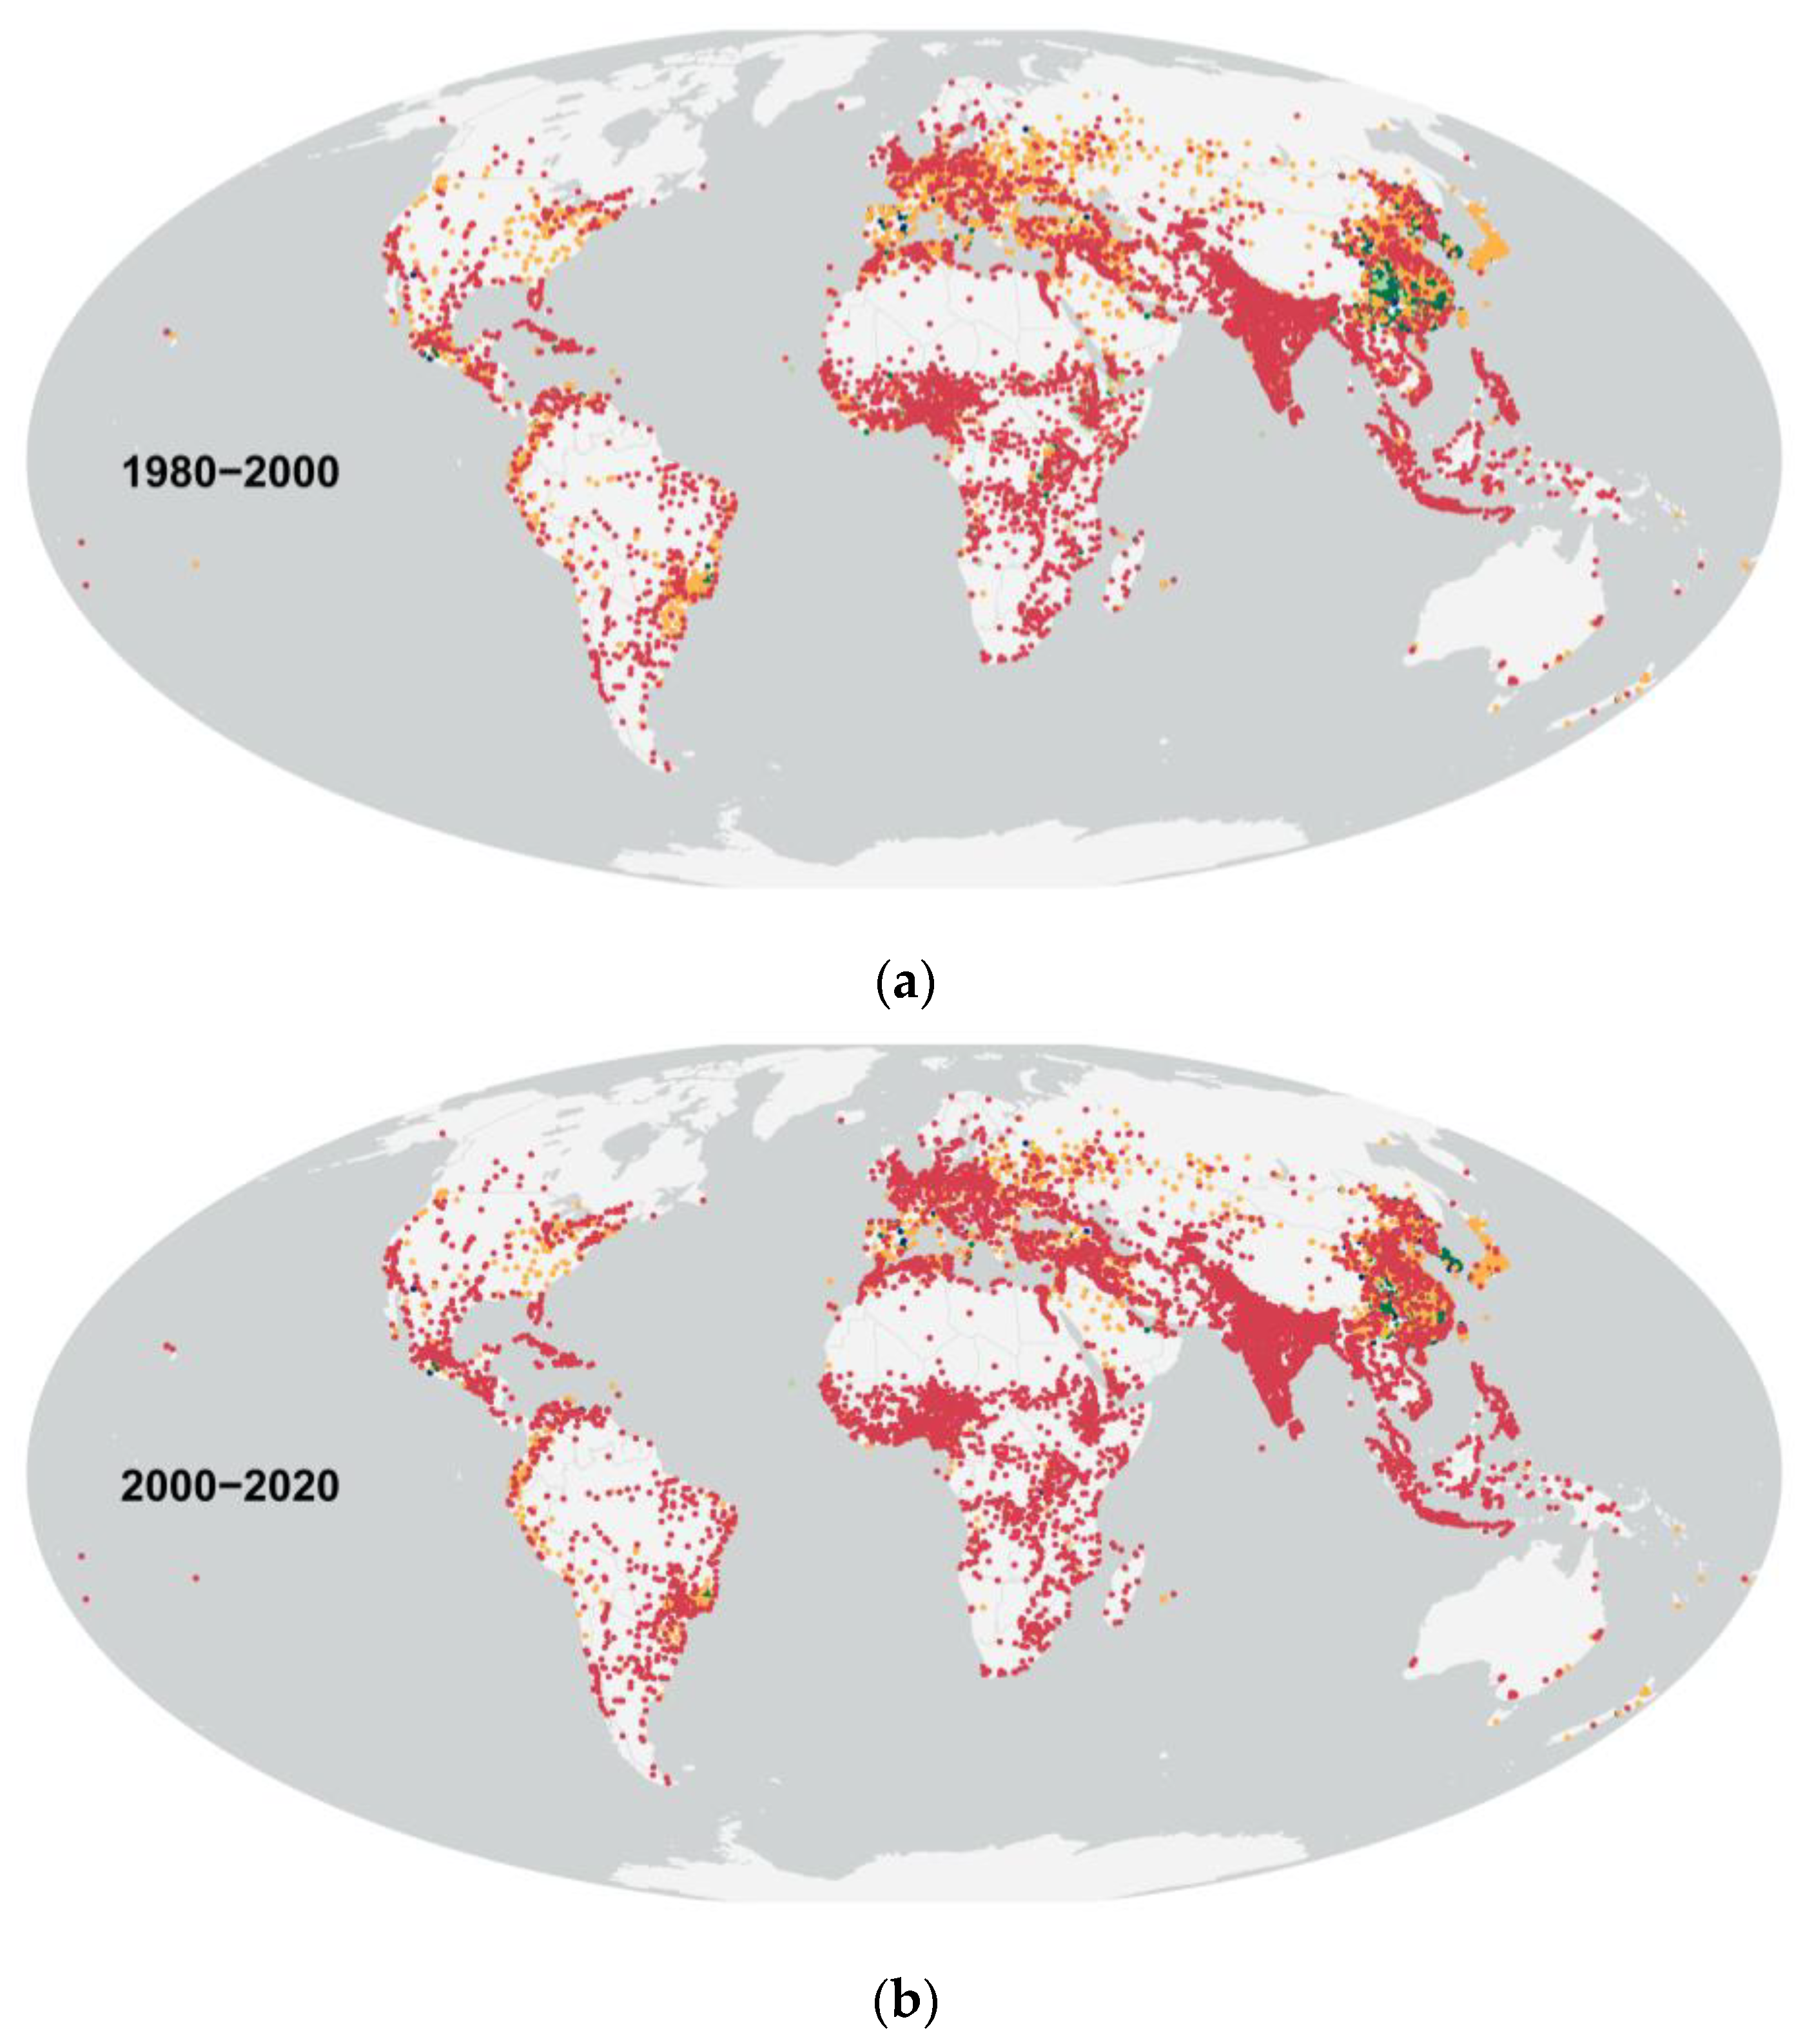
Figure 3 shows the spatial distribution of urban centres by LCRPGR class; their corresponding numerical distributions are provided in Supplementary Tables S2 and S3. Inefficient growth (LCRPGR > 1) was the most common outcome, affecting 7442 urban centres (69%) in 1980–2000 and 5610 (52%) in 2000–2020. The share of inefficiency due to demographic decline (LCRPGR ≤ 0) rose from 1009 (9%) to 2121 (20%), while the share of efficient centres (0 < LCRPGR ≤ 1) increased modestly, from 2405 (22%) to 3125 (29%). Statistical testing confirmed that these distributions differed significantly across the two periods (χ2 = 745.9, df = 2, p < 0.001; Supplementary Table S4). The effect size was small to moderate (Cramer’s V = 0.19), indicating that while the association between period and efficiency outcome was not strong, the shift was systematic and consistent across the global sample. Inefficient cases driven by land consumption were overrepresented in 1980–2000, whereas efficiency and demographic-decline cases were disproportionately common in 2000–2020. These results provide statistical evidence of a structural shift in efficiency outcomes, from widespread land-consumption-driven inefficiency in the earlier period toward a more mixed profile in the later period, marked by both efficiency gains and increasing inefficiency driven by demographic decline.
Regional concentrations of LUE outcomes further illustrate these shifts (Figure 3, Supplementary Table S2). In both periods, most inefficient cases were located in “Central and Southern Asia” and “Eastern and South-Eastern Asia,” totaling 4278 urban centres in 1980–2000 and 3329 in 2000–2020—more than twice the combined number recorded in “Northern Africa and Western Asia,” “Latin America and the Caribbean,” and “Europe.” While inefficiency from land consumption (LCRPGR > 1) declined over time, many urban centres did not transition to efficiency; instead, a portion remained inefficient due to persistently high LCR despite demographic decline. Inefficiency attributable to demographic decline (LCRPGR ≤ 0) was consistently concentrated in “Europe” and “Eastern and South-Eastern Asia” across both periods. By 2000–2020, however, this inefficiency class also expanded into “Sub-Saharan Africa” and “Central and Southern Asia.” The number of efficient centres (0 < LCRPGR ≤ 1) increased modestly, with the highest counts—each exceeding 300—found in “Eastern and South-Eastern Asia,” “Latin America and the Caribbean,” “Northern Africa and Western Asia,” and “Sub-Saharan Africa.”
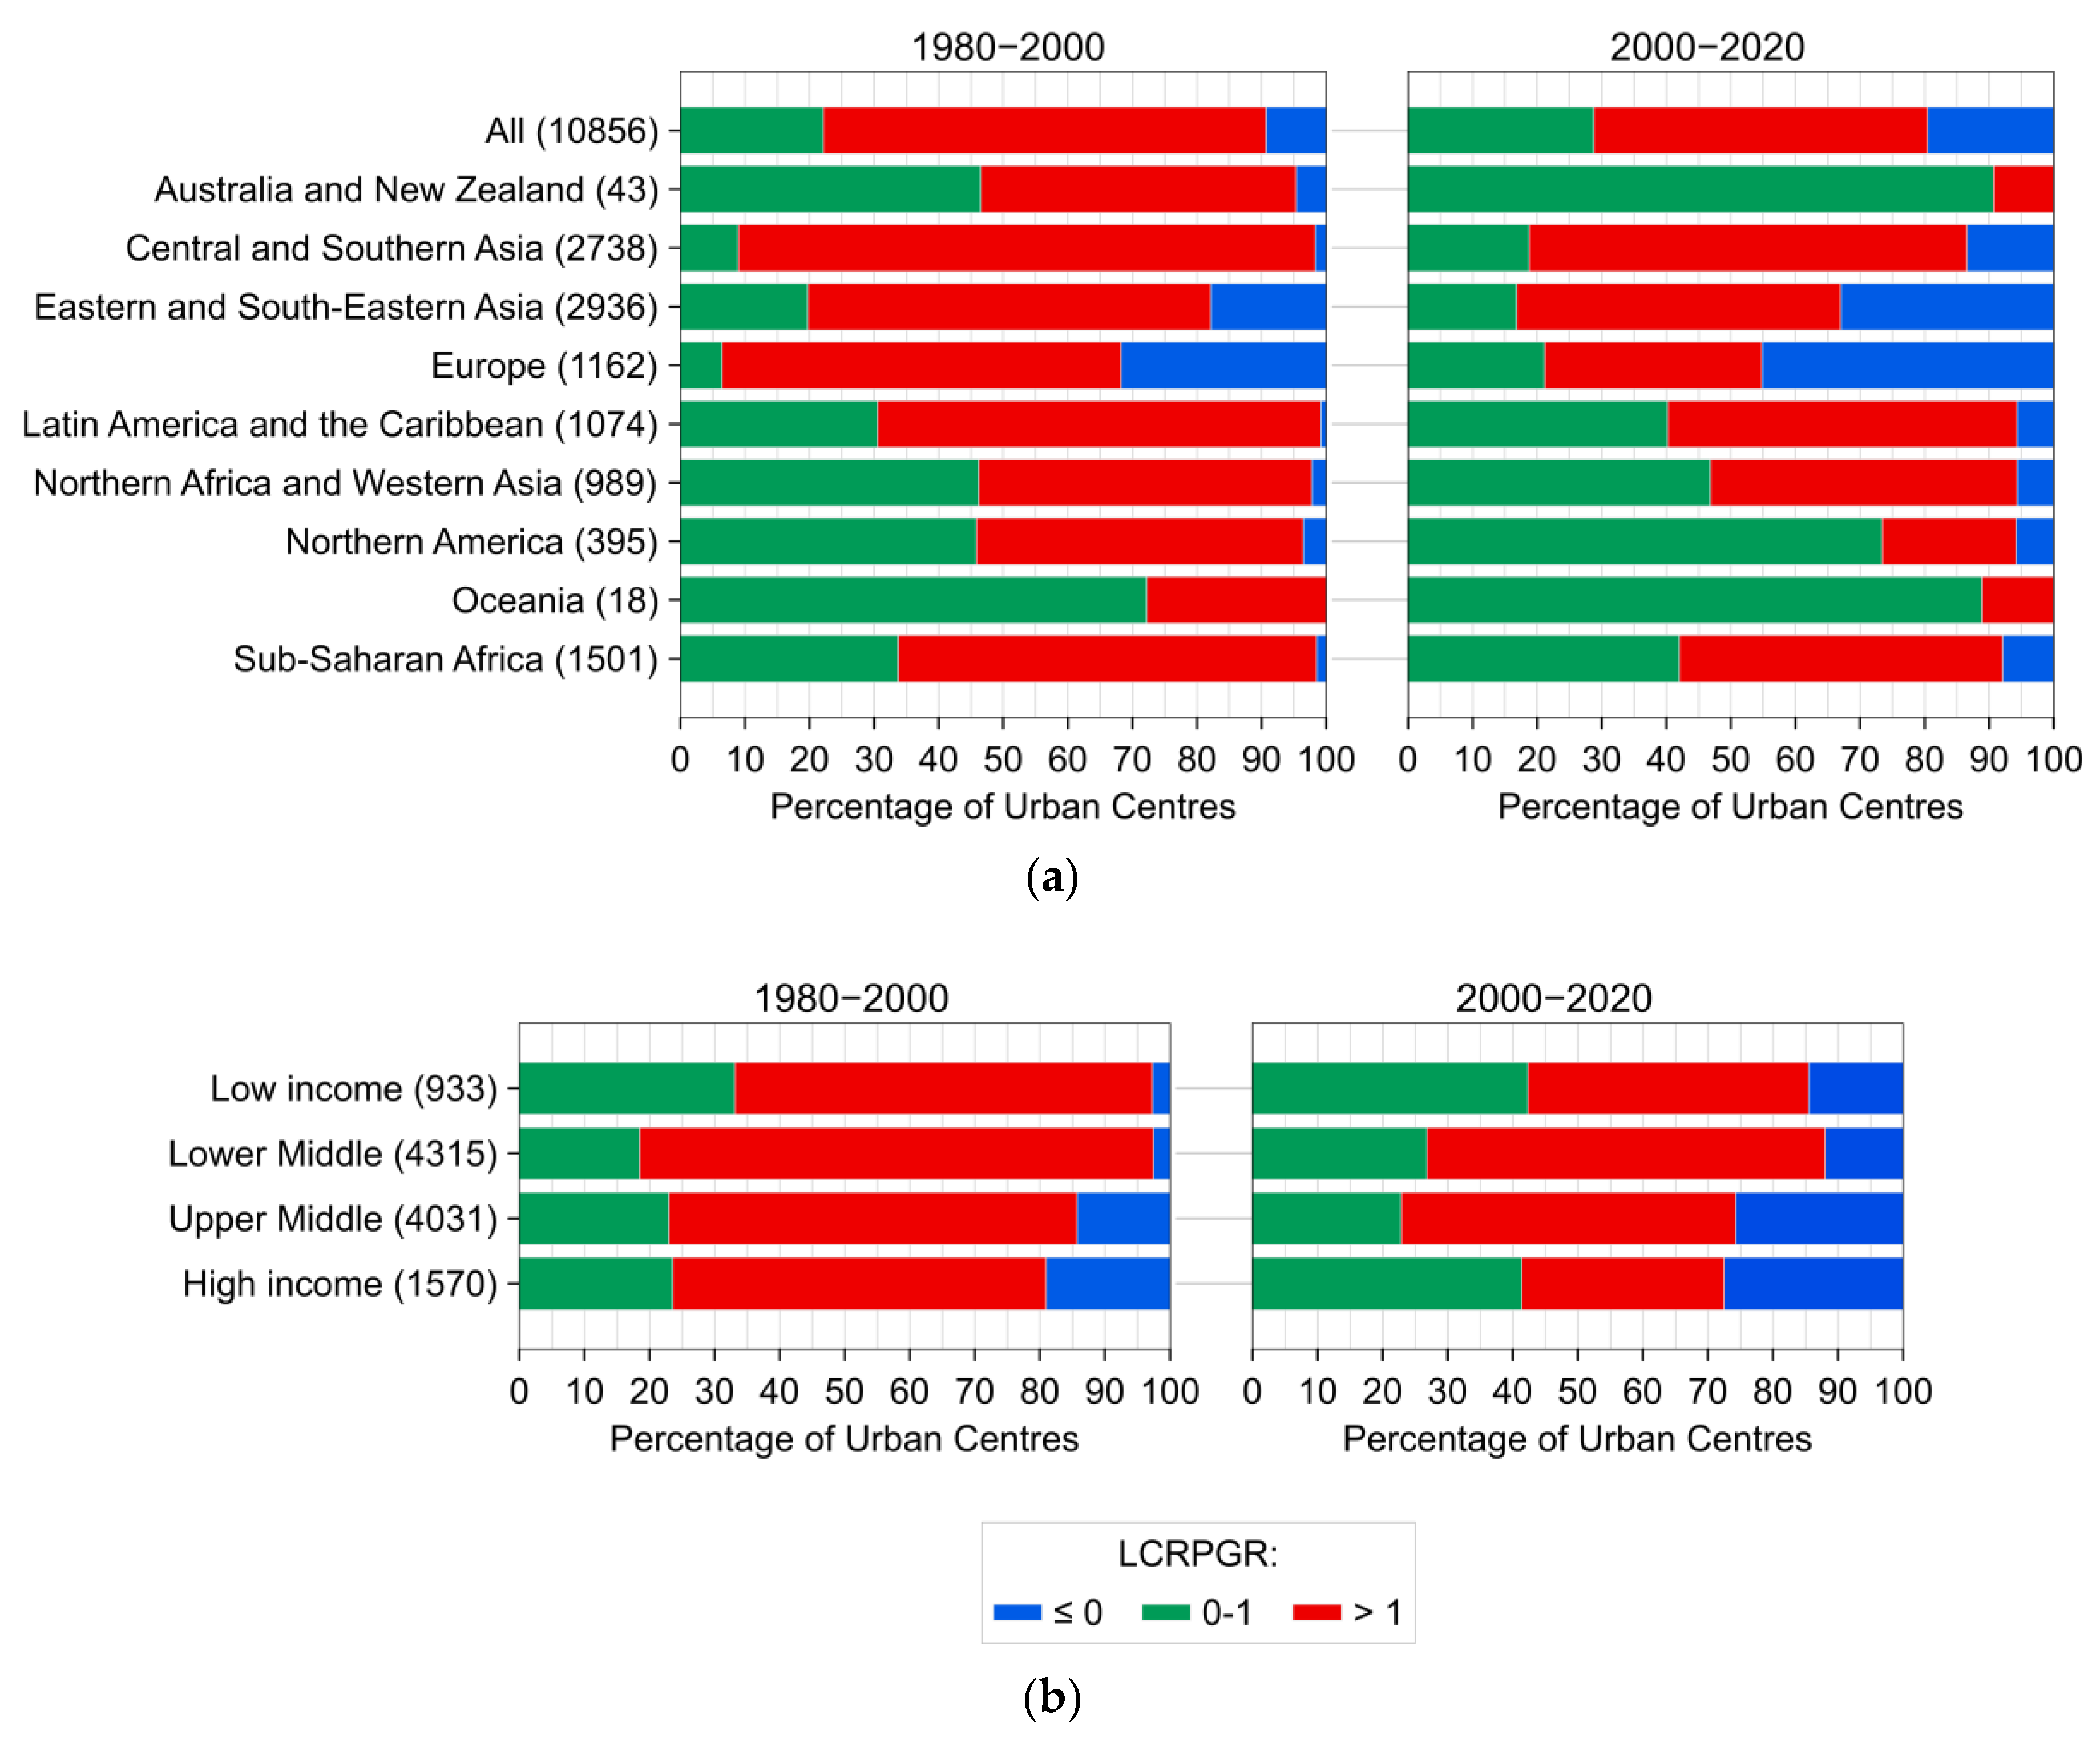
Complementing these distributions, Figure 4 shows relative class composition across regions and income groups, highlighting the persistent dominance of inefficient growth (LCRPGR > 1) of urban centres in lower-middle-income countries and the rising share of demographic-decline cases (LCRPGR ≤ 0) in upper-middle- and high-income contexts.

5.3. BUA-BUV Trajectories

The co-evolution of BUA and BUV from 1980 to 2020 is illustrated in Figure 5, which includes all urban centres (panels a–b) and the top 10 most populous urban centres (panels c–d). In the raw BUA–BUV space (panels a and c), cities such as Tokyo, Guangzhou, and Shanghai exhibit long trajectories extending toward the upper-right quadrant, indicating substantial absolute increases in both BUA and BUV. However, this representation primarily captures the scale and cumulative magnitude of growth, providing limited insight into each urban centre’s prevailing built form and directional characteristics relative to others. This plot alone is insufficient for reliably classifying urban centres by urban growth trajectory in a systematic or replicable manner.
Normalized trajectories (panels b and d), which rescale growth to a standard 0–1 range, allow for more meaningful comparisons across urban centres of varying size. Aided by the 1:1 line, these plots reveal heterogeneous developmental pathways. Some urban centres show steep upward trajectories aligned with vertical intensification, while others follow flatter paths consistent with horizontal expansion. For example, among the top 10 most populous urban centres, Tokyo, Guangzhou, and Seoul exhibit vertically oriented trajectories. Jakarta, Dhaka, and Manila maintain trajectories indicative of sustained horizontal growth. These contrasting patterns highlight the interpretive value of the trajectory framework in distinguishing spatial development strategies that are not readily discernible using absolute values alone.

5.4. Prevailing Built Forms of Urban Centres

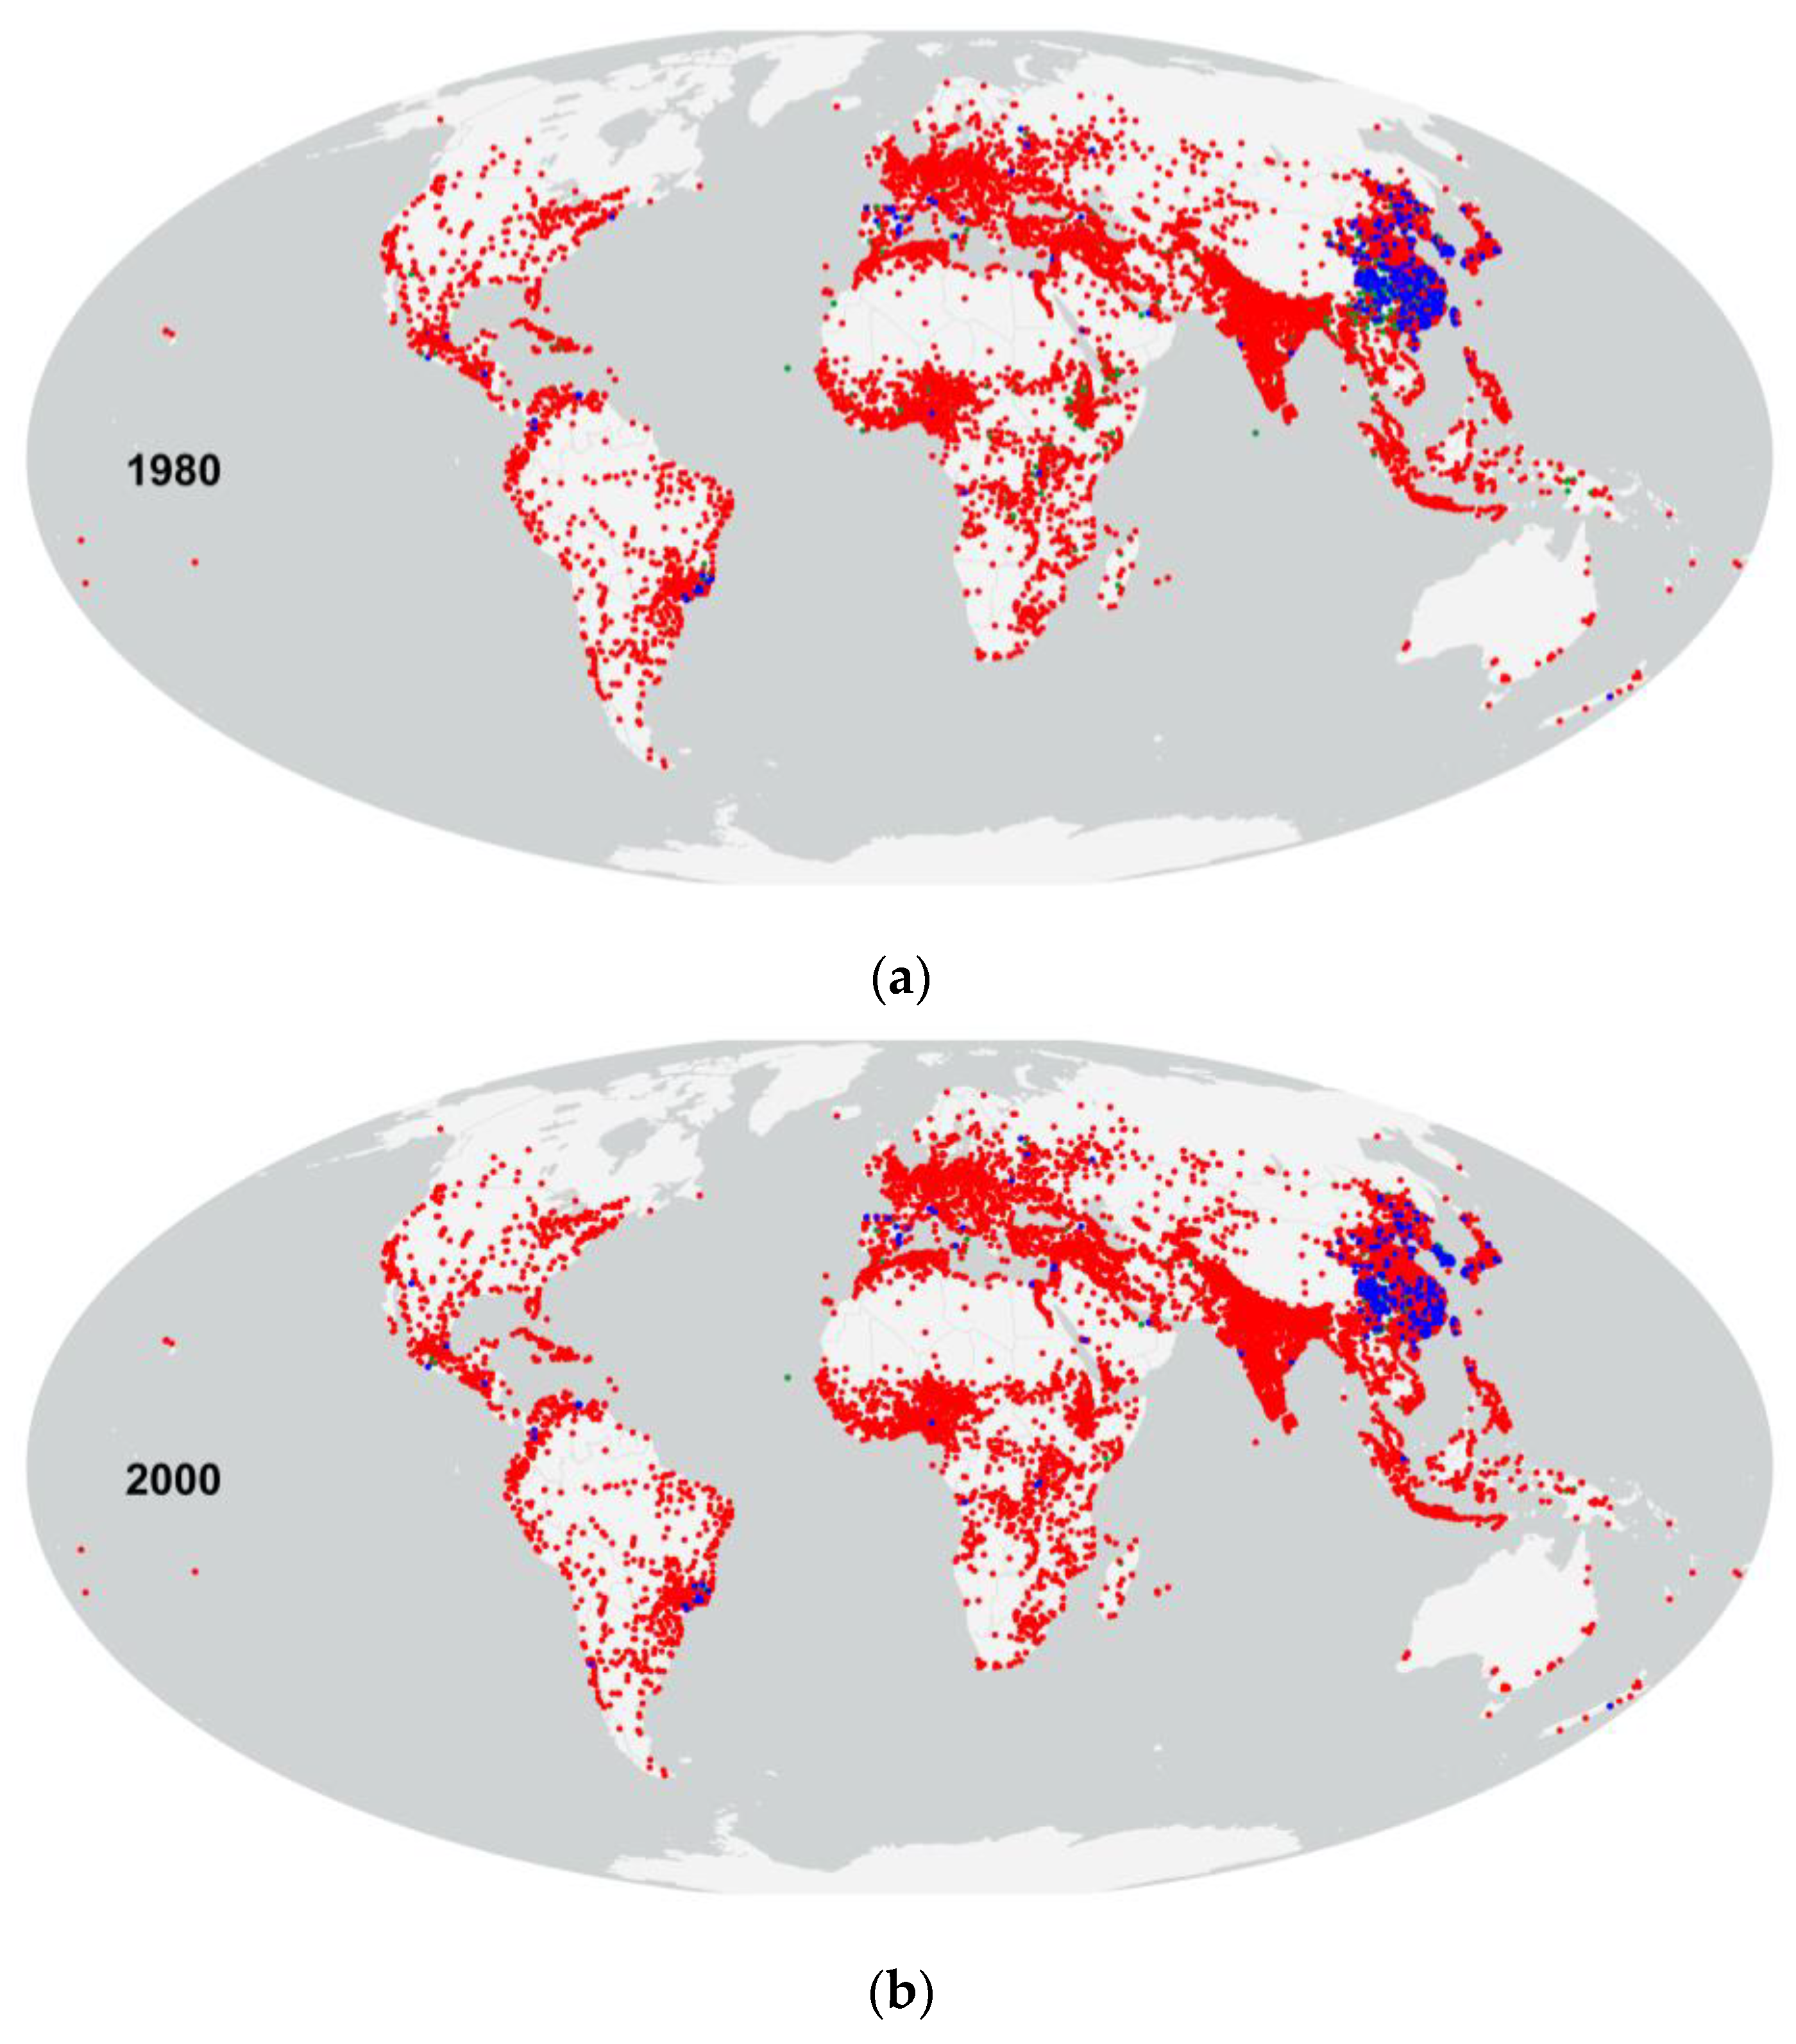
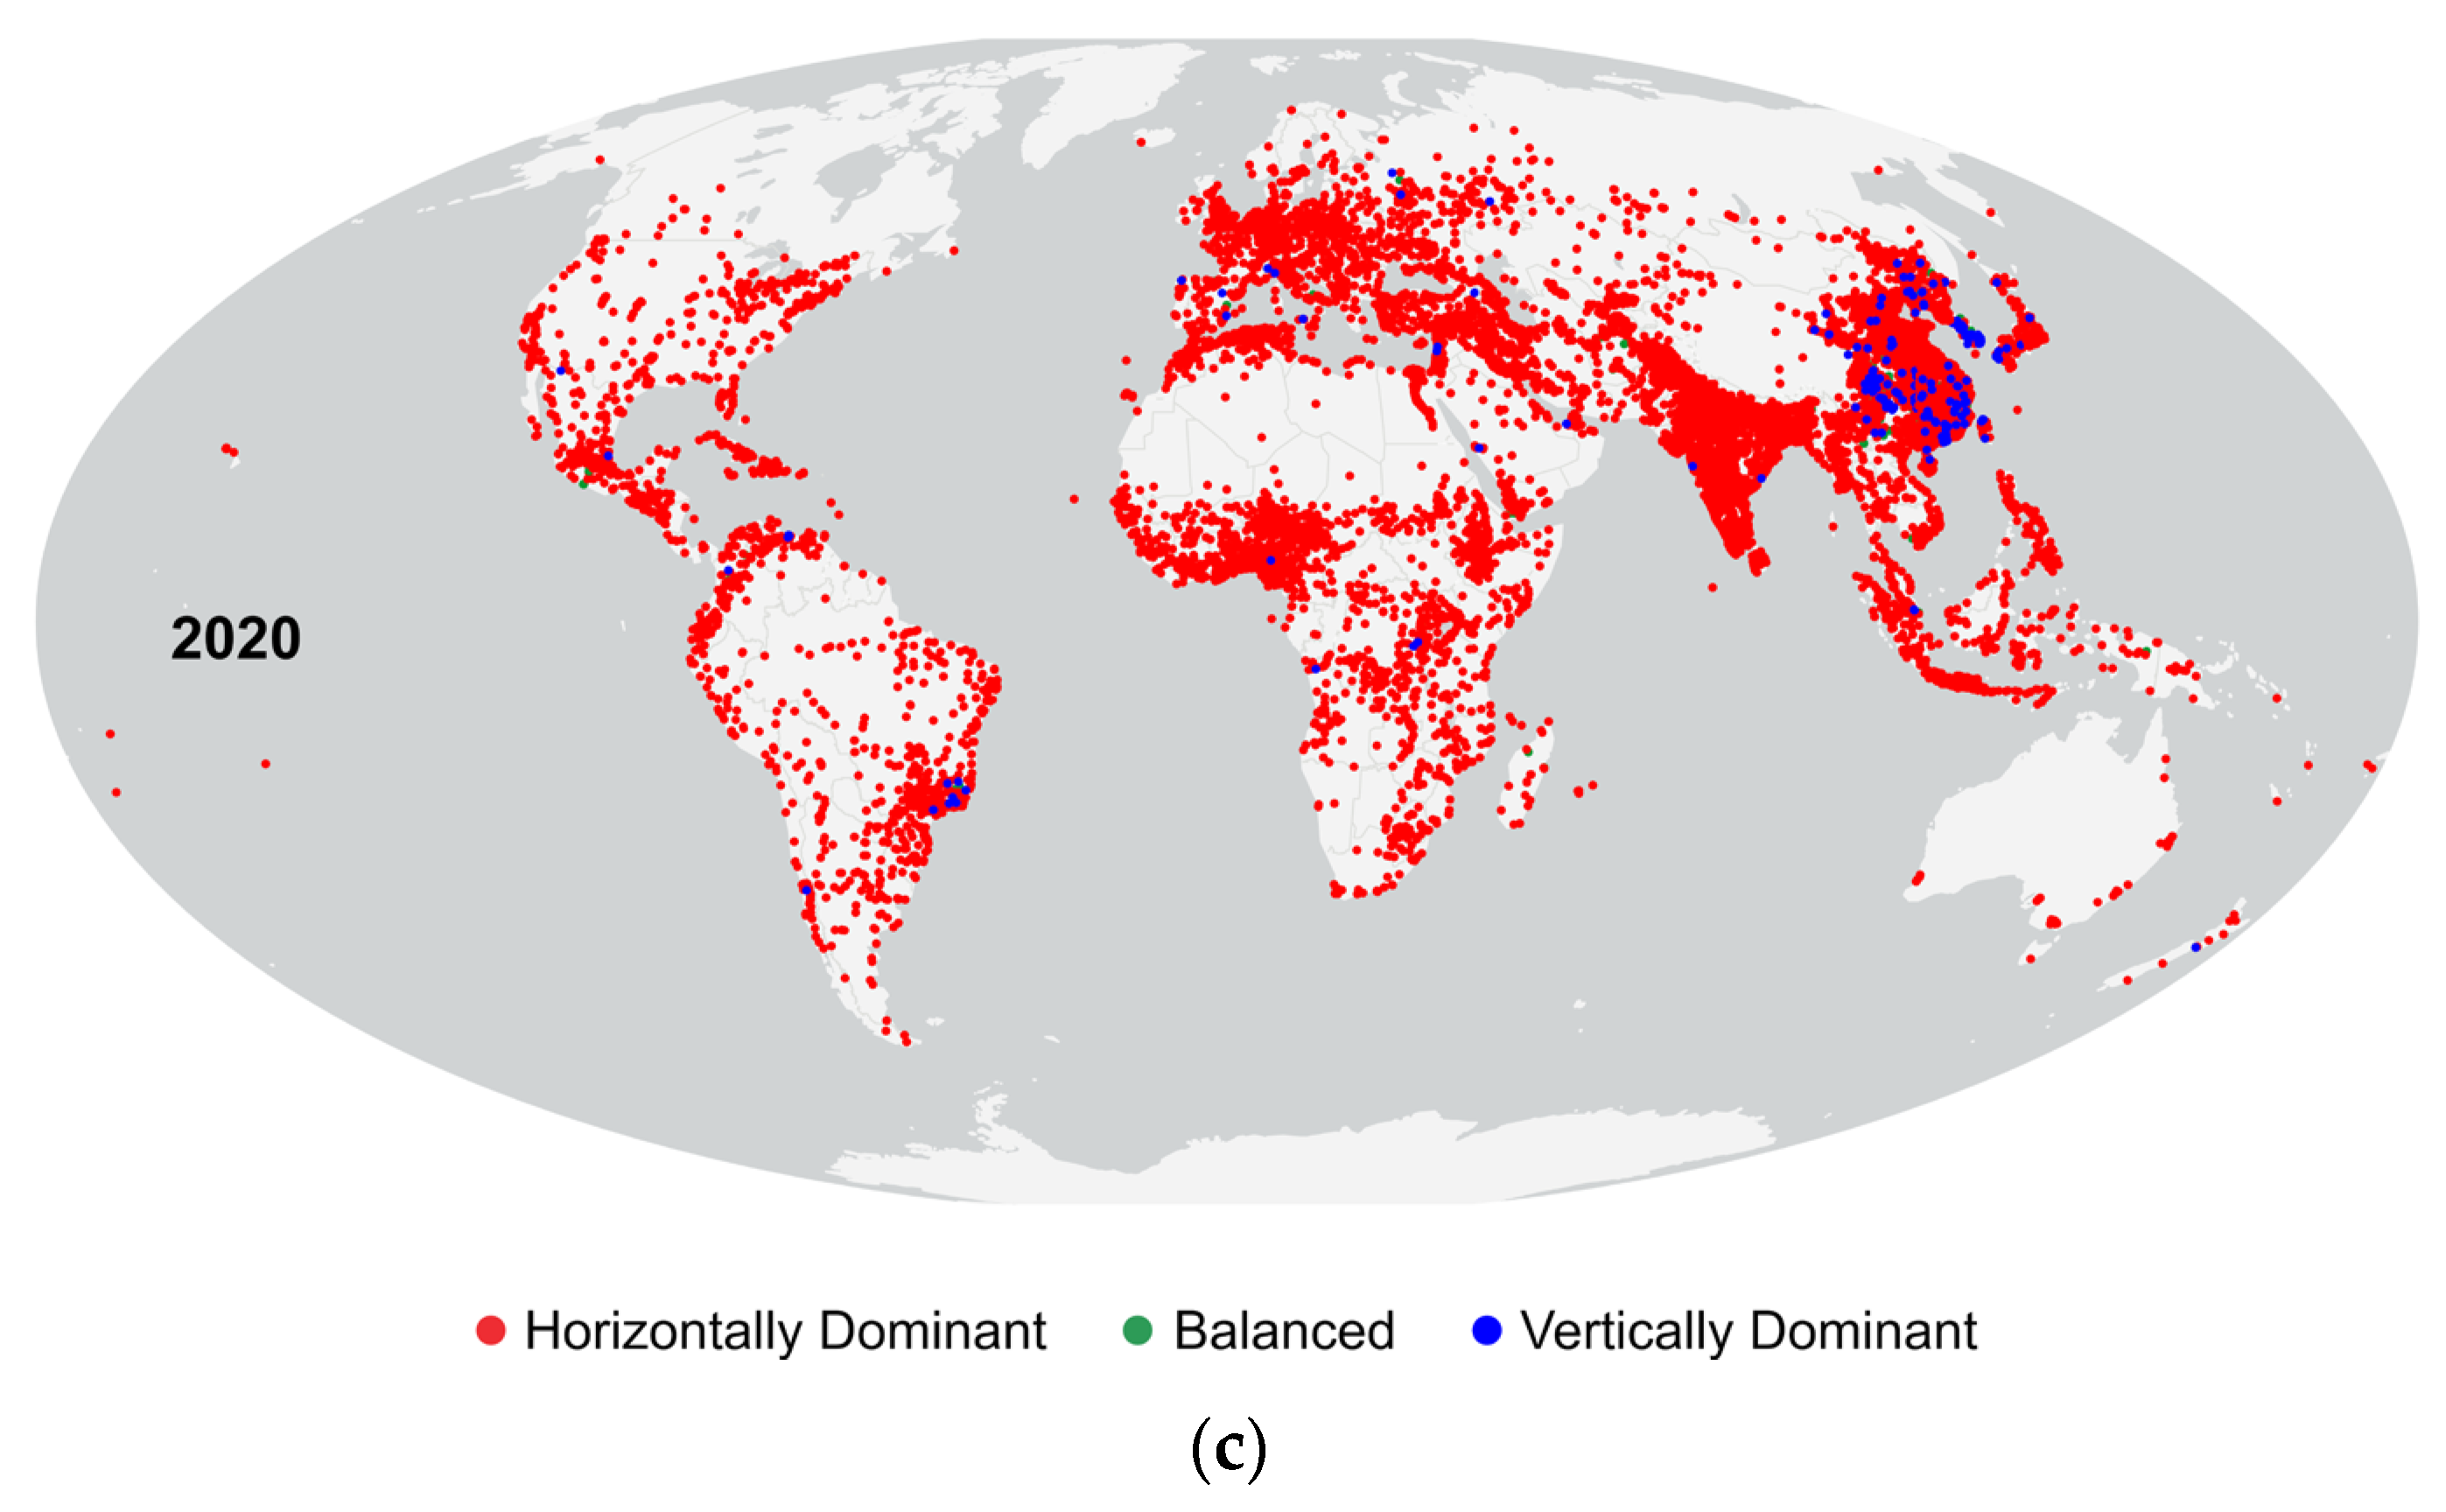
Figure 6 illustrates the evolving spatial distribution of prevailing built form types, while the corresponding numerical distributions are provided in Supplementary Tables S5 and S6. In 1980, most urban centres (9306 or 86%) were classified as horizontally dominant, while 1172 (11%) exhibited a balanced built form, and only 378 (3%) were vertically dominant. Horizontally dominant urban centres were geographically widespread, occurring across various SDG regions. In contrast, urban centres with balanced built forms were disproportionately concentrated in Asia, accounting for 76% of all balanced urban centres globally. Notably, Asia also hosted the highest number of vertically dominant urban centres, with 323 out of the 378 located primarily in countries such as China, Japan, and South Korea. By 2020, the proportion of horizontally dominant urban centres had increased to 97% (or 10,528 urban centres), while the shares of balanced and vertically dominant centres declined to 1% (143) and 2% (185), respectively, both categories remaining primarily concentrated in Asia.
Statistical testing confirmed these shifts in the global distribution of built forms are statistically significant. However, the strength of association is modest (χ2 test of independence, χ2 = 1266.9, df = 4, p < 0.001, Cramer’s V = 0.14; see Supplementary Table S7 for full test results). Balanced forms were disproportionately frequent in 1980 but declined sharply thereafter, while horizontal forms became increasingly more prevalent than expected if built form and time period were independent by 2020. Vertical forms, which were slightly overrepresented in 1980, fell to levels below those expected under independence by 2020. These results indicate a global shift toward horizontal dominance accompanied by a reduction in balanced and vertical forms over the four-decade period.

5.5. Trajectory Typologies of Urban Centres

Trajectory typologies derived from the normalized BUA–BUV space (Figure 5b) and their corresponding spatial distributions (Figure 7; Supplementary Tables S8–S13) reveal the dominant structural evolution pathways of urban centres. Over the 1980–2000 and 2000–2020 intervals, “Sustained Horizontal Growth” (Typology I) was the most common growth pattern. This typology accounted for 6307 (58%) urban centres in the earlier period, and rose to 74% in the latter, reinforcing horizontal expansion as the prevailing global trend. In both periods, urban centres in “Central and Southern Asia”, “Eastern and South-Eastern Asia”, and “Sub-Saharan Africa” collectively accounted for over 60% of all cities exhibiting this growth pattern.
“Moving Toward Vertical Balance” (Typology H) was the second most common growth pattern, accounting for 28% of urban centres in 1980–2000, but declining to 20% in 2000–2020. During the first period, this typology was concentrated mainly in “Eastern and South-Eastern Asia” and “Europe”, comprising approximately 53% of all urban centres in this category. By the end of the second period, “Eastern and South-Eastern Asia” significantly expanded its share, representing about 48% of urban centres under this typology. At the same time, most other regions experienced a decline in their numbers.
Typologies indicative of more structurally balanced or transitional growth, such as “Sustained Balanced Growth” (Typology E) and “Transitioning to Horizontal Growth” (Typology F), were relatively uncommon. Typology E, mostly observed in “Eastern and South-Eastern Asia”, declined from 6% to 2% between the two periods. Typology F similarly decreased from 5%, primarily concentrated in “Central and Southern Asia” and “Sub-Saharan Africa”, to just 0.7%.
Typologies associated with substantial vertical intensification (A: Vertical Intensification, D: Transitioning to Vertical Growth, and G: Vertical Rise from Horizontal Base) were absent in both periods. Typology B (Balanced Growth in Vertical Context) was observed in approximately 3% of all urban centres in both periods. This typology was heavily concentrated in “Eastern and South-Eastern Asia”, which accounted for over 80% of all urban centres in this class. Typology C (Horizontal Expansion in Vertical Context) was observed in only 6 (or 0.06%) urban centres in 2000–2020, all located in “Eastern and South-Eastern Asia” and in “Europe”.
The Chi-square analysis further demonstrated that trajectory typology distributions varied significantly across the three multi-decadal periods (χ2 = 888.2, df = 5, p < 0.001; Cramer’s V = 0.20; Supplementary Table S14). The association strength was moderate, just like in the previous analysis of prevailing built forms, yet the standardized residuals reveal systematic shifts in growth pathways. In 1980–2000, balanced and transitional types (Typologies E and F) as well as movements toward vertical balance (Typology H) occurred more frequently than expected if typology and period were independent. By 2000–2020, these categories fell to levels well below those expected under independence, while “Sustained Horizontal Growth” (Typology I) was strongly overrepresented. These results point to the consolidation of horizontal expansion as the dominant long-term trajectory, coupled with the retreat of balanced and transitional growth forms.

5.6. Linking Urban Growth Typologies to Efficiency Outcomes

Figure 8 shows the percentage distribution of BUA–BUV trajectory typologies across the three LCRPGR-based LUE classes (LCRPGR ≤ 0, 0–1, and >1) for 1980–2000 and 2000–2020, with corresponding numerical values reported in Supplementary Tables S15 and S16.
For 1980–2000, the LCRPGR ≤ 0 class was dominated by Typology I (Sustained Horizontal Growth; 349 of 1009 centres, 35%) and Typology H (Moving Toward Vertical Balance; 449 centres, 44%). This dominance indicates that even under stagnant or declining population conditions, many urban centres continued to expand outward, while a substantial share showed partial shifts toward vertical balance. The LCRPGR > 1 class, also denoting inefficiency, was largely represented by Typology I (4478 of 7442 centres, 60%), reinforcing the link between horizontal expansion and spatial inefficiency. The efficient class (0 < LCRPGR ≤ 1) was likewise dominated by Typology I (1480 of 2405 centres, 62%), demonstrating that proportional growth between land consumption and population can still occur within predominantly horizontal trajectories.
The dominance of Typology I persisted into the 2000–2020 period. Around 60% of urban centres with LCRPGR ≤ 0 (1283 of 2121) followed a sustained horizontal growth trajectory, as did 4205 of the 5610 centres with LCRPGR > 1. Even among efficient centres, horizontal expansion was predominant, with 2570 of 3125 (82%) classified under Typology I.
Across all LCRPGR classes and both periods, vertical and balanced typologies (e.g., B and E) remained relatively rare. This scarcity suggests that compact or vertically intensifying development has yet to emerge as a widespread structural pathway, even among urban centres deemed efficient under the SDG 11.3.1 standard. Typology B (Balanced Growth in Vertical Context) reflects efficiency achieved within a vertical-dominant regime, while Typology E (Sustained Balanced Growth) indicates proportional growth in both horizontal and vertical dimensions. Both can be regarded as structurally sustainable trajectories, yet their combined presence was minimal. In the 2000–2020 period, only 47 urban centres followed Typology B and 16 followed Typology E while also achieving efficient land utilization.
Chi-square tests confirmed that these typology distributions differed significantly across periods within each efficiency class (p < 0.001 in all cases; Supplementary Tables S18–S20). The strength of association was consistently moderate, with Cramer’s V values of 0.26 for LCRPGR ≤ 0, 0.21 for LCRPGR > 1, and 0.24 for 0 < LCRPGR ≤ 1, indicating systematic though not strong shifts in composition over time. Additional tests across efficiency classes within each period also showed significant associations (p < 0.001 in all cases; Cramer’s V = 0.17 for 1980–2000, and 0.13 for 2000–2020; Supplementary Tables S21 and S22). These effect sizes point to weaker but still significant links between efficiency outcomes and growth typologies, with standardized residuals highlighting the persistent overrepresentation of sustained horizontal growth and the underrepresentation of structurally sustainable forms.

5.7. Sensitivity of the BUA-BUV Framework

5.7.1. Effect of Thresholds on Prevailing Built Form

With the period 2000–2020 as a case example, adjusting the threshold used to define the zone of effective balance influenced the stability of the prevailing built form classifications (Figure 9, Table 4). The most pronounced changes were observed in the balanced category (Figure 9). Under the stricter 1st percentile threshold, only about one-quarter of the centres classified as balanced in the baseline scheme were retained (25% in both 2000 and 2020), while all horizontal and vertical cases remained stable. Assignment purity was perfect for balanced cases (100%) but dropped for vertical cases (80–87%), indicating that many borderline vertical centres were reallocated. Horizontal cases maintained very high purity (98–99%). Overall agreement with the baseline was 98% in 2000 and 99% in 2020, but Cohen’s kappa index declined to 0.77–0.81, reflecting reduced reliability once chance agreement is accounted for.
Conversely, widening the balance zone to the 10th percentile substantially expanded the balanced class. In this case, balanced cases achieved full retention (100%) but lower assignment purity (50–57%), reflecting the inclusion of many centres classified initially as horizontal or vertical. Horizontal and vertical classes retained high purity (100%) but somewhat lower retention (97–99% and 85–91%, respectively). Overall agreement remained high (97% in 2000; 99% in 2020), and kappa values increased slightly (0.78–0.85) relative to the 1st percentile threshold, spanning the substantial to almost perfect range.
The collapsed analysis, in which balanced cases were contrasted against all others, confirmed the higher sensitivity of the balanced category. For the 1st percentile threshold, kappa dropped to 0.40 in both 2000 and 2020, corresponding to only fair agreement. In contrast, the 10th percentile threshold yielded stronger performance and substantial agreement with the baseline, with kappa improving to 0.65 in 2000 and 0.72 in 2020.
These results demonstrate that horizontal and vertical assignments are insensitive primarily to threshold shifts, while the balanced class is strongly parameter-dependent. The balance category either contracts sharply under stricter definitions or expands markedly under looser ones, leading to systematic variations in retention, assignment purity, overall agreement, and kappa.

5.7.2. Effect of Slope Parameters on Trajectory Typology

The stability of trajectory typology classifications relative to the baseline scheme varied depending on the threshold and slope partition applied (Table 5 and Table 6). Adjusting only the percentile threshold (1st, 5th, 10th) while keeping the baseline slope partition resulted in minimal change, with overall agreement remaining very high (97–98%) and κ = 0.93–0.94, indicating almost perfect agreement. In contrast, altering the slope partitions substantially reduced stability: the 0–25°/25–55°/55–90° partition produced agreement of 73–76% with κ = 0.51–0.55 (moderate), while the 0–20°/20–50°/50–90° partition yielded only 49–51% agreement with κ = 0.24–0.27 (fair). These results show that overall classification agreement is far more sensitive to slope partitioning than to percentile threshold choice.
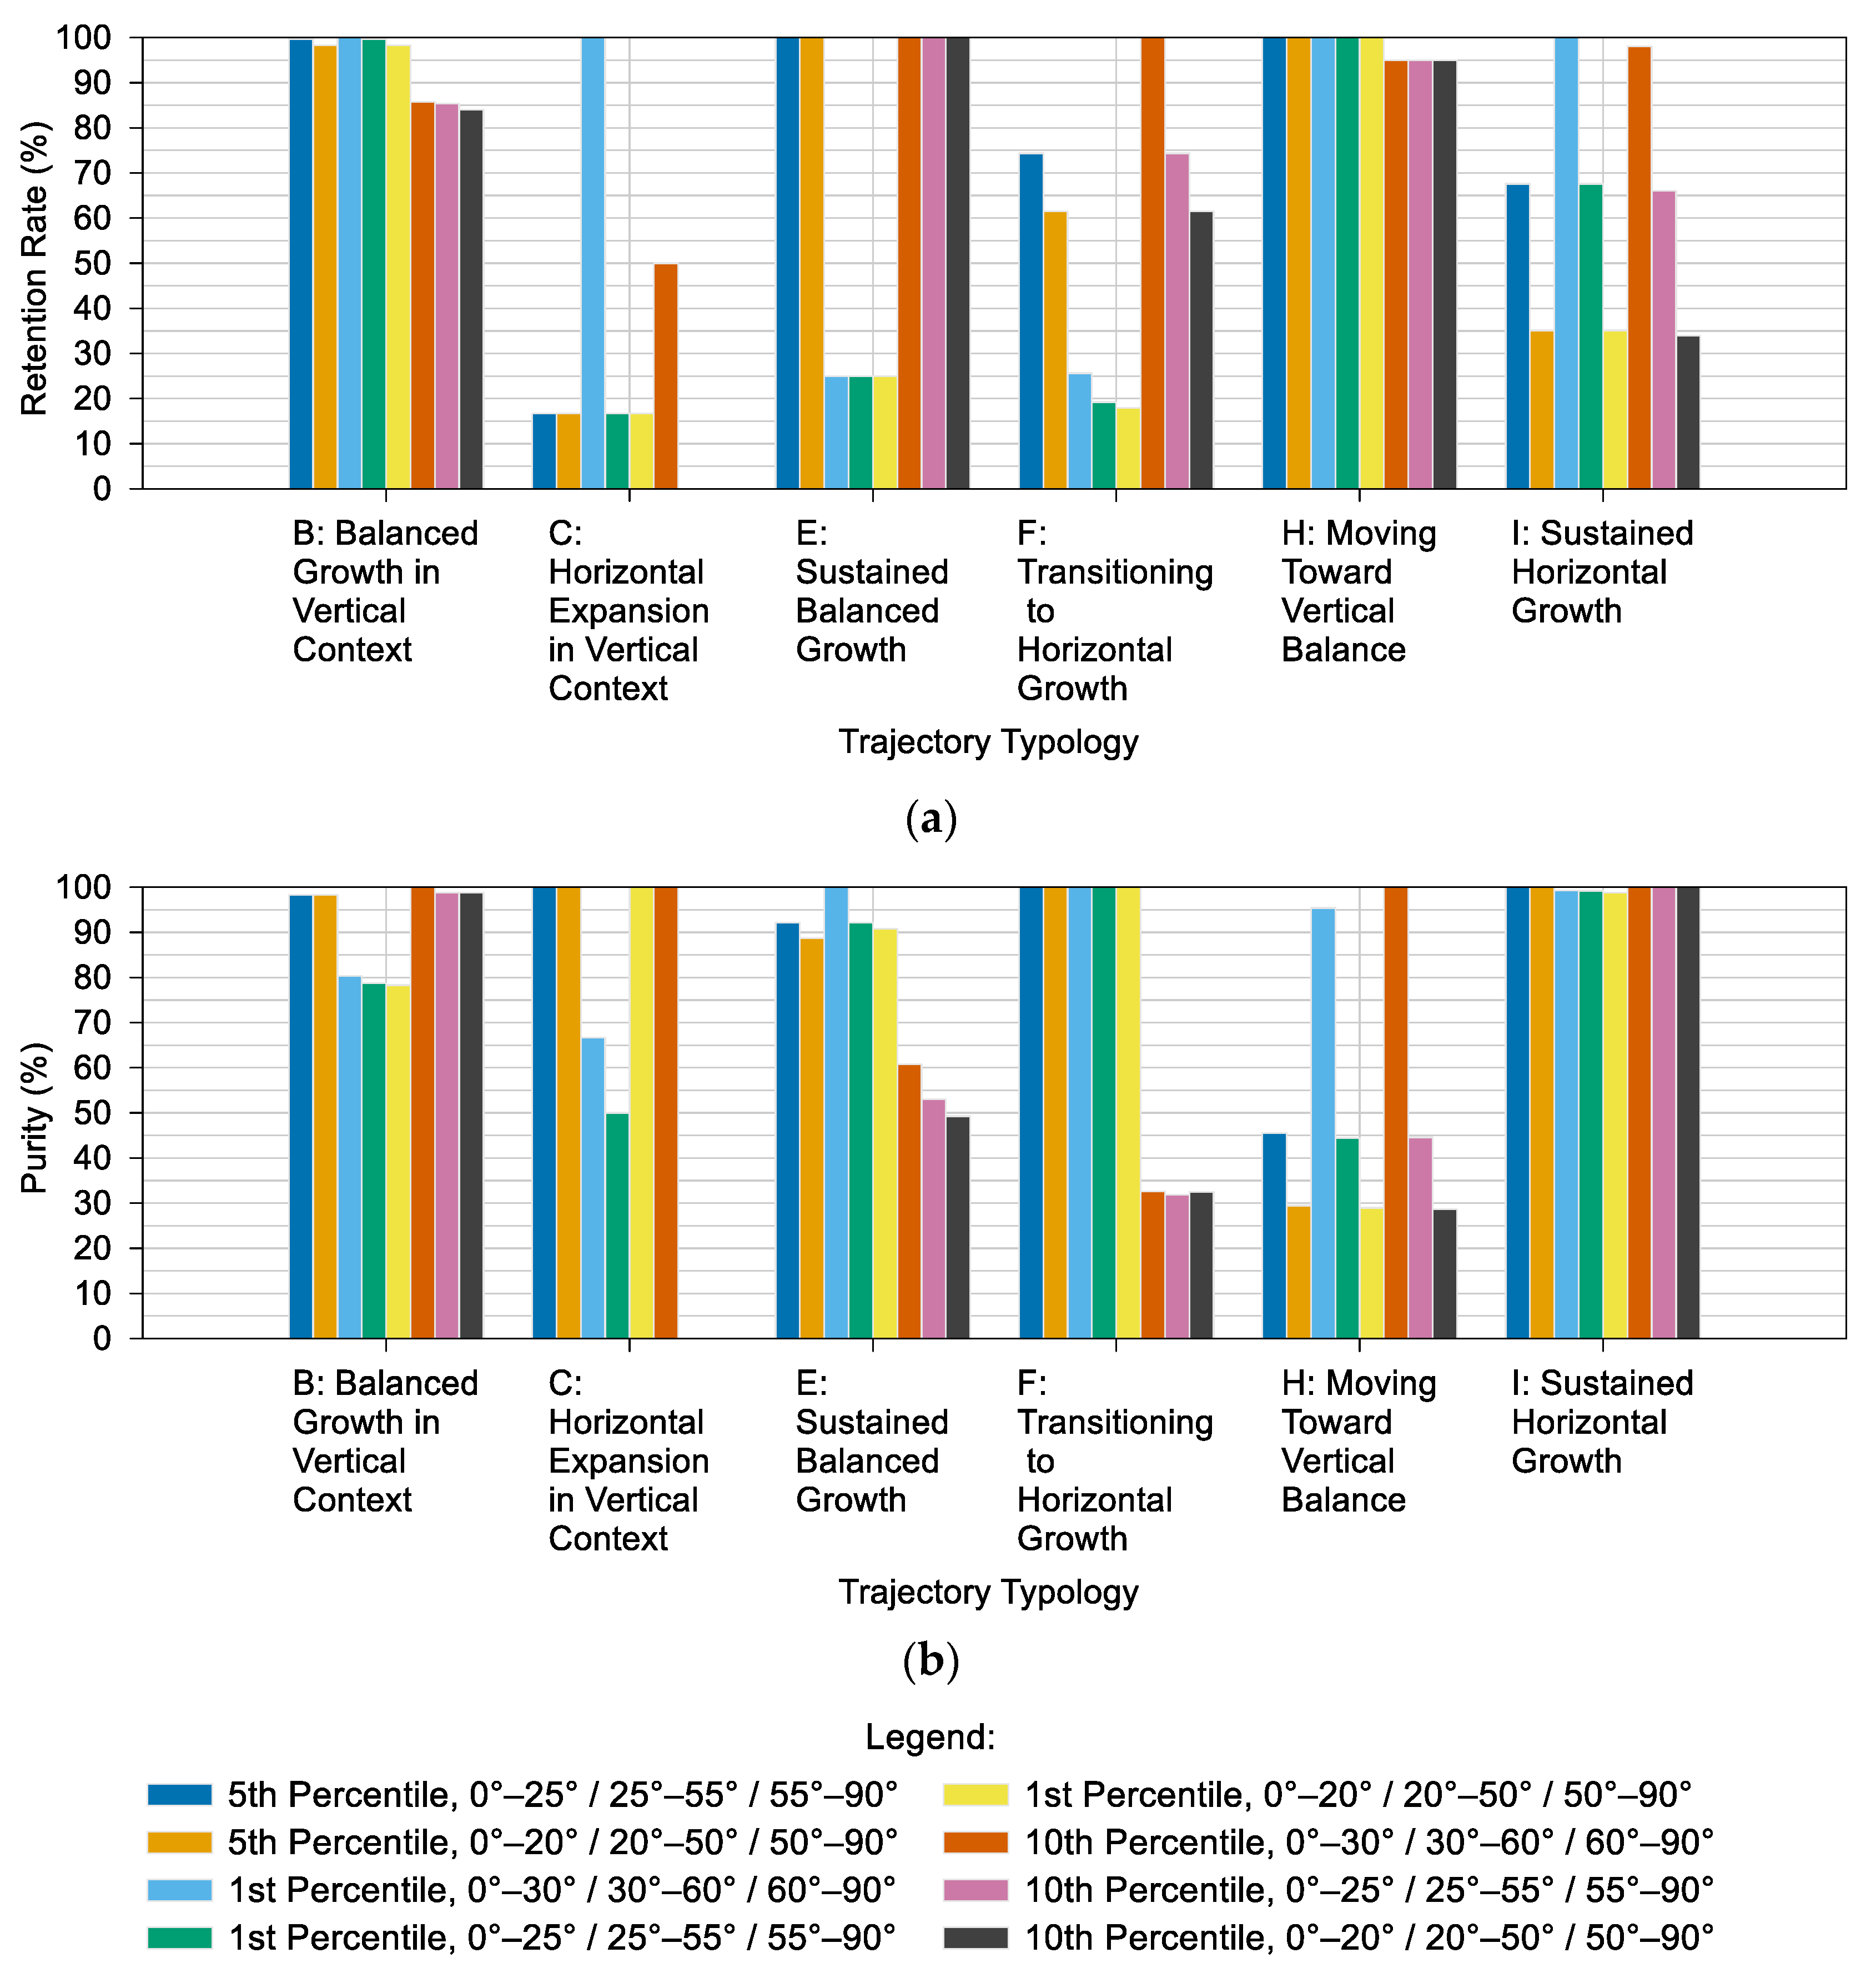
Beyond overall agreement, the detailed retention and purity analysis highlights how parameter combinations differentially affect individual trajectory categories (Figure 10). Balance-related typologies (B, E, H) show high retention stability across most parameterizations, but purity is sensitive to slope partitioning, with H particularly prone to misclassification. Horizontal-leaning categories (C, F, I) exhibit the most substantial volatility, with retention rates often collapsing under alternative settings. Stricter balance thresholds (1st percentile) fragment transitional classes, while looser thresholds (10th percentile) inflate balance categories (e.g., E, H) at the expense of purity. This finding indicates that typology distributions are not invariant and that parameterization choices significantly affect the allocation of transitional and horizontal categories, even when dominant balance groups remain stable.

6. Discussion

6.1. Enhanced Interpretation of Efficiency Outcomes Through Built-Up Volume Integration

We have demonstrated that the BUA–BUV trajectory framework enhances the interpretation of efficiency outcomes under SDG 11.3.1 by revealing not only whether urban growth is efficient, but also how that efficiency is associated with structural form. The conventional LCRPGR indicator, even when considered alongside its LCR and PGR components, can only show whether efficiency stems from reduced land consumption or from demographic dynamics, as in the case when urban centres are classified solely by their LCRPGR values. Because LCRPGR’s calculation relies solely on built-up area, its two-dimensional formulation captures outward expansion but cannot account for vertical growth. Our findings confirm this limitation: urban centres with fundamentally different trajectories, such as those following sustained horizontal growth and those exhibiting balanced growth in a vertical context, were both classified as “efficient” under LCRPGR, despite reflecting structurally divergent pathways (Figure 8).
Integrating the vertical dimension through built-up volume addresses this limitation. By considering BUV alongside BUA within a single trajectory framework, it becomes possible to distinguish efficiency that results from genuine densification from efficiency that simply reflects slower sprawl or demographic change. This added vertical dimension allows growth patterns to be traced and directly linked to efficiency outcomes, clarifying whether compactness arises from vertical expansion, constrained outward growth, or population dynamics without structural improvement. As demonstrated in our analysis, pairing the framework with LCRPGR transforms SDG 11.3.1 monitoring from a purely outcome-based assessment into a diagnostic tool that can reveal the structural sustainability, or fragility, of observed efficiency gains. Applying this framework at a global scale reveals distinct and persistent patterns in how urban centres have structurally evolved over the past four decades. This explicit structural integration is a key innovation absent in earlier global LUE studies.

6.2. Global Patterns of Built Form and Growth Modality

The analysis of BUA–BUV trajectories from 1980 to 2020 reveals that although most urban centres experienced significant increases in both built-up extent and volume, their normalized trajectories underscore strongly contrasting structural modes of growth. A dominant pattern is the persistence of horizontally oriented built form, accompanied by a decline in balanced and vertically dominant forms over time. Typology I (Sustained Horizontal Growth) remained the most prevalent across both periods, underscoring the global predominance of outward expansion as the prevailing urban model. In contrast, typologies associated with marked vertical expansion (A, D, G) were rare, while transitional trajectories (C, F) appeared only intermittently, suggesting that shifts toward more balanced or vertical configurations remain exceptions rather than the rule.
These findings are consistent with earlier global assessments, which have repeatedly documented horizontal expansion as the principal mode of urban growth [26,71,72]. The concentration of vertically dominant trajectories in Asian urban centres corroborates prior studies by Liu et al. [16] and Frolking et al. [25], which highlighted the regional prominence of high-rise intensification in large Asian metropolises. However, in line with those studies, our results emphasize that vertical intensification remains geographically constrained and secondary at the global scale. While compact vertical urbanism is often highlighted in sustainability debates as a desirable model for reducing land consumption and enhancing density [18,73,74,75], the empirical evidence presented here suggests that the dominant global trajectory of urban development continues to favor outward sprawl rather than upward consolidation.

6.3. Intersection of Structural Dynamics and Efficiency Metrics

Temporal trends in LCR, PGR, and LCRPGR suggest a movement toward improved efficiency from 2000 onwards, echoing results from earlier GHSL-based global assessments [6,15,33]. However, the framework clarifies that these improvements are not necessarily linked to vertical intensification. Although the number of inefficient urban centres (LCRPGR > 1) declined from 69% in 1980–2000 to 52% in 2000–2020, horizontal expansion remained dominant across all efficiency classes. Even efficient centres (0 < LCRPGR ≤ 1) were primarily associated with sustained horizontal growth rather than compact forms. Conversely, vertical and balanced typologies remained marginal, even where centres exhibited favorable LCRPGR values.
This divergence highlights that numerical efficiency does not always align with structural compactness. Improvements in LCRPGR may stem from slower expansion or demographic stabilization, rather than genuine densification. Similarly, vertical intensification may initially appear inefficient if not matched by population growth, producing lagged efficiency gains. These findings emphasize that efficiency outcomes cannot be interpreted reliably without structural context, as LCRPGR alone risks obscuring the mechanisms driving observed values.
This concern is corroborated by Taubenböck et al. [72], who found that global urban expansion between 1985 and 2015 resulted in structurally less dense cities, as newly developed areas were dominated by low-density morphologies despite demographic densification of older cores. Their scenario analysis revealed a substantial “lost potential” for compact development, consistent with our finding that efficiency gains in LCRPGR often reflect horizontal expansion or demographic change rather than vertical intensification. These results underscore the importance of complementing efficiency metrics with structural diagnostics to avoid misinterpretations of urban sustainability.

6.4. Structural Sustainability and Policy Implications

The alignment—or misalignment—between efficiency metrics and structural growth has critical implications for urban policy. Our results show that many urban centres classified as “efficient” under SDG 11.3.1 continue to follow predominantly horizontal trajectories. While such centres may achieve efficiency numerically, their form implies higher long-term infrastructure costs, fragmented service delivery, and larger carbon and ecological footprints [76].
These insights indicate that SDG 11.3.1 monitoring should move beyond outcome-based thresholds and incorporate structural diagnostics such as the BUA–BUV trajectory framework. For policy, this means that urban efficiency assessments can no longer be limited to ratios of land consumption and population growth, but should also evaluate how land is consumed. Embedding trajectory-based diagnostics into monitoring systems would allow policymakers to achieve the following:
  • Identify unsustainable pathways early, flagging urban centres where apparent efficiency masks sprawl-driven growth that may lock in high resource use [77].
  • Promote densification through measures such as transit-oriented development [78,79] and mixed-use zoning [80], focusing on areas where vertical growth is both practical and necessary.
  • Differentiate regional strategies by promoting vertical or balanced growth in land-scarce contexts [81], while focusing on managed expansion in regions with lower demographic pressure.
  • Support transitional pathways by recognizing centres currently in mixed or evolving forms (e.g., moving toward vertical balance) and ensuring these shifts are reinforced through infrastructure and governance interventions [82,83].
These implications highlight the importance of reframing SDG 11.3.1 monitoring as both an evaluative and diagnostic tool. The BUA–BUV trajectory framework can help cities and regions align urban growth management with broader goals of resilience, inclusivity, and low-carbon development by revealing whether efficiency outcomes are underpinned by sustainable structural forms.

6.5. Limitations and Future Work

The findings of this study should be interpreted with recognition of several caveats and limitations. First, the use of normalized BUA and BUV values entails certain interpretive constraints. Global min–max transformation ensures that all urban centres can be compared on a standardized scale, which is essential for consistent typology classification. However, this emphasis on relative tendencies comes at the cost of absolute magnitudes. Because global min–max normalization uses the largest cities to set the upper bound, a few megacities determine the scale, which compresses the relative positions of most small- and mid-sized centres and makes their differences appear less pronounced. In addition, skewed distributions can lead to mid-range values appearing more similar than they are in absolute terms. While this approach inevitably simplifies the diversity of urban centre sizes, it provides a transparent and reproducible basis for global comparison, which is precisely the purpose of the framework. Users of the results should therefore recognize normalization as both a methodological necessity and a trade-off, balancing comparability with the potential loss of local detail.
Second, the prevailing built form and growth modality classifications are contingent on the parameter settings employed in the BUA–BUV framework, particularly the definition of the zone of effective balance and the slope partitions used to differentiate horizontal, balanced, and vertical growth. While these thresholds were partly informed by distributional properties of the dataset, they remain operational choices. The sensitivity analysis demonstrated that altering these thresholds affects typology assignments, with percentage agreement and Cohen’s kappa index revealing moderate to substantial reassignments across scenarios. This sensitivity of the typology assignments underscores that while the framework is informative for comparative analysis, its results are not absolute descriptors of urban morphology, and conclusions must be considered within the bounds of the applied parameterization.
Third, the framework is based on BUA and BUV values aggregated at the level of entire urban centres. This formulation assumes homogeneity of built form and growth dynamics within each centre, meaning that intra-urban variability, such as districts simultaneously undergoing horizontal expansion and vertical densification, cannot be represented. While this assumption is necessary for global-scale comparability, it may mask important sub-city dynamics that influence sustainability outcomes.
Fourth, the reliance on GHSL-derived built-up area and volume estimates in the GHS-UCDB 2025 introduces data-related limitations. Although these products represent state-of-the-art global EO-based information, they are subject to uncertainties in input datasets, classification algorithms, and temporal harmonization, which were not explicitly quantified or incorporated in this study. Vertical estimates, in particular, depend on building height models that may have regional biases. Consequently, while the results capture robust global patterns, local-scale deviations from ground reality cannot be excluded.
Fifth, the analysis relied on a filtered version of the GHS-UCDB 2025, where urban centres with extreme LCRs and PGRs were excluded. While this step was necessary to ensure methodological consistency, it also means that the assessment is incomplete and that the reported distributions do not cover the complete global set of urban centres. Moreover, because normalization statistics for BUA and BUV were derived from the reduced sample, the resulting balance thresholds may not fully reflect the entire spectrum of built-up characteristics. Consequently, the classification of prevailing forms and trajectories may be biased, particularly at the extremes of the distribution.
Finally, this study relied on three benchmark years (1980, 2000, 2020) to minimize the influence of precision limitations even though the GHS-UCDB 2025 dataset provides built-up and population estimates at 5-year intervals. The built-up and volume information was derived from 100-m GHSL layers, which, while suitable for global-scale analysis, constrain the detection of finer-scale structural changes. Shorter temporal intervals may not reliably capture meaningful change at this resolution, as uncertainties in the underlying data can obscure incremental variations. Consequently, intermediate fluctuations or transitional dynamics in urban growth may remain undetected.
Beyond methodological concerns, comparative interpretations using the BUA–BUV framework must also be approached with caution. Urban growth trajectories are shaped by changes in the built environment, topographic constraints, and broader socioeconomic, institutional, and cultural dynamics. Structurally similar trajectories may thus emerge from fundamentally different urbanization processes. In many contexts, vertical growth may support sustainability goals by limiting the expansion of impervious surfaces and preserving non-urban land. In this paper, vertical development is therefore framed as potentially more sustainable in terms of mitigating horizontal land take, rather than being intrinsically preferable to horizontal expansion. However, vertical densification may also entail trade-offs, such as increased urban heat accumulation and reduced air circulation [84]. These broader environmental and social consequences necessitate careful, context-sensitive interpretation when evaluating the sustainability of observed urban growth patterns.
Further work should extend the framework by testing alternative parameterizations and incorporating more temporally resolved and finer-resolution EO data to capture short-term, non-linear dynamics better. Addressing uncertainties in the input datasets and propagating them through the framework would also enhance the reliability of the results, ensuring that typology assignments and efficiency assessments are not unduly driven by data errors or biases. In addition, applying the framework to other global EO data products would enable evaluation of the robustness and comparability of results across datasets. The framework should also be applied at more local scales, such as analyzing cities within a single country or metropolitan region, to evaluate how well the typologies capture subnational growth dynamics. Such localized applications would not only enable validation against detailed ground data and provide insights into nationally specific development pathways, but also account for intra-urban variability, where different districts may follow divergent horizontal or vertical growth trajectories. Such extensions would test the framework’s transferability from global to national, metropolitan, and intra-urban contexts, thereby strengthening its usefulness for trajectory-based assessments of urban land use efficiency. Future work should also explore integrating functional or socioeconomic indicators (e.g., population density, infrastructure, economic activity) to complement the structural diagnostics provided by BUA–BUV trajectories and to better explain why particular growth pathways emerge.

7. Conclusions

This study introduced the Built-up Area–Built-up Volume (BUA–BUV) trajectory framework as a complementary approach to SDG 11.3.1 monitoring, integrating vertical and horizontal dimensions of urban growth into assessments of land use efficiency. Applied to 10,856 urban centres worldwide from 1980 to 2020, the framework revealed that global improvements in LCRPGR were rarely driven by vertical intensification. Instead, horizontal expansion remained the predominant trajectory, confirming earlier global assessments and underscoring that outcome-based efficiency metrics can obscure structural forms that carry long-term sustainability risks.
The principal contribution of this work is to show that linking efficiency assessments with trajectory typologies enables a more diagnostic interpretation of SDG 11.3.1. In doing so, it strengthens the interpretability, comparability, and policy relevance of LCRPGR by clarifying whether efficiency outcomes are associated with horizontal sprawl, vertical densification, or balanced forms of growth. The BUA–BUV trajectory framework thus provides a scalable means to capture the structural pathways of urbanization and to better align global monitoring with the objectives of sustainable, inclusive, and resilient urban development.

Supplementary Materials

The following supporting information can be downloaded at: https://www.mdpi.com/article/10.3390/ijgi14100404/s1, Figure S1: Boxplots of Land Consumption Rate (LCR), Population Growth Rate (PGR), and the LCR-to-PGR ratio (LCRPGR) for the 10,856 urban centres; Figure S2: Boxplots of Land Consumption Rate (LCR), Population Growth Rate (PGR), and the LCR-to-PGR ratio (LCRPGR) for the 10,856 urban centres, grouped by UN SDG regions; Figure S3: Boxplots of Land Consumption Rate (LCR), Population Growth Rate (PGR), and the LCR-to-PGR ratio (LCRPGR) for the 10,856 urban centres, grouped by World Bank income group; Table S1: Built-up area (BUA, km2) and built-up volume (BUV, km3), together with their normalized values, for the hypothetical city examples shown in Figure 1; Table S2: Distribution of LCRPGR values across global urban centres for the periods 1980–2000, 2000–2020, and 1980–2020 by UN SDG Regions; Table S3: Distribution of LCRPGR values across global urban centres for the periods 1980–2000, 2000–2020, and 1980–2020 by World Bank Income Group; Table S4: Chi-square (χ^2) test of independence for LCRPGR class distributions across two multi-decadal periods (1980–2000 and 2000–2020); Table S5: Distribution of urban centres by prevailing built forms across UN SDG regions; Table S6: Distribution of urban centres by prevailing built form across World Bank Income Groups; Table S7: Chi-square (χ^2) test of independence for prevailing built form distributions across years (1980, 2000, 2020); Table S8: Distribution of urban centres by trajectory typology across UN SDG regions: 1980–2000; Table S9: Distribution of urban centres by trajectory typology across World Bank Income Group: 1980–2000; Table S10: Distribution of urban centres by trajectory typology across UN SDG Region: 2000–2020; Table S11: Distribution of urban centres by trajectory typology across World Bank Income Group: 2000–2020; Table S12: Distribution of urban centres by trajectory typology across UN SDG Region: 1980–2020; Table S13: Distribution of urban centres by trajectory typology across World Bank Income Group: 1980–2020; Table S14: Chi-square (χ^2) test of independence for trajectory typology distributions across two multi-decadal periods (1980–2000 and 2000–2020); Table S15: Distribution of urban centres by LUE class and trajectory typology: 1980–2000; Table S16: Distribution of urban centres by LUE class and trajectory typology: 2000–2020; Table S17: Distribution of urban centres by LUE class and trajectory typology: 1980–2020; Table S18: Chi-square (χ^2) test of independence for trajectory typology distributions across two multi-decadal periods (1980–2000 and 2000–2020) for LCRPGR ≤ 0; Table S19: Chi-square (χ^2) test of independence for trajectory typology distributions across two multi-decadal periods (1980–2000 and 2000–2020) for LCRPGR > 1; Table S20: Chi-square (χ^2) test of independence for trajectory typology distributions across two multi-decadal periods (1980–2000 and 2000–2020) for 0< LCRPGR ≤ 1; Table S21: Chi-square (χ^2) test of independence for trajectory typology distributions across LUE classes for the period 1980–2000; Table S22: Chi-square (χ^2) test of independence for trajectory typology distributions across LUE classes for the period 2000–2020.

Author Contributions

Conceptualization, Jojene Santillan; methodology, Jojene Santillan; data curation, Jojene Santillan; formal analysis, Jojene Santillan; visualization, Jojene Santillan; writing—original draft preparation, Jojene Santillan; writing—review & editing, Jojene Santillan, Mareike Dorozynski, Christian Heipke; project administration, Jojene Santillan; funding acquisition, Jojene Santillan; supervision, Christian Heipke. All authors have read and agreed to the published version of the manuscript.

Funding

This research received no external funding.

Data Availability Statement

The GHS-UCDB 2025 (GHS-UCDB R2024A) dataset used in this study is publicly available at https://human-settlement.emergency.copernicus.eu/ghs_ucdb_2024.php. The files employed in the analysis were downloaded from this source on 30 December 2024. Derivative datasets produced during the study are available from the corresponding author upon reasonable request.

Acknowledgments

J. Santillan acknowledges the support of the Department of Science and Technology–Science Education Institute (DOST–SEI), Philippines, through its Foreign Graduate Scholarships in Priority S&T Fields Program, and Caraga State University, Philippines, for providing a doctoral scholarship and fellowship. The authors also acknowledge the European Commission Joint Research Centre (EC-JRC) for making the GHS-UCDB 2025 dataset freely available. We further extend our gratitude to the six anonymous reviewers for their constructive comments and suggestions, which substantially improved the quality of this manuscript.

Conflicts of Interest

The authors declare no conflicts of interest. The funders had no role in the design of the study; in the collection, analyses, or interpretation of data; in the writing of the manuscript; or in the decision to publish the results.

Abbreviations

The following abbreviations are used in this manuscript:
3DLUI3D Land Use Index
B3DIBuilding 3D Density Index
BUABuilt-up Area
BUVBuilt-up Volume
dfDegrees of Freedom
EOEarth Observation
GHSGlobal Human Settlement
GHSLGlobal Human Settlement Layers
GHS-UCDBGlobal Human Settlement Urban Centre Database
κCohen’s kappa index
LCRLand Consumption Rate
LCRPGRRatio of LCR to PGR
LiDARLight Detection and Ranging
LUELand Use Efficiency
pp-value
PGRPopulation Growth Rate
SDGSustainable Development Goal
UNUnited Nations
VHGVertical-to-Horizontal Growth ratio
WBWorld Bank

References

  1. Stokes, E.C.; Seto, K.C. Characterizing Urban Infrastructural Transitions for the Sustainable Development Goals Using Multi-Temporal Land, Population, and Nighttime Light Data. Remote Sens. Environ. 2019, 234, 111430. [Google Scholar] [CrossRef]
  2. UN DESA 68% of the World Population Projected to Live in Urban Areas by 2050, Says UN. Available online: https://www.un.org/en/desa/68-world-population-projected-live-urban-areas-2050-says-un (accessed on 31 August 2025).
  3. Mahendra, A.; Seto, K.C. Upward and Outward Growth: Managing Urban Expansion for More Equitable Cities in the Global South; World Resources Report, Towards a More Equal City; World Resources Institute: Washington, DC, USA, 2019. [Google Scholar]
  4. UN Department of Economic and Social Affairs. Sustainable Development Goal 11. Available online: https://sdgs.un.org/goals/goal11 (accessed on 7 May 2025).
  5. UN Statistics Division SDG Indicator Metadata (Harmonized Metadata Template—Format Version 1.0). Last Updated 2021-03-01. Available online: https://unstats.un.org/sdgs/metadata/files/Metadata-11-03-01.pdf (accessed on 27 December 2024).
  6. Estoque, R.C.; Ooba, M.; Togawa, T.; Hijioka, Y.; Murayama, Y. Monitoring Global Land-Use Efficiency in the Context of the UN 2030 Agenda for Sustainable Development. Habitat Int. 2021, 115, 102403. [Google Scholar] [CrossRef]
  7. UN-Habitat. Metadata on SDGs Indicator 11.3.1 Indicator Category: Tier II; United Nations Human Settlements Program (UN-Habitat): Nairobi, Kenya, 2018. [Google Scholar]
  8. Ghazaryan, G.; Rienow, A.; Oldenburg, C.; Thonfeld, F.; Trampnau, B.; Sticksel, S.; Jürgens, C. Monitoring of Urban Sprawl and Densification Processes in Western Germany in the Light of Sdg Indicator 11.3.1 Based on an Automated Retrospective Classification Approach. Remote Sens. 2021, 13, 1694. [Google Scholar] [CrossRef]
  9. Nicolau, R.; David, J.; Caetano, M.; Pereira, J.M.C. Ratio of Land Consumption Rate to Population Growth Rate-Analysis of Different Formulations Applied to Mainland Portugal. ISPRS Int. J. Geo-Inf. 2019, 8, 10. [Google Scholar] [CrossRef]
  10. Huang, M.; Liu, F.; Gong, D.; Lin, H.; Chen, Y.; Hu, B.; Ge, Y.; Xiao, C. Spatiotemporal Evolution of Land Use Efficiency in 357 Cities across Mainland China from 2000 to 2020 Based on SDG 11.3.1. Sci. Total Environ. 2024, 954, 176157. [Google Scholar] [CrossRef]
  11. Zhou, M.; Lu, L.; Guo, H.; Weng, Q.; Cao, S.; Zhang, S.; Li, Q. Urban Sprawl and Changes in Land-Use Efficiency in the Beijing–Tianjin–Hebei Region, China from 2000 to 2020: A Spatiotemporal Analysis Using Earth Observation Data. Remote Sens. 2021, 13, 2850. [Google Scholar] [CrossRef]
  12. Jaber, S.M. Land Use Efficiency and Governance Disparities: Unveiling the Nexus in the Arab World. Environ. Dev. 2025, 55, 101169. [Google Scholar] [CrossRef]
  13. Santillan, J.R.; Heipke, C. Assessing Patterns and Trends in Urbanization and Land Use Efficiency Across the Philippines: A Comprehensive Analysis Using Global Earth Observation Data and SDG 11.3.1 Indicators. PFG J. Photogramm. Remote Sens. Geoinf. Sci. 2024, 92, 569–592. [Google Scholar] [CrossRef]
  14. Li, C.; Cai, G.; Du, M. Big Data Supported the Identification of Urban Land Efficiency in Eurasia by Indicator SDG 11.3.1. ISPRS Int. J. Geo-Inf. 2021, 10, 64. [Google Scholar] [CrossRef]
  15. Schiavina, M.; Melchiorri, M.; Freire, S.; Florio, P.; Ehrlich, D.; Tommasi, P.; Pesaresi, M.; Kemper, T. Land Use Efficiency of Functional Urban Areas: Global Pattern and Evolution of Development Trajectories. Habitat Int. 2022, 123, 102543. [Google Scholar] [CrossRef] [PubMed]
  16. Liu, X.; Wu, X.; Li, X.; Xu, X.; Liao, W.; Jiao, L.; Zeng, Z.; Chen, G.; Li, X. Global Mapping of Three-Dimensional Urban Structures Reveals Escalating Utilization in the Vertical Dimension and Pronounced Building Space Inequality. Engineering 2024, 47, 86–99. [Google Scholar] [CrossRef]
  17. Soltani, A.; Azizi, P.; Rahimioun, A.; Sedaghatfard, M. Volumetric Urban Sprawl: Horizontal and Vertical Growth in Two Metropolitans. J. Urban Manag. 2025. [Google Scholar] [CrossRef]
  18. Bibri, S.E.; Krogstie, J.; Kärrholm, M. Compact City Planning and Development: Emerging Practices and Strategies for Achieving the Goals of Sustainability. Dev. Built Environ. 2020, 4, 100021. [Google Scholar] [CrossRef]
  19. Esch, T.; Brzoska, E.; Dech, S.; Leutner, B.; Palacios-Lopez, D.; Metz-Marconcini, A.; Marconcini, M.; Roth, A.; Zeidler, J. World Settlement Footprint 3D—A First Three-Dimensional Survey of the Global Building Stock. Remote Sens. Environ. 2022, 270, 112877. [Google Scholar] [CrossRef]
  20. Li, M.; Wang, Y.; Rosier, J.F.; Verburg, P.H.; van Vliet, J. Global Maps of 3D Built-up Patterns for Urban Morphological Analysis. Int. J. Appl. Earth Obs. Geoinf. 2022, 114, 103048. [Google Scholar] [CrossRef]
  21. Pesaresi, M.; Politis, P. GHS-BUILT-V R2023A—GHS Built-up Volume Grids Derived from Joint Assessment of Sentinel2, Landsat, and Global DEM Data, Multitemporal (1975–2030) 2023. Available online: https://data.jrc.ec.europa.eu/dataset/ab2f107a-03cd-47a3-85e5-139d8ec63283 (accessed on 21 May 2025).
  22. Pesaresi, M.; Politis, P. GHS-BUILT-H R2023A—GHS Building Height, Derived from AW3D30, SRTM30, and Sentinel2 Composite (2018) 2023. Available online: https://data.jrc.ec.europa.eu/dataset/85005901-3a49-48dd-9d19-6261354f56fe (accessed on 21 May 2025).
  23. Kamath, H.G.; Singh, M.; Malviya, N.; Martilli, A.; He, L.; Aliaga, D.; He, C.; Chen, F.; Magruder, L.A.; Yang, Z.-L.; et al. GLObal Building Heights for Urban Studies (UT-GLOBUS) for City- and Street- Scale Urban Simulations: Development and First Applications. Sci. Data 2024, 11, 886. [Google Scholar] [CrossRef] [PubMed]
  24. Che, Y.; Li, X.; Liu, X.; Wang, Y.; Liao, W.; Zheng, X.; Zhang, X.; Xu, X.; Shi, Q.; Zhu, J.; et al. 3D-GloBFP: The First Global Three-Dimensional Building Footprint Dataset. Earth Syst. Sci. Data 2024, 16, 5357–5374. [Google Scholar] [CrossRef]
  25. Frolking, S.; Mahtta, R.; Milliman, T.; Esch, T.; Seto, K.C. Global Urban Structural Growth Shows a Profound Shift from Spreading out to Building Up. Nat. Cities 2024, 1, 555–566. [Google Scholar] [CrossRef]
  26. Mahtta, R.; Mahendra, A.; Seto, K.C. Building up or Spreading out? Typologies of Urban Growth across 478 Cities of 1 Million+. Environ. Res. Lett. 2019, 14, 124077. [Google Scholar] [CrossRef]
  27. Zambon, I.; Colantoni, A.; Salvati, L. Horizontal vs. Vertical Growth: Understanding Latent Patterns of Urban Expansion in Large Metropolitan Regions. Sci. Total Environ. 2019, 654, 778–785. [Google Scholar] [CrossRef]
  28. Zhao, C.; Weng, Q.; Hersperger, A.M. Characterizing the 3-D Urban Morphology Transformation to Understand Urban-Form Dynamics: A Case Study of Austin, Texas, USA. Landsc. Urban Plan. 2020, 203, 103881. [Google Scholar] [CrossRef]
  29. Zięba-Kulawik, K.; Skoczylas, K.; Mustafa, A.; Wężyk, P.; Gerber, P.; Teller, J.; Omrani, H. Spatiotemporal Changes in 3D Building Density with LiDAR and GEOBIA: A City-Level Analysis. Remote Sens. 2020, 12, 3668. [Google Scholar] [CrossRef]
  30. European Commission; Joint Research Centre; Melchiorri, M.; Mari Rivero, I.; Florio, P.; Schiavina, M.; Krasnodebska, K.; Politis, P.; Uhl, J.; Pesaresi, M.; et al. Stats in the City the GHSL Urban Centre Database 2025; Publications Office of the European Union: Luxembourg, 2024. [Google Scholar]
  31. Faye, B.; Du, G.; Zhang, R. Efficiency Analysis of Land Use and the Degree of Coupling Link between Population Growth and Global Built-Up Area in the Subregion of West Africa. Land 2022, 11, 847. [Google Scholar] [CrossRef]
  32. Melchiorri, M.; Pesaresi, M.; Florczyk, A.J.; Corbane, C.; Kemper, T. Principles and Applications of the Global Human Settlement Layer as Baseline for the Land Use Efficiency Indicator—SDG 11.3.1. ISPRS Int. J. Geo-Inf. 2019, 8, 96. [Google Scholar] [CrossRef]
  33. Schiavina, M.; Melchiorri, M.; Corbane, C.; Florczyk, A.J.; Freire, S.; Pesaresi, M.; Kemper, T. Multi-Scale Estimation of Land Use Efficiency (SDG 11.3.1) across 25 Years Using Global Open and Free Data. Sustainability 2019, 11, 5674. [Google Scholar] [CrossRef]
  34. Wang, Y.; Huang, C.; Feng, Y.; Zhao, M.; Gu, J. Using Earth Observation for Monitoring SDG 11.3.1-Ratio of Land Consumption Rate to Population Growth Rate in Mainland China. Remote Sens. 2020, 12, 357. [Google Scholar] [CrossRef]
  35. Jiang, H.; Sun, Z.; Guo, H.; Weng, Q.; Du, W.; Xing, Q.; Cai, G. An Assessment of Urbanization Sustainability in China between 1990 and 2015 Using Land Use Efficiency Indicators. npj Urban Sustain. 2021, 1, 34. [Google Scholar] [CrossRef]
  36. Koroso, N.H.; Lengoiboni, M.; Zevenbergen, J.A. Urbanization and Urban Land Use Efficiency: Evidence from Regional and Addis Ababa Satellite Cities, Ethiopia. Habitat Int. 2021, 117, 102437. [Google Scholar] [CrossRef]
  37. Li, C.; Cai, G.; Sun, Z. Urban Land-Use Efficiency Analysis by Integrating LCRPGR and Additional Indicators. Sustainability 2021, 13, 13518. [Google Scholar] [CrossRef]
  38. Calka, B.; Orych, A.; Bielecka, E.; Mozuriunaite, S. The Ratio of the Land Consumption Rate to the Population Growth Rate: A Framework for the Achievement of the Spatiotemporal Pattern in Poland and Lithuania. Remote Sens. 2022, 14, 1074. [Google Scholar] [CrossRef]
  39. Bhandari, R.; Xue, W.; Virdis, S.G.P.; Winijkul, E.; Nguyen, T.P.L.; Joshi, S. Monitoring and Assessing Urbanization Progress in Thailand between 2000 and 2020 Using SDG Indicator 11.3.1. Sustainability 2023, 15, 9794. [Google Scholar] [CrossRef]
  40. Wang, Y.; Li, B.; Xu, L. Monitoring Land-Use Efficiency in China’s Yangtze River Economic Belt from 2000 to 2018. Land 2022, 11, 1009. [Google Scholar] [CrossRef]
  41. Cardenas-Ritzert, O.S.E.; Vogeler, J.C.; Shah Heydari, S.; Fekety, P.A.; Laituri, M.; McHale, M. Automated Geospatial Approach for Assessing SDG Indicator 11.3.1: A Multi-Level Evaluation of Urban Land Use Expansion across Africa. ISPRS Int. J. Geo-Inf. 2024, 13, 226. [Google Scholar] [CrossRef]
  42. Wang, H.; Liu, Y.; Sun, L.; Ning, X.; Li, G. Assessment of Chinese Urban Land-Use Efficiency (SDG11.3.1) Utilizing High-Precision Urban Built-up Area Data. Geogr. Sustain. 2025, 6, 100210. [Google Scholar] [CrossRef]
  43. Laituri, M.; Davis, D.; Sternlieb, F.; Galvin, K. Sdg Indicator 11.3.1 and Secondary Cities: An Analysis and Assessment. ISPRS Int. J. Geo-Inf. 2021, 10, 713. [Google Scholar] [CrossRef]
  44. Jiang, H.; Guo, H.; Sun, Z.; Xing, Q.; Zhang, H.; Ma, Y.; Li, S. Projections of Urban Built-up Area Expansion and Urbanization Sustainability in China’s Cities through 2030. J. Clean. Prod. 2022, 367, 133086. [Google Scholar] [CrossRef]
  45. Angel, S.; Mackres, E.; Guzder-Williams, B. Measuring Change in Urban Land Consumption: A Global Analysis. Land 2024, 13, 1491. [Google Scholar] [CrossRef]
  46. Santillan, J.R.; Dorozynski, M.; Heipke, C. Uncertainty Quantification and Monte Carlo Simulations to Enhance SDG 11.3.1 Monitoring. ISPRS Ann. Photogramm. Remote Sens. Spat. Inf. Sci. 2025, X-G-2025, 753–762. [Google Scholar] [CrossRef]
  47. Cardenas-Ritzert, O.S.E.; Vogeler, J.C.; Shah Heydari, S.; Fekety, P.A.; Laituri, M.; McHale, M.R. Effects of Land Use Data Spatial Resolution on SDG Indicator 11.3.1 (Urban Expansion) Assessments: A Case Study Across Ethiopia. Sustainability 2024, 16, 9698. [Google Scholar] [CrossRef]
  48. Aquilino, M.; Adamo, M.; Blonda, P.; Barbanente, A.; Tarantino, C. Improvement of a Dasymetric Method for Implementing Sustainable Development Goal 11 Indicators at an Intra-Urban Scale. Remote Sens. 2021, 13, 2835. [Google Scholar] [CrossRef]
  49. Wang, H.; Wei, Y.; Liu, Y.; Cao, Y.; Liu, R.; Ning, X. Evaluation of Chinese Urban Land-Use Efficiency (Sdg11.3.1) Based on High-Precision Urban Built-up Area Data. In Proceedings of the IGARSS 2024—2024 IEEE International Geoscience and Remote Sensing Symposium, Athens, Greece, 7–12 July 2024; pp. 858–862. [Google Scholar]
  50. Koomen, E.; Rietveld, P.; Bacao, F. The Third Dimension in Urban Geography: The Urban-Volume Approach. Environ. Plan. B Plan. Des. 2009, 36, 1008–1025. [Google Scholar] [CrossRef]
  51. Ruan, L.; He, T.; Xiao, W.; Chen, W.; Lu, D.; Liu, S. Measuring the Coupling of Built-up Land Intensity and Use Efficiency: An Example of the Yangtze River Delta Urban Agglomeration. Sustain. Cities Soc. 2022, 87, 104224. [Google Scholar] [CrossRef]
  52. Kim, J.; Kim, H. 3-D Land Use Index: Vertical Land Use Analysis Based on Multi-Dimensional Geospatial Data Cube. In Proceedings of the 2024 IEEE International Conference on Big Data (BigData 2024), Washington, DC, USA, 15–18 December 2024; pp. 8719–8721. [Google Scholar]
  53. Forman, R.T.T. Land Mosaics: The Ecology of Landscapes and Regions; Cambridge University Press: Cambridge, UK, 1995. [Google Scholar]
  54. Camagni, R.; Gibelli, M.C.; Rigamonti, P. Urban Mobility and Urban Form: The Social and Environmental Costs of Different Patterns of Urban Expansion. Ecol. Econ. 2002, 40, 199–216. [Google Scholar] [CrossRef]
  55. Jabareen, Y.R. Sustainable Urban Forms. J. Plan. Educ. Res. 2006, 26, 38–52. [Google Scholar] [CrossRef]
  56. Schneider, A.; Woodcock, C.E. Compact, Dispersed, Fragmented, Extensive? A Comparison of Urban Growth in Twenty-Five Global Cities Using Remotely Sensed Data, Pattern Metrics and Census Information. Urban Stud. 2008, 45, 659–692. [Google Scholar] [CrossRef]
  57. Shi, Y.; Sun, X.; Zhu, X.; Li, Y.; Mei, L. Characterizing Growth Types and Analyzing Growth Density Distribution in Response to Urban Growth Patterns in Peri-Urban Areas of Lianyungang City. Landsc. Urban Plan. 2012, 105, 425–433. [Google Scholar] [CrossRef]
  58. Sun, Y.; Jiao, L.; Guo, Y.; Xu, Z. Recognizing Urban Shrinkage and Growth Patterns from a Global Perspective. Appl. Geogr. 2024, 166, 103247. [Google Scholar] [CrossRef]
  59. Santillan, J.R.; Heipke, C. Using GHSL to Analyze Urbanization and Land-Use Efficiency in the Philippines from 1975-2020: Trends and Implications for Sustainable Development. ISPRS Ann. Photogramm. Remote Sens. Spat. Inf. Sci. 2023, 10, 413–422. [Google Scholar] [CrossRef]
  60. European Commission. GHSL Data Package 2023; Publications Office of the European Union: Luxembourg, 2023. [Google Scholar]
  61. European Commission. Statistical Office of the European Union Applying the Degree of Urbanisation—A Methodological Manual to Define Cities, Towns and Rural Areas for International Comparisons, 2021 ed.; Publications Office of the European Union: Luxembourg, 2021. [Google Scholar]
  62. Schiavina, M.; Melchiorri, M.; Pesaresi, M. GHS-SMOD R2023A—GHS Settlement Layers, Application of the Degree of Urbanisation Methodology (Stage I) to GHS-POP R2023A and GHS-BUILT-S R2023A, Multitemporal (1975–2030) 2023. Available online: https://data.jrc.ec.europa.eu/dataset/a0df7a6f-49de-46ea-9bde-563437a6e2ba (accessed on 21 May 2025).
  63. Pesaresi, M.; Politis, P. GHS-BUILT-S R2023A—GHS Built-up Surface Grid, Derived from Sentinel2 Composite and Landsat, Multitemporal (1975–2030) 2023. Available online: https://data.jrc.ec.europa.eu/dataset/9f06f36f-4b11-47ec-abb0-4f8b7b1d72ea (accessed on 21 May 2025).
  64. Schiavina, M.; Freire, S.; MacManus, K. GHS-POP R2023A—GHS Population Grid Multitemporal (1975–2030) 2023. Available online: https://data.jrc.ec.europa.eu/dataset/2ff68a52-5b5b-4a22-8f40-c41da8332cfe (accessed on 21 May 2025).
  65. Pesaresi, M.; Schiavina, M.; Politis, P.; Freire, S.; Krasnodębska, K.; Uhl, J.H.; Carioli, A.; Corbane, C.; Dijkstra, L.; Florio, P.; et al. Advances on the Global Human Settlement Layer by Joint Assessment of Earth Observation and Population Survey Data. Int. J. Digit. Earth 2024, 17, 2390454. [Google Scholar] [CrossRef]
  66. Barbato, G.; Barini, E.M.; Genta, G.; Levi, R. Features and Performance of Some Outlier Detection Methods. J. Appl. Stat. 2011, 38, 2133–2149. [Google Scholar] [CrossRef]
  67. McHugh, M.L. The Chi-Square Test of Independence. Biochem. Med. 2013, 23, 143–149. [Google Scholar] [CrossRef]
  68. Congalton, R.G. A Review of Assessing the Accuracy of Classifications of Remotely Sensed Data. Remote Sens. Environ. 1991, 37, 35–46. [Google Scholar] [CrossRef]
  69. Cohen, J. A Coefficient of Agreement for Nominal Scales. Educ. Psychol. Meas. 1960, 20, 37–46. [Google Scholar] [CrossRef]
  70. Landis, J.R.; Koch, G.G. The Measurement of Observer Agreement for Categorical Data. Biometrics 1977, 33, 159. [Google Scholar] [CrossRef]
  71. Zhou, Y.; Li, X.; Chen, W.; Meng, L.; Wu, Q.; Gong, P.; Seto, K.C. Satellite Mapping of Urban Built-up Heights Reveals Extreme Infrastructure Gaps and Inequalities in the Global South. Proc. Natl. Acad. Sci. USA 2022, 119, e2214813119. [Google Scholar] [CrossRef]
  72. Taubenböck, H.; Mast, J.; Lemoine Rodríguez, R.; Debray, H.; Wurm, M.; Geiß, C. Was Global Urbanization from 1985 to 2015 Efficient in Terms of Land Consumption? Habitat Int. 2025, 160, 103397. [Google Scholar] [CrossRef]
  73. Lin, Z. Vertical Urbanism: Re-Conceptualizing the Compact City. In Vertical Urbanism; Routledge: London, UK, 2018; ISBN 978-1-351-20682-2. [Google Scholar]
  74. Pelczynski, J.; Tomkowicz, B. Densification of Cities as a Method of Sustainable Development. IOP Conf. Ser. Earth Environ. Sci. 2019, 362, 012106. [Google Scholar] [CrossRef]
  75. Munn, K.; Dragićević, S. Spatial Multi-Criteria Evaluation in 3D Context: Suitability Analysis of Urban Vertical Development. Cartogr. Geogr. Inf. Sci. 2021, 48, 105–123. [Google Scholar] [CrossRef]
  76. OECD. Rethinking Urban Sprawl: Moving Towards Sustainable Cities; OECD: Paris, France, 2018; ISBN 978-92-64-18982-9. [Google Scholar]
  77. Hasse, J.E.; Lathrop, R.G. Land Resource Impact Indicators of Urban Sprawl. Appl. Geogr. 2003, 23, 159–175. [Google Scholar] [CrossRef]
  78. Kim, J.H.; Li, X. Building More Housing near Transit: A Spatial Analysis of Residential Densification Dynamics. Transp. Policy 2021, 114, 15–24. [Google Scholar] [CrossRef]
  79. Yang, W.; Xu, Q.; Yi, S.; Shankar, R.; Chen, T. Enhancing Transit-Oriented Development Sustainability through the Integrated Node-Place-Ecology (NPE) Model. Transp. Res. D Transp. Environ. 2024, 136, 104456. [Google Scholar] [CrossRef]
  80. Mualam, N.; Salinger, E.; Max, D. Increasing the Urban Mix through Vertical Allocations: Public Floorspace in Mixed Use Development. Cities 2019, 87, 131–141. [Google Scholar] [CrossRef]
  81. Grace Wong, K.M. Vertical Cities as a Solution for Land Scarcity: The Tallest Public Housing Development in Singapore. Urban. Des. Int. 2004, 9, 17–30. [Google Scholar] [CrossRef]
  82. Li, Y.; Beeton, R.J.S.; Zhao, X.; Fan, Y.; Yang, Q.; Li, J.; Ding, L. Advancing Urban Sustainability Transitions: A Framework for Understanding Urban Complexity and Enhancing Integrative Transformations. Humanit. Soc. Sci. Commun. 2024, 11, 1064. [Google Scholar] [CrossRef]
  83. Swilling, M.; Hajer, M. Governance of Urban Transitions: Towards Sustainable Resource Efficient Urban Infrastructures. Environ. Res. Lett. 2017, 12, 125007. [Google Scholar] [CrossRef]
  84. Giyasov, B.; Giyasova, I. The Impact of High-Rise Buildings on the Living Environment. E3S Web Conf. 2018, 33, 01045. [Google Scholar] [CrossRef]
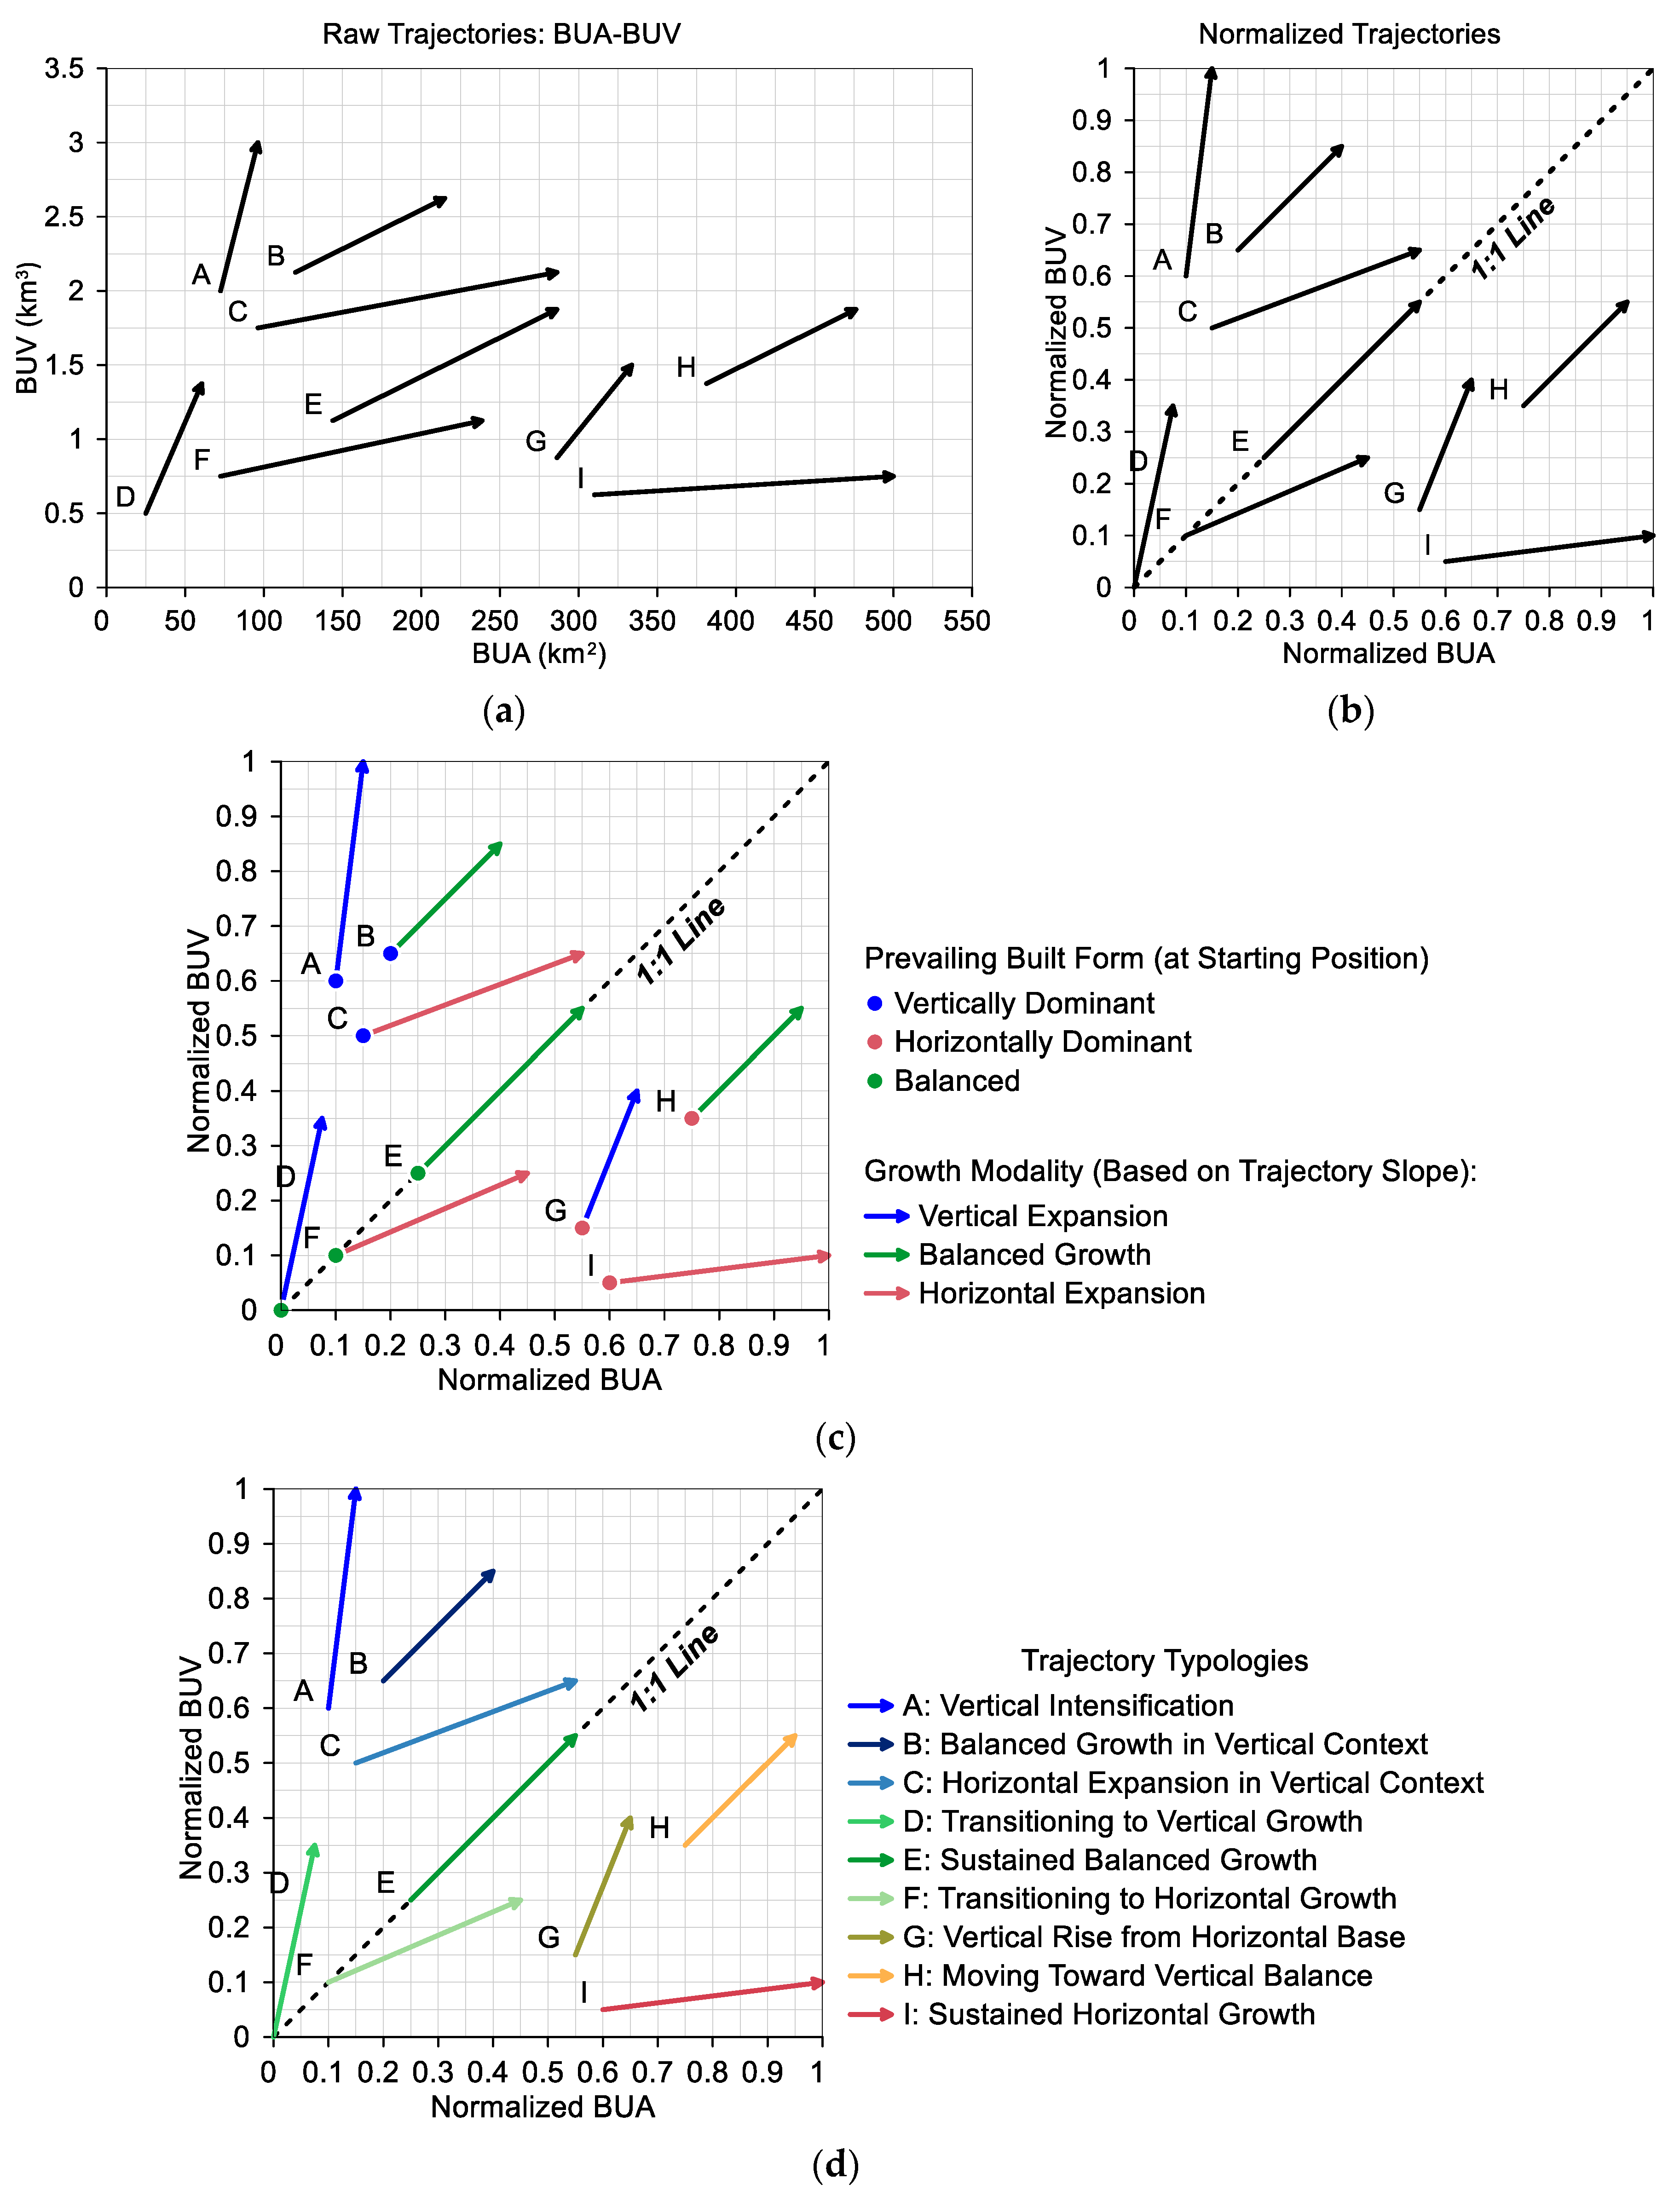
Figure 1. Hypothetical example illustrating the BUA–BUV trajectory framework for classifying urban growth typologies under the assumption of monotonic increases in BUA and BUV over time. (a) Raw BUA–BUV trajectories derived from plotted built-up area (BUA) and built-up volume (BUV) values at two epochs for nine hypothetical urban centres (City A to City I), with connecting lines illustrating the direction and magnitude of growth between time steps. (b) Normalized trajectories, where BUA and BUV values are rescaled to the [0, 1] range relative to the maximum across all cities and epochs, enabling comparability of growth directions independent of absolute size. (c) Classification of prevailing built form at the starting position combined with growth modality based on trajectory slope. (d) Resulting trajectory typologies.
Ijgi 14 00404 g001
Figure 2. Geographic distribution of the 10,856 urban centres included in this study, categorized by UN SDG region. Each point corresponds to an individual urban centre from the Global Human Settlement Layer Urban Centre Database (GHS-UCDB 2025). The number of centres per region is shown in parentheses following the region name.
Ijgi 14 00404 g002
Figure 3. Distribution of LCRPGR values across global urban centres for the periods (a) 1980–2000, (b) 2000–2020, and (c) 1980–2020.
Ijgi 14 00404 g003
Figure 4. Percentage distribution of urban centres classified into three LUE classes across (a) SDG regions and (b) World Bank (WB) Income Group for the periods 1980−2000 and 2000−2020. Urban centres not classified under the WB Income Group were excluded from panel (b). The total number of urban centres per SDG region or income group is indicated in parentheses.
Ijgi 14 00404 g004
Figure 5. Trajectories of urban centres in raw and normalized BUA–BUV space from 1980 to 2020. Panels (a,b) show raw and normalized trajectories for all urban centres in the dataset. Panels (c,d) present the corresponding trajectories for the top 10 most populous urban centres in 2020 based on the Global Human Settlement Layer Urban Centre Database (GHS-UCDB 2025).
Ijgi 14 00404 g005
Figure 6. Distribution of prevailing built form dominance among urban centres in (a) 1980, (b) 2000, and (c) 2020 based on normalized BUA–BUV values.
Ijgi 14 00404 g006aIjgi 14 00404 g006b
Figure 7. Global distribution of urban centres by BUA–BUV trajectory typology for (a) 1980–2000, (b) 2000–2020, and (c) 1980–2020. Each point represents one urban centre classified into one of nine typologies based on prevailing built form and growth direction. Only six of the nine typologies were observed among the urban centres for the three analyzed periods.
Ijgi 14 00404 g007aIjgi 14 00404 g007b
Figure 8. Percentage distribution of urban centres across BUA–BUV trajectory typologies for three LCRPGR-based LUE classes (≤0, 0–1, >1) during (a) 1980–2000 and (b) 2000–2020. The total number of urban centres per LUE class is indicated in parentheses.
Ijgi 14 00404 g008
Figure 9. Sensitivity of prevailing built form to the zone of effective balance thresholds (1st vs. 10th percentile): retention (a,b) and assignment purity (c,d) for 2000 and 2020, comparing the 1st and 10th percentile scenarios relative to the baseline 5th-percentile classification.
Ijgi 14 00404 g009
Figure 10. Sensitivity of trajectory typology classifications to variations in the percentile threshold for the zone of effective balance (1st, 5th, and 10th percentiles) and the slope partitioning schemes: retention (a) and assignment purity (b) for the period 2000–2020, relative to the baseline configuration (5th percentile, 0–30°/30–60°/60–90°).
Ijgi 14 00404 g010
Table 1. Interpretation of LCRPGR values based on the sign and relative magnitude of land consumption rate (LCR) and population growth rate (PGR), as defined under SDG 11.3.1 [5,7].
CaseLCRPGRLCRPGRInterpretation
1A>0>0>1Land consumption exceeds population growth; indicates inefficient land use (e.g., sprawl, low-density expansion).
1B>0>0=1Proportional land consumption and population growth; represents the ideal condition for land use efficiency, where the land consumption rate matches the population growth rate, indicating that urban expansion is aligned with demographic demand.
1C>0>0<1Population grows faster than land expansion; denotes efficient land use, typically via densification or compact growth.
2>0< 0<0Urban expansion amid population decline; reflects highly inefficient land use and unsustainable spatial growth.
3<0>0<0Built-up area contracts as population increases; may indicate efficient densification, but can also lead to overcrowding if unmanaged.
4A<0<0<1Both LCR and PGR decline; if LCR declines faster, indicates efficient urban contraction.
4B<0<0>1Both LCR and PGR decline; if PGR declines faster, it indicates inefficient shrinkage with possible underutilization of urban space.
5
(Special case)
Any=0UndefinedPGR is zero; LCRPGR is undefined. Interpretation depends on LCR: if LCR > 0, it indicates inefficiency; if LCR < 0, it may suggest efficient contraction.
6
(Special case)
=0≠00No change in land consumption. If PGR > 0, it indicates maximum efficiency; if PGR < 0, it reflects ambiguous conditions needing contextual analysis.
Table 2. Typology of urban growth patterns represented as a 3 × 3 matrix, based on the trajectory of normalized Built-up Area (BUA) and Built-up Volume (BUV). Rows correspond to the prevailing built form at the starting position (with trajectory starting position in brackets), columns represent growth modes (with slope description and ranges in parenthesis), and cells contain the typology names with corresponding interpretations. The classification assumes simultaneous increases in BUA and BUV, limiting trajectory slopes to 0–90°. If decline of BUA or BUV is also considered, the slope domain extends to −180–180°, yielding additional typologies not covered in this table. “On or near the 1:1 line” denotes balanced cases, defined through a zone of effective balance as described in Section 3.2.
Vertical Expansion
(Steeper, 60–90°)
Balanced Growth
(Moderate, 30–60°)
Horizontal Expansion
(Shallow, 0–30°)
Vertically Dominant
(Above the 1:1 line)
A: Vertical Intensification
(Growth is driven primarily by built-up volume; vertically dominant cities become more compact.)
B: Balanced Growth in Vertical Context
(BUA and BUV increase at relatively balanced rates while retaining vertical dominance.)
C: Horizontal Expansion in Vertical Context
(BUA increases more rapidly than BUV, but vertical dominance remains.)
Balanced
(On or near the 1:1 line)
D: Transitioning to Vertical Growth
(Urban form shifts from balance toward increasing vertical development.)
E: Sustained Balanced Growth
(BUA and BUV grow proportionally; urban structure remains balanced.)
F: Transitioning to Horizontal Growth
(Urban form shifts from balance toward increasing horizontal expansion.)
Horizontally Dominant
(Below the 1:1 line)
G: Vertical Rise from
Horizontal Base
(Cities previously dominated by BUA show increased BUV; a shift toward vertical development.)
H: Moving Toward Vertical
Balance
(Both BUA and BUV grow, with vertical development catching up; movement toward balance.)
I: Sustained Horizontal Growth
(Horizontal expansion continues to dominate; vertical growth remains limited.)
Table 3. Median LCR, PGR, and LCRPGR of global urban centres. Refer to Figures S1–S3 in the Supplementary Materials for visualizations of the full distributions.
LCR (%)PGR (%)LCRPGR
1980–20002000–20201980–20201980–20002000–20201980–20201980–20002000–20201980–2020
All3.471.723.441.970.951.521.671.051.94
UN SDG Region
Australia and New Zealand1.190.631.061.641.481.600.960.540.77
Central and Southern Asia6.022.155.552.210.961.602.751.633.45
Eastern and South-Eastern Asia4.192.084.311.130.420.811.641.022.03
Europe1.220.631.000.260.100.211.660.521.48
Latin America and the Caribbean3.011.352.702.171.231.741.411.081.65
Northern Africa and Western Asia2.741.792.882.791.832.311.030.971.25
Northern America1.550.651.221.521.151.421.010.580.94
Oceania1.890.601.292.642.162.510.660.450.61
Sub-Saharan Africa3.372.493.902.742.252.381.381.011.69
World Bank Income Group
Low income3.522.253.843.011.872.381.430.821.74
Lower Middle4.672.094.542.371.281.872.121.322.48
Upper Middle3.501.773.431.480.691.181.441.061.73
High income1.300.661.100.610.530.541.240.601.29
Table 4. Overall agreement and Cohen’s kappa index with the baseline (5th percentile) prevailing built form classification for 2000 and 2020 under alternative effective zone of balance thresholds (1st and 10th percentiles).
MetricYear1st Percentile10th Percentile
Overall Agreement200098%97%
202099%99%
Cohen’s kappa
(Three-class case: Horizontal, Balanced, Vertical)
20000.770.78
20200.810.85
Cohen’s kappa
(Two-class case: Balanced vs. All Other Built Forms)
20000.400.65
20200.400.72
Table 5. Overall agreement with the baseline trajectory typology classification (5th percentile balance threshold, 0–30°/30–60°/60–90° slope partition) for 2000–2020 under alternative percentile thresholds and slope partitions.
5th Percentile 1st Percentile 10th Percentile
0–30°/30–60°/60–90°(Baseline)98%97%
0–25°/25–55°/55–90°76%74%73%
0–20°/20–50°/50–90°51%50%49%
Table 6. Cohen’s kappa index with the baseline trajectory typology classification (5th percentile balance threshold, 0–30°/30–60°/60–90° slope partition) for 2000–2020 under alternative percentile thresholds and slope partitions.
5th Percentile 1st Percentile 10th Percentile
0–30°/30–60°/60–90°(Baseline)0.940.93
0–25°/25–55°/55–90°0.550.510.51
0–20°/20–50°/50–90°0.270.240.25
Disclaimer/Publisher’s Note: The statements, opinions and data contained in all publications are solely those of the individual author(s) and contributor(s) and not of MDPI and/or the editor(s). MDPI and/or the editor(s) disclaim responsibility for any injury to people or property resulting from any ideas, methods, instructions or products referred to in the content.