Surrounding Vitality Reasoning of Attractions Supported by Knowledge Graph
Abstract
1. Introduction
2. Materials and Methods
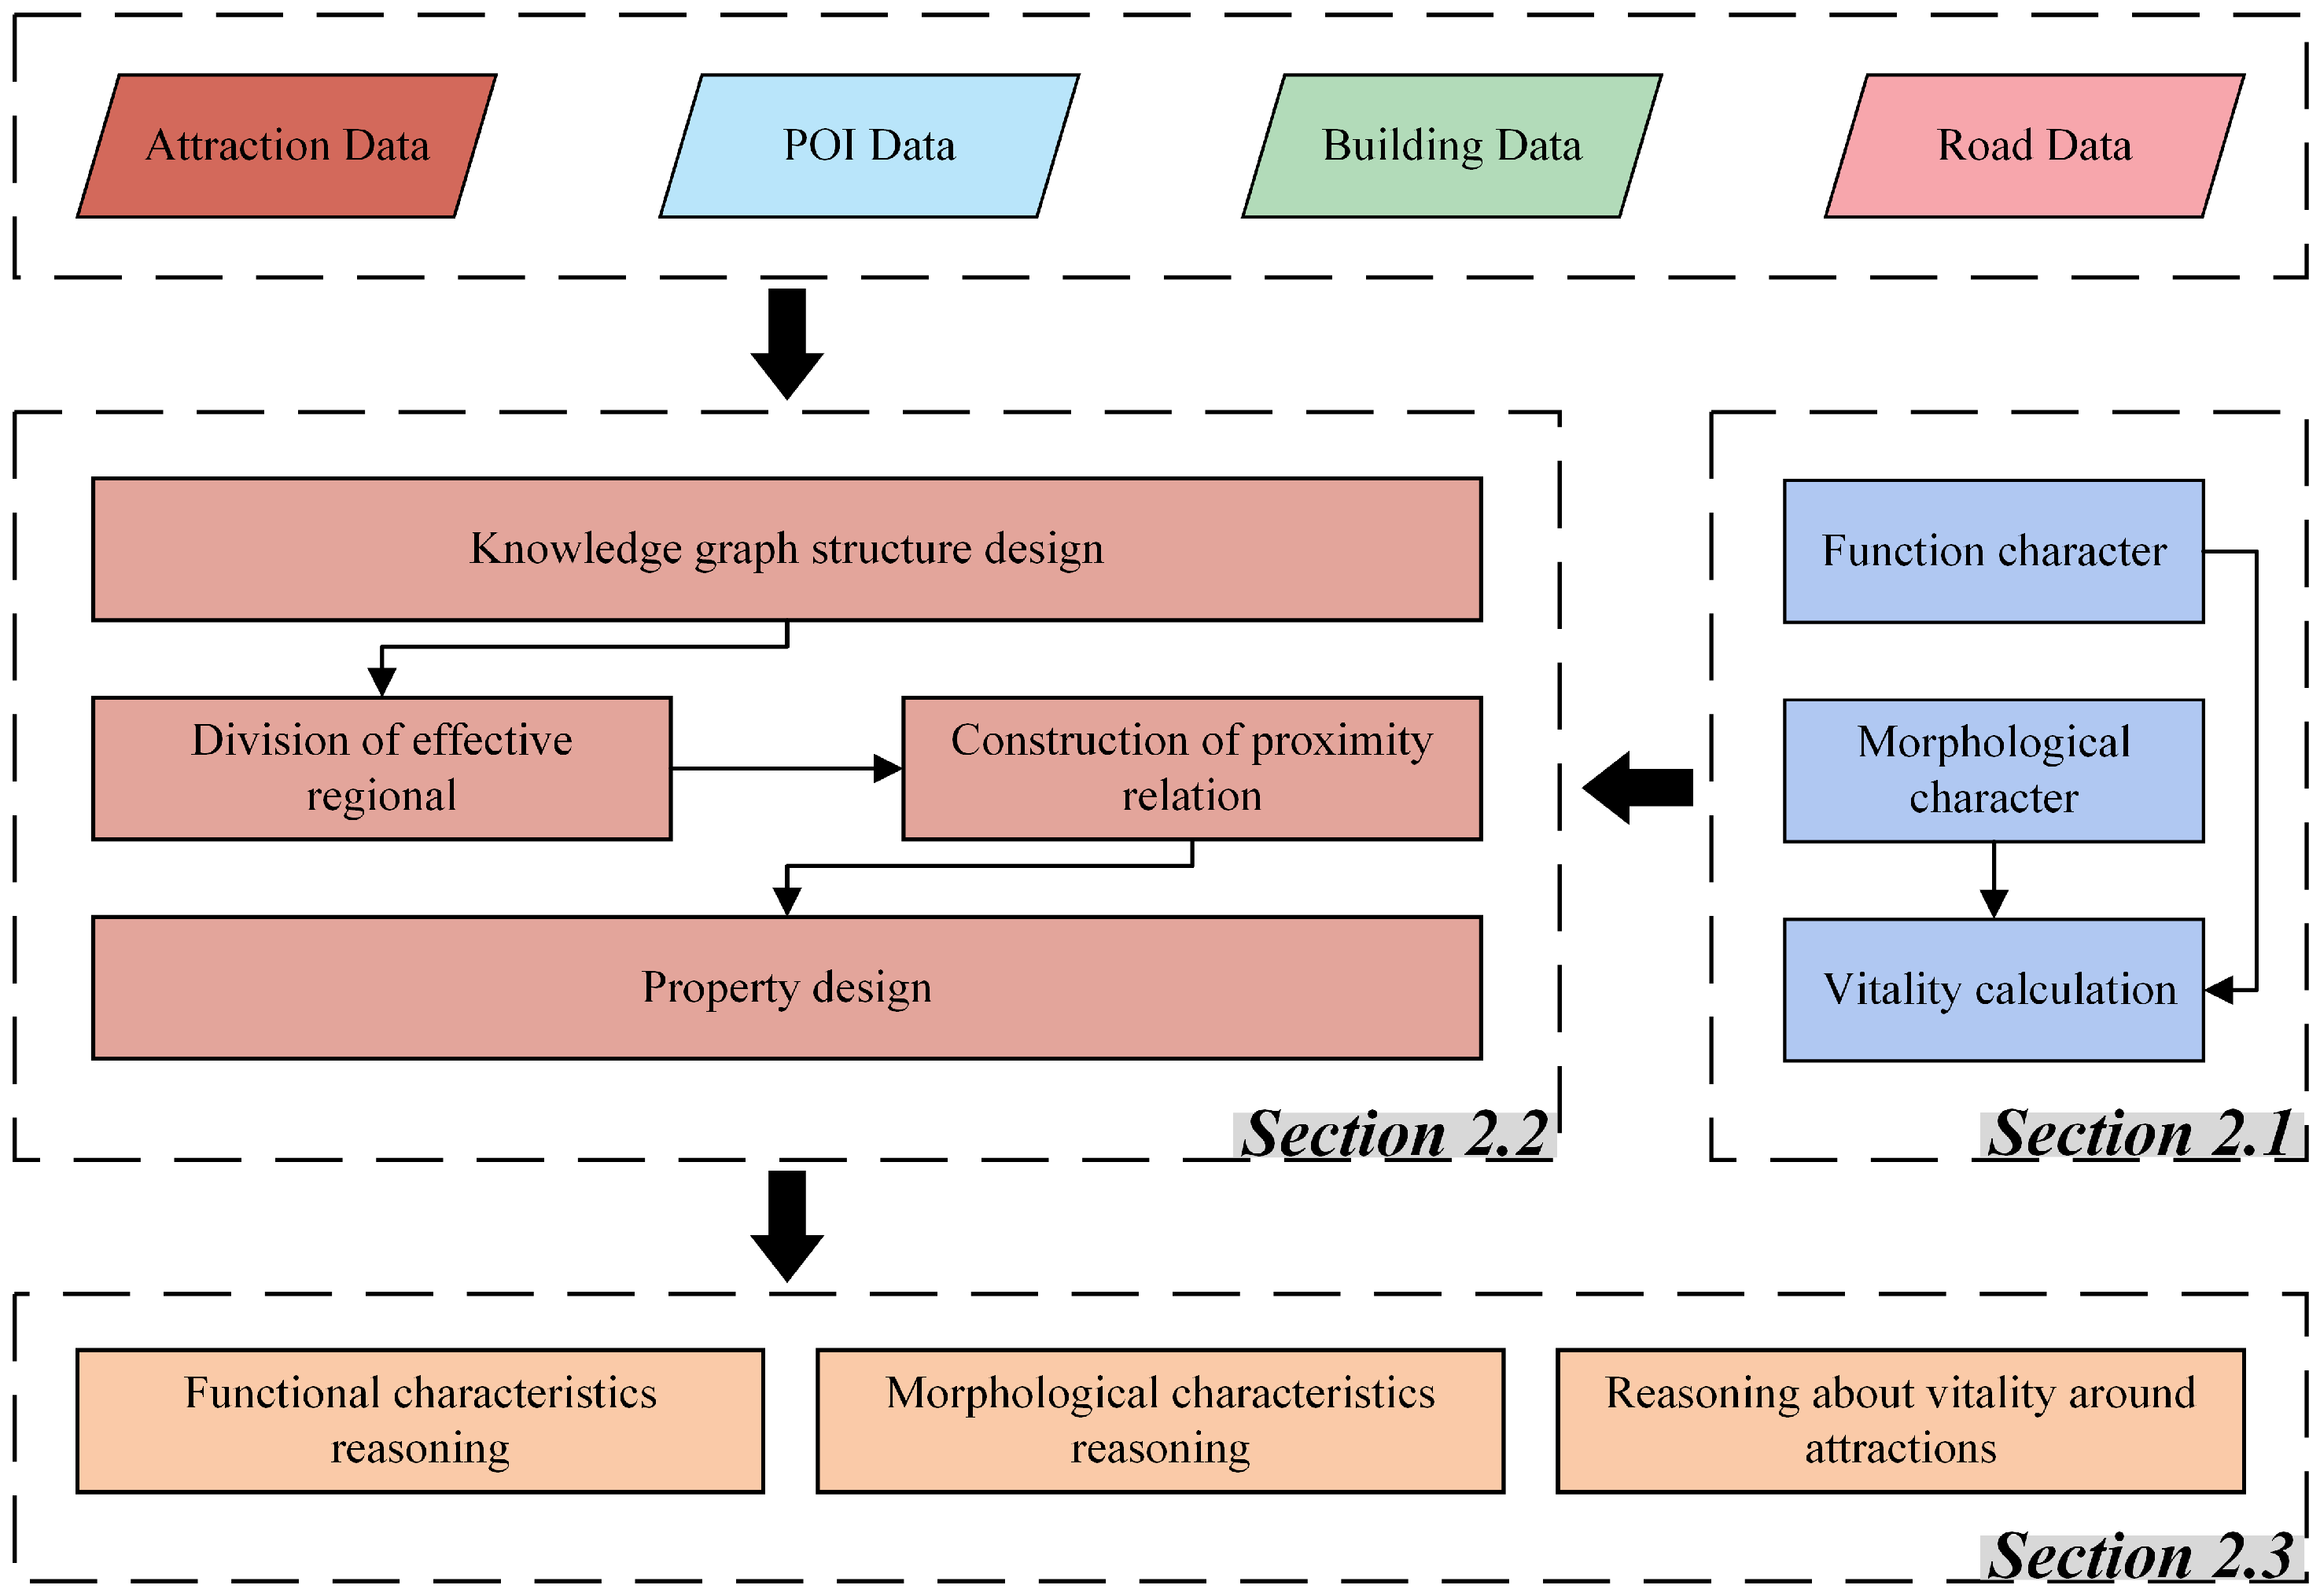
2.1. Vitality Modeling of the Surrounding Area of the Attractions
2.1.1. Functional Characteristics
2.1.2. Morphological Characteristics
2.1.3. Calculation Model for Vitality in the Surrounding Attraction Areas
2.2. Construction of Attration Knowledge Graph
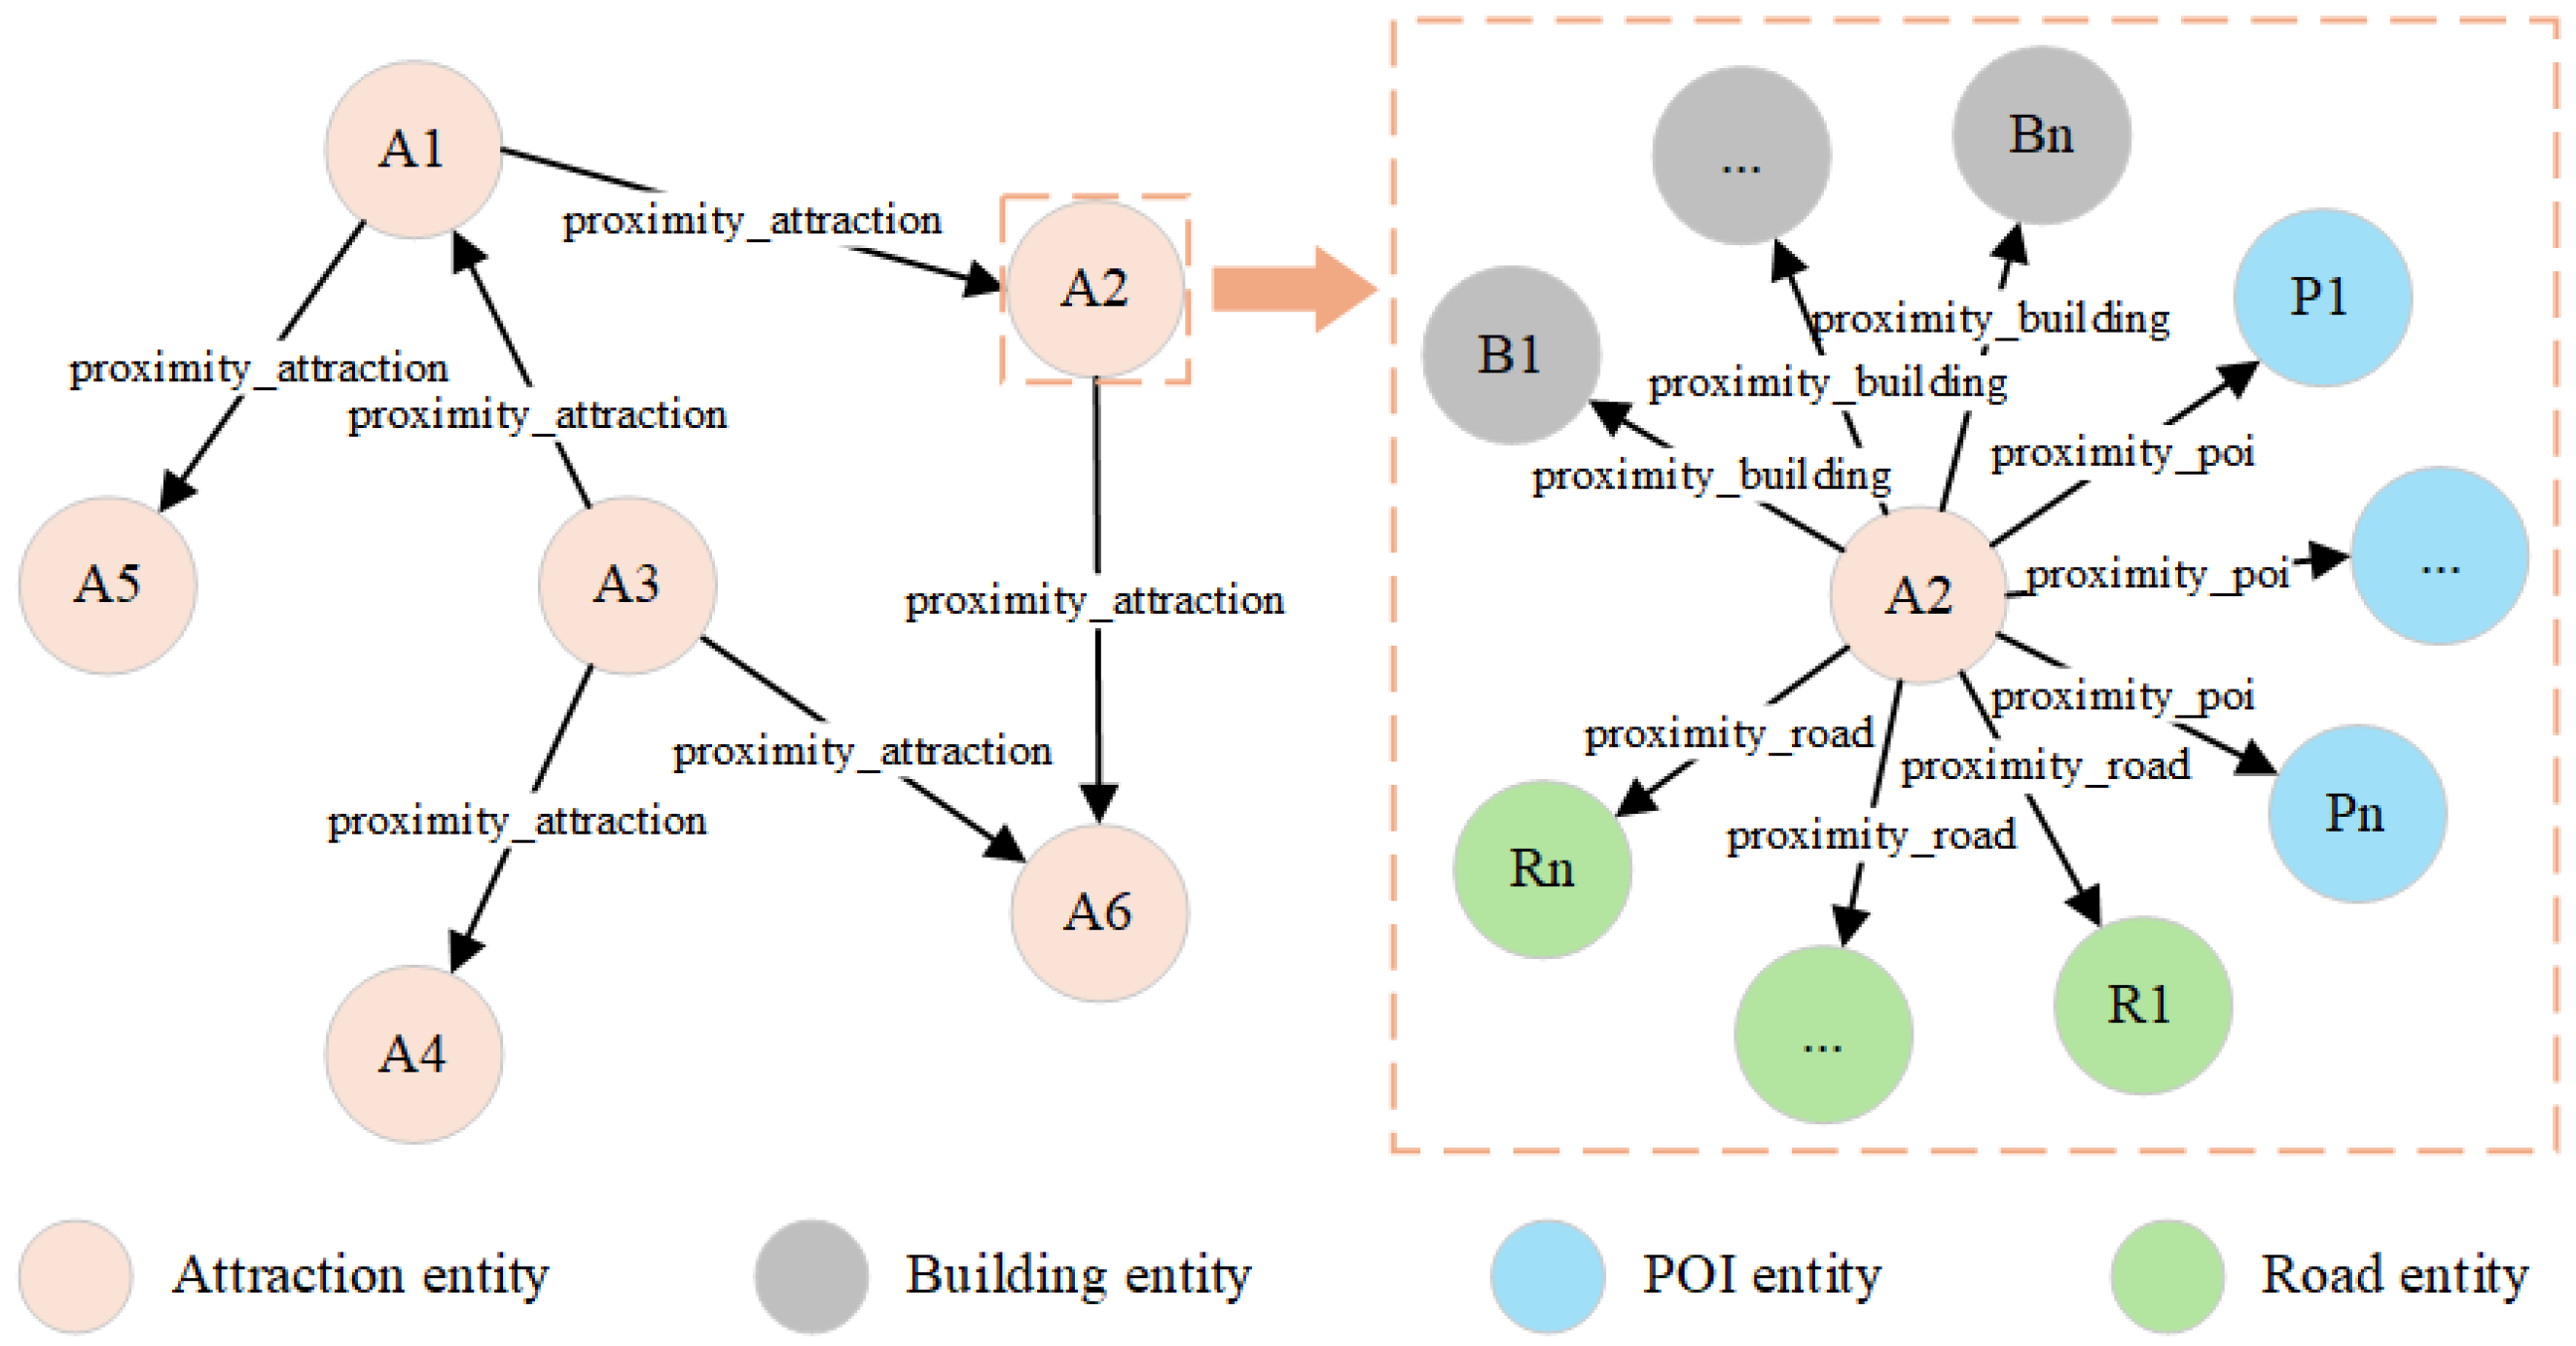
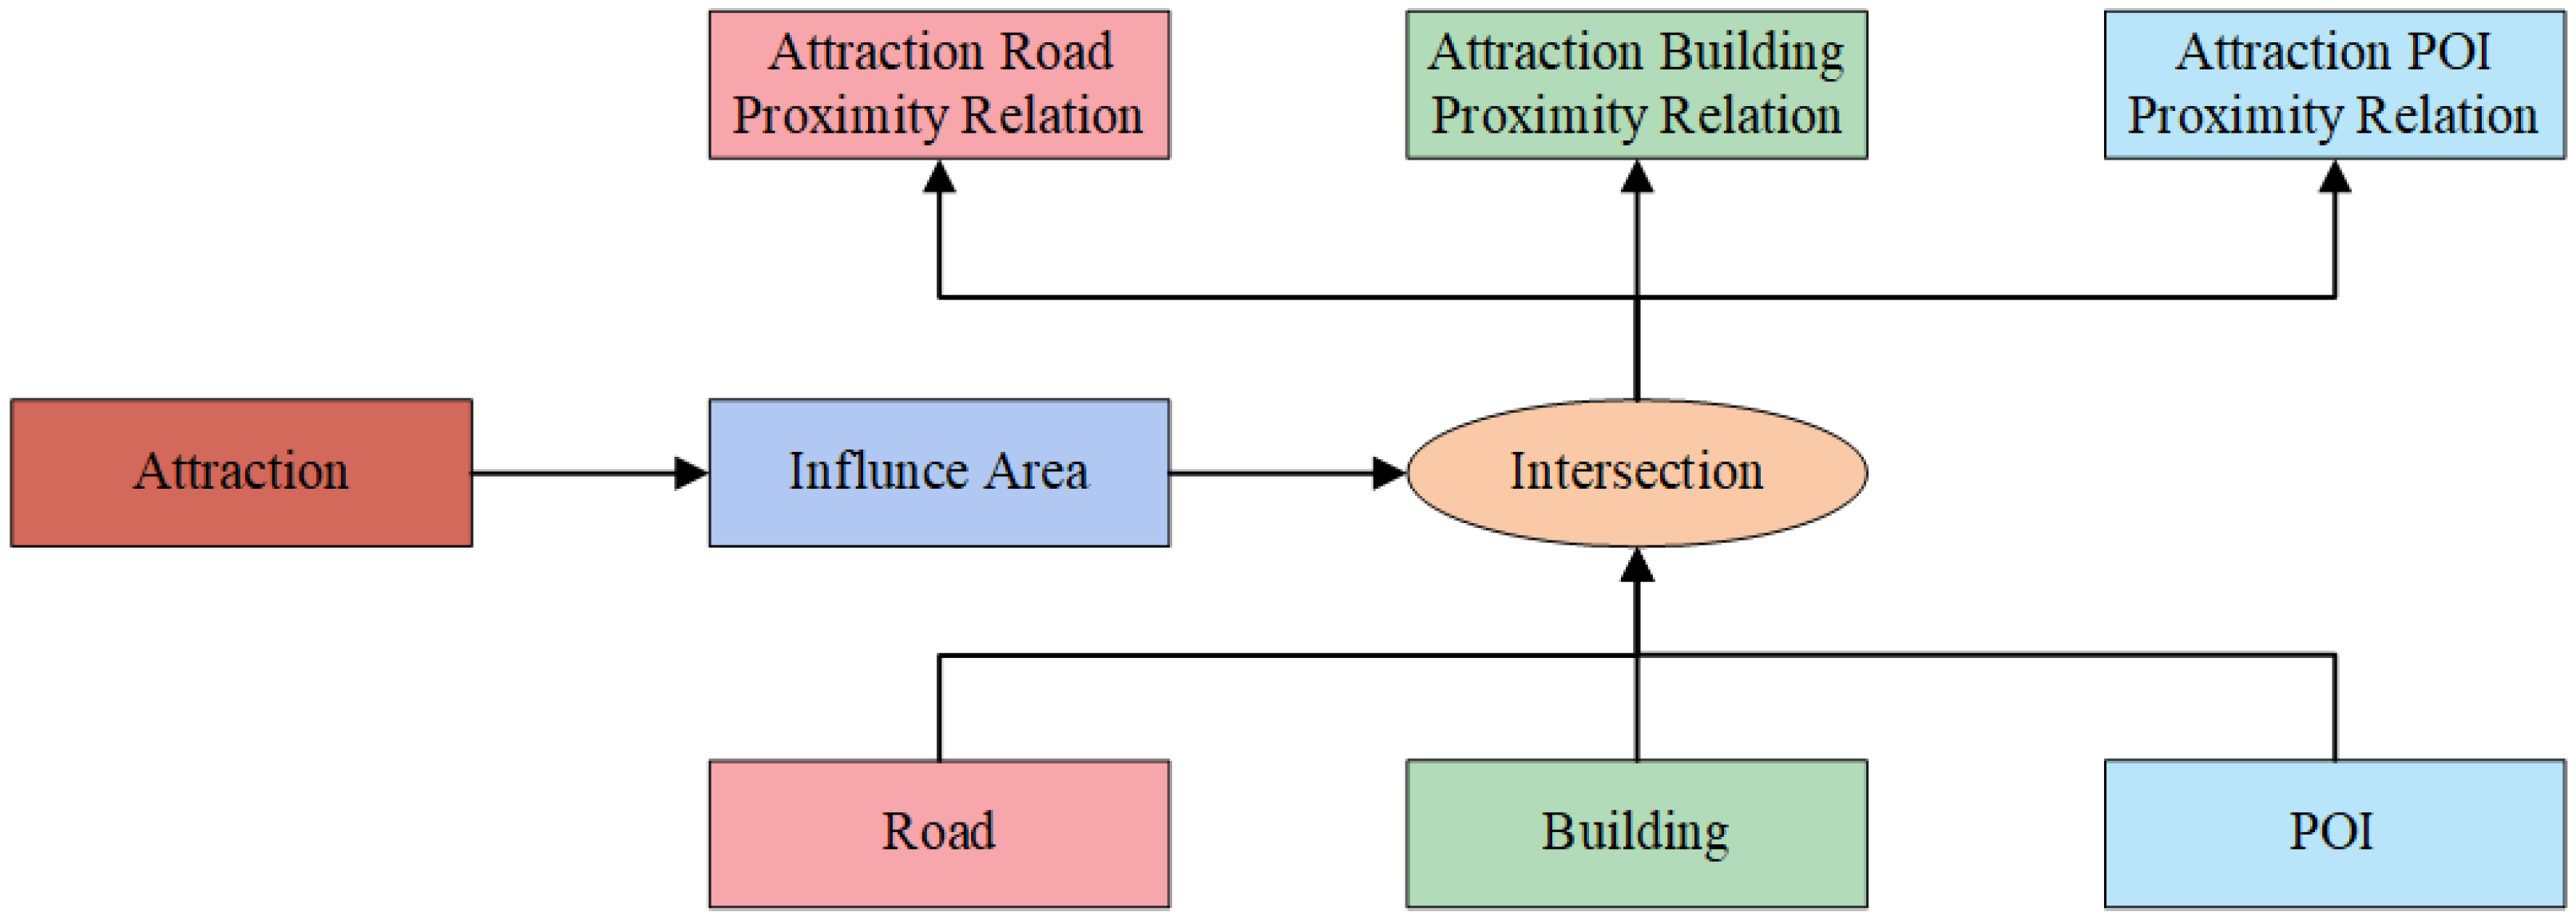
2.2.1. Knowledge Graph Structure Design
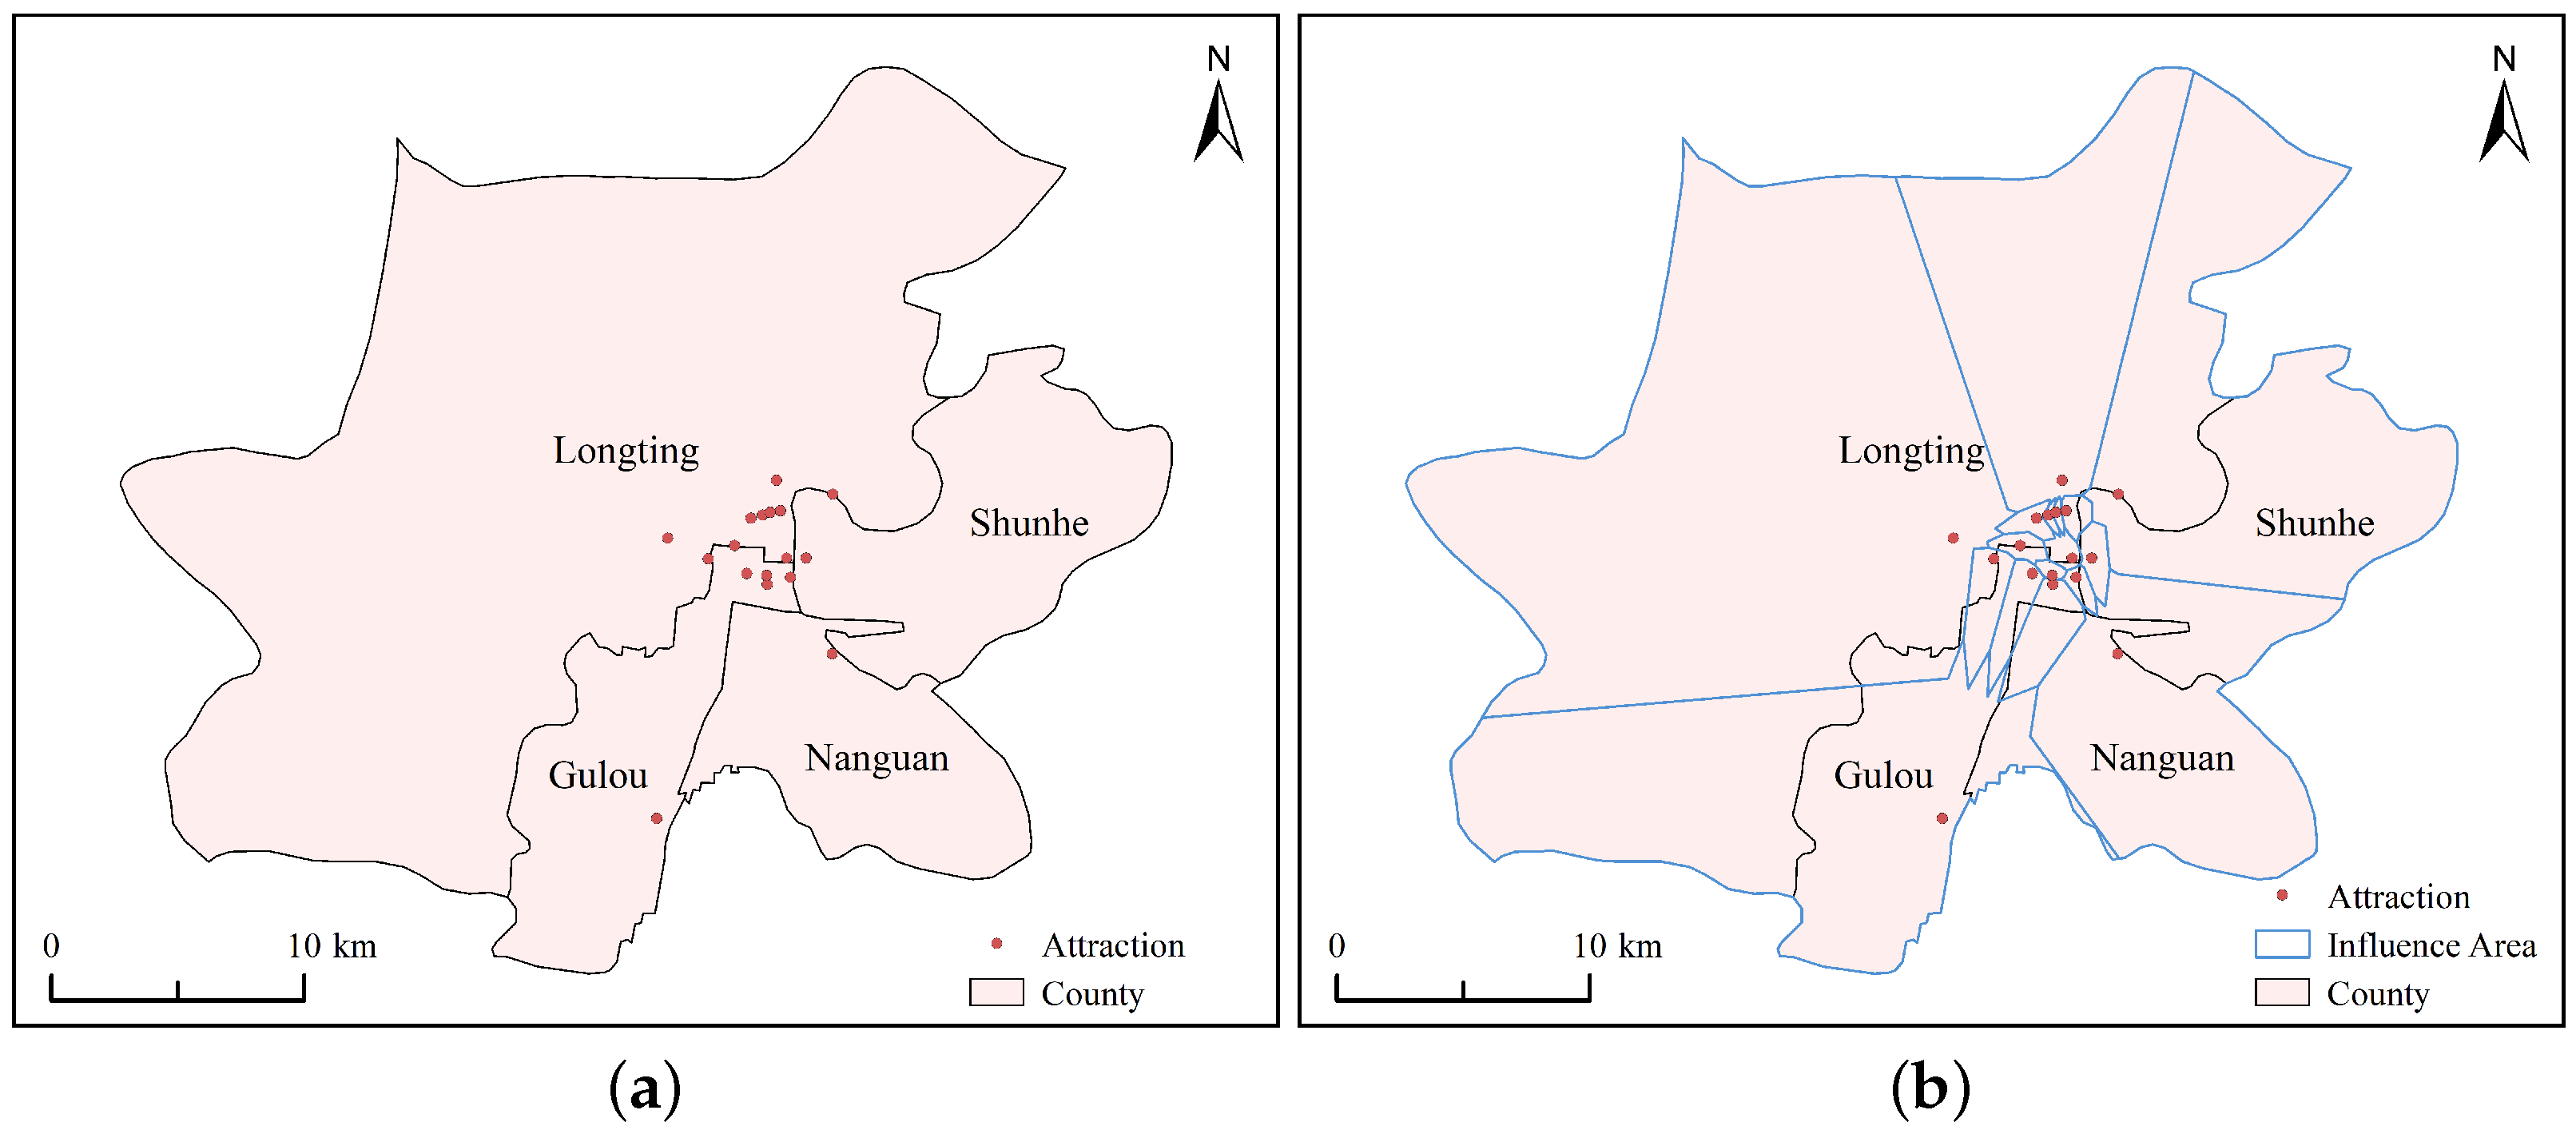
2.2.2. Attraction Influence Area Delineation
- Step 1.
- Construct the attraction Voronoi regions using the Delaunay triangulation algorithm, ensuring the distance from each point to the nearest attraction is minimized within each region.
- Step 2.
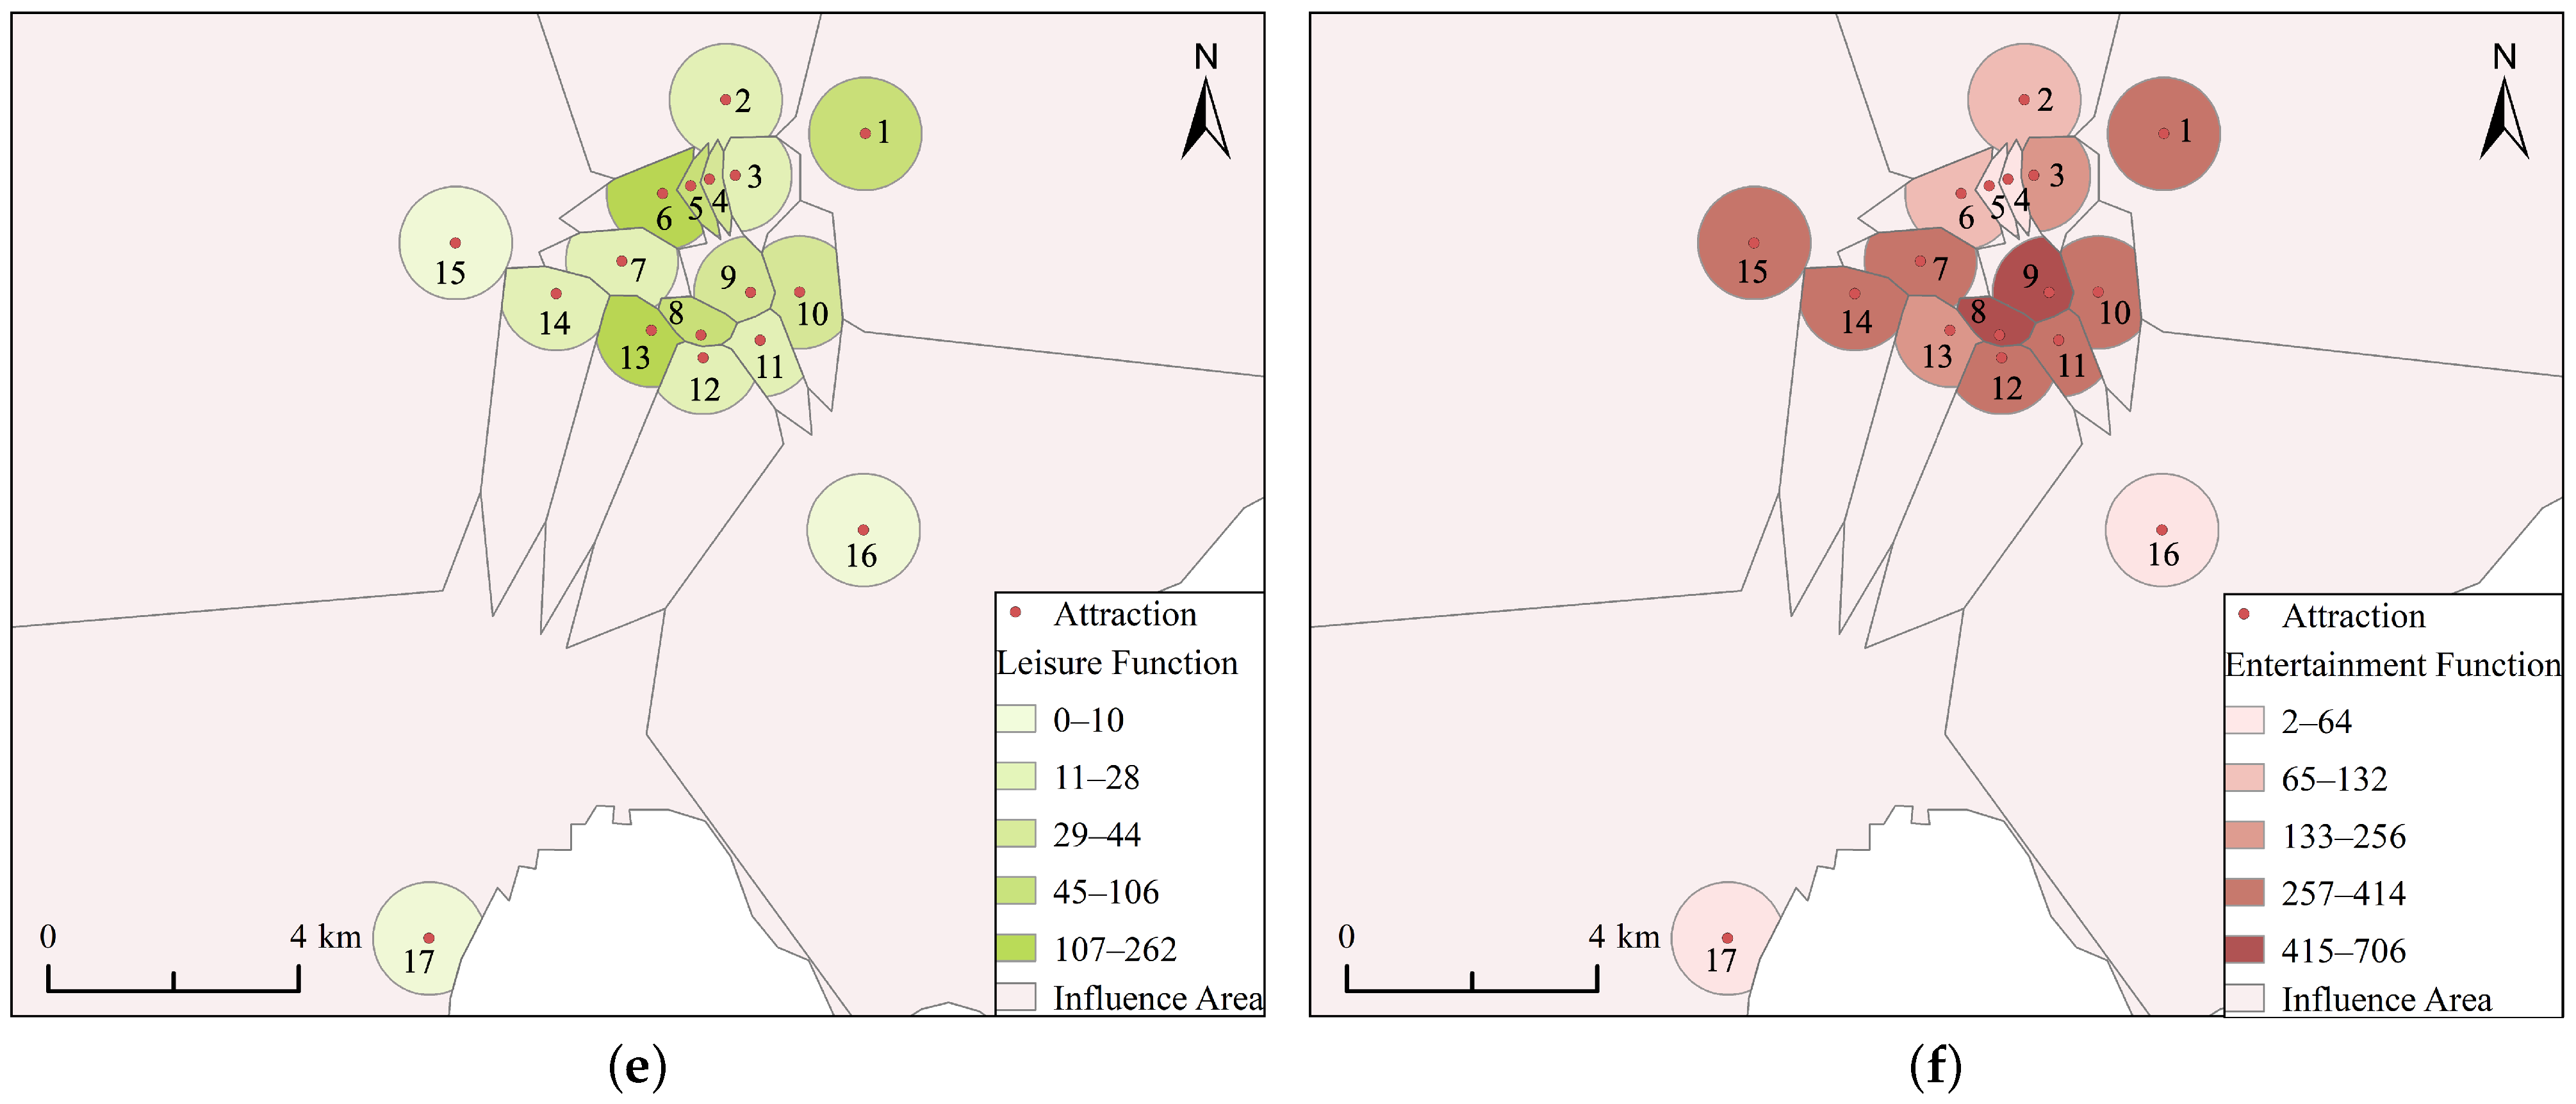
- Intersect the Voronoi regions with the administrative boundaries of Kaifeng main city to define the influence area of each attraction, as shown in Figure 3.
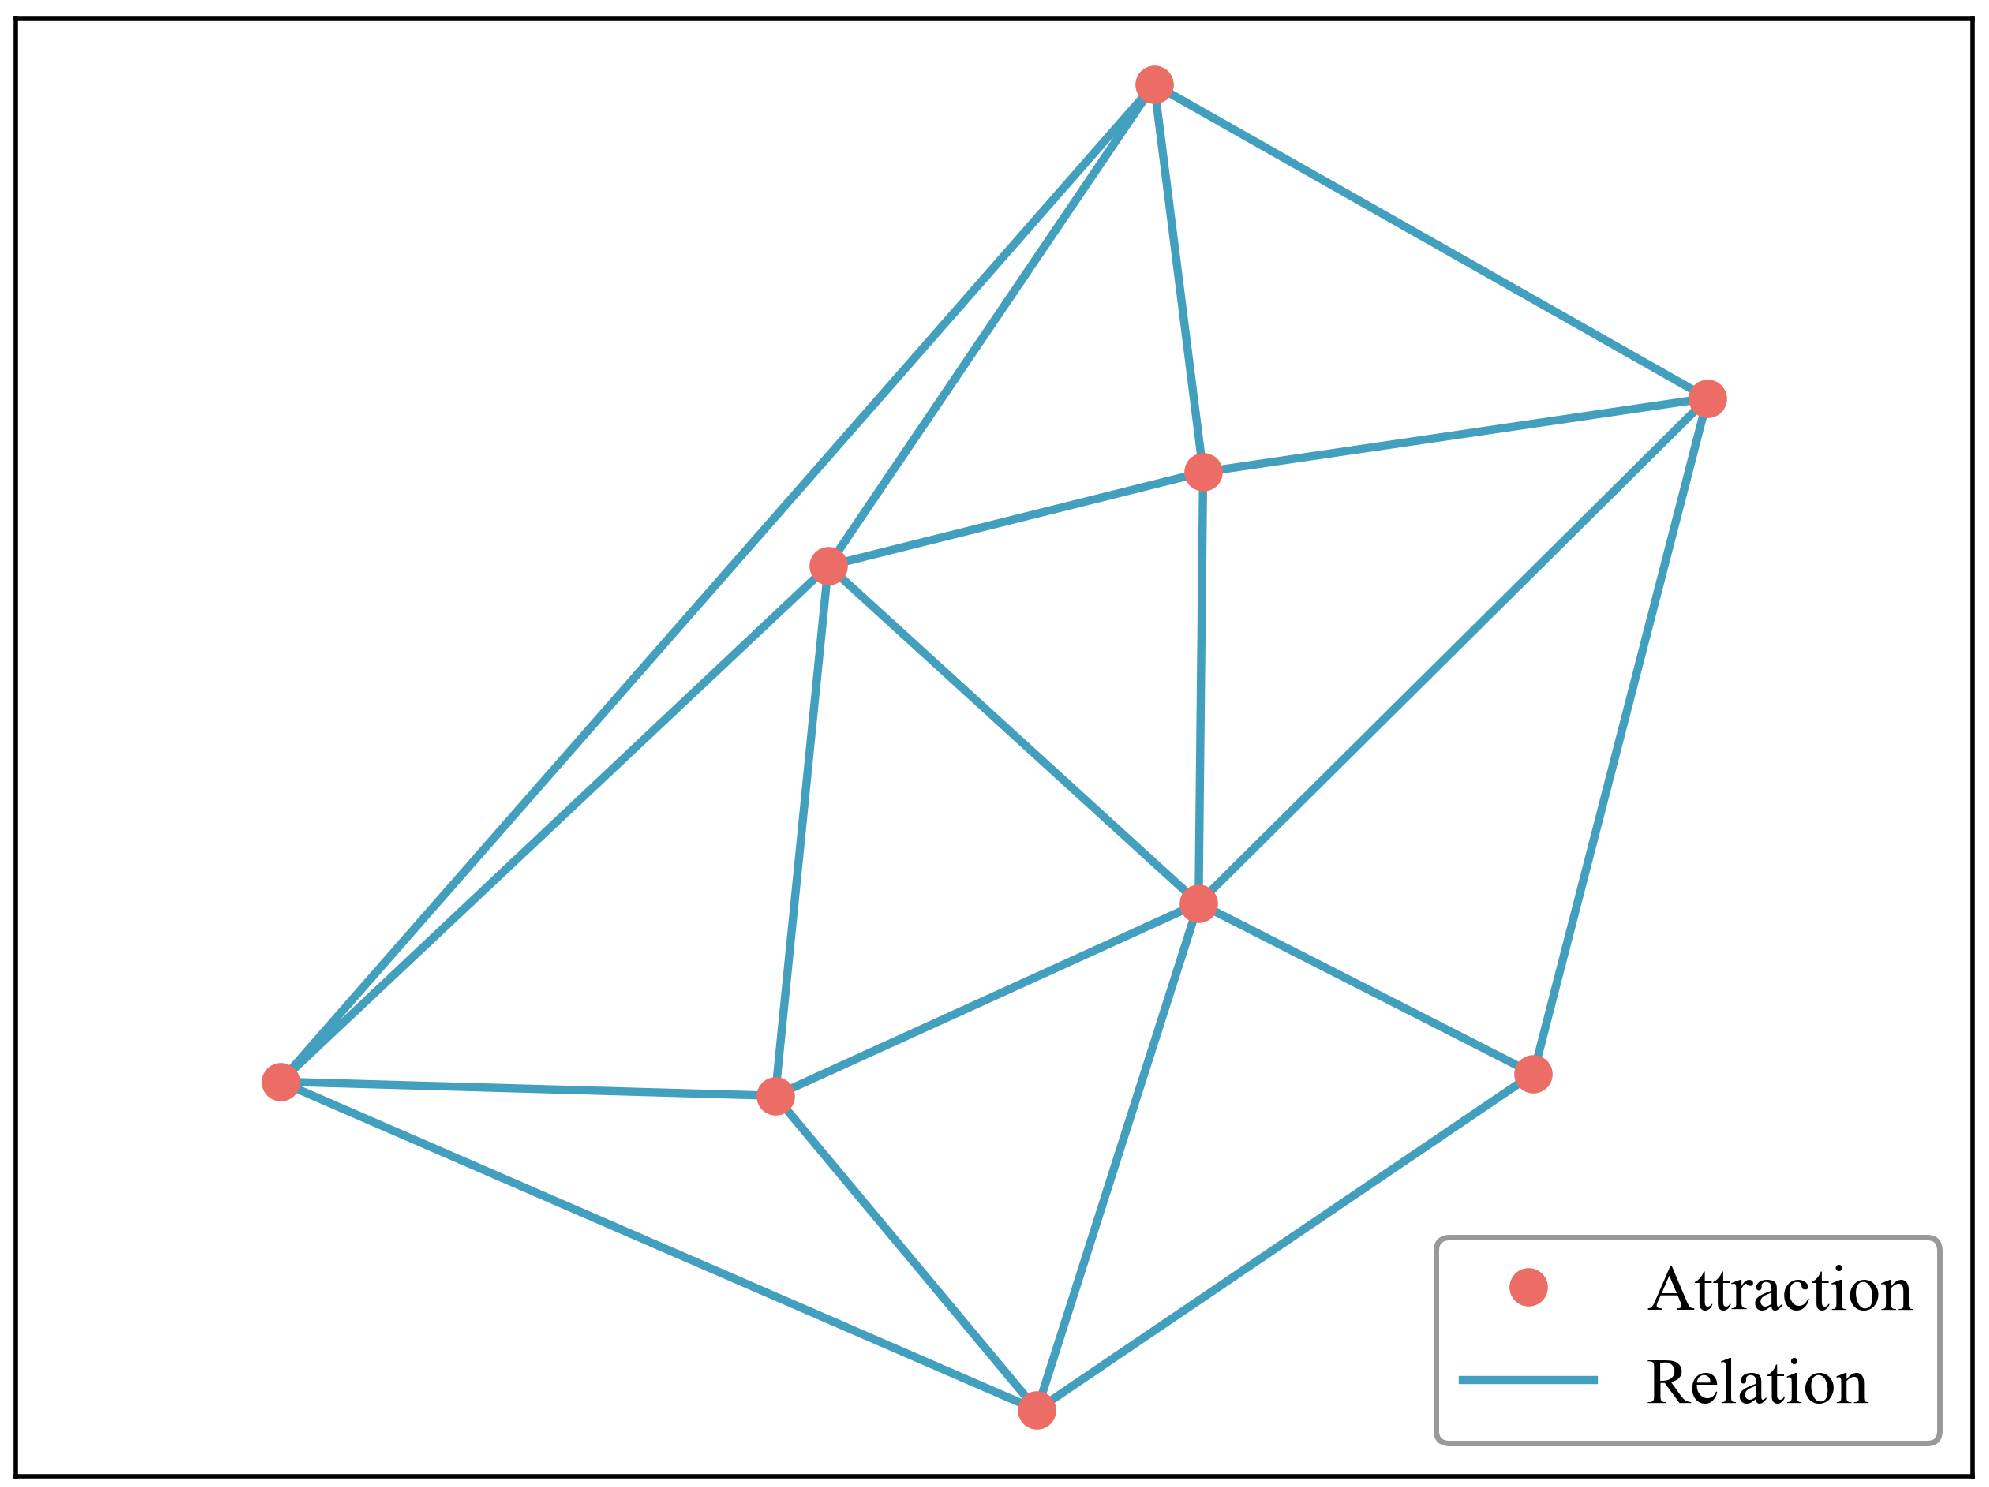
2.2.3. Proximity Relation
2.2.4. Property Design
2.3. Rule-Based Reasoning for Surrounding Vitality Reasoning of Attractions
2.3.1. Functional Characteristic Reasoning
- Step 1.
- Determine the distance threshold dis around the attraction that needs to be queried.
- Step 2.
- Based on the distance threshold dis, carry out the knowledge graph reasoning to obtain the POI within the scope of the research unit.
- Step 3.
- Further statistics of the categories of POI to get the statistical results of each functional category .
- Step 4.
- Based on the calculation results of Step 3, carry out functional diversity calculation according to Equation (1), and get the functional diversity calculation results .
2.3.2. Morphological Characteristics Reasoning
- Step 1.
- Determine the distance threshold dis around the attraction to be queried.
- Step 2.
- Based on the distance threshold dis scenic influence area calculation to obtain the scenic research unit .
- Step 3.
- Reasoning based on the distance threshold dis, obtain the building entities and road entities whose distance from the attraction is less than dis.
- Step 4.
- Calculate the building density based on the scenic research unit and building entities , and obtain the building density calculation results.
- Step 5.
- Calculate the density of road based on the research unit of attraction and road entity , and get the calculation result of road density .
2.3.3. Vitality Reasoning in the Surrounding Attraction Areas
- Step 1.
- Determine the distance threshold dis that needs to be queried around the attraction.
- Step 2.
- Based on Section 2.3.1, conduct functional diversity reasoning within the research unit, and get the functional diversity reasoning result .
- Step 3.
- Based on Section 2.3.2, reason about the road density and building density within the research unit, and get the results of the road density calculation and building density calculation .
- Step 3.
- Based on the results obtained from Step 2 and Step 3, carry out the vitality calculation of the area around the attraction through Equation (3).
3. Experiments and Results
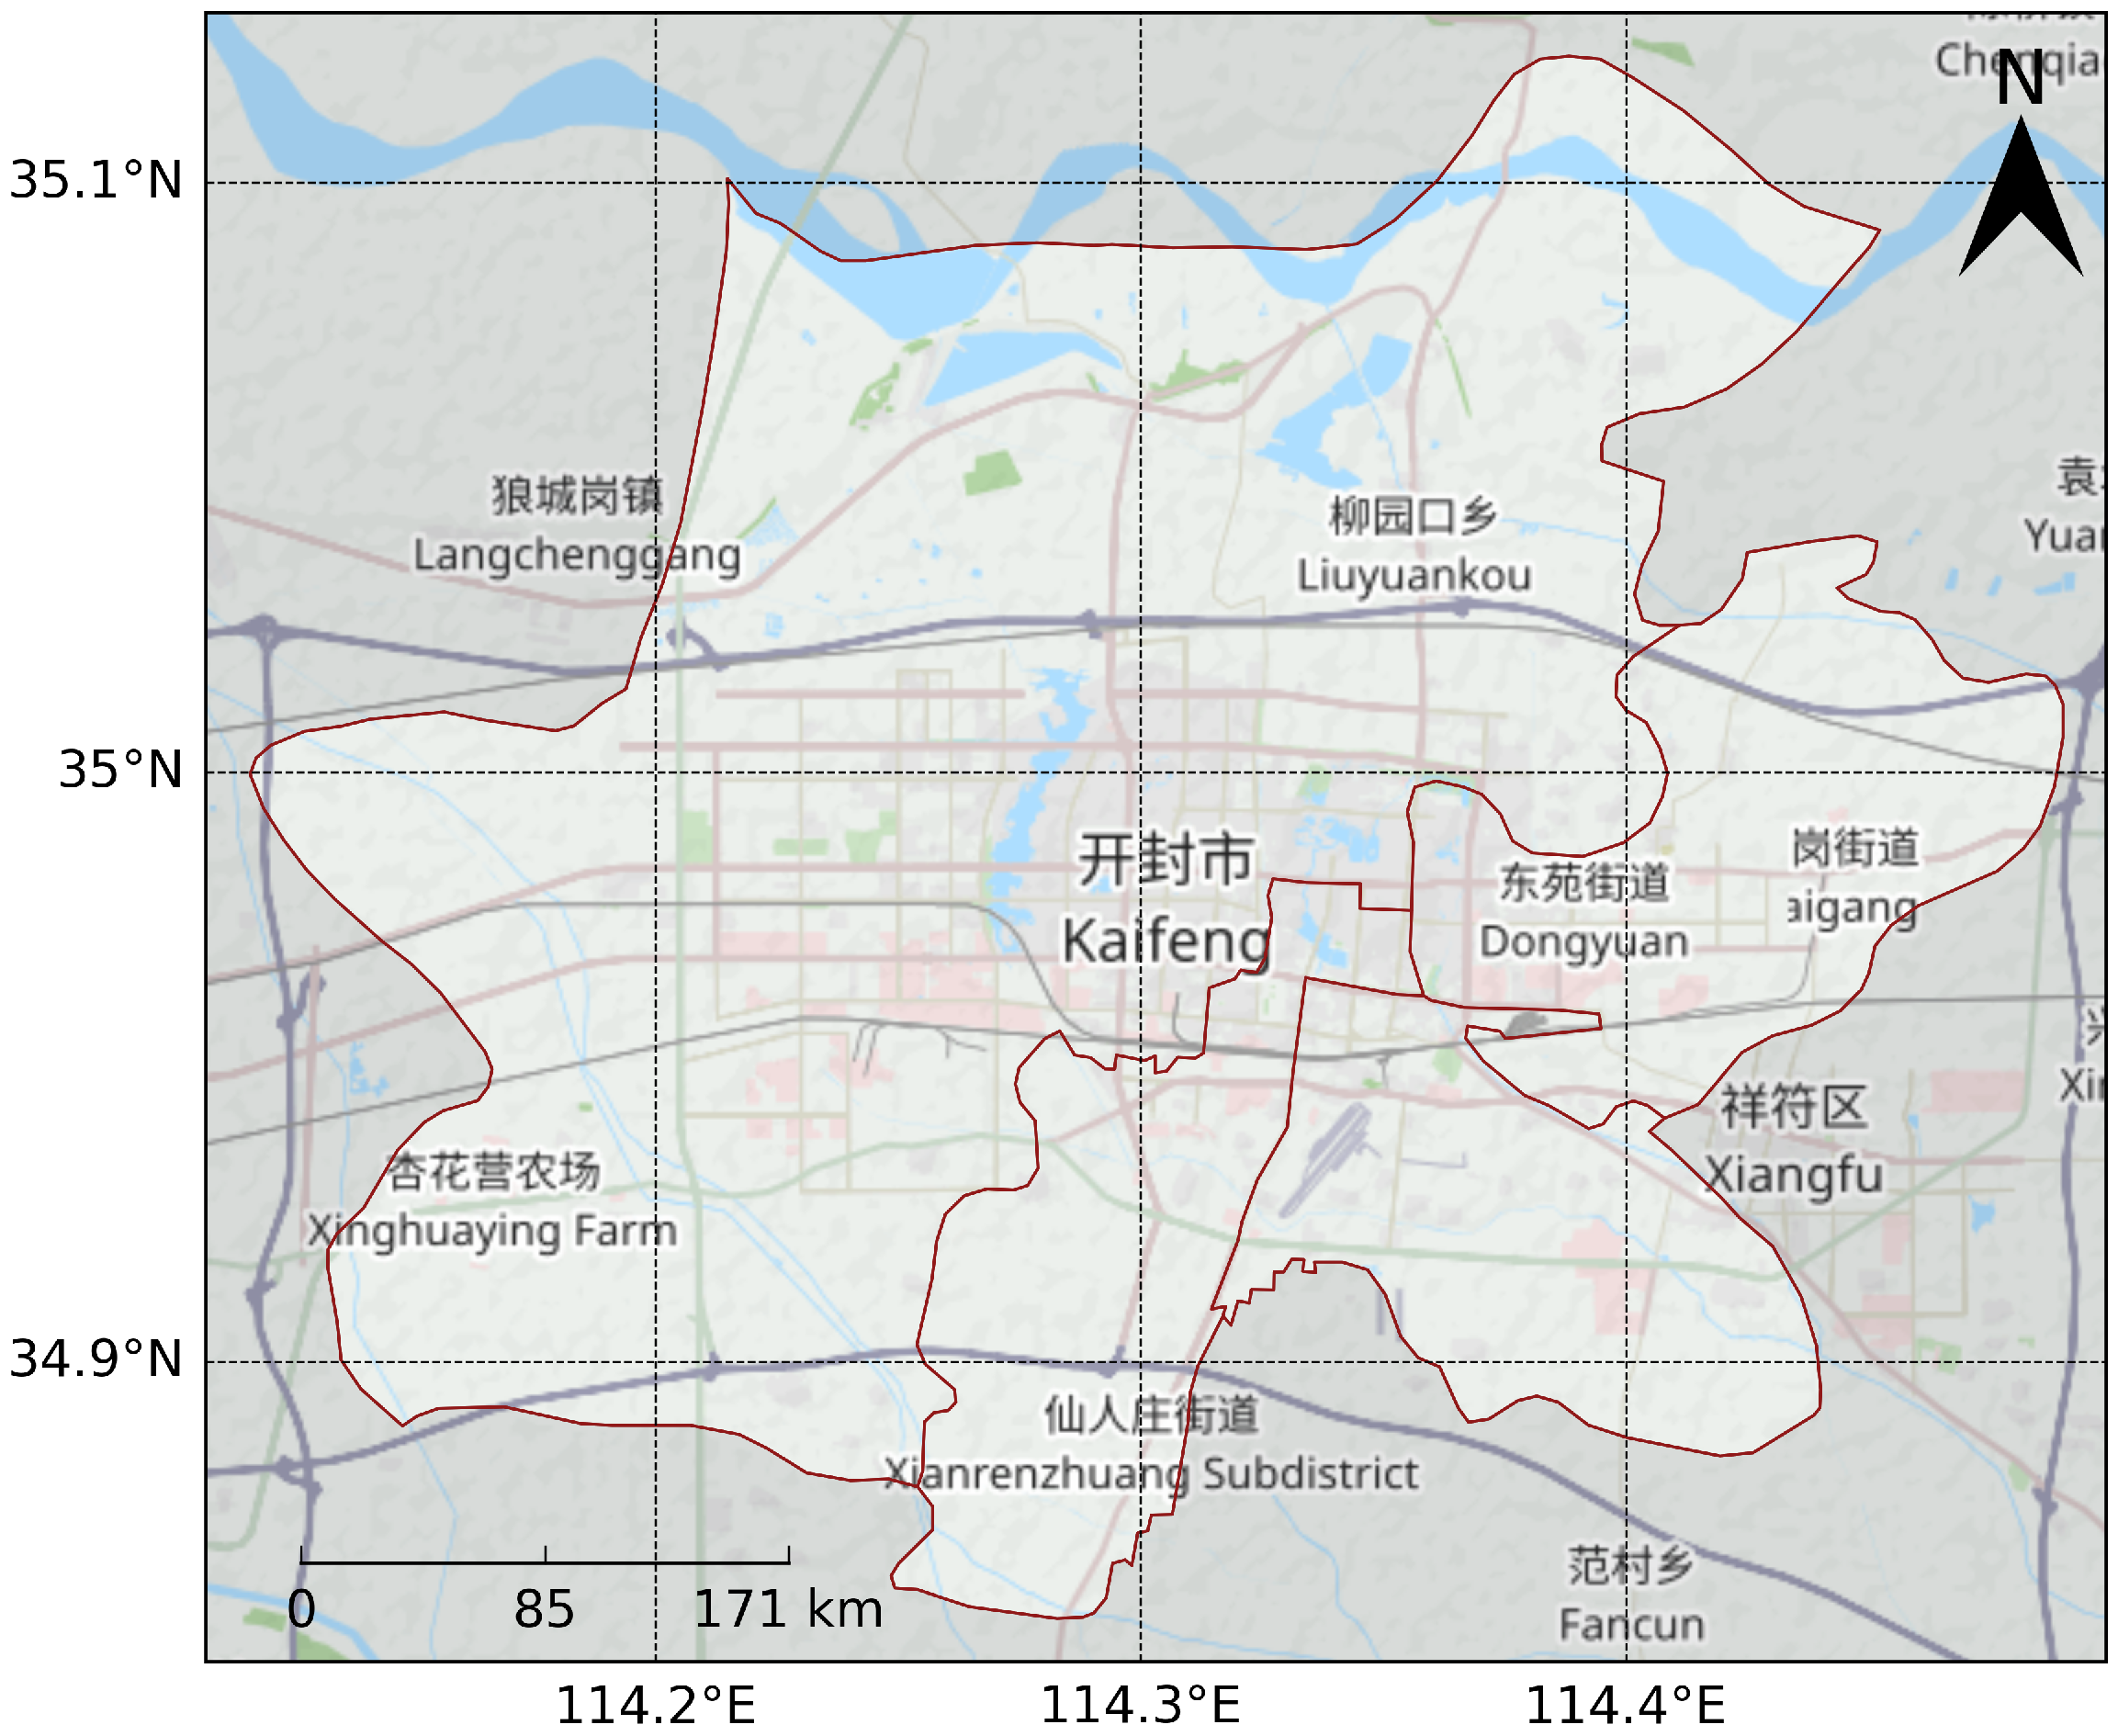
3.1. Study Area and Data
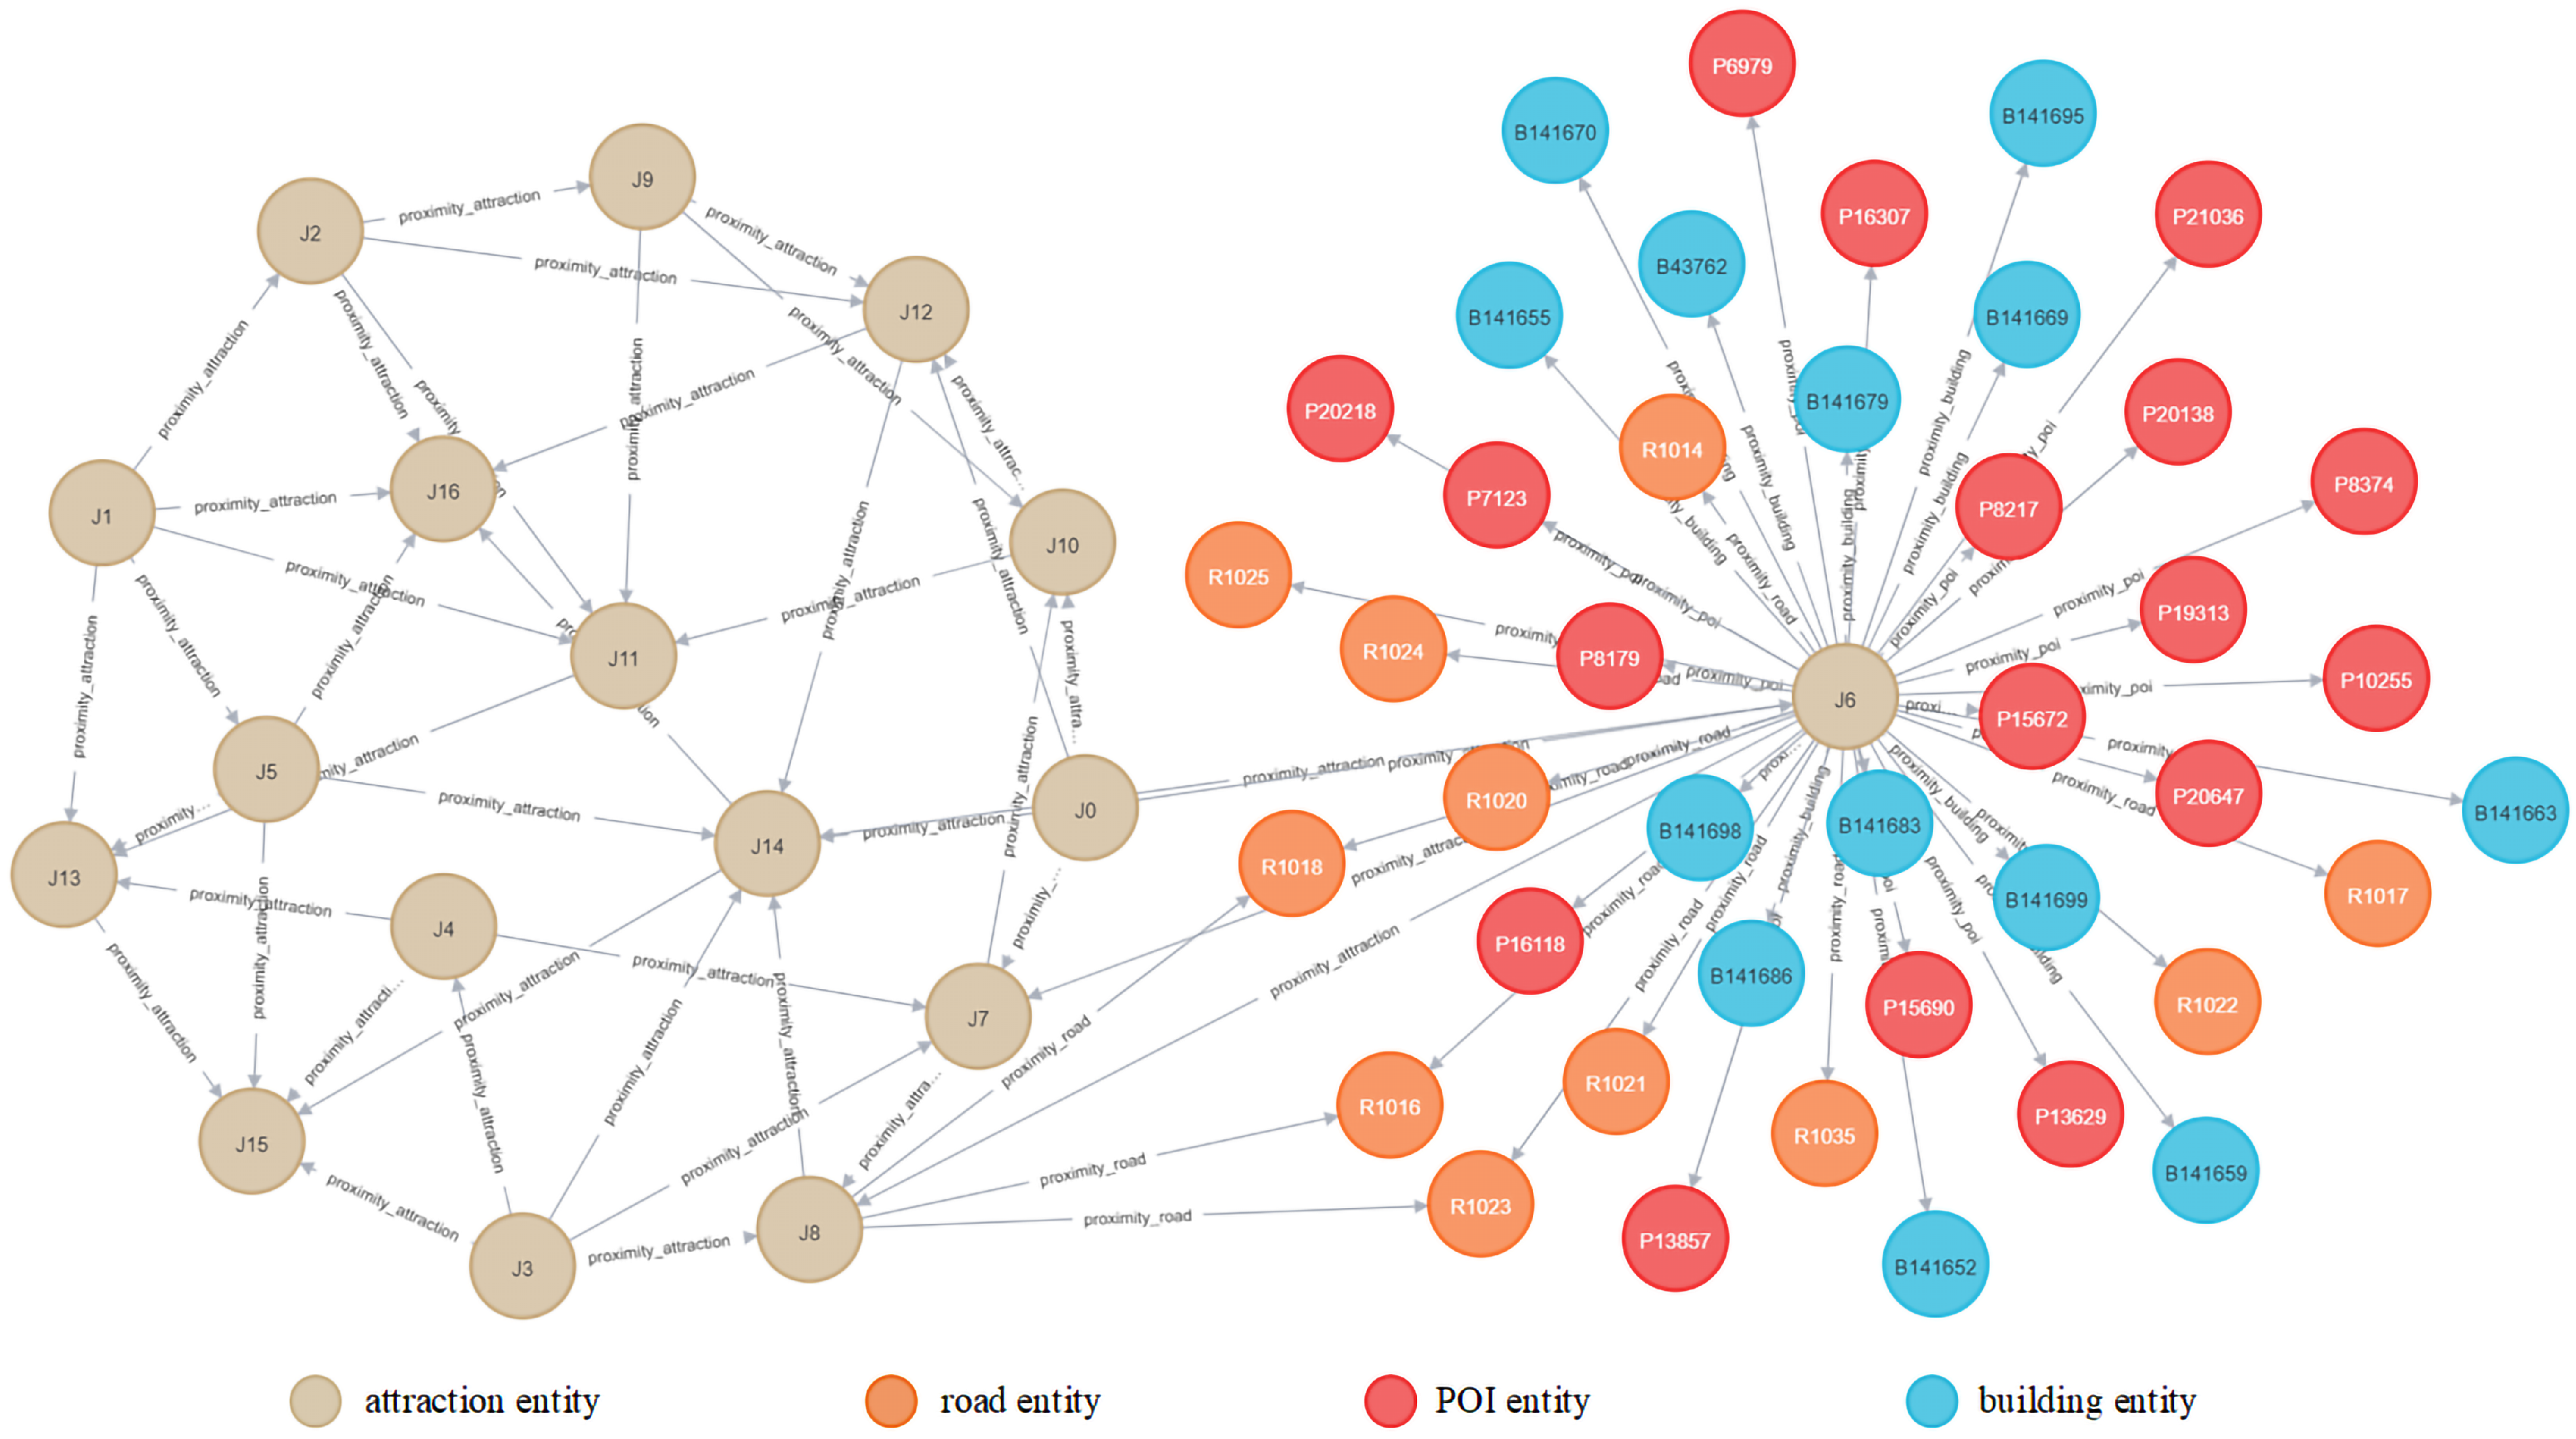
3.2. Attractions Knowledge Graph Construction Results
3.3. Results of Vitality Reasoning of the Surrounding Area of the Attractions
3.3.1. Reasoning About the Functional Characteristics of the Surrounding Area of the Attractions
3.3.2. Reasoning About Morphological Characteristics of the Surrounding Area of the Attractions
3.3.3. Reasoning About Vitality of the Surrounding Area of the Attractions
4. Discussion
5. Conclusions
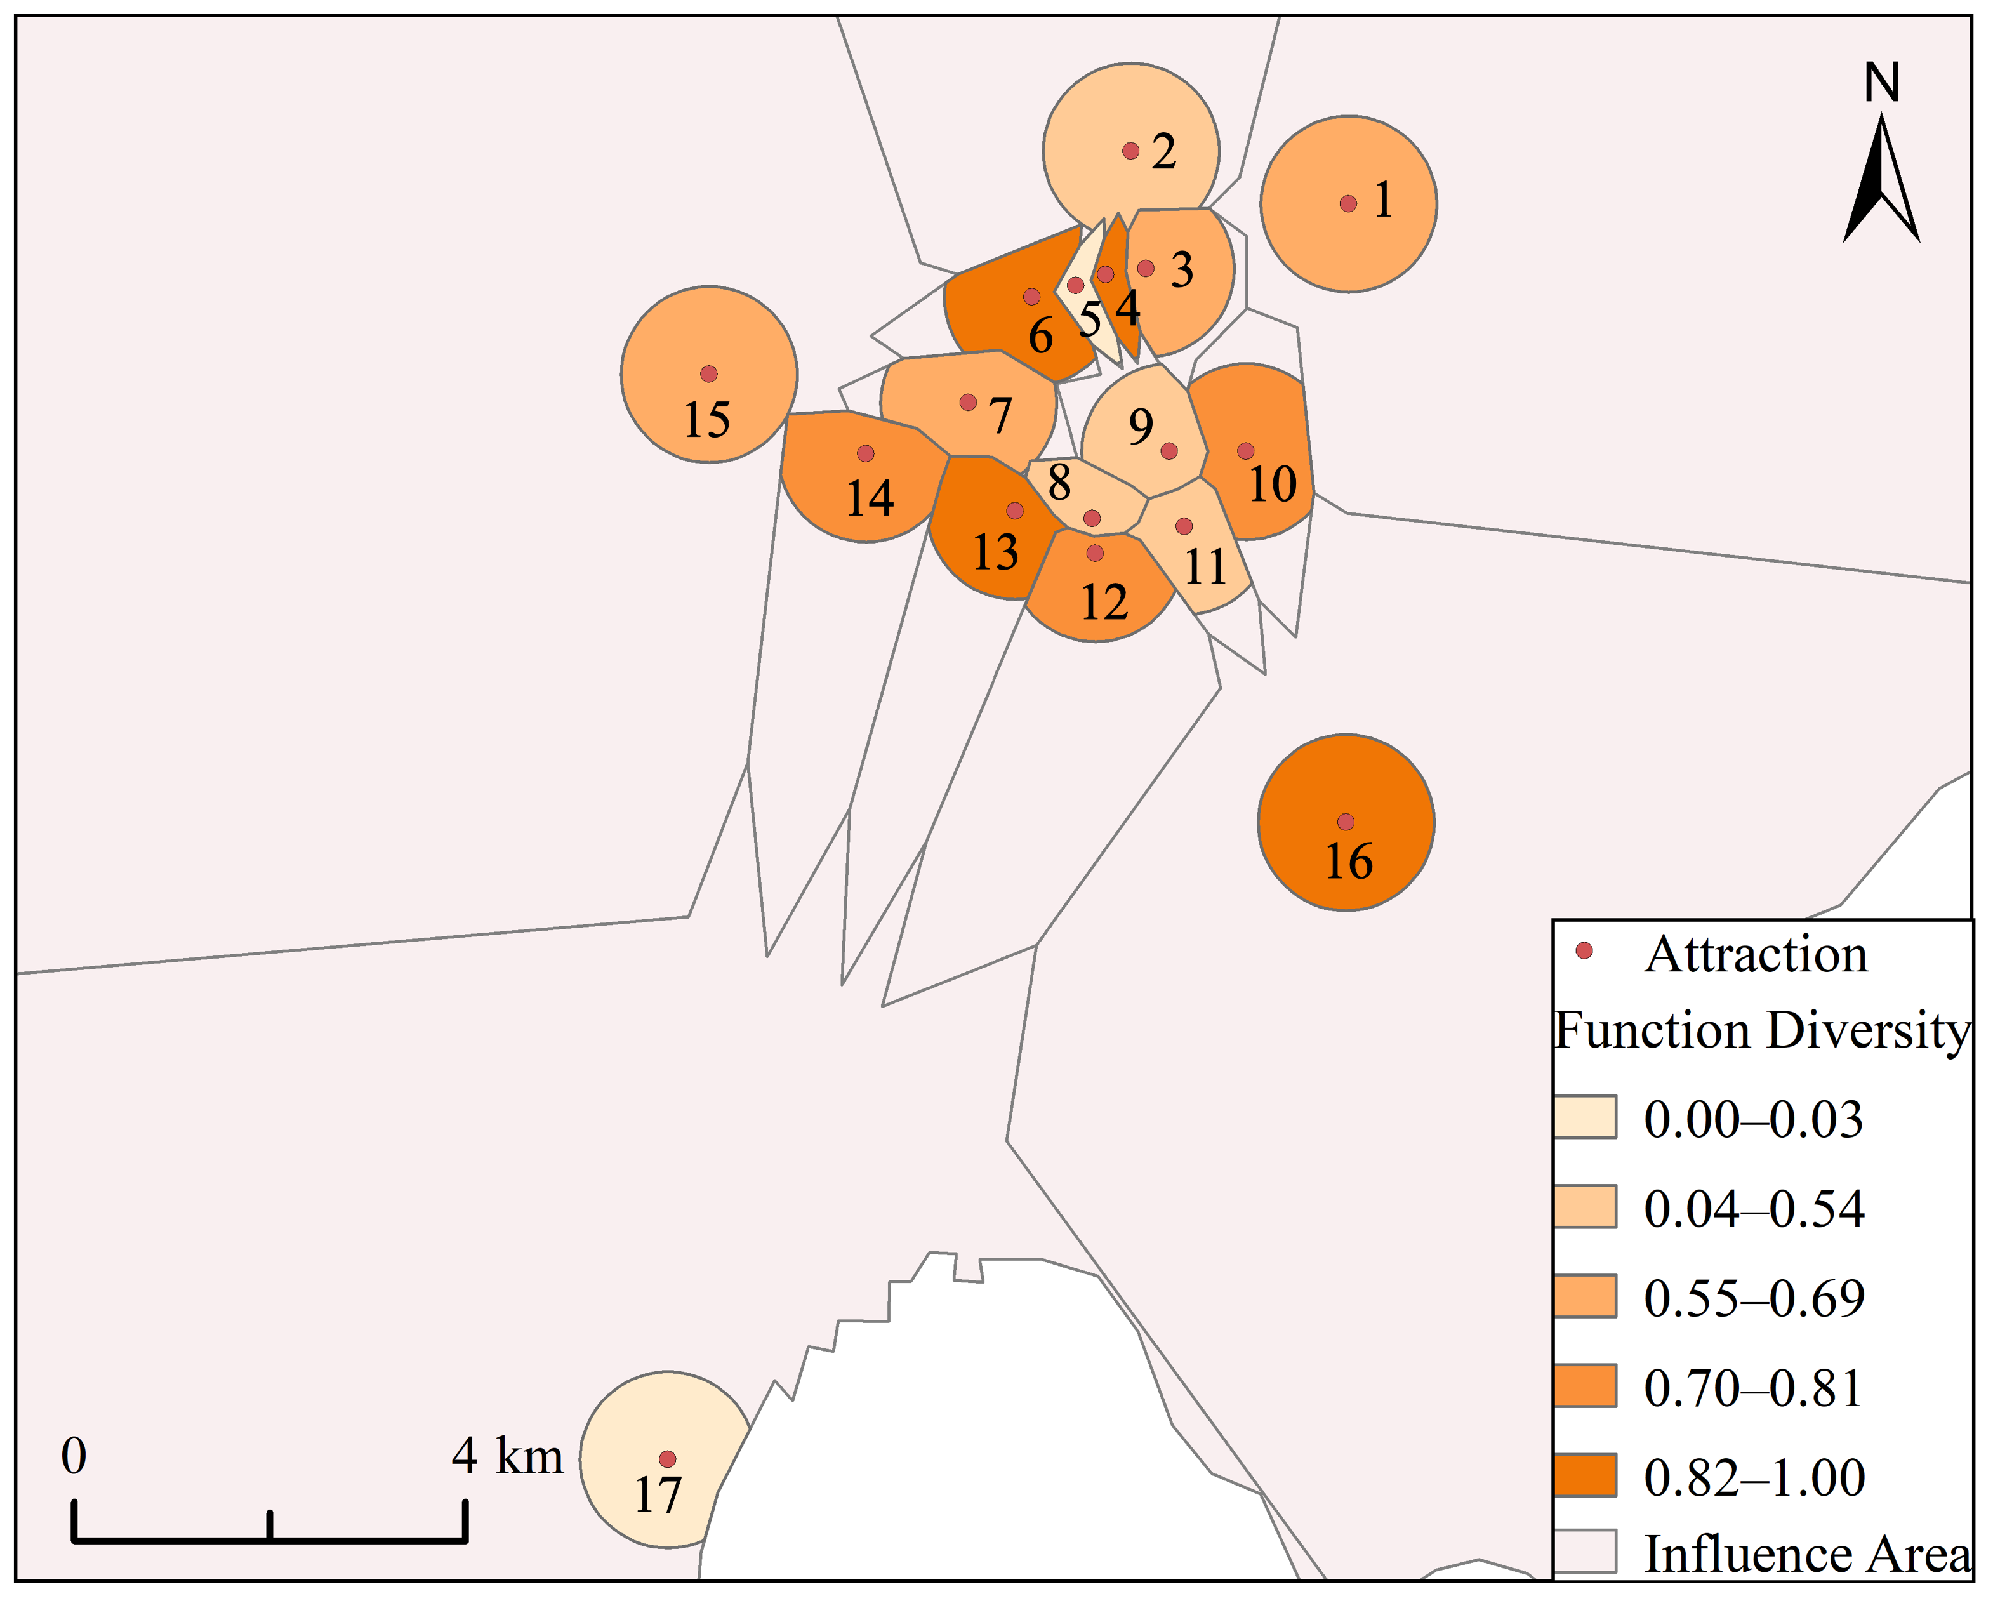
- The areas surrounding attractions in Kaifeng’s main urban district exhibited distinct functional differentiation. Yang Family’s Tianbo Mansion, Millennium City Park, and Lord Bao’s Memorial Temple all exhibited high functional diversity indices, forming a composite functional spatial structure.
- The areas surrounding attractions in Kaifeng’s main urban district exhibited a pronounced feature of morphological integration. Daxiangguo Buddhist Temple possessed distinct morphological characteristics, featuring both high building density and high road network density.
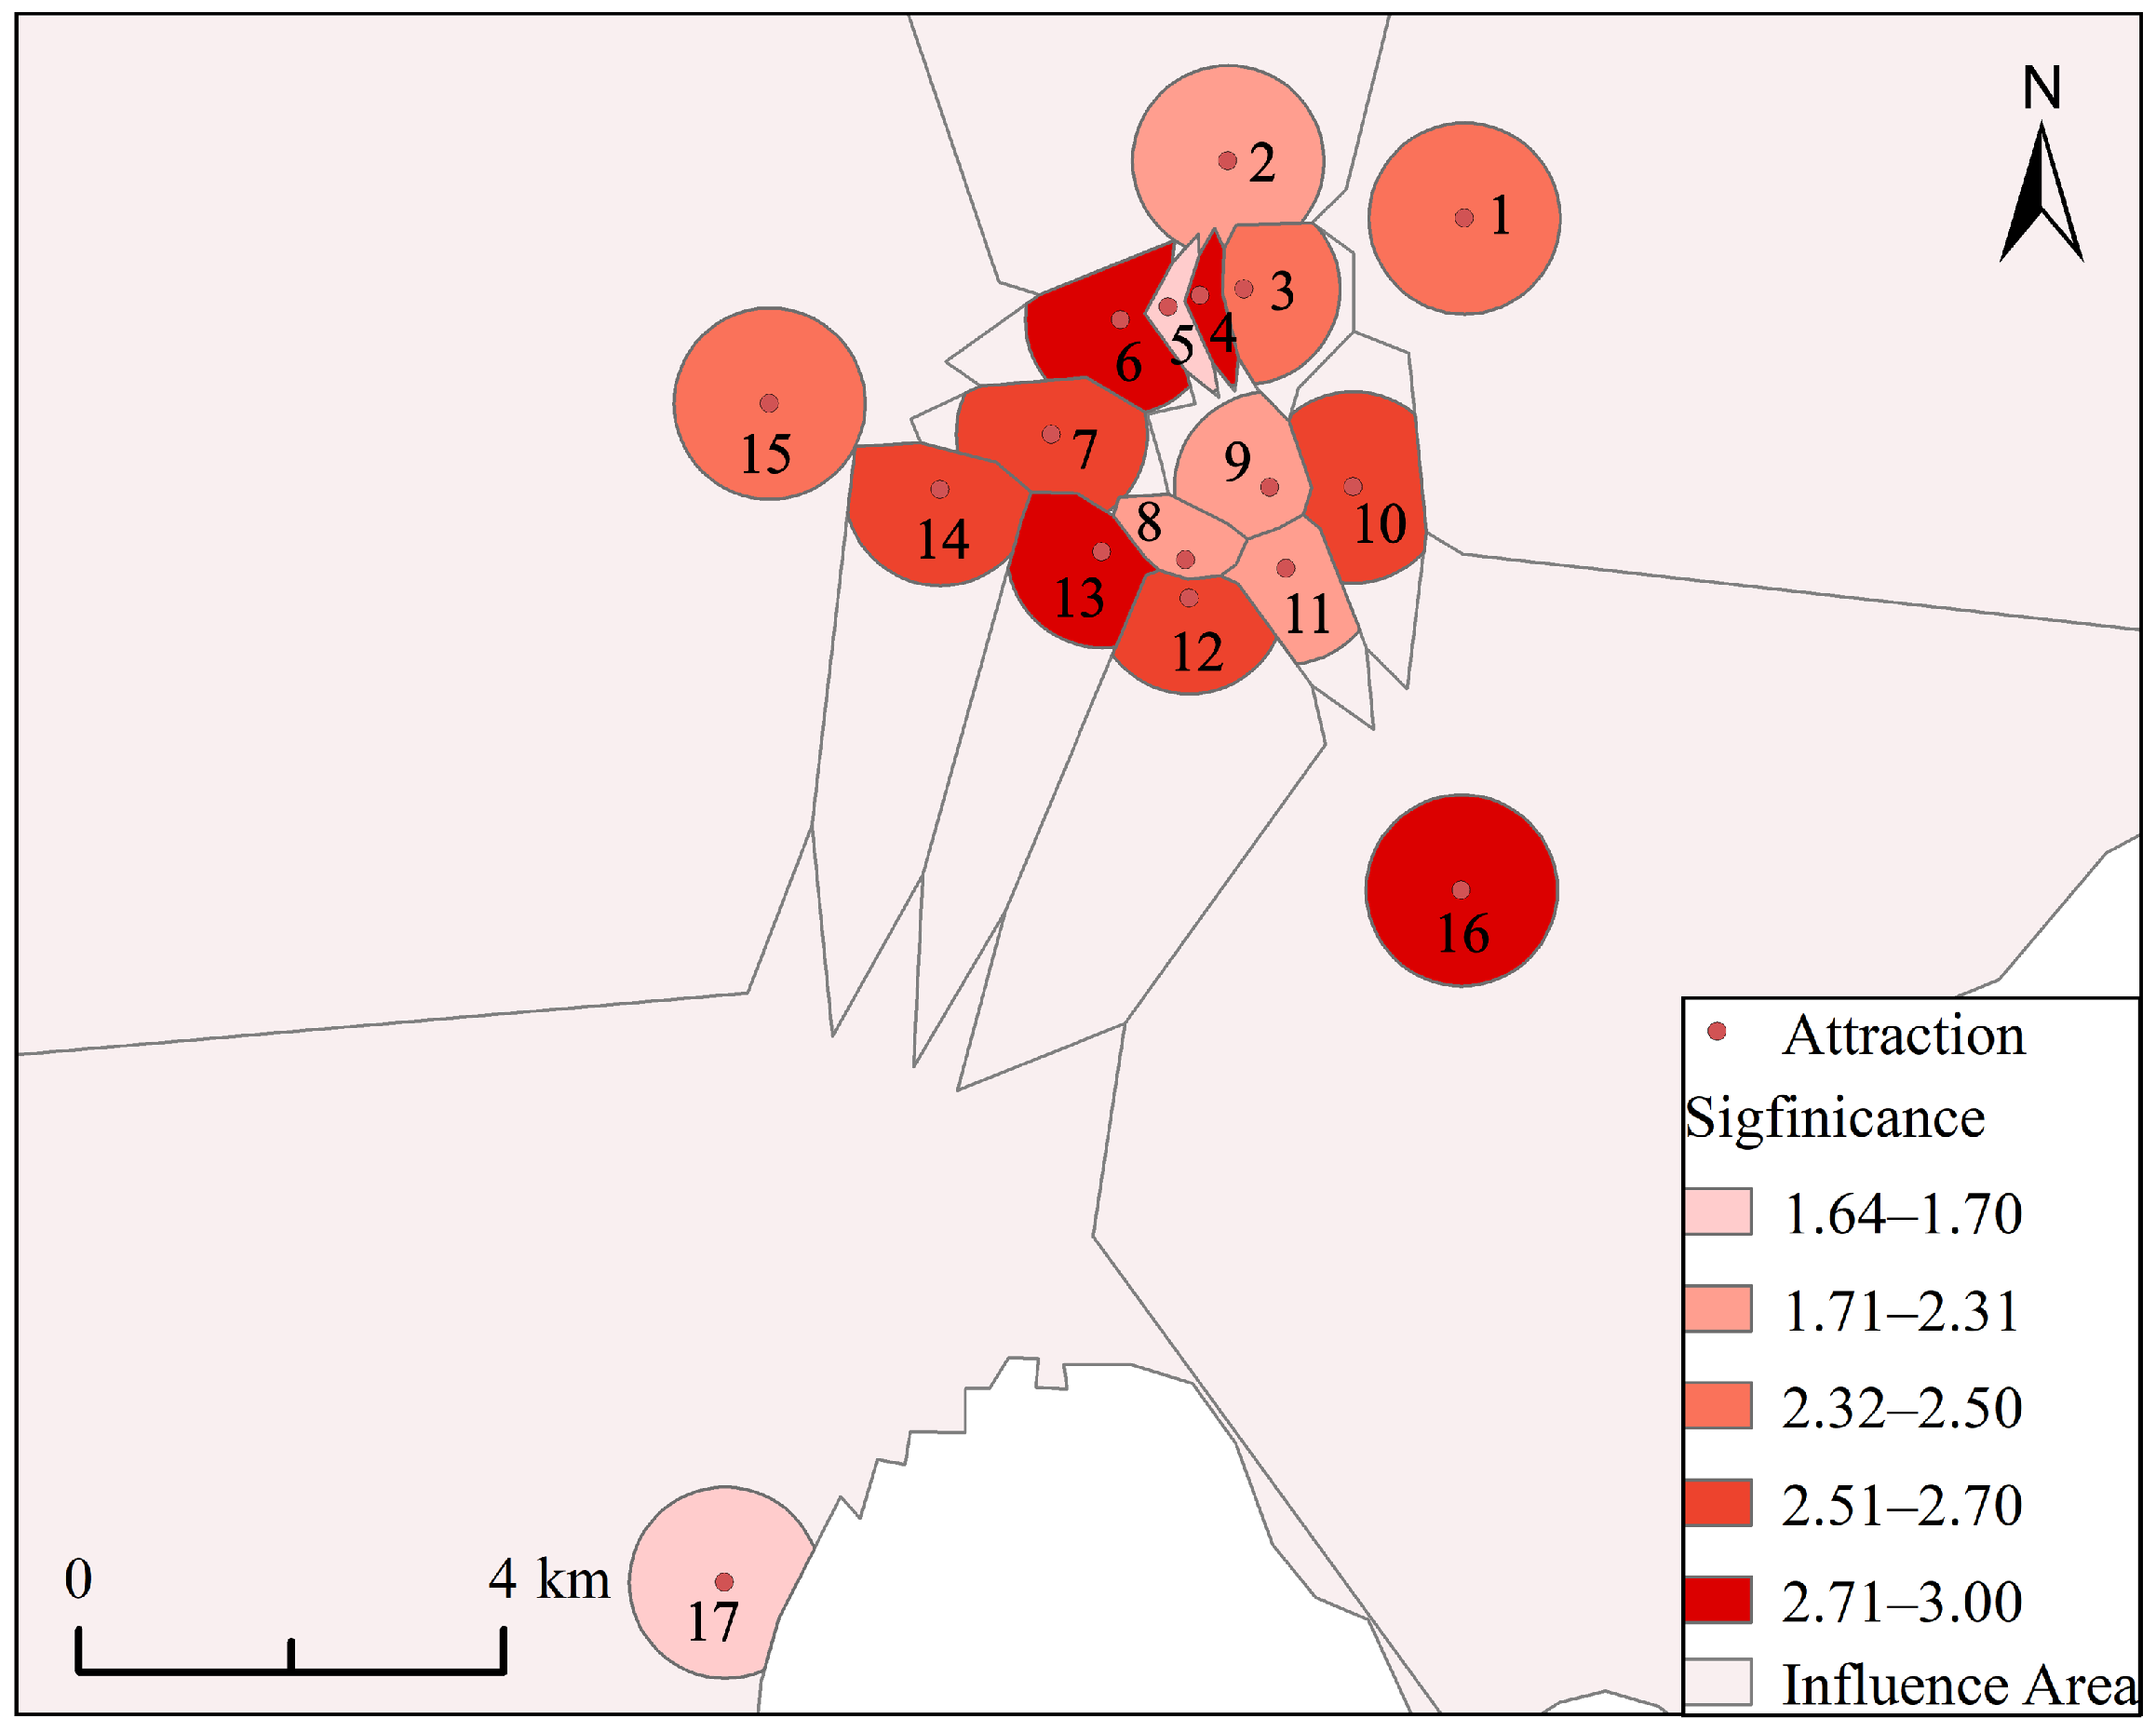
- The vitality level around attractions in the main urban area of Kaifeng City exhibited obvious spatial differentiation. The Yang Family’s Tianbo Mansion, the Millennium City Park, and Lord Bao’s Memorial Temple demonstrated higher vitality values, primarily due to their superior functional complexity and morphological synergy effects. In contrast, Yanqing Taoist Temple, China Han Garden and Stele Forest, and Yudian Rural Tourism Resort exhibited relatively lower vitality values in their surrounding areas.
Author Contributions
Funding
Data Availability Statement
Conflicts of Interest
References
- Jiang, Y.; Huang, Z.; Zhou, X.; Chen, X. Evaluating the impact of urban morphology on urban vitality: An exploratory study using big geo-data. Int. J. Digit. Earth 2024, 17, 2327571. [Google Scholar] [CrossRef]
- Yuan, C.; Ren, S.; He, J. Urban Sprawl and Economic Vitality: Evidence from 284 Cities in China. J. Urban Plan. Dev. 2025, 151, 04025013. [Google Scholar] [CrossRef]
- Zikirya, B.; Xing, Y.; Zhou, C. The Matching Relationship Between the Distribution Characteristics of High-Grade Tourist Attractions and Spatial Vitality in Xinjiang. Sustainability 2024, 16, 9426. [Google Scholar] [CrossRef]
- Maas, P.R. Towards a Theory of Urban Vitality. Ph.D. Dissertation, University of British Columbia, Vancouver, BC, Canada, 1961. [Google Scholar]
- Ma, Z. Deep exploration of street view features for identifying urban vitality: A case study of Qingdao city. Int. J. Appl. Earth Obs. Geoinf. 2023, 123, 103476. [Google Scholar] [CrossRef]
- Nathvani, R.; Cavanaugh, A.; Suel, E.; Bixby, H.; Clark, S.N.; Metzler, A.B.; Nimo, J.; Moses, J.B.; Baah, S.; Arku, R.E.; et al. Measurement of urban vitality with time-lapsed street-view images and object-detection for scalable assessment of pedestrian-sidewalk dynamics. ISPRS J. Photogramm. Remote Sens. 2025, 221, 251–264. [Google Scholar] [CrossRef] [PubMed]
- Wu, Y.; Yang, M.; Li, X.; Wei, X.; Qian, Y. Study on the Influence of Strip-Shaped Urban Rail Transit Stations on Urban Vitality Distribution Based on Point of Interest Data. Appl. Sci. 2025, 15, 2031. [Google Scholar] [CrossRef]
- Wang, T.; Li, Y.; Li, H.; Chen, S.; Li, H.; Zhang, Y. Research on the Vitality Evaluation of Parks and Squares in Medium-Sized Chinese Cities from the Perspective of Urban Functional Areas. Int. J. Environ. Res. Public Health 2022, 19, 15238. [Google Scholar] [CrossRef]
- Chen, J.; Ren, K.; Li, P.; Wang, H.; Zhou, P. Toward effective urban regeneration post-COVID-19: Urban vitality assessment to evaluate people preferences and place settings integrating LBSNs and POI. Environ. Dev. Sustain. 2024. [Google Scholar] [CrossRef]
- Lu, S.; Shi, C.; Yang, X. Impacts of Built Environment on Urban Vitality: Regression Analyses of Beijing and Chengdu, China. Int. J. Environ. Res. Public Health 2019, 16, 4592. [Google Scholar] [CrossRef]
- Zikirya, B.; He, X.; Li, M.; Zhou, C. Urban Food Takeaway Vitality: A New Technique to Assess Urban Vitality. Int. J. Environ. Res. Public Health 2021, 18, 3578. [Google Scholar] [CrossRef]
- Zhang, Z.; Liu, J.; Zhao, Y.; Zhou, Q.; Song, L.; Xu, S. Community-Level Urban Vitality Intensity and Diversity Analysis Supported by Multisource Remote Sensing Data. Remote Sens. 2025, 17, 1056. [Google Scholar] [CrossRef]
- Gan, X.; Huang, L.; Wang, H.; Mou, Y.; Wang, D.; Hu, A. Optimal Block Size for Improving Urban Vitality: An Exploratory Analysis with Multiple Vitality Indicators. J. Urban Plan. Dev. 2021, 147, 04021027. [Google Scholar] [CrossRef]
- Wu, W.; Liu, X.; Zhou, Y.; Zhao, K. Spatial heterogeneity of built environment’s impact on urban vitality using multi-source big data and MGWR. Sci. Rep. 2025, 15, 23459. [Google Scholar] [CrossRef] [PubMed]
- Yue, W.; Chen, Y.; Zhang, Q.; Liu, Y. Spatial Explicit Assessment of Urban Vitality Using Multi-Source Data: A Case of Shanghai, China. Sustainability 2019, 11, 638. [Google Scholar] [CrossRef]
- Yan, W.J.; Liu, S.T. Built Equality and Sustainable Urban Cultural Space: A Case Study of Quanzhou, China. Buildings 2023, 13, 2337. [Google Scholar] [CrossRef]
- Liu, Y.; Ding, J.; Fu, Y.; Li, Y. UrbanKG: An Urban Knowledge Graph System. ACM Trans. Ligent Syst. Technol. 2023, 14, 60. [Google Scholar] [CrossRef]
- Hogan, A.; Blomqvist, E.; Cochez, M.; D’Amato, C.; de Melo, G.; Gutierrez, C.; Kirrane, S.; Labra Gayo, J.E.; Navigli, R.; Neumaier, S.; et al. Knowledge Graphs. ACM Comput. Surv. 2021, 54, 71. [Google Scholar] [CrossRef]
- Gao, J.; Qiu, P.; Yu, L.; Huang, Z.; Lu, F. An interpretable attraction recommendation method based on knowledge graph. Sci. Sin. Informationis 2020, 50, 1055–1068. [Google Scholar] [CrossRef]
- Dsouza, A.; Tempelmeier, N.; Yu, R.; Gottschalk, S.; Demidova, E. WorldKG: A World-Scale Geographic Knowledge Graph. In Proceedings of the 30th ACM International Conference on Information & Knowledge Management (CIKM ’21), Virtual Event, Queensland, Australia, 1–5 November 2021; ACM: New York, NY, USA, 2021; pp. 4475–4484. [Google Scholar] [CrossRef]
- Yang, X.; Li, W.; Chen, Y.; Guo, Y. Construction of a COVID-19 Pandemic Situation Knowledge Graph Considering Spatial Relationships: A Case Study of Guangzhou, China. ISPRS Int. J. Geo-Inf. 2022, 11, 561. [Google Scholar] [CrossRef]
- Li, H.; Zhang, C.; Xiao, Z.; Chen, M.; Lu, D.; Liu, S. A Web-based geo-simulation approach integrating knowledge graph and model-services. Environ. Model. Softw. 2021, 144, 105160. [Google Scholar] [CrossRef]
- Zhang, Y.; Xu, R.; Lu, W.; Mayer, W.; Ning, D.; Duan, Y.; Zeng, X.; Feng, Z. Multi-Modal Spatio-Temporal Knowledge Graph of Ship Management. Appl. Sci. 2023, 13, 9393. [Google Scholar] [CrossRef]
- Yang, H.; He, Q.; Cui, L.; Taha, A.M.M. Exploring the Spatial Relationship between Urban Vitality and Urban Carbon Emissions. Remote Sens. 2023, 15, 2173. [Google Scholar] [CrossRef]
- Li, S.; Wu, C.; Lin, Y.; Li, Z.; Du, Q. Urban Morphology Promotes Urban Vibrancy from the Spatiotemporal and Synergetic Perspectives: A Case Study Using Multisource Data in Shenzhen, China. Sustainability 2020, 12, 4829. [Google Scholar] [CrossRef]
- Gao, C.; Li, S.; Sun, M.; Zhao, X.; Liu, D. Exploring the Relationship between Urban Vibrancy and Built Environment Using Multi-Source Data: Case Study in Munich. Remote Sens. 2024, 16, 1107. [Google Scholar] [CrossRef]
- Liu, F.; Tang, Z.; Zhang, L.; Yu, L.; Liu, K. Exploring the Relationship between Spatiotemporal Distribution of Urban Vibrancy and Neighborhood Attributes by Coupling Multi-Source Data: A Case of Nanshan District in Shenzhen. Trop. Geogr. 2025, 45, 410–422. [Google Scholar] [CrossRef]
- Liu, F.; Andrienko, G.; Andrienko, N.; Chen, S.; Janssens, D.; Wets, G.; Theodoridis, Y. Citywide Traffic Analysis Based on the Combination of Visual and Analytic Approaches. J. Geovisualization Spat. Anal. 2020, 4, 15. [Google Scholar] [CrossRef]
- Huang, X.; Yang, J.; Li, J.; Wen, D. Urban functional zone mapping by integrating high spatial resolution nighttime light and daytime multi-view imagery. ISPRS J. Photogramm. Remote Sens. 2021, 175, 403–415. [Google Scholar] [CrossRef]
- Lin, A.; Sun, X.; Wu, H.; Luo, W.; Wang, D.; Zhong, D.; Wang, Z.; Zhao, L.; Zhu, J. Identifying Urban Building Function by Integrating Remote Sensing Imagery and POI Data. IEEE J. Sel. Top. Appl. Earth Obs. Remote Sens. 2021, 14, 8864–8875. [Google Scholar] [CrossRef]
- Deng, Z.; You, X.; Shi, Z.; Gao, H.; Hu, X.; Yu, Z.; Yuan, L. Identification of Urban Functional Zones Based on the Spatial Specificity of Online Car-Hailing Traffic Cycle. ISPRS Int. J. Geo-Inf. 2022, 11, 435. [Google Scholar] [CrossRef]
- Yang, X.; Bo, S.; Zhang, Z. Classifying Urban Functional Zones Based on Modeling POIs by Deepwalk. Sustainability 2023, 15, 7995. [Google Scholar] [CrossRef]
- Pan, C.; Wu, S.; Li, E.; Li, H.; Liu, X. Identification of urban functional zones in Macau Peninsula based on POI data and remote information sensors technology for sustainable development. Phys. Chem. Earth 2023, 131, 103447. [Google Scholar] [CrossRef]
- Wen, Z.; Zhao, J.; Li, M. A Study on the Influencing Factors of the Vitality of Street Corner Spaces in Historic Districts: The Case of Shanghai Bund Historic District. Buildings 2024, 14, 2947. [Google Scholar] [CrossRef]
- Usui, H.; Teraki, A.; Okunuki, K.i.; Satoh, T. A comparison of neighbourhood relations based on ordinary Delaunay diagrams and area Delaunay diagrams: An application to define the neighbourhood relations of buildings. Int. J. Geogr. Inf. Sci. 2020, 34, 2177–2203. [Google Scholar] [CrossRef]
- Su, Y.; Xu, Q.; Zhu, X.; Zhang, F.; Liu, Y. Automatic Functional Classification of Buildings Supported by a POI Semantic Characterization Knowledge Graph. ISPRS Int. J. Geo-Inf. 2024, 13, 285. [Google Scholar] [CrossRef]
- Xu, X.; Genovese, P.V.; Zhao, Y.; Liu, Y.; Woldesemayat, E.M.; Zoure, A.N. Geographical Distribution Characteristics of Ethnic-Minority Villages in Fujian and Their Relationship with Topographic Factors. Sustainability 2022, 14, 7727. [Google Scholar] [CrossRef]
- Cui, Y.; Zha, G.; Wang, Q.; Dang, Y.; Shi, K.; Duan, X.; Xu, D.; Huang, B. Evaluating the community commercial vitality using multi-source data: A case study of Hangzhou, China. Giscience Remote Sens. 2025, 62, 2451335. [Google Scholar] [CrossRef]




| Functional Factor | Description |
|---|---|
| Business Function | Share of business POIs in the study unit, including corporations, finance, government agencies, education and training, hotels, culture and media. |
| Transportation Function | Share of transportation POI in the study unit, including transportation facilities. |
| Residential Function | Share of residential POIs in the study unit, including real estate. |
| Life Function | POI of living services in the research unit, including life services, automobile services, medical care, beauty salons, sports and fitness. |
| Leisure Function | Share of leisure POI in the study unit, including tourist attractions, recreation and entertainment. |
| Entertainment Function | Share of entertainment POI in the study unit, including shopping, gourmet food. |
| Morphological Factor | Description | Formula |
|---|---|---|
| Road density | Ratio of road n length to unit area within the study unit | |
| Building density | Ratio of building area to unit area within a study unit |
| Type | Name | Property | Description |
|---|---|---|---|
| Entity | Attraction | jid | Unique identifier of the attraction entity. |
| crs | Spatial reference of the current entity. | ||
| name | Name of the current attraction entity. | ||
| level | Level of the current attraction entity. | ||
| geometry | Geometric information of the current attraction entity. | ||
| POI | pid | Unique identifier of the POI entity. | |
| name | Name of the POI entity. | ||
| class | Functional class of the POI entity. | ||
| geometry | Geometric information of the POI entity. | ||
| Road | rid | Unique identifier of the road entity. | |
| level | Class of the current road entity. | ||
| length | Length of the current road entity. | ||
| geometry | Geometric information of the current road entity. | ||
| Building | bid | Unique identification of the building. | |
| area | Area of the current building entity. | ||
| geometry | Geometric information about the current building entity. | ||
| Relation | Proximity_attraction | id | Unique identifier of the relation between two attractions with a proximity relationship. |
| distance | Distance between the current attractions. | ||
| Proximity_poi | id | Unique identifier of the relation between attraction and POI with a proximity relationship. | |
| distance | Distance between the current attraction and POI. | ||
| Proximity_road | id | Unique identifier of the relation between attraction and road with a proximity relationship. | |
| distance | Distance between the current attraction and the road. | ||
| Proximity_building | id | Unique identifier of the relation between attraction and building with a proximity relationship. | |
| distance | Distance between the current attraction and the building. |
| Data | Data Source | Geometry | Access Date | URL |
|---|---|---|---|---|
| Road | Open Street Map | Linestring | 14 January 2025 | https://www.openstreetmap.org/ |
| Building | Amap | Polygon | 14 January 2025 | https://ditu.amap.com/ |
| POI | Amap | Point | 14 January 2025 | https://ditu.amap.com/ |
| Type | Name | Number |
|---|---|---|
| Entity | Attraction | 17 |
| POI | 9190 | |
| Road | 11,446 | |
| Building | 283,732 | |
| Relation | Proximity_attraction | 43 |
| Proximity_poi | 9190 | |
| Proximity_road | 12,440 | |
| Proximity_building | 286,214 |
| Index | Attraction | Business | Transportation | Residential | Life | Leisure | Entertainment | Function Diversity | Buildiing Density | Road Density | Significance |
|---|---|---|---|---|---|---|---|---|---|---|---|
| 1 | Iron Pagoda Scenic Area | 106 | 16 | 506 | 122 | 68 | 288 | 0.61 | 0.32 | 0.26 | 2.44 |
| 2 | Wansui Mountain Song Dynasty Martial Arts City | 90 | 20 | 324 | 66 | 16 | 84 | 0.50 | 0.26 | 0.23 | 2.29 |
| 3 | Dragon Pavilion Scenic Area | 94 | 2 | 70 | 78 | 14 | 180 | 0.65 | 0.82 | 0.48 | 2.48 |
| 4 | Yang Family’s Tianbo Mansion | 30 | 4 | 36 | 18 | 32 | 64 | 1.00 | 0.38 | 1.00 | 2.95 |
| 5 | China Han Garden and Stele Forest | 8 | 4 | 0 | 16 | 106 | 26 | 0.04 | 0.00 | 0.98 | 1.70 |
| 6 | Millennium City Park | 40 | 28 | 92 | 86 | 262 | 132 | 0.90 | 0.14 | 0.53 | 2.82 |
| 7 | Kaifeng City Wall | 100 | 16 | 112 | 90 | 28 | 302 | 0.69 | 0.39 | 0.48 | 2.54 |
| 8 | Yanqing Taoist Temple | 112 | 6 | 56 | 102 | 78 | 528 | 0.33 | 0.86 | 0.81 | 2.05 |
| 9 | Shan-Shaan-Gan Guild Hall | 212 | 24 | 174 | 186 | 44 | 706 | 0.51 | 0.72 | 0.60 | 2.29 |
| 10 | Liu Shaoqi Memorial Hall | 118 | 12 | 96 | 90 | 44 | 302 | 0.73 | 0.74 | 0.49 | 2.58 |
| 11 | Daxiangguo Buddhist Temple | 126 | 14 | 94 | 102 | 22 | 372 | 0.54 | 1.00 | 0.89 | 2.32 |
| 12 | Kaifeng Prefecture | 166 | 16 | 162 | 148 | 28 | 304 | 0.81 | 0.83 | 0.66 | 2.69 |
| 13 | Lord Bao’s Memorial Temple | 144 | 16 | 34 | 106 | 188 | 256 | 0.86 | 0.36 | 0.50 | 2.77 |
| 14 | Imperial Song Cultural Park | 152 | 22 | 264 | 120 | 18 | 302 | 0.74 | 0.60 | 0.33 | 2.61 |
| 15 | Bianliang Song City | 162 | 28 | 262 | 98 | 10 | 414 | 0.59 | 0.43 | 0.50 | 2.41 |
| 16 | Yuwang Terrace Scenic Area | 28 | 26 | 106 | 58 | 4 | 48 | 0.85 | 0.26 | 0.00 | 2.75 |
| 17 | Yudian Rural Tourism Resort | 6 | 0 | 0 | 4 | 0 | 2 | 0.00 | 0.05 | 0.05 | 1.65 |
Disclaimer/Publisher’s Note: The statements, opinions and data contained in all publications are solely those of the individual author(s) and contributor(s) and not of MDPI and/or the editor(s). MDPI and/or the editor(s) disclaim responsibility for any injury to people or property resulting from any ideas, methods, instructions or products referred to in the content. |
© 2025 by the authors. Published by MDPI on behalf of the International Society for Photogrammetry and Remote Sensing. Licensee MDPI, Basel, Switzerland. This article is an open access article distributed under the terms and conditions of the Creative Commons Attribution (CC BY) license (https://creativecommons.org/licenses/by/4.0/).
Share and Cite
Liu, Y.; Wu, L.; Su, Y. Surrounding Vitality Reasoning of Attractions Supported by Knowledge Graph. ISPRS Int. J. Geo-Inf. 2025, 14, 400. https://doi.org/10.3390/ijgi14100400
Liu Y, Wu L, Su Y. Surrounding Vitality Reasoning of Attractions Supported by Knowledge Graph. ISPRS International Journal of Geo-Information. 2025; 14(10):400. https://doi.org/10.3390/ijgi14100400
Chicago/Turabian StyleLiu, Yi, Lili Wu, and Youneng Su. 2025. "Surrounding Vitality Reasoning of Attractions Supported by Knowledge Graph" ISPRS International Journal of Geo-Information 14, no. 10: 400. https://doi.org/10.3390/ijgi14100400
APA StyleLiu, Y., Wu, L., & Su, Y. (2025). Surrounding Vitality Reasoning of Attractions Supported by Knowledge Graph. ISPRS International Journal of Geo-Information, 14(10), 400. https://doi.org/10.3390/ijgi14100400


