Article

Harnessing GPS Spatiotemporal Big Data to Enhance Visitor Experience and Sustainable Management of UNESCO Heritage Sites: A Case Study of Mount Huangshan, China

1
School of Geography and Planning, Chizhou University, Chizhou 247000, China
2
Research Center for Agricultural Ecological Resources and Environment, Chizhou University, Chizhou 247000, China
*
Author to whom correspondence should be addressed.
ISPRS Int. J. Geo-Inf. 2025, 14(10), 396; https://doi.org/10.3390/ijgi14100396 (registering DOI)
Submission received: 12 August 2025 / Revised: 7 October 2025 / Accepted: 10 October 2025 / Published: 12 October 2025
(This article belongs to the Special Issue Spatial Information for Improved Living Spaces)

Abstract

In the era of big data, the rapid proliferation of user-generated content enriched with geolocations offers new perspectives and datasets for probing the spatiotemporal dynamics of tourist mobility. Mining large-scale geospatial traces has become central to tourism geography: it reveals preferences for attractions and routes to enable intelligent recommendation, enhance visitor experience, and advance smart tourism, while also informing spatial planning, crowd management, and sustainable destination development. Using Mount Huangshan—a UNESCO World Cultural and Natural Heritage site—as a case study, we integrate GPS trajectories and geo-tagged photographs from 2017–2023. We apply a Density-Field Hotspot Detector (DF-HD), a Space–Time Cube (STC), and spatial gridding to analyze behavior from temporal, spatial, and fully spatiotemporal perspectives. Results show a characteristic “double-peak, double-trough” seasonal pattern in the number of GPS tracks, cumulative track length, and geo-tagged photos. Tourist behavior exhibits pronounced elevation dependence, with clear vertical differentiation. DF-HD efficiently delineates hierarchical hotspot areas and visitor interest zones, providing actionable evidence for demand-responsive crowd diversion. By integrating sequential time slices with geography in a 3D framework, the STC exposes dynamic spatiotemporal associations and evolutionary regularities in visitor flows, supporting real-time crowd diagnosis and optimized spatial resource allocation. Comparative findings further confirm that Huangshan’s seasonal intensity is significantly lower than previously reported, while the high agreement between trajectory density and gridded photos clarifies the multi-tier clustering of route popularity. These insights furnish a scientific basis for designing secondary tour loops, alleviating pressure on core areas, and charting an effective pathway toward internal structural optimization and sustainable development of the Mount Huangshan Scenic Area.

1. Introduction

1.1. Background and Challenges

China’s tourism industry is undergoing a strategic transition from rapid growth to high-quality development, aspiring to become a tourism powerhouse. However, alongside rapid tourism expansion and the normalization of holiday travel, overtourism has become a major barrier to sustainable tourism development and effective urban governance [1]. Overtourism manifests mainly through tourist numbers exceeding the spatial carrying capacity of destinations, resulting in intense temporal and spatial concentration [2]. This has led to various critical issues, including traffic system paralysis, overloaded public service facilities, deteriorating tourist experiences, environmental degradation, and even serious safety incidents [3,4,5]. In this context, tourism destination management faces dual pressures: satisfying tourist experience demands and ensuring sustainable development [6,7]. Precisely analyzing tourists’ spatiotemporal behavior patterns across multiple scales is expected to offer crucial decision-making support, thereby aiding in optimizing spatial resource allocation and visitor flow management strategies [8,9,10].
Research on tourists’ spatiotemporal behavior typically adopts a macro–meso–micro-scale framework. The macro-scale examines inter-destination tourist flows, focusing on cross-regional migration patterns at national or regional levels [11,12,13]. The meso-scale explores tourists’ behavior within a single destination, such as cities or tourism demonstration areas [14,15,16,17,18]. In contrast, the micro-scale delves into detailed movement trajectories within scenic areas, such as theme parks and islands [19,20,21]. In recent years, research at three scales has coalesced into a relatively mature and stable framework. Among these, the micro-scale offers a finely grained depiction of tourists’ behavioral patterns and demand characteristics. Especially against the backdrop of rapidly evolving smart tourism, findings at this scale can be directly translated into productive capacity and deployed in operational practice and real-time services, which has drawn widespread attention. With the continual infusion of new technologies and methods, the field now stands at the forefront of explosive innovation, giving rise to a multitude of new research questions and application scenarios and attracting growing scholarly interest.

1.2. Literature Review

1.2.1. Types and Applications of Tourism Big Data

Traditionally, micro-scale tourist behavior studies rely heavily on surveys, travel diaries, and interviews to capture detailed attributes such as visitation patterns, duration of stay, tourism expenditure, and satisfaction [22,23]. Although valuable, these methods depend on respondents’ observational capabilities and memory accuracy, often leading to subjective biases and data collection limitations. Therefore, in the era of smart tourism, there is an urgent need for high-resolution, easily accessible, and timely spatiotemporal big data to accurately uncover tourists’ behavioral patterns [24,25].
With increasingly diverse data sources, GPS data [26,27,28], mobile signaling data [29,30], and social media check-in data (e.g., Weibo) [31,32,33] have significantly enriched studies on tourists’ spatiotemporal behaviors. However, there are notable differences among these data sources. Mobile signaling data collection is complex, and social media check-ins suffer from temporal sparsity issues [34,35]. GPS data, by comparison, offer continuous and precise positional recordings, simultaneously capturing multidimensional attributes such as time, speed, and direction. Additionally, the convenience for tourists to record and share their mobility trajectories significantly enhances data resolution and accessibility, thus demonstrating unique advantages for micro-scale behavioral research [36,37].

1.2.2. Methods for Spatiotemporal Behavior Analysis

In recent years, scholars have increasingly applied tourism big data—especially GPS trajectories—to the study of visitor behavior. For example, Taczanowska et al. combined GPS traces with graph-theoretic methods to analyze spatial behavior in an Austrian national park and found that only 61% of movements were confined to designated trail networks [38]. Using visitor tracks from the TwoStep platform at Mount Hua, China, Liu et al. employed Markov chains to reveal three spatial transfer patterns—“adjacent transfers,” “span transfers,” and “hub transfers”—and, with K-means clustering, identified three spatiotemporal visitation modes: “daytime ascent,” “nighttime ascent,” and “all-day sightseeing” [39]. Integrating GPS data with questionnaires from 312 respondents on Gulangyu Island, Li et al. used a multinomial logit (MNL) model to uncover latent behavioral mechanisms of destination choice, confirming the significant roles of proximity, historical attributes, and attractiveness [40]. Taking the Summer Palace as a case area, Huang et al. documented pronounced spatiotemporal tension in visitor behavior, showing that dwell time declines as the exit-time constraint intensifies [41]. Gu et al. applied the space–time prism and DBSCAN to the Helan Mountain wine region (Ningxia) to identify four spatiotemporal behavior patterns and three salient spatial features [42]. In Tibet, Liu et al. leveraged a steady-state Markov chain framework and trajectory big data to produce short- and long-term forecasts of interactions among nodes in the tourism-flow network, elucidating the system’s intricate interdependencies [43]. Wang et al. improved DBSCAN by jointly incorporating spatial, temporal, and directional dimensions to characterize changes in visitors’ spatiotemporal patterns [44]. Using Wuchon Hanok Village as a study area, Yun et al. employed kernel density estimation (KDE) to extract distributional hotspots and examined seasonal behavioral differences in average travel distance, mean speed, total dwell time, total movement time, and total stop time [45]. Korpilo et al. likewise used KDE to analyze runners’ and mountain bikers’ behavior in Helsinki’s parks, identifying three hotspot regions [46]. Kuo et al. developed a rapid method for identifying POIs/ROIs from geo-tagged photos based on their spatial and temporal attributes, validated in the dense urban settings of Tainan and Taipei [47]. Collectively, tourism big data has been widely used to reveal key indicators of tourist behavior, including route patterns [48,49], attraction popularity [50,51], trip frequency [52,53], and duration [54,55], as shown in Table 1.

1.3. Advantages and Contributions of This Study

Identifying the dynamic distribution of hotspots and interest areas within scenic sites is a crucial entry point for understanding visitor behavior and optimizing spatial planning. KDE, a widely used tool for first-order hotspot measurement, provides a valuable macroscopic summary of spatial density but is limited in its ability to delineate precise hotspot extents and peak locations. By contrast, models that quantify hotspot regions and peaks enable more effective characterization of the spatial regularities in visitor behavior. In this study, we adopt the Density-Field Hotspot Detector (DF-HD) to identify multi-level hotspot structures across the study area, accurately portray visitor interest preferences, and delineate hierarchical interest zones. These outputs provide scientific evidence to support targeted crowd diversion and control during peak periods. In parallel, we employ the Space–Time Cube (STC) to integrate sequential time slices with geographic positions in a three-dimensional framework, thereby uncovering the dynamic spatiotemporal associations and evolutionary patterns of visitor behavior—key technical support for diagnosing real-time flows and optimizing spatial resource allocation. Moreover, elevation exerts a substantial influence on behavior in mountain scenic areas; whereas existing studies often discuss this qualitatively, we further quantify the relationship between visitor interest points and elevation, enhancing both the explanatory power and practical utility of our analysis.
Mount Huangshan, recognized globally as both a cultural and natural heritage site, a global geopark, and one of China’s top ten scenic areas, attracts visitors worldwide. Nevertheless, the mass influx of tourists has led to severe “spatiotemporal overload.” According to the Huangshan Scenic Area 2024 Annual Work Summary and 2025 Work Plan, the scenic area received 5.568 million visitors in 2024, with over 95,000 visitors during the three-day Qingming Festival alone. Data from the Huangshan Scenic Area Smart Management Center revealed peak instant densities of 9.8 people/m2 at key viewpoints and queue durations reaching 5.2 h at ropeway stations, with queues extending to peripheral roads. Furthermore, tourists’ effective touring radius shrank to 1.2 km, leading 83% of visitors to adopt a “jump-island” visitation pattern, with an average scenic viewpoint viewing time of merely 4.5 min. Such crowding severely impacts visitor experiences and escalates safety risks.
Numerous scholars have conducted in-depth investigations into visitor behavior and tourism experience in the Mount Huangshan Scenic Area. Using metaphor-elicitation techniques, Zhang et al. combined semi-structured interviews with participant-provided photographs to extract constructs, build consensus, and produce a consensual cognitive map of Huangshan’s tourism image; their analysis identified ten emblematic visiting zones most attractive to tourists [56]. Focusing on the four gateway communities at the east, south, west, and north entrances, Huang et al. employed analysis of variance to examine residents’ perceptions of ecological justice across two dimensions—interpersonal ecological justice and interspecies ecological justice—revealing spatial differences and associated drivers [57]. Within a cognition–affect–behavior framework, Xu et al. introduced travel motivation as a mediating variable and used structural equation modeling to probe the relationship between tourists’ environmentally responsible behaviors and ecological emotions. However, studies that explicitly parse visitor behavior from a spatiotemporal perspective remain relatively limited [58]. For example, Huang et al. deployed Wi-Fi access points at key nodes capable of capturing smartphone signals and, by analyzing connection logs, derived distributions of dwell times at attractions and movement times between them; yet the dataset covered only 29 days and was constrained to 20 access points within the scenic area, which limits generalizability [59].
Resolving the current supply–demand tension in Mount Huangshan hinges on a rigorous understanding of how scenic resources are utilized and how visitor flows evolve dynamically. Scientific data analytics and evidence-based route planning are essential to optimize crowding and regulate visitor distribution. To this end, the present study conducts an empirical analysis of tourists’ spatiotemporal behavior patterns in Mount Huangshan using high-precision GPS positioning data, with the aim of providing both theoretical grounding and practical guidance for fine-grained destination management and enhanced visitor experience.

2. Materials and Methods

2.1. Study Area

Mount Huangshan Scenic Area, located in Huangshan City in southern Anhui Province, China, was designated as a UNESCO World Cultural and Natural Heritage Site in 1990. From a natural heritage perspective, Mount Huangshan features a distinctive granite peak-forest landscape shaped by the combined forces of geological uplift, glaciation, and long-term weathering and erosion. Its temperate forest ecosystem preserves an intact vertical vegetation zonation and harbors rare species, reflecting exceptional biodiversity. Culturally, since the Tang dynasty, Huangshan has profoundly influenced Chinese landscape art and philosophy; its ancient temples, historic mountain paths, and cliff inscriptions embody the ideal of “harmony between humanity and nature,” showcasing the global significance of biocultural coexistence. The scenic area comprises 72 peaks, including the main Lotus Peak at 1864 m elevation, alongside Bright Summit and Tiandu Peak. The famous Huangshan Welcoming Pine symbolizes the hospitable Eastern etiquette of the Anhui people. The scenic area is divided into six zones: Yuping, Diao Bridge, Beihai, Wenquan, Yungu, and Songgu, with four main entrances located at each cardinal point (Figure 1).
In February 2022, Anhui Province released the “14th Five-Year Plan for the Construction and Development of the Southern Anhui International Cultural Tourism Demonstration Zone,” introducing the concept of the “Greater Huangshan” for the first time. In December 2023, the Standing Committee of the Anhui Provincial Party Committee approved the “Action Plan for Building a World-Class Leisure, Vacation, Health and Wellness Tourism Destination in Greater Huangshan,” emphasizing high-end leadership, international perspectives, and coordinated regional development strategies to enhance the global recognition of the Huangshan brand. Against this backdrop, Mount Huangshan urgently requires strategic repositioning through upgraded thinking and integrated business models to solidify its status within national and global tourism contexts.

2.2. Research Rationale and Framework

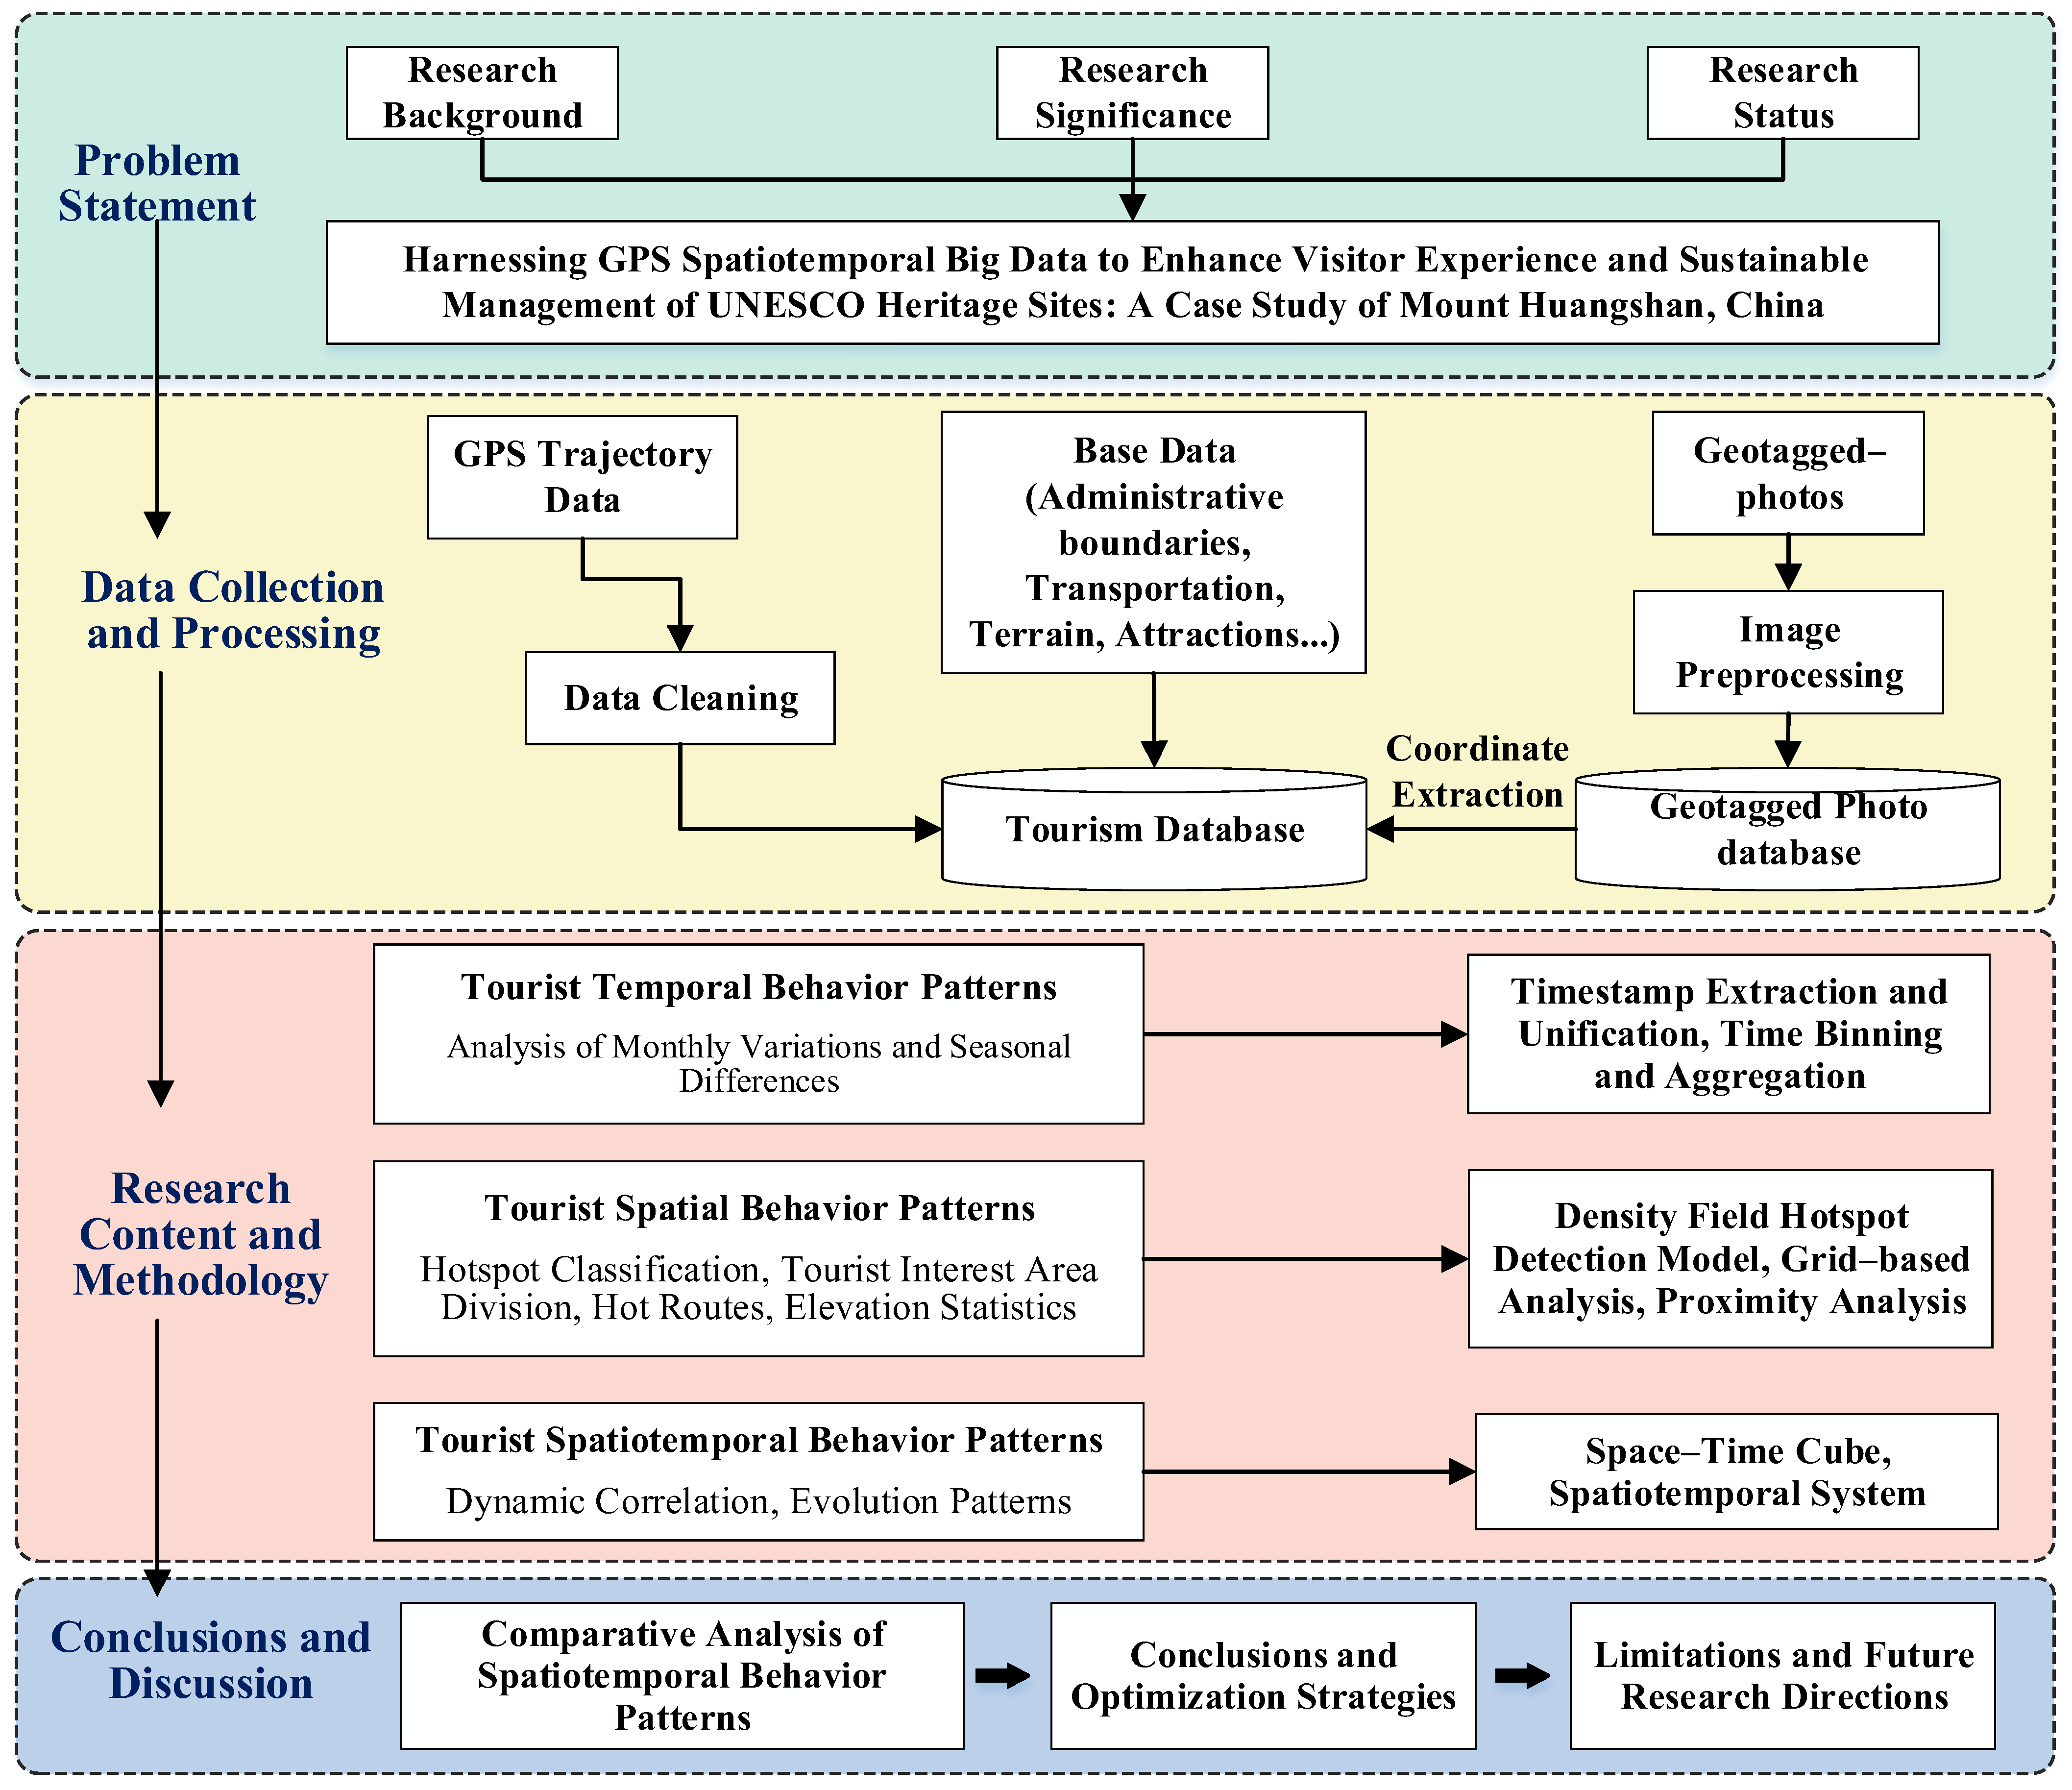
Focusing on the core question—how to leverage GPS spatiotemporal big data to enhance visitor experience and sustainable management in World Heritage sites—this study employs the Mount Huangshan Scenic Area as a case. We first assemble multi-source datasets, including GPS trajectory records and geo-tagged photographs. After data cleaning, image preprocessing, and coordinate extraction, we construct two interoperable repositories: a tourism trajectory database and a geo-tagged photo database.
Building on these datasets, the analysis proceeds along three mutually reinforcing lines:temporal behavior patterns of visitors, spatial behavior patterns and integrated spatiotemporal behavior patterns.
Methodologically, we integrate a suite of complementary techniques: timestamp extraction, track segmentation, the Density-Field Hotspot Detector (DF-HD) for hierarchical hotspot delineation, spatial gridding for areal normalization and comparison, and the Space–Time Cube (STC) for voxel-based 3D spatiotemporal analysis. Finally, we conduct comparative analyses of behavior patterns derived from trajectories and geo-tagged photos, propose management optimizations tailored to congestion mitigation and experience enhancement, and discuss limitations and future research directions. The complete technical workflow is illustrated in Figure 2.

2.3. Data Sources and Preprocessing

2.3.1. GPS Data

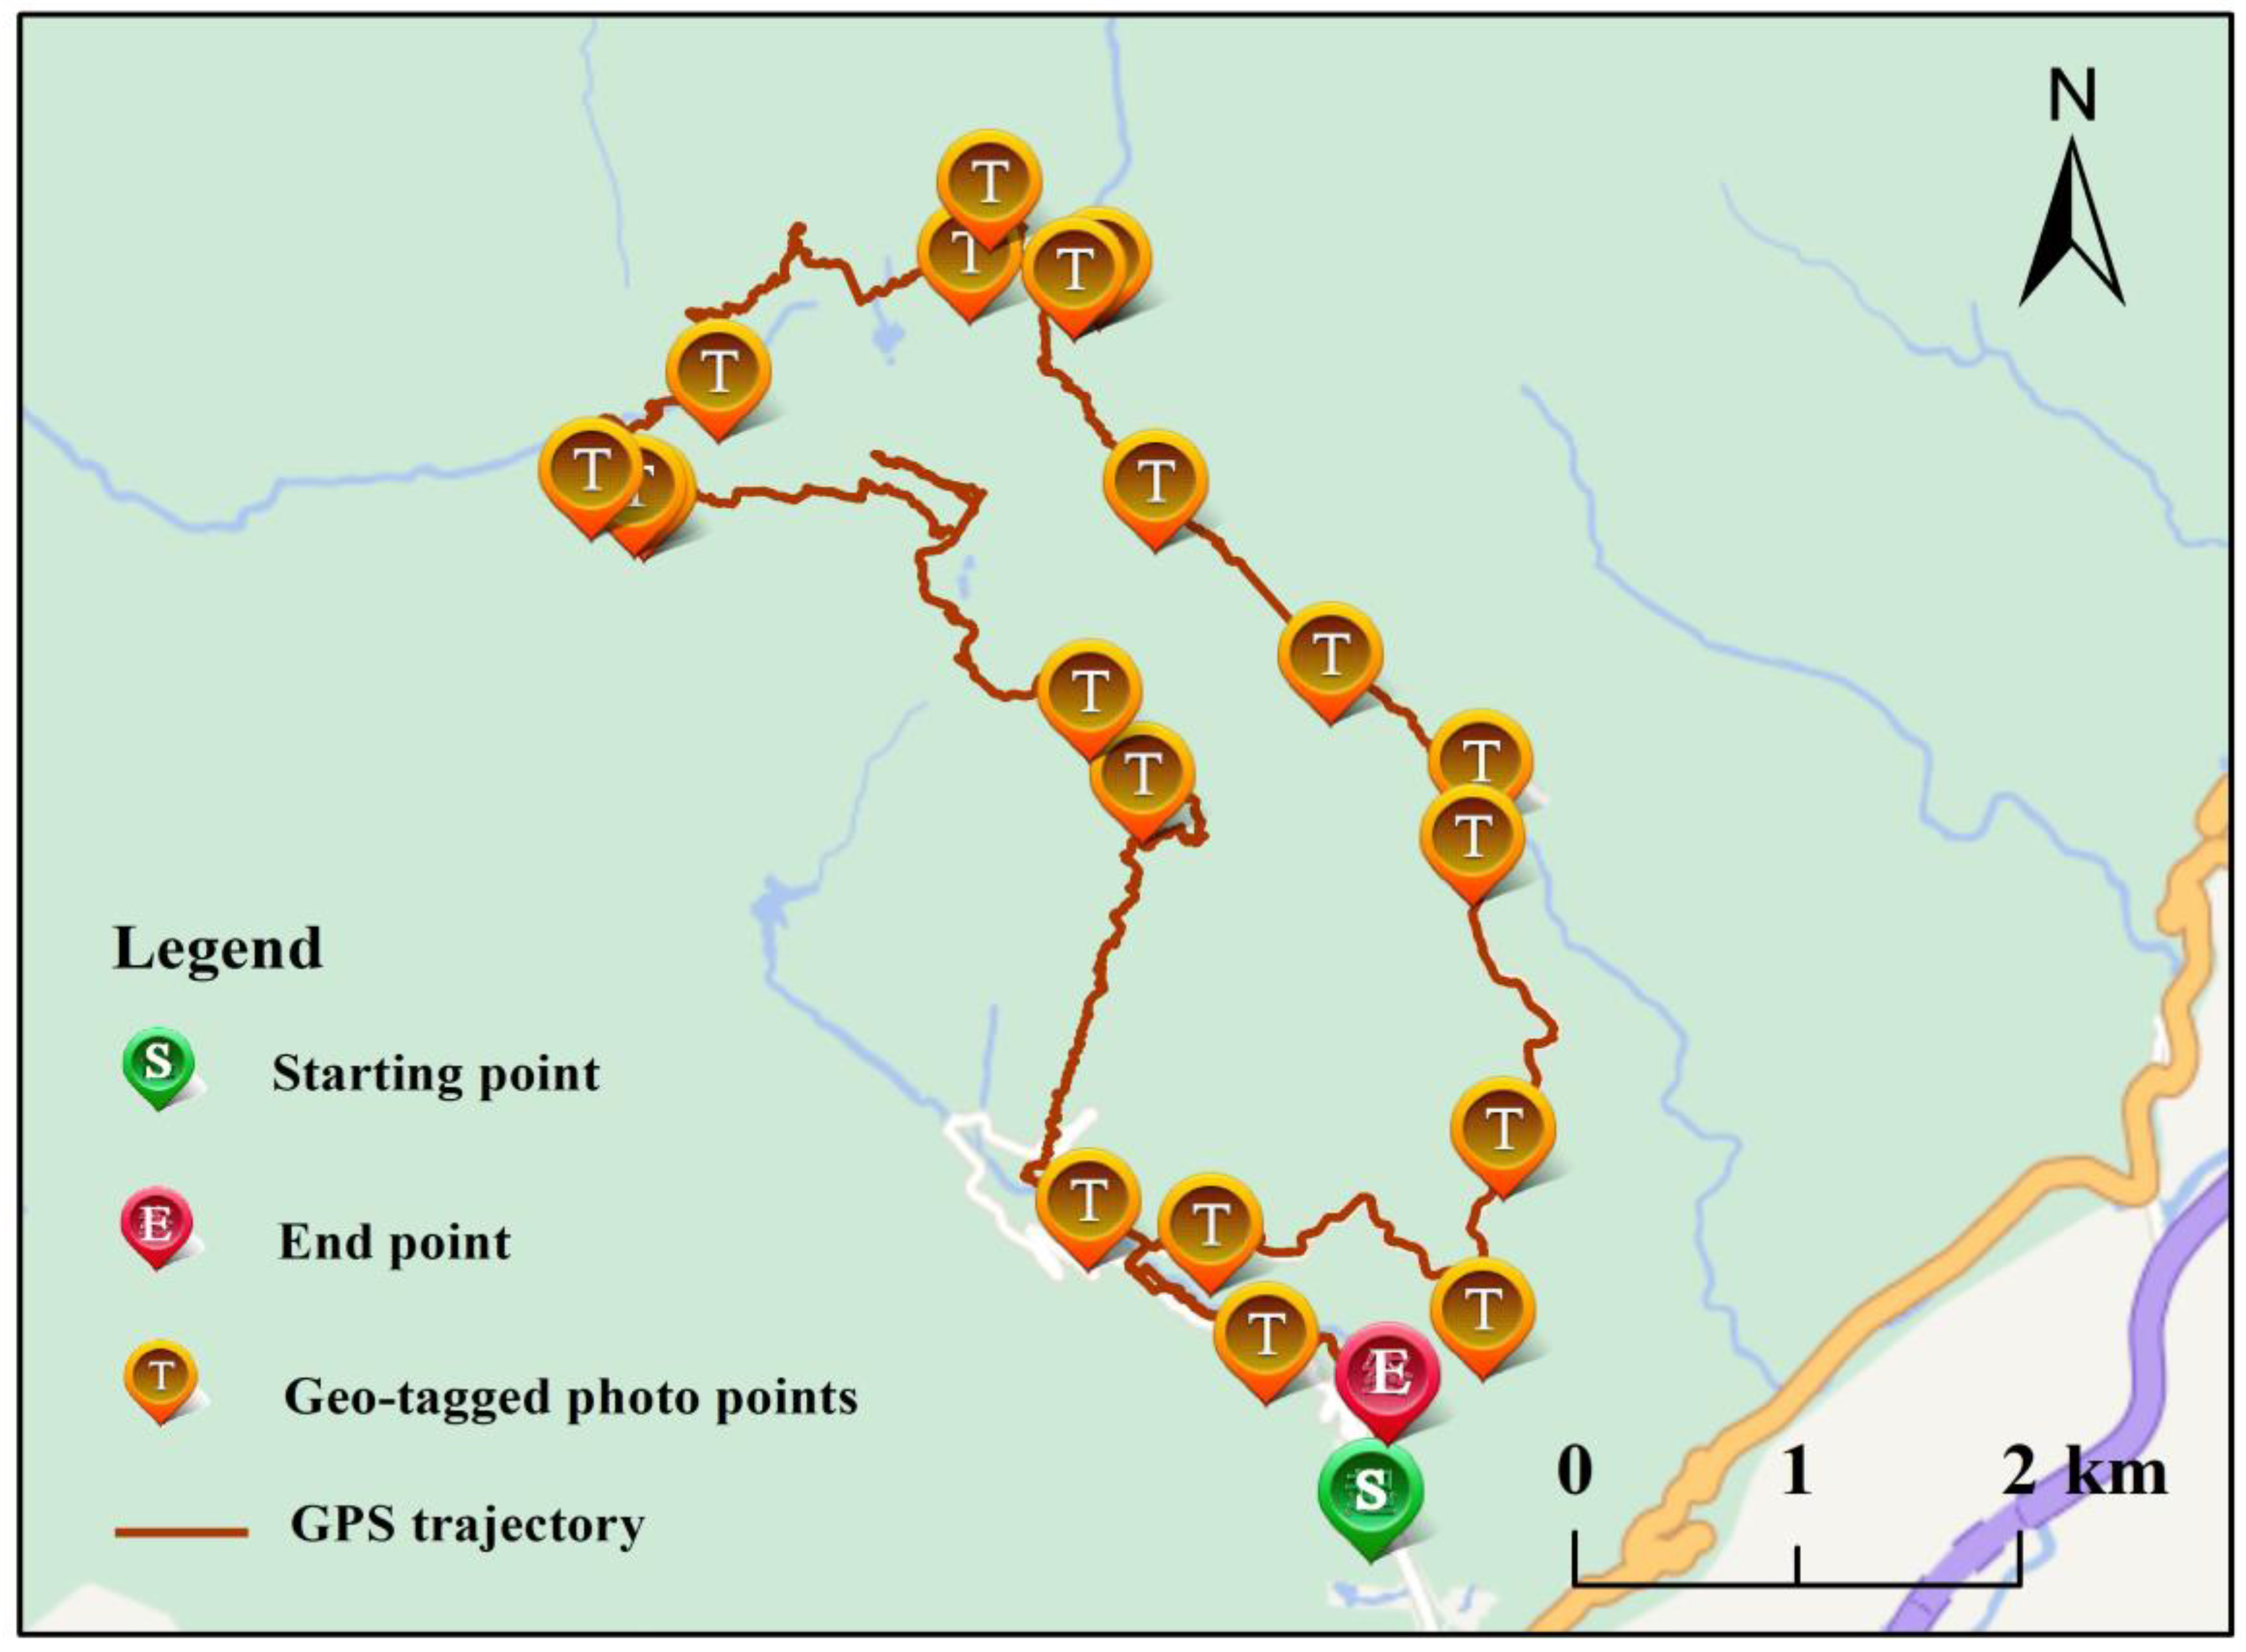
The GPS data for visitors from January 2017 to December 2023 were sourced from the Twostep platform, providing positional information, timestamps, geo-tagged photographs, and trajectory routes [60] (Figure 3). Data cleansing involved: (1) removing records outside the scenic area boundary, (2) filtering trajectories shorter than 0.5 km, (3) deleting duplicate entries, and (4) excluding records lacking timestamps. This process resulted in 2263 valid trajectories and 25,226 geo-tagged photograph points. Given that tourists’ photography is typically purposeful and context-driven, geo-tagged photographs can, to a considerable extent, serve as valid proxies for points of interest (POIs). In this study, we conducted a systematic audit of the 25,226 photographs, examining both their visual content and filenames. The review indicates that most images focus on natural landscapes (e.g., mountains, rock formations, pine trees, cloud seas), cultural or architectural features, and visitor activities at iconic viewpoints. A non-trivial subset, however, captured facilities unrelated to sightseeing—such as restrooms, signage, and vending kiosks—which do not exhibit typical POI characteristics. To improve validity and representativeness, these non-relevant items were removed. After screening, 22,397 geo-tagged photo points were retained as valid POIs for subsequent analyses.
Data preprocessing utilized Model Builder for automated batch processing, including data format conversions (KML to GDB, GDB to point/line features) and projection transformations (CGCS2000 coordinate system, Gauss–Krüger 3° zone projection) (Figure 4).

2.3.2. Basic Scenic Area Data

Point of interest (POI) and boundary data for the scenic area were obtained through the Baidu Map API, while road and river data were sourced from BIGEMAP GIS OfficeV29.12.23. Digital Elevation Model (DEM) data were obtained from the Geospatial Data Cloud (https://www.gscloud.cn/sources/accessdata/310?pid=302, accessed on 6 October 2024). These data were initially in WGS1984 coordinate system and subsequently re-projected using ArcGIS Pro3.3.

2.4. Methods

2.4.1. Density-Field Based Hotspot Detector (DF-HD)

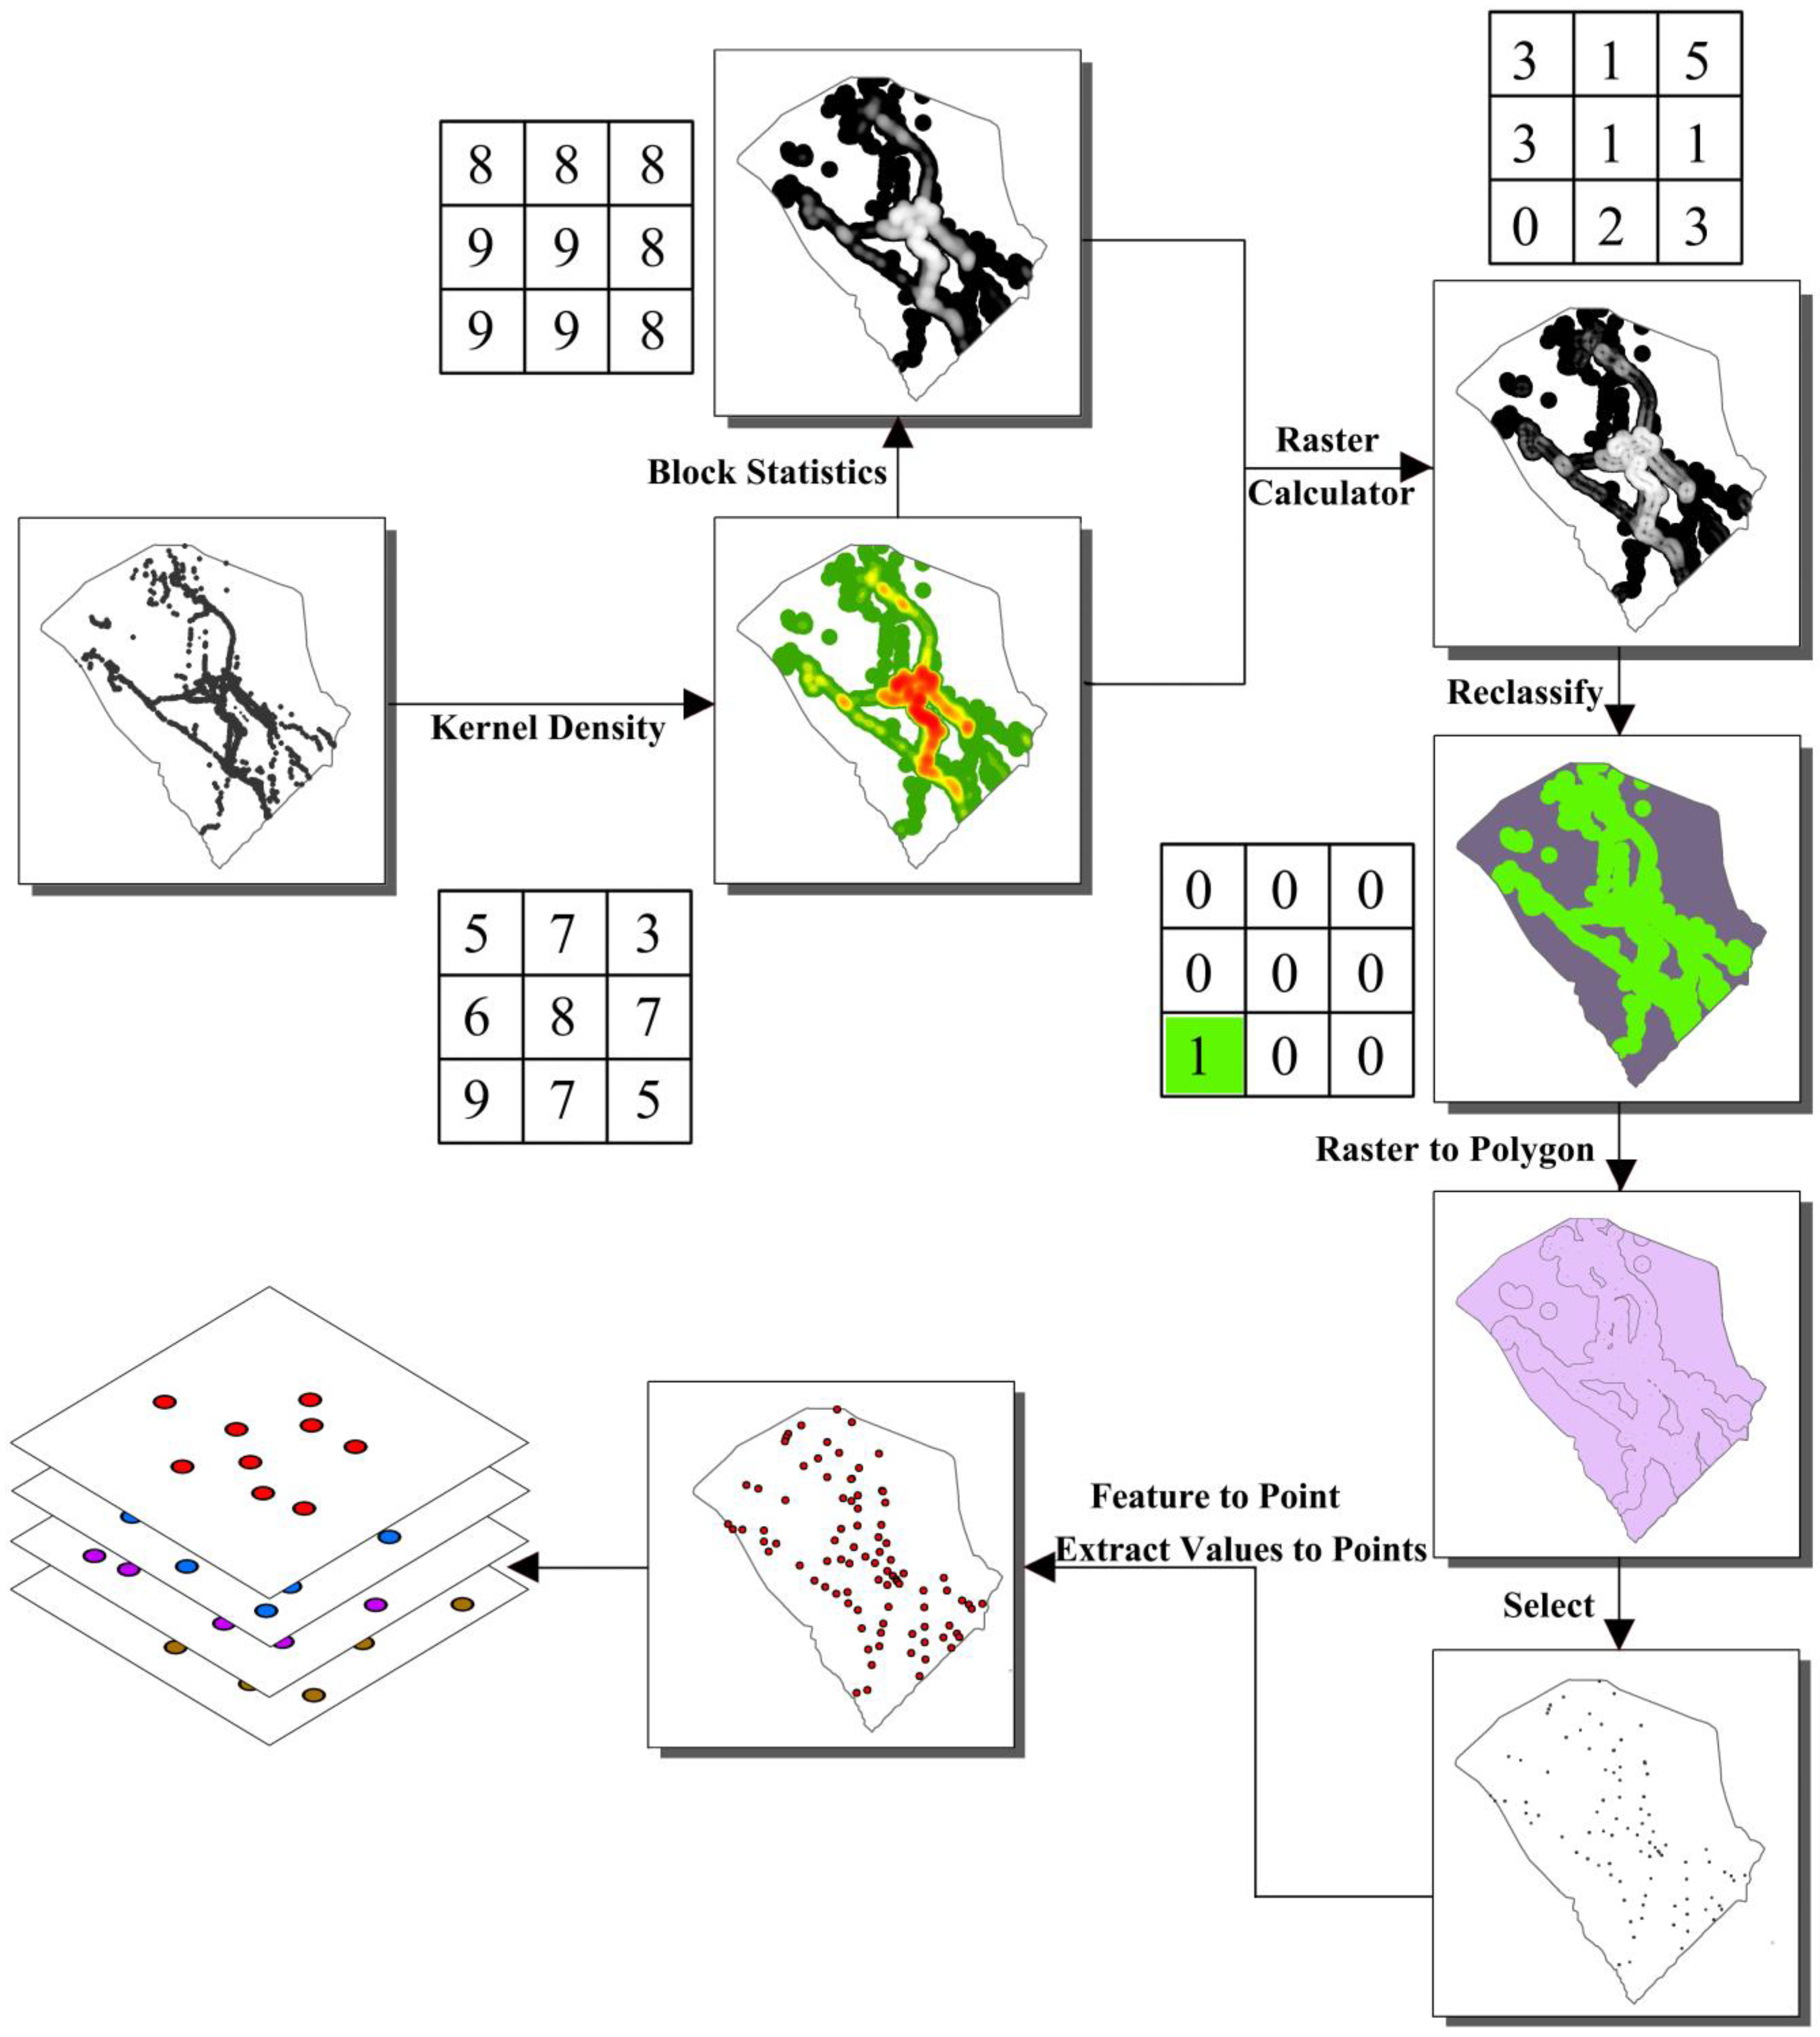
Traditional density analyses provide a general overview of spatial distributions but lack precision in identifying hotspot areas. This study adopted the Density-Field Based Hotspot Detector (DF-HD) [61], which accurately quantifies hotspot areas and their peak values, effectively analyzing and visualizing spatial hotspots. Initially, a kernel density field model was constructed to represent POI density. A local density maximum surface was determined using window analysis, and map algebra calculated the difference between the two surfaces, resulting in a non-negative surface (zero values indicating local maxima, positive values indicating lower-density areas). Hotspots were then extracted through reclassification, data structure transformation, data filtering, and numerical extraction, followed by categorizing hotspot values into hierarchical levels. The algorithm process is illustrated in Figure 5. Building on this approach, we quantitatively identified multi-level hotspot distributions across the study area, yielding a reproducible and precise delineation of multi-tier visitor interest zones. These results provide a robust evidence base for subsequent crowd-dispersion management and operational decision-making.

2.4.2. Space–Time Cube (STC) Model

The Space–Time Cube (STC) model is a visualization and computational tool that integrates discrete spatiotemporal data into a continuous three-dimensional space–time framework (spatial and temporal dimensions). This model combines discrete spatiotemporal events (e.g., tourist POIs) into continuous voxels, enabling synchronous and comprehensive analysis of tourists’ spatiotemporal patterns. By capturing spatiotemporal interactions, the STC method overcomes the limitations of separate temporal and spatial analyses, effectively uncovering hidden behavioral patterns. This represents a paradigm shift from static snapshots to dynamic processes. We operationalize this by constructing a space–time cube (STC) from multidimensional raster layers, discretized at a 100 m spatial resolution with monthly temporal slices. Monthly multidimensional raster layers were used to construct the STC, visualizing data in voxel format (Figure 6).

2.4.3. Nearest Neighbor Analysis

Nearest neighbor analysis computes spatial proximity by finding and measuring the distance between input features and their nearest neighbors. In this study, nearest neighbor analysis evaluated the relationship between tourist POIs and the scenic area’s road network. Using this method, we quantitatively reveal the strength and patterns of path dependence in tourists’ spatial behavior, providing evidence-based guidance for trail planning and the spatial allocation of visitor facilities within the scenic area.

2.4.4. Temporal Data Preprocessing

We first extracted timestamps from the raw GPS tracks (KML) and photo EXIF metadata, converted all times to China Standard Time (UTC+8), and removed missing or invalid records. The data were then sorted, deduplicated using spatiotemporal tolerances (≤5 s and ≤5 m), and screened for timestamp monotonicity to eliminate anomalous points. Trajectories were segmented wherever consecutive points were separated by more than 30 min or exhibited unreasonable displacements; only segments with a length ≥0.5 km were retained. To suppress noise, we computed point-to-point instantaneous speed and heading changes, discarded outliers with speeds >12 m·s−1 and heading flips caused by GPS jitter, and did not apply temporal interpolation so as to preserve the original time series characteristics. At the temporal aggregation stage, we summarized, by month, the number of trajectories, cumulative length, and the count of geotagged photos, and calculated a seasonality intensity index to quantify spatiotemporal regularities. We then constructed a space–time cube (STC) with 100 m grid cells and monthly slices; voxel-level visualization and analysis were used to reveal inter-attraction co-occurrence patterns. Finally, geotagged photos that passed content filtering and temporal validation were used in the DF-HD procedure to generate comparable hierarchical hotspot layers, ensuring that the density-field results and the STC analysis provided mutually corroborating evidence.

2.4.5. Comparative Methods

(1)
Seasonal Intensity Index
The seasonal intensity index was used to assess the seasonal variation in tourist flows, calculated as follows [62]:
R = i = 1 12 ( x i 8.33 ) 2 12
where R denotes the seasonal intensity index, and xi is the percentage share of tourist POIs or trajectory counts in month i relative to the annual total. A larger R indicates a stronger concentration of activity in particular months, whereas values approaching 0 imply a more even monthly distribution. In this study, we use this index to conduct longitudinal comparisons with prior research, with the goal of revealing the temporal trend and evolutionary pattern of seasonality in the Mount Huangshan Scenic Area.
(2)
Spatial Gridding Analysis
Spatial gridding integrates unevenly distributed spatial data into uniform geometric units for statistical analysis, effectively elucidating spatial coupling characteristics. The study area was divided into 100 m × 100 m grids. Using ArcGIS’s spatial join function, the geo-tagged photo locations and attributes were linked to these grids, and the number of photos within each grid was tallied. Subsequently, these results were compared against the density analysis structure of tourist trajectories. The objective is to conduct a systematic comparison with the results of the trajectory analysis. We perform cross-validation using two spatial analytical approaches grounded in different principles—one based on point density and the other on line density—to enhance the robustness and credibility of our findings.

2.4.6. Innovations of This Study

This study integrates and refines spatiotemporal data-mining techniques for a specific application domain and validates them in practice. Three aspects of innovation are highlighted: (i) we introduce and optimize the Density-Field Hotspot Detection (DF-HD) model, enabling quantitative identification of multi-level hotspot distributions within the study area; this yields precise characterizations of visitor interest preferences and the multi-scale spatial structure of areas of interest. (ii) We extend the space–time cube approach to micro-scale analyses of visitor behavior in mountain-type heritage destinations. By constructing a three-dimensional “time–space–attribute” model, we effectively reveal temporal expansion, contraction, and displacement dynamics of attraction-level flows. (iii) Whereas most existing studies are confined to 2D planar analyses and treat elevation only qualitatively, we perform elevation-aware spatial statistics based on a DEM, examining the relationship between points of interest and elevation to uncover the vertical differentiation of visitor spatial behavior in the Huangshan Scenic Area and its underlying mechanisms.

3. Results

3.1. Analysis of Tourist Behavior Based on GPS Data

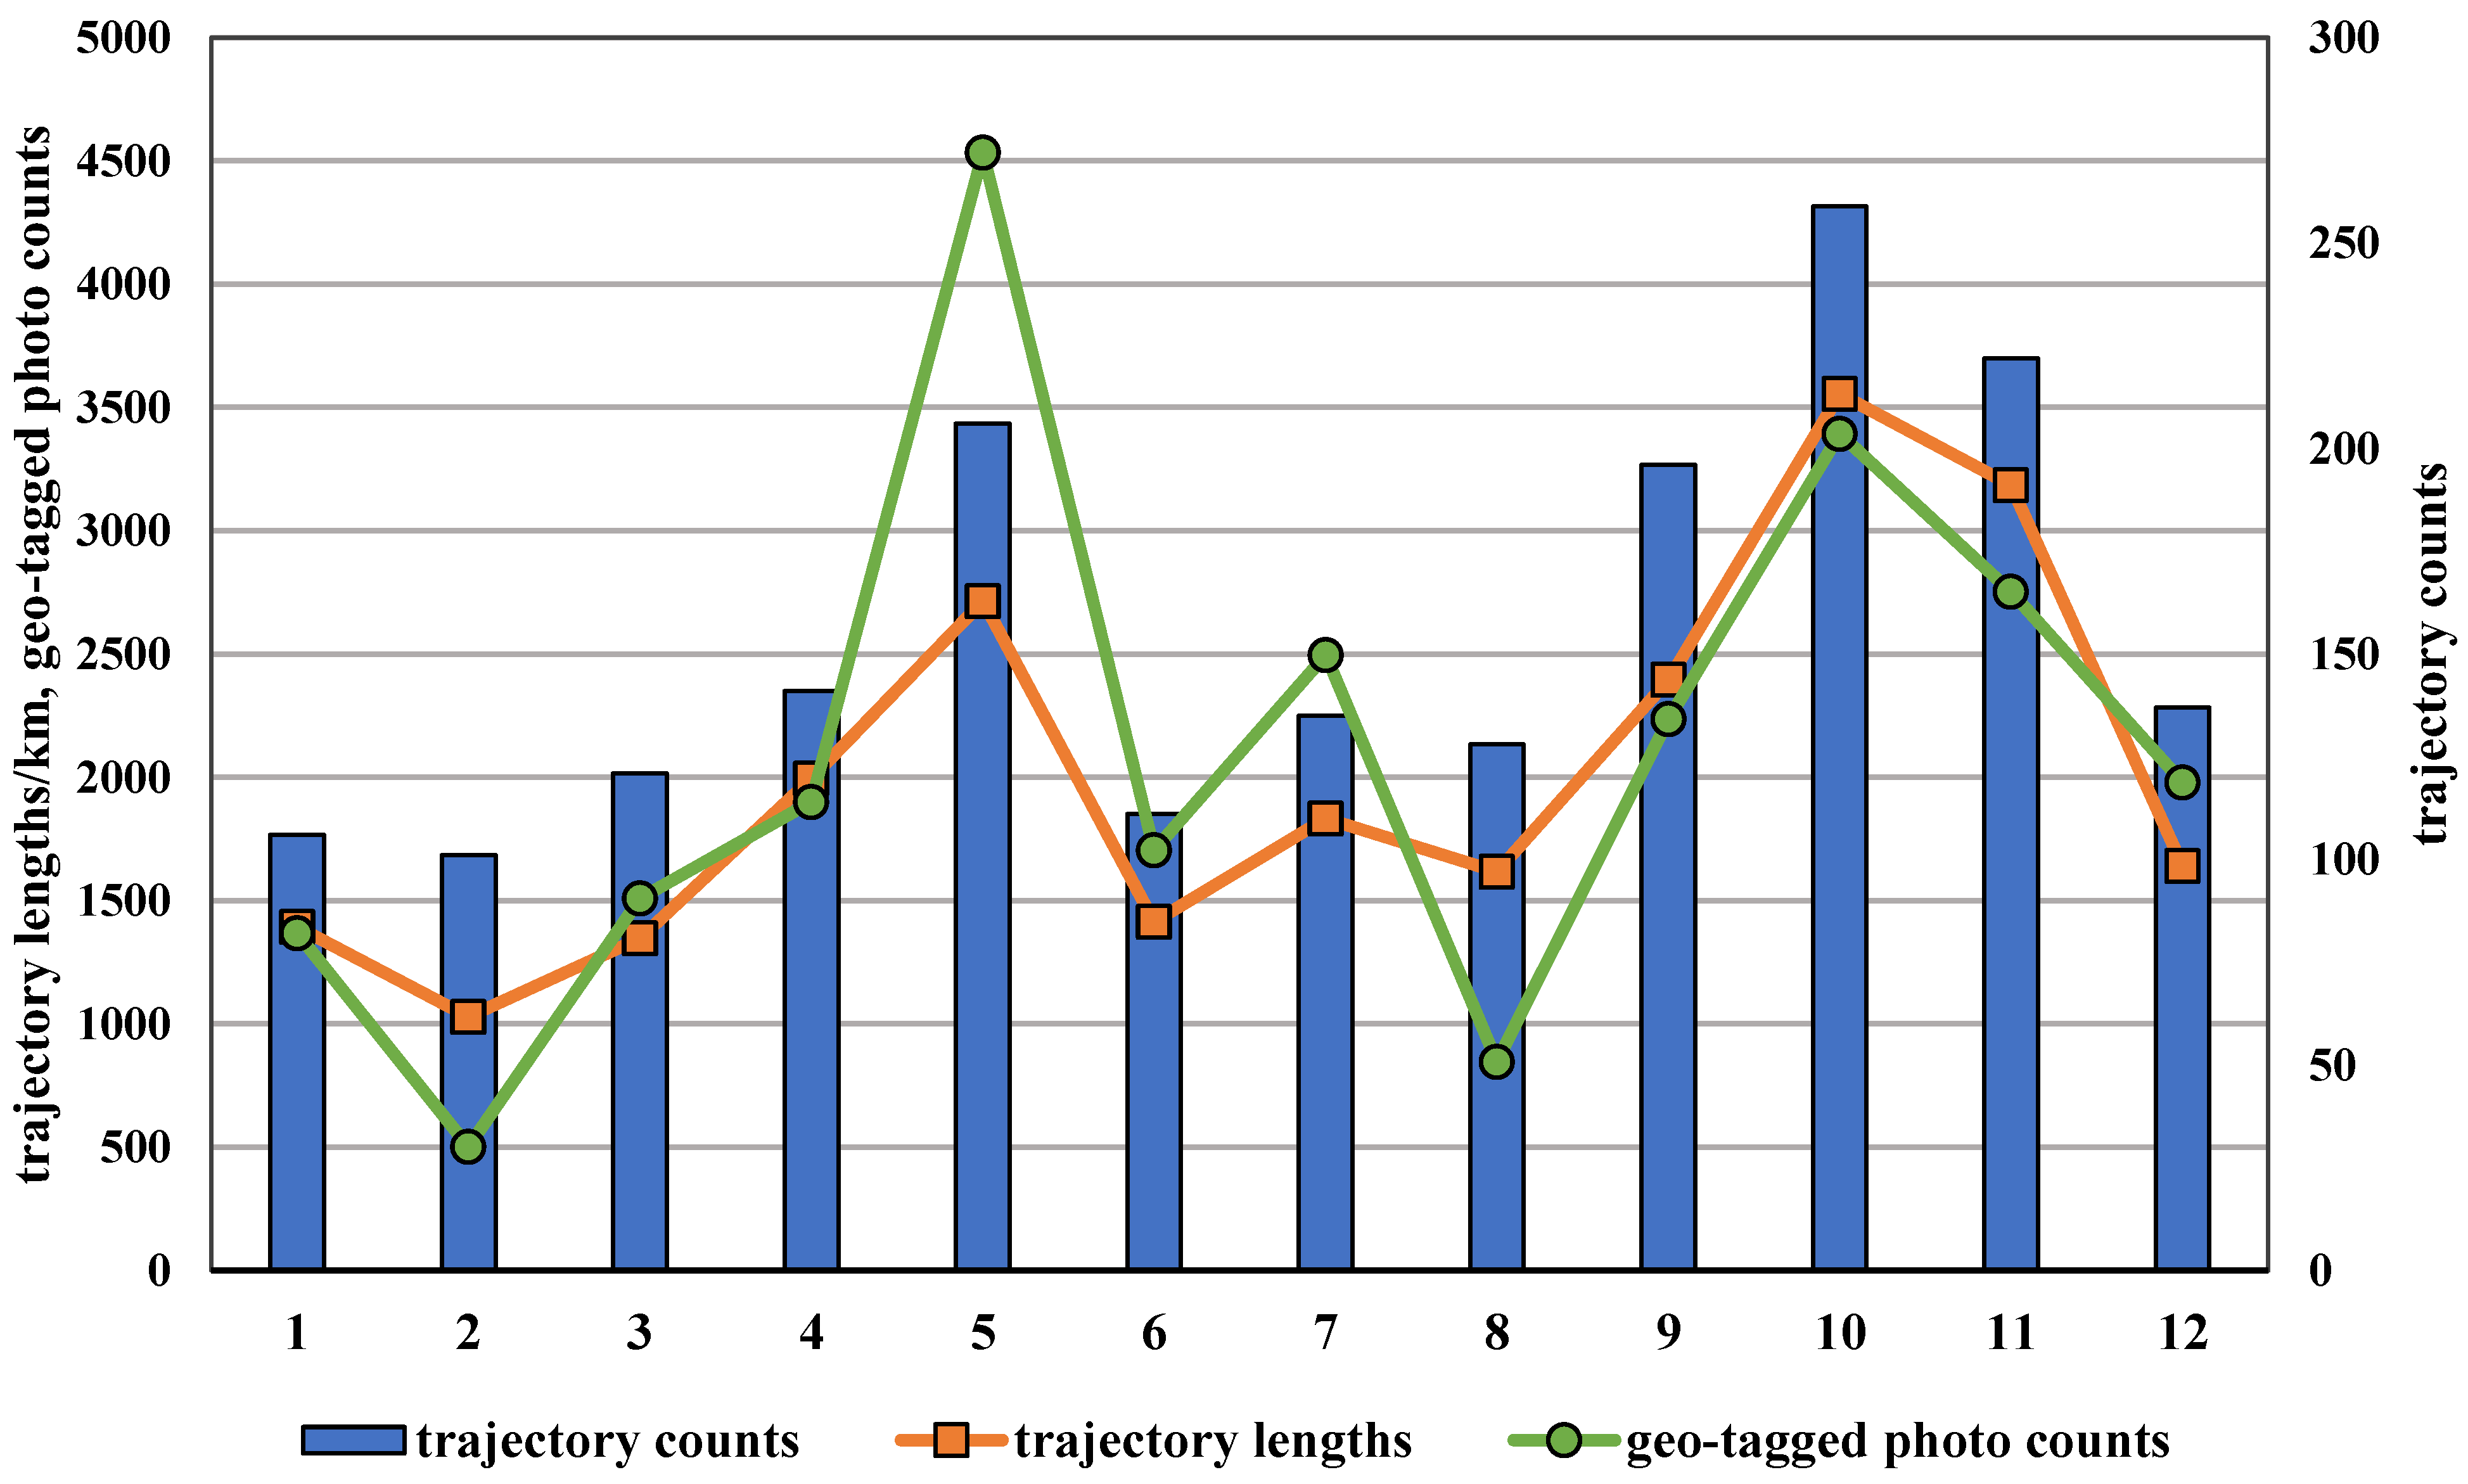
Analysis of the number of GPS trajectories, trajectory length, and geo-tagged photo counts (Figure 7) revealed a typical seasonal pattern characterized by two peaks and two troughs, indicating highly synchronized and seasonally significant tourist behaviors. Mount Huangshan is located in a subtropical monsoon climate region with distinct seasons; the climate is particularly pleasant during spring and autumn (especially in May and October), making these periods tourism peaks. The “May Day” and “National Day” holidays notably contribute to these peaks. Conversely, metrics were lower in January, February, August, and December, particularly in February and August, due to extreme winter cold at higher elevations and high temperatures with frequent rain in August, reducing tourism appeal.
Given the decisive role of elevation in shaping visitor behavior in mountain destinations, we conducted a spatial statistical analysis linking points of interest (POIs) with elevation. The results reveal a marked elevation dependence in visitor distribution, which can be divided into four vertical belts (Table 2):
Low-elevation transport belt (15.86%).
Comprising gateways, transport hubs (e.g., Yungu Temple, the lower station of the Ciguang Pavilion cableway), and surrounding service villages/towns. Its functions are primarily transit and spatial transition; dwell times are short and sightseeing has not yet fully commenced.
Mid-elevation connection belt (13.99%).
A pivotal zone in Huangshan’s vertical structure that integrates mode transfer, progressive experience, and ecological buffering. After passing through the low-elevation belt, visitors first encounter hallmark granite landforms and pine forests here; viewing platforms and photo spots gradually lead to an immersive touring state and rising anticipation.
High-elevation core sightseeing concentration belt (66.27%).
POIs are extremely clustered, forming the absolute core of visitor activity. This reflects the concentration of signature attractions on the summits. The drawing power of top-tier natural scenery, the layout of summit accommodations, and the design of ring-shaped touring routes jointly compress visitor activities and spending into this belt.
Very-high-elevation attenuation belt (3.88%).
POI shares drop sharply. Constrained by the limited physical space of peak tops (e.g., Lotus Peak), fragile alpine environments, and protective development controls, facilities are sparse and serve only basic sightseeing and safety needs.
The formation of this vertical structure can be explained by an attraction–facilities–terrain coupling: the intrinsic pull of iconic natural features sets the baseline direction of movement; co-located service facilities (hotels, food & beverage, viewing decks) reinforce agglomeration; and rugged mountain topography constrains feasible facility locations, ultimately concentrating behavior on the few usable summit flats. Revealing these vertical regularities has direct managerial implications for peak-period crowd control, optimized infrastructure siting, and the sustainable management of sensitive alpine environments.

3.2. Tourist Interest Preferences Identified by the DF-HD Model

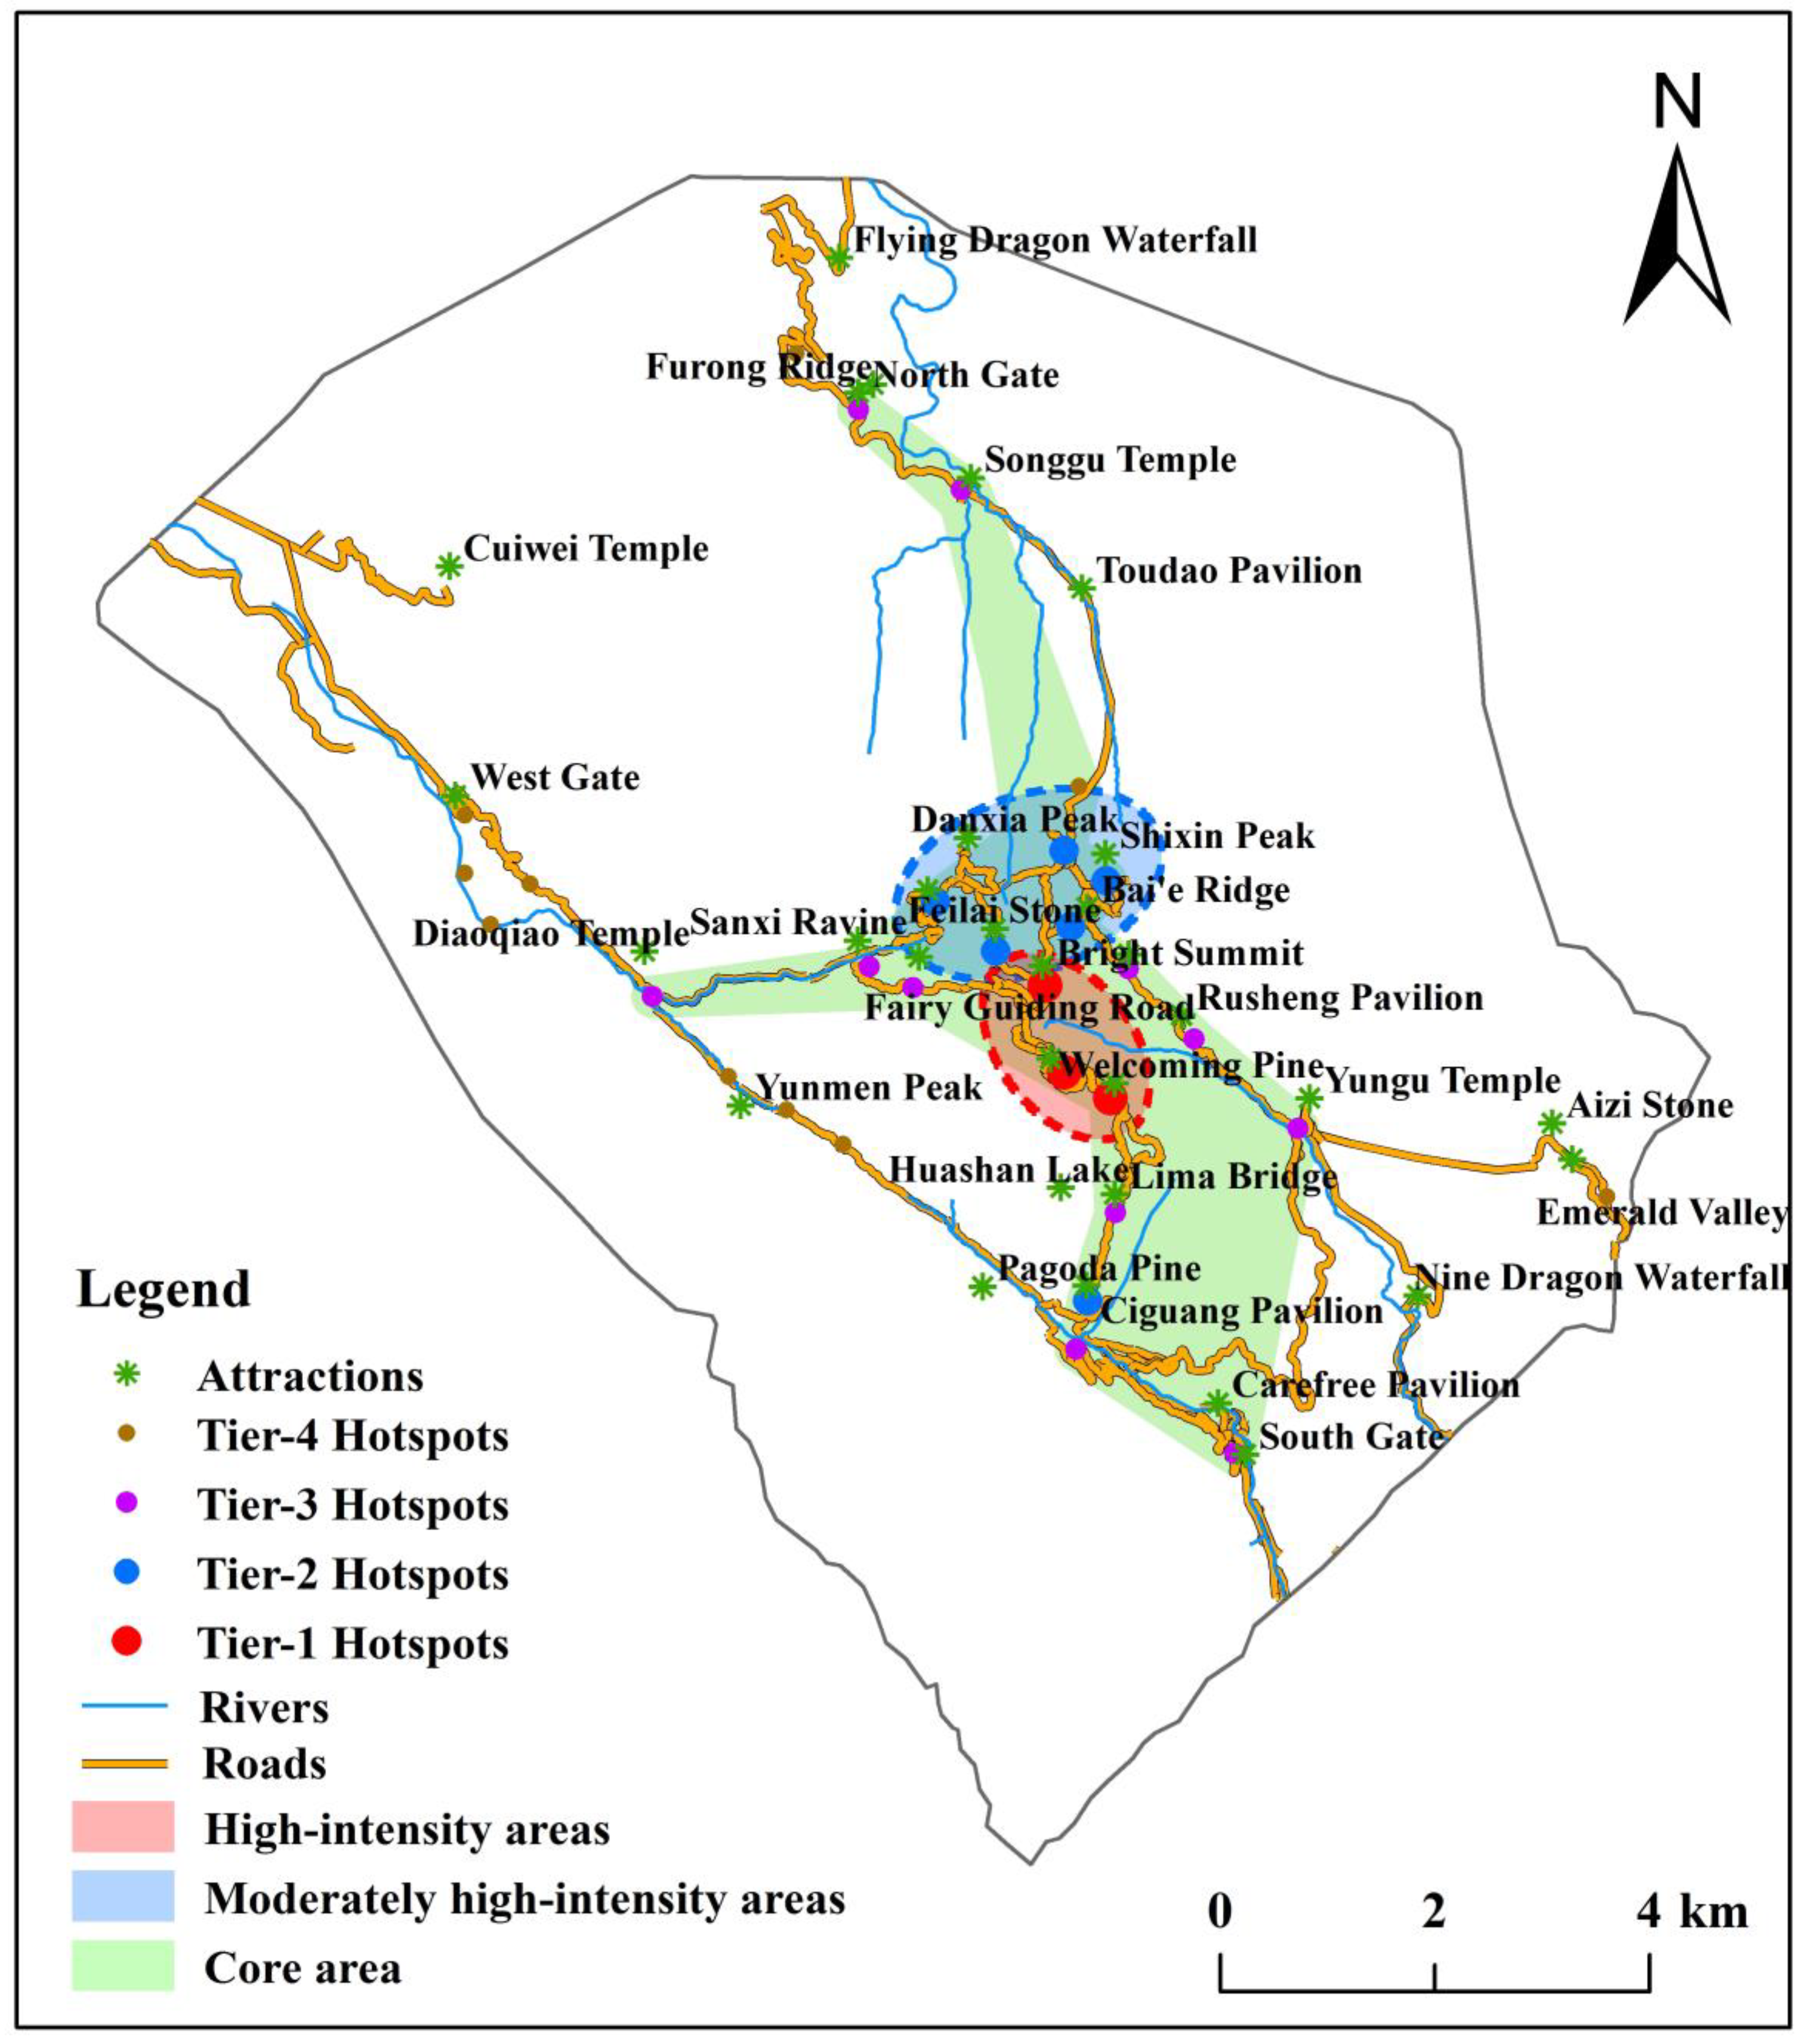
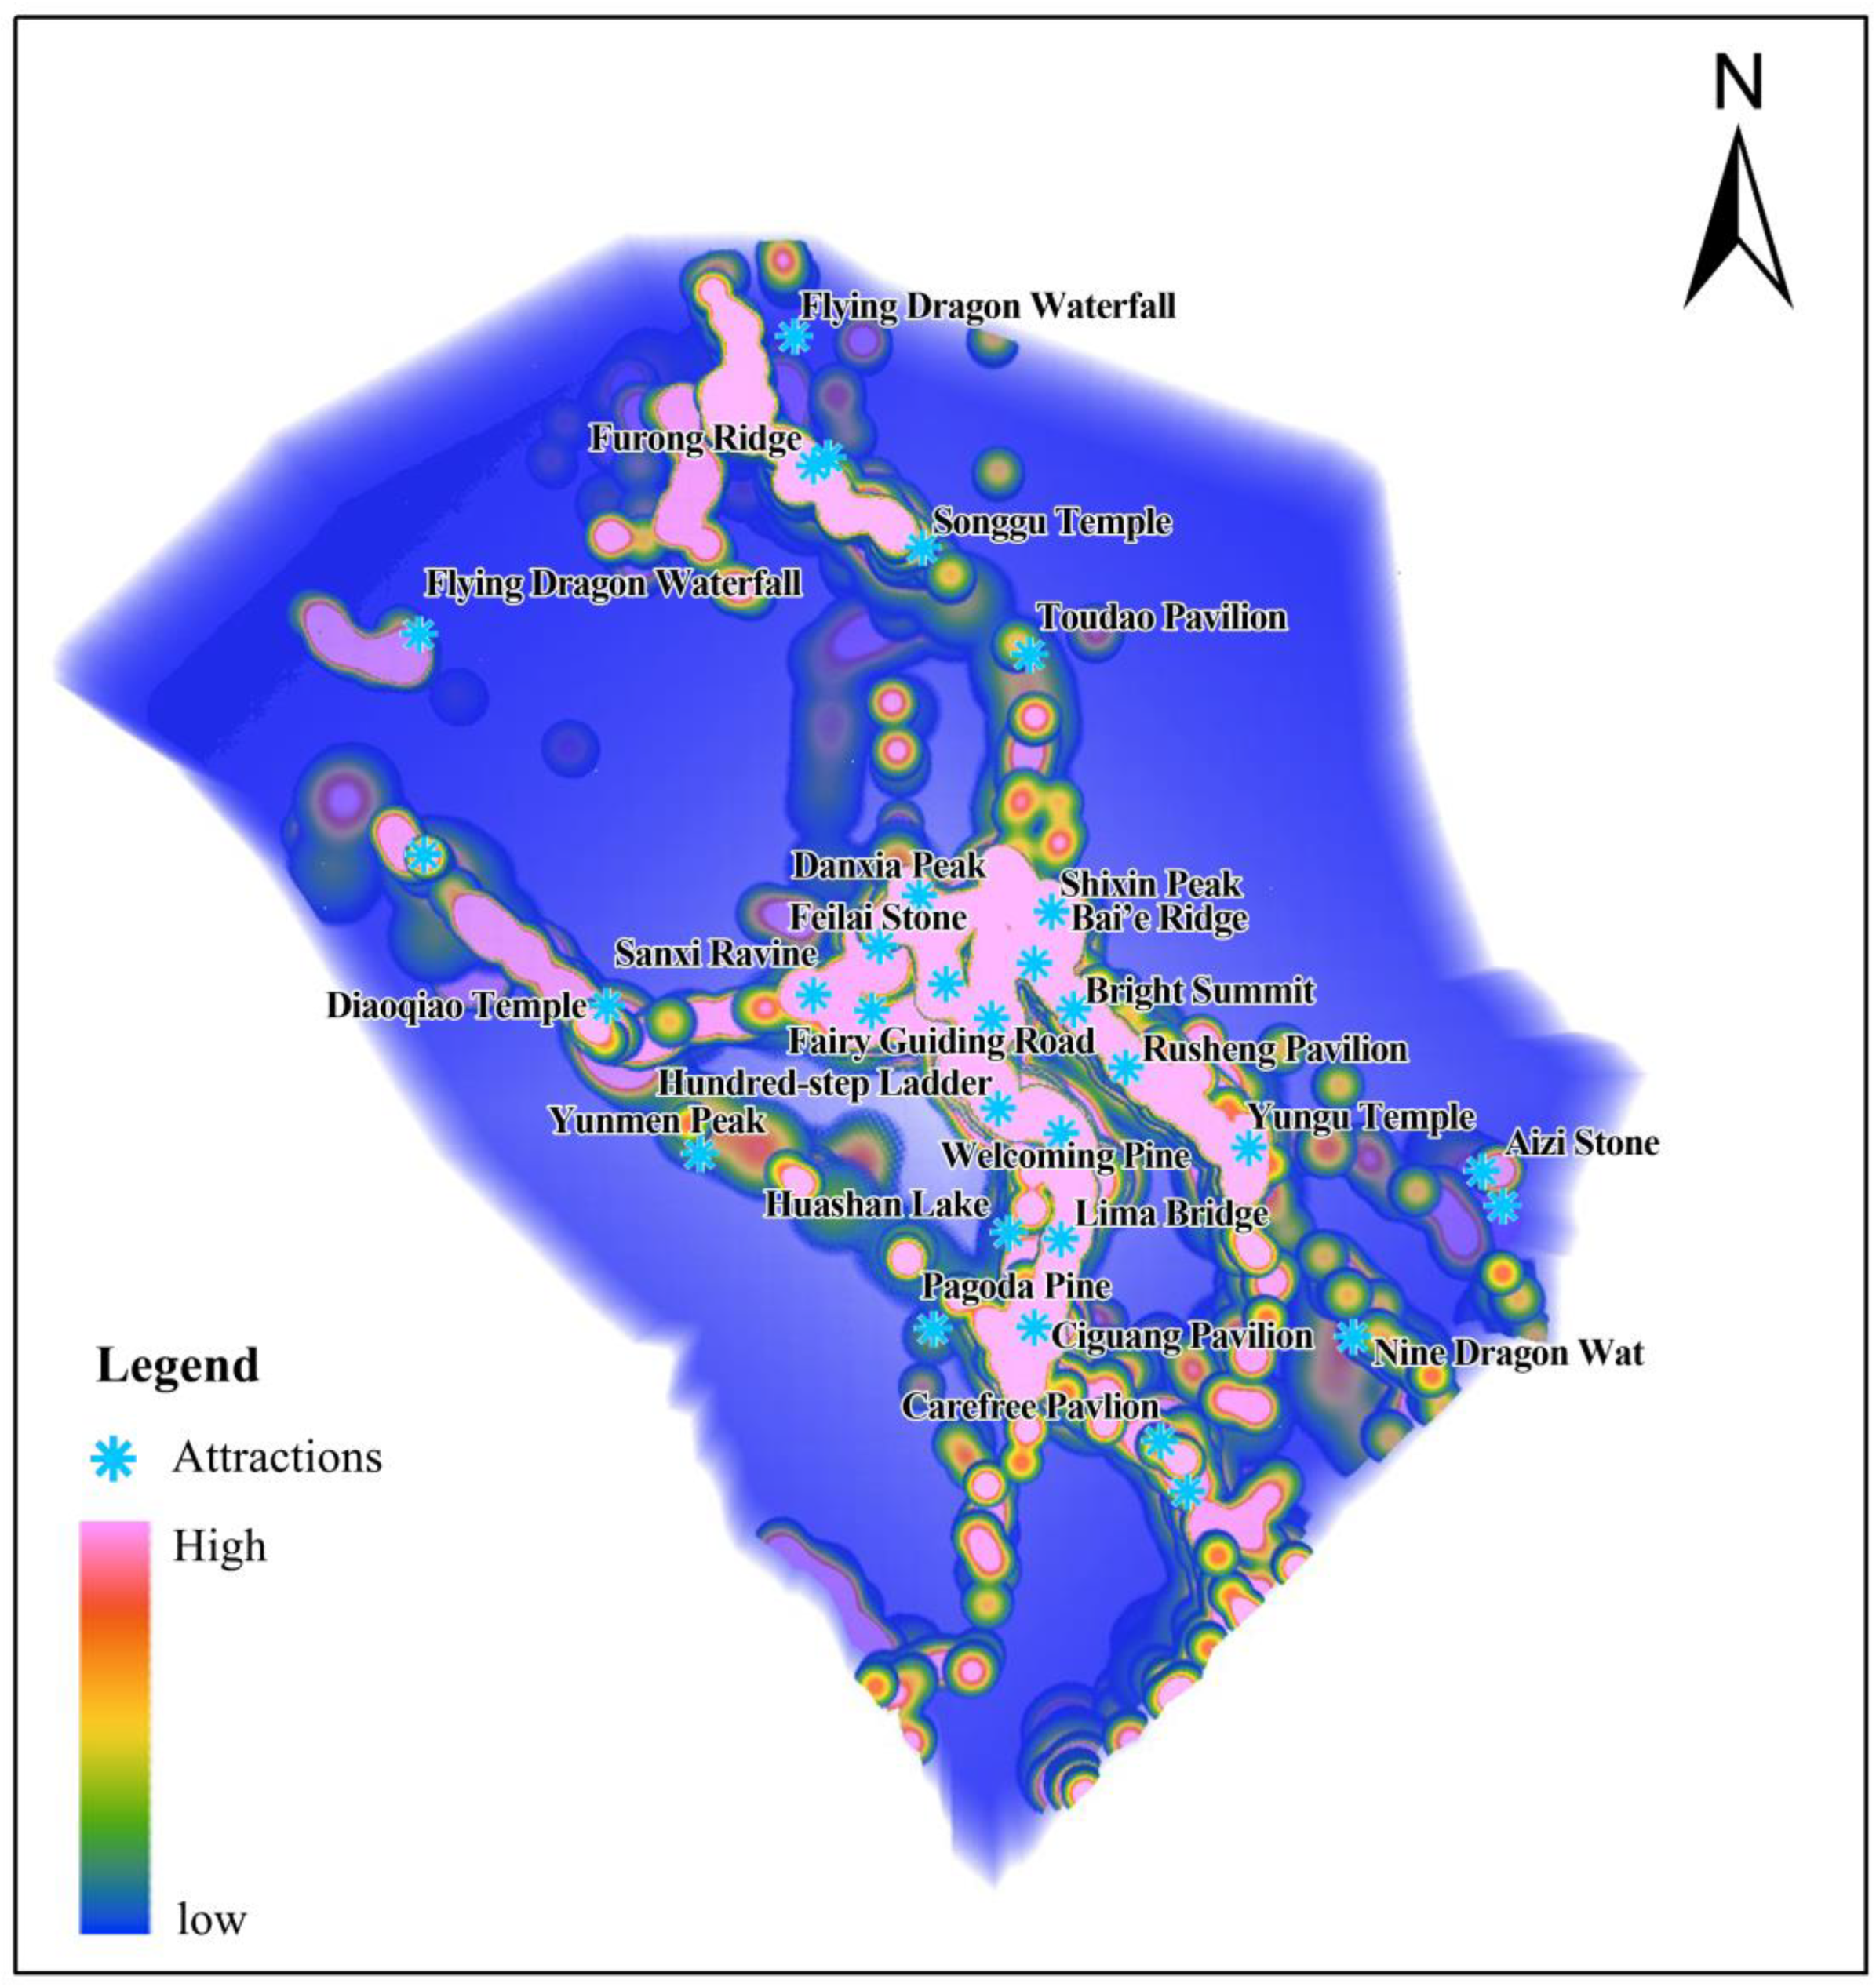
The DF-HD model identified hotspots from geo-tagged photographs (Figure 8), categorized into four hierarchical levels, overlaid with scenic attractions to form an attraction heat map (Table 3). The top three hotspot levels demonstrated significant spatial coupling with attractions, while the fourth level showed weaker coupling, primarily distributed along roads.
High-heat attractions (heat values 12,088–9150) clustered significantly in Yuping and Beihai areas. Moderate-high-heat attractions (heat values 7938–2446) were primarily north of high-heat attractions, exhibiting significant variability. Moderate-heat attractions (heat values 1908–518) were dispersed across six scenic areas, and low-heat attractions (heat values < 245) aligned with roads. Overall, although the high-, moderate-high-, and moderate-heat attractions are linked to the core scenic resources, their combined spatial footprint covers only about 10% of the Huangshan Scenic Area. Most are located at higher elevations with relatively homogeneous landscape types, and there is limited spatial overlap between the high-intensity and moderately high-intensity areas. Moreover, the surrounding areas lack sufficiently attractive substitute sites. Together, these factors hinder effective visitor redistribution during peak seasons. Therefore, optimizing spatial layouts, enhancing peripheral attractions, and fostering connectivity between core and peripheral areas are vital for sustainable tourism. Developing alternative attractions near high-heat zones (e.g., Bright Summit–Welcoming Pine and Shixin Peak–Feilai Stone areas) can diversify visitor distribution. Additionally, activating peripheral resources like Songgu’s thermal springs in synergy with existing resources can facilitate balanced regional development.
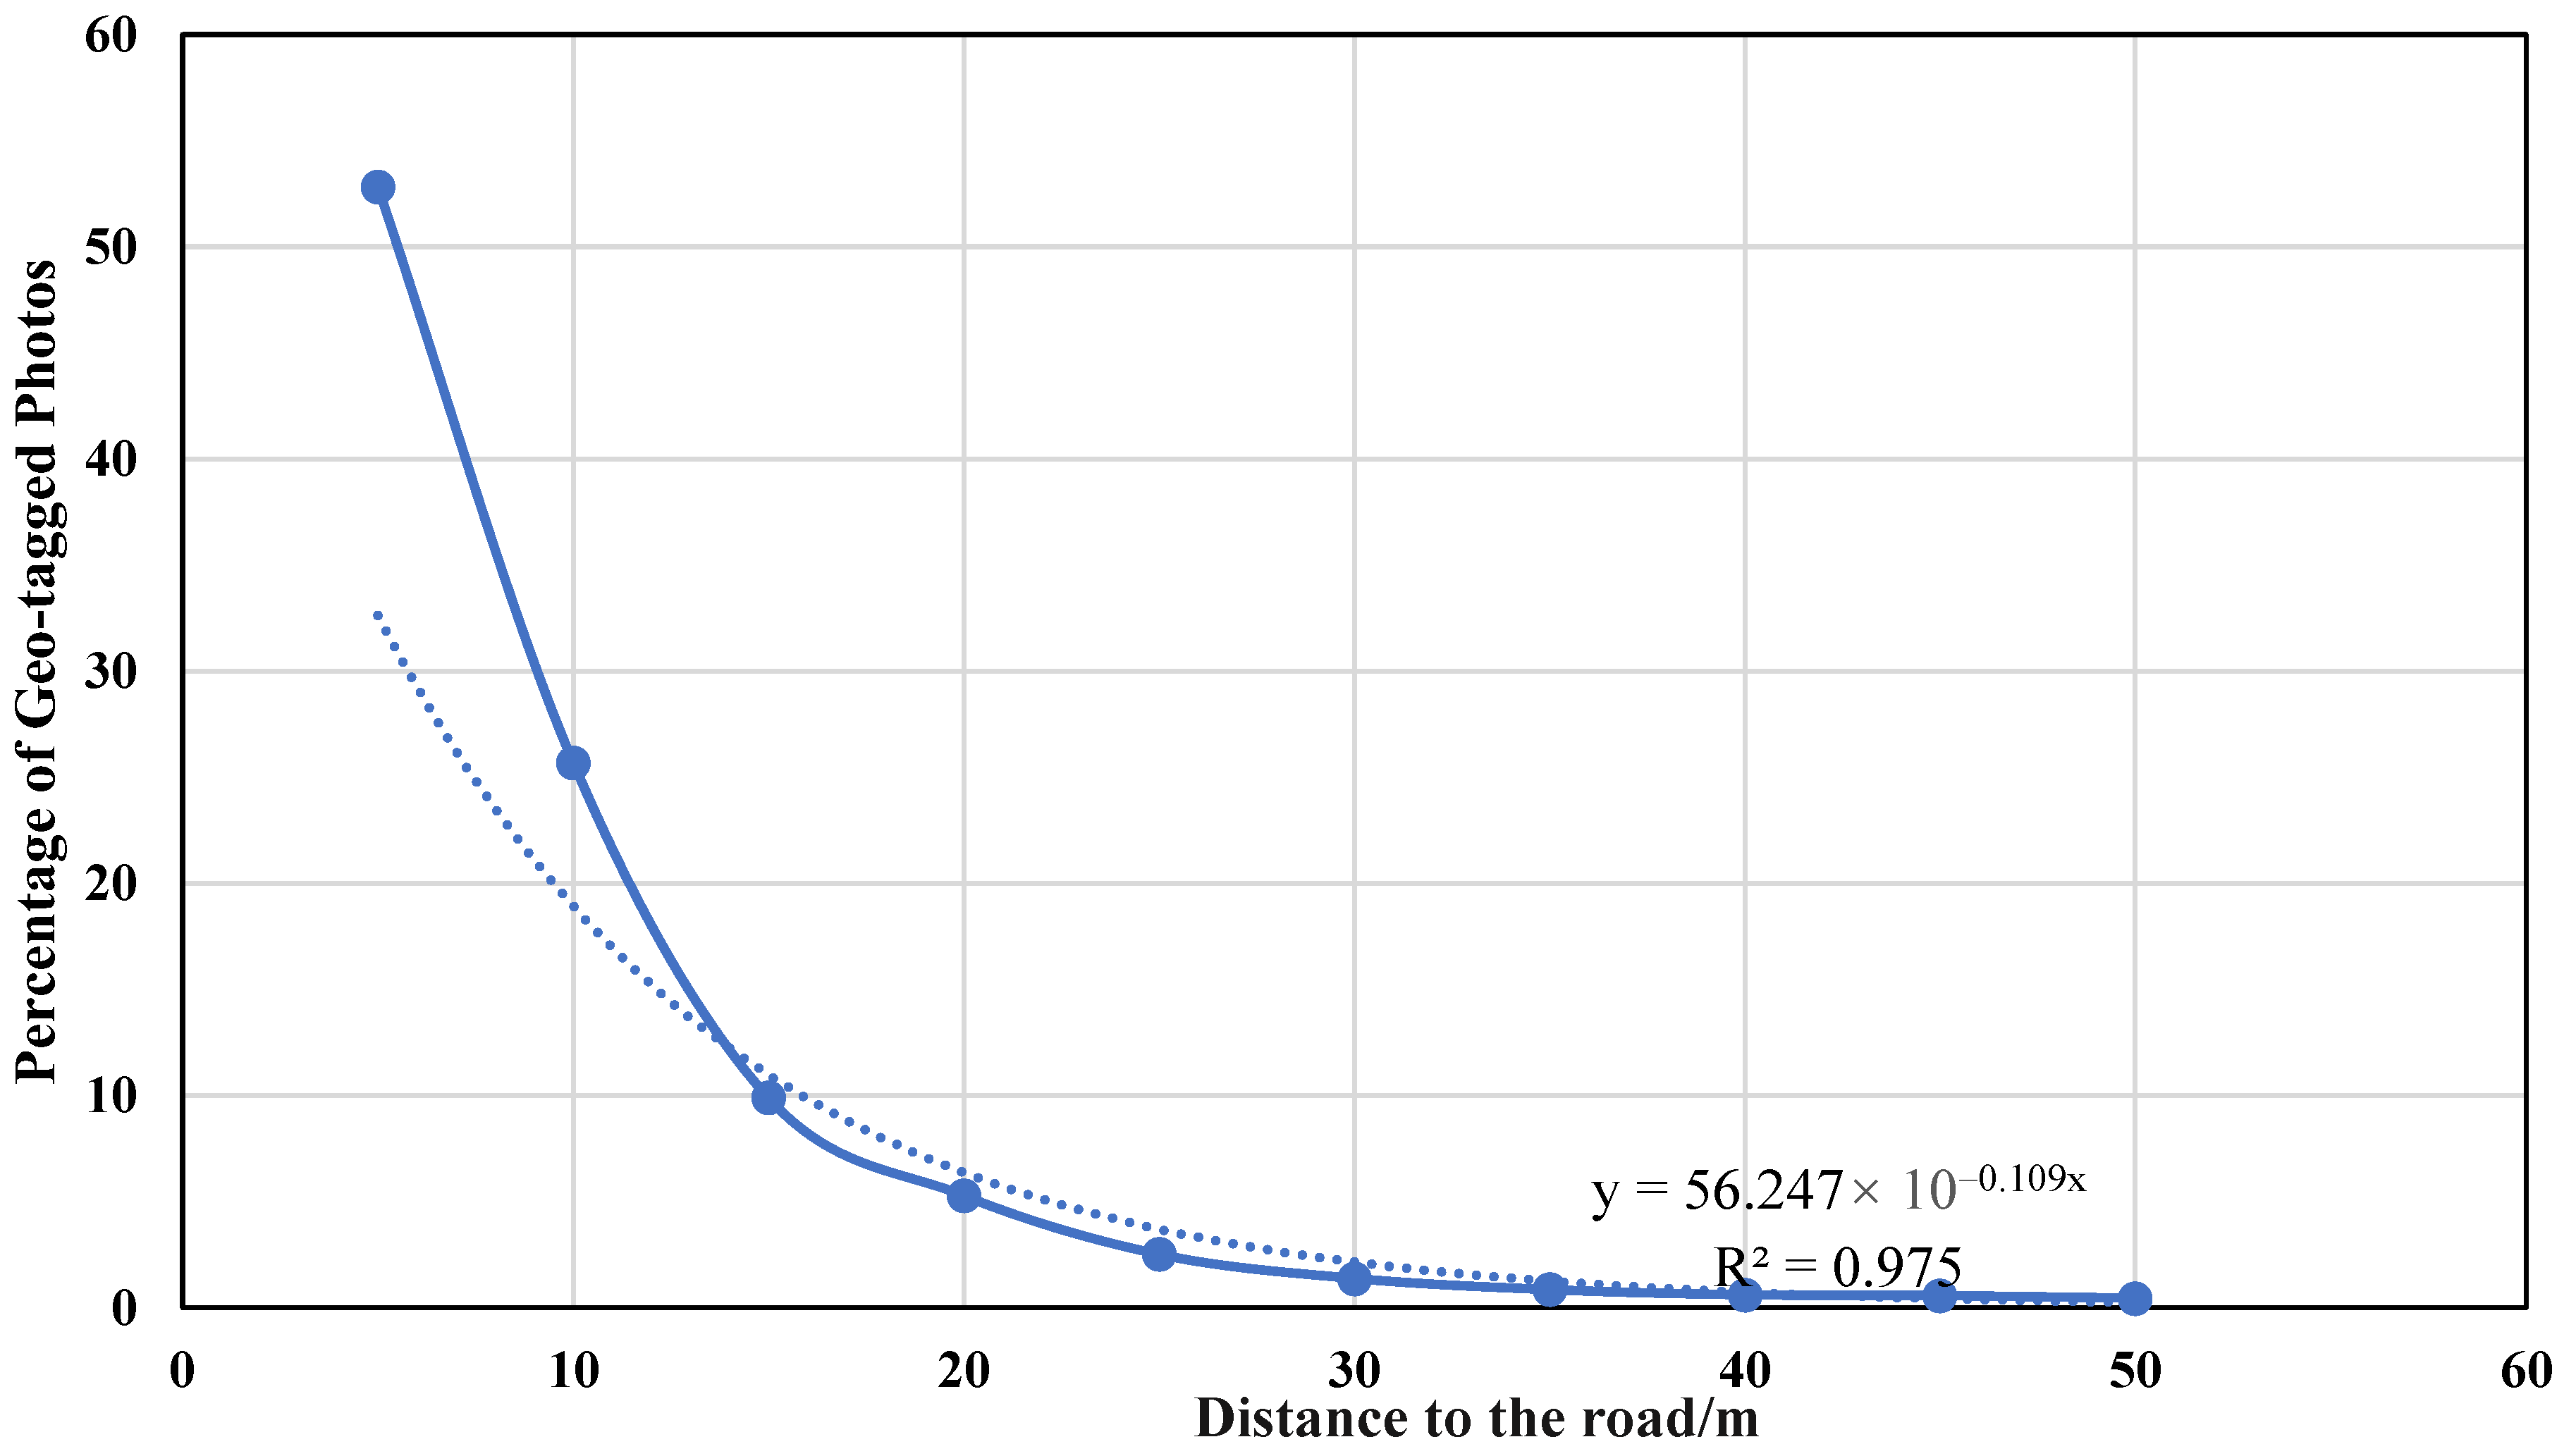
Using a nearest-neighbor approach, we examined the spatial relationship between geo-tagged photographs and the scenic road network (Figure 9). Photo counts were aggregated in concentric distance bands at 5 m intervals. The number of geo-tagged photos declines exponentially with increasing distance from roads, well described by y = 56.247 × 10−0.109x with a coefficient of determination R2 = 0.975, indicating an excellent fit. The decay constant (k = 0.109 m−1) implies a half-distance of 6.36 m; that is, for every additional 6.36 m from a road, the expected photo count is reduced by half. Consistent with this pattern, over 93% of geo-tagged photos fall within 20 m of roads, evidencing a pronounced path-dependence in visitor behavior.

3.3. Space–Time Cube Analysis of Attractions and Visitor Patterns

To reveal the dynamic associations and evolutionary patterns of visitor behavior in both space and time, we constructed a space–time cube (STC) that integrates sequential time slices with geographic locations in three dimensions. Specifically, the 22,397 visitor points of interest (POIs) were aggregated by month; using an empirically selected bandwidth, we generated monthly density-field surfaces, which were then assembled into a mosaic dataset to build the STC. Spatiotemporal voxels were subsequently used for visualization and analysis (Figure 10). By adjusting the transparency parameters, we could clearly observe pronounced month-to-month differences in the spatial extent of the density fields. To expose internal structural details, we further extracted cross-sectional slices through the space–time voxels for selected attractions within the Mount Huangshan Scenic Area (Figure 11).
The Space–Time Cube (STC) analysis revealed nuanced spatiotemporal patterns of visitor activities. Inspection of STC voxel data for various attractions showed high voxel values and extensive distributions during spring and autumn, contrasting lower values and reduced distributions in winter and summer, especially in January, February, August, and December. Attractions like Bright Summit and Welcoming Pine maintained high voxel values year-round. Attractions such as Ciguang Pavilion, Dreamland, and Shixin Peak exhibited moderate voxel values, while those in Yungu and Songgu had lower values. Seasonality varied significantly: water-oriented attractions like West Sea Grand Canyon attracted longer visits in summer, while snow-oriented attractions like Shixin Peak appealed in winter. Overall, the number of attractions with high seasonal appeal in summer and winter is markedly lower than in spring and autumn, and their active STC-voxel footprints are correspondingly limited in spatial extent. Only a handful of sites stand out in summer or winter; however, these are typically lower-tier attractions with relatively homogeneous landscape features and small catchment areas, which constrain their capacity to draw large visitor volumes.
Future planning should address seasonal gaps, activate resources, and optimize visitor distribution. Summer offerings could include water-based activities and star-gazing experiences. Winter plans could incorporate immersive ice and snow activities, safe viewing platforms, and cultural experiences highlighting Huizhou heritage. Developing educational and thematic travel products targeting student groups during vacations will enrich tourist experiences and achieve sustainable, balanced tourism development.

3.4. Comparative Analysis

3.4.1. Temporal Trend and Evolution of Seasonality

To elucidate the temporal trend and evolutionary pattern of seasonality in the Mount Huangshan Scenic Area, we conducted a longitudinal comparison using the seasonal intensity index against findings from prior studies. The indices derived from GPS trajectories and geo-tagged photographs are 2.58 and 3.13, respectively, notably lower than previous studies [63,64], indicating reduced seasonal variation in tourist visits to Mount Huangshan. This reduction likely stems from improved infrastructure, including the completion of a cableway network, enhancing winter access by 75%, protective measures against winter ice, discounted off-season ticket policies, and diversified all-season tourism products like summer camping and winter wellness activities.

3.4.2. Trajectory Density vs. Geo-Tagged Photo Grids

Density analysis of 2263 tourist trajectories was highly consistent with the spatial distribution of geo-tagged photographs (Figure 12), highlighting significant hierarchical spatial clustering of tourist routes. The Yuping and Beihai scenic areas, central to the tourism system, exhibited the highest trajectory density, forming primary hotspot routes, notably the Welcoming Pine–Hundred-step Cloud Ladder–Bright Summit axis. Secondary hotspots included routes connecting Wenquan and Yuping, and Diao Bridge and Beihai areas, such as Bright Summit–Feilai Stone and Dreamland–Paiyun Pavilion routes. From the perspective of the scenic area’s entrance system, the South Gate—benefiting from convenient transportation and well-developed facilities—serves as the primary entry point for most visitors, followed by the North Gate, whereas the East and West Gates receive markedly lower visitor volumes. The southern entrance, favored for its accessibility, exhibited secondary hotspot routes through Carefree Pavilion, Wenquan, and Yuping areas, demonstrating significant spatial linkage between entry points and core attractions. Yungu and Songgu areas, which are farther and less attractive, formed third-tier hotspot routes.
Overall, visitor flows in the Mount Huangshan Scenic Area display a pronounced north–south spatial pattern. The Diao Bridge area near the West Gate and the Yungu area near the East Gate show relatively low visitation intensity, whereas crowding pressure is highly concentrated in traditional hotspots such as Beihai and Yuping. Looking ahead, strengthening the dispersal capacity of the East and West Gates and enhancing the attractiveness of the eastern and western subareas would enable the creation of secondary touring loops, effectively relieving pressure on the South Gate and the core zones. This would optimize the spatial distribution of visitors and foster a multi-center, networked internal circulation—a strategy of clear significance for structural optimization and sustainable development in Huangshan. The main benefits are threefold:
Relieve core congestion and protect OUV. Alleviate the intense human pressure in core areas (e.g., Yuping and Beihai), reduce ecological loading on sensitive environments, and safeguard the site’s Outstanding Universal Value.
Differentiate products and extend stays. Build a portfolio of “rugged west, tranquil east”—adventure-oriented products in the west and culture–leisure offerings in the east—to enrich experience layers, lengthen stays, and move beyond the prevailing one-day-tour model.
Enhance spatial efficiency and resilience. Achieve a more balanced visitor distribution, thereby improving overall spatial organization and boosting the integrated competitiveness and system resilience of this world-class destination.
In addition, the Songgu area toward the North Gate lies at lower elevations with gentler terrain, making it well-suited to function as a buffer zone.

4. Discussion

At the micro-scale, conventional studies of tourist behavior often rely on continuous digital fields derived from density surfaces to portray the spatial distribution of points of interest. While informative at an aggregate level, these models have limited quantitative power to delineate where hotspots begin and end and to locate intensity peaks with precision. In this study, our density-field hotspot detector (DF-HD) quantitatively distinguishes multi-level hotspot regions and thus captures visitor interest preferences with greater fidelity. In parallel, the space–time cube (STC) effectively reveals spatiotemporal heterogeneity among attractions. Despite the contributions of this work, several issues merit further discussion.

4.1. Potential Application Scenarios

The DF-HD is an effective tool for precisely identifying core aggregation zones and their spatial extents within point datasets, enabling a shift from broad areal distribution to core-area delineation. It is suitable wherever local extrema must be extracted from macroscopic density surfaces. Urban studies and planning: By analyzing commercial POIs (e.g., shops, restaurants), DF-HD can identify multi-level business cores and their catchment boundaries, providing quantitative evidence for retail layout and competitive analysis [48]. Traffic management: Using GPS traces or crash locations, DF-HD pinpoints extreme congestion/accident clusters along a network, distinguishing multiple black spots on the same roadway and supporting fine-grained governance [65,66]. Ecological conservation: With species-occurrence points, DF-HD can delineate biodiversity hotspots—such as core habitats and breeding grounds—thereby informing reserve zoning and ecological corridor design and improving protection efficiency [67,68].Space–Time Cube (STC) integrates time explicitly into spatial analysis to reveal temporal dynamics and anomalies. Public safety: Spatiotemporal analysis of crime incidents can expose seasonal migration of hotspots and shifts in offense types, guiding precise deployment of patrol resources [69,70]. Infectious-disease control: STC built from case reports can reconstruct transmission pathways, localize outbreak centers, and support rapid response and intervention evaluation [71,72].

4.2. Study Limitations

Data-dimension limitations.Lack of socio-demographic attributes. Although the 2bulu GPS trajectories reconstruct positions, speeds, and headings with high fidelity, they do not contain age, gender, origin, occupation, or education, limiting our ability to infer psychological needs and value motivations behind behavior. Limited semantic understanding of photos. We applied rule-based filtering to remove content unsuitable as POIs (e.g., restrooms, signage), but have not yet systematically incorporated computer-vision methods for image semantics.
Temporal-scale limitations.Our primary temporal unit is monthly, which captures seasonality but not short-term holiday surges or intra-day rhythms. Moreover, analysis is based on 2263 valid trajectories extracted from 2017–2023; this scale may constrain statistical power for fine subgroups or brief episodic phenomena.
Spatial-scale and generalizability limitations. The study focuses on the micro-scale within the Huangshan boundary. Under the evolving Greater Huangshan collaboration, interactions between the core scenic area and neighboring 5A destinations (e.g., Taiping Lake, Hongcun, Xidi, Jiuhua Mountain) are being reconfigured. Systematically parsing meso-scale flows within this world-class destination network is an important direction. We also acknowledge MAUP and parameter sensitivity (e.g., 100-m grid, monthly STC slices, DF-HD bandwidths); a more systematic multi-scale robustness assessment is needed.
Methodological scope.Our integrated DF-HD + STC + spatial gridding pipeline is designed for hierarchical hotspot detection and seasonal evolution. It does not yet include causal inference (e.g., treatment effects of management measures) or predictive simulation (e.g., agent-based or queueing models).

4.3. Future Research Directions

From “behavioral patterns” to “behavioral drivers.”Through multi-source data fusion, we will construct multi-dimensional tourist profiles by integrating GPS trajectories with surveys (socio-demographics, motivations, satisfaction), in-depth interviews (decision processes, experiential perceptions), and social-media data (text sentiment and image content analysis), enabling precise linkage of trajectory + attributes + motivation [73]. In parallel, computer-vision models will support multimodal parsing of geo-tagged photos to automatically detect scenes (e.g., summit, lakeshore), objects (e.g., trekking poles), activities (e.g., hiking, photographing), and affective/crowding cues—transforming traditional POIs into context-rich activity points [60,74] for fine-grained, situational interpretation of behavior and experience quality.
Multi-scale analytics for “dynamic processes.”We will develop a hierarchical temporal framework spanning year–month–week–holiday (e.g., Golden Week)–day–hour [39] to reveal the formation, surge, and dissipation of overtourism during holidays, and to characterize time-of-day clustering and dispersion (e.g., early morning vs. afternoon). This will underpin timed-entry and real-time diversion policies with time-specific guidance. Rolling inclusion of 2024+ data will improve model precision, enable post-pandemic comparisons, and test cross-year stability.
At the meso-regional level, we will expand from the Huangshan core to the Greater Huangshan system by integrating flows across multiple 5A attractions (e.g., Hongcun, Xidi) using compliant sources such as mobile signaling and linked-ticket data. This will clarify network structures, primary corridors, and hubs; model cross-destination choice; and diagnose competition–coordination dynamics, thereby informing regional itinerary design and pressure relief for core sites.
From “descriptive diagnosis” to “intervention simulation.”We will translate empirical rules into forward-looking tools. For example, an agent-based model will instantiate heterogeneous visitor agents in a virtual environment to simulate behavioral responses and spatial redistributions under scenarios such as extreme weather or sudden surges. This policy laboratory can anticipate impacts prior to implementation, identify latent risks (e.g., emergent bottlenecks), and optimize management strategies—enhancing the proactivity and scientific basis of decision-making.

5. Conclusions

Drawing on GPS trajectories and geo-tagged photographs from the Mount Huangshan Scenic Area (2017–2023), this study integrated a Density-Field Hotspot Detector (DF-HD), a Space–Time Cube (STC), and spatial gridding to systematically characterize visitors’ spatiotemporal behavior and mobility patterns. The main conclusions are as follows:
Temporal and vertical regularities. Visitor behavior exhibits a pronounced “double-peak, double-trough” seasonal wave, with marked surges in spring and autumn. Spatially, distribution shows strong elevation dependence and clear vertical differentiation: points of interest cluster extremely within the 1600–1800 m band, forming the absolute core of visitor activity. This pattern underscores the distinctive mobility signatures of a site with both natural and cultural Outstanding Universal Value.
Hierarchical hotspots and structural implications. The DF-HD model effectively identifies multi-level visitor interest hotspots and clarifies their spatial structure. Spatial overlap between high-intensity and moderately high-intensity areas is limited and nearby substitutes are scarce. Consequently, pressure concentrates within a narrow core. These findings provide critical evidence for targeted crowd dispersion and refined, zone-specific management.
Joint spatiotemporal dynamics from STC. By integrating continuous time with geographic space in a 3D framework, the STC enables joint analysis of attraction-specific flow distributions and fluctuations. Results indicate marked seasonal heterogeneity in attraction appeal and visitor spatial behavior: sites such as Xihai Grand Canyon and Lima Bridge concentrate visitors and lengthen dwell times in summer, whereas Shixin Peak and Yungu gain prominence in winter. These insights offer a scientific basis for zoning strategies and seasonal flow regulation.
Comparative evidence on seasonality and route use. Longitudinal comparison shows a declining trend in the seasonal intensity index, signaling a gradual easing of temporal concentration and, by implication, reduced pressure during traditional peak seasons. Moreover, close agreement between trajectory densities and gridded photo counts jointly reveals multi-tier clustering along touring routes, pointing to actionable pathways for secondary loop design, internal structural optimization, and more balanced distribution of visitors away from the core.
Overall, the study extends the analytical scope of tourism big data in both theory and method and provides practical guidance and decision support for spatial planning, visitor management, and sustainable development in Mount Huangshan and comparable mountain heritage destinations.

Author Contributions

Conceptualization, Jianping Sun and Shi Chen; methodology, Yinlan Huang; software, Qiong Li; validation, Huifang Rong, Shi Chen and Jianping Sun; formal analysis, Jianping Sun; investigation, Qiong Li; resources, Huifang Rong; data curation, Shi Chen; writing—original draft preparation, Jianping Sun; writing—review and editing, Huifang Rong and Shi Chen; visualization, Yinlan Huang and Qiong Li; supervision, Huifang Rong; project administration, Huifang Rong and Shi Chen; funding acquisition, Jianping Sun. All authors have read and agreed to the published version of the manuscript.

Funding

This research was funded by Key Project of Anhui Provincial Department of Education (2022AH051821).

Data Availability Statement

The raw data supporting the conclusions of this article will be made available by the authors on request.

Conflicts of Interest

The authors declare no conflicts of interest.

References

  1. Mihalic, T. Concpetualising overtourism: A sustainability approach. Ann. Tour. Res. 2020, 84, 103025. [Google Scholar] [CrossRef]
  2. Li, A.; Mou, N.; Zhang, L.; Yang, T.; Liu, W.; Liu, F. Tourism Flow between Major Cities during China’s National Day Holiday: A Social Network Analysis Using Weibo Check-in Data. IEEE Access 2020, 8, 225675–225691. [Google Scholar] [CrossRef]
  3. Zheng, Y.; Mou, N.; Zhang, L.; Makkonen, T.; Yang, T. Chinese tourists in Nordic countries: An analysis of spatio-temporal behavior using geo-located travel blog data. Comput. Environ. Urban Syst. 2021, 85, 101561. [Google Scholar] [CrossRef]
  4. García-García, J.M.; Santos-Rojo, C.; Llopis-Amor, M. Overtourism and sustainability: A bibliometric study (2018–2021). Technol. Forecast. Soc. Chang. 2023, 188, 122285. [Google Scholar] [CrossRef]
  5. Xu, S.; Kim, H.J.; Liang, M.; Ryu, K. Interrelationships between tourist involvement, tourist experience, and environmentally responsi-ble behavior: A case study of Nansha Wetland Park, China. J. Travel Tour. Mark. 2018, 35, 856–868. [Google Scholar] [CrossRef]
  6. Wang, Y.; Bramwell, B. Heritage protection and tourism development priorities in Hangzhou, China: A political economy and gov-ernance perspective. Tour. Manag. 2012, 33, 988–998. [Google Scholar] [CrossRef]
  7. Grelaud, M.; Ziveri, P. The generation of marine litter in Mediterranean island beaches as an effect of tourism and its mitigation. Sci. Rep. 2020, 10, 20326. [Google Scholar] [CrossRef] [PubMed]
  8. Chen, J.; Shoval, N.; Stantic, B. Tracking tourist mobility in the big data era: Insights from data, theory, and future directions. Tour. Geogr. 2024, 26, 1381–1411. [Google Scholar] [CrossRef]
  9. Mehmood, F.; Ahmad, S.; Kim, D.H. Design and development of a real-time optimal route recommendation system using big data for tourists in Jeju Island. Electronics 2019, 8, 506. [Google Scholar] [CrossRef]
  10. Chantre-Astaiza, A.; Fuentes-Moraleda, L.; Muñoz-Mazón, A.; Ramirez-Gonzalez, G. Science mapping of tourist mobility 1980–2019. Technological advancements in the collection of the data for tourist traceability. Sustainability 2019, 11, 4738. [Google Scholar] [CrossRef]
  11. Zhang, Z.; Wang, F.; Deng, L. Identifying node-corridor-network of tourist flow and influencing factors using GPS big data: A case study in Gansu and Qinghai provinces, China. Int. J. Appl. Earth Obs. Geoinf. 2024, 135, 104271. [Google Scholar] [CrossRef]
  12. Maeda, T.N.; Yoshida, M.; Toriumi, F.; Ohashi, H. Extraction of tourist destinations and comparative analysis of preferences between foreign tourists and domestic tourists on the basis of geotagged social media data. ISPRS Int. J. Geo-Inf. 2018, 7, 99. [Google Scholar] [CrossRef]
  13. Mou, N.; Liu, Z.; Zheng, Y.; Makkonen, T.; Yang, T.; Zhang, L. Cycling in Tibet: An analysis of tourists’ spatiotemporal behavior and infrastructure. Tour. Manag. 2022, 88, 104418. [Google Scholar] [CrossRef]
  14. Zheng, W.; Li, M.; Lin, Z.; Zhang, Y. Leveraging tourist trajectory data for effective destination planning and management: A new heuristic approach. Tour. Manag. 2022, 89, 104437. [Google Scholar] [CrossRef]
  15. Peng, X.; Huang, Z. A novel popular tourist attraction discovering approach based on geo-tagged social media big data. ISPRS Int. J. Geo-Inf. 2017, 6, 216. [Google Scholar] [CrossRef]
  16. Mou, N.; Yuan, R.; Yang, T.; Zhang, H.; Tang, J.; Makkonen, T. Exploring spatio-temporal changes of city inbound tourism flow: The case of Shanghai, China. Tour. Manag. 2020, 76, 103955. [Google Scholar] [CrossRef]
  17. Liu, J.; Chen, J.; Law, R.; Wang, S.; Yang, L. Travel patterns and spatial structure: Understanding winter tourism by trajectory data mining. Asia Pac. J. Tour. Res. 2024, 29, 1351–1368. [Google Scholar] [CrossRef]
  18. Li, G.; Yuan, J.; Deng, N. Comparative study of the spatial behavior of Chinese and foreign tourists based on landmark recognition in short tourism videos: A case study of Beijing. Asia Pac. J. Tour. Res. 2024, 29, 96–112. [Google Scholar] [CrossRef]
  19. Vu, H.Q.; Leung, R.; Rong, J.; Miao, Y. Exploring Park Visitors’ Activities in Hong Kong using Geotagged Photos. In Information and Communication Technologies in Tourism 2016; Springer: Cham, Switzerland, 2016; pp. 183–196. [Google Scholar] [CrossRef]
  20. Li, Y.; Xie, J.; Gao, X.; Law, A. A Method of selecting potential development regions based on GPS and social network models–from the perspective of tourist behavior. Asia Pac. J. Tour. Res. 2021, 26, 183–199. [Google Scholar] [CrossRef]
  21. Ji, K.M.; Zhao, Y.; Wang, J.; Huang, X. Consuming the mundane and extraordinary: Hospitality facilities and transport in the spatio-temporal behaviour of theme park visitors. Asia Pac. J. Tour. Res. 2021, 26, 953–972. [Google Scholar] [CrossRef]
  22. Smallwood, C.B.; Beckley, L.E.; Moore, S.A. An analysis of visitor movement patterns using travel networks in a large marine park, north-western Australia. Tour. Manag. 2012, 33, 517–528. [Google Scholar] [CrossRef]
  23. Xu, D.; Cong, L.; Wall, G. Tourists’ spatio-temporal behaviour and concerns in park tourism: Giant Panda National Park, Sichuan, China. Asia Pac. J. Tour. Res. 2019, 24, 924–943. [Google Scholar] [CrossRef]
  24. Zhu, H. Zone division and extraction of historic area based on big data. Curr. Issues Tour. 2021, 24, 1991–2012. [Google Scholar] [CrossRef]
  25. Huang, Y.; Xiao, Z.; Wang, D.; Jiang, H.; Wu, D. Exploring Individual Travel Patterns across Private Car Trajectory Data. IEEE Trans. Intell. Transp. Syst. 2020, 21, 5036–5050. [Google Scholar] [CrossRef]
  26. Korpilo, S.; Virtanen, T.; Saukkonen, T.; Lehvävirta, S. More than A to B: Understanding and managing visitor spatial behaviour in urban forests using public participation GIS. J. Environ. Manage. 2018, 207, 124–133. [Google Scholar] [CrossRef]
  27. Hallo, J.C.; Beeco, J.A.; Goetcheus, C.; McGee, J.; McGehee, N.G.; Norman, W.C. GPS as a Method for Assessing Spatial and Temporal Use Distributions of Nature-Based Tourists. J. Travel Res. 2012, 51, 591–606. [Google Scholar] [CrossRef]
  28. Edwards, D.; Griffin, T. Understanding tourists’ spatial behaviour: GPS tracking as an aid to sustainable destination management. J. Sustain. Tour. 2013, 21, 580–595. [Google Scholar] [CrossRef]
  29. Ahas, R.; Aasa, A.; Mark, Ü.; Pae, T.; Kull, A. Seasonal tourism spaces in Estonia: Case study with mobile positioning data. Tour. Manag. 2007, 28, 898–910. [Google Scholar] [CrossRef]
  30. Saluveer, E.; Raun, J.; Tiru, M.; Altin, L.; Kroon, J.; Snitsarenko, T.; Aasa, A.; Silm, S. Methodological framework for producing national tourism statistics from mobile positioning data. Ann. Tour. Res. 2020, 81, 102895. [Google Scholar] [CrossRef]
  31. Bao, M.; Yang, N.; Zhou, L.; Lao, Y.; Zhang, Y.; Tian, Y. The spatial analysis of weibo check-in data-The case study of Wuhan. Commun. Comput. Inf. Sci. 2013, 399 Pt 2, 480–491. [Google Scholar] [CrossRef]
  32. Zhou, L.; Bao, M.; Yang, N.; Lao, Y.; Zhang, Y.; Tian, Y. Spatio-temporal analysis of weibo check-in data based on spatial data ware-house. Commun. Comput. Inf. Sci. 2013, 399 Pt 1, 466–479. [Google Scholar] [CrossRef]
  33. Alfred, R.; Chen, Z.; Eboy, O.V.; Luxuan, Z.; Renjie, L. Analyzing trends in the spatial-temporal visitation patterns of mainland Chi-nese tourists in Sabah, Malaysia based on Weibo social big data. Heliyon 2023, 9, e15526. [Google Scholar] [CrossRef] [PubMed]
  34. Traunmueller, M.W.; Johnson, N.; Malik, A.; Kontokosta, C.E. Digital footprints: Using WiFi probe and locational data to analyze hu-man mobility trajectories in cities. Comput. Environ. Urban Syst. 2018, 72, 4–12. [Google Scholar] [CrossRef]
  35. Grinberger, A.Y.; Shoval, N.; McKercher, B. Typologies of tourists’ time-space consumption: A new approach using GPS data and GIS tools. Tour. Geogr. 2014, 16, 105–123. [Google Scholar] [CrossRef]
  36. Wang, M.; Liu, J.; Zhang, S.; Zhu, H.; Zhang, X. Spatial pattern and micro-location rules of tourism businesses in historic towns: A case study of Pingyao, China. J. Destin. Mark. Manag. 2022, 25, 100721. [Google Scholar] [CrossRef]
  37. Shoval, N.; Isaacson, M. Sequence alignment as a method for human activity analysis in space and time. Ann. Assoc. Am. Geogr. 2007, 97, 282–297. [Google Scholar] [CrossRef]
  38. Taczanowska, K.; González, L.M.; Garcia-Massó, X.; Muhar, A.; Brandenburg, C.; Toca-Herrera, J.L. Evaluating the structure and use of hiking trails in recreational areas using a mixed GPS tracking and graph theory approach. Appl. Geogr. 2014, 55, 184–192. [Google Scholar] [CrossRef]
  39. Liu, W.; Wang, B.; Yang, Y.; Mou, N.; Zheng, Y.; Zhang, L.; Yang, T. Cluster analysis of microscopic spatio-temporal patterns of tourists’ movement behaviors in mountainous scenic areas using open GPS-trajectory data. Tour. Manag. 2022, 93, 104614. [Google Scholar] [CrossRef]
  40. Li, Y.; Yang, L.; Shen, H.; Wu, Z. Modeling intra-destination travel behavior of tourists through spatio-temporal analysis. J. Destin. Mark. Manag. 2019, 11, 260–269. [Google Scholar] [CrossRef]
  41. Huang, X.; Wu, B. Intra-attraction Tourist Spatial-Temporal Behaviour Patterns. Tour. Geogr. 2012, 14, 625–645. [Google Scholar] [CrossRef]
  42. Gu, Q.; Zhang, H.; Huang, S.; Zheng, F.; Chen, C. Tourists’ spatiotemporal behaviors in an emerging wine region: A time-geography perspective. J. Destin. Mark. Manag. 2021, 19, 100513. [Google Scholar] [CrossRef]
  43. Liu, J.; Li, X.; Yang, Y.; Tan, Y.; Geng, T.; Wang, S. Short- and long-term prediction and determinant analysis of tourism flow networks: A novel steady-state Markov chain method. Tour. Manag. 2025, 109, 105139. [Google Scholar] [CrossRef]
  44. Wang, S.; Yang, Y.; Tan, Y.; Chen, J.; Hu, S.; Liu, J. Dynamic evolution of spatiotemporal behavioral patterns in desert tourism: Insights from big trajectory data. Asia Pac. J. Tour. Res. 2025; ahead of print. [Google Scholar] [CrossRef]
  45. Yun, H.J.; Kang, D.J.; Lee, M.J. Spatiotemporal distribution of urban walking tourists by season using GPS-based smartphone application. Asia Pac. J. Tour. Res. 2018, 23, 1047–1061. [Google Scholar] [CrossRef]
  46. Korpilo, S.; Virtanen, T.; Lehvävirta, S. Smartphone GPS tracking—Inexpensive and efficient data collection on recreational move-ment. Landsc. Urban Plan. 2017, 157, 608–617. [Google Scholar] [CrossRef]
  47. Kuo, C.L.; Chan, T.C.; Fan, I.C.; Zipf, A. Efficient method for POI/ROI discovery using Flickr geotagged photos. ISPRS Int. J. Geo-Inf. 2018, 7, 121. [Google Scholar] [CrossRef]
  48. Xu, D.; Cong, L.; Wall, G. Visitors’ spatio-temporal behavior at a zoo in China. Asia Pac. J. Tour. Res. 2020, 25, 931–947. [Google Scholar] [CrossRef]
  49. Mou, N.; Zheng, Y.; Makkonen, T.; Yang, T.; Tang, J.; Song, Y. Tourists’ digital footprint: The spatial patterns of tourist flows in Qing-dao, China. Tour. Manag. 2020, 81, 104151. [Google Scholar] [CrossRef]
  50. Su, X.; Spierings, B.; Dijst, M.; Tong, Z. Analysing trends in the spatio-temporal behaviour patterns of mainland Chinese tourists and residents in Hong Kong based on Weibo data. Curr. Issues Tour. 2020, 23, 1542–1558. [Google Scholar] [CrossRef]
  51. Li, Y.; Luo, P.; Li, R. Study on Spatial Distribution Characteristics of Tourists in Xiazhangquan Area Based on Geographical Indica-tion Photos. J. Fujian Norm. Univ. (Nat. Sci. Ed.) 2020, 36, 93–100. (In Chinese) [Google Scholar]
  52. Ferreira, A.P.G.; Silva, T.H.; Loureiro, A.A.F. Uncovering spatiotemporal and semantic aspects of tourists mobility using social sensing. Comput. Commun. 2020, 160, 240–252. [Google Scholar] [CrossRef]
  53. Liu, J.; Wang, S.; Law, R.; Chen, J.; Yang, L. Growing threat of marine tourism activities to whales: Evidence from vessel trajectory big data mining. J. Sustain. Tour. 2025; ahead of print. [Google Scholar] [CrossRef]
  54. Xu, X.; Hu, J. Study on Spatiotemporal Behavior of Urban Park Tourists Based on GPS Data:A Case Study of Wuhan East Lake Scenic Area. Econ. Geogr. 2020, 40, 224–232. (In Chinese) [Google Scholar]
  55. Lu, J.; Huang, X.; Kupfer, J.A.; Xiao, X.; Li, Z.; Wei, H.; Wang, S.; Zhu, L. Spatial, temporal, and social dynamics in visitation to U.S. national parks: A big data approach. Tour. Manag. Perspect. 2023, 48, 101143. [Google Scholar] [CrossRef]
  56. Zhang, Y.; Zhang, Z.; Li, Y.; Xiao, L. Consensus Map Analysis of Tourist Destination Image in Mountain Scenic Spots: A Case Study of Huangshan Mountain. Tour. Res. 2024, 16, 57–69. (In Chinese) [Google Scholar]
  57. Huang, C.; Wang, Q. A Study on Residents’Perception of Ecological Justice and Spatial Differences in Tourism Community: A Case Study of the Gateway Communities of Huangshan Scenic Area. Tour. Sci. 2024, 38, 59–79. (In Chinese) [Google Scholar] [CrossRef]
  58. Xu, J.; Wang, Q. The relationship between eco-emotions and environmental responsibility behaviors of tourists in natural tourist destinations: A case study of Huangshan Scenic Area. J. Chin. Ecotourism 2024, 14, 359–374. (In Chinese) [Google Scholar] [CrossRef]
  59. Huang, W.; Zhang, Y.; Wu, M.; Dang, A. Tourist Behavioral Analysis of Smart National Park Based on WiFi Positioning Data: Case Study on Huangshan National Park. Chin. Landsc. Archit. 2018, 3, 25–31. [Google Scholar]
  60. Zeng, X.; Zhong, Y.; Yang, L.; Wei, J.; Tang, X. Analysis of Forest Landscape Preferences and Emotional Features of Chinese Forest Recreationists Based on Deep Learning of Geotagged Photos. Forests 2022, 13, 892. [Google Scholar] [CrossRef]
  61. Zhang, H.; Zhou, X.; Tang, G.; Zhou, L.; Ye, X. Hotspot discovery and its spatial pattern analysis for catering service in cities based on field model in GIS. Geogr. Res. 2020, 39, 354–369. (In Chinese) [Google Scholar]
  62. Hu, Y.; Ma, X.; Liu, J.; Liu, Y. Similarity of Spatio-temporal Behavior of Tourists in Island-based Destinations Based on GPS Data: A Case Study of Changdao Island in Shandong Province. Sci. Geogr. Sin. 2022, 42, 1954–1962. (In Chinese) [Google Scholar] [CrossRef]
  63. Lu, L. A study on the tourist flows in mountain resorts—A case study in Huangshan mountain. ACTA Geogr. Sin. 1994, 49, 237–246. (In Chinese) [Google Scholar]
  64. Wang, D.; Lu, L.; Liu, C.; Zhang, J.; Ling, S. Temporal and Spatial Characteristics of Domestic Tourist Flows to Mountain Resorts. J. Mt. Sci. 2004, 22, 625–632. (In Chinese) [Google Scholar]
  65. Liashkov, S. Identifying High-Risk Areas for Traffic Collisions in Montgomery, Maryland Using KDE and Spatial Autocorrelation Analysis. arxiv 2025, arXiv:2506.21930. [Google Scholar]
  66. Rengarasu, T.M.; Arunodi, H.K.I. Identification of Traffic Accident Hotspots using Network Kernel Density: Application to Galle District in Sri Lanka. J. South Asian Logist. Transp. 2025, 5, 1–23. [Google Scholar] [CrossRef]
  67. Hu, Y.; Linsheng, Z.; Qi, W. Identification and analysis of conservation gap of national nature reserves in China. Ecol. Indic. 2024, 158, 111525. [Google Scholar] [CrossRef]
  68. Yang, L.; Xu, H.; Pan, S.; Chen, W.; Zeng, J. Identifying the impact of global human activities expansion on natural habitats. J. Clean. Prod. 2024, 434, 140247. [Google Scholar] [CrossRef]
  69. Khan, A.; Chandran, N.; Gangodkar, D. Geospatial analysis of crime patterns and hotspots for crime prevention using deep learning algorithms. EDPACS, 2025; ahead of print. [Google Scholar] [CrossRef]
  70. Taha, O.I.B.; Shafiq, M.O. Combining the richness of GIS techniques with visualisation tools to better understand the spatial distri-bution of data—A case study of Chicago City crime analysis. Int. J. Big Data Intell. 2020, 7, 29. [Google Scholar] [CrossRef]
  71. Wang, Y.; Chen, X.; Xue, F. A Review of Bayesian Spatiotemporal Models in Spatial Epidemiology. ISPRS Int. J. Geo-Inf. 2024, 13, 97. [Google Scholar] [CrossRef]
  72. Jiao, L.; Shen, T.; Han, Y.; Liu, W.; Liu, W.; Dang, L.; Wei, M.; Yang, Y.; Guo, J.; Miao, M.; et al. The spatial-temporal distribution of hepatitis B virus infection in China, 2006–2018. BMC Infect. Dis. 2024, 24, 811. [Google Scholar] [CrossRef] [PubMed]
  73. Bigné, E.; Zanfardini, M.; Andreu, L. How online reviews of destination responsibility influence tourists’ evaluations: An exploratory study of mountain tourism. J. Sustain. Tour. 2020, 28, 686–704. [Google Scholar] [CrossRef]
  74. Zhang, K.; Chen, Y.; Lin, Z. Mapping destination images and behavioral patterns from user-generated photos: A computer vision approach. Asia Pac. J. Tour. Res. 2020, 25, 1199–1214. [Google Scholar] [CrossRef]
Figure 1. Study Area. Geographic Location of the Huangshan Scenic Area in China. Boundary of the Huangshan Scenic Area.
Ijgi 14 00396 g001
Figure 2. The technical workflow.
Ijgi 14 00396 g002
Figure 3. Tourist GPS Data from the Twostep platform.
Ijgi 14 00396 g003
Figure 4. Data preprocessing. (a) Format conversions (KML to GDB). (b) Format conversions (GDB to points/lines).(The yellow rectangles represent methods, the green ellipses represent data, the blue ellipses indicate workspaces, the cyan ellipses denote attributes, and the orange hexagons symbolize iterators).
Ijgi 14 00396 g004
Figure 5. Density-Field-Based Hotspot Detector.
Ijgi 14 00396 g005
Figure 6. Space–Time Cube. (a) Spatial-temporal Data. (b) Space–Time Cube. (c) Space–Time Voxels.
Ijgi 14 00396 g006
Figure 7. Tourists’ temporal behavior characteristics.
Ijgi 14 00396 g007
Figure 8. Results of hotspot detection using DF-HD.
Ijgi 14 00396 g008
Figure 9. Spatial relationships between geo-tagged photos and scenic roads.
Ijgi 14 00396 g009
Figure 10. Tourists’ spatio-temporal behavior characteristics.
Ijgi 14 00396 g010
Figure 11. Partial Cutaway Visualization of Tourists’ Spatio-temporal Behavior Characteristics. (a) ①Yungu Temple ②Bright Summit ③Feilai Stone. (b) ④Lima Bridge ⑤Welcoming Pine ⑥Fairy Guiding Road. (c) ⑦Dreamland Scenic Area ⑧Songgu Temple. (d) ⑨Xihai Grand Canyon ⑩Ciguang Pavilion. (e) ⑪Rusheng Pavilion ⑫Shixin Peak. (f) ⑬Bai’e Ridge ⑭Sanxi Ravine ⑮Diaoqiao Temple.
Ijgi 14 00396 g011
Figure 12. Tourist route popularity. (a) Kernel density analysis of tourist trajectories. (b) Grid-based analysis of geo-tagged photographs.
Ijgi 14 00396 g012
Table 1. Applications of tourism big data in visitor behavior analysis.
Study ObjectData SourceMain Method(s)Reference
Route patternsGPSKernel density estimation (KDE), standard deviational ellipse[26]
Attraction popularityGPSPoint density[27]
Visitor distributionGPSOverlay analysis[28]
Seasonal variationMobile signalingSpatial interpolation, principal component analysis[29]
Cross-border tourismMobile signalingLinear regression[30]
Block-level heatWeiboAnalytic hierarchy process (AHP), point density[31]
Trip durationWeibotemporal statistics[32]
Behavioral preferencesWeiboKDE, standard deviational ellipse[33]
Population mobilityWi-FiClustering, network analysis[34]
Visitor spending typesGPSSpace–time prism, clustering[35]
Attraction popularityEnterprise dataStandard deviational ellipse, Getis–Ord Gi*[36]
Route patternsGPSSequence alignment[37]
Route patternsGPSGraph-theoretic methods, network analysis[38]
Transfer patternsGPSMarkov chains, clustering[39]
Destination choiceGPS + surveyMultinomial logit (MNL)[40]
Trip durationGPSClustering[41]
Route patternsGPS + surveyClustering, space–time prism[42]
Tourism-flow networkGPSSteady-state Markov chain[43]
Route patternsGPSClustering, similarity computation[44]
Attraction popularity & dwellGPSKDE[45]
Attraction popularityGPSKDE, clustering[46]
POI/ROIGeo-tagged photosSpatial overlap algorithm[47]
Route patternsGPSClustering[48]
Tourist flowsTravel diariesNetwork analysis, concentration analysis[49]
Attraction popularityWeiboKDE, temporal statistics[50]
Attraction popularityGeo-tagged photosGetis–Ord Gi*, KDE[51]
Trip frequencyTwitterSpatial statistics[52]
Trip frequencyGPSGeographically weighted regression (GWR), spatial gridding[53]
Trip durationGPS + geo-tagged photosSpatial gridding, nearest-neighbor analysis[54]
Trip durationSafeGraphPoisson regression[55]
Table 2. Vertical differentiation of visitor POIs in the Mount Huangshan Scenic Area.
Vertical BeltElevation (m)POIs (Count)Share (%)
Low-elevation transport belt<4001590.71
400–5003161.41
500–6007003.13
600–7005212.33
700–8005432.42
800–9007253.24
900–10005862.62
Mid-elevation connection belt1000–11003321.48
1100–12005902.63
1200–13004061.81
1300–14007083.16
1400–150011004.91
High-elevation core concentration1500–1600273912.23
1600–1700718032.06
1700–1800492321.98
High-elevation core concentration>18008693.88
Table 3. Attraction Heat Map.
Hotspot TypeHigh-Heat
Attractions
Moderate-High-Heat
Attractions
Moderate-Heat AttractionsLow-Heat
Attractions
Attractions (Descending Order of Heat)Welcoming Pine, Hundred-step Cloud Ladder, Bright SummitShixin Peak, Dreamland, Feilai Stone, Ciguang Pavilion, Bai’e Ridge, Immortal GuidingYungu Temple, West Sea Grand Canyon, Lima Bridge, Sanxi Mouth, Rusheng Pavilion, Diao Bridge Temple, Songgu TempleOther Attraction
Disclaimer/Publisher’s Note: The statements, opinions and data contained in all publications are solely those of the individual author(s) and contributor(s) and not of MDPI and/or the editor(s). MDPI and/or the editor(s) disclaim responsibility for any injury to people or property resulting from any ideas, methods, instructions or products referred to in the content.