Article

ADAImpact Tool: Toward a European Ground Motion Impact Map

1
Centre of Geographical Studies, IGOT, University of Lisbon, 1600-276 Lisbon, Portugal
2
Geomatics Research Unit, Centre Tecnològic Telecomunicacions Catalunya (CTTC/CERCA), Avinguda Carl Friedrich Gauss 7, 08860 Castelldefels, Spain
3
Pyrenean Institute of Ecology, Spanish National Research Council (IPE-CSIC), Av. Montañana 1005, 50059 Zaragoza, Spain
4
Geohazards InSAR Laboratory and Modelling Group (InSARlab), Geohazards and Climate Change Department, Geological and Mining Institute of Spain (IGME-CSIC), Calle Ríos Rosas 23, 28003 Madrid, Spain
*
Author to whom correspondence should be addressed.
ISPRS Int. J. Geo-Inf. 2025, 14(10), 389; https://doi.org/10.3390/ijgi14100389
Submission received: 16 July 2025 / Revised: 15 September 2025 / Accepted: 30 September 2025 / Published: 6 October 2025

Abstract

This article presents the ADAImpact tool, a QGIS plugin designed to assess the potential impacts of geohazards—such as landslides, subsidence, and sinkholes—using open-access surface displacement data from the European Ground Motion Service (EGMS), which is based on Sentinel-1 satellite observations. Created as part of the European RASTOOL project, ADAImpact integrates InSAR-derived ground movement data with exposure datasets (including population, infrastructure, and buildings) to support civil protection agencies in conducting risk assessments and planning emergency responses. The tool combines “Process Magnitude”, with “Exposure” metrics, quantifying the population and critical infrastructure affected, to generate potential impact maps for ground motion hazards. When applied to case studies along the Portugal–Spain border and the coastal region of Granada, Spain, ADAImpact successfully identified areas of high potential impact. These results underscore the tool’s utility in pre- and post-disaster assessment, highlighting its potential for scalability across Europe.

1. Introduction

Some of the most severe natural disasters are consequences of regularly occurring geohazards such as earthquakes, landslides and volcanic eruptions [1]. According to the Emergency Events Database EM-DAT [2], Europe has experienced over 50 geohazard-related natural disasters since 2000, affecting more than 750,000 people and causing substantial economic losses. Alongside hydrological hazards, these threats are a primary focus of civil protection activities, given their frequency and the substantial human resources required to manage emergency responses [3]. A critical component of geohazard risk analysis, and of providing useful information to civil protection authorities, is determining the location and magnitude of geohazard impacts across varying spatial scales, from individual cities to an entire region [4]. In this context, remote sensing technologies have become an essential source of information for stakeholders involved in disaster management, particularly for surveying and mapping emergency [5].
The launch of the Copernicus Sentinel-1 satellites in 2014, which ensured global and consistent Synthetic Aperture Radar (SAR) data acquisition under an open and free distribution policy, marked a turning point in both data exploitation and practical application. A key outcome of this advancement has been the emergence of ground motion services (GMS) at regional, national, and continental scales [6], with particular emphasis on the European Ground Motion Service (EGMS) [7]. These services generate ground motion time-series from SAR imagery, enabling applications across a wide range of domains. These include both natural geohazards (e.g., floods, landslides, sinkholes) and anthropogenic risks (e.g., subsidence due to groundwater extraction, mining activities), as well as land management, urban planning, infrastructure development and management (e.g., railways, roads and dams) [8,9,10]. As Copernicus services continue to evolve, EGMS is also expected to expand in scope to meet the growing demands of a broader user community and a wider range of applications [11]. However, despite the demonstrated potential of SAR data in supporting short-term crisis response, risk mapping and post-disaster recovery [12], EGMS data remain significantly underexploited [6]. Notably, while these datasets have proven valuable in various localized scenarios, no risk maps based on EGMS data currently exist at the European scale.
InSAR-derived displacement data have been used in various local and regional studies to produce risk maps that support civil protection activities. For example, Solari et al. [4], using a case study of the Canary Islands, developed a methodology to generate simplified maps for Civil Protection Authorities. Their approach identifies areas of active deformation, based on a velocity threshold and a clustering process, which are then classified by taking into account the vulnerability of the exposed elements within the affected areas. In another study, Mastrantoni et al. [13] applied a score-based methodology in the city center of Rome, integrating multiple spatial hazard maps with multi-satellite, multi-frequency InSAR data and physical attributes of the built urban environment. This allowed for the ranking of assets exposed to multiple geohazard risks. More recently, Lopez-Vinielles et al. [14] used InSAR data from the European Ground Motion Service (EGMS) to assess the vulnerability of the Spanish coastline to ground movements, providing initial socio-economic impact estimates, including those related to the transportation infrastructure, buildings, and population.
This article describes the ADAImpact tool and its underlying methodology, developed to assess the potential impact of ground movements by integrating process magnitude with exposure data for detected active geohazards. The aim is to support more effective risk assessment by offering a tool that is simple, flexible, user-friendly, and accessible even to non-expert users and policy makers. To ensure broad usability and replicability across Europe, particular attention was given to ensuring compatibility with open-access data sources, such as the European Ground Motin Service (EGMS) and OpenStreetMap. The tool, named ‘ADAImpact’ has been implemented as a plugin for QGIS, an open source Geographic Information System licensed under the GNU General Public Licence [15]. While other QGIS plugins such as InaSAFE [16] and OpenQuake IRMT [17], support multi-hazard and earthquake-specific risk assessments, respectively, ADAImpact offers a unique capability: the integration of EGMS InSAR data for large-scale ground deformation analysis. Nevertheless, its current scope is narrower, as it relies on a single data source and specific hazard types, whereas InaSAFE provides broader multi-hazard integration and OpenQuake offers a well-structured solution focused on earthquake risk assessment.
As a part of the ADATools suite (i.e., Active Deformation Areas Tools) developed within the framework of the European DG-ECHO project RASTOOL (UCPM-2021-PP-101048474), these tools are fully compatible with the EGMS data structure and can be applied in any context requiring the detection and classification of ground movements. The first tool in the suite, ADAfinder, based on the methodology described in Barra et al. [18], enables the automatic extraction and selection of most significant Active Deformation Areas (ADAs) from EGMS raw data. Once the ADAs are identified, subsequent tools, ADAclassifier and TSclassifier, facilitate a preliminary evaluation of the displacement processes, providing insight into the likely causes of ground motion [19]. The ADAtools suite is freely available from the official website: https://adatools.cttc.es/ (accessed on 10 August 2025).
The novelty of the work lies in integrating the ADAImpact tool into a structured procedure that enables the generation of a simple, replicable cartographic product for assessing the potential impact of ground movements across any region in Europe. This pilot assessment utilizes surface displacement data obtained from EGMS, combined with exposure data sourced from publicly available open-access datasets. The proposed methodology was applied to two study areas: one along the Portugal–Spain border, and the other in the coastal zone of Granada, in southern Spain.
The article is structured as follows. Section 2 outlines the framework in which this pilot assessment was carried out, including the conceptualization of potential impact, the interface and analytical workflow of the ADAImpact tool, and a description of the core datasets used. Section 3 presents the main results, focusing on the analysis of the process magnitude, exposure and resulting potential impact as derived through ADAImpact. Section 4 and Section 5 discuss the added value of the results in the context of civil protection activities, particularly examining the hypothesis of the Europe-wide replicability of the potential impact mapping approach. Finally, we outline directions for future development and provide a summary of the main conclusions.

2. Materials and Methods

2.1. The Concept of Potential Impact

Numerous existing approaches are grounded on the conventional and contemporary interpretation of the disaster risk concept, as outlined by the United Nations Office for Disaster Risk Reduction [20], which defines disaster risk as the outcome of combining hazard, exposure, and vulnerability (Figure 1).
A hazard refers to the potential occurrence of a physical event—either of natural or human-induced origin -that may cause loss of life, injury, or other health impacts, as well as damage to and loss of assets, infrastructure, livelihoods, ecosystems, environmental resources, including the disruption of essential services [21]. Hazards are typically assessed through three key components [22,23]: (i) Spatial—Where is the hazardous process likely to occur? (ii) Temporal—When is the hazardous process expected to take place? (iii) Magnitude—How large, or how fast is the hazardous process likely to be? Among these, magnitude generally determines the severity of damage the hazardous event may impose on exposed elements.
The exposure encompasses the presence of people, livelihoods, species or ecosystems, environmental functions, services and resources, infrastructure, and economic, social, or cultural assets in places that could be adversely affected by hazards [20,21].
Despite the multitude of viewpoints and concepts surrounding vulnerability (e.g., Maiti et al. [24]; Contreras et al. [25]; Santos et al. [26]), they generally converge on the idea that vulnerability pertains to the characteristics of individuals, communities, or other exposed entities, encompassing physical, social, economic, or environmental aspects, all of which heighten their propensity to the impacts of hazards [27]. This underscores the pivotal role that vulnerability plays in explaining the scale of disasters [28,29].
The concept of vulnerability has been defined in two distinct ways, emphasizing the ‘degree of loss’ and the ‘proneness to be damage’. The former pertains to physical vulnerability, while the latter is associated with social vulnerability. Regardless of the concept, assessing vulnerability requires detailed data on the population, for social vulnerability assessment, or the physical characteristics of buildings and other infrastructure elements (e.g., roads, railways) for physical vulnerability assessment, which are difficult to obtain and too complex to be included in an exploratory risk analysis. Additionally, to the best of our knowledge, detailed assessments of the physical vulnerability of buildings and/or infrastructures, as well as the social vulnerability of the population, are not yet available for the European space, at least at a scale compatible with the detail of the European Ground Motion Service (EGMS).
For this reason, the ADAImpact tool is not intended to conduct a comprehensive risk analysis, which would require assessing vulnerability. Instead, the tool if focused on evaluating the potential impact of ground movements using hazard and exposure data (Figure 1). The primary objective of the ADAImpact tool is to support the management of potential risks caused by ground motions (e.g., landslides, sinkholes, and subsidence) across large areas. It is designed to rapidly provide civil protection stakeholders with actionable information to guide and prioritize interventions and support decision-making processes.

2.2. The ADAImpact Tool

2.2.1. ADAImpact Workflow

ADAImpact tool is a QGIS plugin developed in Python 3.7 to assess the potential impact of the detected Active Deformation Areas (ADAs). The experimental version of the plugin can be downloaded from the following Github repository: https://github.com/nmileu/rastool (accessed on 10 August 2025).
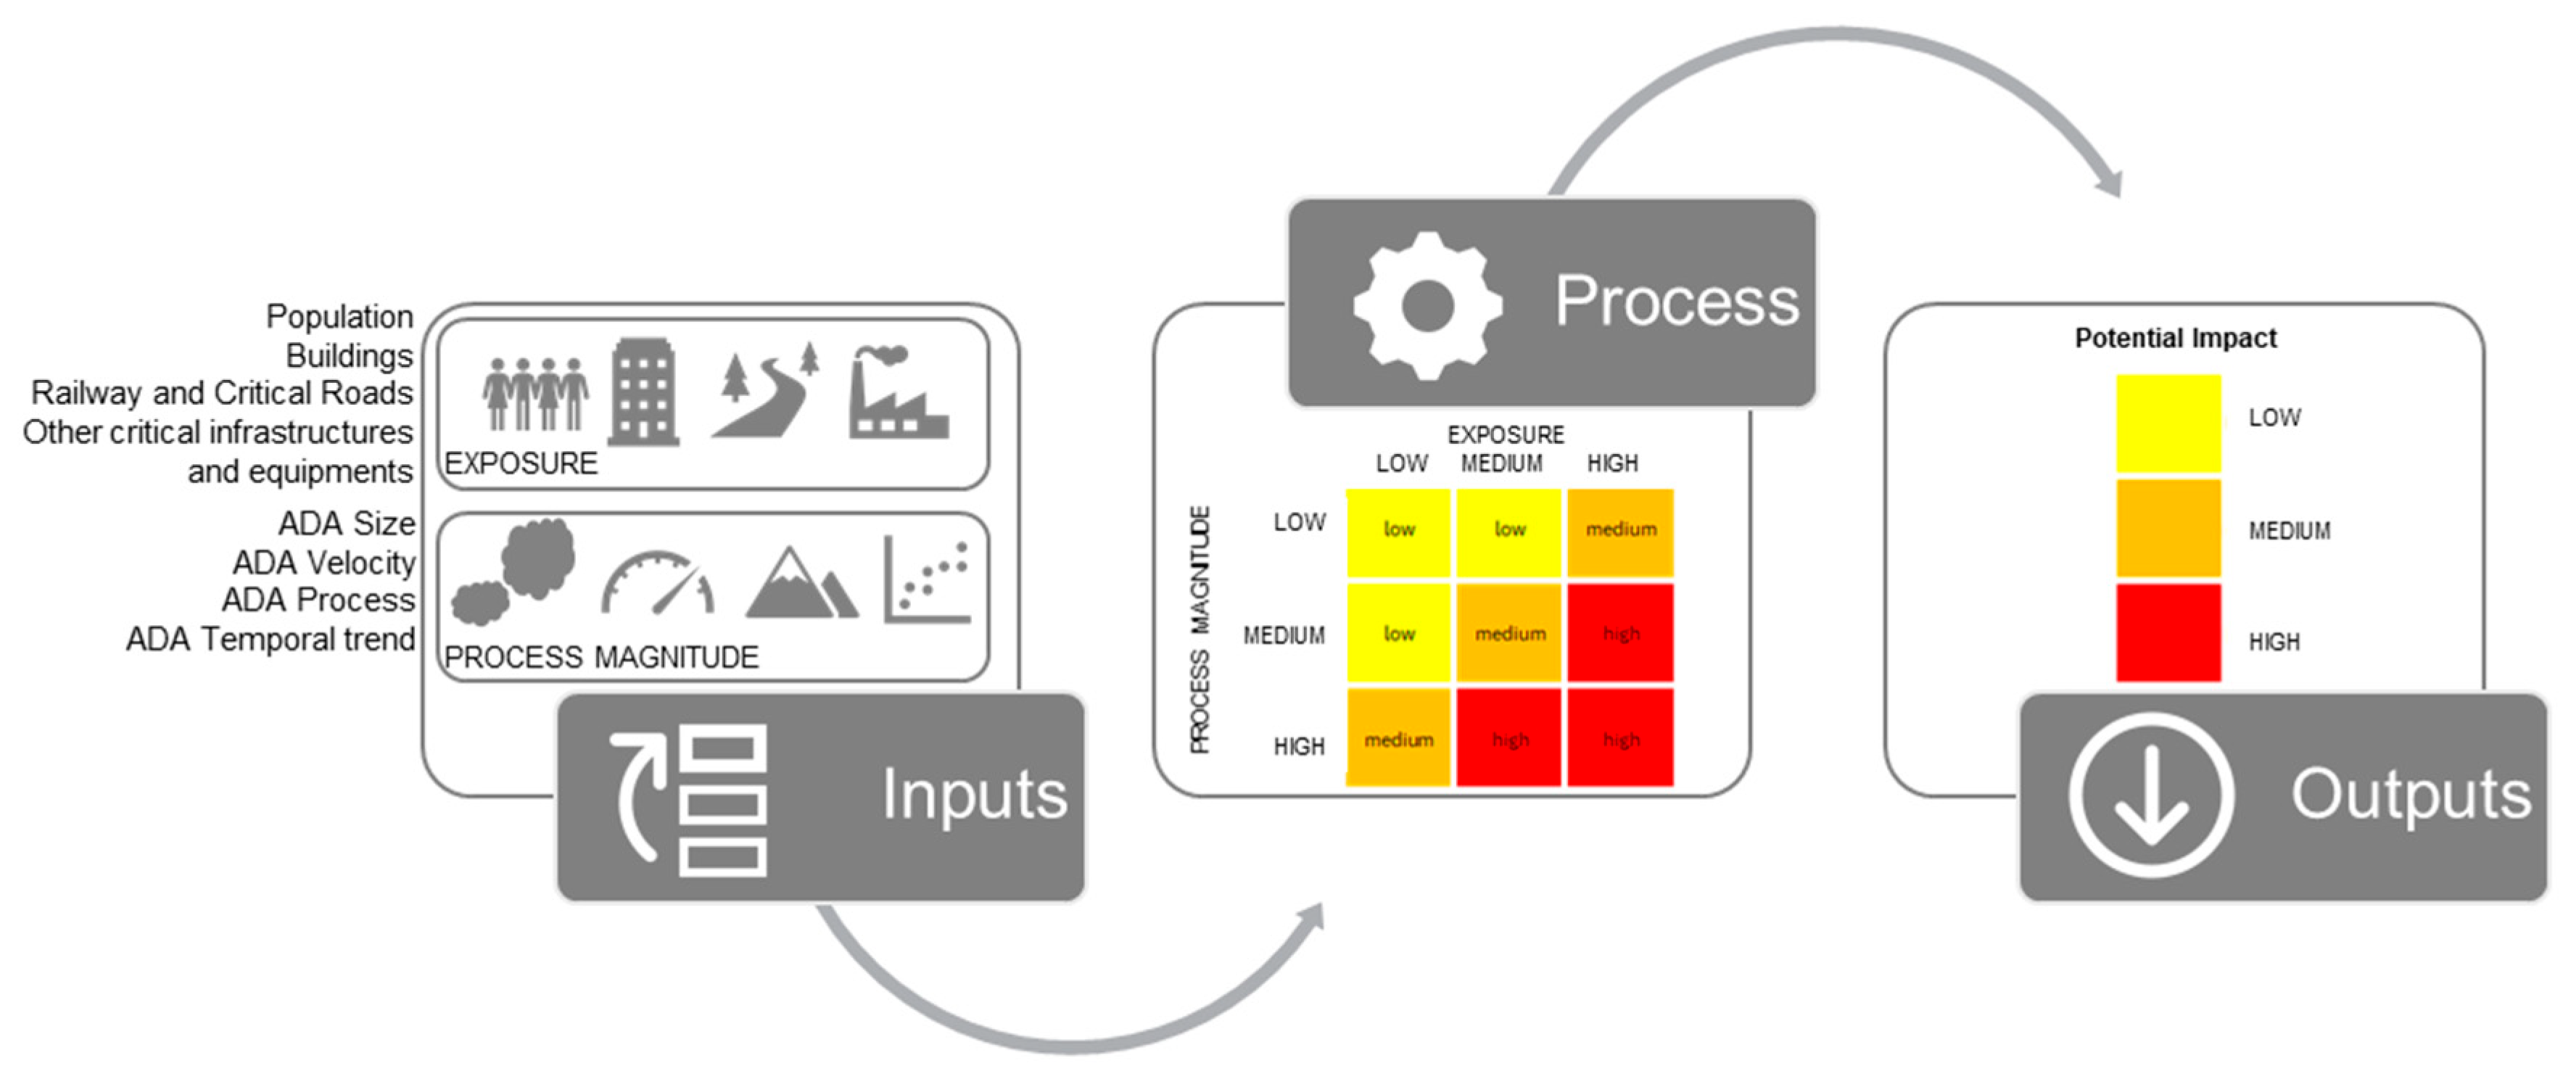
The ADAImpact tool performs a qualitative classification of each ADA by evaluating its potential impact as low, medium, or high (Figure 2). This classification is based on two key factors: the estimated magnitude of the ground motion process and the level of exposure. The tool requires two primary inputs: (i) classified ADAs, generated by the ADAclassifier tool, which serves as the basis for evaluating the magnitude of the ground motion process; and (ii) exposure layers, which include population, buildings, major roads, railways, and other critical infrastructure and equipment, used to assess the level of exposure in the affected area.
In the current version of the plugin, exposure calculation is performed by combining data across several thematic layers: population, built-up areas, roads, railways and other critical infrastructure and equipment. All these layers are mandatory inputs for the calculation process. The potential impact assessment is carried out by integrating the previous estimation of both the exposure and process magnitude within an automated classification routine.
(a)
Classification of Process Magnitude
The process magnitude associated with each ADA is evaluated through a classification based on the following key properties of the ADA: size, average velocity, process type and temporal trend of deformation. In our assessment of process magnitude, spatial extent and velocity are evaluated independently. The underlying rationale is that the larger the area affected by a geohazard, the greater its magnitude. For example, in the case of a landslide, magnitude is typically proportional to the affected area, which is strongly correlated with the volume of displaced material [30]. Although the size of the ADA may not directly represent the full spatial extent of the associated geohazard, it is regarded as a reliable proxy for its impact.
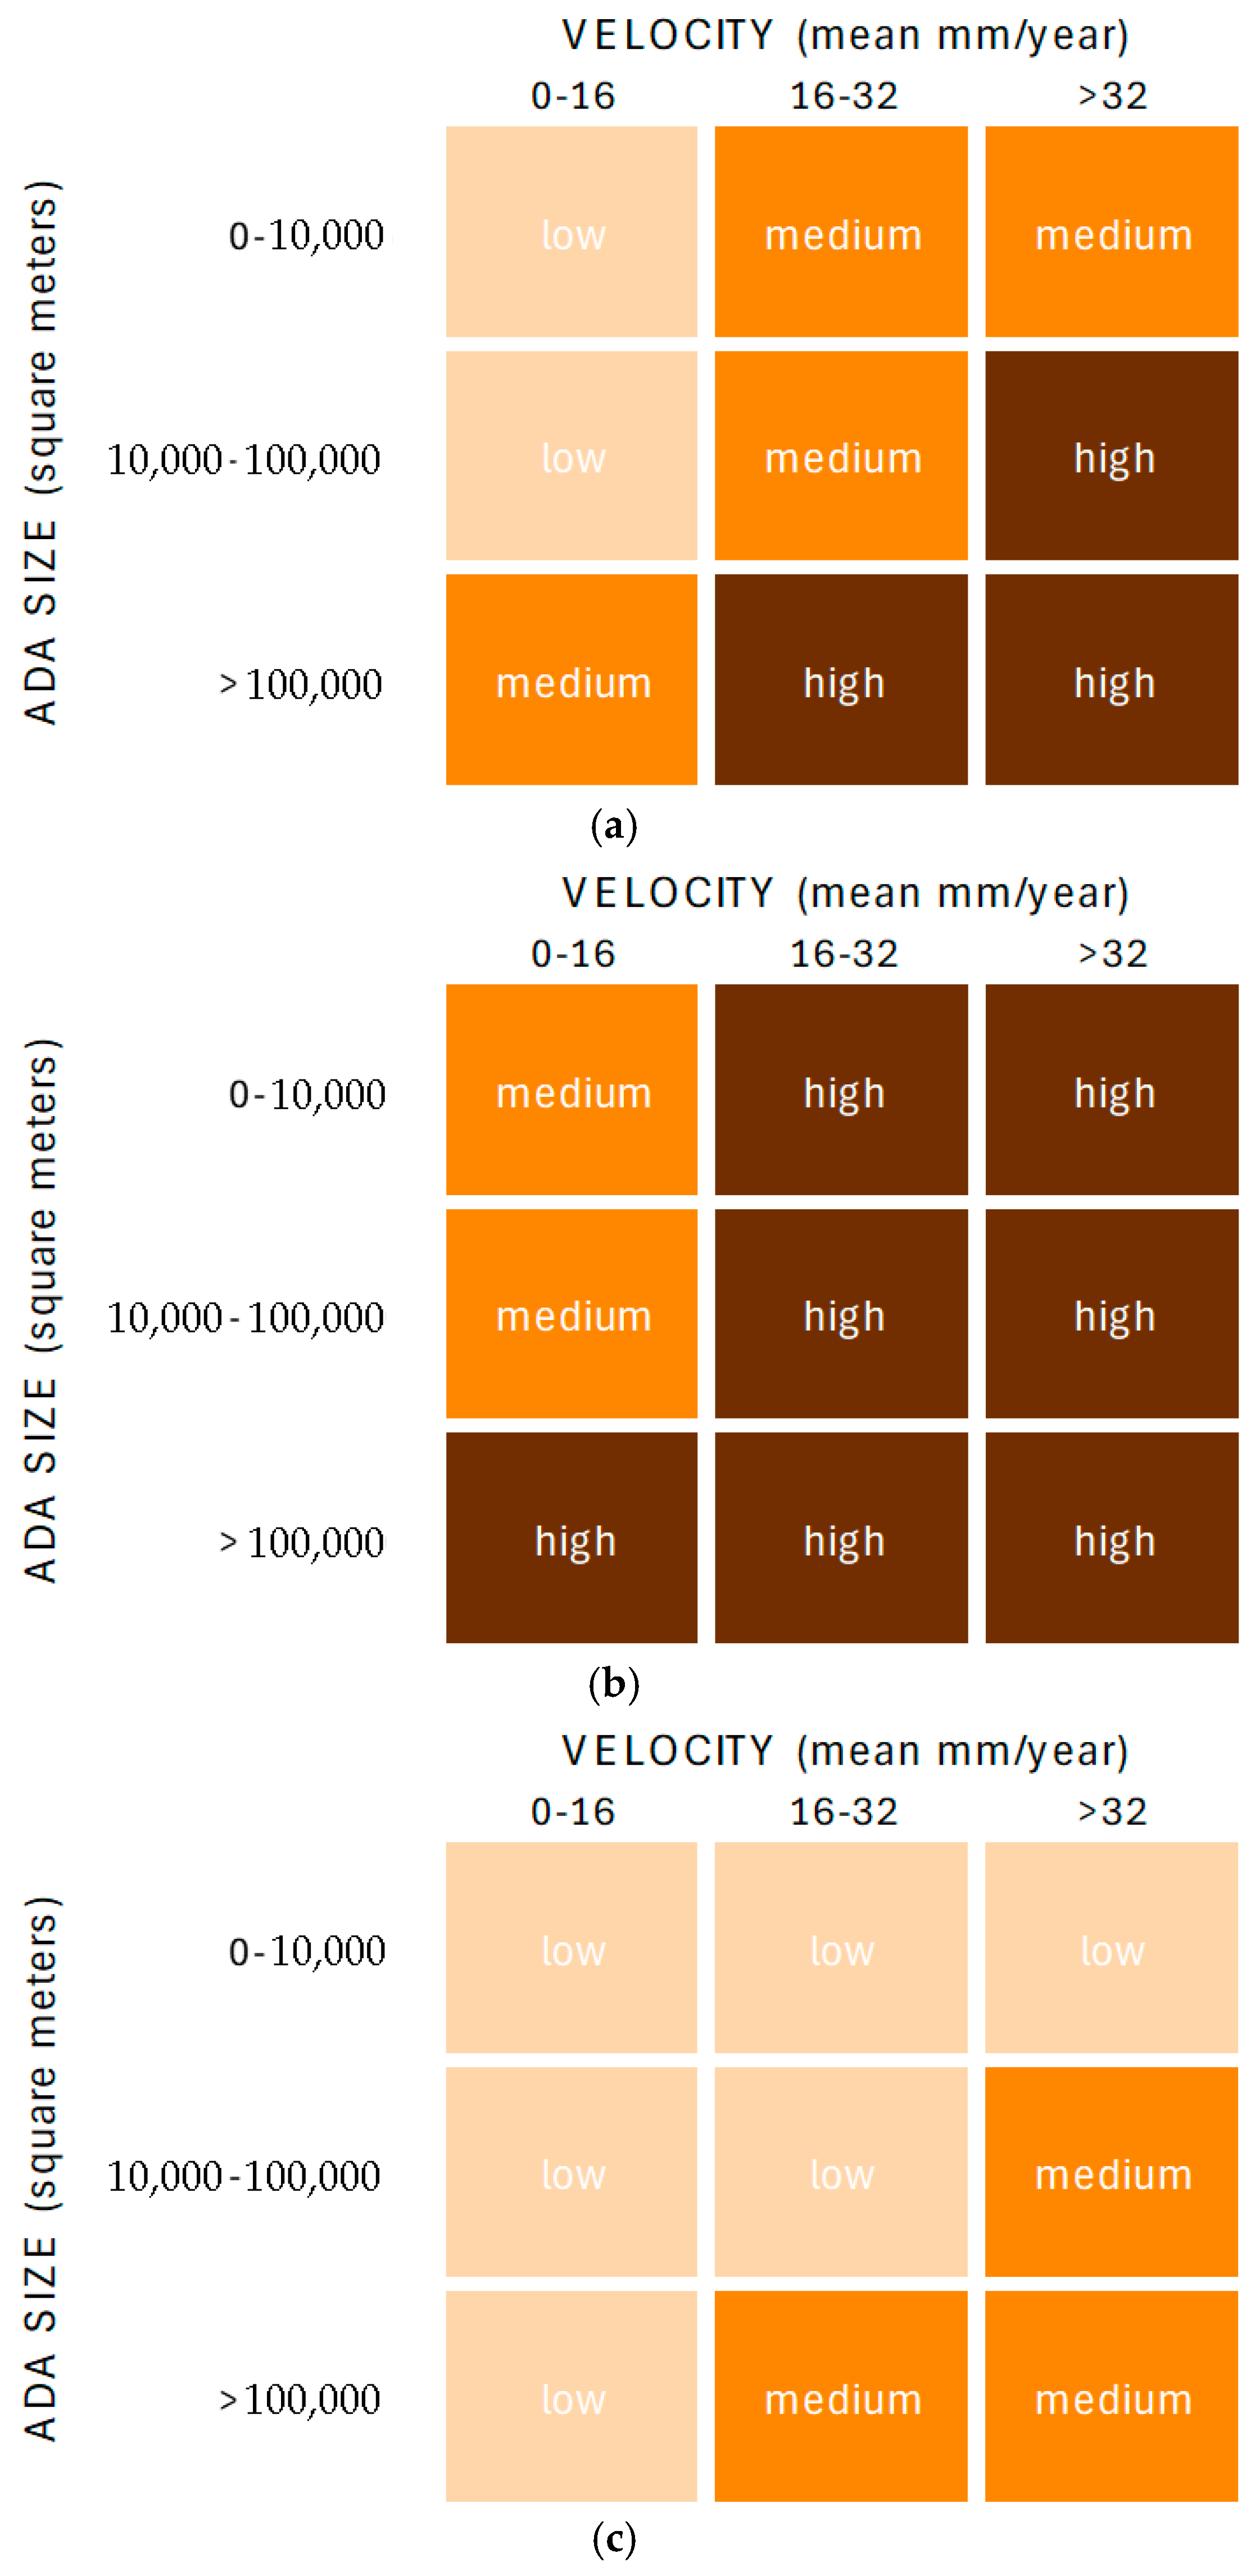
Size and average velocity are provided as numerical values in square meters (size) and mm/year (average velocity). The ADA size is classified in three classes following a logarithmic rule (0–10000 m2; 10000–100000 m2; >100000 m2). The ADA mean velocity is categorized in three classes, in accordance with the classification proposed by Solari et al. [4]: 0–16 mm/year; 16–32 mm/year; and >32 mm/year.
The process types include landslide, sinkhole, subsidence, settlement and uplift. With the current version of the ADAclassifier tool, each ADA is assigned a code indicating its association with a specific process type, along with a corresponding level of certainty: code 2—high certainty that the ADA corresponds to the identified process type; code 1—lower certainty that the ADA corresponds to the process; code 0—the ADA is highly unlikely to be associated with that process; code −1—The process type could not be classified due to insufficient input data. For the ADAImpact tool two of these codes are particularly relevant: code 2, indicating that the ADA is associated with a specific process type (e.g., “it is a landslide”) and code 0, indicating that the ADA is not associated with that process type (e.g., “it is not a landslide”).
The temporal trend of deformation, as defined by the TSclassifier, is included in the attribute table of each ADA and is categorized into three classes (hereafter referred to as TS_class): (1) decreasing velocity (e.g., exponential negative trend); (2) maintaining velocity (i.e., linear trend; no movement); and (3) increasing velocity (e.g., bi-linear, exponential positive trends).
The Process Magnitude of ADAs showing a linear temporal trend (maintaining velocity, TS_class = 2) is determined based on the combination of ADA size and mean velocity, as defined in the matrix in Figure 3a, regardless of the geohazard type. When an ADA displays an accelerating trend over time (TS class= 3), the process magnitude classification is increased by one level, as shown in Figure 3b. However, this rule does not apply when the original combination of size and velocity already results in a high Process Magnitude. This adjustment is valid across all process types. For ADAs showing a decreasing velocity trend (TS_class = 1), the Process Magnitude is reduced by one level, but only for the following process types: subsidence, settlement and uplift, as illustrated in Figure 3c. For landslides and sinkholes, this reduction does not apply; instead, the classification should continue to follow the matrix in Figure 3a, regardless of the declining trend. This exception reflects the special characteristics of landslides and sinkholes, namely their tendency to involve faster displacement rates and sudden dynamic changes triggered by external conditions. These features increase their potential impact and recommend closer attention and monitoring [31,32]. On the opposite side, settlements are typically characterized by a declining displacement velocity, which generally reduces their expected impact. Although subsidence may exhibit more complex behaviors, cases with a decreasing velocity are also considered to have a lower final potential impact.
(b)
Classification of Exposure
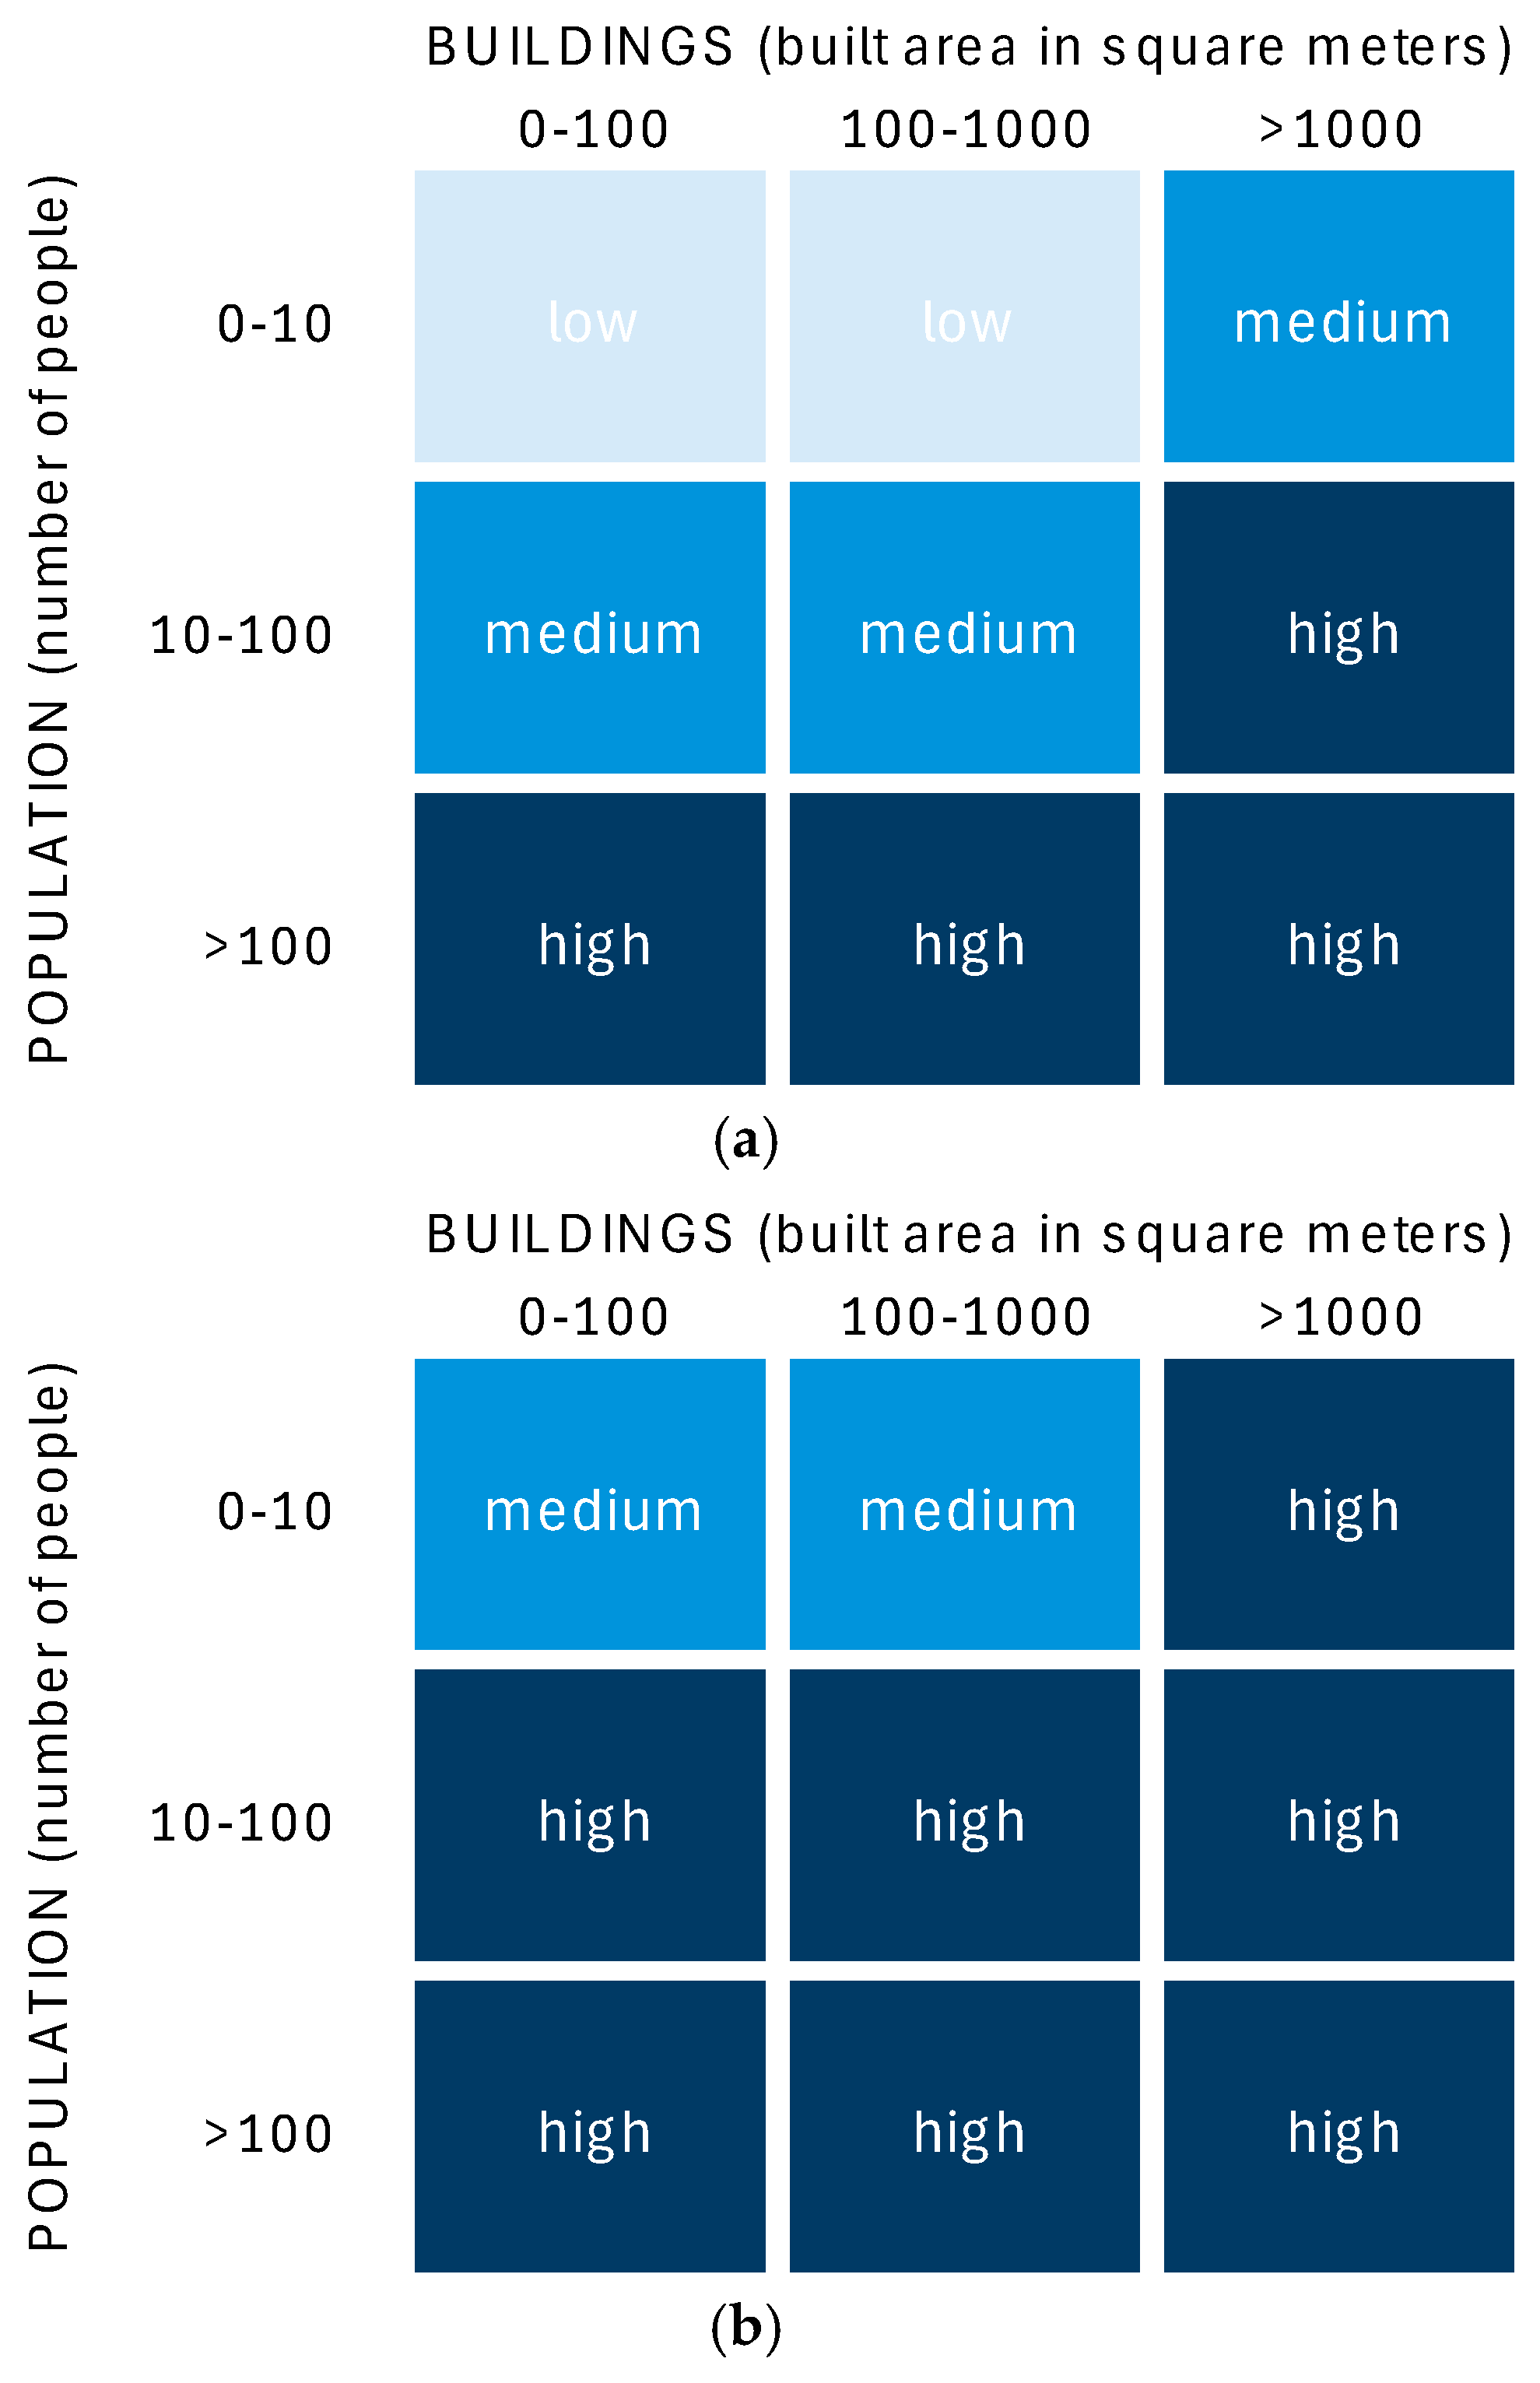
The Exposure associated with each identified ADA is evaluated by considering the built-up area, population and the presence of critical infrastructure or equipment within the ADA polygon. In cases where no critical infrastructure or equipment is present, exposure is classified into three categories (low, medium, high) according to the matrix shown in Figure 4a.
When an ADA intersects with at least one critical linear infrastructure (e.g., railway, road) or critical polygon infrastructure or equipment (e.g., dam, hospital, school, etc.), the exposure class increases by one level, as shown in Figure 4b. This adjustment, however, does not apply when the combination of built-up area and exposed people already results in a high exposure classification.
(c)
Classification of Potential Impact
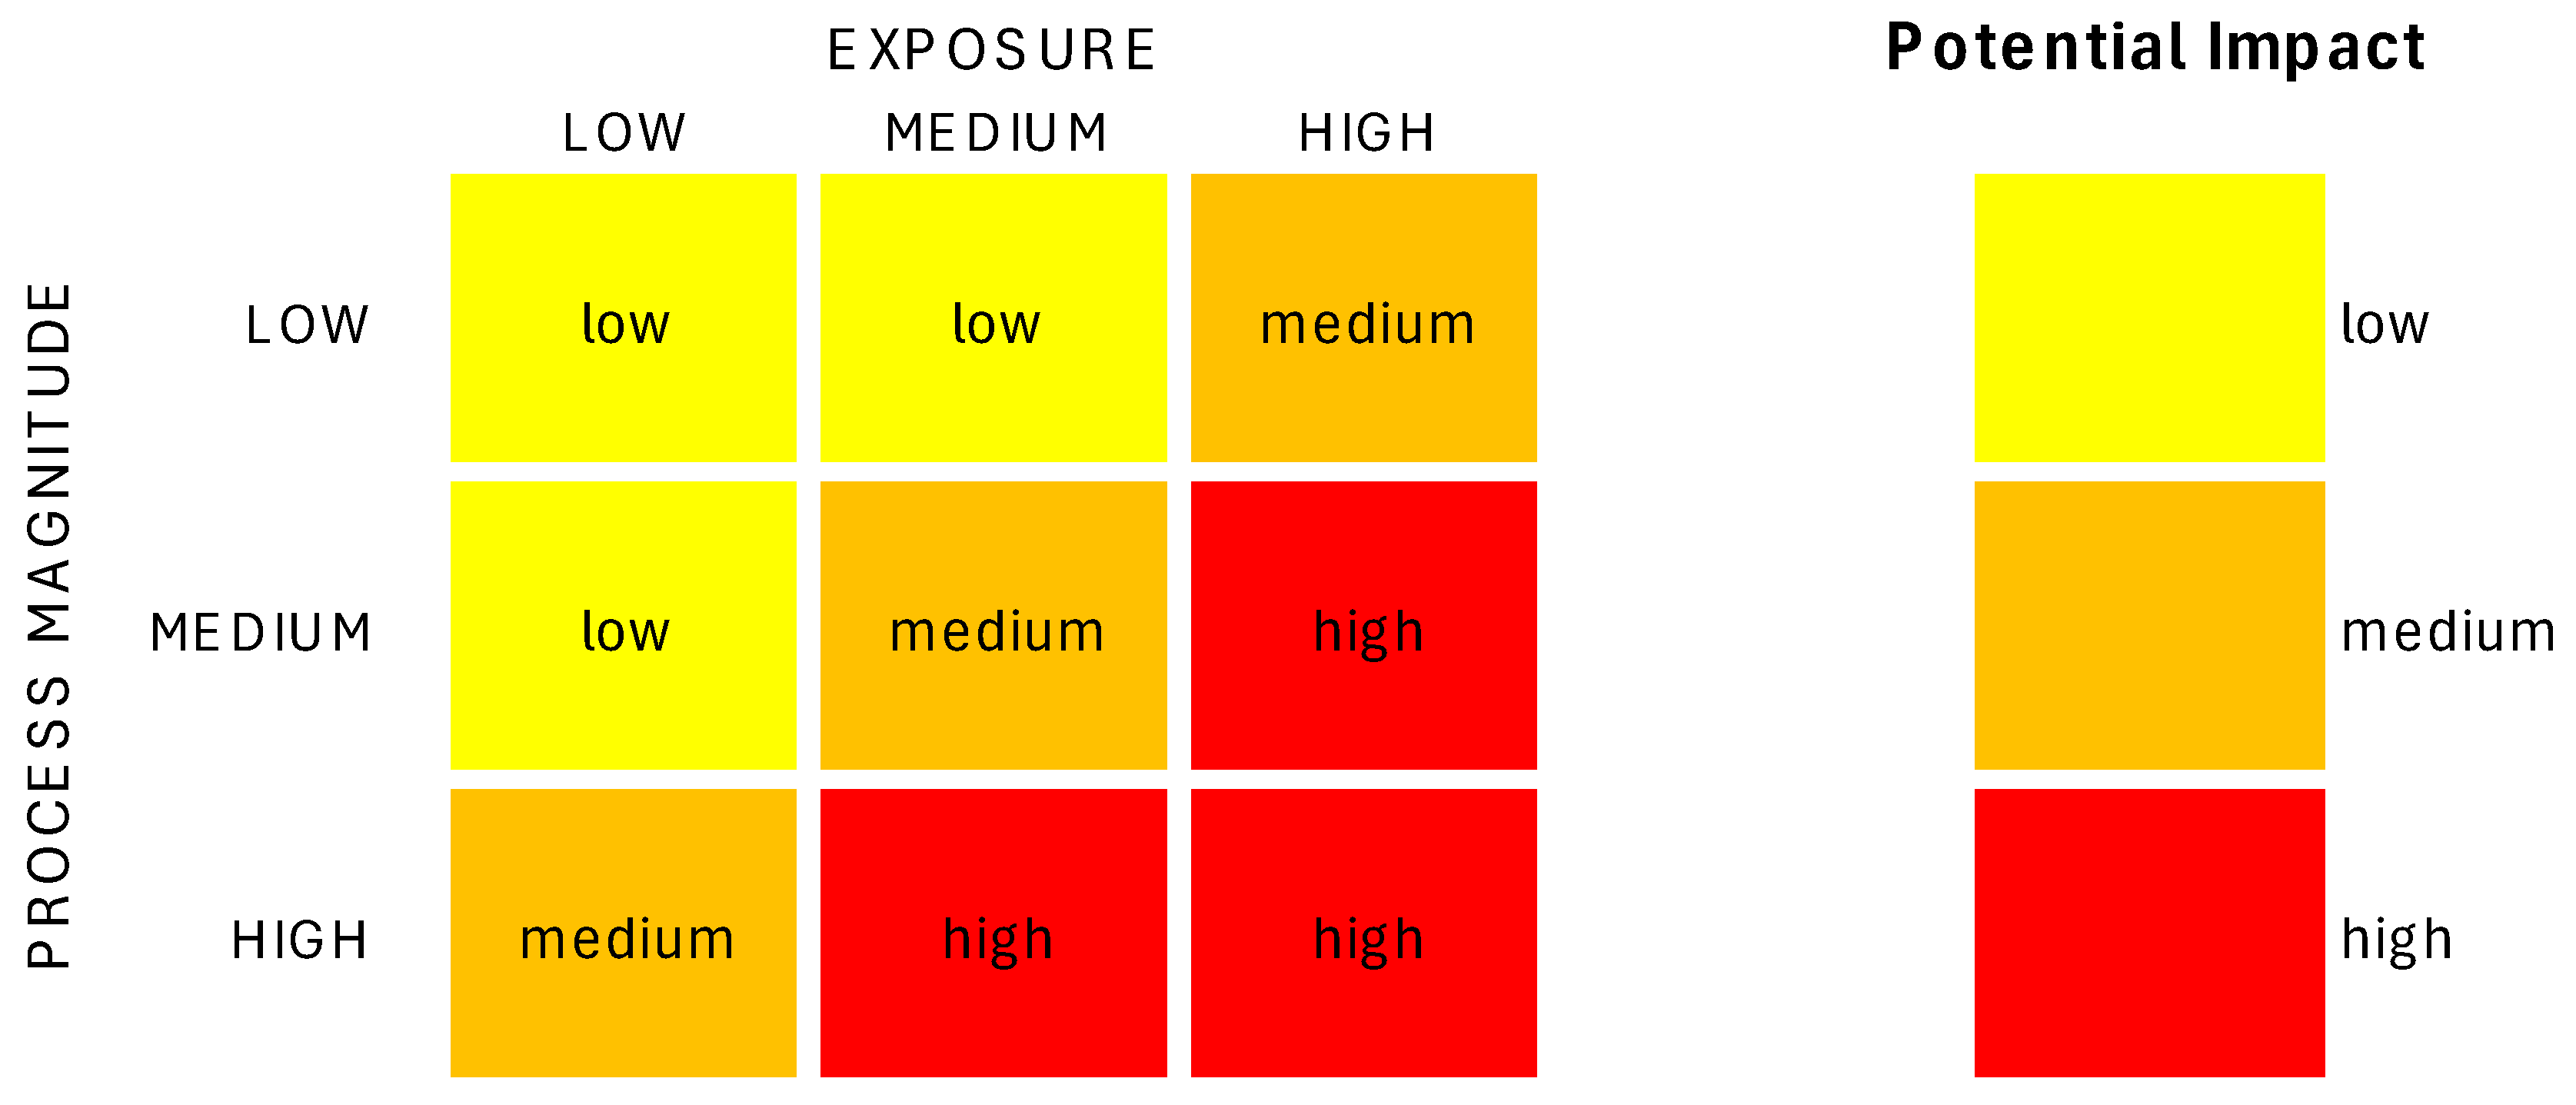
The potential impact of the geological hazards characterized by ADAtools is determined by combining two factors: process magnitude and exposure. Each of these factors is classified in three categories: low, medium, high. These classifications are then cross-referenced int a matrix, which produces the final potential impact assessment in three categories: high, medium, low (Figure 5).

2.2.2. The GUI

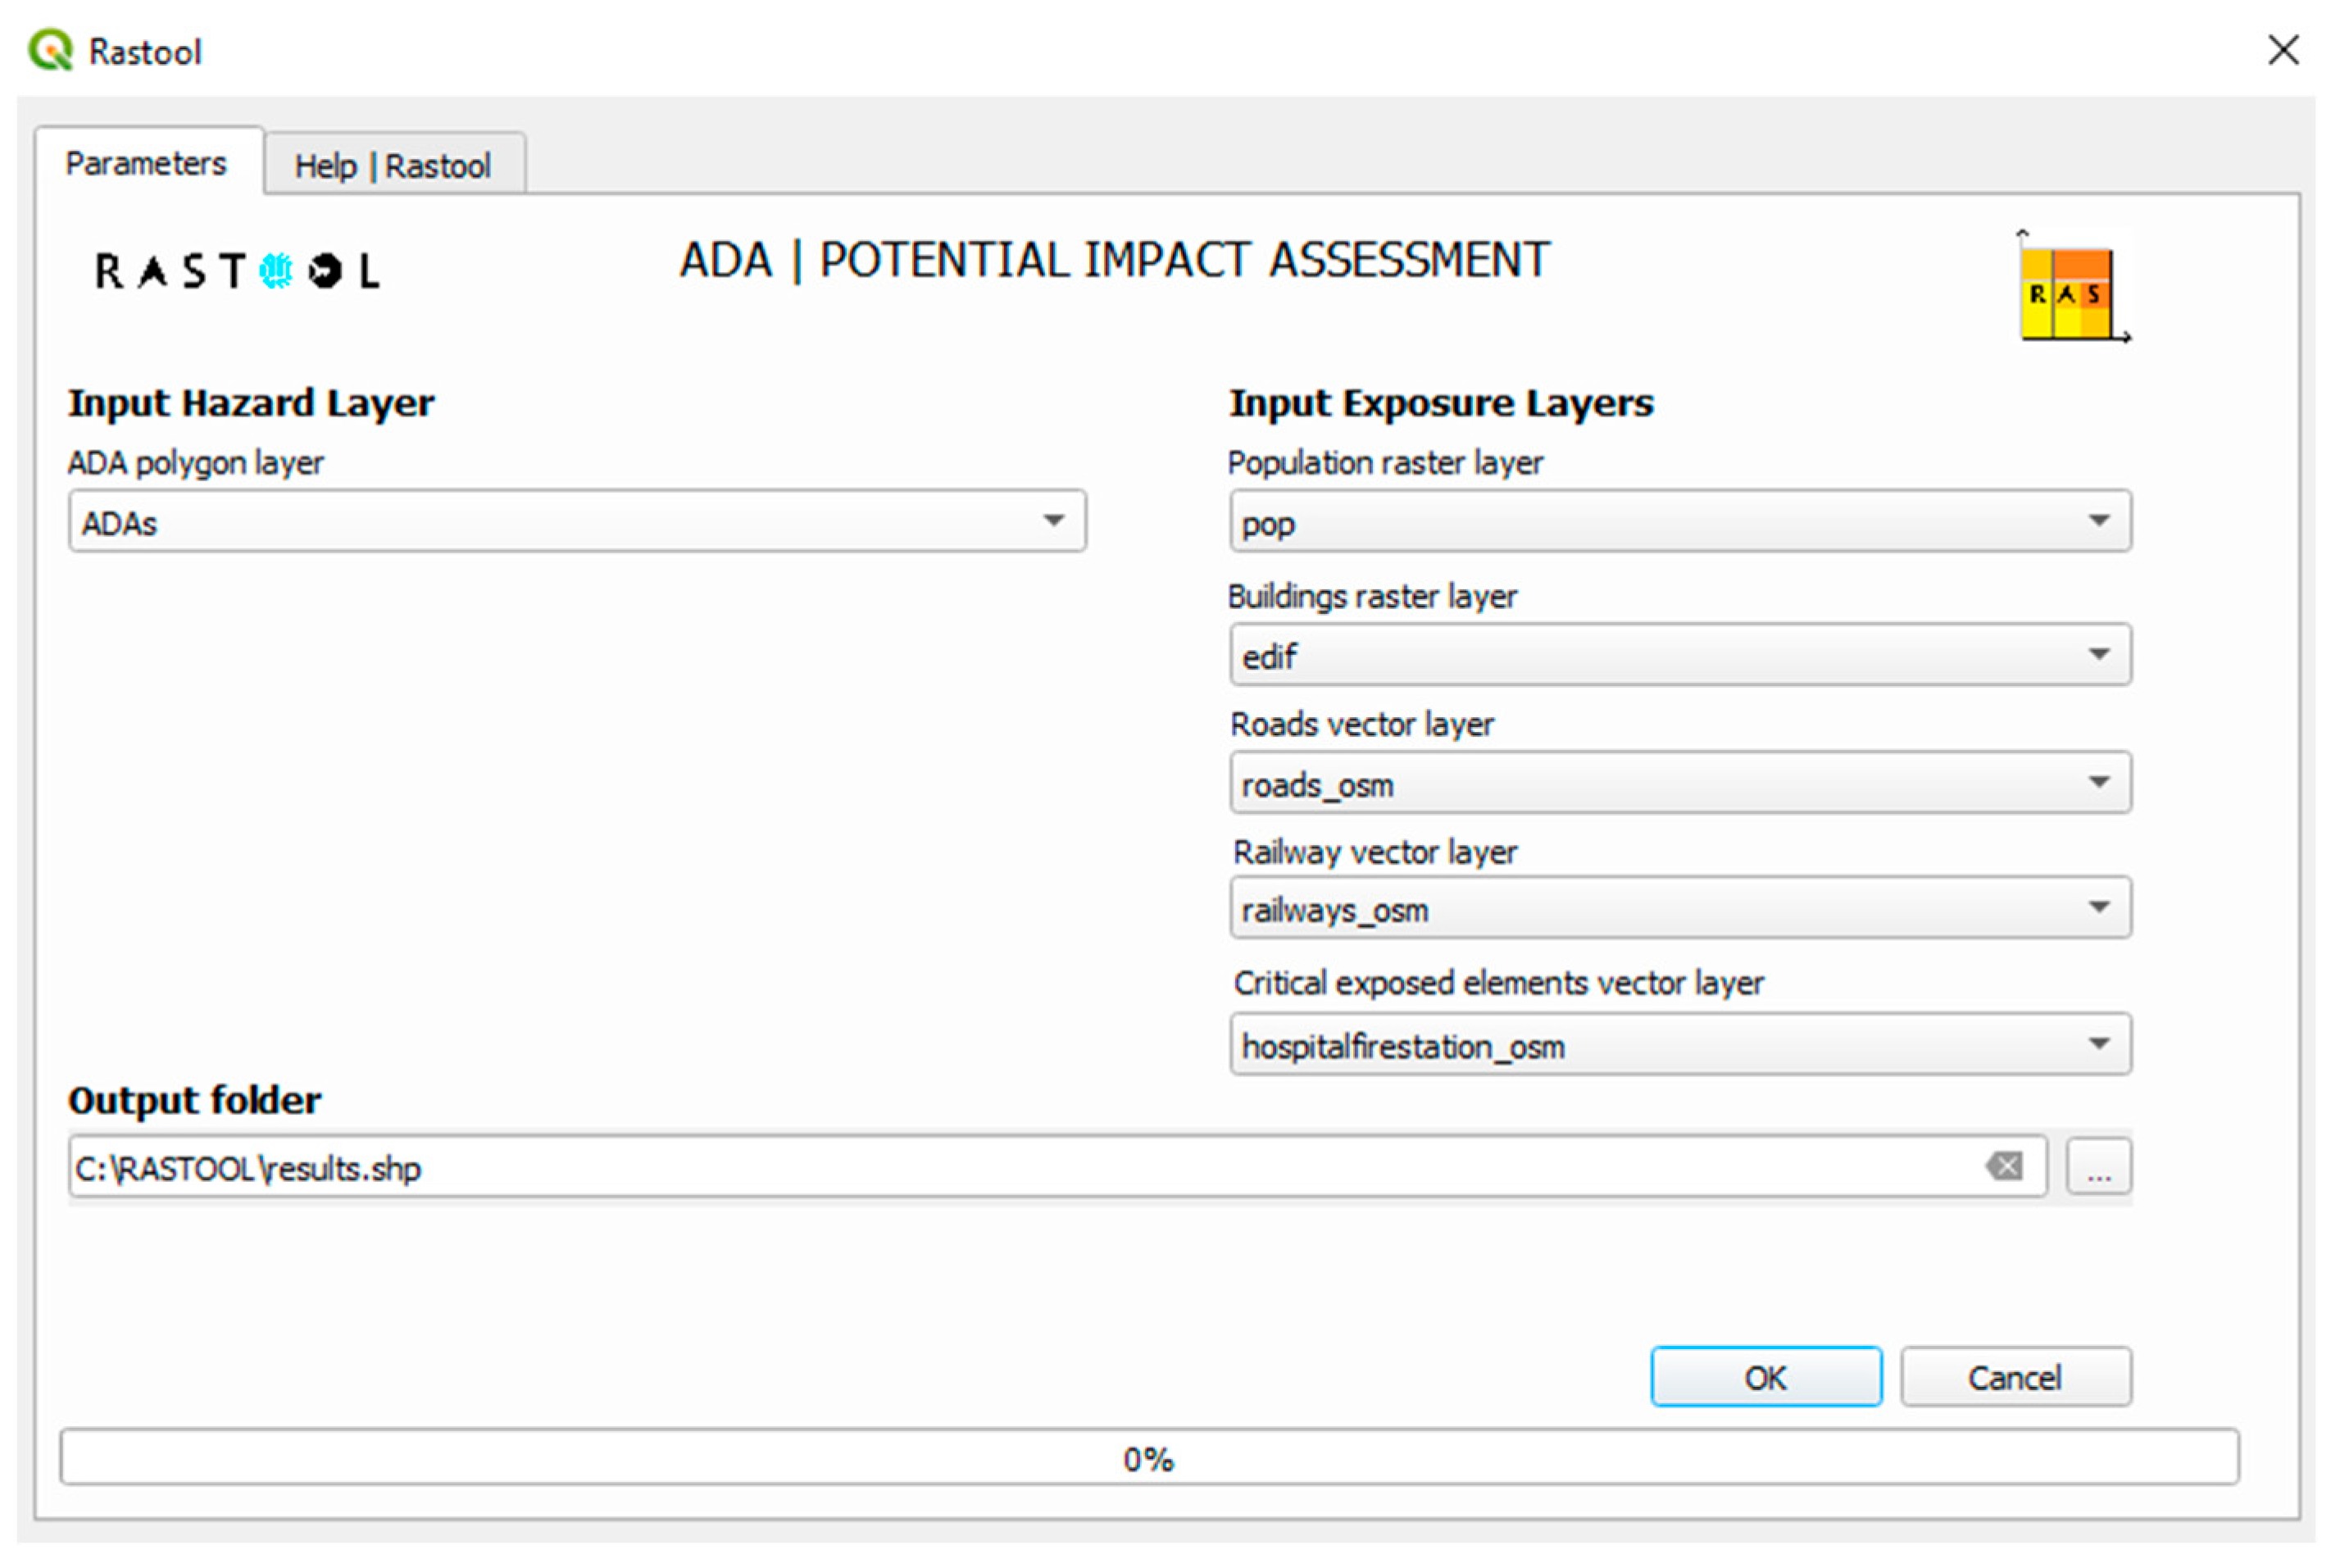
The graphical user interface (GUI) consists of a form with two tabs (Figure 6). The first tab, “Parameters,” allows users to select the input datasets for the impact calculation and to define the location and name of the output file. The second tab, “Help | Rastool”, provides a description of the project and the overview of the available functionalities.
The main input layer in the plugin is the ADA layer, which must be loaded in the layers panel as a polygon shapefile generated by the ADAclassifier tool. The exposure layers are selected in the combo boxes, with the data type serving as a filter: raster for population and buildings layer; line for road and railway network; and polygon for critical infrastructure and equipment. The result is the ADA shapefile with the added attributes derived from the calculation of process magnitude, exposure and potential impact.

2.3. Input Data

ADAImpact is a tool that uses the ADA polygons generated by the ADAclassifier to assess the potential impact of a given ground deformation process by combining process magnitude with exposure. The process magnitude is determined from four ADA attributes: size, average velocity, process type, and temporal trend of deformation.
The exposure includes the buildings, population, and a set of critical linear infrastructure (e.g., railway, road) and critical polygon infrastructure or equipment (e.g., dam, hospital, school, etc.). The primary data used to assess exposure is obtained from the Global Human Settlement Layer (GHSL) project [33], which produces new global spatial information, evidence-based analytics and knowledge describing the human presence on Earth. It operates in a fully open and free data and methods access policy [34]. Moreover, the GHSL is the core dataset of the Exposure Mapping Component under the Copernicus Emergency Management Service. The GHSL Data Package 2023 contains the new GHSL data produced at the European Commission Directorate General Joint Research Centre in the Directorate for Space, Security and Migration in the Disaster Risk Management Unit in the period 2022–2023.

2.3.1. Process Magnitude

The ADA file generated by the ADAclassifier is a mandatory input layer for the ADAImpact tool. It must be provided as a polygon layer in ESRI Shapefile format and includes the following attribute fields: AREA, V_MEAN_ABS, PROCESS, and TS_CLASS.

2.3.2. Exposed Buildings

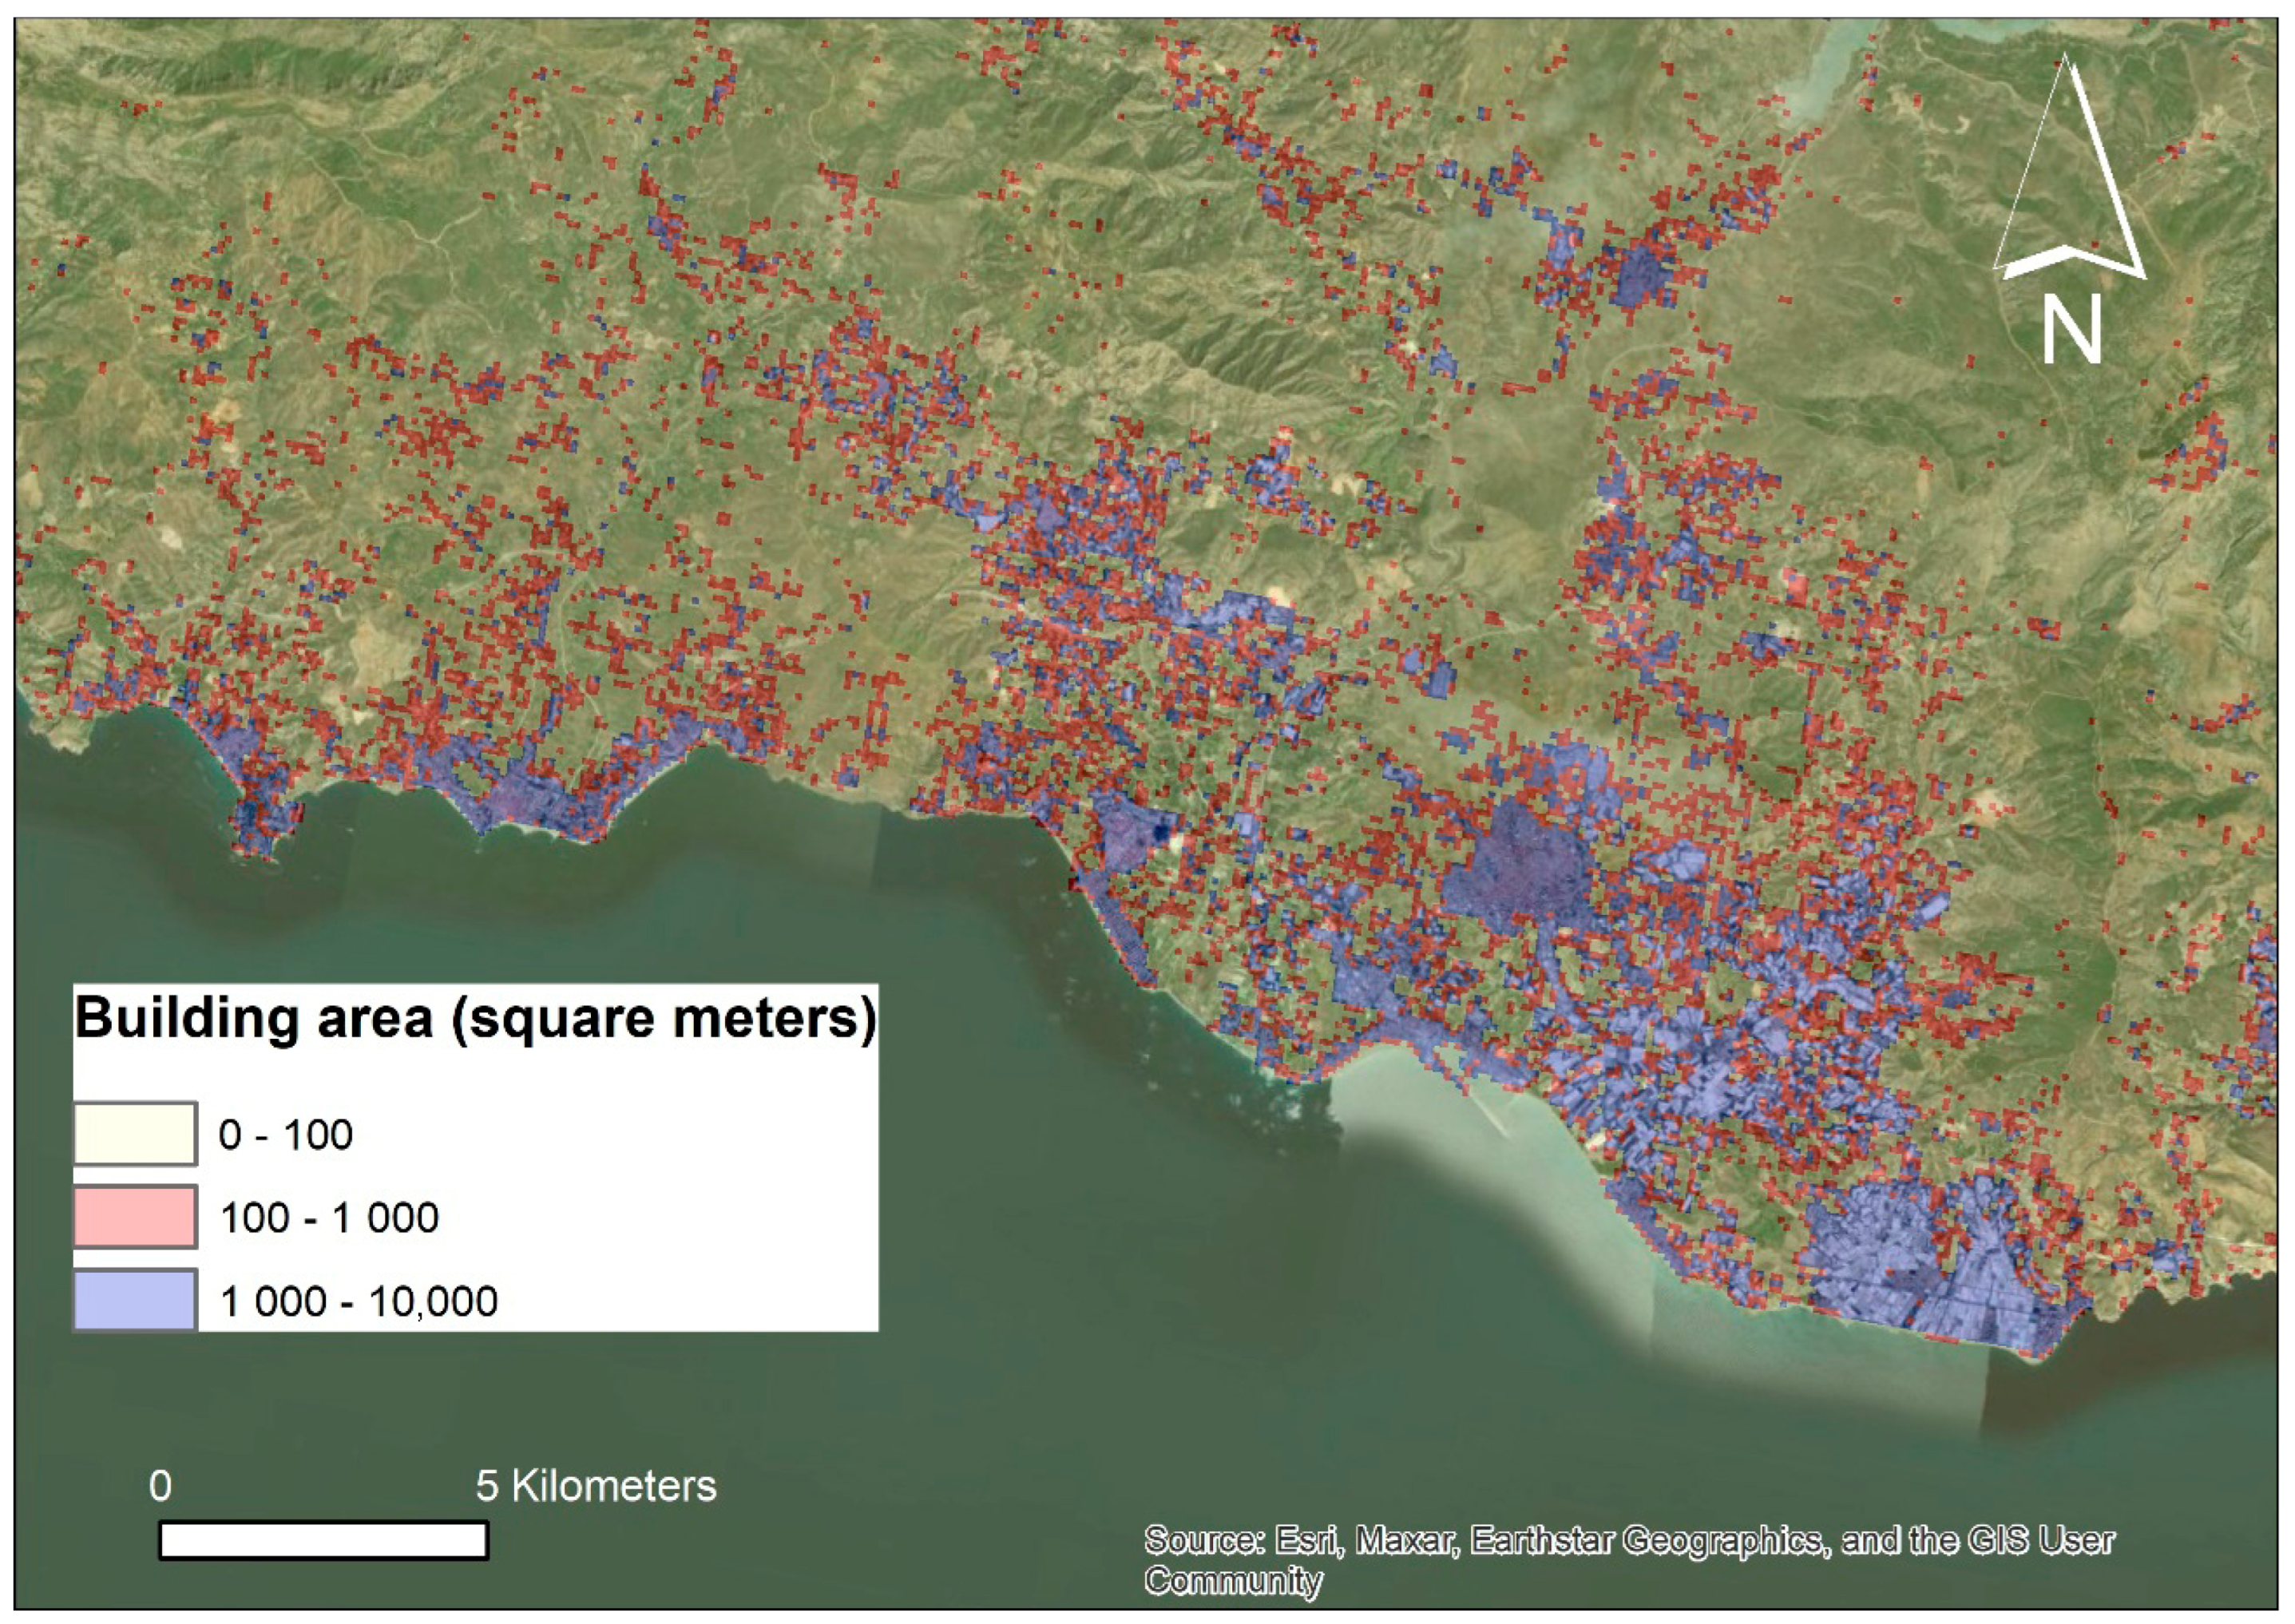
The default data on buildings used in the ADAImpact tool are sourced from the GHS-BUILT-S R2023A spatial raster dataset, which maps built-up surfaces using a combination of Sentinel-2 composite imagery (2018) and multitemporal Landsat data (1975–2030) [35]. This dataset, with a spatial resolution of 100 m, provides estimates of built-up (BU) areas expressed in square meters (Figure 7). The GHS-BUILT-S includes two key functional classifications: (a) Total built-up surface and (b) Non-residential (NRES) built-up surface. The data is derived through spatio-temporal interpolation of five observation epochs using satellite imagery from multiple sensors and platforms. Landsat data (MSS, TM, ETM sensors) supports the 1975, 1990, 2000, and 2014 epochs, while the 2018 epoch is represented by the Sentinel-2 composite (GHS-composite-S2 R2020A). To assess exposure in the ADAImpact tool, both residential and non-residential buildings are considered. The built surface exposure is a mandatory input in the workflow. Since this layer is raster format, the values of built-up area are obtained directly from the pixel value.
Given the characteristics and limitations of remote sensing technology, the ADAImpact tool defines a building as “any roofed structure erected above ground for any use”. This definition follows the original definition since the initial concept of the GHSL [35], which is the same as the INSPIRE “building” abstraction: https://inspire.ec.europa.eu/id/document/tg/bu (accessed on 10 August 2025), limited to the above-ground case, and without the “permanent” characterization of the built-up structures, allowing to be inclusive to temporary settlements as those associated with slums, rapid migratory patterns, or displaced people due to disasters induced by natural hazards or crisis. “Buildings are constructions above (and/or underground) which are intended or used for the shelter of humans, animals, things, the production of economic goods or the delivery of services and that refer to any structure (permanently) constructed or erected on its site”.

2.3.3. Exposed Population

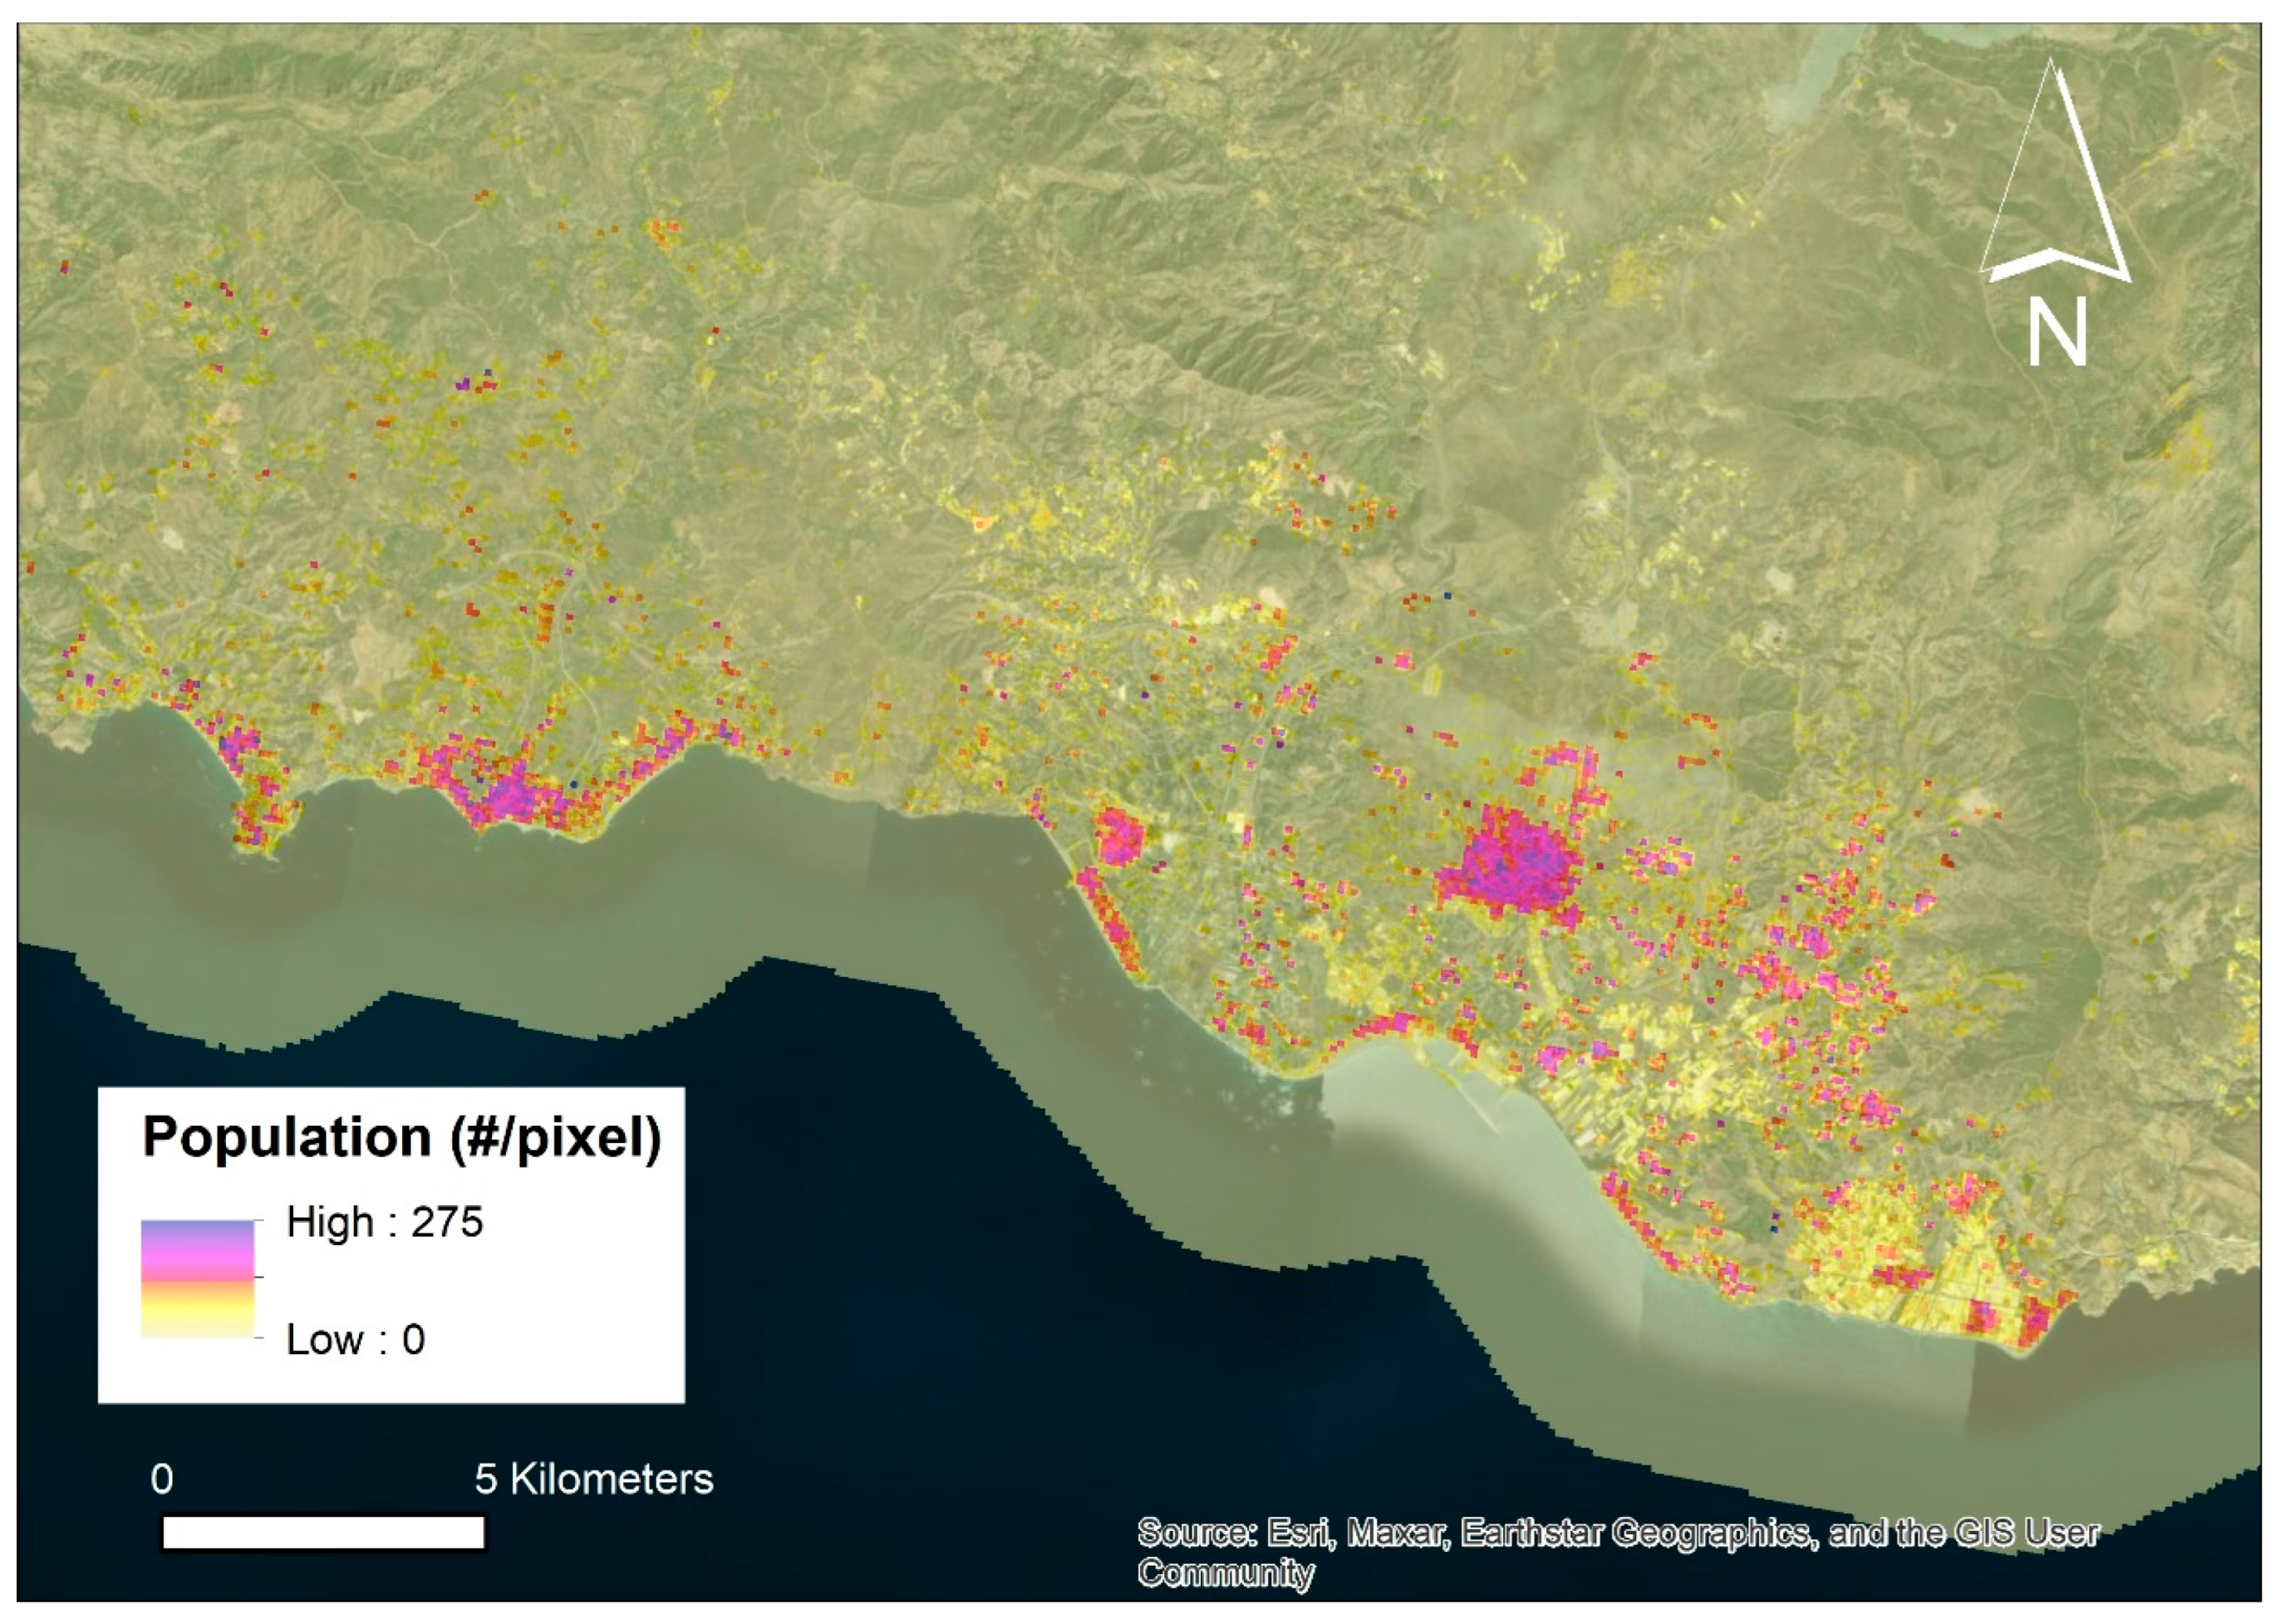
The data on exposed population is retrieved from the GHS-POP spatial raster product (GHS-POP_GLOBE_R2023), which depicts the distribution of human population, expressed as the number of people per cell (100 m-resolution) [33]. The exposed population is a mandatory input layer in the ADAImpact tool. Provided in raster format, population values are extracted directly from raster pixel values.
Residential population estimates at five-year intervals between 1975 and 2030 are derived from raw global census data harmonized by CIESIN for the Gridded Population of the World, version 4.11 (GPWv4.11). For the case studies, only the dataset corresponding to the 2020 epoch was used. These data, initially available at the polygon (census/administrative unit) level, were disaggregated to grid cells using spatial information on the distribution, classification, and volume of built-up areas, as mapped in the Global Human Settlement Layer (GHSL) for each corresponding epoch. The disaggregation methodology is detailed in Freire et al. [36].
For the updated GHS-POP dataset (GHS-POP_GLOBE_R2023A), the disaggregation process employed the GHS-BUILT-V dataset (GHS-BUILTV_GLOBE_R2023A, version 1.0)—a Sentinel/Landsat-derived product—serving as the spatial target. Total built-up volume (GHS-BUILT-V_GLOBE_R2023A) and non-residential built-up volume (GHS-BUILTV_NRES_GLOBE_R2023A) were combined by subtracting the latter from the former to estimate residential built-up volume across all five-year time steps between 1975 and 2030. Grid cells marked as “NoData” in the built-up layers were treated as zero during population disaggregation.
The primary sources for population estimates across epochs include the raw census data with geometry from GPWv4.11 (CIESIN/SEDAC), supplemented by projections from the UN World Population Prospects (2022) and the UN World Urbanization Prospects (2018). For the European Union, population counts were additionally controlled at the Local Administrative Unit level 2 (LAU2) using the Eurostat LAU2 time series (Figure 8).

2.3.4. Exposed Critical Infrastructures and Equipment

The ADAImpact tool also includes critical infrastructures and equipment as additional exposed elements. These elements are retrieved from the OpenStreetMap (https://www.openstreetmap.org), which is a free, open geographic database of the whole world that is being built by volunteers largely from scratch and released with an open-content license. The OpenStreetMap License allows free access to map images and most of underlying map data. OpenStreetMap (OSM) uses its own topology to store geographical features which can then be exported into other GIS file formats [37]. Table 1 lists the layers of exposed critical infrastructures and equipment used in the analysis.
The inclusion of critical infrastructure elements in the ADAImpact tool does not require any mandatory attribute fields, as the spatial analysis process is binary, depending solely on the presence or absence of the element. Users may also integrate additional critical assets of interest. If the asset is represented as a line feature, it should be added to the roads and railway shapefiles; if it is represented as a polygon feature, it should be included in the polygon shapefile containing other critical infrastructures and equipment.

2.4. Output Data

The output of the ADAImpact is a shapefile containing the classified ADAs, identical in geometry to the input file, but with three new fields in the attributes table: EXPOSURE, MAGNITUDE and IMPACT. Each field records the corresponding classification derived from the matrices described above, which have been implemented in Python using conditional statements.

3. Results

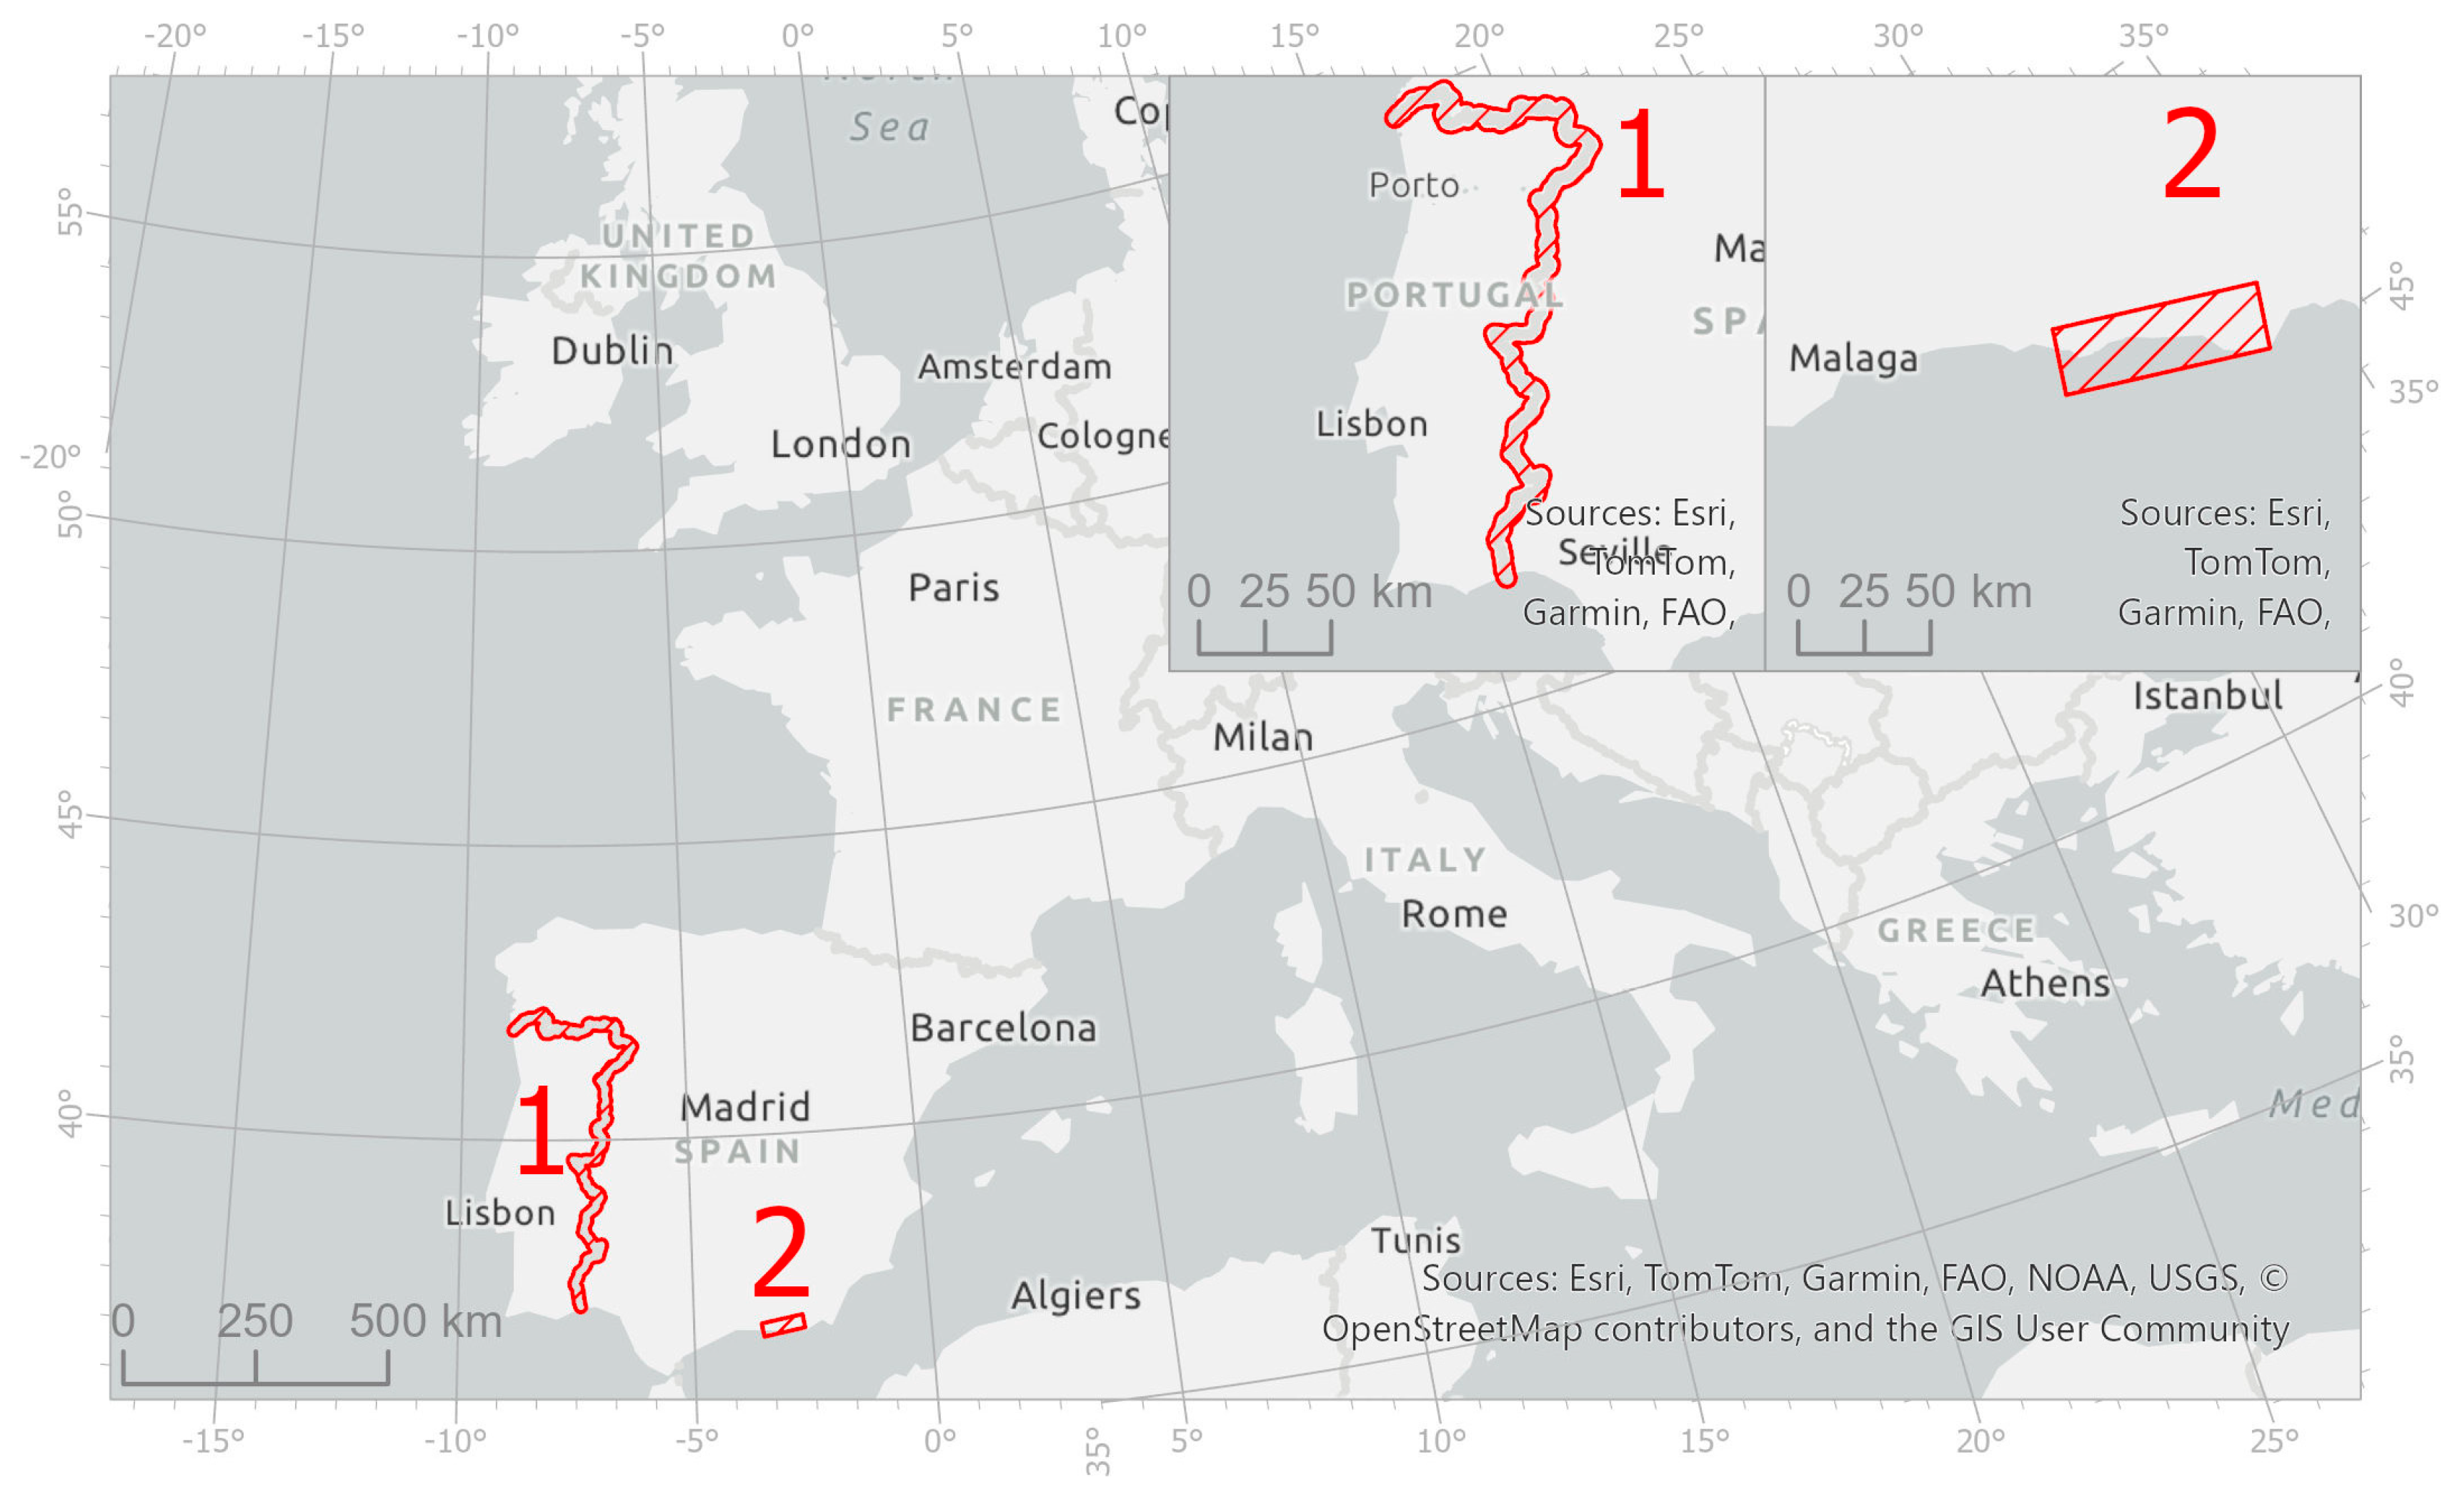
The ADAImpact tool was applied to two test regions, the Portuguese–Spanish border and the coastal area of Granada, Spain (Figure 9). The border region (Portugal–Spain) is characterized by several structural vulnerabilities, such as low population density, aging population, poor economic dynamics and poor network of public infrastructures and services. The entire border Portugal–Spain was selected as the tool is designed to exploit the extensive coverage provided by the EGMS. The coastal area of Granada is made up mostly of agricultural areas and small tourist towns and villages. The area was selected to test the ADA-Impact tool in an alternative geographical context where geohazards are more prominent.

3.1. Border Between Portugal and Spain

To demonstrate its applicability, the ADA-Impact tool was applied along the entire border between Portugal and Spain, using the Exposure, Process Magnitude, and potential impact matrices. The tool was implemented with its default input datasets, which included ADA polygons generated by the ADAclassifier tool, together with layers on population, built-up surfaces, roads, railway, and other critical infrastructures and equipment, as described in Section 2.3.
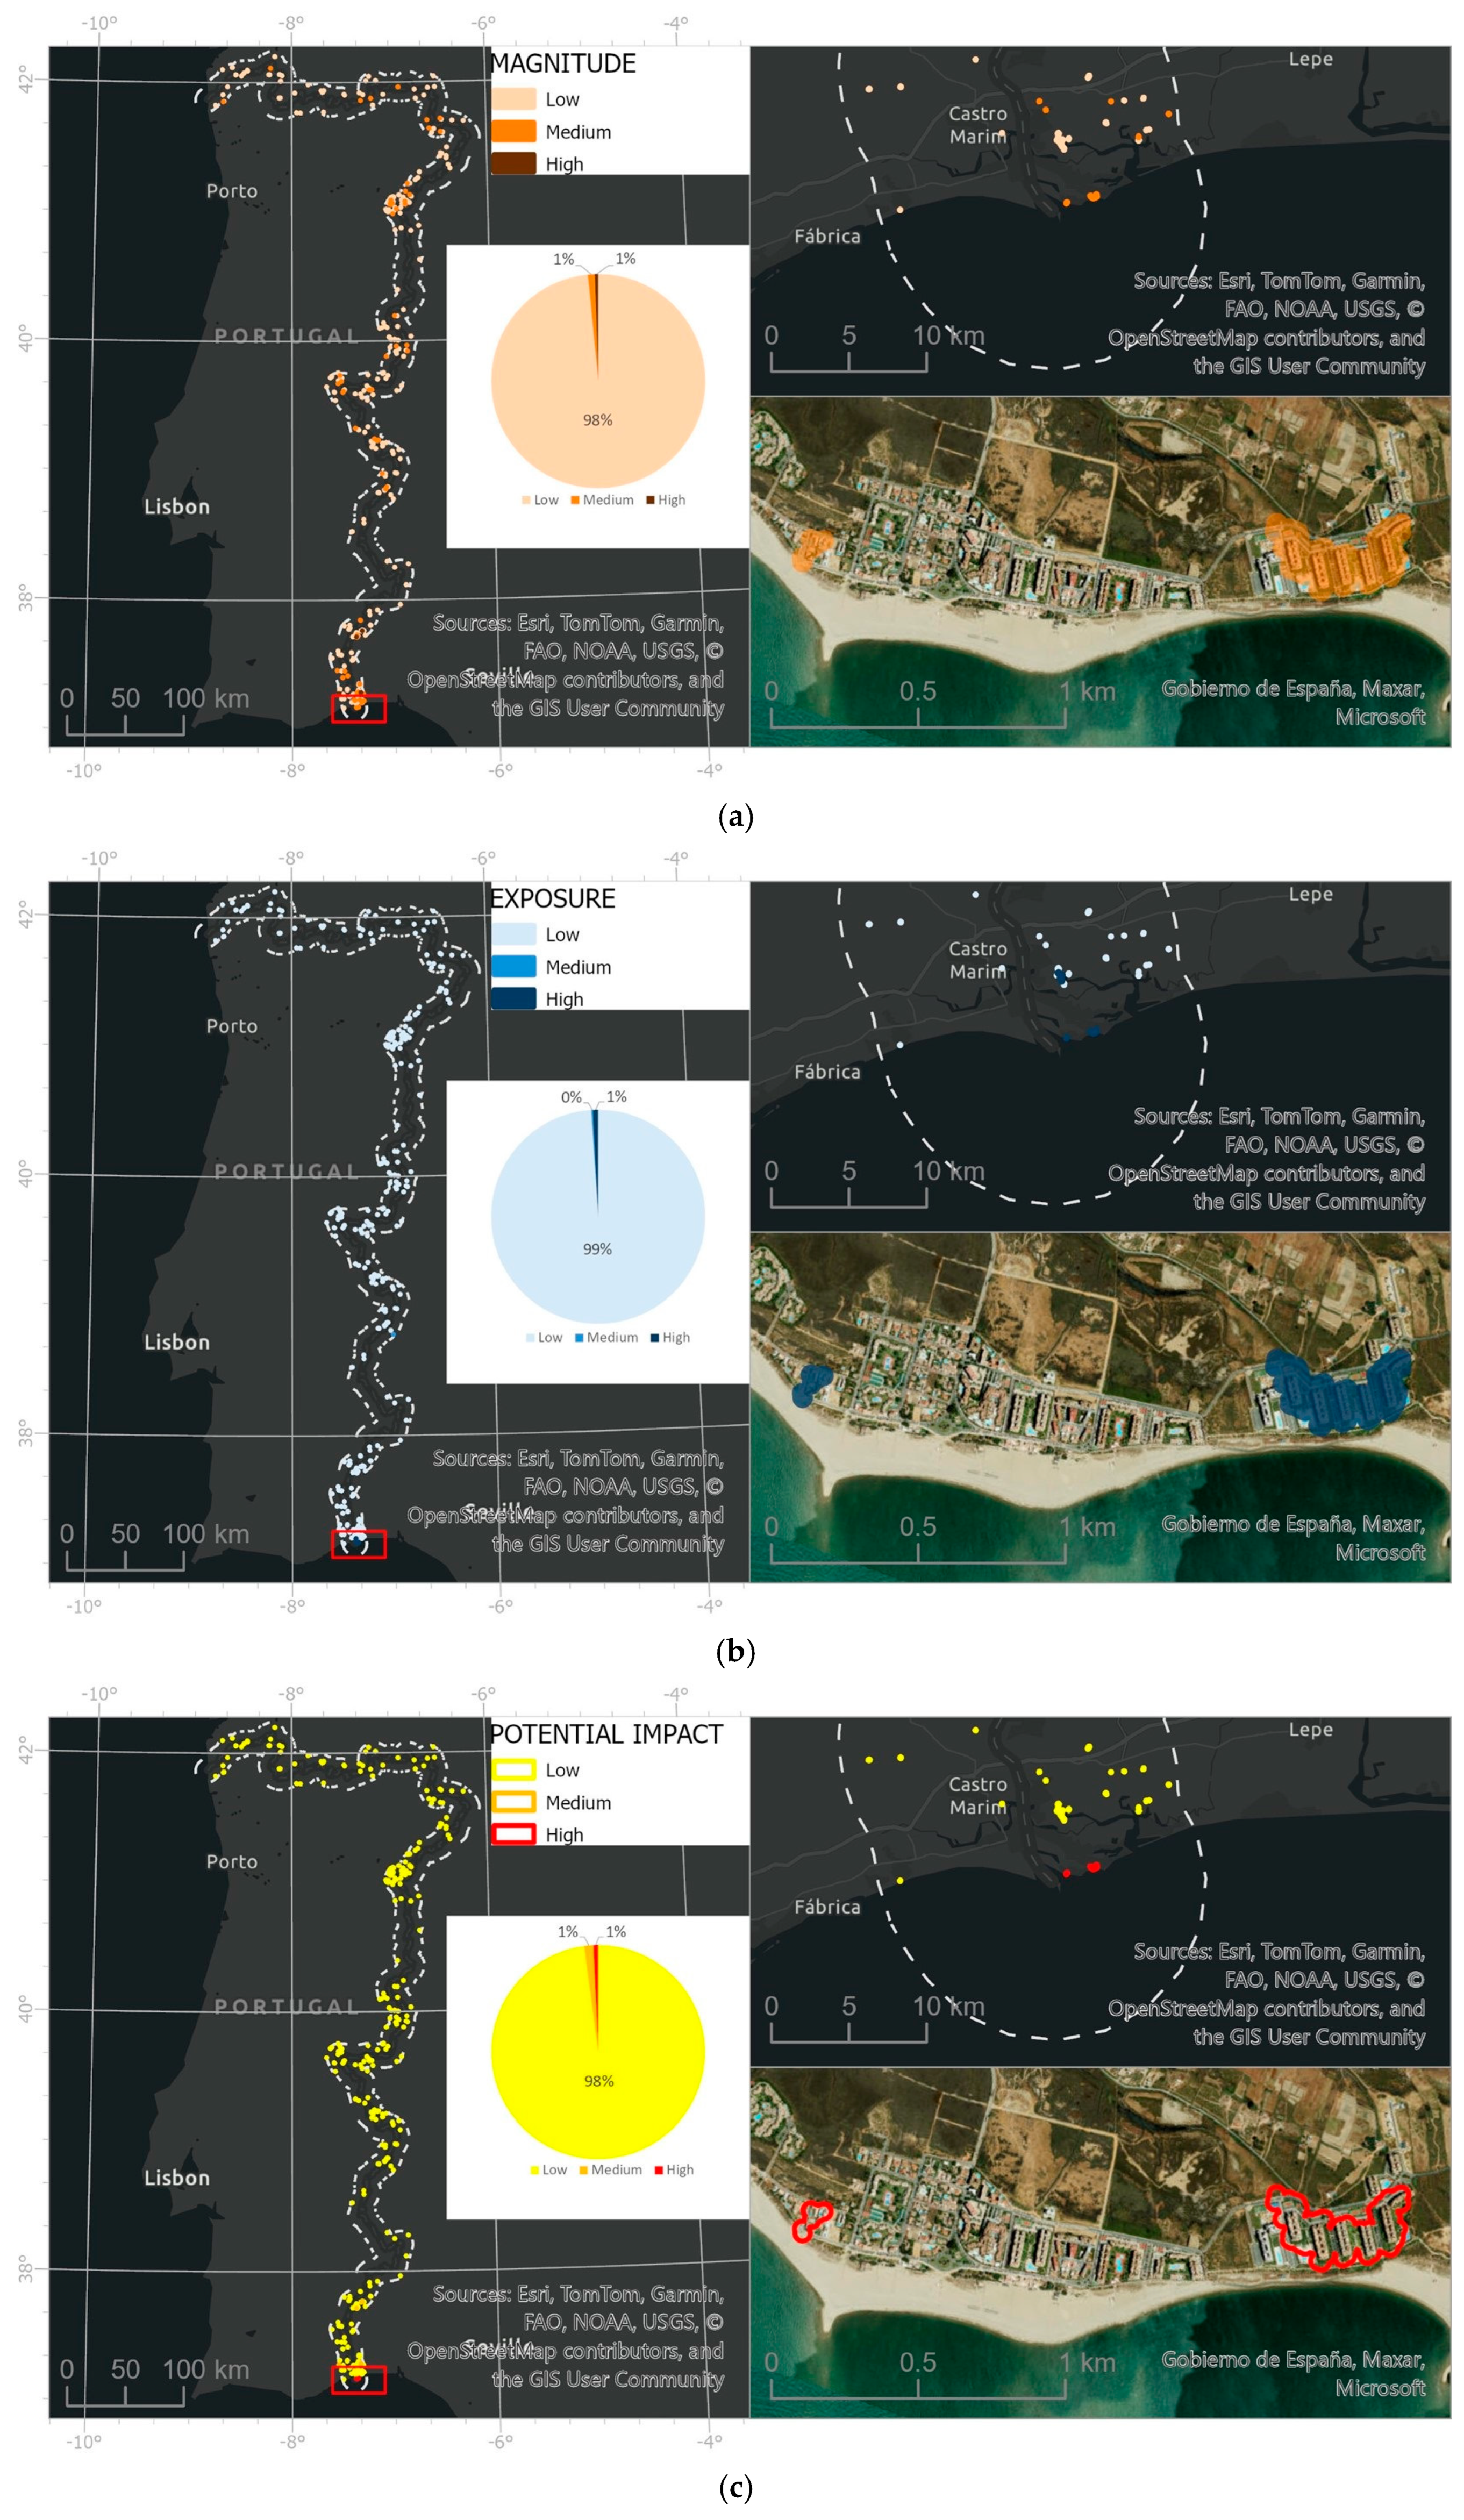
The ADAtools were applied to the first update of the EGMS products, covering the period 2015–2021. A total of 860 ADAs were extracted, temporally characterized, and classified, using the ADAfinder, TSclassifier, and ADAclassifier, respectively. Among these, the ADAImpact identified 385 areas of ‘potential impact’. According to the process magnitude matrices, only about 2% of the ADAs fall in the ‘Medium’ or ‘High’ categories (Figure 10a). This outcome reflects the characteristics of the study area, which is dominated by gentle terrain and exhibits low levels of geohazard activity. The exposure analysis (Figure 10b) shows that the ‘Low’ exposure class is overwhelmingly dominant, accounting for 99% of the ADAs identified along the Portugal–Spain border.
The predominance of ADAs classified in the ‘Low’ potential impact category (98%) reflects the general characteristics of the study area, which is marked by heterogeneity, sparse urbanization, and relatively gentle relief, with few areas displaying significant potential impacts. The small subset of ADAs categorized as ‘High’ potential impact corresponds to severe and damaging phenomena, such as major structural damage or evacuated buildings. Among these, the Isla Canela–Ayamonte area stands out due to its association with land subsidence (Figure 10c).

3.2. Coastal Zone of Granada (Spain)

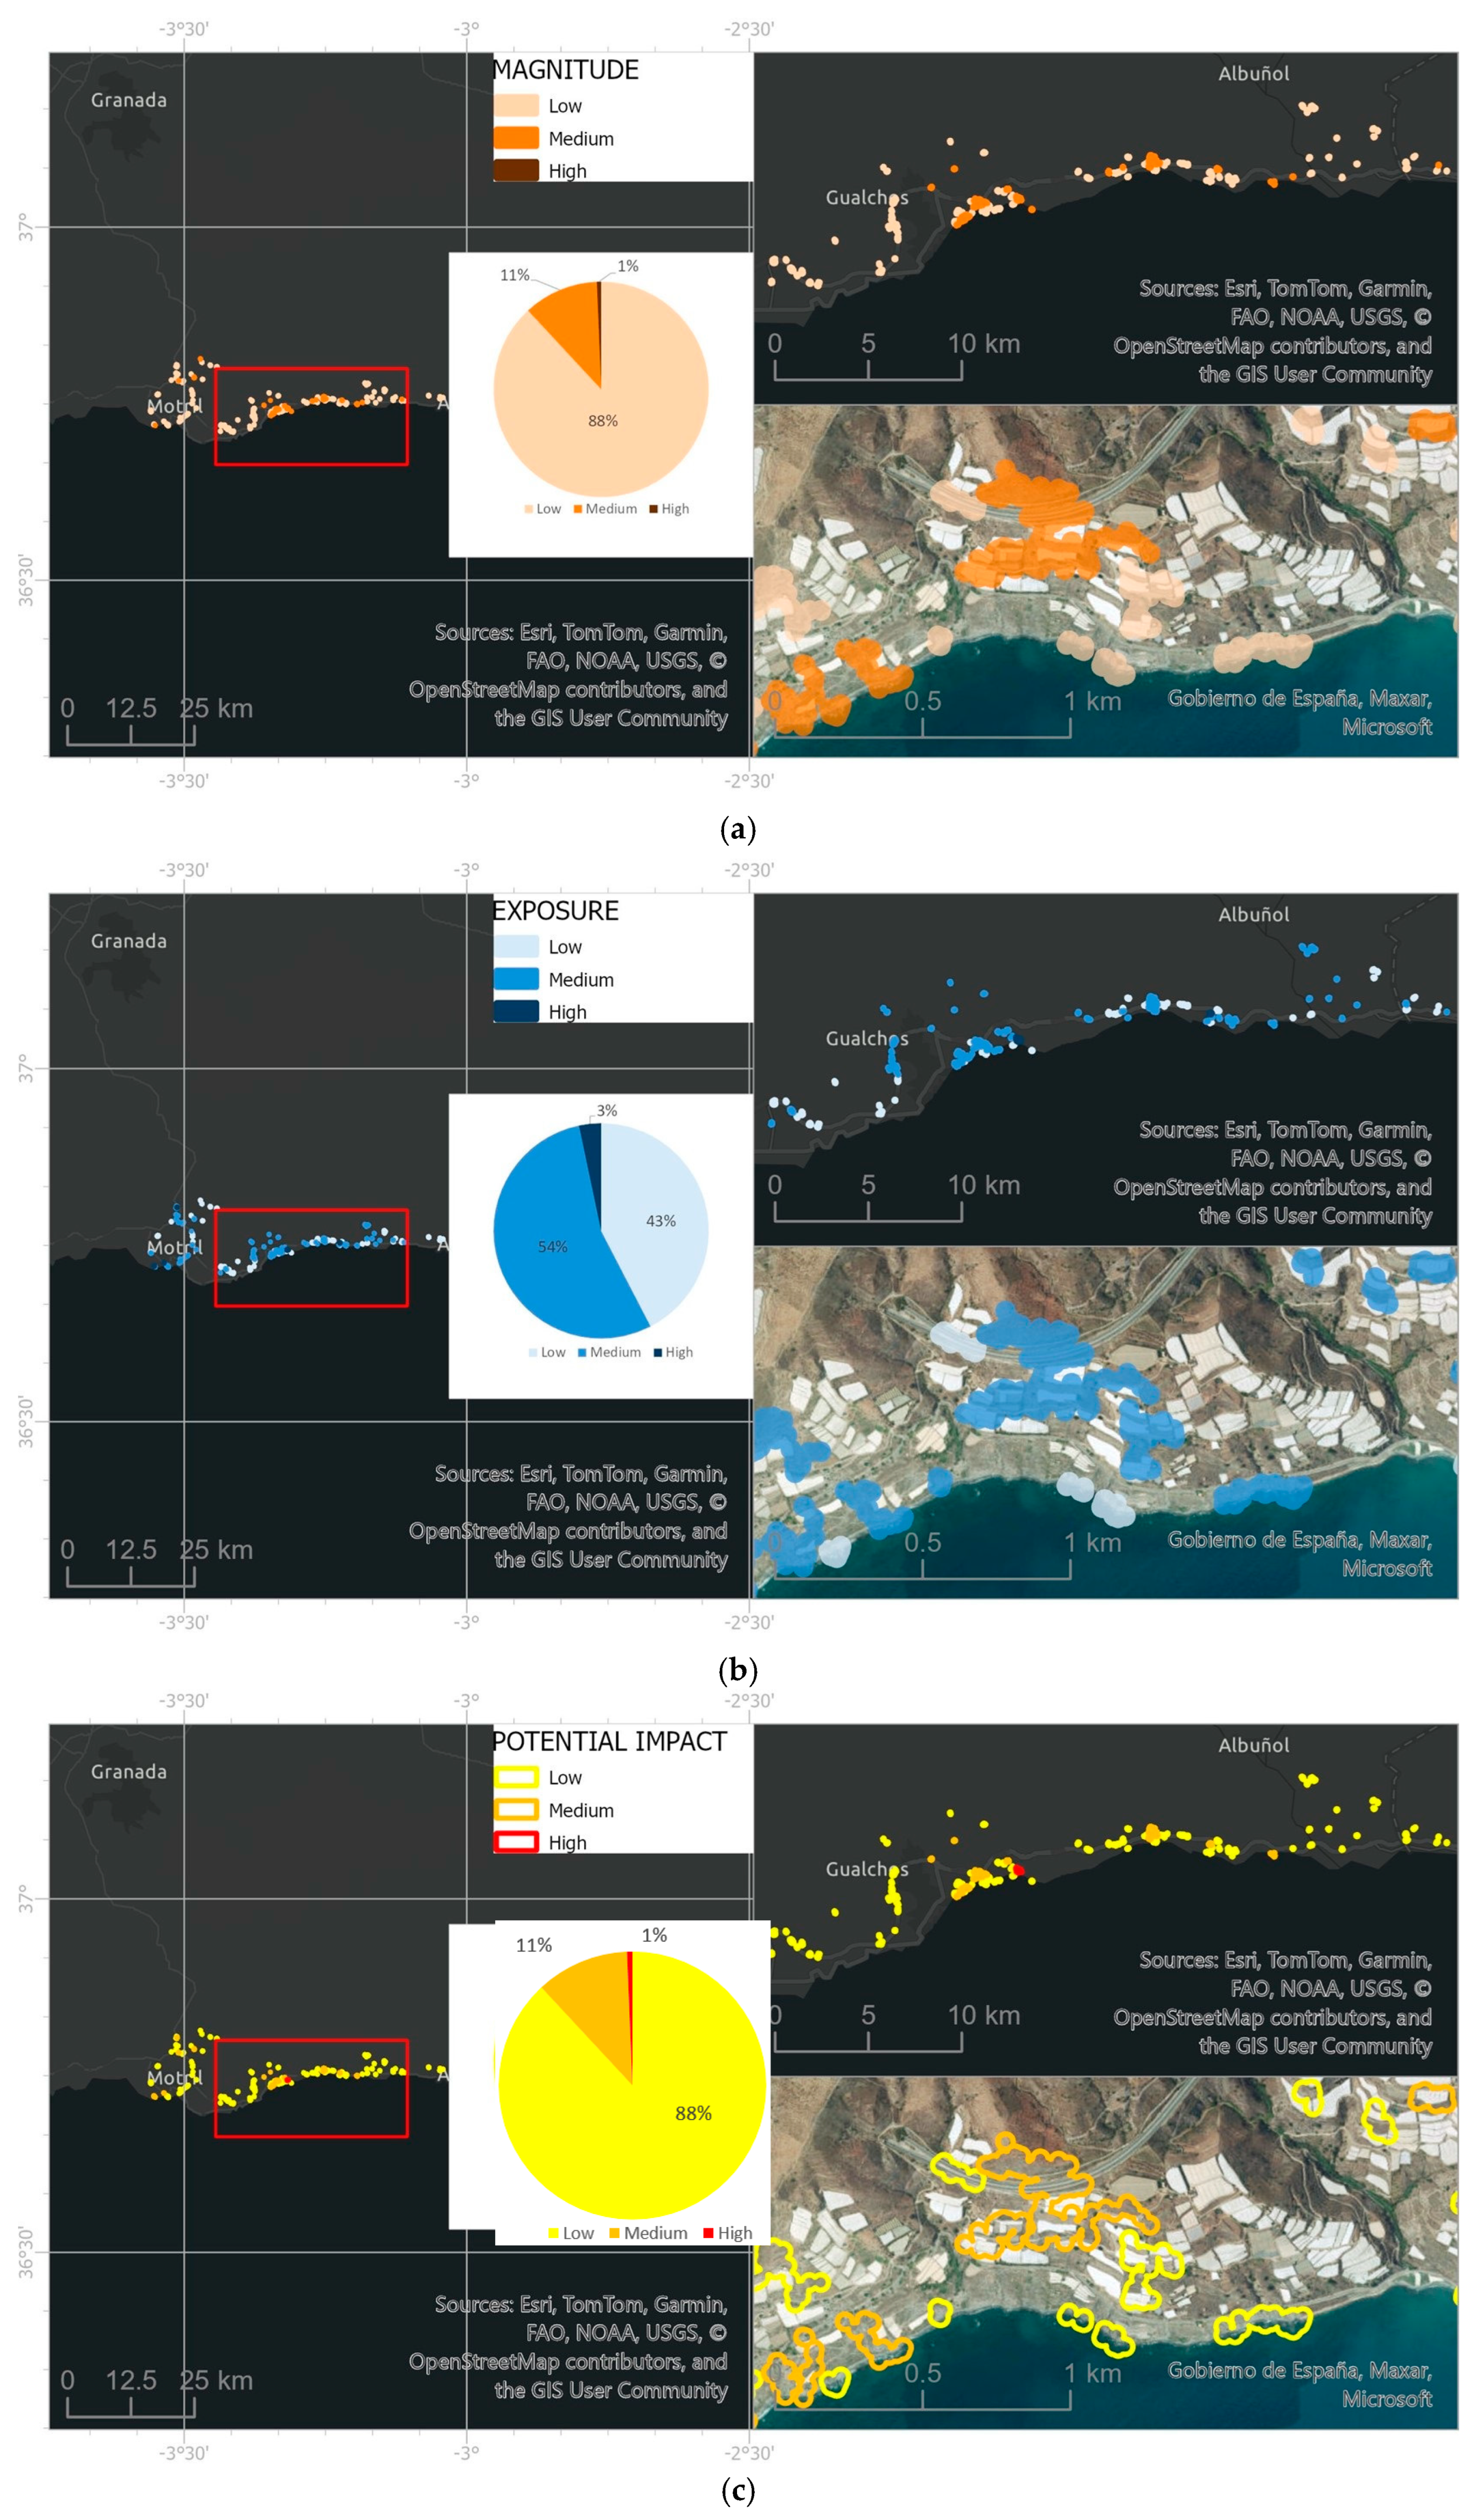
In this case study, the ADAImpact tool was applied to the coastal zone of Granada (Spain), a region well-known for its susceptibility to landslides [35]. The application of ADAtools identified 151 areas of ‘potential impact’. Of these, the majority (88%) exhibit Low process magnitude, while 11% fall into the Medium category and only 1% into the High category (Figure 11a).
Figure 11b illustrates the exposure classes computed for ADAs identified along the Granada coastal zone. The ‘Medium’ exposure class is the most prominent (54%), largely reflecting its strong association with road infrastructure. This is followed by the ‘Low’ class (43%), while only 3% of ADAs fall into the ‘High’ class.
Figure 11c presents the classification of ADAs by potential impact in the Granada coastal area. The analysis shows that the majority (88%) fall into the ‘Low’ class, while 11% are classified as ‘Medium’, mostly along major regional roads. Only 1% of ADAs are assigned to the ‘High’ class. In terms of population exposure, the potentially affected population consists of 167 inhabitants in the ‘Low’ class, 80 in the ‘Medium’ class, and 11 in the ‘High’-class. These results align with the characteristics of an area that is regularly affected by geohazards yet still retains a small percentage of ADAs classified as ‘high potential impact’, representing the most significant and suitable candidates for further in-depth analysis and monitoring.
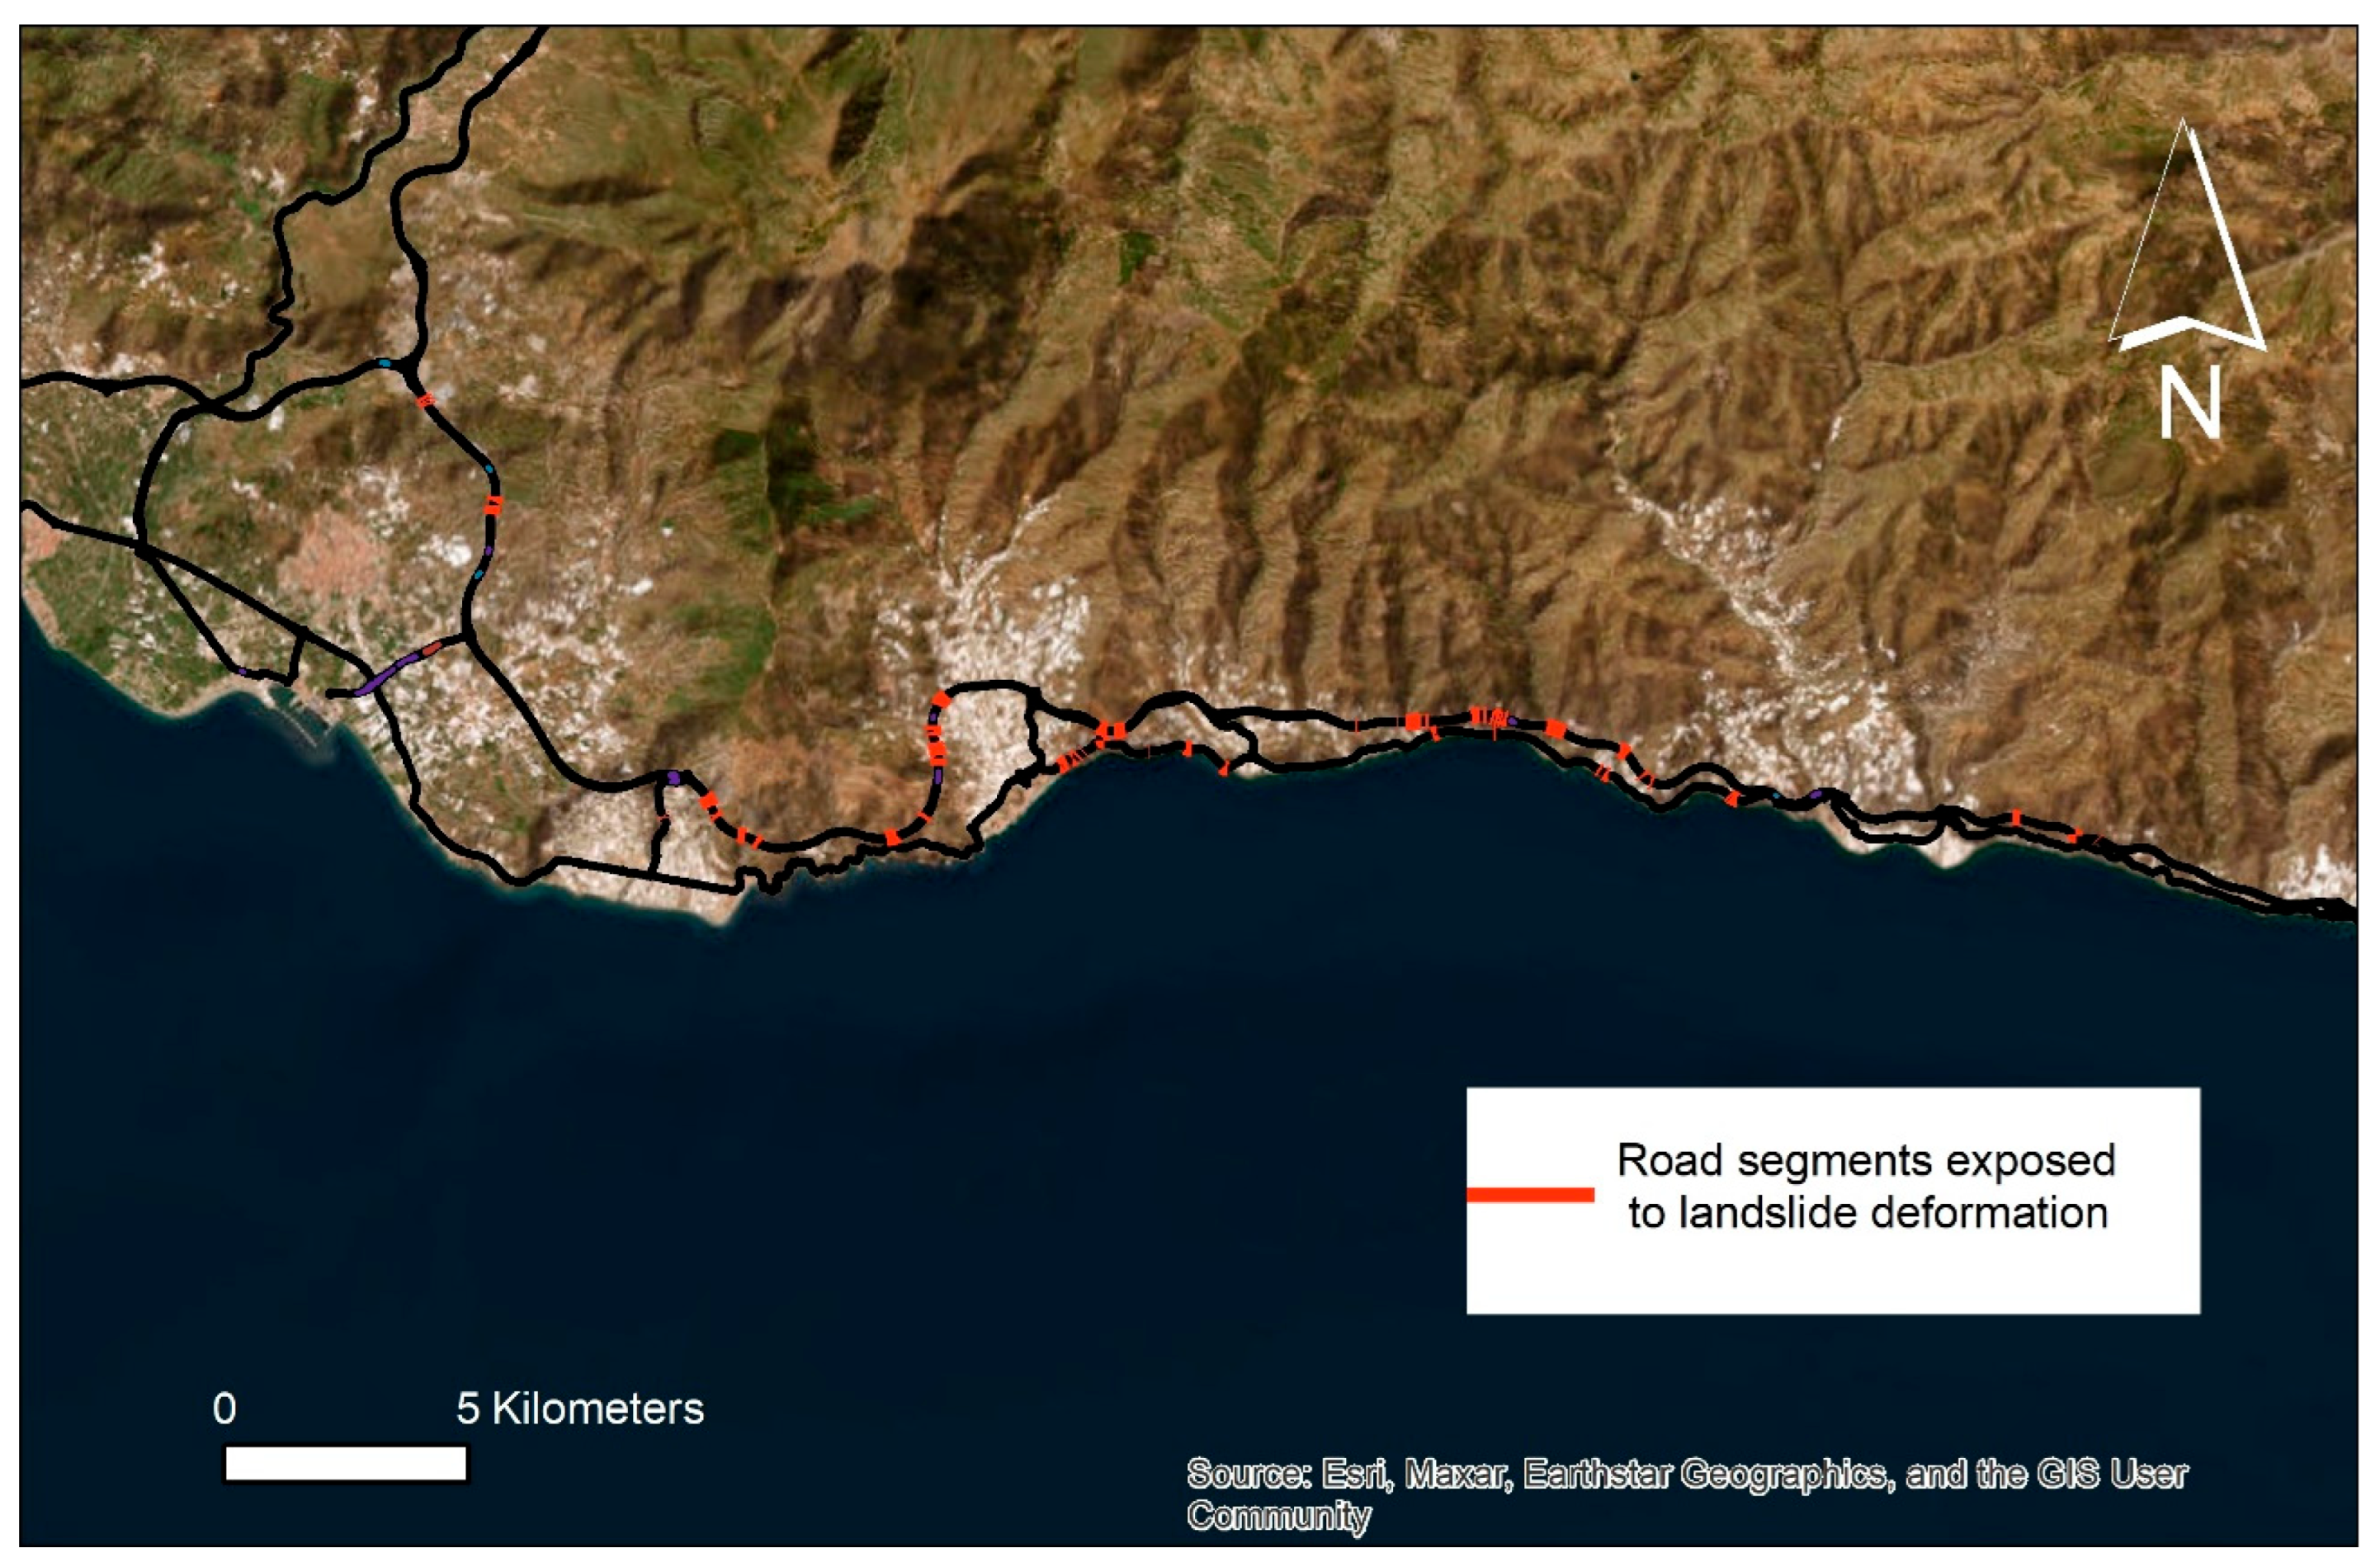
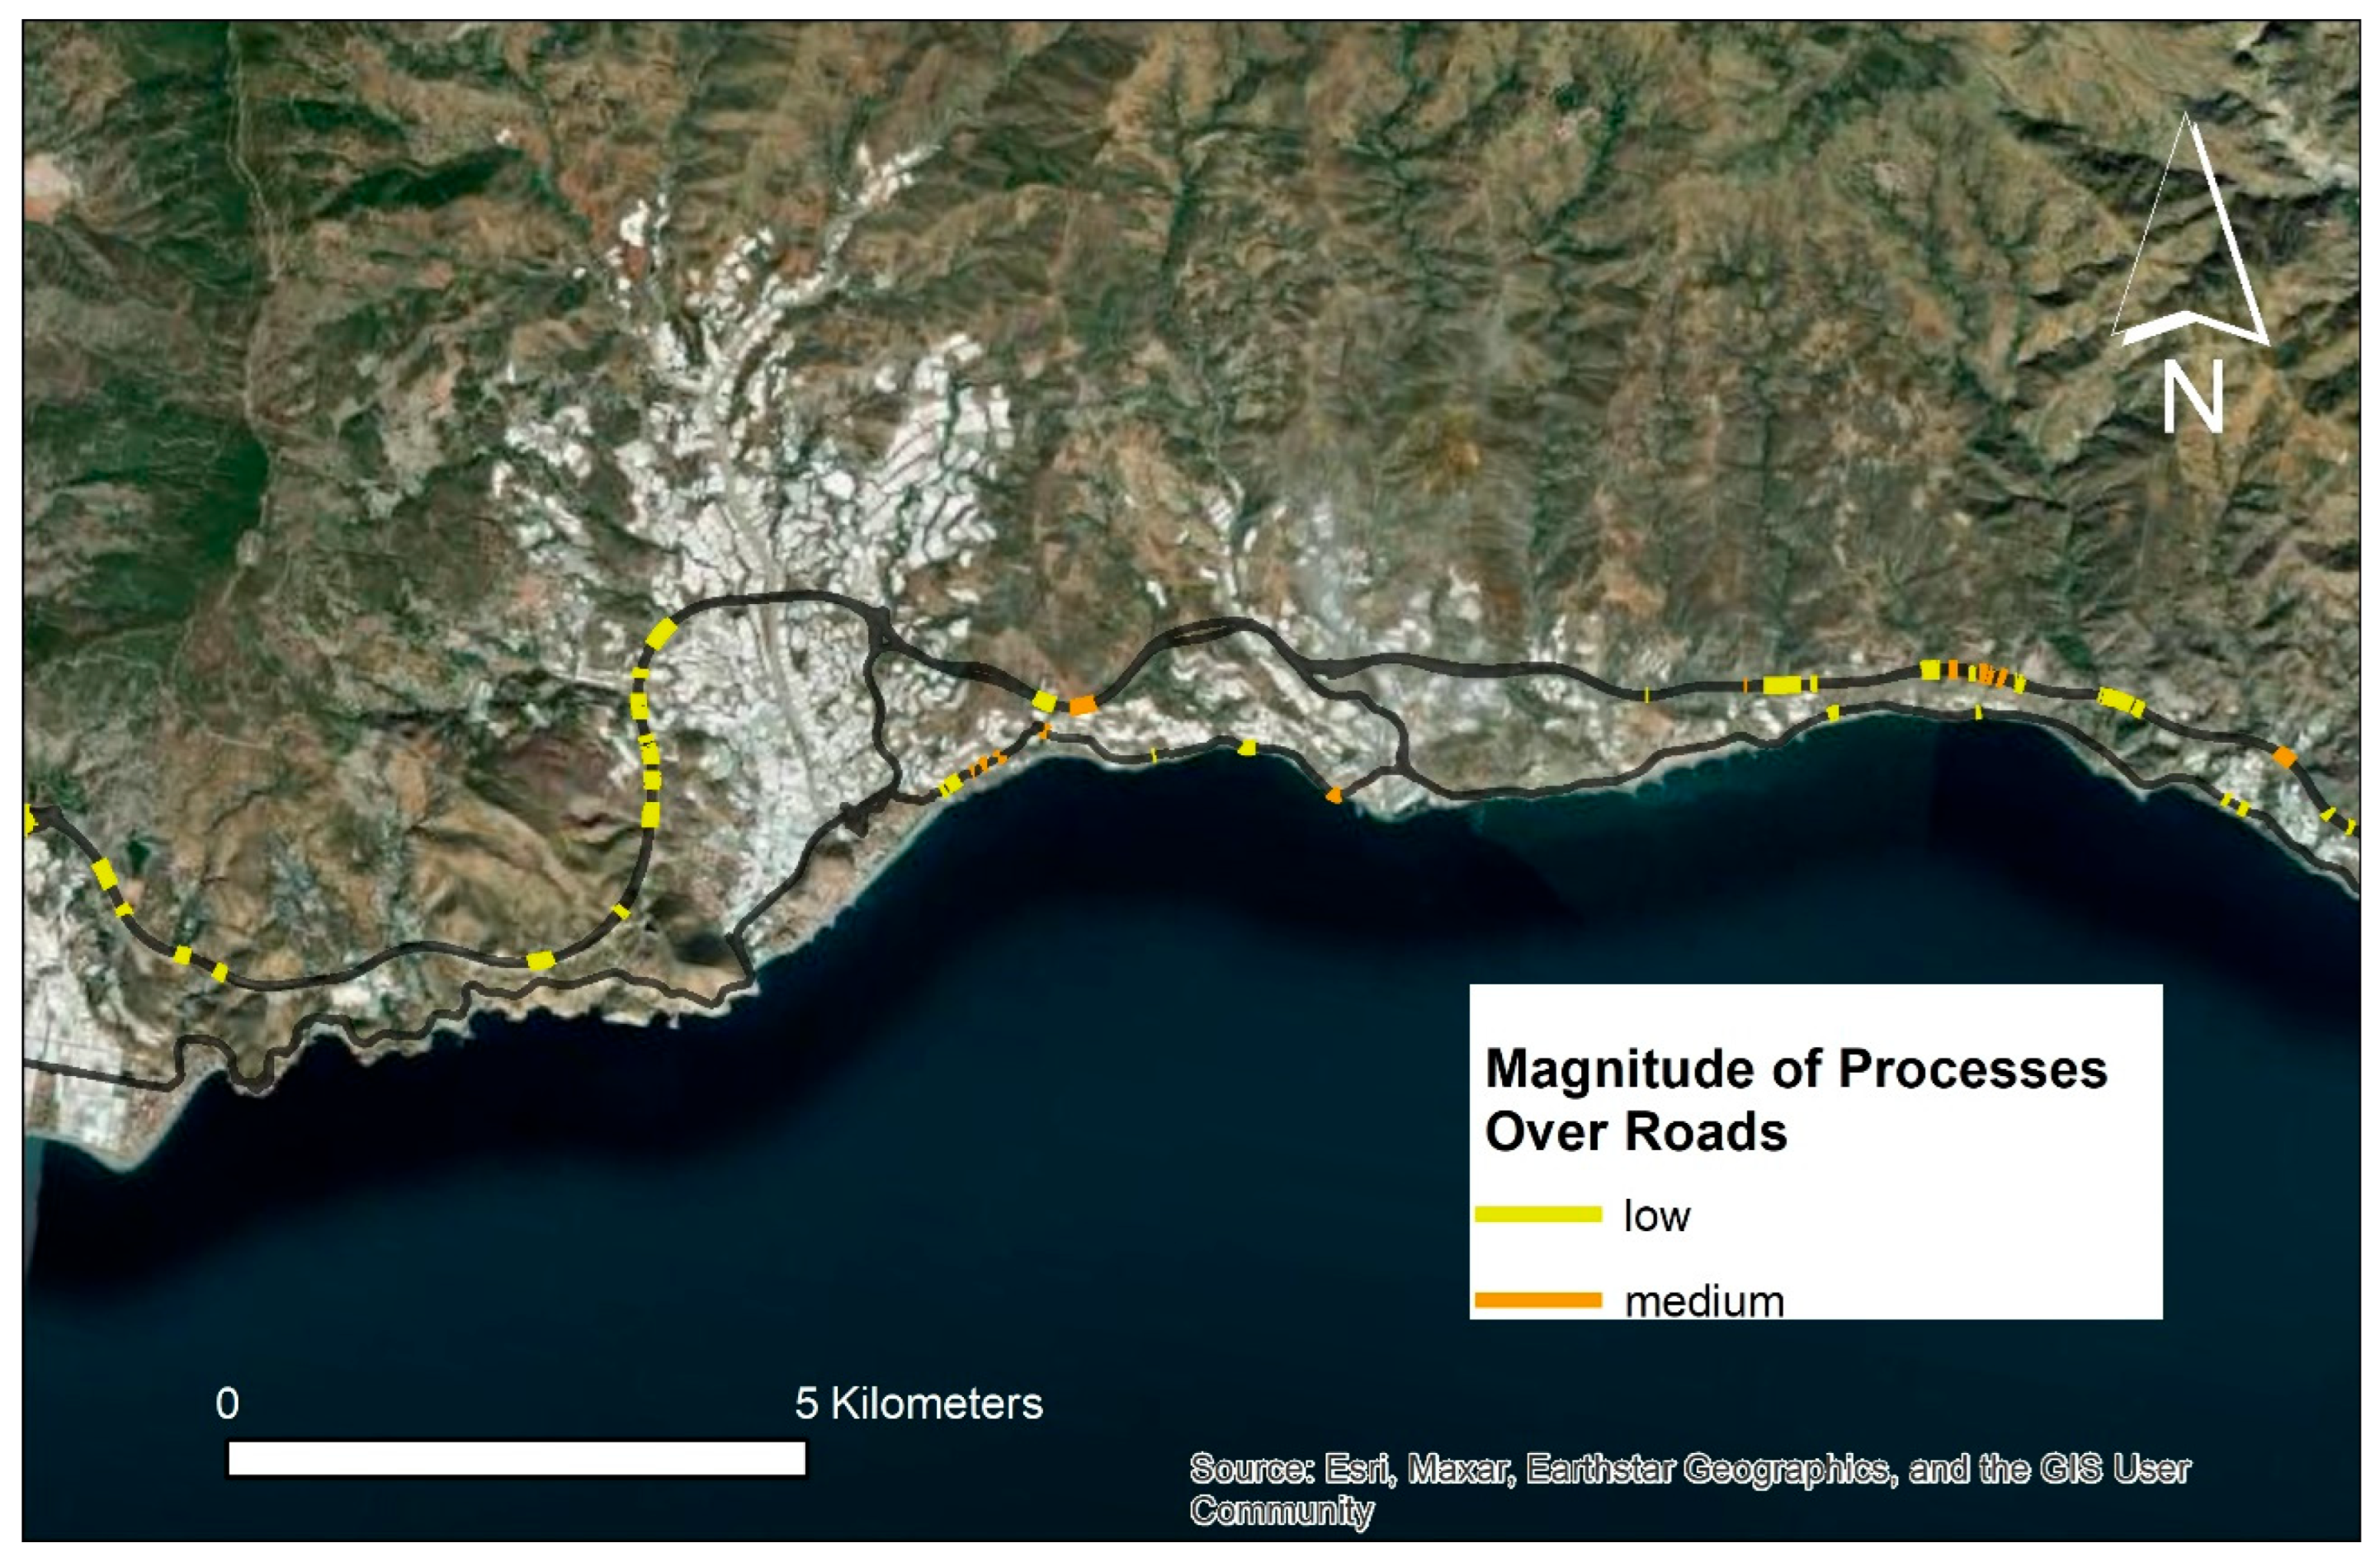
Beyond the typical representation of potential impacts obtained from EGMS data processing, the ADAImpact tool provides a more intuitive approach to presenting results. It focuses on exposed elements and highlights specific ADA properties, such as the type of deformation process, the magnitude of the process, and contributing factors like the ADA’s size, velocity, and temporal trend. As examples, Figure 12 illustrates road segments exposed to landslide deformation, and Figure 13 shows the process magnitude of deformation impacting roads along the Granada coastal zone.

3.3. Validation

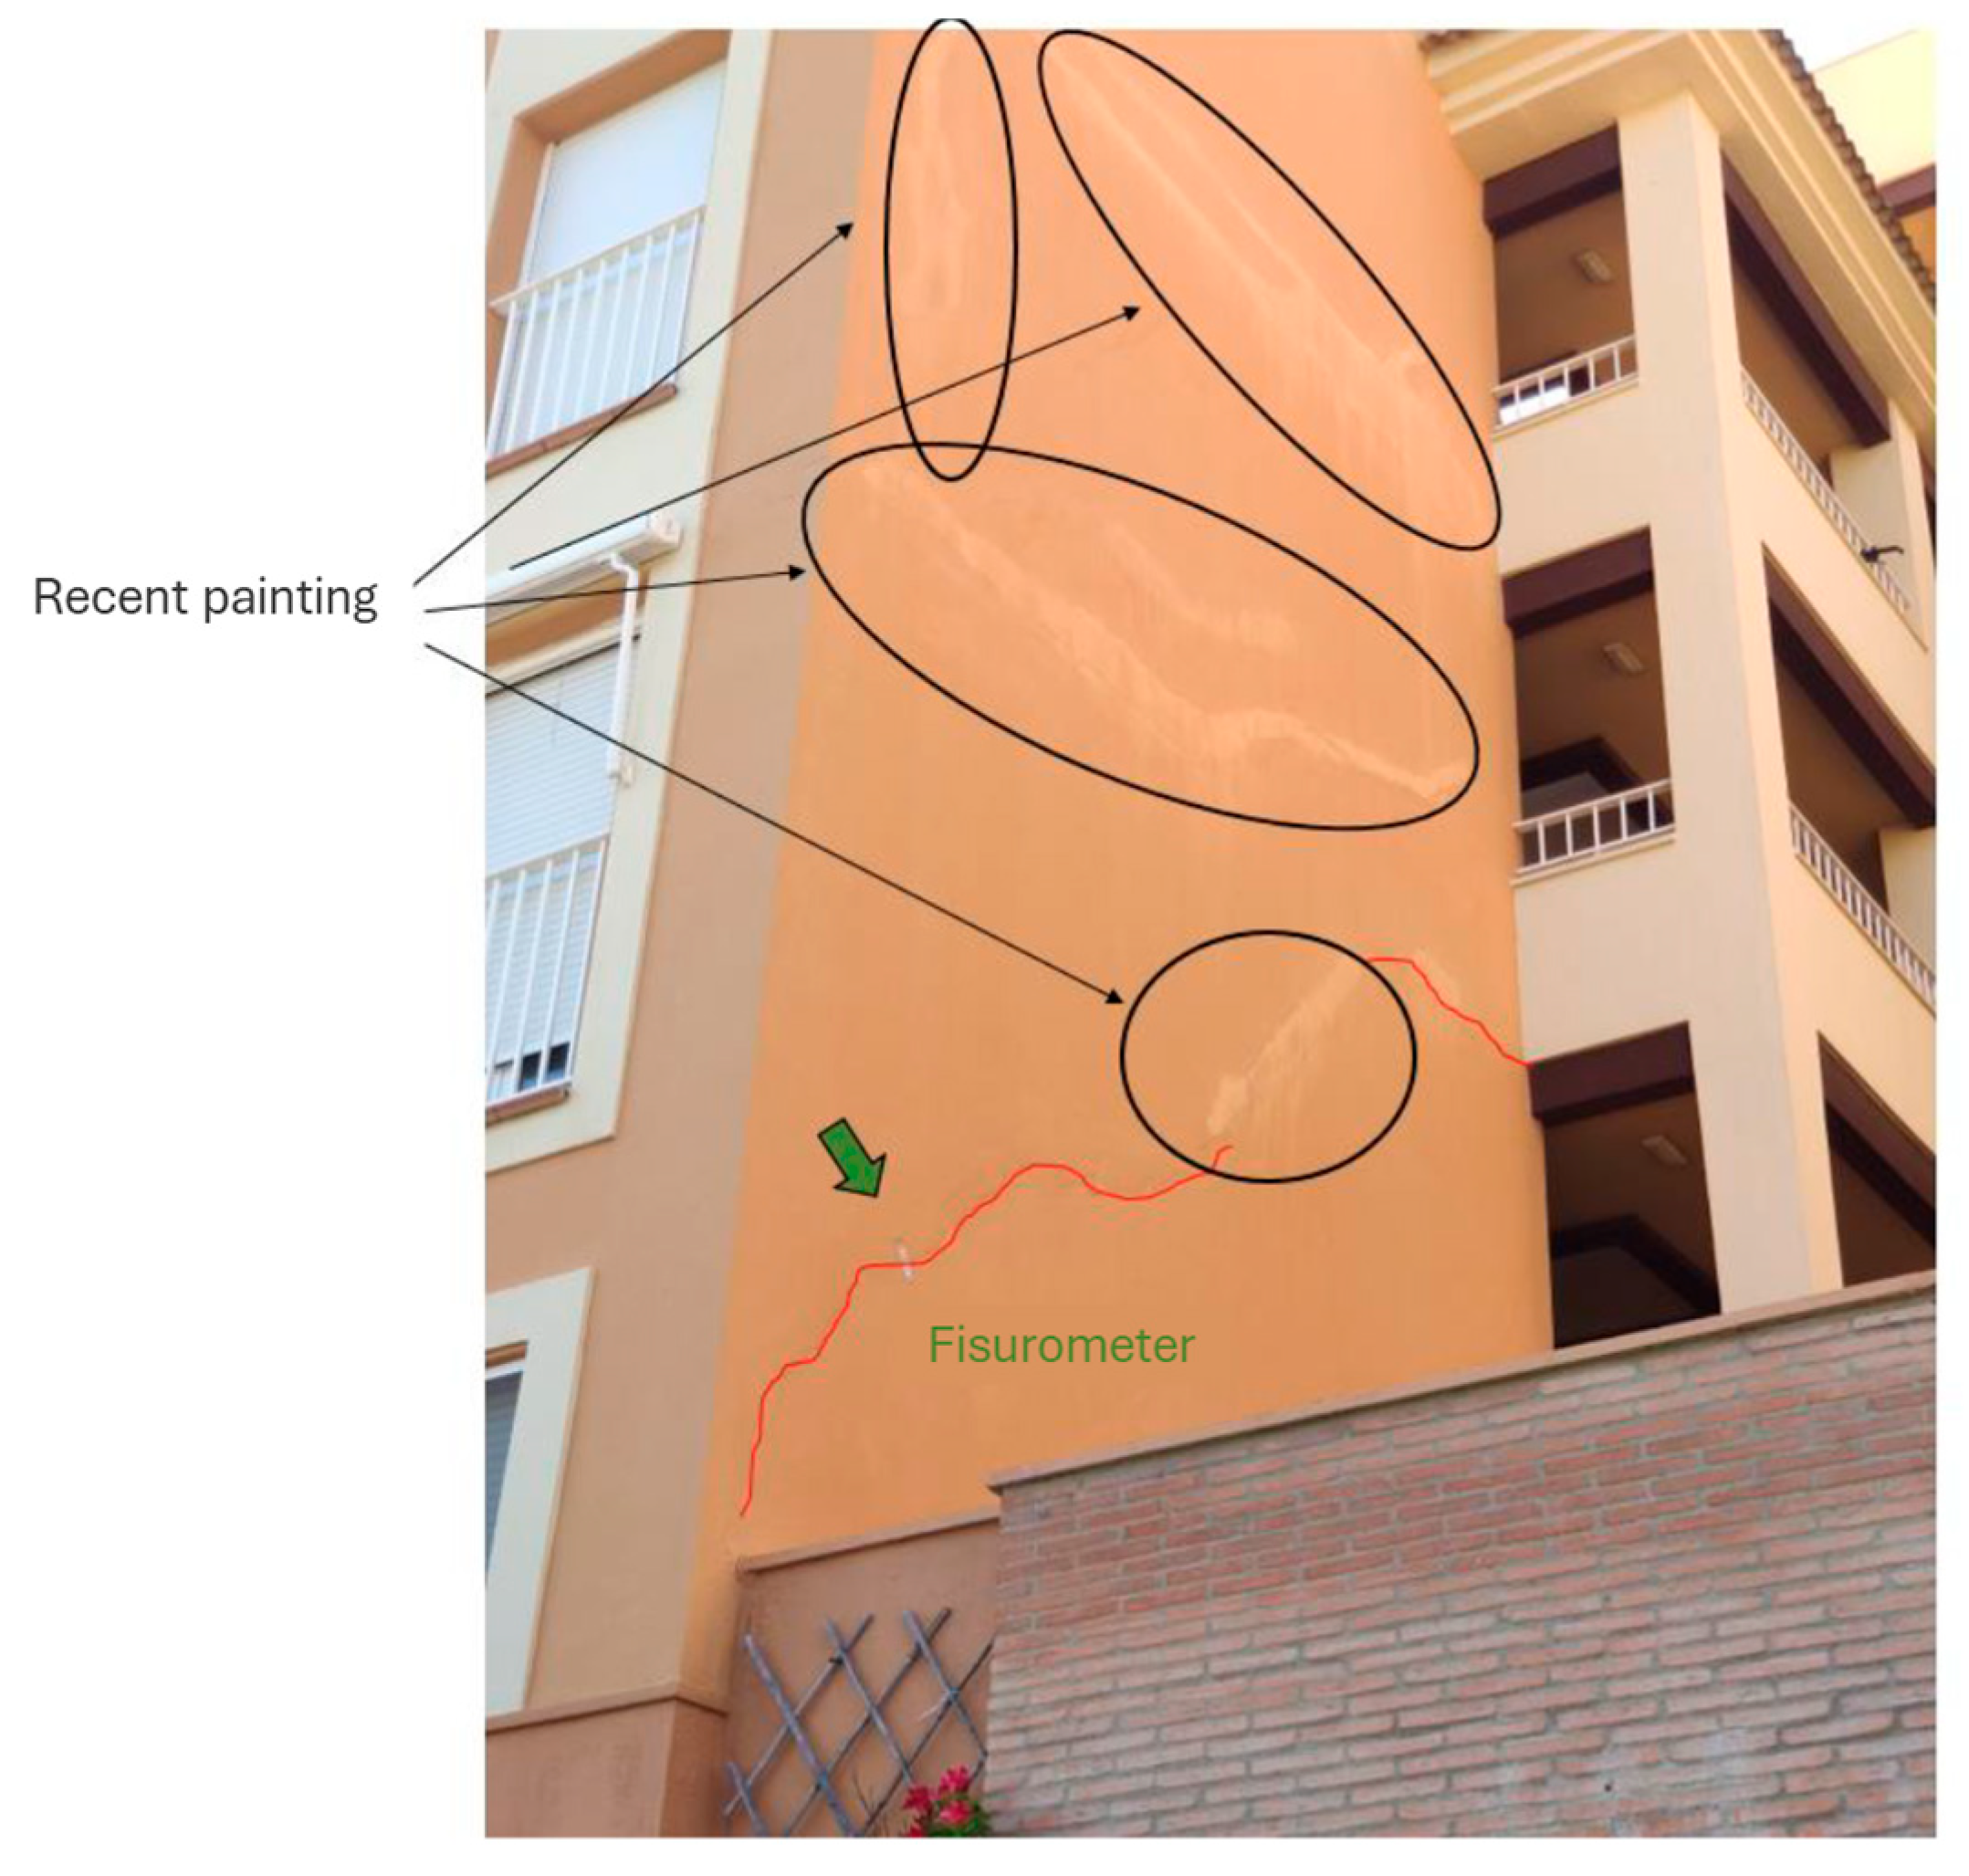
Damage detection campaigns provide a valuable means of validating ground displacement, particularly when observed damages are consistent with the detected motion. In June 2023, a field campaign was conducted to validate the results obtained from the application of ADATools to EGMS products. The Isla Canela area (south of Spain) was selected as a site of interest because it was among the most clearly detected locations along the Portugal–Spain border and had also been classified as an area of high exposure. The ADA polygon covering the Residential Los Flamencos, Residential Las Arenas, Residential Los Cisnes, and Residential Los Albatros areas is characterized by an average displacement velocity of 7.7 mm/year, with a significant built-up area (16,354 m2) and a resident population of 109 inhabitants. In this area, four buildings with higher displacement velocities and high exposure (population and built-up area) were analyzed. The results revealed minor damages in three of the buildings, corresponding to lower velocities, and more significant damages in the building with the highest deformation rate. This building was also monitored using extensometric gauges on its northern side (Figure 14).
For the Granada coast, no field survey was possible within the scope of this work; however, our results are consistent with those observed and described by Barra et al. (2022) [38] for that study area.

4. Discussion

This article introduces a new QGIS tool that utilizes ADA polygons generated by the ADAtools software to assess the potential impact of ground motions by combining process magnitude and exposure. The approach, designed to be scalable and applicable across Europe, was tested and validated along the Portuguese–Spanish border and in the coastal zone of Granada, Spain. Ensuring replicability at the European scale was a central goal of development, achieved through the use of EGMS data in combination with globally available, open-access exposure datasets.
The results obtained can be used to produce pre-disaster maps, providing essential and timely thematic information to assist Civil Protection decision makers in planning for emergencies in geohazards prone areas, with the ultimate goal of mitigating damage. This aligns with the findings of López-Vinielles et al. [14], who highlighted that evaluating potential socio-economic impacts is an invaluable component of risk management, particularly in regions undergoing rapid urbanization and infrastructure development.
ADAs are polygons aggregating clusters of points nearby that exhibit deformation caused by a specific type of geohazard. However, they provide only an approximation of the spatial extent of detected deformation processes, rather than their exact geographical boundaries, which is a limitation of the technique. In addition, InSAR can only measure the LOS (line of sight) component of any actual movement. Consequently, the measurement sensitivity is directly influenced by the angle between the direction of movement and the LOS: the smaller this angle, the higher the sensitivity of the technique to detect and measure movement [4,39,40]. Conversely, InSAR’s capability to measure movement is most limited when the motion occurs in a direction completely perpendicular to the LOS, resulting in poor or no detection horizontal motion [4,39,40]. Moreover, the InSAR techniques are suitable for monitoring “extremely slow” and “very slow” landslides, as categorized by Cruden and Varnes (1996) [41], whereas certain landslide types characterized by rapid movements or sudden collapses, such as falls and topples, remain undetectable. In addition, it is well known that InSAR techniques are applicable only to some typologies of land cover (primarily urbanized/built-up areas) since the presence of vegetation causes temporal decorrelation [42].
Despite these limitations, the outputs of the ADAImpact tool can be directly used by Civil Protection decision makers for preliminary screening, enabling the identification of new deformations and the potential acceleration of existing phenomena. Additionally, these outputs help to identify potentially critical situations that warrant further investigation. In this context, we propose a set of guidelines for each potential impact class, intended to assist Civil Protection stakeholders in their decision-making process.
ADAs classified as having a high potential impact should be verified in the field immediately. In these areas, a detailed field-based characterization of the hazard and exposure should be carried out, validating the data from the potential impact assessment matrix. Moreover, the need for any supplementary ground-based monitoring to be combined with remote sensing techniques should be evaluated. Additionally, the physical vulnerability of the exposed buildings and infrastructure, as well as the social vulnerability of the exposed population, should be assessed. In particular, the needs and resources to be mobilized in the case of a potential evacuation of the hazardous area should be evaluated. The owners of the critical equipment/infrastructure exposed to hazardous phenomena should be contacted and should follow the procedures for monitoring deformations. In cases where the preventive evacuation of residential buildings is not justified, residents should be warned about the existing deformation and should be trained to report any visible changes in the deformation pattern affecting buildings and/or infrastructure to the civil protection stakeholders. High-potential-impact ADAs should be revisited in the field, at least, following events of intense or prolonged rainfall, as well as following seismic events.
ADAs classified as having a medium potential impact should be approached with caution. Specifically, if this classification is due to a high or medium process magnitude associated with landslides or sinkholes, the same protocol used for high-impact ADAs should be applied. The remaining medium potential impact ADAs should be visited in the field, and a detailed characterization of the hazard and exposure should be conducted, validating the data from the potential impact assessment matrix. The owners of the critical equipment/infrastructure exposed to hazardous phenomena should be contacted and should follow the procedures for monitoring deformations. Medium-potential-impact ADAs should be revisited in the field, at least, following events of intense or prolonged rainfall, as well as following seismic events.
ADAs classified as having a low potential impact typically are associated with low to medium process magnitude and exposure. These ADAs should be visited in the field, validating the data from the potential impact assessment matrix. Additionally, low-potential-impact ADAs should be revisited in the field, at least, following events of intense or prolonged rainfall, as well as following seismic events.
In our work, exposure was assessed by combining the building environment with the resident population. We recognize that, in the case of subsidence, commercial and industrial buildings may be as important as—or even more important than—residential buildings. Our model addresses this by allowing the resident population layer to be replaced with a layer representing the present population at different times of the day and on different days of the week.
The annual updates planned for the EGMS datasets (Three datasets in 2025: 2014–2021, 2018–2022 and 2019–2023) will allow for the multi-temporal analysis of the detected ADAs. This will improve the identification of new ADAs and allow for monitoring the evolution of previously identified ones.
One of the primary limitations of using the ADAImpact plugin is its dependence on the prior processing of EGMS data to derive the elements required for classifying process magnitude. While the tool is optimized for EGMS datasets, it remains compatible with alternative input sources, provided that the field structure is maintained. The integration and aggregation of data from different scales and formats pose another challenge, as this can influence the results. Consequently, it is crucial for users to critically analyze the potential impact maps to ensure their reliability and accuracy. Future developments of the ADAImpact tool could include the creation of a web-based version, enabling users to generate or consult potential impact maps without requiring the installation of desktop GIS software or plugins.
The results obtained with the ADAImpact tool demonstrate its value as a significant asset in the field of civil protection. Its capabilities can extend to programs such as the Copernicus Emergency Management Service (Copernicus EMS) by enhancing map production services, particularly for the preparedness (pre-event) and emergency response phases within the disaster risk cycle. These maps can provide critical information on the geographic locations of ADAs, the identification and magnitude of ground deformation processes, exposure maps (e.g., population, infrastructure, and equipment), potential impact assessments, safe locations, evacuation routes, and even post-event change detection. Such detailed insights enable improved situational awareness and decision making for civil protection authorities, ultimately strengthening disaster management strategies.

5. Conclusions

The results obtained using the ADAImpact tool applied to the case studies lead to the following conclusions:
  • The development of the ADAImpact tool enables ordinary users to geographically identify geohazards and ground motion that can have a potential impact on exposed structures, infrastructures and people.
  • The tool can be used across any location in Europe in a simple and intuitive way, utilizing data provided by the EGMS.
  • The ADAImpact is able to evaluate the process magnitude by comprehensively considering all the information included in the ADA map, such as the process type, the velocity, the spatial extent and the temporal evolution of the movement.
  • The exposure assessment methodology is both universal and flexible, allowing the use of open data and considering any critical infrastructure or equipment existing in the study area.
  • Categorizing potential impact with the ADAImpact tool enables civil protection decision makers to establish priorities and define actions to safeguard people and property, following specific guidelines for each impact class.
  • The cartographic results related to process magnitude, exposure (population and buildings), and potential impact constitute valuable products for programs such as the Copernicus Emergency Management Service.

Author Contributions

Conceptualization: Nelson Mileu and José Luís Zêzere; Writing—original draft: Nelson Mileu and José Luís Zêzere; Writing—review and editing: Nelson Mileu, Anna Barra, Pablo Ezquerro and José Luís Zêzere; Software: Nelson Mileu; Methodology: Nelson Mileu and José Luís Zêzere; Investigation: Nelson Mileu; Formal analysis: Nelson Mileu; Validation: Anna Barra, Pablo Ezquerro, Sérgio C. Oliveira, Ricardo A. C. Garcia, Raquel Melo, Pedro Pinto Santos, Marta Béjar-Pizarro and Oriol Monserrat; Visualization: Anna Barra, Pablo Ezquerro, Sérgio C. Oliveira, Ricardo A. C. Garcia, Raquel Melo, Pedro Pinto Santos, Marta Béjar-Pizarro and Oriol Monserrat; Project administration: Anna Barra. All authors have read and agreed to the published version of the manuscript.

Funding

This work is part of the Project EGMS RASTOOL-DoS: European Ground Motion Risk Assessment Tools—Downstream Service, Co-financed by the EU—Union Civil Protection Mechanism (UCPM-2024-KAPP-PP—101193210) and JDC2023-052719-I, financed by MCIU/AEI/10.13039/501100011033 y and FSE+.

Data Availability Statement

The original data presented in the study are openly available in Zenodo at https://doi.org/10.5281/zenodo.16050408.

Conflicts of Interest

The authors declare no conflicts of interest.

References

  1. Salichon, J.; Le Cozannet, G.; Modaressi, H.; Hosford, S.; Missotten, R.; McManus, K.; Marsh, S.; Paganini, M.; Ishida, C.; Plag, H.P.; et al. 2nd IGOS Geohazards Theme Report; BRGM: Orléans, France, 2007; pp. 1–87.
  2. EMDAT. The Emergency Events Database; UCL–CRED: Brussels, Belgium, 2019; Available online: www.emdat.be (accessed on 10 August 2025).
  3. Asteris, P.G.; Cavaleri, L.; di Trapani, F.; Macaluso, G.; Scaduto, G. Definition of Seismic Vulnerability Maps for Civil Protection Systems: The Case of Lampedusa Island. Open Constr. Build. Technol. J. 2016, 10, 87–105. [Google Scholar] [CrossRef]
  4. Solari, L.; Barra, A.; Herrera, G.; Bianchini, S.; Monserrat, O.; Béjar-Pizarro, M.; Crosetto, M.; Sarro, R.; Moretti, S. Fast detection of ground motions on vulnerable elements using Sentinel-1 InSAR data. Geomat. Nat. Hazards Risk 2018, 9, 152–174. [Google Scholar] [CrossRef]
  5. Wania, A.; Joubert-Boitat, I.; Dottori, F.; Kalas, M.; Salamon, P. Increasing timeliness of satellite-based flood mapping using early warning systems. Remote Sens. 2021, 13, 2114. [Google Scholar] [CrossRef]
  6. Barra, A.; Cuevas-González, M.; Navarro, J.; Béjar-Pizarro, M.; Ezquerro, P.; Bianchini, S.; Zezere, J.L.; Medici, C.; Del Soldato, M.; Palamà, R.; et al. ADATools: Free and User-Friendly Tools to Semiautomatically Extract and Analyse Wide PSI Displacement Maps; EGU General Assembly: Vienna, Austria, 2024; EGU24-20708. [Google Scholar] [CrossRef]
  7. Costantini, M.; Minati, F.; Trillo, F.; Ferretti, A.; Novali, F.; Passera, E.; Dehls, J.; Larsen, Y.; Marinkovic, P.; Eineder, M.; et al. European ground motion service (EGMS). In Proceedings of the 2021 IEEE International Geoscience and Remote Sensing Symposium IGARSS, Brussels, Belgium, 11–16 July 2021; pp. 3293–3296. [Google Scholar]
  8. Mirmazloumi, S.M.; Wassie, Y.; Navarro, J.A.; Palamà, R.; Krishnakumar, V.; Barra, A.; Cuevas-González, M.; Crosetto, M.; Monserrat, O. Classification of ground deformation using Sentinel-1 persistent scatterer interferometry time series. GISci. Remote Sens. 2022, 59, 374–392. [Google Scholar] [CrossRef]
  9. Navarro, J.A.; Cuevas, M.; Tomás, R.; Barra, A.; Crosetto, M. A toolset to detect and classify active deformation areas using Interferometric SAR Data. In Proceedings of the 5th International Conference on Geographical Information Systems Theory, Applications and Management—GISTAM, Crete, Greece, 3–5 May 2019; pp. 167–174. [Google Scholar] [CrossRef]
  10. Tarpanelli, A.; Mondini, A.C.; Camici, S. Effectiveness of Sentinel-1 and Sentinel-2 for flood detection assessment in Europe. Nat. Hazards Earth Syst. Sci. 2022, 22, 2473–2489. [Google Scholar] [CrossRef]
  11. Capes, R.; Passera, E. Product Description and Format Specification. EGMS v2.0. Copernicus Land Tech Libr. 2023. Available online: https://land.copernicus.eu/.../egms-product-description-document/ (accessed on 15 January 2024).
  12. Donezar-Hoyos, U.; Albizua-Huarte, L.; Amezketa-Lizarraga, E.; Barinagarrementeria-Arrese, I.; Ciriza, R.; De Blas-Corral, T.; Larrañaga-Urien, A.; Ros-Elso, F.; Tamés-Noriega, A.; Viñuales-Lasheras, M.; et al. The Copernicus EMS validation service as a vector for improving the emergency mapping based on Sentinel data. Rev. Teledetec. 2020, 56, 23–34. [Google Scholar] [CrossRef]
  13. Mastrantoni, G.; Masciulli, C.; Marini, R.; Esposito, C.; Mugnozza, G.S.; Mazzanti, P. A novel model for multi-risk ranking of buildings at city level based on open data: The test site of Rome, Italy. Geomat. Nat. Hazards Risk 2023, 14, 2275541. [Google Scholar] [CrossRef]
  14. López-Vinielles, J.; Ezquerro, P.; Béjar-Pizarro, M.; Sarro, R.; Cuevas-González, M.; Barra, A.; Mateos, R.M. Potential socio-economic impacts of ground movements in the coastal municipalities of Spain: Insights from the supra-regional implementation of the European Ground Motion Service. Ocean Coast. Manag. 2024, 259, 107452. [Google Scholar] [CrossRef]
  15. QGIS. QGIS Download. 2024. Available online: https://www.qgis.org/download/ (accessed on 15 January 2024).
  16. InaSAFE. InaSAFE: Free Software for Natural Hazard Impact Modelling. 2023. Available online: https://inasafe.org (accessed on 10 September 2025).
  17. GEM Foundation; CEDIM. Integrated Risk Modelling Toolkit (IRMT), User Manual (Release 3.16.1). QGIS Plugin. 2023. Available online: https://docs.openquake.org/oq-irmt-qgis/v3.16.1/ (accessed on 10 September 2025).
  18. Barra, A.; Solari, L.; Béjar-Pizarro, M.; Monserrat, O.; Bianchini, S.; Herrera, G.; Moretti, S. A methodology to detect and update active deformation areas based on Sentinel-1 SAR images. Remote Sens. 2017, 9, 1002. [Google Scholar] [CrossRef]
  19. Monserrat, O.; Barra, A.; Béjar-Pizarro, M.; Rivera, J.S.; Galve, J.P.; Guardiola, C.; Cuevas-González, M.; Mateos, R.M.; Ezquerro, P.; Azañon, J.M.; et al. ADATools: Free and easy-to-use tools for semi-automatically extracting and analysing multitemporal interferometric displacement maps. Int. Arch. Photogramm. Remote Sens. Spat. Inf. Sci. 2024, 48, 351–356. [Google Scholar] [CrossRef]
  20. UNDRR. Global Assessment Report on Disaster Risk Reduction (GAR2019); United Nations Office for Disaster Risk Reduction: Geneva, Switzerland, 2019. [Google Scholar]
  21. IPCC. Climate Change 2014: Impacts, Adaptation, and Vulnerability. Part A: Global and Sectoral Aspects; Cambridge University Press: Cambridge, UK; New York, NY, USA, 2014; 1132p. [Google Scholar]
  22. Varnes, D.J. Landslide Hazard Zonation: A Review of Principles and Practice; UNESCO: Paris, France, 1984. [Google Scholar]
  23. Guzzetti, F.; Carrara, A.; Cardinali, M.; Reichenbach, P. Landslide hazard evaluation: A review of current techniques and their application in a multiscale study, Central Italy. Geomorphology 1999, 31, 181–216. [Google Scholar] [CrossRef]
  24. Maiti, S.; Jha, S.K.; Garai, S.; Nag, A.; Bera, A.; Paul, V.; Upadhaya, R.; Deb, S. An assessment of social vulnerability to climate change among the districts of Arunachal Pradesh, India. Ecol. Indic. 2017, 77, 105–113. [Google Scholar] [CrossRef]
  25. Contreras, D.; Chamorro, A.; Wilkinson, S. The spatial dimension in the assessment of urban socio-economic vulnerability related to geohazards. Nat. Hazards Earth Syst. Sci. 2020, 20, 1663–1687. [Google Scholar] [CrossRef]
  26. Santos, P.P.; Zêzere, J.L.; Pereira, S.; Rocha, J.; Tavares, A.O. A novel approach to measuring spatiotemporal changes in social vulnerability at the Local Level in Portugal. Int. J. Disaster Risk Sci. 2022, 13, 842–861. [Google Scholar] [CrossRef]
  27. United Nations. Report of the Open-Ended Intergovernmental Expert Working Group on Indicators and Terminology Relating to Disaster Risk Reduction; A/71/644; United Nations Office for Disaster Risk Reduction: Geneva, Switzerland, 2016. [Google Scholar]
  28. Alexander, D. Models of Social Vulnerability to Disasters. RCCS Annu. Rev. 2012, 4, 22–40. [Google Scholar] [CrossRef]
  29. Marulanda Fraume, M.C.; Cardona, A.O.D.; Fraume, P.M.; T, M.-L.C.; Barbat, A.H. Evaluating risk from a holistic perspective to improve resilience: The United Nations evaluation at global level. Saf. Sci. 2020, 127, 104739. [Google Scholar] [CrossRef]
  30. Guzzetti, F.; Ardizzone, F.; Cardinali, M.; Rossi, M.; Valigi, D. Landslide Volumes and Landslide Mobilization Rates in Umbria, Central Italy. Earth Planet. Sci. Lett. 2009, 279, 222–229. [Google Scholar] [CrossRef]
  31. Gutiérrez, F.; Parise, M.; De Waele, J.; Jourde, H. A review on natural and human-induced geohazards and impacts in karst. Earth-Sci. Rev. 2014, 138, 61–88. [Google Scholar] [CrossRef]
  32. Froude, M.J.; Petley, D.N. Global fatal landslide occurrence from 2004 to 2016. Nat. Hazards Earth Syst. Sci. 2018, 18, 2161–2181. [Google Scholar] [CrossRef]
  33. Schiavina, M.; Freire, S.; Carioli, A.; MacManus, K. GHS-POP R2023A—GHS Population Grid Multitemporal (1975–2030); JRC, European Commission: Brussels, Belgium, 2023. [Google Scholar]
  34. Melchiorri, M.; Pesaresi, M.; Florczyk, A.J.; Corbane, C.; Kemper, T. Principles and applications of the global human settlement layer as Baseline for the Land Use Efficiency Indicator—SDG 11.3.1. ISPRS Int. J. Geo-Inf. 2019, 8, 96. [Google Scholar] [CrossRef]
  35. Pesaresi, M.; Huadong, G.; Blaes, X.; Ehrlich, D.; Ferri, S.; Gueguen, L.; Halkia, M.; Kauffmann, M.; Kemper, T.; Lu, L.; et al. A global human settlement layer from optical HR/VHR RS data: Concept and First Results. IEEE J. Sel. Top. Appl. Earth Obs. Remote Sens. 2013, 6, 2102–2131. [Google Scholar] [CrossRef]
  36. Freire, S.; MacManus, K.; Pesaresi, M.; Doxsey-Whitfield, E.; Mills, B. Development of new open and free multi-temporal global population spatial raster datasets at 250 m resolution. In Proceedings of the Geospatial Data in a Changing World, AGILE, Helsinki, Finland, 14–17 June 2016. JRC100523. [Google Scholar]
  37. Geofabrik. Geofabrik Download Server. 2018. Available online: https://download.geofabrik.de/ (accessed on 15 July 2023).
  38. Barra, A.; Reyes-Carmona, C.; Herrera, G.; Galve, J.P.; Solari, L.; Mateos, R.M.; Azañón, J.M.; Béjar-Pizarro, M.; López-Vinielles, J.; Palamà, R.; et al. From Satellite Interferometry Displacements to Potential Damage Maps: A Tool for Risk Reduction and Urban Planning. Remote Sens. Environ. 2022, 282, 113294. [Google Scholar] [CrossRef]
  39. Bru, G.; Ezquerro Martín, P.; López-Vinielles, J.; Reyes-Carmona, C.; Guardiola-Albert, C.; Béjar Pizarro, M. Manual Básico sobre el Uso de Datos InSAR para Medir Desplazamientos de la Superficie del Terreno; CSIC—Instituto Geológico y Minero de España (IGME): Madrid, Spain, 2024; Available online: https://digital.csic.es/handle/10261/360969 (accessed on 10 September 2025).
  40. Talledo, D.A.; Miano, A.; Bonano, M.; Di Carlo, F.; Lanari, R.; Manunta, M.; Meda, A.; Mele, A.; Prota, A.; Saetta, A.; et al. Satellite Radar Interferometry: Potential and Limitations for Structural Assessment and Monitoring. J. Build. Eng. 2022, 46, 103756. [Google Scholar] [CrossRef]
  41. Cruden, D.M.; Varnes, D.J. Landslide Types and Processes. In Landslides: Investigation and Mitigation, Special Report 247; Turner, A.K., Schuster, R.L., Eds.; Transportation Research Board, National Research Council, National Academy Press: Washington, DC, USA, 1996; pp. 36–75. [Google Scholar]
  42. Bianchini, S.; Solari, L.; Bertolo, D.; Thuegaz, P.; Catani, F. Integration of Satellite Interferometric Data in Civil Protection Strategies for Landslide Studies at a Regional Scale. Remote Sens. 2021, 13, 1881. [Google Scholar] [CrossRef]
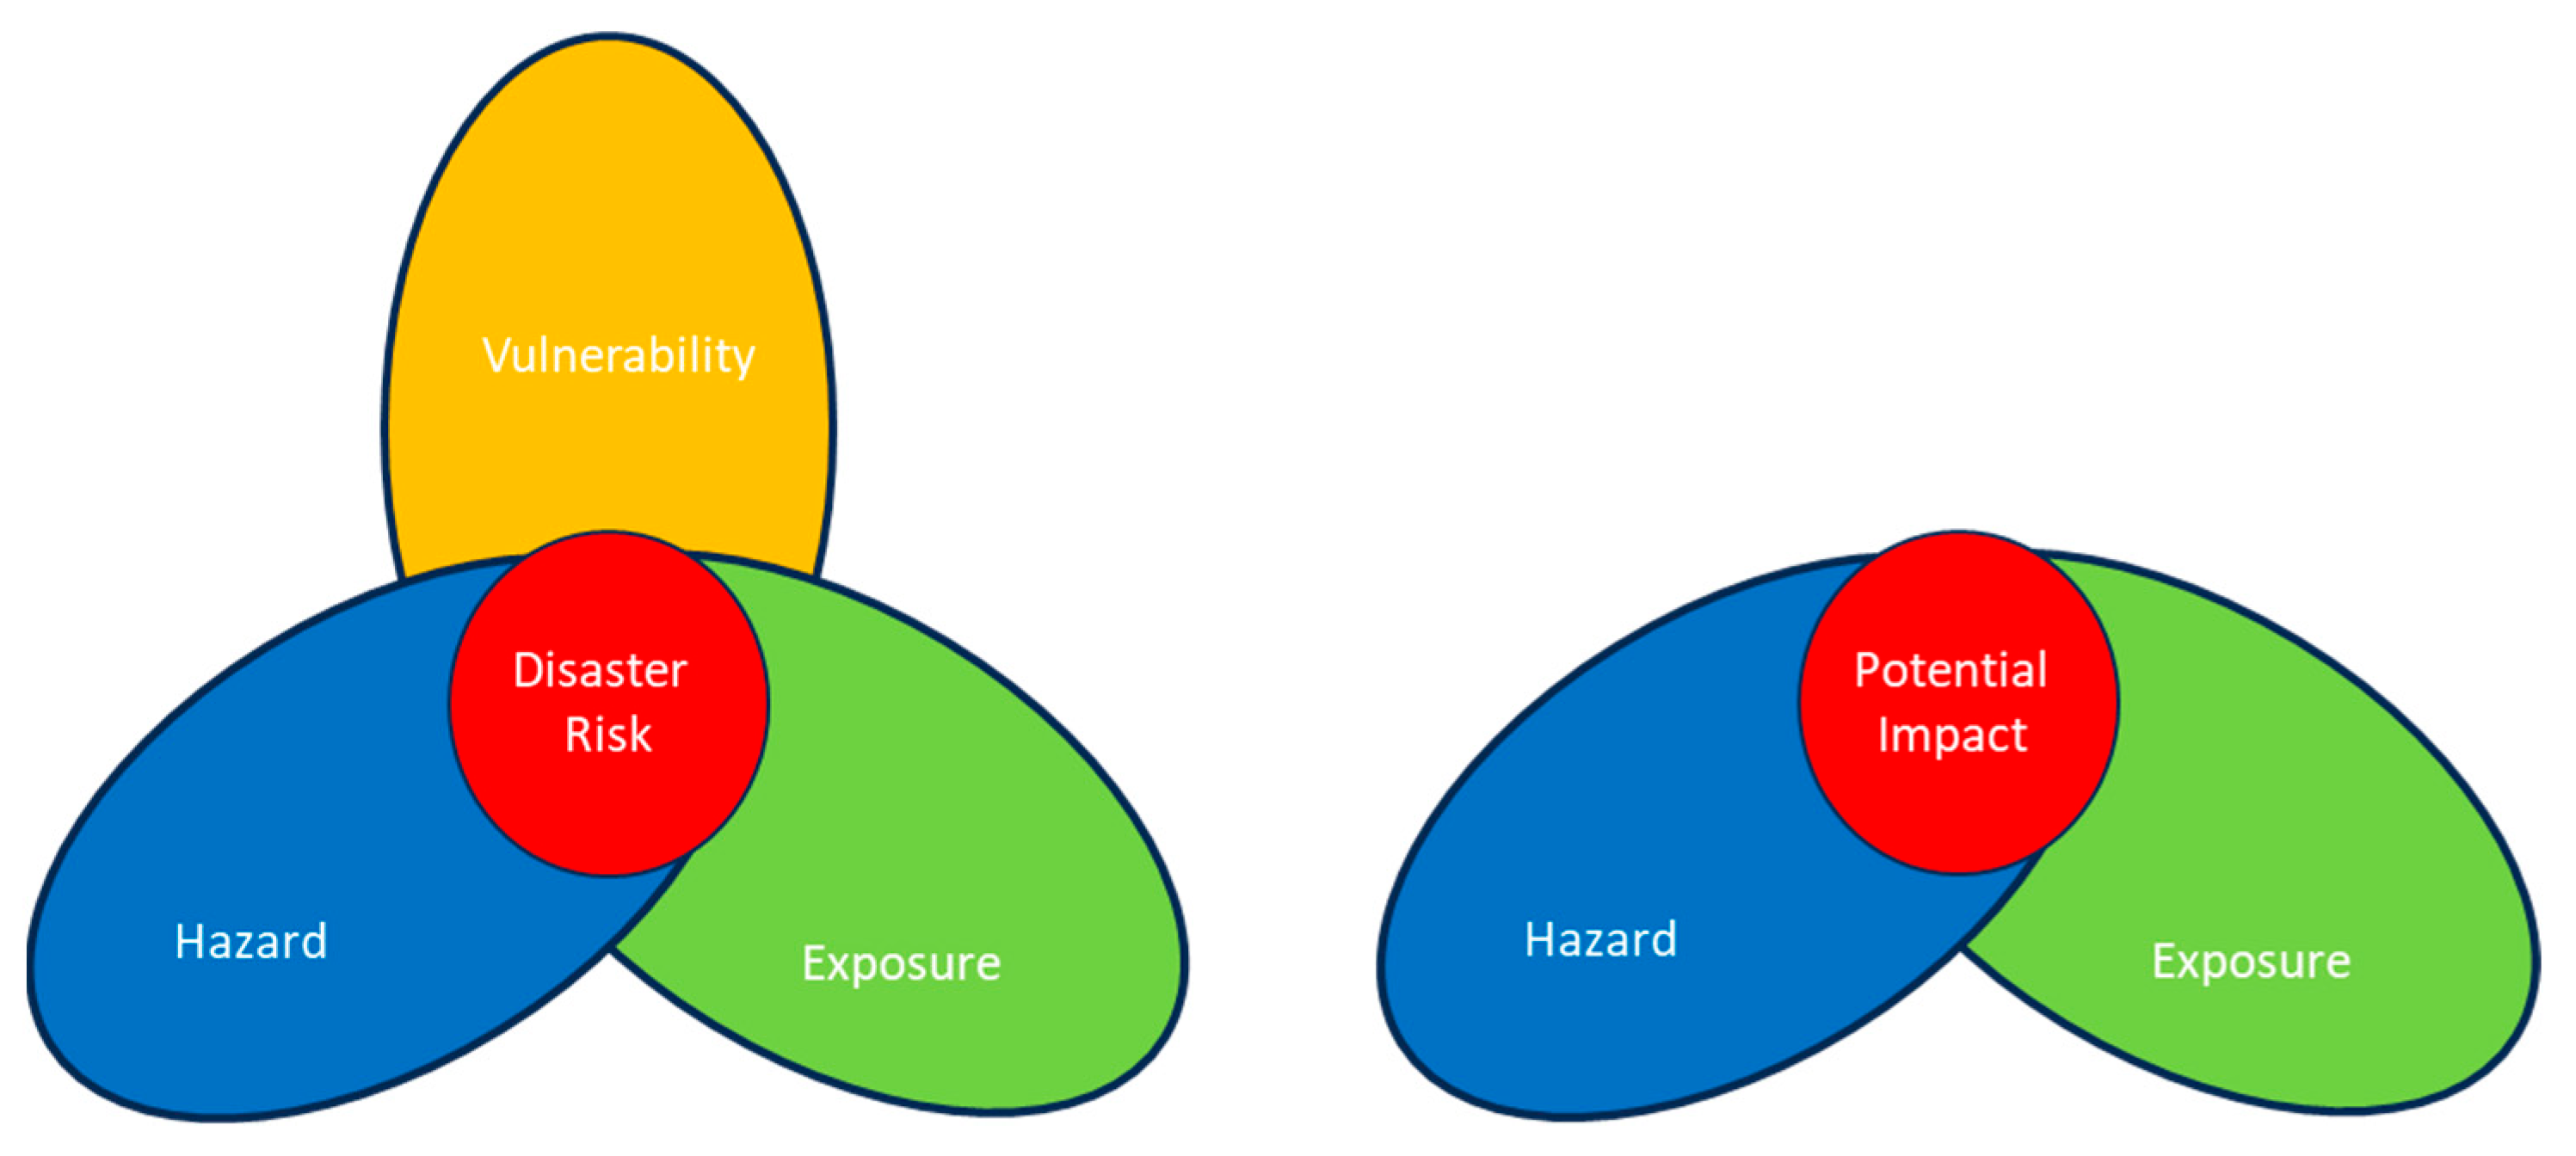
Figure 1. Conceptual Framework of Potential Impact Derived from the Disaster Risk Concept.
Ijgi 14 00389 g001
Figure 2. QGIS ADAImpact methodology flowchart.
Ijgi 14 00389 g002
Figure 3. Matrices for assessing Process Magnitude based on ADA size and ADA velocity, combined with different velocity trends: (a) stable velocity (TS_class = 2), applied to all processes; (b); increasing velocity (TS_class= 3), applied to all processes; (c) decreasing velocity (TS_class = 1), applied to subsidence, settlement and uplift. For landslide and sinkhole, the matrix shown in panel (a) should be applied.
Ijgi 14 00389 g003
Figure 4. Matrices for assessing Exposure based on exposed buildings and exposed population: (a) without critical infrastructures or equipment within the ADA; (b) with critical infrastructures or equipment within the ADA.
Ijgi 14 00389 g004
Figure 5. Matrix to assess Potential Impact based on Process Magnitude and Exposure.
Ijgi 14 00389 g005
Figure 6. QGIS ADAImpact Plugin interface.
Ijgi 14 00389 g006
Figure 7. Building area along the Granada (Spain) coastal zone retrieved form the GHS-BUILT-S R2023A- GHS.
Ijgi 14 00389 g007
Figure 8. Population along the Granada (Spain) coastal zone retrieved form the GHS-POP_GLOBE_R2023A.
Ijgi 14 00389 g008
Figure 9. Study areas: 1—Portugal–Spain border; 2—Granada coastal area.
Ijgi 14 00389 g009
Figure 10. ADAs process magnitude (a) exposure (b) and potential impact (c) along the Portugal/Spain border.
Ijgi 14 00389 g010
Figure 11. ADAs process magnitude (a) exposure (b) and potential impact (c) along the Granada coastal zone.
Ijgi 14 00389 g011
Figure 12. Road segments exposed to landslide deformation along the Granada coastal zone.
Ijgi 14 00389 g012
Figure 13. Process magnitude of deformation affecting roads along the Granada coastal zone.
Ijgi 14 00389 g013
Figure 14. Observed building damages in Isla Canela (southern Spain, within the Portugal–Spain border).
Ijgi 14 00389 g014
Table 1. Exposed critical infrastructures and equipment layers.
DescriptionLayerExtracted classesSource
Railwaysgis_osm_railways_free_1All classesOSM
Roadsgis_osm_roads_free_1Motorway, Motorway link, Primary, Trunk, Trunk linkOSM
Infrastructure and equipmentgis_osm_traffic_a_free_1‘dams’, ‘marina’ and ‘fuel’OSM
gis_osm_builings_a_free_1‘airport terminal’, ‘fire station’, ‘hospital’, ‘police station’, ‘school’, ‘train station’ and ‘university’
gis_osm_transport_a_free_1‘airfield’, ‘airport’ and ‘ferry terminal
Disclaimer/Publisher’s Note: The statements, opinions and data contained in all publications are solely those of the individual author(s) and contributor(s) and not of MDPI and/or the editor(s). MDPI and/or the editor(s) disclaim responsibility for any injury to people or property resulting from any ideas, methods, instructions or products referred to in the content.