1. Introduction
“People-centered” and “socially sustainable development” principles have emerged as paramount guiding principles in global urban regeneration efforts aimed at achieving sustainable urban development [
1,
2,
3]. In China, the 14th five-year national plan transformed urban development’s orientation from “incremental expansion” to “quality improvement”, aiming at improving the quality of life (QoL) through people-oriented urban regeneration [
1,
4,
5]. Against this background, urban regeneration in China stands as a pivotal force driving improvements in urban configuration, components, and the QoL for urban residents [
2,
3,
6]. Upon re-evaluating the conditions of existing residential communities [
7], a socially sustainable perspective (SSP) proves indispensable for realizing high-quality urbanization and aiding in regeneration decision making [
8,
9]. The current urban regeneration practices are predominantly guided by top-down policy making and project-based implementations with similar spatial intervention strategies [
10,
11]. Unfortunately, these approaches often undervalue aspects such as public participation, social equity, and other critical factors essential for creating socially sustainable communities [
12]. A socially sustainable community is characterized by creating livable, inclusive, and equitable environments that cater to all residents’ needs and uphold social justice principles [
13,
14]. Achieving this requires urban regeneration to be more proactive in enhancing urban quality [
15,
16,
17].
Measuring community quality is a practical approach that significantly contributes to attaining social sustainability in urban regeneration [
5]. Developing an assessment-framework-driven multidimensional quantitative model (MQM) proves indispensable for informing community regeneration policies, planning initiatives, and design decision making [
18]. However, research on community quality in urban regeneration falls short of comprehensively capturing these intricate dynamics [
19,
20]. Simultaneously, the qualitative approach to gathering city-wide information about quality measures often poses challenges and lacks generalizability [
21]. Furthermore, the absence of a coordinated exploration of quality-influence factors at the community scale hampers accurate quality measurement. The emergence and advancement of information and communication technology have yielded abundant available open and multi-sourced geospatial data, including Point of Interest (POI), area of interest (AOI), Weibo check-ins, Dianping, and other GIS-based data. This technological evolution forms the basis for advancing quantitative research and propels urban studies into an unprecedented era [
22,
23]. Against this backdrop, this research aims to construct a quantitative measurement model of community quality based on multi-sourced geospatial data, providing a more comprehensive and integrated assessment framework.
Quantifying community quality through integrating diverse data sources at the community level emerges as an effective strategy to explore sustainable land use, bolster land management, and enhance overall sustainability. This approach can potentially assist urban planners and policymakers in advancing socially sustainable urban development, a critical component in pursuing sustainable development goals [
19,
20]. By leveraging multi-sourced data such as satellite imagery, social media, and community surveys, researchers can capture and analyze various aspects of community quality, such as economic activity, social cohesion, and environmental quality. MQM-based analysis can inform policies and planning decisions prioritizing community well-being and fostering long-term sustainability [
18]. The utilization of multi-sourced geospatial data for quantifying community quality catalyzes the promotion of more equitable and sustainable development practices at the community level.
To be more specific, this study focuses on the following research questions:
How to form an analysis framework with MQM to evaluate community quality based on the SSP?
How to quantitatively weigh the variables’ contribution in multi-sourced geospatial data to measure community quality and verify the MQM assessment?
What regeneration planning and design strategies could be implemented based on the MQM analysis results?
The structure of this paper unfolds in the following manner: First, a comprehensive assessment framework centered around the multidimensional quantitative model (MQM) for measuring community quality is introduced, accompanied by a thorough review of the pertinent literature. Secondly, this paper delineates the methods for acquiring relevant data and correlated analytical approaches. Moving forward, the third section delves into the intricacies of the community quality measurement variables, which were judiciously weighed using the Analytic Hierarchy Process (AHP). Subsequently, the quality analysis based on the MQM is introduced and substantiated through an AI-based semantic analysis applied to street view images. Finally, the paper concludes with a detailed exploration of research discussions and a comprehensive summarization of the key conclusions. The relevant contents were added and contend to differentiate between the assessment and strategy formulation stages. In
Section 5.1 and
Section 5.2, the illustration highlights the role and contributions of the MQM in assessing community quality. In
Section 5.3, the proposed regeneration strategies are considered preliminary applications and perspectives based on the assessment results to enhance the research objectives.
3. Research Data and Methods
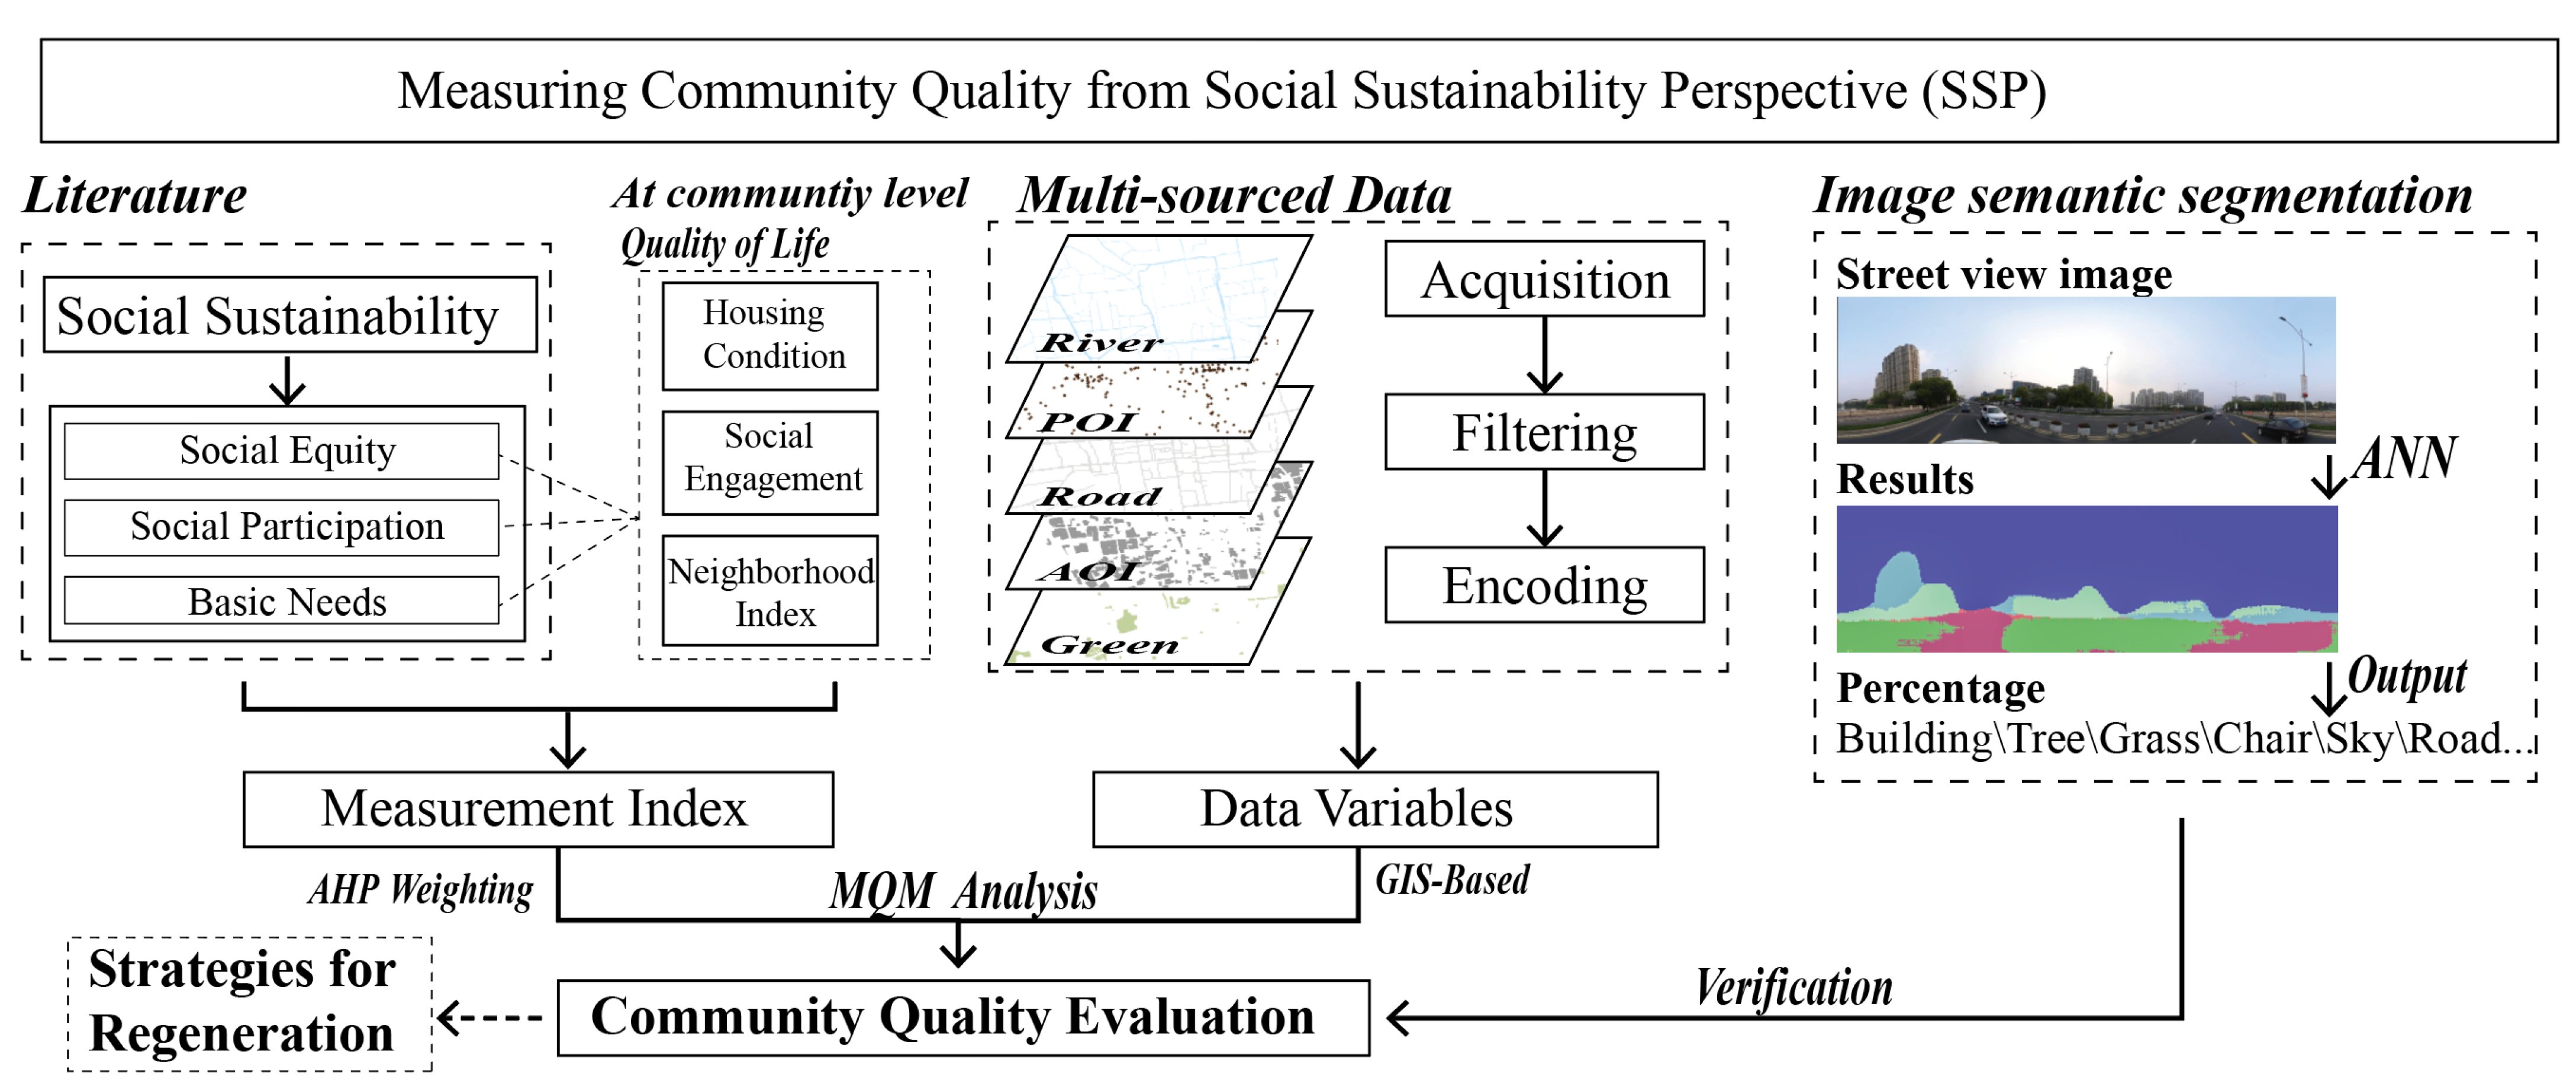
This research constructs an MQM based on the SSP. Commencing with residents’ demands, the study meticulously organizes measurement methods and content for assessing urban community quality, specifically focusing on social equity, social participation, and basic needs. This process results in the formulation of an MQM-based community quality evaluation system derived from the SSP. The content of this evaluation system is meticulously curated through an extensive literature review. Furthermore, to enrich the evaluation process, an Application Programming Interface (API) and web crawler are utilized to gather emerging data, such as the area of interest (AOI) and Point of Interest (POI). The community’s quality is then evaluated by combining this acquired content. Building upon this foundation, machine learning techniques are applied to conduct image semantic segmentations on street view images surrounding the community. The resulting evaluation outcomes undergo rigorous verification through quantitative analysis. Subsequently, community regeneration strategies are fine-tuned in alignment with the evaluation findings. The research framework of this project, as illustrated in
Figure 2, encapsulates the intricate process of integrating the SSP, MQM, and advanced technologies to holistically assess and optimize community quality.
3.1. Study Area
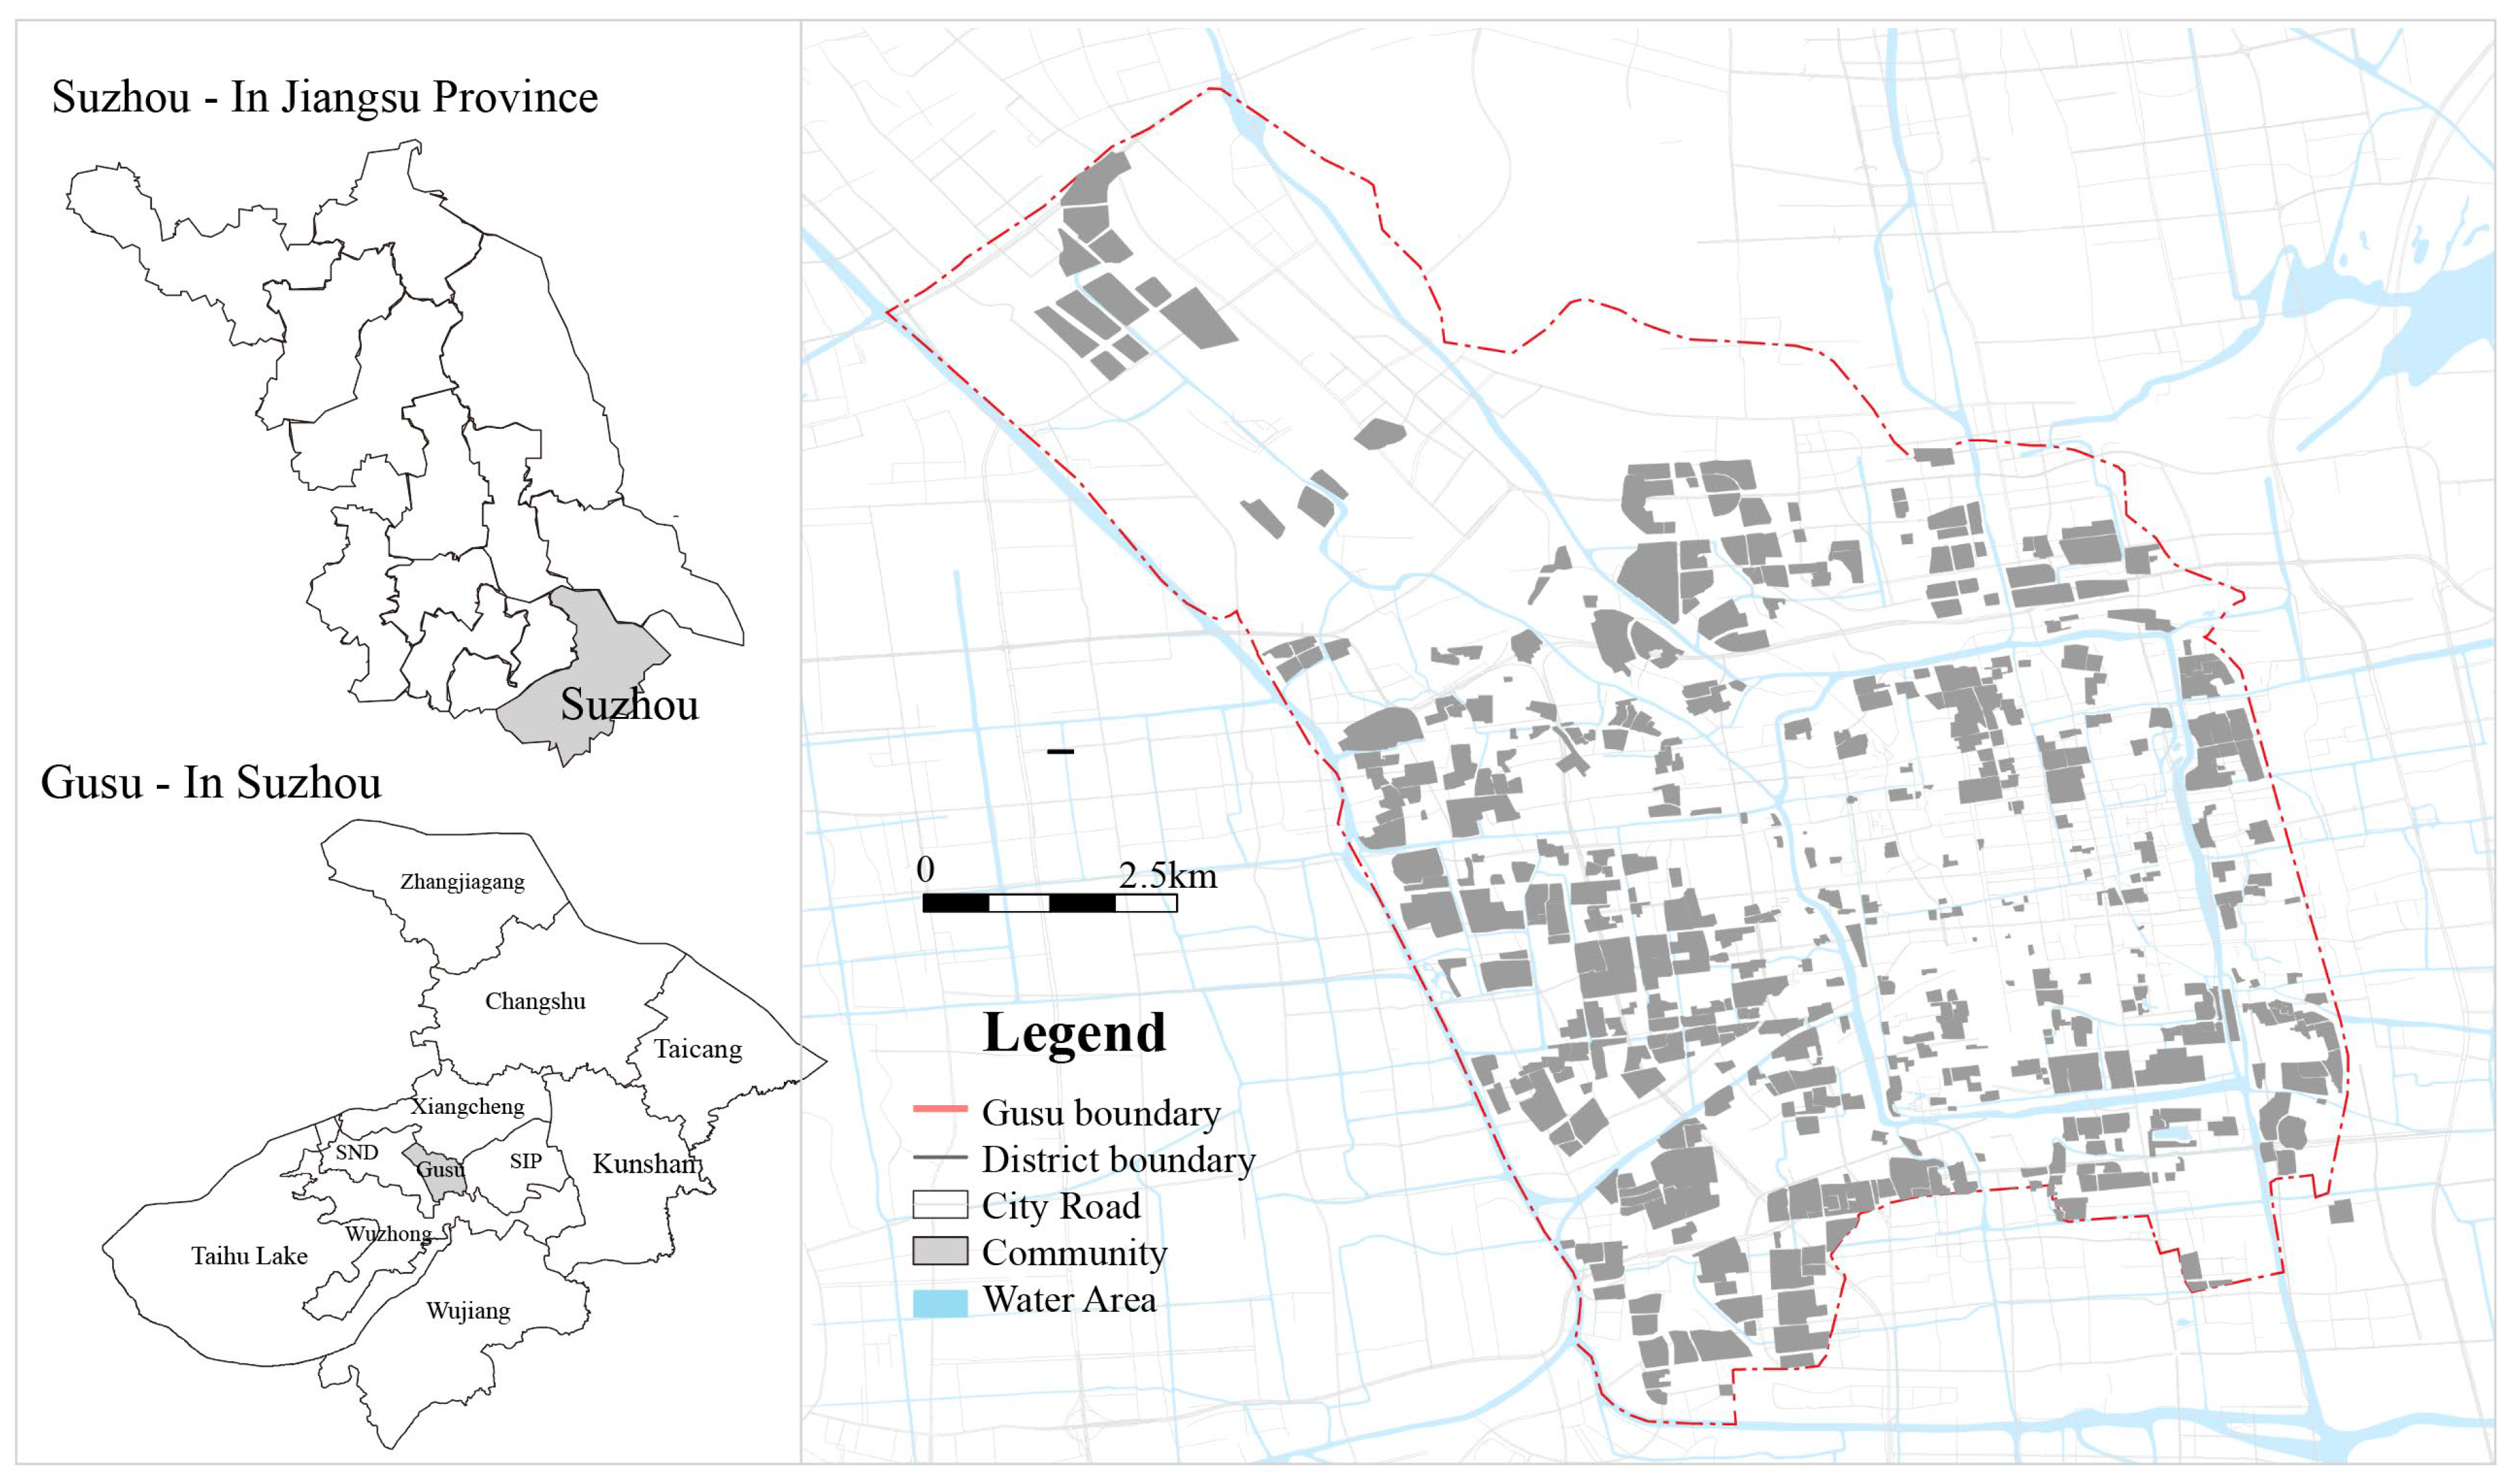
This research selects the Gusu district of Suzhou, Jiangsu Province, as the research case, one of China’s first pilot cities to explore urban regeneration (
Figure 3). The exploration of the urban fabric of Gusu district has great reference significance for formulating urban regeneration guidance that will affect future regeneration in China. The rationale for choosing the Gusu district of Suzhou as the focus for applying the MQM is twofold. Firstly, the Gusu district features a concentration of renewal projects in older urban communities with high population densities. This area is a hub of extensive patent activities, commercial outlets, and public facilities, complemented by a vibrant social-media-user community. The geospatial and behavioral data in Gusu district provide the multidimensional data support required to analyze the MQM model. Secondly, Gusu district, serving as the core area of Suzhou, embodies a blend of profound historical and cultural depth with the typical characteristics of modern urban development. This unique combination of traditional and contemporary attributes makes the Gusu district an exemplary urban community model. The insights derived from measuring the community QoL here hold substantial reference value for similar regions nationwide. Moreover, Gusu district is China’s first and only national historical and cultural conservation district, with a lot of architectural heritage, including classical gardens, ancient buildings, and historic streets [
68]. Therefore, the regeneration of the physical environment is strictly restricted by laws and regulations, making it an ideal case to explore urban regeneration based on social sustainability.
3.2. Research Data
According to the division method of residential areas identified in the “Planning and Design Standards for Urban Residential Areas (GB50180-2018)” issued by the Ministry of Housing and Urban–Rural Development of the People’s Republic of China, this study selects the “Neighborhood block”, the minor residential area, as the unit [
69]. In addition, starting from the neighborhood block, the area within 300 m of it is established as the buffer zone, which serves as the boundary of our data analysis.
The data analyzed in this research mainly include two categories:
The first category is the AOI data within the established buffer zone. AOI data are the carriers for the analysis and expression of residential units, and the area of interest is shown in the digital map, with clear geographical boundaries [
70];
The second category of data is the basic information and indicators. The researchers obtained the AOI data of neighborhood blocks in Gusu district, Suzhou, through the Application Programming Interface (API) provided by Gaode Map.
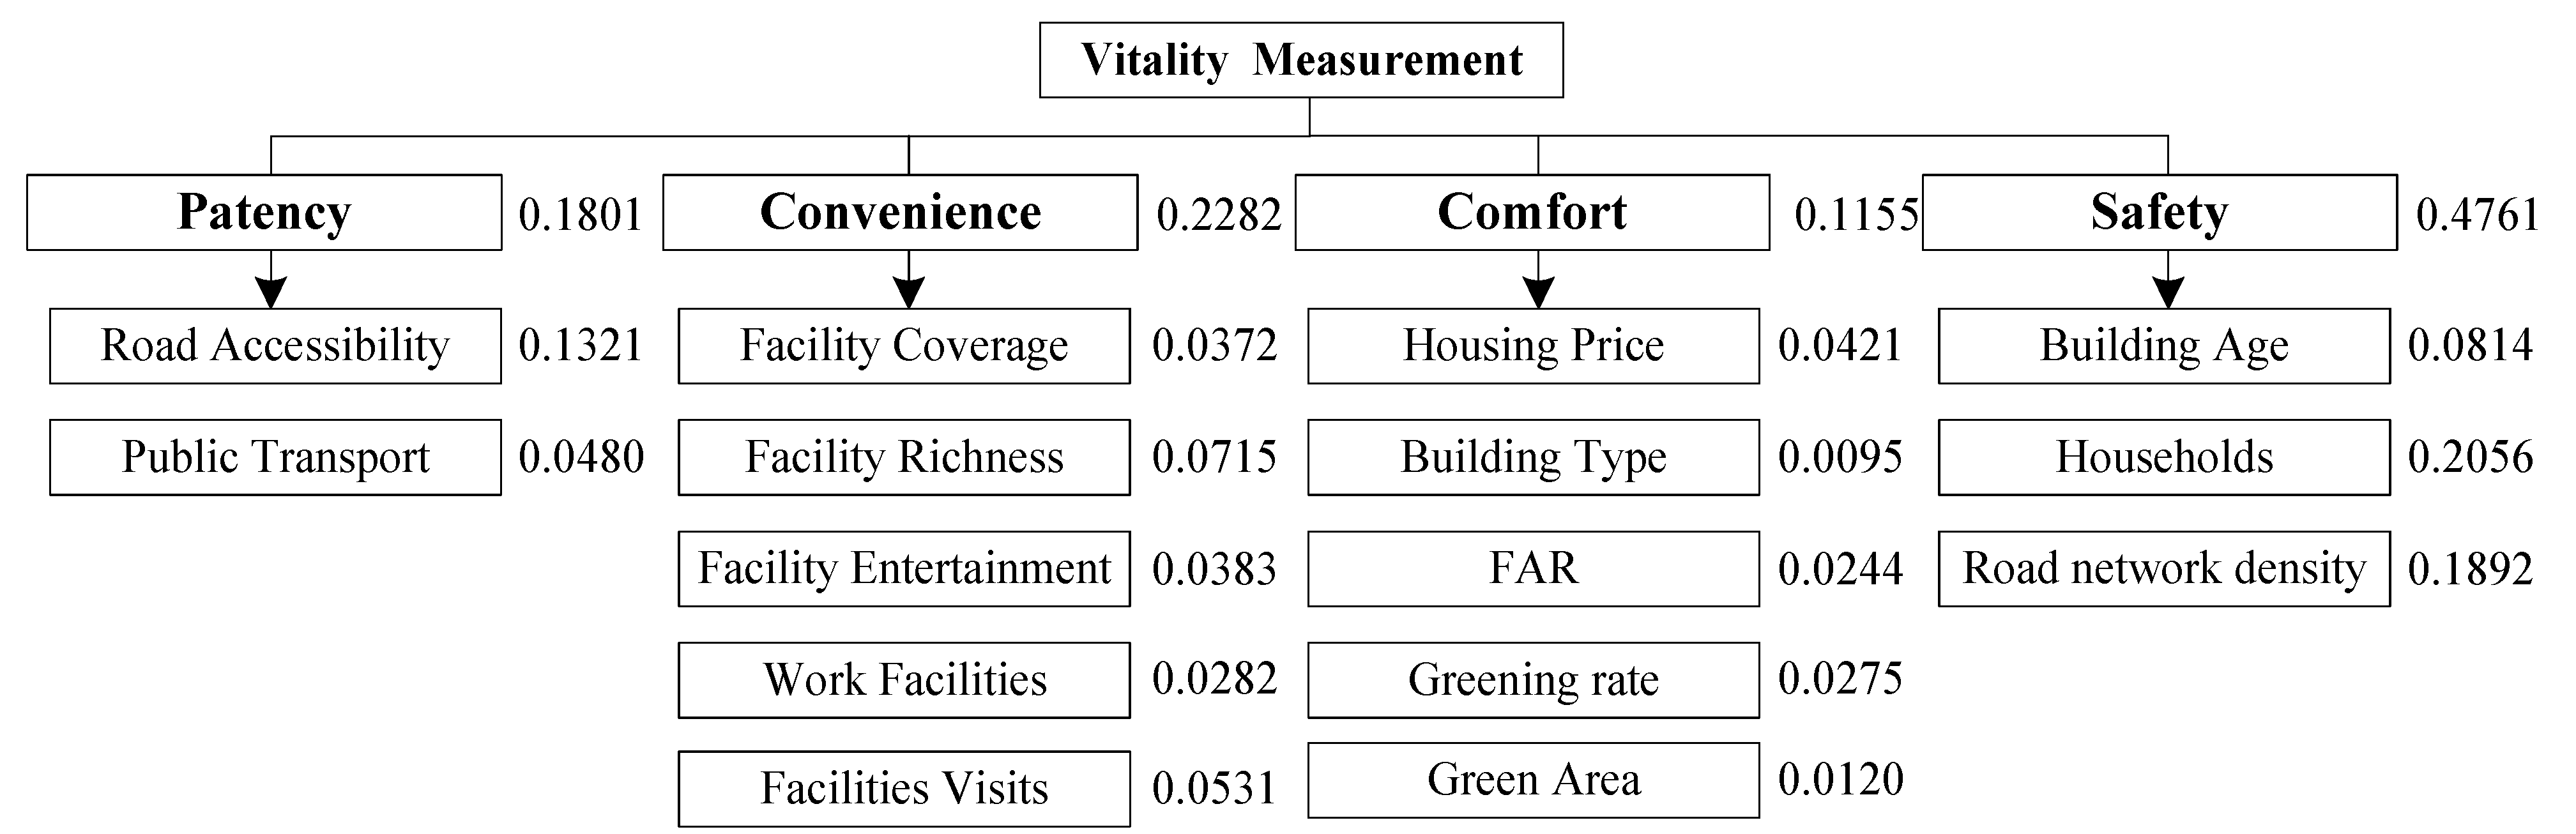
After the acquired data were corrected using geographic coordinates and deduplicated, 538 residential communities with geographical boundaries were obtained. According to the community quality measurement model proposed in this study, 538 residential communities were evaluated. The data were divided into four categories for analysis, namely patency (including road accessibility and public transport stations), convenience (facility coverage, facility richness, facility entertainment, and work facilities), comfort (housing price, building type, FAR, greening rate, and green area), and safety (building age, households, and road network density) (
Figure 4).
Moreover, the relevant point data, including POI data and traffic station data, were obtained through API provided by Gaode Map. The POI data were specific places where people gather and conduct daily activities, which are significant for urban planners to evaluate in terms of their functionalities, vibrancy, and developments [
71,
72]. After screening and induction, a total of 25,489 relevant POI data were included in the research analysis. The traffic station data include bus and subway stations, and 11,190 traffic station data were included in the research and analysis. Moreover, a total of 15,241 user check-in data in 2022 were obtained through the API provided by Sina Weibo for analysis and research. Based on the public review the API interface to obtain food stores, a total of 88,475 relevant point data were included in the research and analysis after screening and induction; 7422 images from the panorama of street view images captured from Baidu street view were used for quality verification analysis (
Table 1).
3.3. Research Methodology
3.3.1. Selection of Measurement Evaluation Indicators
From the SSP, the community quality evaluation system is mainly carried out from three levels: social equity, social participation, and basic needs. The impact of different levels on community quality varies. Therefore, based on the relevant literature, the measurement indicators in the evaluation system are sorted out and coded according to different measurement dimensions. Previous studies have indicated a positive correlation between the number of households and community safety. Communities with more households tend to have more comprehensive security measures, thereby increasing residents’ sense of safety [
38]. Additionally, the stability of housing prices is widely regarded as an important indicator for evaluating the quality of community spaces [
26,
27,
28]. The level and fluctuation of housing prices can reflect residents’ satisfaction with their living areas and the overall environmental quality. Furthermore, it can shed light on the combined effects of community safety, educational resources, and transportation convenience. Moreover, road network density is closely associated with both safety and accessibility. From a safety perspective, an appropriate road network density helps disperse traffic and pedestrian flow, reducing congestion and the risk of accidents and enhancing safety. From an accessibility perspective, a dense road network provides more travel route options, improving accessibility between various points within the area, effectively reducing travel time, and enhancing the convenience of commuting or daily life [
69]. The specific content is as follows (
Table 2):
Patency: indicators include road accessibility and public transport stations;
Convenience: facility coverage, facility richness, facility entertainment, and facility visits;
Comfort: housing prices, building types, FAR, green areas, and greening rate;
Safety: building ages, households, and road network density.
Table 2.
The constructed index system for quality measurement.
Table 2.
The constructed index system for quality measurement.
| Primary Indicator | Secondary Indicators | Calculation Formula | Quantitative Annotation |
|---|
| Patency | Road Accessibility | | global integration of spatial syntax |
| | Public Transport Station | | number of transportation stations within 300 m around the community |
| Convenience | Facility Coverage | | number of POIs within 300 m around the community; |
| | Facility Richness | | number of functional categories of POI points; , number of Class functions; all POIs in the area |
| | Facility Entertainment | | sign in points of Weibo within 300 m around the community |
| | Work Facilities | | number of companies and enterprises within 300 m around the community |
| | Facility Visits (C6) | | , total number of visitors to facilities within 300 m |
| Comfort | Housing Price | | community average house price |
| | Building Type | | number of floors of the building |
| | FAR | | overall floorage; , area of the community |
| | Greening rate | | greening area of the community; area of the community |
| | Green Area | | greenbelt area within 300 m around the community |
| Safety | Building Age | | the era of community construction |
| | Households | | the number of households in the community |
| | Road network density | | total length of roads in the area; total area. |
3.3.2. The Weight Setting of the Community Quality Evaluation System
To determine the impact weight of different influencing factors and optimize the constructed community quality measurement model more scientifically, the methods of the Analytic Hierarchy Process (AHP) [
73,
74] and Fuzzy Comprehensive Evaluation (FCE) [
75,
76] are adopted to establish a hierarchical structure model according to the updated quality measurement system. The AHP questionnaire includes the primary indicators (patency, convenience, comfort, and safety), and secondary indicators (14 different indicators) are generated. Using the AHP questionnaire, five experts with different backgrounds were invited to make subjective evaluations, and the results of the expert interviews were analyzed to determine the impact weights of different indicators. Among them, the invited experts consist of two urban planning teachers from universities, two designers from urban planning and design companies, and one staff member from the housing construction department of the Chinese government. Different interviewees included vital stakeholders, such as policymakers in urban regeneration and decision makers of regeneration schemes, which were significant in optimizing the effectiveness and science of the proposed measurement model. According to the interview results combined with the AHP analysis to determine the impact weight of different indicators (
Appendix A), the final measurement model construction is shown in
Figure 5 (
Appendix B).
3.4. Community Quality Verification Analysis
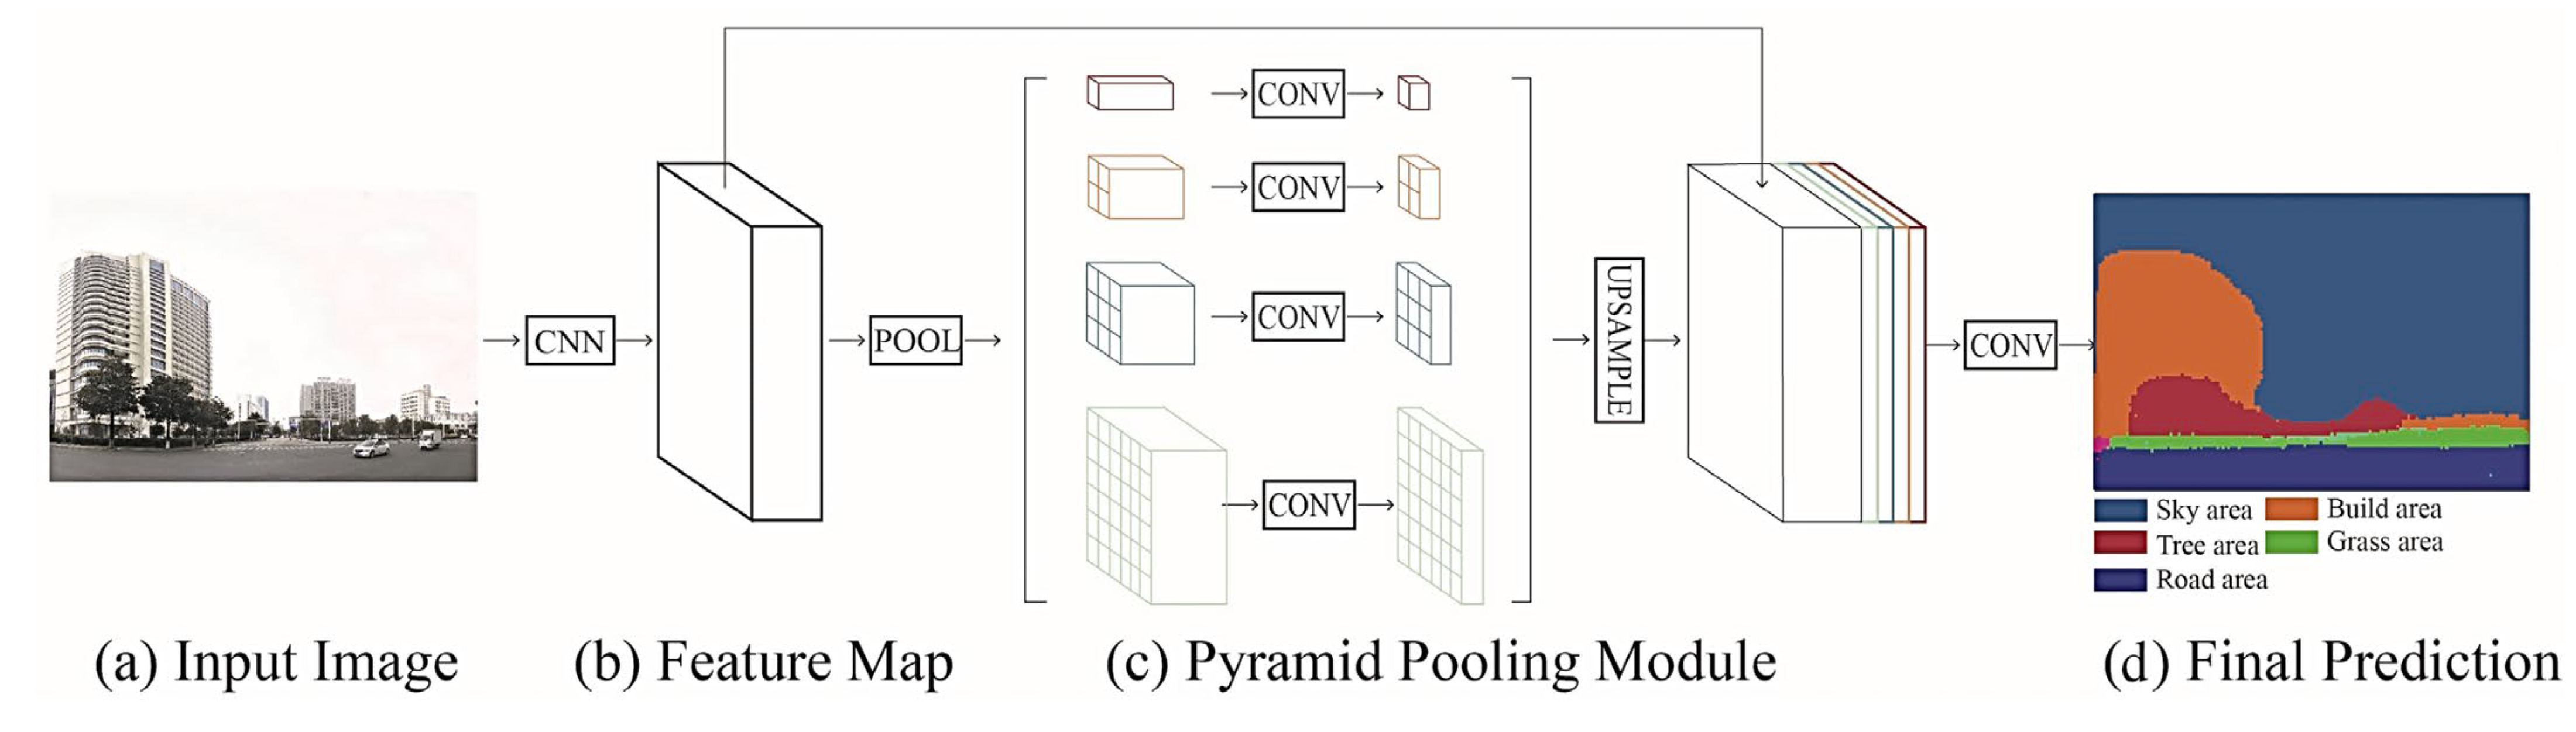
This article proposes a Pyramid Scene Parsing Network (PSPNet) recognition of street scenes based on a pyramid pooling module that integrates global contextual information to verify quality (
Figure 6). PSPNet can aggregate contextual information from different regions, thereby improving the ability to obtain global information. Experiments have shown that such a prior representation (referring to the PSPNet structure) is effective and performs excellently on multiple datasets. We validate the quality evaluation results mentioned earlier based on the number of people and vehicles identified.
A PSPNet was used to analyze the spatial semantics of the environmental image of the community in Gusu, and verified by identifying the spatial scene, including the buildings, trees, grass, chairs, lamps, boards, lanes, sky, bridges, rivers, and other elements in the image, and generate their percentages. This quality index is usually less than 1; the closer it is to 1, the higher its quality. The research established a 300 m buffer zone for the communities in Gusu district, linked and averaged the street view quality values within the buffer zone, obtained the street view quality index of the community, and ultimately divided it into five categories using the natural discontinuity method. Through this method, the community quality results could be verified by the PSPNet image analysis.
Overall, this research applies artificial intelligence to image semantic segmentation technology, focusing on urban planning. It involves the high-precision analysis of massive urban images and remote sensing data to extract the spatial distribution and structural information of various urban elements such as roads, buildings, green spaces, and water bodies. Though details of an intelligent classification process based on these elements, specific content is isolated and meets the needs of various urban studies. This enables urban planners to make more scientific and detailed decisions based on accurate geospatial data.
4. Results and Findings
4.1. The Measuring Results of Community Quality
4.1.1. Patency
The analysis of patency in this study was conducted using road accessibility and public transport station analyses. The findings revealed a significant correlation between the patency analysis results and the urban fabric in the Gusu district. As shown in
Figure 7a, the road accessibility of the communities within the ancient town of Suzhou (delimited by the moat) is mainly in the range of 24.1–35.2, while the road accessibility in the communities outside the ancient town is mostly above 36.8. There are apparent spatial differences in the distribution of the imbalance in road accessibility. Moreover, only a few communities in the ancient town have a road accessibility above 36.8, primarily distributed along the core traffic roads, such as near the south gate in the southern part and the Ganjiang road that connects the eastern and western parts of Gusu district. The analysis of public transport stations revealed that the number of stations inside the ancient town is significantly lower than that outside it, consistent with the results of the road accessibility analysis (
Figure 7b). In the eastern part of the study area, at the intersection of Gusu district and the Suzhou Industrial Park district, the index of traffic connection is much higher than 84, making it the highest performance of traffic connection in Gusu district.
Based on the weightings of the various indicators determined by the AHP results shown in
Figure 5, the road accessibility and public transport station data were overlaid to obtain the analysis results of patency in Gusu district (
Figure 7c). The analysis results show that the patency in the areas outside the Suzhou ancient town is better than that inside it, with a significant difference. From the spatial distribution of patency, the southern and eastern regions in Gusu district have higher patency than the western and northern areas.
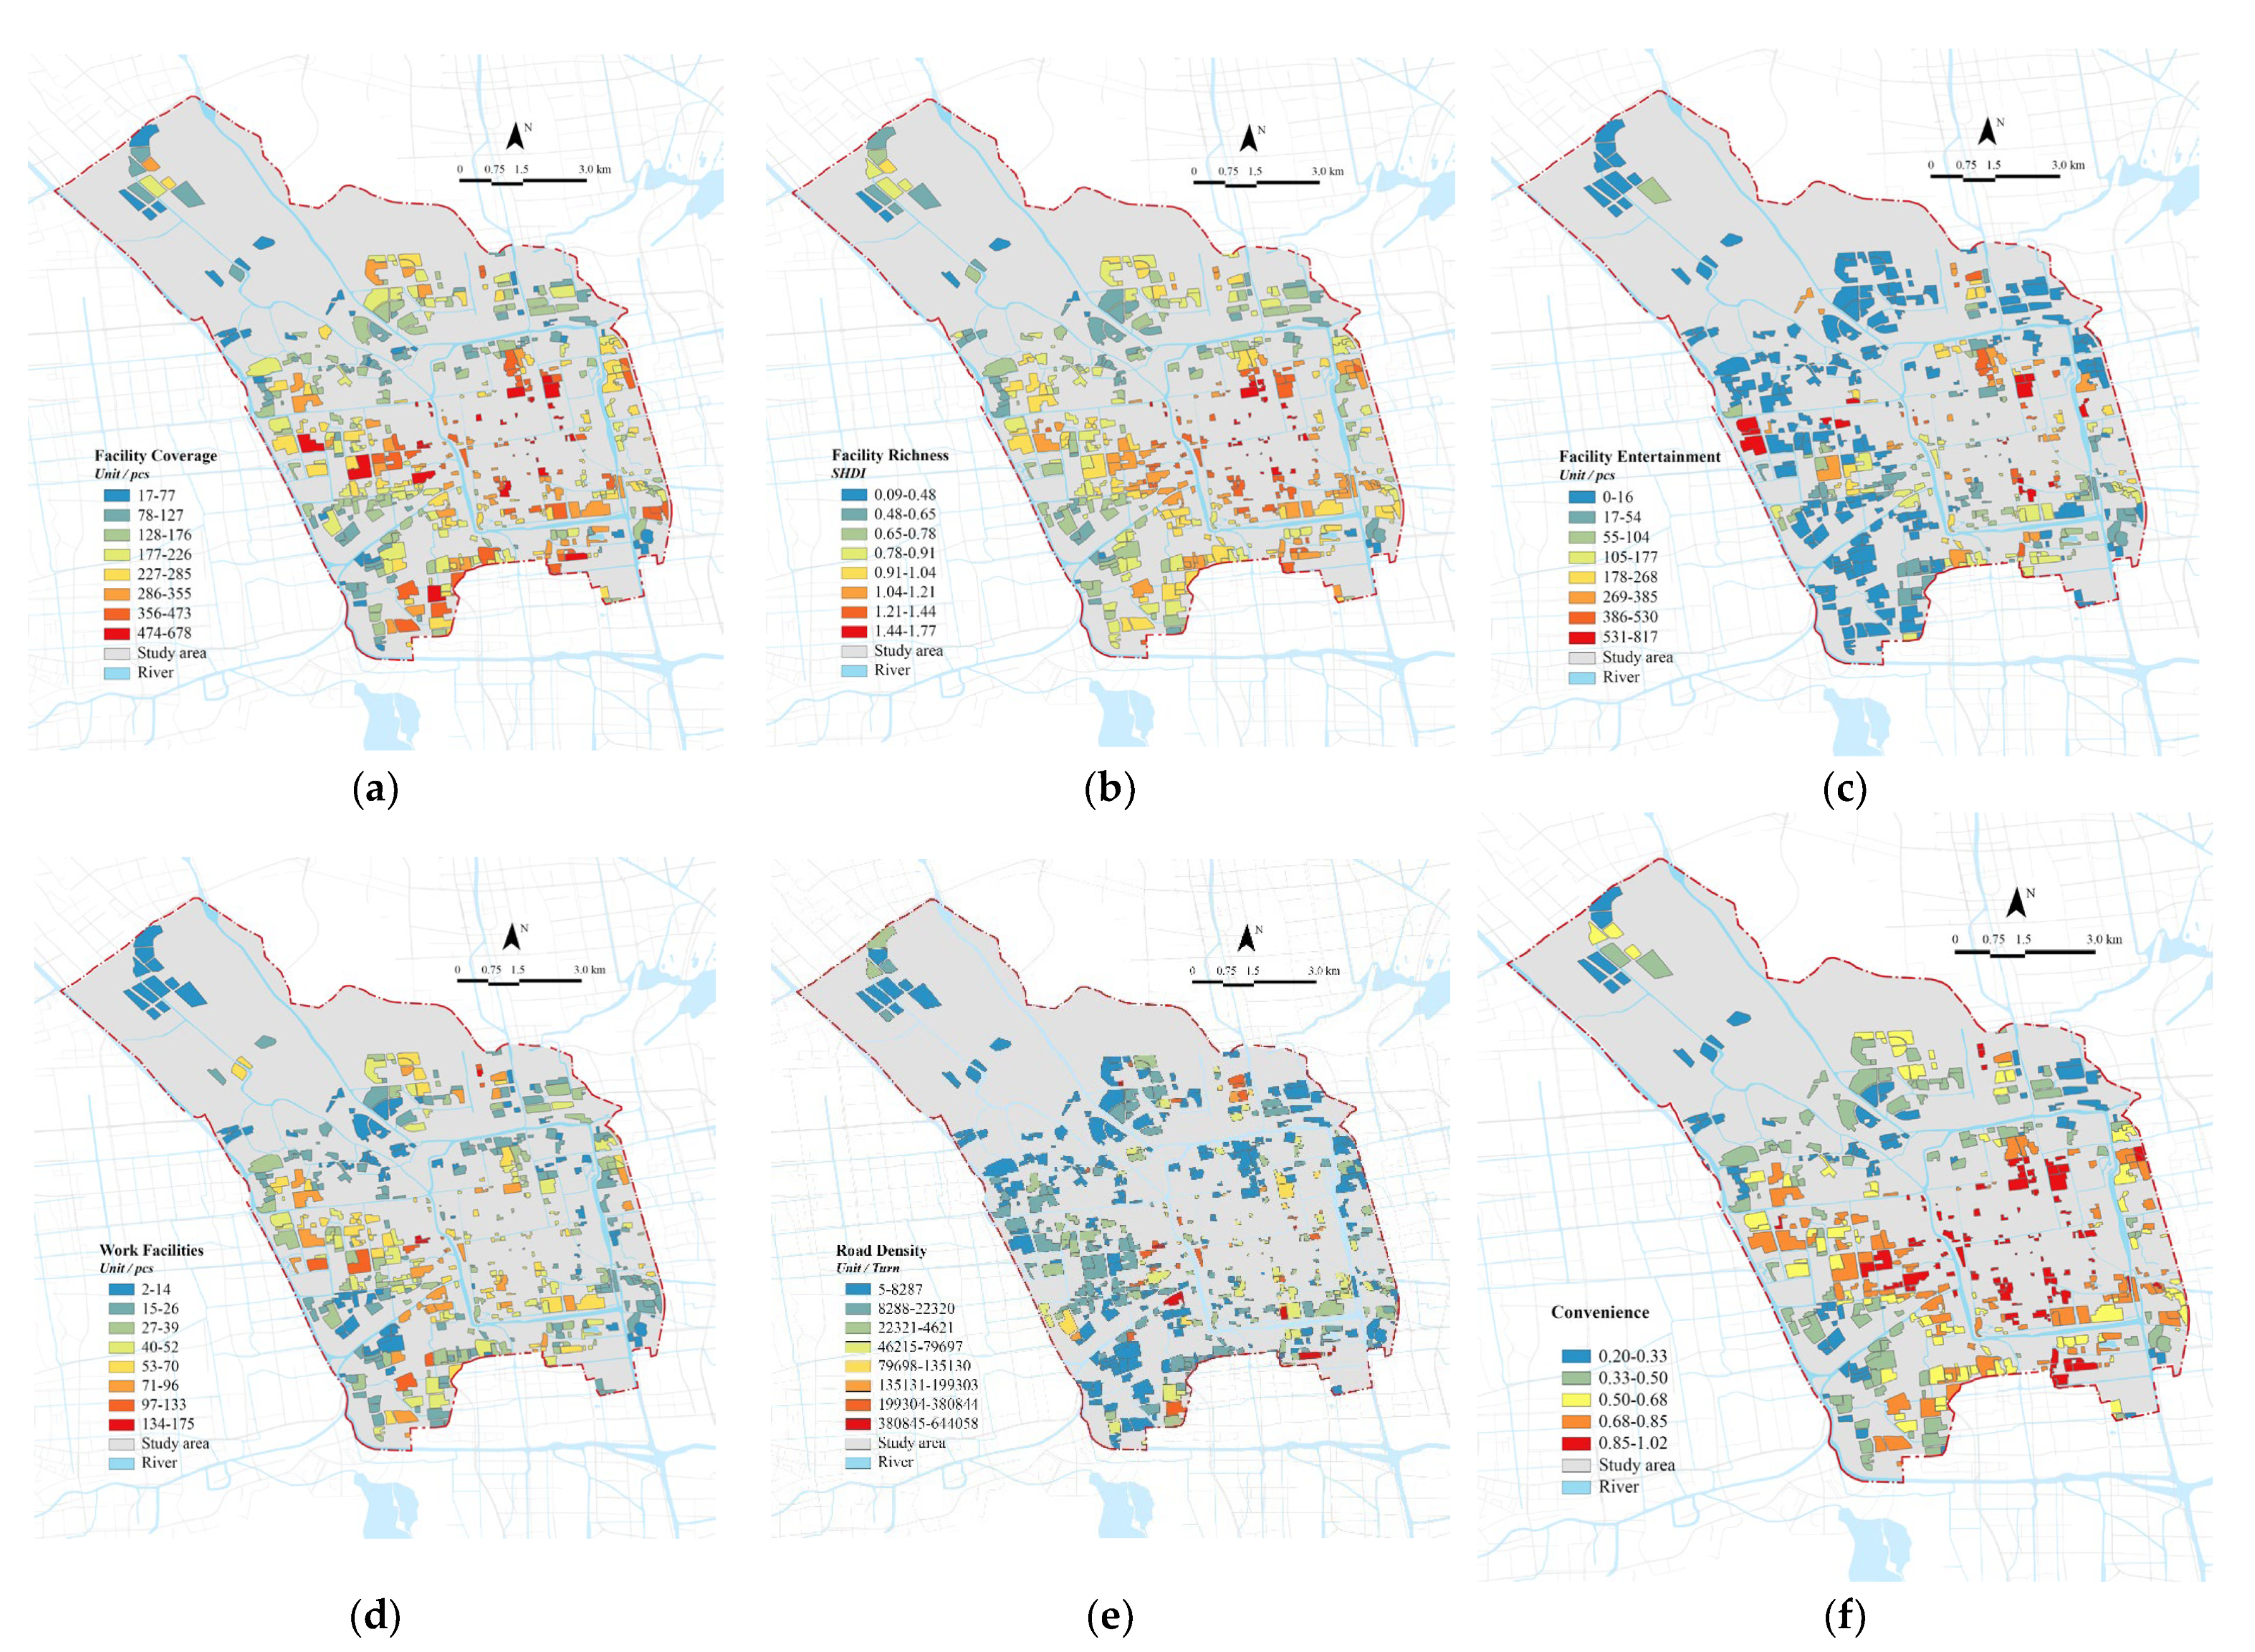
4.1.2. Convenience
The convenience analysis in this study comprised facility coverage, richness, entertainment, and work facilities (
Figure 8a–e). The findings revealed a significant correlation between the analysis results of convenience and the urban fabric in Gusu district, which is consistent with the analysis results of patency. However, the results of the convenience analysis show that the ancient town of Suzhou (delimited by the moat) is superior to the area outside the ancient town. To be more specific, the facility coverage analysis showed that most communities within the ancient town are more than 227 within a 300 m range buffer zone, while communities outside the ancient town are between 78 and 226 (
Figure 8a). The facility richness gradually decreased from the center to the periphery, with only communities with a value higher than 1.44 appearing in the ancient town (
Figure 8b). Moreover, the analysis results of facility entertainment showed more facilities inside the ancient town than outside, with only the southern and western regions of Gusu district having distributed facilities outside the ancient town (
Figure 8c). Additionally, the analysis of work facilities showed little difference between the ancient town and the area outside it, but work facilities outside the ancient town are mainly distributed in the western and southern parts of Gusu district (
Figure 8d). Fewer facilities distributed in the eastern and northern parts supported a significant imbalance in spatial distribution. Most facilities have views of less than 8000, but higher stories may reach 60,000, mainly concentrated in the center of the ancient town (
Figure 8e).
The convenience analysis results of the Gusu district were obtained by superimposing the weights of the various indicators based on the AHP results on the four factors that impact convenience (
Figure 8f). The analysis results showed that convenience within the ancient town of Suzhou is significantly better than that outside it, with poor convenience in the northern and southwestern areas of the Gusu district.
4.1.3. Comfort
The comfort analysis comprises housing prices, building types, FAR, the greening rate, and green areas (
Figure 9). The analysis shows that the housing prices within the ancient town of Suzhou (delimited by the moat) are higher than those outside it, with the high-priced areas mainly distributed near the southern gate and Suzhou railway station in the north (
Figure 9a). The analysis of building types shows that the buildings in Suzhou are mainly multi-story buildings of four–six floors, with few high-rise buildings over ten floors, distributed primarily on the outskirts of the ancient town (
Figure 9b). In addition, the analysis results show that the FAR within the ancient town is generally lower than that outside it, and most are lower than 1.84. However, the FAR is higher in the western and southern areas outside the ancient town, and most residential communities are above 1.84. The distribution of FAR also affects the result of the greening rate, as shown in
Figure 9c. The northern, western, and eastern areas of Suzhou have more green areas, but the distribution of the greening rate within Suzhou is more even due to the influence of FAR (
Figure 9d–e).
Based on the weight of each indicator set by the AHP, the five factors affecting comfort were combined to obtain the analysis result of Gusu district (
Figure 9f). The analysis results show that the distribution of comfort in Suzhou is relatively even, but the number of communities with poor comfort within the ancient town is small, and the difference in comfort is relatively tiny. However, there is a large difference in comfort among residential communities outside the ancient town, especially in the western area, where the mix of communities with the lowest and highest comfort evaluations is high. This may pose a potential risk of spatial isolation for urban residents and should be given more attention in the process of urban regeneration.
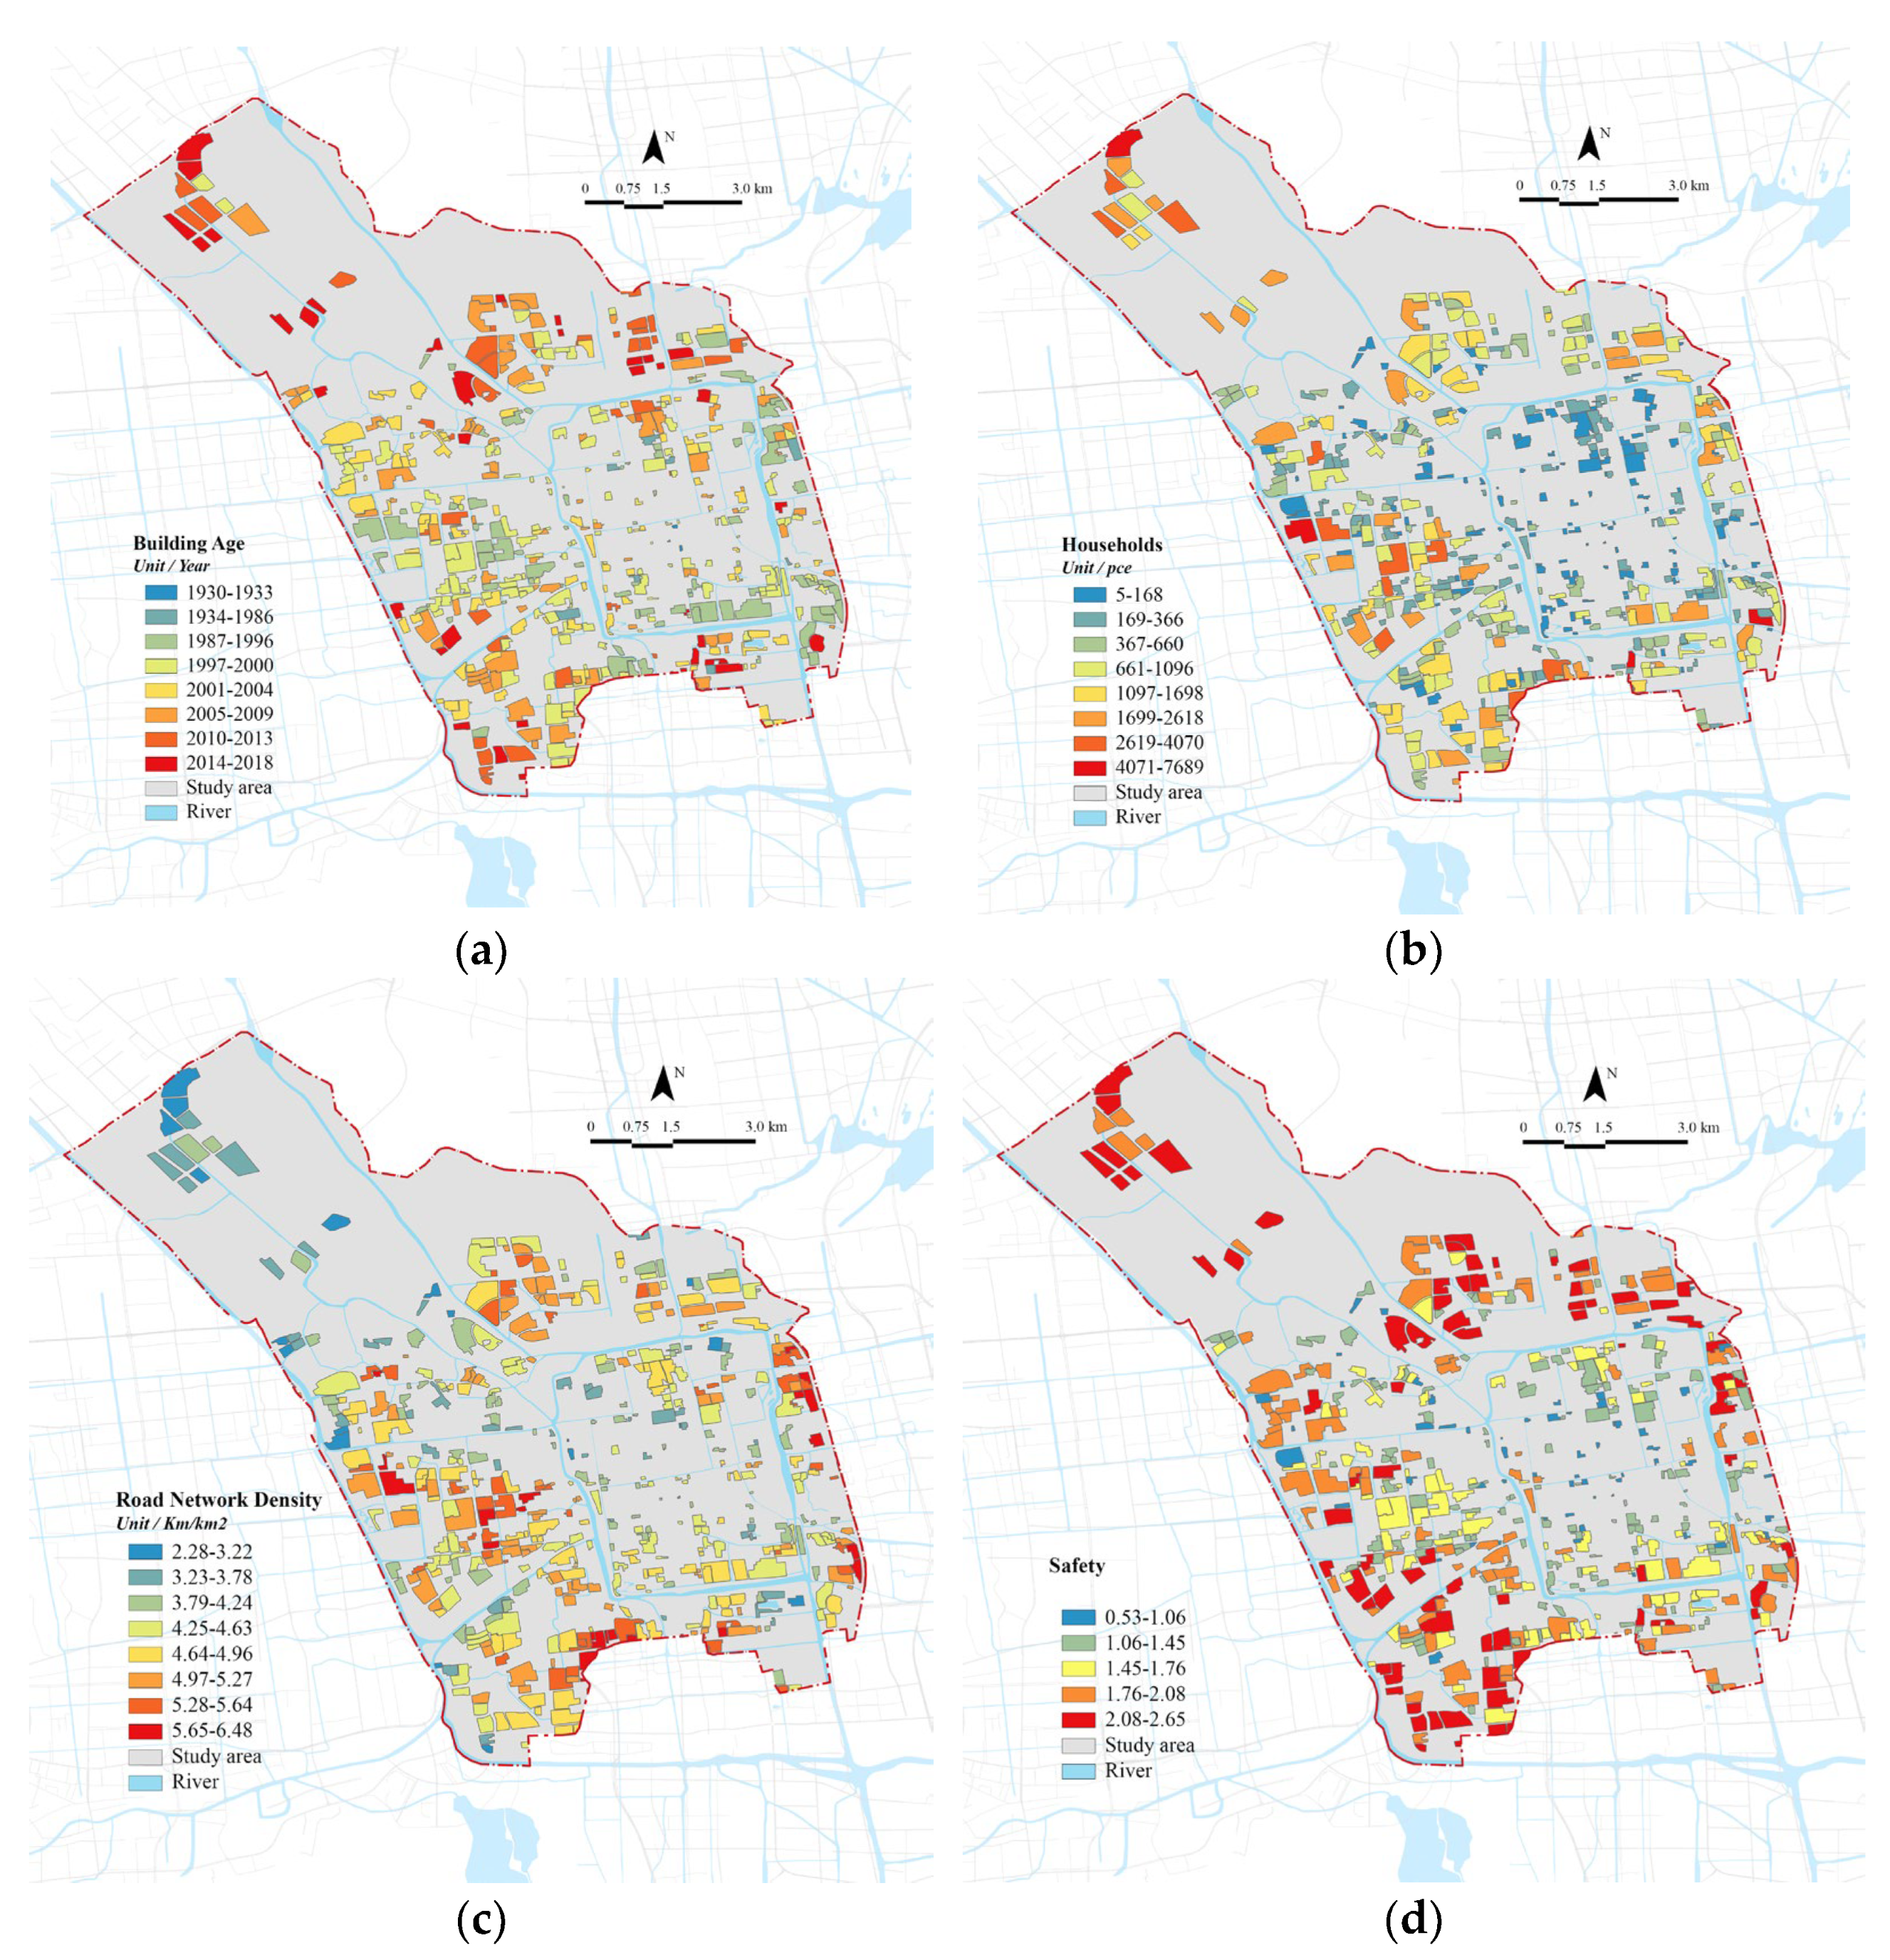
4.1.4. Safety
The safety analysis comprises building ages, households, and road network density (
Figure 10). The analysis of building ages shows that residential communities in the ancient town of Suzhou (delimited by the moat) and the west and east sides of the Gusu district mainly were built before 2000, falling within the definition of old residential communities [
77]. Residential communities in the north and south areas of the Gusu district were mostly built after 2005. Additionally, the analysis of households shows that residential communities in the ancient town mostly have less than 1000 households and determine an increasing trend from the inside to the outside. The analysis of road network density shows a high degree of consistency with the analysis of households in most areas.
Based on the AHP analysis of the weightings of the indicators, safety was found to have the highest weight, followed by convenience, patency, and comfort. As shown in
Figure 11, the comprehensive spatial distribution of the community quality was obtained by processing the results of each indicator analyzed according to the weighting set in
Figure 5. The quantified community quality was divided into five levels using the natural break classification method, with Level 1 representing the highest quality and Level 5 representing the lowest quality. The statistical results are presented in
Table 3. As shown in
Figure 11, the distribution of community quality in the Gusu district is significantly correlated with the urban fabric, with the ancient town of Suzhou serving as the main boundary. The community quality in the ancient town is generally low, with most communities falling into Levels 1–3. Conversely, the communities outside the ancient town present higher quality, with more communities falling into Levels 4 and 5. Additionally, the communities with the highest quality (Level 5) exhibit an aggregated distribution, primarily concentrated in the western and southwestern areas of the Gusu district. However, communities with different quality levels show mixed spatial distributions, with high-quality and low-quality communities coexisting in the same region. This situation is particularly evident in the western and southwestern areas of the district. Another notable spatial distribution characteristic of community quality is that those areas where the Gusu district borders other urban districts exhibit higher community quality. For instance, the areas where the Gusu district connects the southern and eastern regions of the Wuzhong district and the Suzhou Industrial Park demonstrate higher community quality.
4.1.5. Overall Community Quality Results
The statistical results can better demonstrate the analysis results of various indicators of community quality after categorizing it into different levels using the natural break classification method (
Table 3). Based on the analysis of measurement categories, communities falling into the second, third, and fourth levels show a higher distribution frequency, with each level accounting for approximately 20–30% of the total number of communities in the study area. Specifically, the analysis of patency reveals a higher number of communities in the second and third levels, accounting for 23.4% and 26.2%, respectively. Additionally, the convenience analysis demonstrates a more even distribution of communities across all levels, with each level comprising approximately 20% of the total number of communities and the lowest level (Level 5) having the least number of communities (95 and accounting for 17.6%). The analysis of comfort reveals a higher number of communities in the third and fourth levels, accounting for 25.5% and 26.4%, respectively, while the number of communities in the first and fifth levels is relatively low, accounting for 12.7% and 15.1%, respectively. The analysis of safety reveals a higher number of communities in the fourth level, accounting for nearly 30%. In contrast, the number of communities in the first and fifth levels is relatively low, accounting for 12.7% and 15.1%, respectively. The analysis indicates relatively few communities with high quality levels in the Gusu district, with only 54 communities (10.0%) falling into the highest level. Most communities fall into the third level, with 158 (29.4%) falling into this category. The numbers of communities in the second and fourth levels are 131 (24.3%) and 158 (25.5%), respectively.
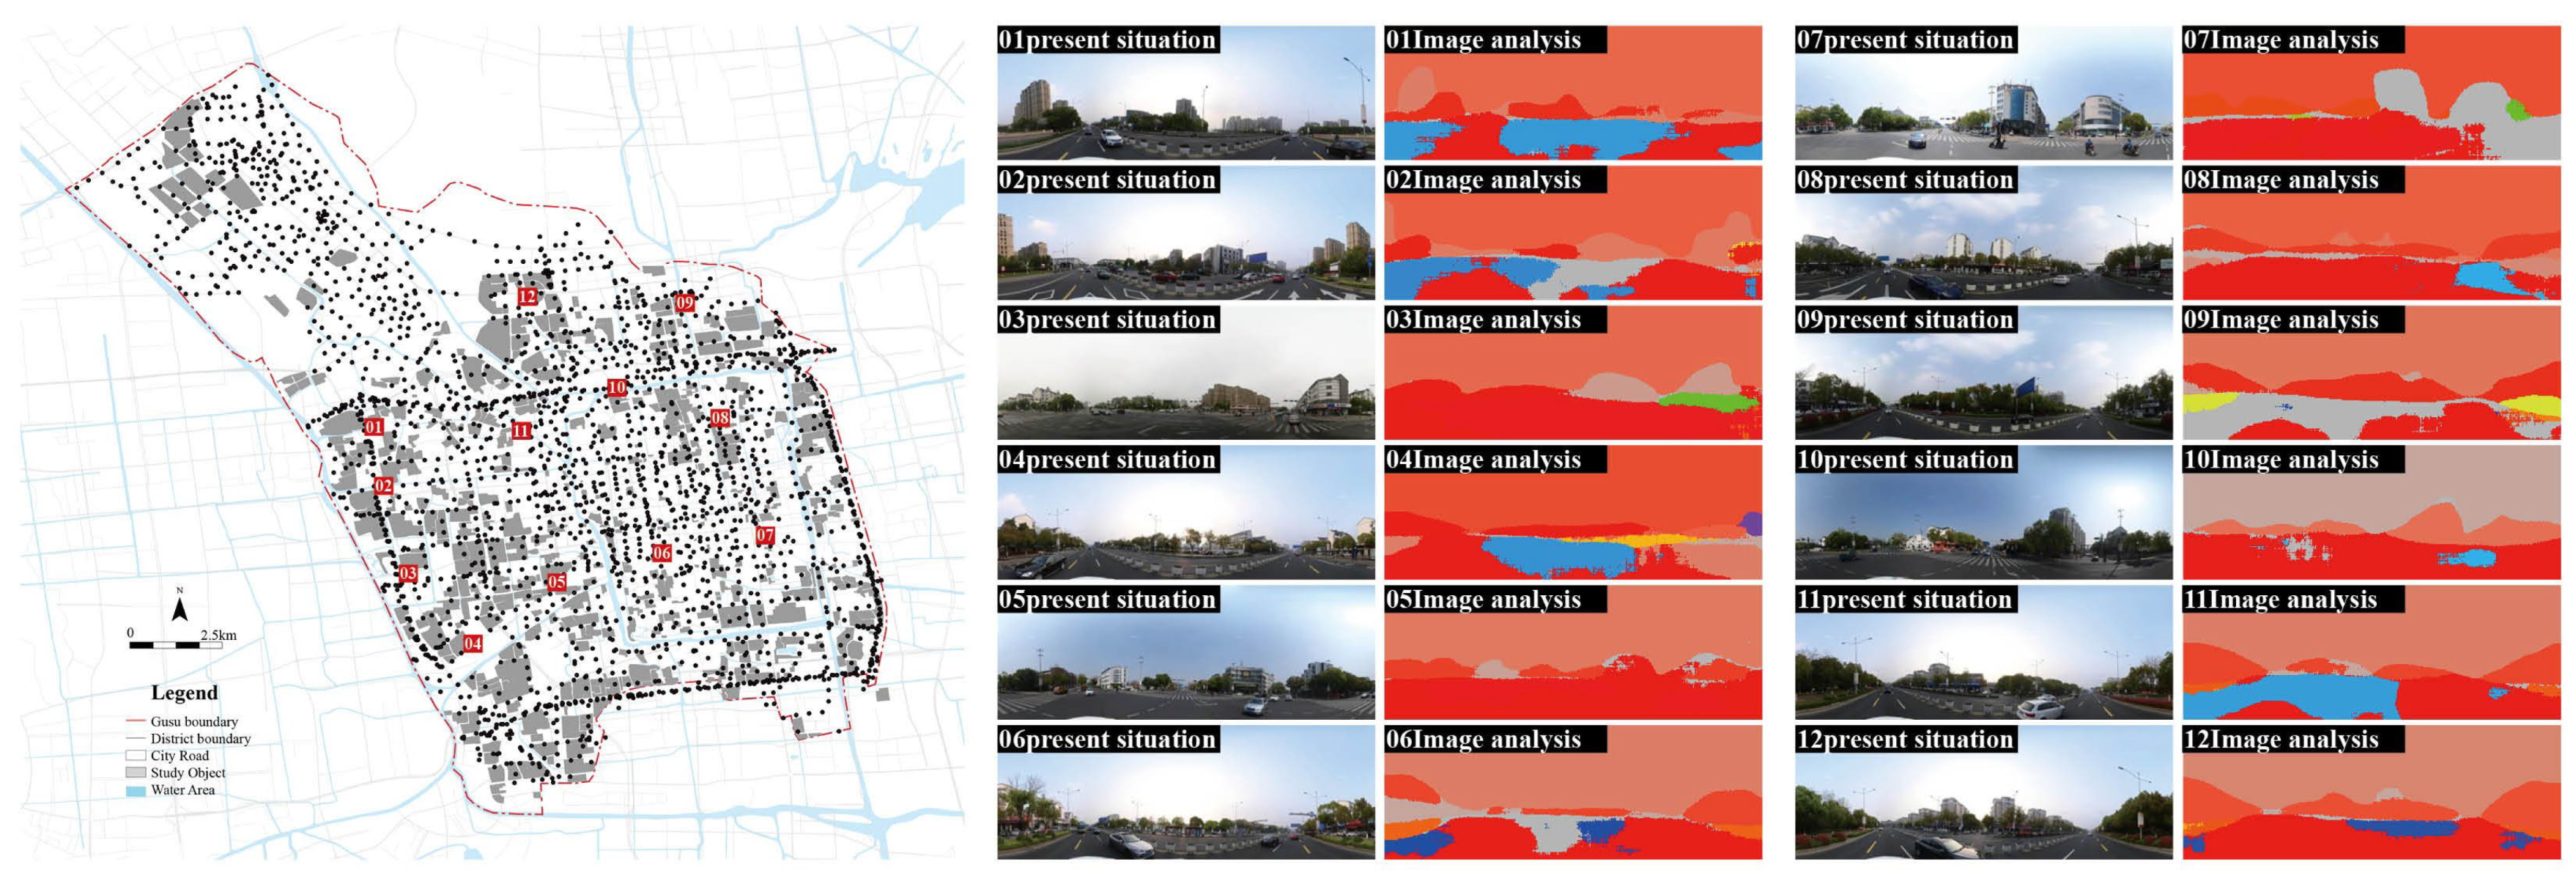
4.2. The Community Quality Verification Based on Street View Image Measurement
This study obtained 7321 street view photos of the Gusu district using the Baidu Open Map API. Based on these images, a machine learning-based semantic segmentation model was constructed to quantify the built environment surrounding the old communities, including the proportions of buildings and greenery, as well as the numbers of pedestrians and motor vehicles. By quantifying these elements of the street view photos, the quality of the communities was evaluated.
The level of community quality in the Gusu district was quantified through the analysis of the street view photos, as shown in
Figure 12. A portion of the analysis process was selected and presented in the study to demonstrate the methods used to evaluate community quality based on the quantification of various elements in the street view photos.
The distribution of community quality in the Gusu district is significantly associated with the urban structure, as demonstrated in
Figure 13, with the ancient town of Suzhou serving as the primary boundary. Communities within the ancient town areas generally exhibit low quality, with the majority falling into the 1–3 categories. Conversely, communities outside the ancient town exhibit higher quality, with more falling into the 4 and 5 categories. Furthermore, the highest quality communities (category 5) tend to cluster in the western and southern parts of the Gusu district, with an overall bias towards the southern region. However, communities with different quality levels exhibit a mixed spatial distribution, with high- and low-quality communities coexisting in the same area. This situation is particularly pronounced in the western and southwestern parts of the region.
Research has found that quality assessment results based on multivariate data and street view image quality assessment are consistent and differential.
- (1)
The consistency is shown in the evaluation results of the central and western regions and the southern regions of the ancient town, which are marked as dashed lines in
Figure 11 and
Figure 13;
- (2)
The differences are mainly concentrated in the northwest and north sides, belonging to the newly developing town of the Gusu district. The urban fabric, block scale, and context differ from the ancient town.
The previous literature has shown that quality verification based on image semantic analysis can accurately identify quality sites in the old urban district [
61]. Therefore, in the ancient town context, the consistency between AI-based image semantic analysis and MQM measurement indicates the accuracy of the MQM’s quality measurement.
However, semantic analysis based on street view images has certain limitations in the new urban large block region. It has little effect on measuring invisible elements such as urban infrastructure and services. Therefore, an MQM based on multi-sourced geospatial data has a broader perspective and comprehensive significance.
In sum, the MQM has a greater comprehensive and integrational advantage, as the quality measurement of contemporary cities has gradually shifted from traditional observations and field studies to more comprehensive methods. For example, the comprehensive analysis of accessibility, the mixing degree, the urban form index, and other factors could assess the quality of cities more comprehensively. Among these factors, accessibility refers to the distance between individuals and important urban resources, such as the distance to public transport, commercial areas, and medical facilities. The mixing degree refers to the diversity of urban functions and uses, such as residential, commercial, office, and cultural mixing degrees. The urban form index involves the physical form and spatial organization, such as building heights, land distribution, transportation network, etc. By analyzing these factors comprehensively, the urban quality level can be more accurately evaluated. Therefore, monitoring unobservable spatial elements and people’s mobility based on the MQM is essential to reflect precise and accurate evaluation results.
5. Discussion
5.1. How to Form an Analysis Framework with the MQM to Evaluate Community Quality Based on the SSP
Based on the application of multi-sourced data and the quantitative analysis of street view images, this paper established a community quality evaluation system MQM from the SSP. Previous studies focused on measuring the relationship between urban morphology and community quality [
21], such as urban form, urban function, and land use [
5,
44,
45,
46], and then used regression to measure the correlation. The MQM proposed in this study comprehensively considers the correlation factors for social sustainability, as well as the integration of multi-sourced data, which enhances the comprehensiveness of measurement methods in urban quality. It can effectively provide scientific data support for urban planning and regeneration, including various factors such as building environments, economic conditions, and social capital. Multi-sourced data are used for the quantitative analysis of community quality, which manifests comprehensive factors such as the QoL, economic development, and social interaction of residents within the community. Community quality could be measured comprehensively and accurately by integrating and analyzing multi-sourced data, such as census, social media, and POI data.
Quantifying community quality using multi-sourced data at the community level effectively explores sustainable land use and strengthens land management and sustainability. Using deep neural networks to analyze streetscape images, including buildings, pedestrians, and greenery, further enhances the evaluation of community quality under multi-sourced data measurement. This approach verifies the evaluation results, quantifies the trend of community quality changes, and predicts future levels of community quality.
It is important to note that the community quality evaluation system is complex and requires continuous improvement and adjustment according to actual situations. This can be achieved through ongoing data collection, the improvement of indicator systems, and the refinement of analytical methods. By continually refining the evaluation system with the MQM, it can become more accurate and useful, providing scientific support for urban planning and regeneration that promotes sustainable land use and management. Such an approach can enable decision-makers to prioritize community well-being, balance economic and environmental considerations, and foster long-term sustainability.
5.2. How to Quantitatively Weigh the Variables’ Contribution in Multi-Sourced Geospatial Data to Community Quality Measurement and Verify the MQM Assessment
This article uses the Analytic Hierarchy Process (AHP) and Fuzzy Comprehensive Evaluation (FCE) methods to weigh each variable’s contribution to the community quality degree and establishes a hierarchical structure model for the updated quality measurement system. The AHP questionnaire includes primary indicators (accessibility, convenience, comfort, and safety) and secondary indicators (14 different indicators). Using the AHP questionnaire, five experts with diverse backgrounds were invited for subjective evaluation, including decision-makers in the urban regeneration process. It had great significance in optimizing the effectiveness and scientific spatial measurement of the proposed MQM. The impact weights of different indicators were determined based on the interview results and AHP analysis. Then, we generated a quality index, which was usually less than 1, and the closer it was to 1, the higher the quality.
Meanwhile, this article established a 300 m buffer zone for the communities in the Gusu district, linked and averaged the street view quality values within the buffer zone, obtained the street view quality index of the community, and ultimately divided it into five categories according to the natural discontinuity method. An AI-based image segmentation technique, PSPNet, was employed to analyze the spatial semantics of the streetscape images around the Gusu community. The validation of the images involved identifying elements such as buildings, trees, grass, chairs, lights, boards, lanes, sky, bridges, rivers, etc. Existing research indicates the absence of a definitive index threshold for assessing built environment quality. However, high-quality built environments in urban streetscapes tend to exhibit specific common characteristics, including the green view ratio, sky ratio, building ratio, and pedestrian flow density.
In this way, the results of community quality can be verified through PSPNet image analysis. The analysis found that safety is considered to have the highest weight, followed by convenience, patency, and comfort. In sum, in the Gusu district, the distribution of community quality is significantly correlated with urban structure, with the ancient town of Suzhou as the main boundary. The community quality of the ancient town is generally low, and most communities belong to Levels 1–3. On the contrary, communities outside the ancient town have higher quality, with more communities belonging to Levels 4 and 5. In addition, the communities with the highest quality (Level 5) exhibit a clustered distribution, mainly concentrated in the western and southern western parts of the Gusu district.
5.3. What Regeneration Planning and Design Strategies could Be Implemented Based on the MQM Analysis Results?
The analysis found that communities with different quality levels exhibit a mixed spatial distribution, with high- and low-quality communities coexisting in the same area. This situation is particularly evident in the region’s western and southern western regions. The classification of different types of communities and their internal characteristics are consistent with the research hypothesis and have a high degree of consistency with related research.
Based on the measurement results of community quality, researchers analyzed communities of different quality levels and discovered distinct features through structured observations within different levels of communities. Among them, communities in Level 5 are mainly located in the northern area of the Gusu district, with incomplete infrastructure and a lack of maintenance for existing facilities. Communities in Level 4 are mostly old communities distributed evenly in various areas of the Gusu district. The main features are a lack of public space in the community and surrounding areas, a single facility, and residents mainly composed of relocated residents. Level 3 communities have diverse types of residents, basic infrastructure, and public space within and surrounding the community, but design and maintenance need to be improved. Communities in Level 2 have diverse populations, complete support facilities, convenient transportation, a good community environment, and strong external attraction. The highest-level communities have superior ecological environments, comprehensive public facilities, high housing prices, and strong external attraction. This aligns with the current studies; for instance, previous studies compared the quality in several Chinese cities and found that both typology and density matter for quality [
21], and highly vital areas generally have the following characteristics: compact streets, diverse architectural forms, and multi-functional land uses [
78]. In response to these phenomena, based on the evaluation system of social sustainability, the following strategies are proposed from the perspectives of safety, convenience, comfort, and patency to promote the improvement of urban quality.
Based on the community quality measurement results, the regeneration strategies should be closely integrated with specific community conditions, particularly in addressing identified weaknesses or areas for improvement. Several urban regeneration strategies can be proposed to improve the quality of different types of communities:
- (1)
Strategies for Level 1—the highest-quality communities:
Based on the superior community environment, community-related activities should be a potential intervention strategy for the next step. For instance, community-led initiatives and events that promote social cohesion and a sense of belonging should be engaged. Diverse transportation options and a pedestrian-friendly environment should be shaped to encourage sustainable activities around the community;
- (2)
Strategies for Level 2—The high-quality communities:
Improve the pedestrian infrastructure to make it safer and more convenient for walking. Upgrade and diversify the local economy to create more job opportunities and increase the community’s resilience. Enhance the design and quality of public space to create more comfortable and healthy living environments;
- (3)
Strategies for Level 3—The moderate-quality communities:
Facilitate partnerships between local businesses, community groups, and government agencies to promote economic development and job creation. Implement traffic calming measures, such as speed limits and traffic circles, to reduce accidents and improve pedestrian safety. Provide financial incentives and support for property owners to improve the condition and appearance of their buildings and public spaces;
- (4)
Strategies for Level 4—The low-quality communities:
Target blighted areas for public investment and redevelopment to improve the quality of the built environment and attract new investment. Support the development of small-scale, community-based businesses to create local job opportunities and foster entrepreneurship. Establish programs and services that address social and economic challenges, such as poverty, unemployment, and a lack of access to basic services. Additionally, there will be an emphasis on comprehensive considerations for overall community functionality improvement, ensuring that regeneration strategies are not limited to solving singular issues but are dedicated to creating a new urban space that is ecologically livable, resource-efficient, and socially harmonious;
- (5)
Strategies for Level 5—The lowest-quality communities:
Prioritize targeted public investment to address the most pressing infrastructure and service needs, such as community parks and public transport stations, to improve infrastructure. For inadequate green spaces, specific and targeted solutions could be proposed in response to the issue, such as expanding green space construction, optimizing green space layout, and encouraging green roofs and vertical greening.
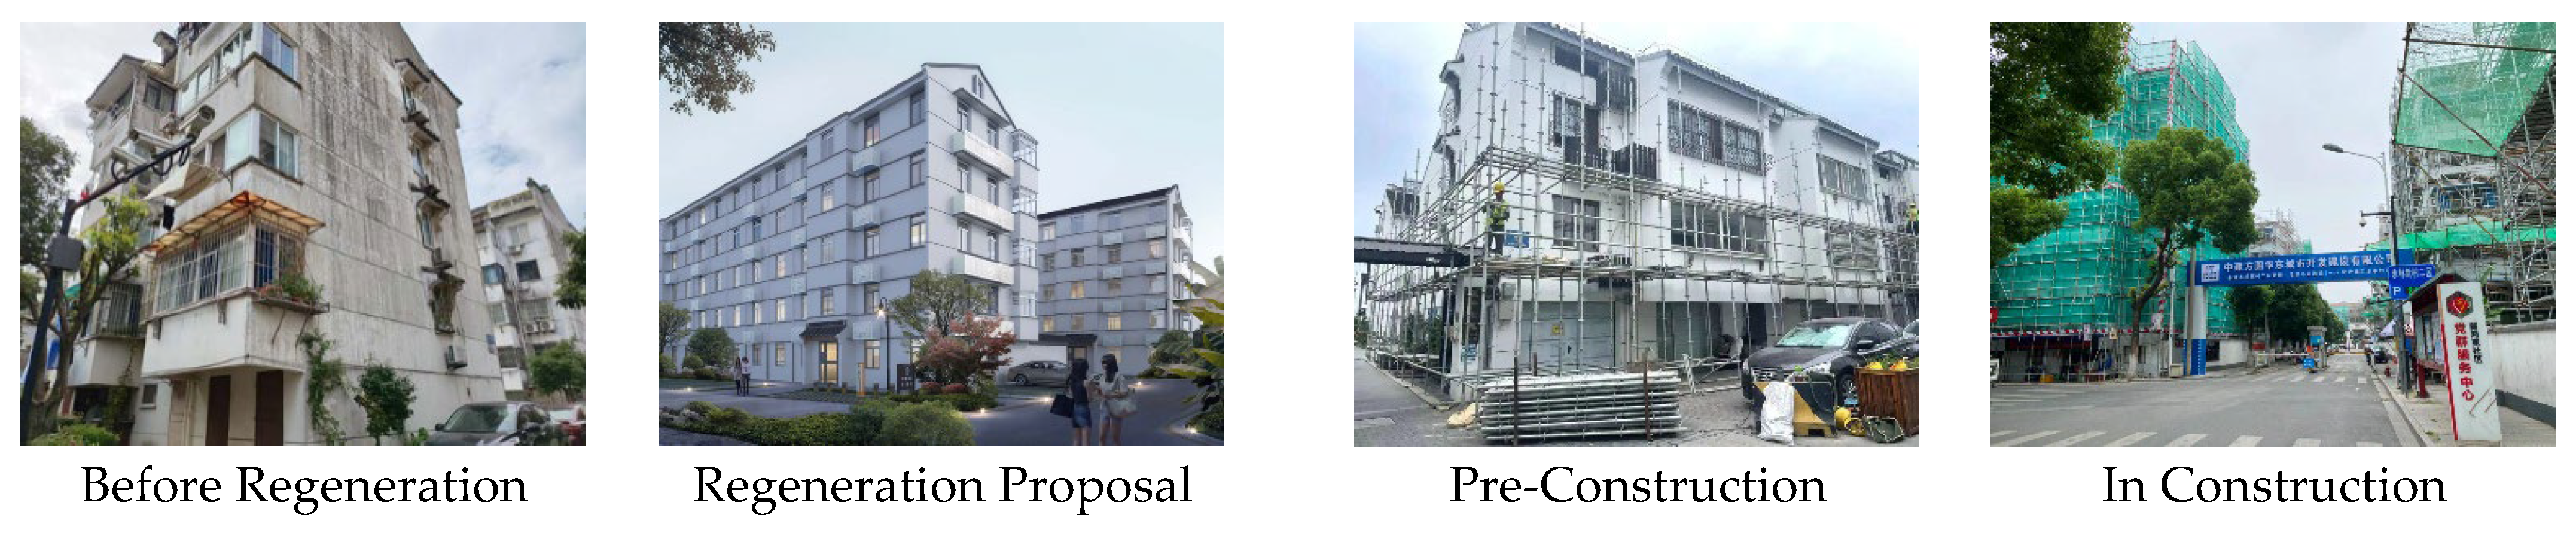
One regeneration project from the east side of the Gusu district in Suzhou was introduced here, and the community is currently undergoing adaptive transformation. According to the MQM evaluation, this community belongs to Level 2, and the regeneration strategies are consistent with government policies; the community focuses on improving its spatial quality and creating a more comfortable environment. The project renovation list is divided into two categories: basic renovation and improvement renovation, including 42 items such as exterior facade renovation, road renovation, and the improvement of convenient service facilities. Nevertheless, the regeneration of such communities should include adding more small and micro-cultural industries to increase the diversity in daily life and local culture (
Figure 14).
6. Conclusions
This research introduces an evaluation system utilizing an MQM based on the SSP to assess community quality across four key dimensions: patency, convenience, comfort, and safety. The results of GIS-based quality evaluations are scrutinized and validated through AI-based street view image segmentation, thereby enhancing the accuracy of measurement outcomes. This addresses a gap in measuring urban quality at the community level on a regional scale, providing both a theoretical foundation and a practical paradigm for community quality assessment.
This study makes significant contributions to urban regeneration grounded in social sustainability, with the community as the fundamental unit of analysis. Firstly, a conceptual framework for social sustainability is established, centered around the community, linking social equity, social participation, and basic needs to the quality of life. Secondly, by reviewing various factors influencing quality of life, the study establishes connections between social sustainability and quality of life using quantifiable multi-sourced geospatial data (housing conditions, social participation, and community indicators). A quantitative measurement model, spanning 14 categories of influencing factors, is proposed. This model is composed of four dimensions: patency, convenience, comfort, and safety, and is tested using the Suzhou Gusu district as a pilot case study.
While the previous literature extensively qualitatively discusses the impact of factors included in the MQM on community quality, this study innovatively advances a methodological approach and quantitatively measures community quality. Introducing the Analytic Hierarchy Process (AHP) to assign weights to individual factors influencing community quality, with distinct weights for different influencing factors, is a notable methodological contribution. This quantitative approach is a departure from the limited quantitative measures in prior studies on community quality.
Furthermore, this study’s measurement of community quality from the SSP enables urban planners and designers to analyze urban areas’ sustainability and quality concretely. Analyzing the spatial distribution and classification of community quality measurement results offers a foundation for planners and governments to prioritize urban renewal in diverse areas, proposing targeted design interventions.
Despite the effectiveness of utilizing multi-sourced data to quantify quality at the community level, the proposed measurement model’s limitations should be acknowledged. On one hand, the model’s testing was confined to the Gusu district, and broader applicability needs validation in more extensive and complex environments in future studies. On the other hand, the model relies on data, such as Weibo check-ins, POI data, and housing price information, collected quarterly or yearly. This temporal limitation hinders the real-time assessment of changes in community quality, posing challenges for meeting operational needs during urban regeneration processes. Additionally, this research acknowledges inherent challenges with the datasets used, such as delays in updates or incomplete coverage in Areas of Interest (AOI) and POI data. Social media data like Weibo Check-in data and reviews from platforms like Dianping might suffer from uneven user participation and sample biases. Additionally, the availability and completeness of government data can be constrained by issues related to public accessibility and timeliness. Despite these challenges, our study centers on “community” and employs multidimensional data to enhance the model and its application on a larger scale. However, the inherent inaccuracies in the data still pose limitations. Future studies could continue to refine the model and address these data issues in subsequent phases of the research, aiming to optimize its accuracy and practical utility.
In conclusion, considerable potential exists for expanding the measurement of community quality based on multi-sourced geospatial data. Future research can explore the introduction of geographic tagging data to delve deeper into community quality and adapt to the rapidly evolving dynamics of communities. Furthermore, the next phase of our research will establish a dynamic assessment mechanism that allows for the real-time monitoring of community development and adjustments to governance models, investigating whether key indicators such as safety, comfort, convenience and accessibility exhibit significant correlations. This approach can be expanded to various urban levels, enhancing adaptability across different scales of city management. Simultaneously, the research methods could be diversified to enhance residents’ well-being and health by integrating data collected from various sensors, such as temperature, humidity, air quality, noise, and organic pollutants in the built environment. Integrated environmental data will provide a more comprehensive foundation for decision making to improve the quality of urban life. Despite these limitations, leveraging diverse data sources to quantify community quality remains a valuable tool for promoting sustainable land use and management, supporting urban planning and policymaking, and ultimately enhancing the well-being of local communities.


 ,
, 
